Article

Quantitative Analysis of Groundwater Recharge in an Arid Area, Northwest China

1
Key Laboratory of Groundwater Resources and Environment, Ministry of Education, Jilin University, Changchun 130021, China
2
College of Earth Sciences, Jilin University, Changchun 130061, China
3
The Institute of Hydrogeology and Environmental Geology, Shijiazhuang 050061, China
*
Author to whom correspondence should be addressed.
Water 2016, 8(8), 354; https://doi.org/10.3390/w8080354
Submission received: 19 June 2016 / Revised: 11 August 2016 / Accepted: 12 August 2016 / Published: 19 August 2016
(This article belongs to the Special Issue Tackling Complex Water Problems in China under Changing Environment)

Abstract

:
The Mixing Cell Model (MCM) is a useful tool that can be applied to areas with limited hydrogeological data, such as arid areas in northwest China, to transform available groundwater hydrochemical data into quantitative information about an aquifer. In this study, we used the MCM to quantify water circulation in the study area and to analyze information such as the supply source composition and proportion of the confined aquifer, the main supply aquifer for local drinking water. The MCM simulation results showed that the confined aquifer in the study area is mainly recharged by leakage of water from the upper unconfined aquifer and lateral flow from the eastern and southern tablelands. Unconfined groundwater and lateral flow contributed to 67.69% and 32.31% of the recharge, respectively. The groundwater circulation model of the study area provided quantitative information about water circulation in different parts of the study area, represented by different cells known as A–F. The information from this model provides a scientific basis for the sustainable use and development of water resources in different parts of the study area.

1. Introduction

Arid areas, which are found on almost every continent, account for 40% of the earth’s land surface and supply food to more than 38% of the world’s population [1]. Arid areas are common throughout, for example, the mid-western United States, China, Algeria, and Australia. Arid areas share some common features, including high temperatures, high evaporation rates, low and irregular precipitation, low surface runoff, and fragile ecological environments. Because of the scarcity and uncertainty of the surface water supply, groundwater contributes a considerable proportion of the total water resource in arid areas, and plays an important role as a water supply for drinking and irrigation [2,3].
The formation and evolution of groundwater supplies in arid areas has always been a topic of considerable interest in international water science. In 1951, the United Nations Educational Scientific and Cultural Organization (UNESCO) began to organize studies of water resource development and conservation in arid areas [4]. The International Association of Hydrogeologists (IAH) raised the profile of theoretical research into groundwater development and evolution in arid areas, and has carried out several large academic projects [5,6]. Various methods have been used to study groundwater circulation, including analysis of hydrogeological structures, hydrodynamic methods [7,8], hydrochemistry, environmental isotopes, and water chemistry kinetics [7,8,9]. Isotopic techniques have been used in studies of groundwater systems to investigate the origin and formation of groundwater, trace groundwater movement, and to determine hydrogeological parameters and groundwater age [10,11]. Since the 1950s, synthetic isotopes and environmental isotopes were used to study hydrological and hydrogeological-related issues [12,13,14,15]. Then a series of studies was carried out to identify recharge sources and to quantify recharge by combining information about hydrology and water chemistry into a groundwater numerical model [16,17,18]. During the 1990s, quantitative research in groundwater circulation progressed rapidly when isotope technology was successfully combined with numerical models [19,20], and the International Atomic Energy Agency (IAEA) launched two coordinated research programs: a mathematical model for quantitative research in hydrology was developed from 1990 to 1993, and an examination of isotope analysis of groundwater migration was completed between 1996 and 1999 [21]. In the meantime, Mixing Cell Model (MCM) was developed [22,23] to use environmental isotopic and water chemistry data to estimate the spatial distribution and the annual recharge rate of a specific aquifer [24]. As well as estimating the quantity of aquifer recharge, the MCM can also evaluate, among other variables, the physical properties of the aquifer, such as the effective porosity and storage coefficient [5]. In recent years, many researchers have combined the MCM with other methods to improve the precision of estimations of aquifer recharge [6,25,26], and for the study of groundwater circulation. Multi-isotope joint applications have been paid more and more attention [27].
The Wu-Ling irrigation area (Figure 1) is in an arid region of northwest China and located in the south of Yinchuan Plain of Ningxia Hui Autonomous Region. In this area, confined water is an important source of domestic drinking water. Since 1958, the Ningxia Bureau of Coal Geological Exploration and Ningxia Institute of Geological Survey had conducted a series of investigations and research projects in the area, and has accumulated a wealth of geological and hydrogeological data [28,29,30]. However, because of different working objectives, a clear picture of the precise patterns of groundwater circulation in the Wu-Ling region is still not available [31]. In the local government action plan, the Wu-Ling area has been designated as an important back-up water supply area for the China Northwest Energy and Chemical Base (CNECB). In-depth studies of the conditions for the formation and recharge of confined water in the study area are therefore urgently needed.
In this study, we constructed a conceptual model of groundwater circulation of the study area from a comprehensive analysis of information about the hydrometeorological conditions, terrain, landscape physiognomy, geology, hydrogeology, hydrodynamic characteristics of the phreatic and confined water, and the distribution of stable isotopes. We then built a MCM of the confined aquifer from the conceptual model of groundwater circulation and water chemistry and stable isotope (D, 18O) data. The simulation results of the MCM provided a quantitative analysis of the recharge sources of confined water and the contributions from different sources in the area. The results of this study can be used as scientific basis for sustainable exploitation and use of confined water in the study area.

2. Methods and Materials

2.1. Samples and Test Data

Forty-one water samples were collected from the study area, including 9 surface water samples, 14 unconfined groundwater samples, and 18 confined water samples. Information about the water temperature, total dissolved solids, electric conductivity, and pH were measured in situ when the samples were collected. Nine hydrochemical constituents (K+, Na+, Ca2+, Mg2+, Cl, SO42−, HCO3, deuterium (D), and oxygen-18 (18O) isotopes) of the samples were analyzed in the laboratory.
Concentrations of major cations and anions were analyzed at Testing Center of Jilin University. Concentrations of major cations (K+, Na+, Ca2+, and Mg2+) were measured by inductively coupled plasma mass spectrometry (ICP–MS, Agilent Technologies, CA). Concentrations of major anions (Cl, SO42−) were measured by ion chromatography (IC). Concentrations of cations and anions were validated using the ionic balance method, and all samples had an ionic balance precision better than 95%.
Stable isotopic composition (D, 18O) was analyzed using a DLT-100 liquid water isotope analyzer (Los Gatos Research, Inc., Mountain View, CA, USA) at the Institute of Geology and Geophysics, Chinese Academy of Sciences. The reference standard for isotope ratios of 18O/16O and D/H was SMOW (Standard Mean Ocean Water). The test precision is 0.05‰ for δ18O and 1‰ for δD.

2.2. Research Method

The MCM [21,22,23] was used to determine the characteristics of the confined aquifer in study area. In the MCM, hydrogeological, hydrochemical, and isotopic data were used to divide the confined aquifer into n homogeneous small cells. Each cell was assigned a set of comprehensive tracer values to denote its water chemistry characteristics. A water conservation equation and a tracer mass conservation equation were established from the possible connections between cells. The recharge or discharge relationships and proportions of each between connected cells were determined by solving the equations. For a steady flow system, the water conservation equation (Equation (1)) and the tracer conservation equation (Equation (2)) of each cell can be combined into a set of K + 1 mass conservation equations (Equation (3)), K is the total number of tracers, and can be solved by minimization of the sum of the squared error J (Equation (4)) [23]:
Q ¯ n W ¯ n + i = 1 I n q ¯ i n j = 1 J n q ¯ n j = e n
where Q ¯ n (L3/T) denotes the time-averaged flow values of the source into cell n, such as injection wells; W ¯ n (L3/T) is the average value of fluxes discharged from cell n, such as pumping fluxes. In and Jn denote the cell numbers of the inflow and outflow of cell n. q ¯ i n (L3/T) and q ¯ n j (L3/T) denote the average fluxes from the ith source into cell n and from cell n into cell j, respectively. e n is the deviation from the water balance because of various field errors identified in the fluxes entering or leaving cell n.
C ˜ n k Q ¯ n C ¯ n k [ W ¯ n + j = 1 J n q ¯ n j ] + i = 1 I n q ¯ i n C ¯ i n k = e n k    k = 1 , 2 , K
C ˜ n k is the average value of the concentration of species k accompanying Q ¯ n . C ¯ n k is the average value of the concentration of species k in cell n. C ¯ i n k is the average value of the concentration of species k from cell i into cell n accompanying the q ¯ i n . e n k is the deviation from the mass balance associated with the tracer k in every flow component.
C _ n q n + D _ n = E _ n
J = n = 1 N [ E _ n T W E _ n ] n = n = 1 N ( C _ n q n + D _ n ) T W ( C _ n q n + D _ n )
In Equation (3), C _ n is a matrix [ ( k + 1 ) × ( I n + J n ) ] of known concentrations. D _ n is a vector [ ( k + 1 ) × 1 ] of known flux terms, such as the rate of pumping or point injection source. E _ n is the [ ( k + 1 ) × 1 ] error vector of cell n. q n is the [ ( I n + J n ) × 1 ] vector of the unknown fluxes entering and leaving cell n. In Equation (4) (   ) T denotes transposition, and W is a diagonal matrix made up of weighting values for each dissolved constituent. It denotes the errors (independent of each other) expected for each of the measured terms in the mass balance of the fluid and the dissolved constituents.
In order to make readers to understand Equations (1), (2) and (4), we have done a simplified example to show the calculated process. In Figure 2, cell n have two discharge items and two recharge items, it means the both number of In and Jn is 2, q ¯ i n and q ¯ n j denote the average fluxes from the ith (i = 1, 2) source into cell n and from cell n into cell j (j = 1, 2), and cell n have a source_ Q ¯ n and a sink_ W ¯ n . Then, we get Equations (5) and (6) by the above assumptions.
If we suppose that K is 9, we can get 10 equations through Equations (5) and (6). q ¯ 1 n , q ¯ 2 n , q ¯ n 1 and q ¯ n 2 are unknown, Q ¯ n and W ¯ n are known in the equations. By solving the equations, we can determine the values of q ¯ 1 n , q ¯ 2 n ,   q ¯ n 1 ,   q ¯ n 2 .
Q ¯ n W ¯ n + i = 1 2 q ¯ i n j = 1 2 q ¯ n j = e n
C ˜ n k Q ¯ n C ¯ n k [ W ¯ n + j = 1 2 q ¯ n j ] + i = 1 2 q ¯ i n C ¯ i n k = e n k k = 1 , 2 , K

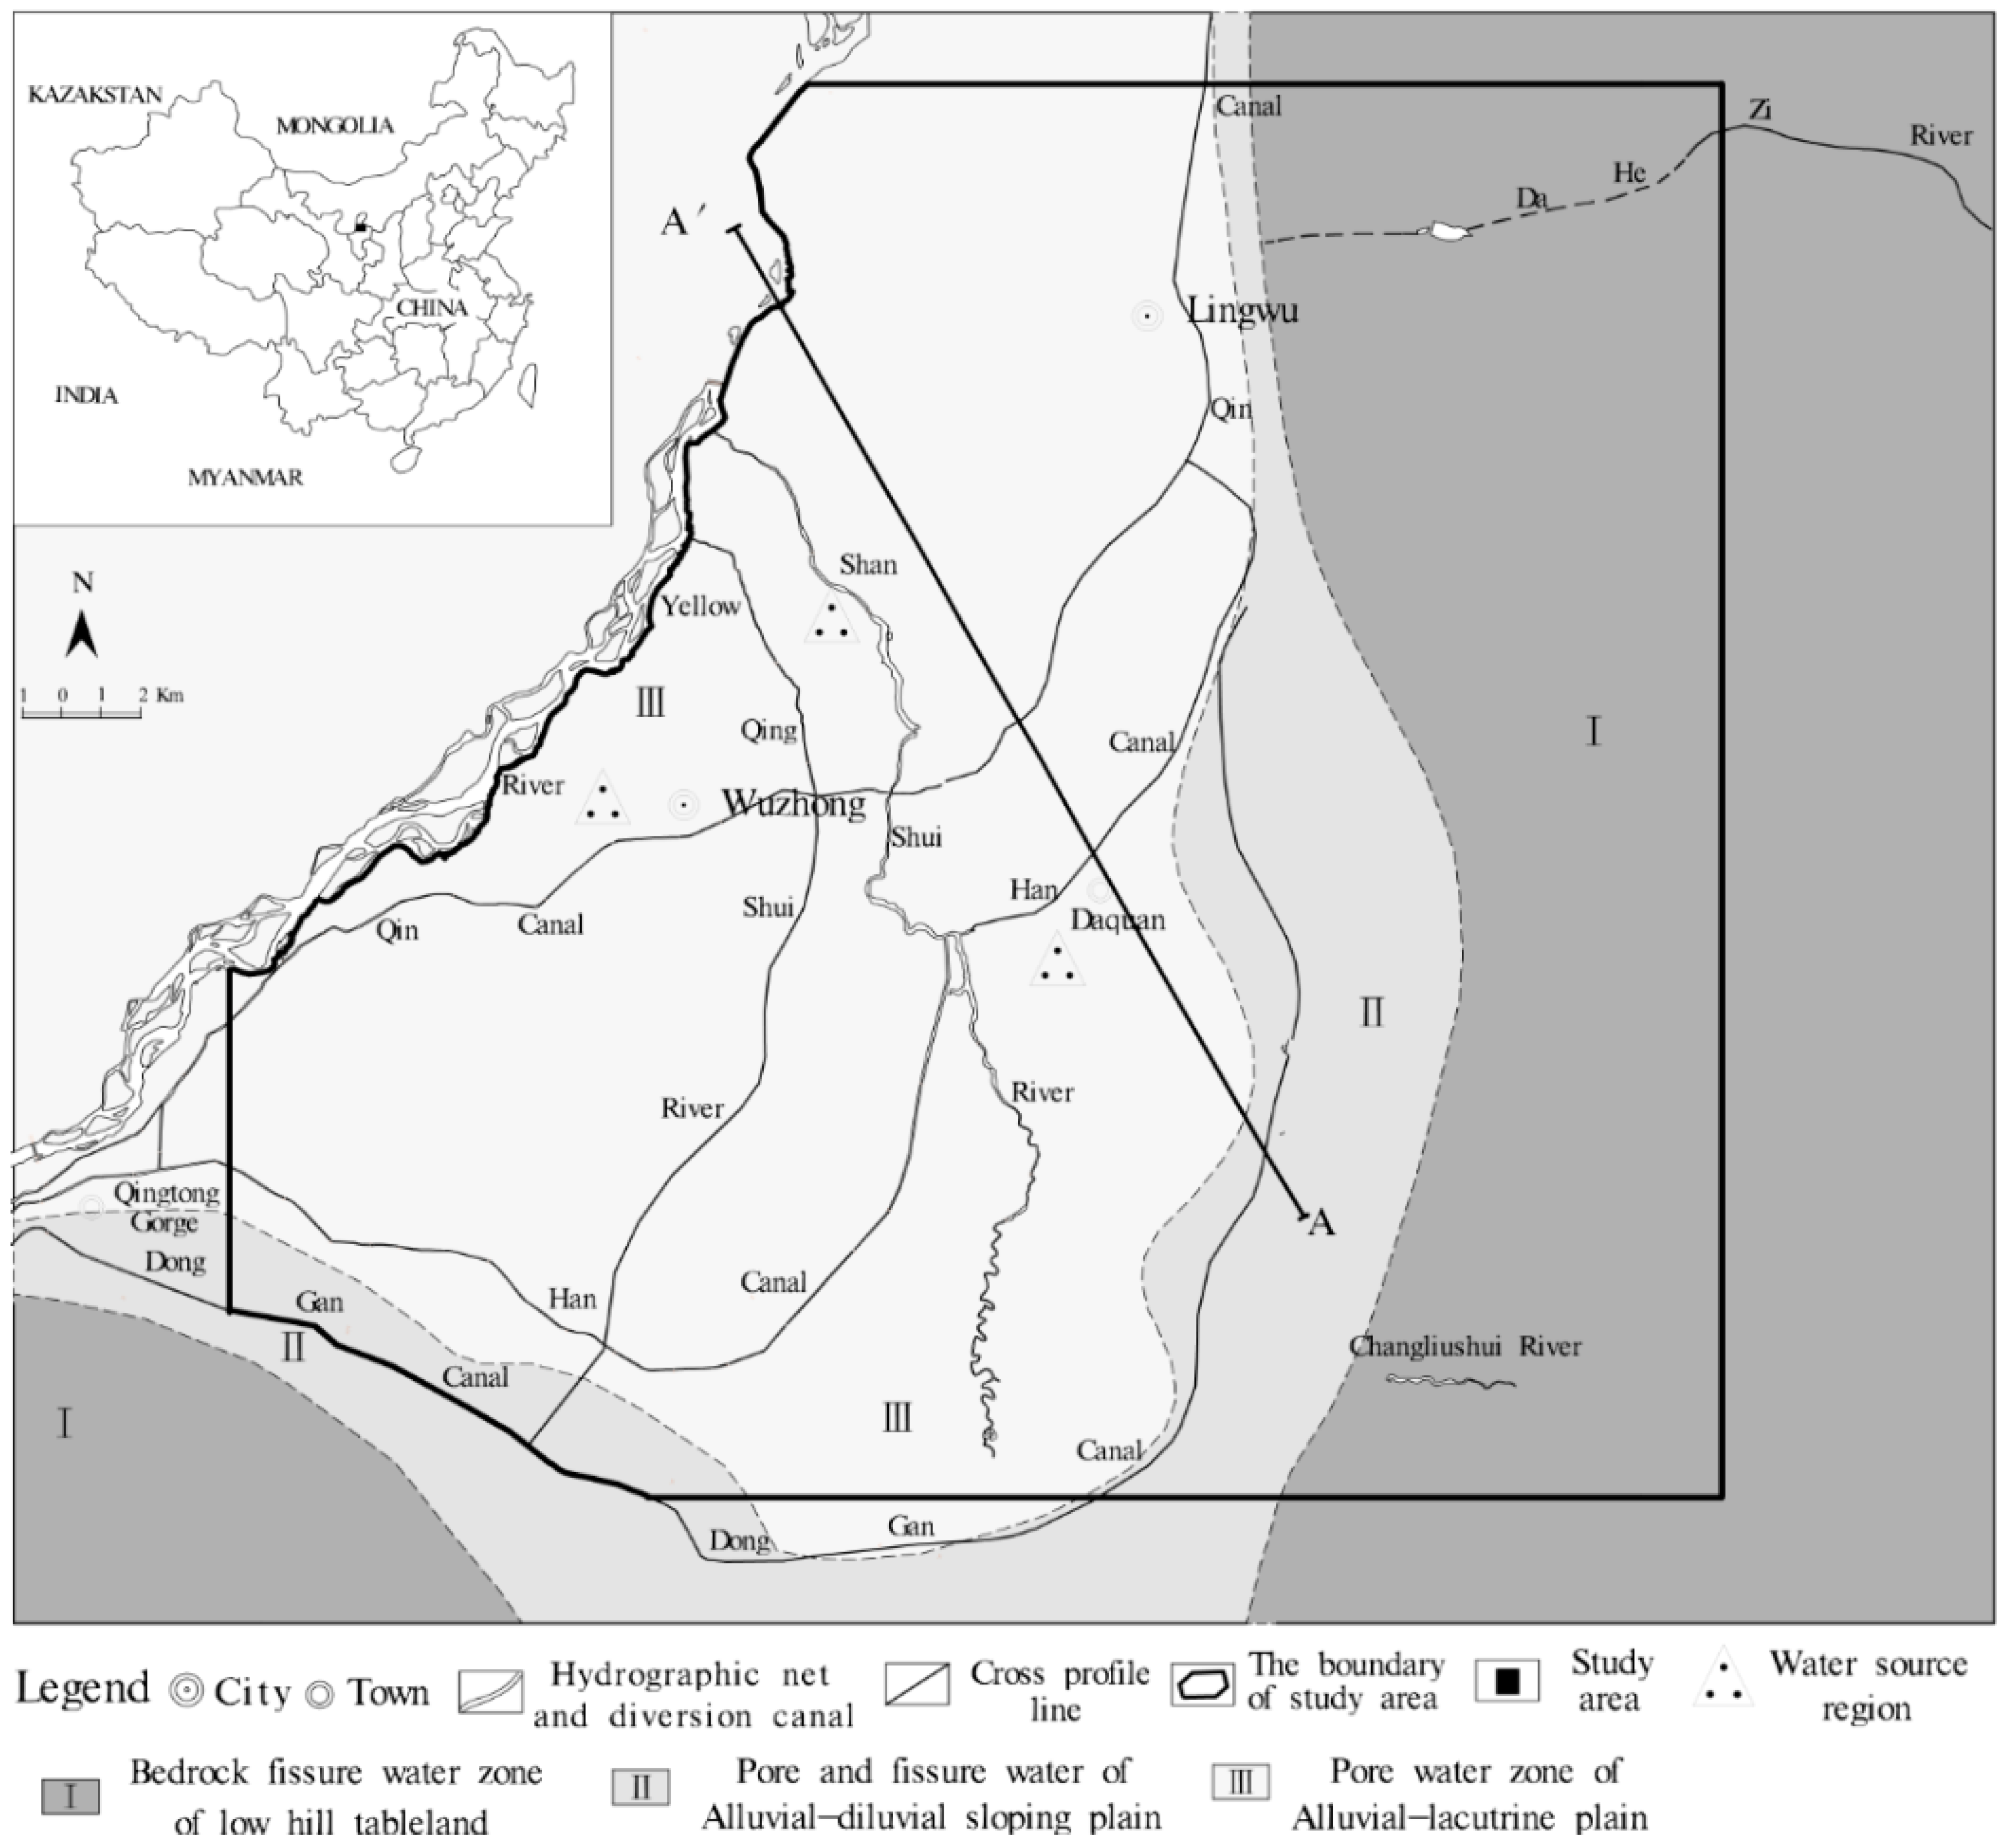
3. Hydrological and Hydrogeological Characteristics of the Study Area

The study area (Figure 1) is in the northwest of China, and has an arid continental climate. The average annual rainfall and average annual evaporation, are 170 mm and 1819 mm, respectively, according to the Water Resources Bulletin of the Ningxia Hui Autonomous Region from 2007 to 2011 [28]. The Qingshui river and Shanshui river in the study area discharge the unconfined groundwater. Three diversion canals, the Qin, Han, and Donggan Canals, were constructed to channel water from the Yellow River at the Qingtong Gorge into the study area for irrigation.
The elevation of the study area terrain gradually decreases from east to west, and tilts to the northwest at a gradient of about 4‰. The geomorphology can be divided into three types, namely the gently sloping tableland, alluvial-diluvial sloping plain area, and alluvial-lacustrine plain. In the tableland area, the strata are mainly composed of bedrock formed before the Quaternary. In the plain area, the strata are composed of Quaternary loose sediments. The study area can be divided into three hydrogeological units: (1) pore water zone of the alluvial-lacustrine plain; (2) pore water and pore-fissure water zone of the alluvial-diluvial sloping plain; and (3) the bedrock fissure water zone of the gently sloping tableland (Figure 1 and Figure 3).
The bedrock fissure water zone of the gently sloping tableland is mainly composed of Mesozoic strata, and is comprised of thick layers of sandstone, sandy mudstone, and glutenite. Fractures are abundant in this zone, and the ground is often covered by aeolian sand that provides optimal conditions for infiltration. This zone mainly stores bedrock fissure water. The individual well water yield is less than 100 m3/d.
The alluvial-diluvial sloping plain mainly consists of partially cemented Tertiary strata, and its lithology consists of sand, gravel, and glutenite interbedded with cohesive soil. Fractures are abundant, and water is stored in the matrix pore and fissures. The water yields from individual wells range from 100 to 1000 m3/d. Generally, the aquifer is within 150 m of the surface. The surface of this area is often covered with aeolian sand, alluvial-diluvial sandy gravel, and clay sand. The area near to the alluvial-lacustrine plain has been transformed into farmland. There is a high permeability in this zone. The alluvial-lacustrine plain is mainly composed of loose sediments from the quaternary and tertiary. Its lithology consists of sand, sandy gravel, and clayey soil. The typical depth of unconfined groundwater is 0.5–6 m. Discontinuous aquitards, ranging from 3 to 10 m in thickness, are distributed in the upper and lower sections of the Quaternary strata. In some local areas, the aquitard is missing and hydrogeological windows have formed. In the alluvial-lacustrine plain zone, pore water can be divided into two types: the single structure phreatic zone and the multilayer structure zone. The multilayer structure zone can be subdivided into the Quaternary phreatic aquifer, Quaternary confined aquifer, and the Tertiary confined aquifer. Because of the lack of a continuous aquiclude between the Quaternary and Tertiary confined aquifers, they are well hydraulically connected. In this study, they are treated as one confined aquifer group.

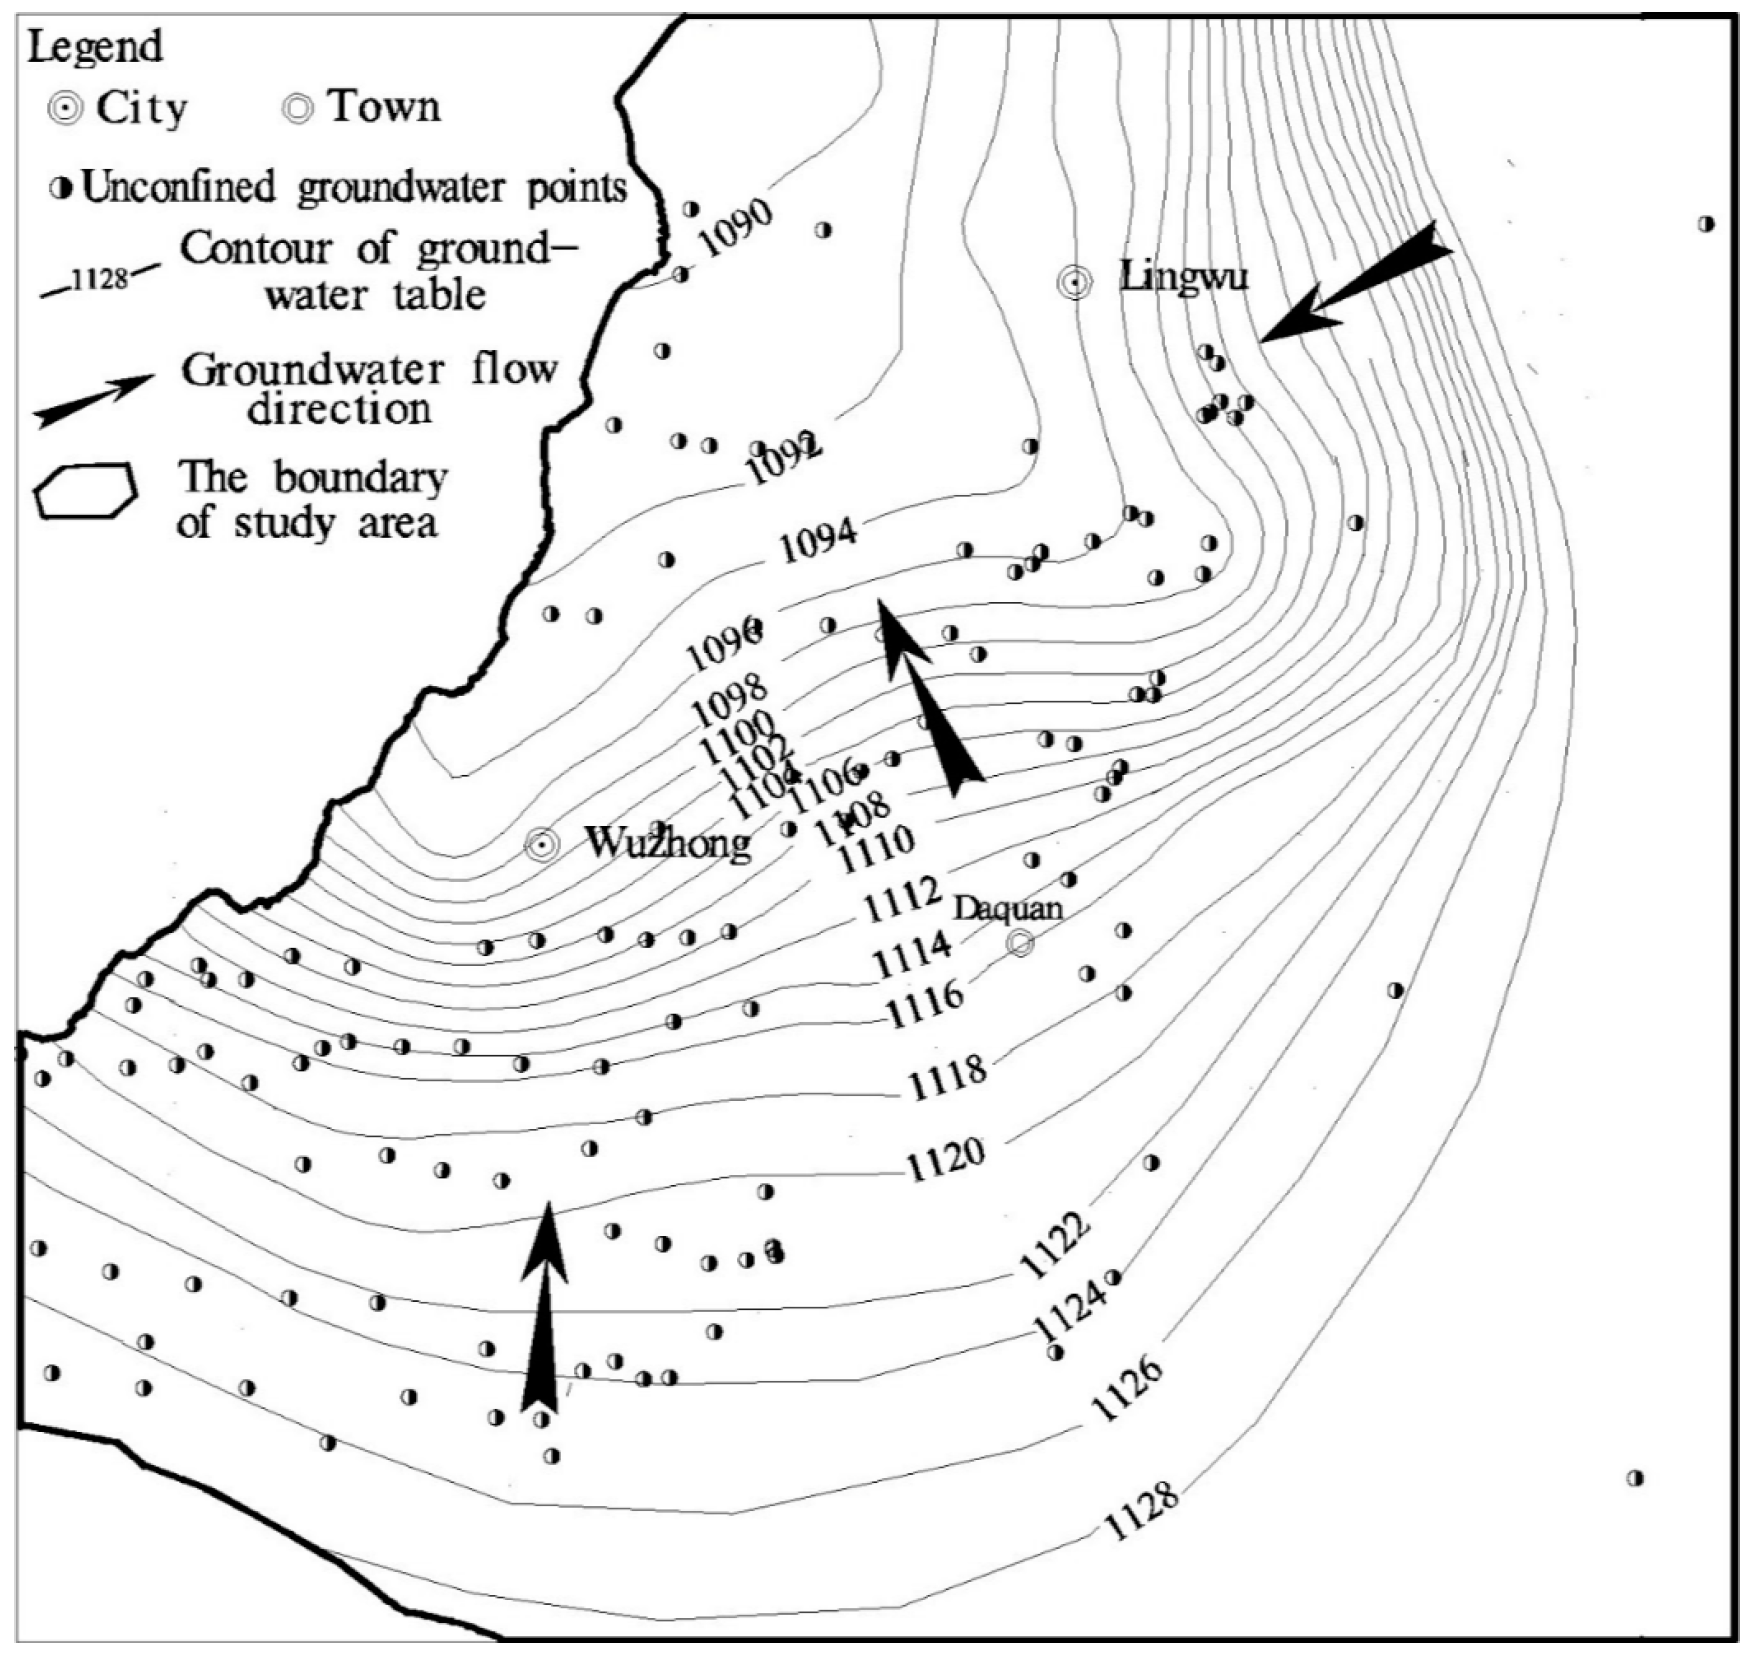
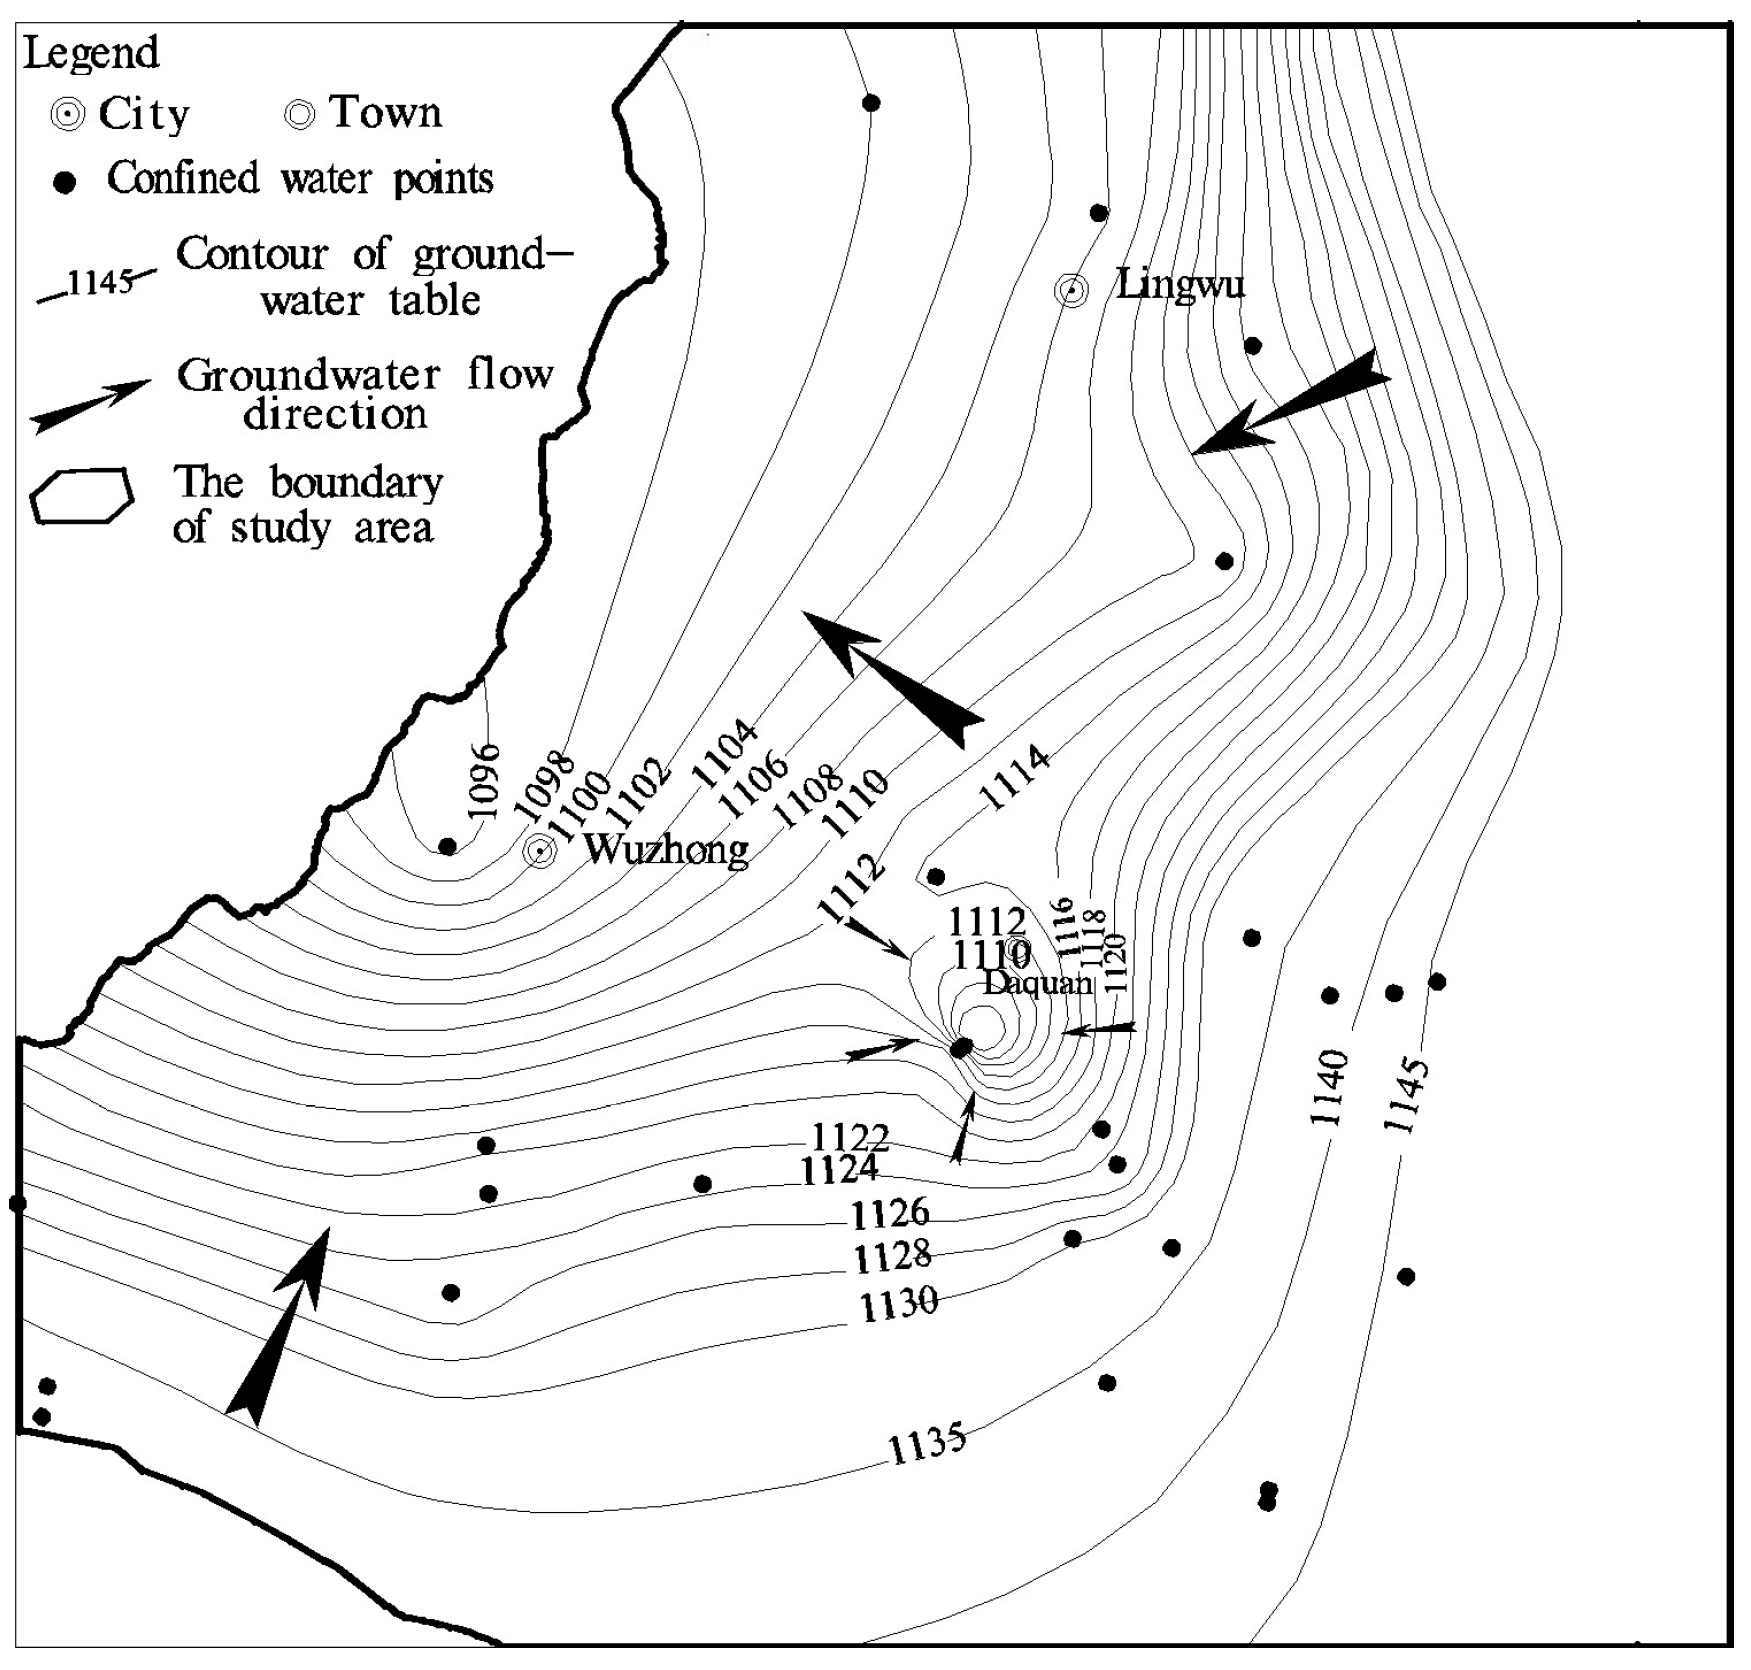
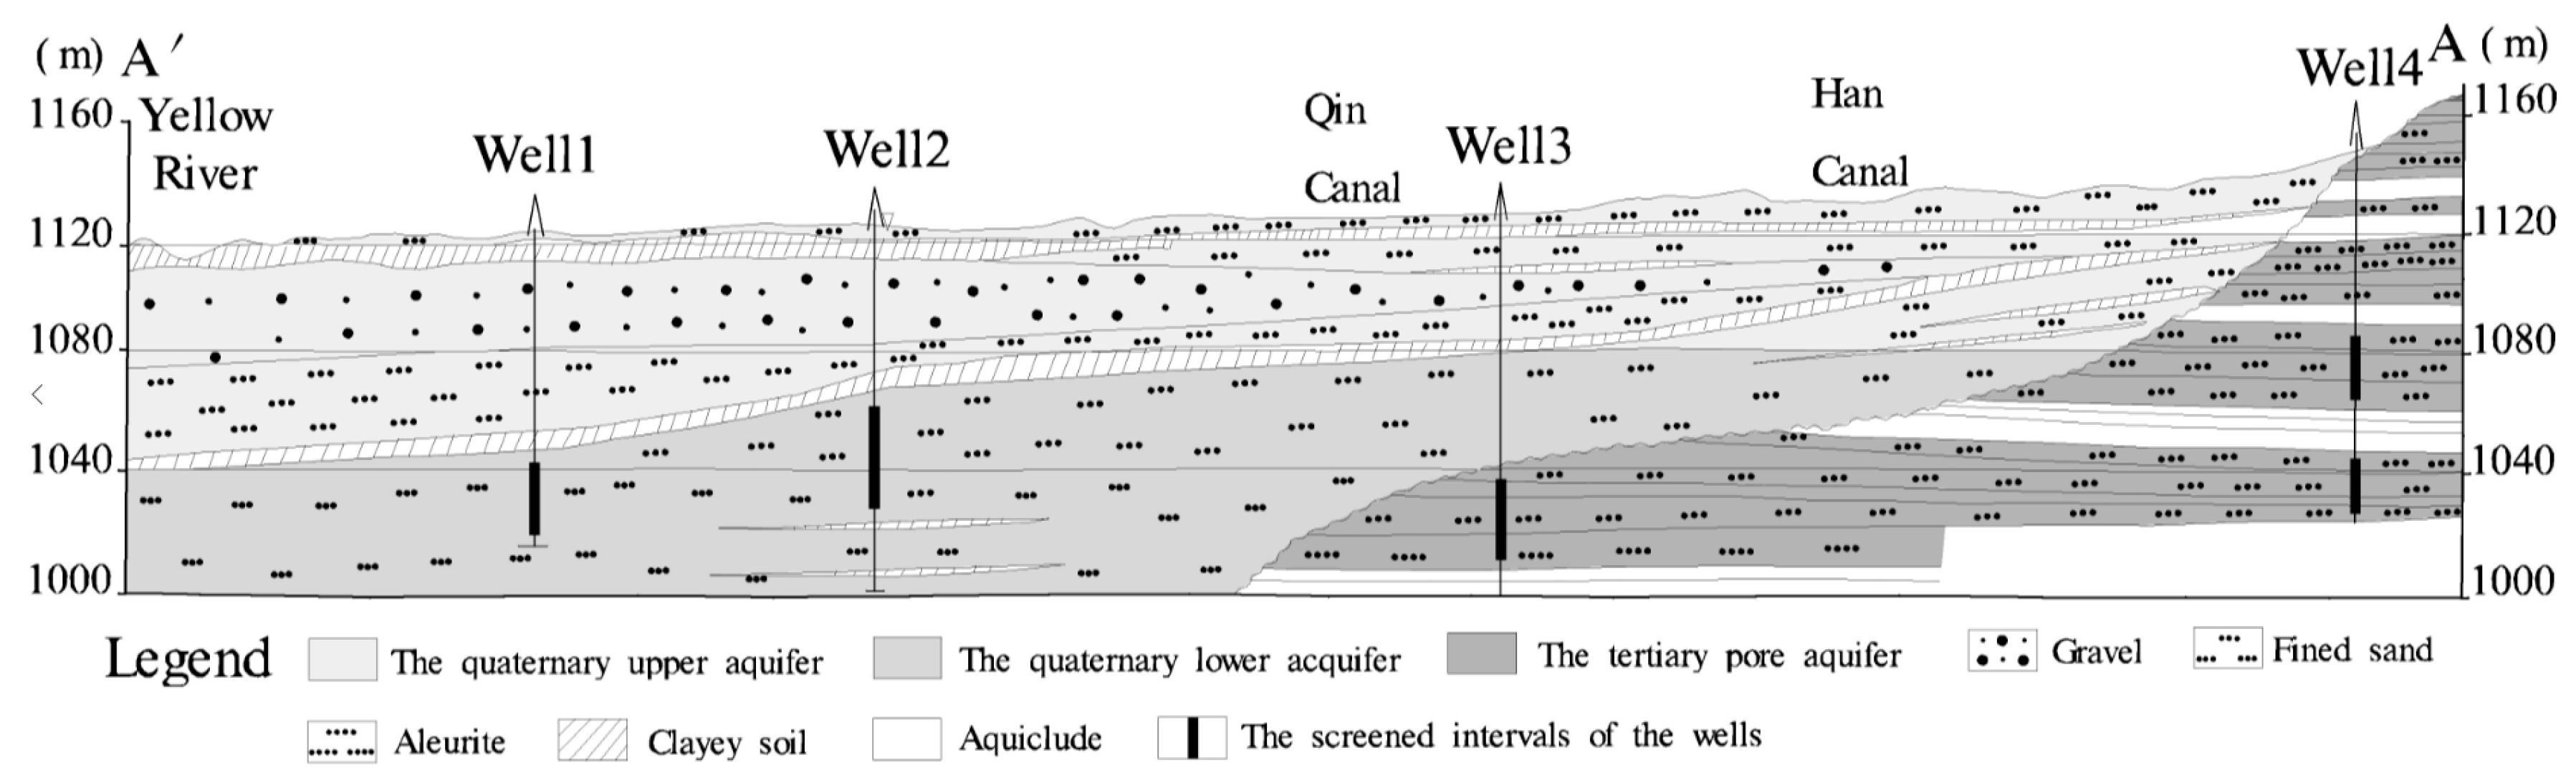
4. The Hydrodynamic Characteristics of the Unconfined and Confined Groundwater

In different seasons, the values of groundwater gradient have a little fluctuation but the shapes of the contours of the water level are relative steady. So the contour maps of the unconfined groundwater and confined water level were drawn from groundwater level monitoring data of the study area from July 2011 (Figure 4 and Figure 5).
In the study area, the unconfined groundwater is controlled by changes in topography, and mainly flows from the southeast to northwest and discharges into the Yellow River (Figure 4). As there is a relative steep topographic gradient and the groundwater gradient is closed to 0.008 in the eastern gently sloping tableland area, the groundwater runoff is rapid in this area. In contrast, the topography is almost horizontal and the groundwater gradient is closed to 0.0005 in the alluvial-lacustrine plain, so the groundwater runoff is very slow in this zone. The phreatic contours in the study area suggest that the groundwater from the gently sloping tableland can provide recharge to the groundwater of the Big Spring area if geological conditions permit.
The shape of the confined water flow field in the study area is nearly consistent with that of the unconfined groundwater, and the overall flow direction is from the southeast to the northwest (Figure 5). The Big Spring area is an important water source in the study area. Because of excessive exploitation, a depression cone has formed. The Changliushui River penetrates into the ground when it flows from east to west at the valley mouth (Figure 1). The location of the undercurrent belt corresponds with the southeast expansion of the Big Spring depression cone.

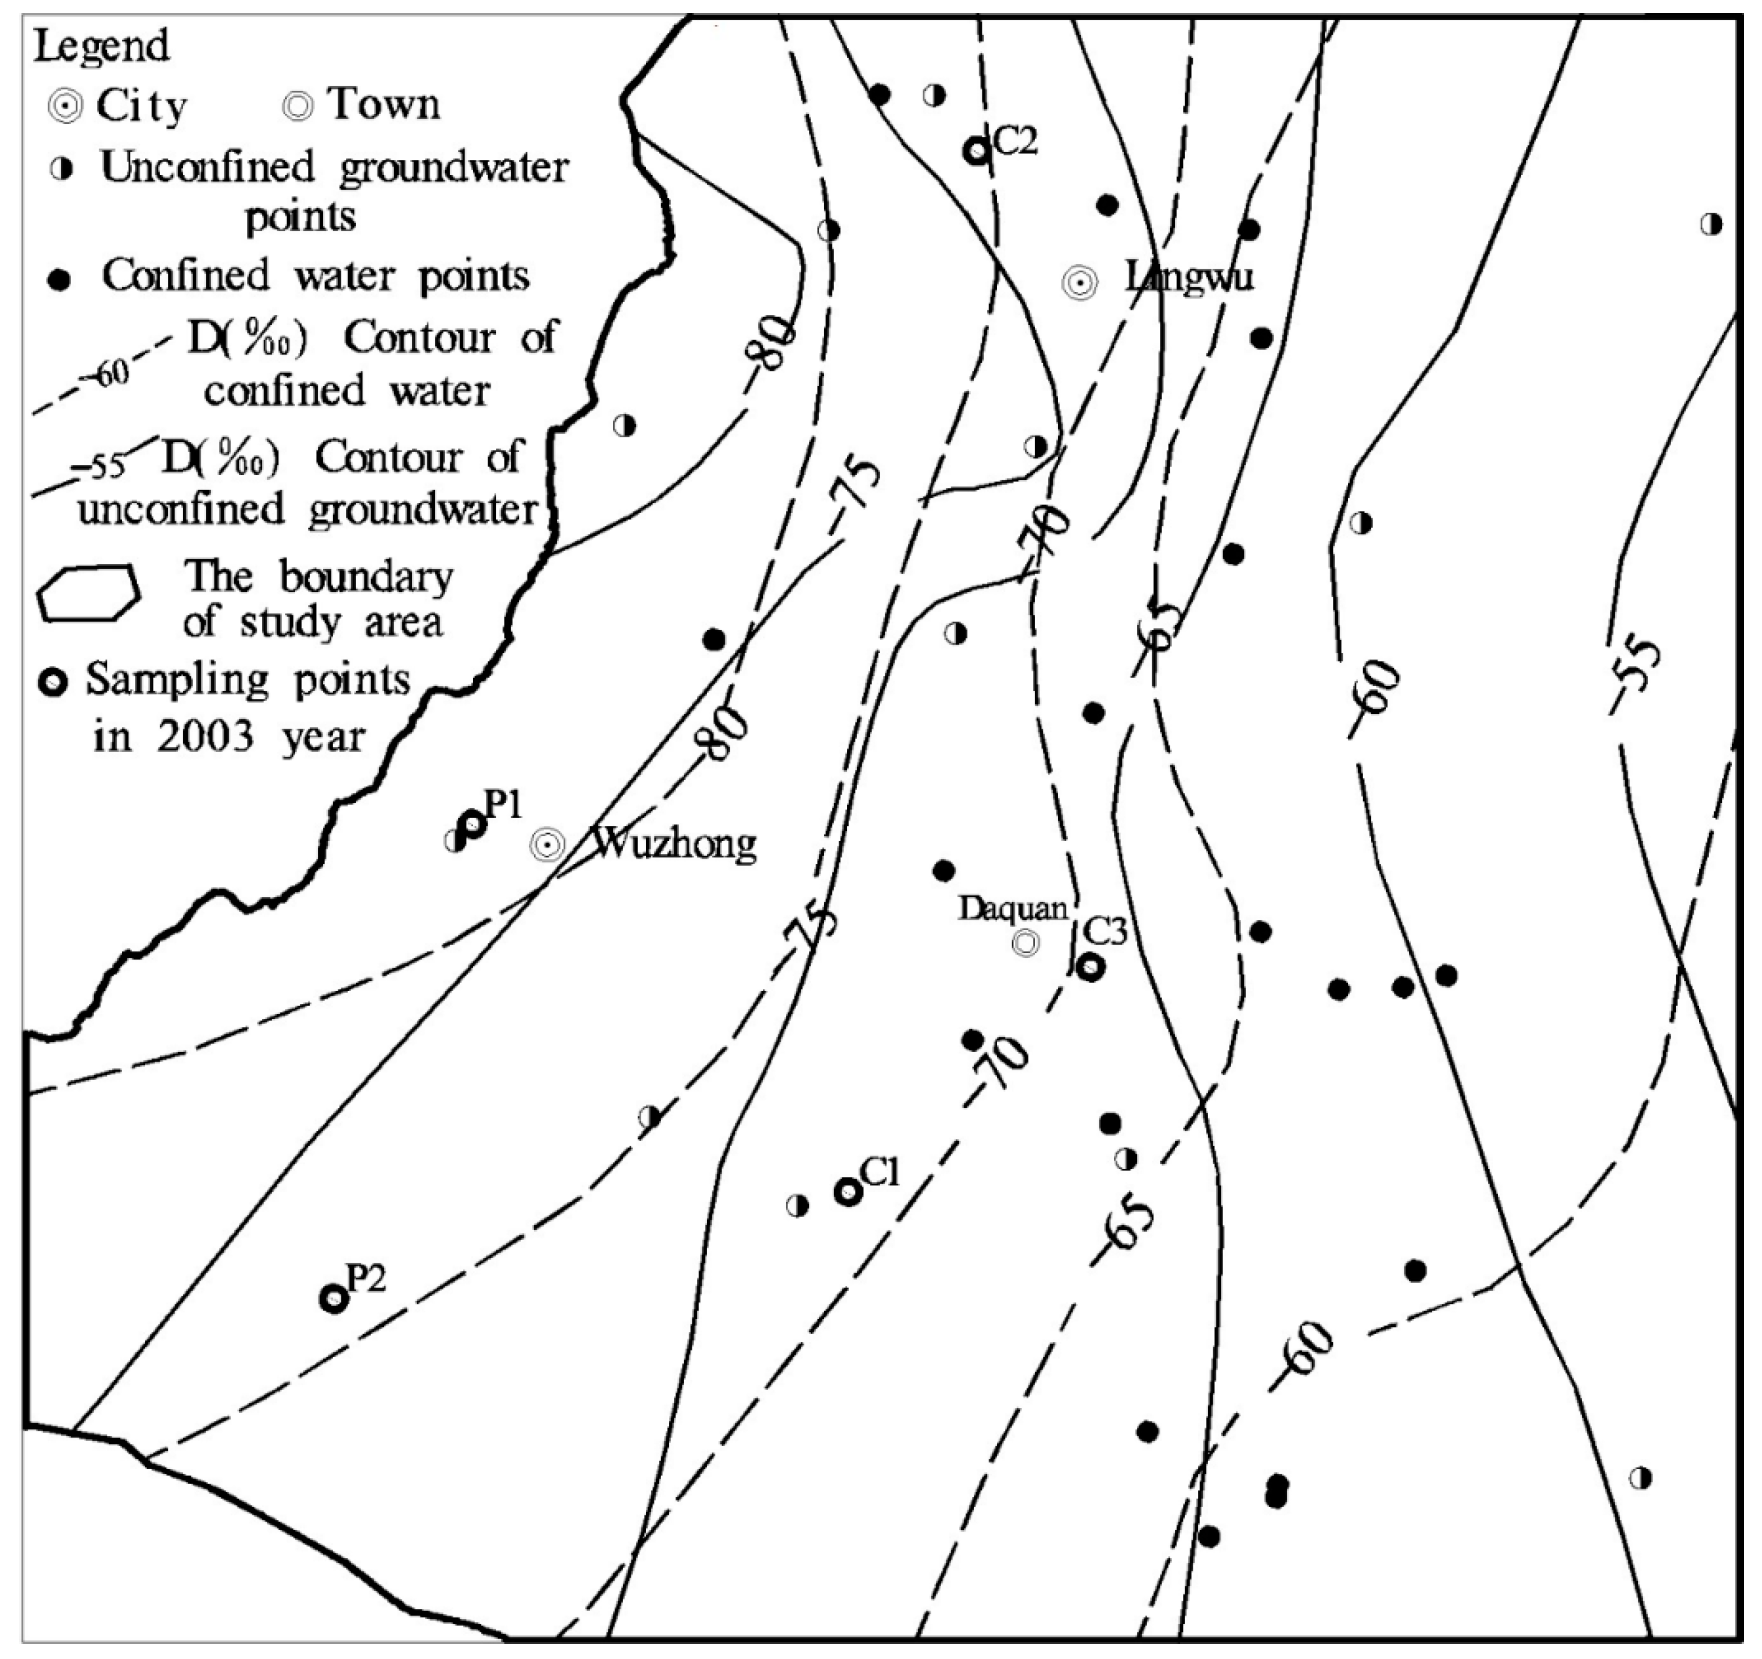
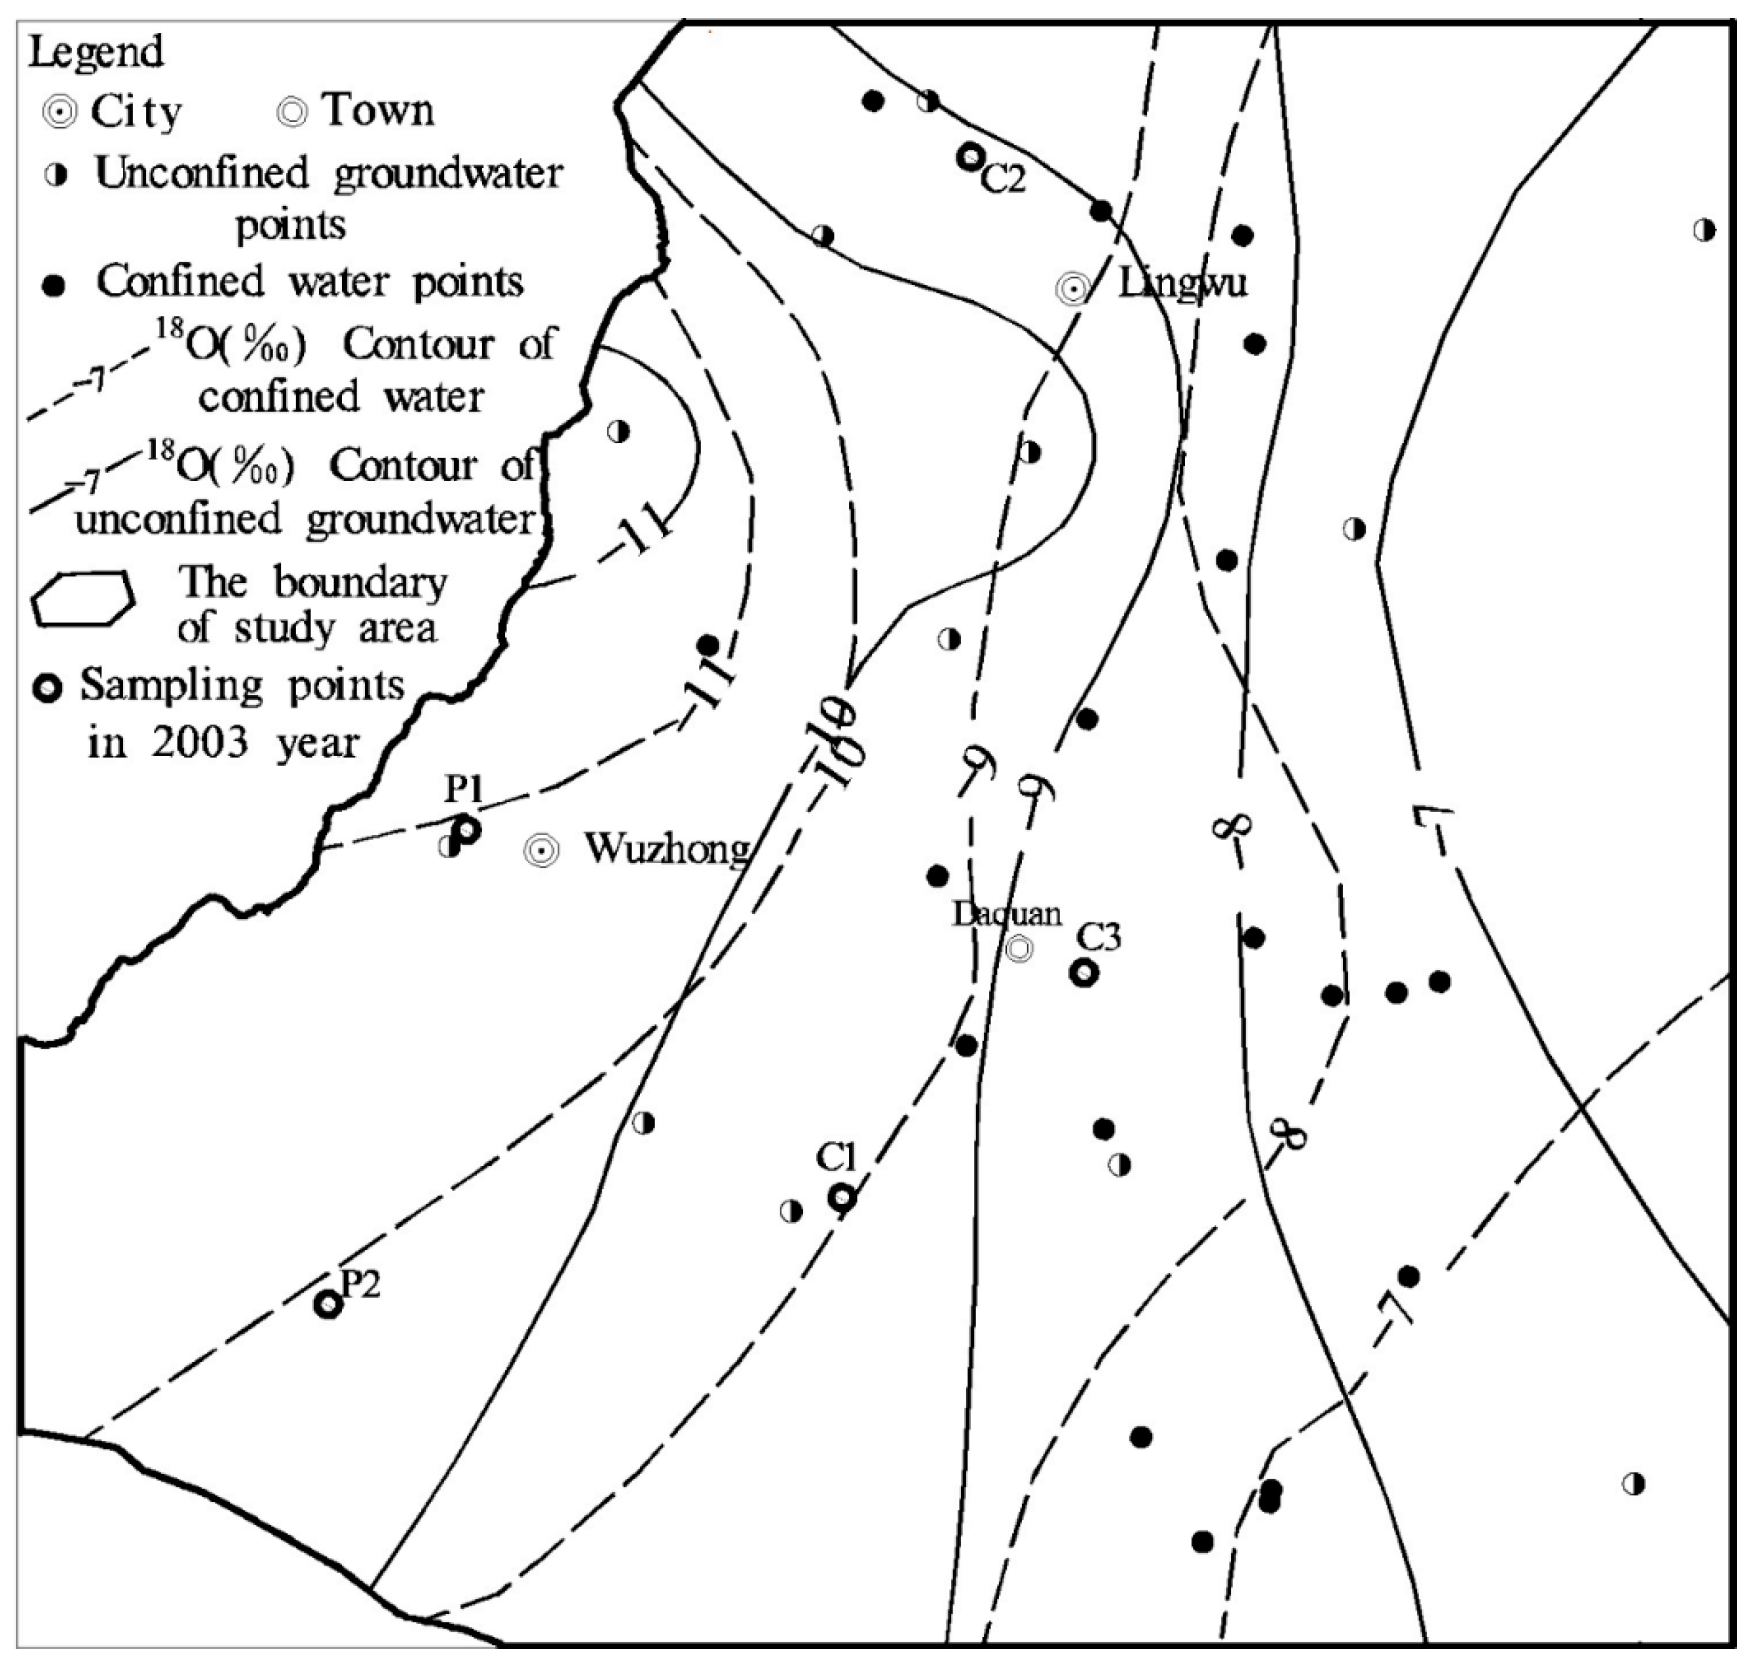
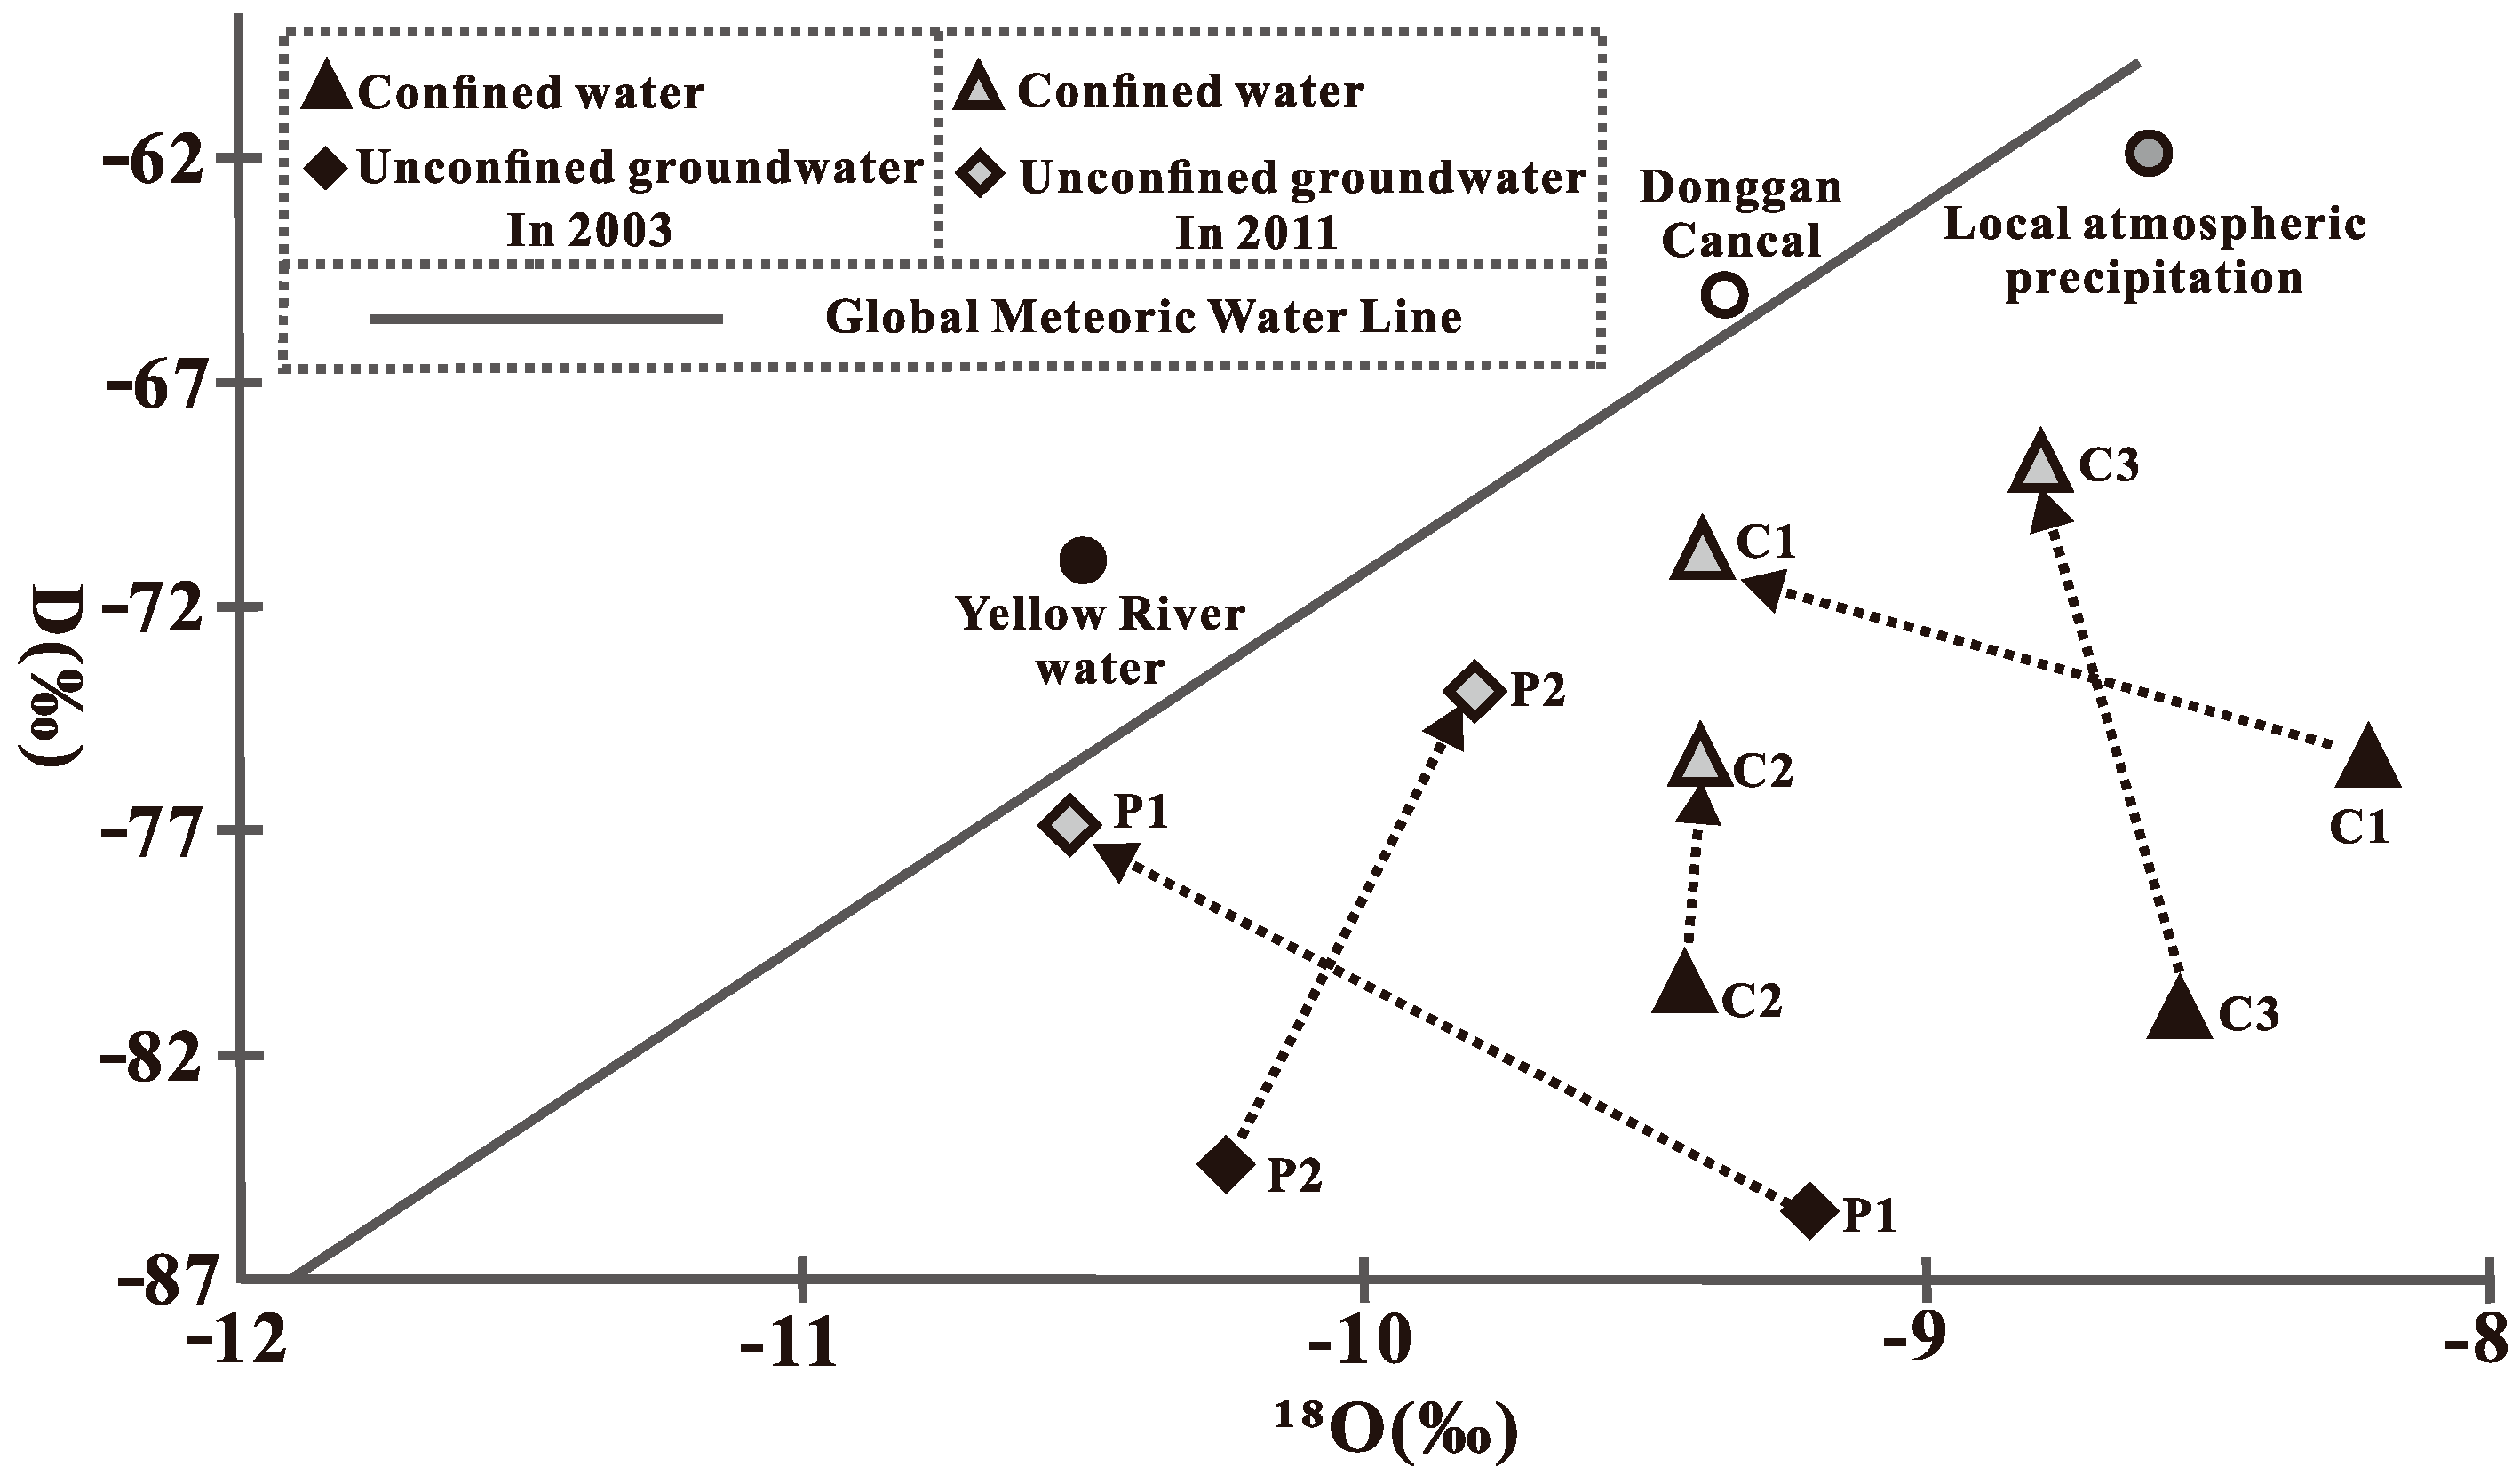
5. Isotopic Temporal and Spatial Distributions of Unconfined Groundwater and Confined Water

The δD and δ18O contour lines of July 2011 were shown in Figure 6 and Figure 7. The average values of δD and δ18O in Yellow River water samples collected at the outflow of Qingtong Gorge were −71‰ and −10.5‰, respectively. The average values of δD and δ18O of local atmospheric precipitation were −61.8‰ and −8.6‰, respectively. The values of δD and δ18O in water (S01) collected from the Donggan Canal in July 2011 were −65.13‰ and −9.36‰, respectively. Because the local precipitation has nearly no impact on the groundwater recharge for its limited amount, the irrigation water of study area mainly diverted from the Yellow River at the location of Qingtong Gorge. At Qingtong Gorge, the diverted Yellow River water is transferred into three canals; (1) Donggan Canal; (2) Qin Canal; and (3) Han Canal. According to the values of δD and δ18O from Yellow river and Donggan Canal, we can roughly confirm the value ranges of δD and δ18O of irrigation water are −71‰ to −65.13‰ and −10.5‰ to −9.36‰, respectively. In Figure 8, values of δD and δ18O from Yellow River and Donggan Canal are located in the upper left corner of GMWL, which are the combined action results of water mixing, evaporation, and human activities [32]. The average values of δD and δ18O of local atmospheric precipitation are located in the lower right corner because of evaporation.
The δD and δ18O contour lines (Figure 6 and Figure 7) from July 2011 indicate that the distribution and the variations in these two isotopes were very similar, and decreased gradually from the southeast to the northwest of the study area. In the gently sloping tableland, the δD and δ18O values were higher and were close to those of local atmospheric precipitation, which indicates that local atmospheric precipitation was the main recharge source of groundwater. From the eastern tableland to the western plain area, the groundwater values of δD and δ18O decreased gradually because of continual recharge of irrigation water from the diversion channel. The δD and δ18O values of confined water and unconfined groundwater were very similar in some parts of the alluvial-lacustrine plain, which reflects the close hydraulic connection between the confined and phreatic aquifers in these areas.
We combined values of δD and δ18O from five points, P1, P2, C1, C2, and C3, sampled in September 2003 (Figure 6 and Figure 7) [33], with values of δD and δ18O calculated by linear interpolation from the July 2011 isotope data (Figure 6 and Figure 7), the multi-year average value of δD and δ18O of the Yellow River water at the Qingtong Gorge outflow, local atmospheric precipitation, and of the Donggan Canal water sample, and compiled a schematic diagram to show changes in the values of δD and δ18O from 2003 to 2011 (Figure 8). The δD and δ18O values of unconfined groundwater (P1 and P2) and confined water (C1, C2, and C3) gradually approached the values of irrigation water from the Donggan Canal and the Yellow River water (Figure 8), but not the values of local atmospheric precipitation, which indicates that unconfined groundwater and confined water have been impacted more by irrigation recharge than by local precipitation recharge. We took no account of the isotopic seasonal effects because sampling points (P1, P2, C1, C2, C3) were collected at the same time and local precipitation had nearly no impact on groundwater recharge.

6. Construction of the Quantitative Groundwater Circulation Model by MCM

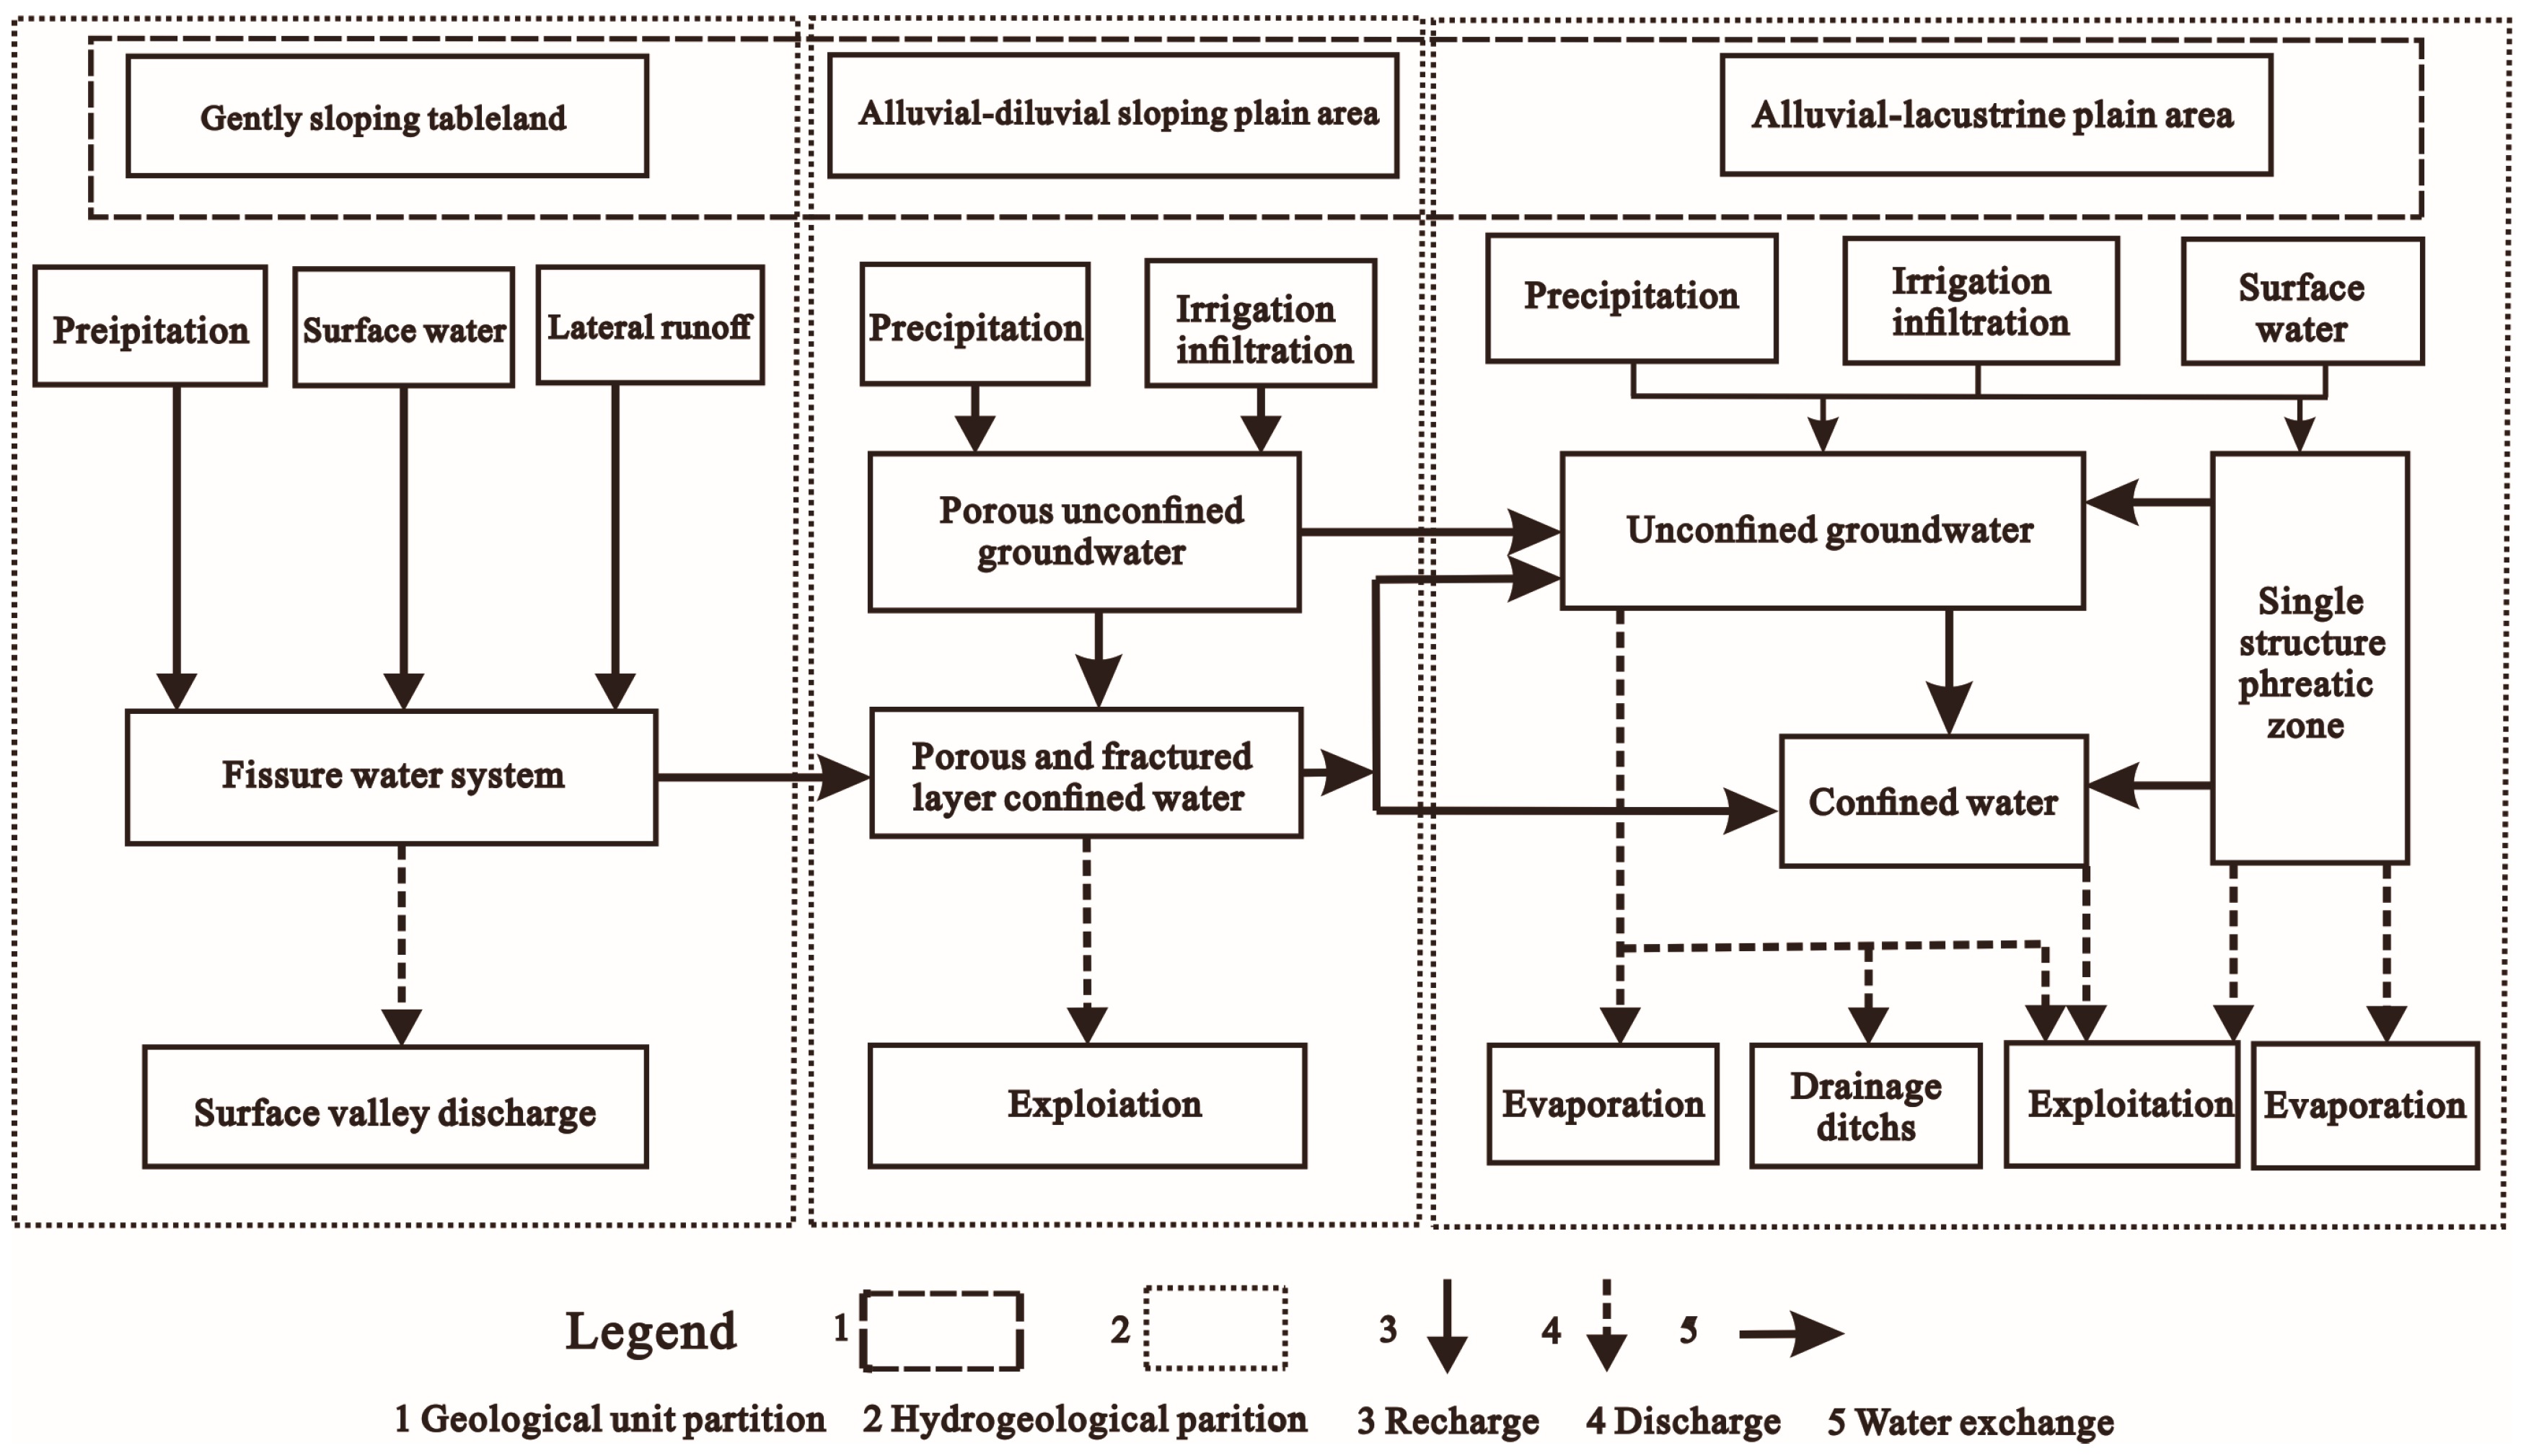
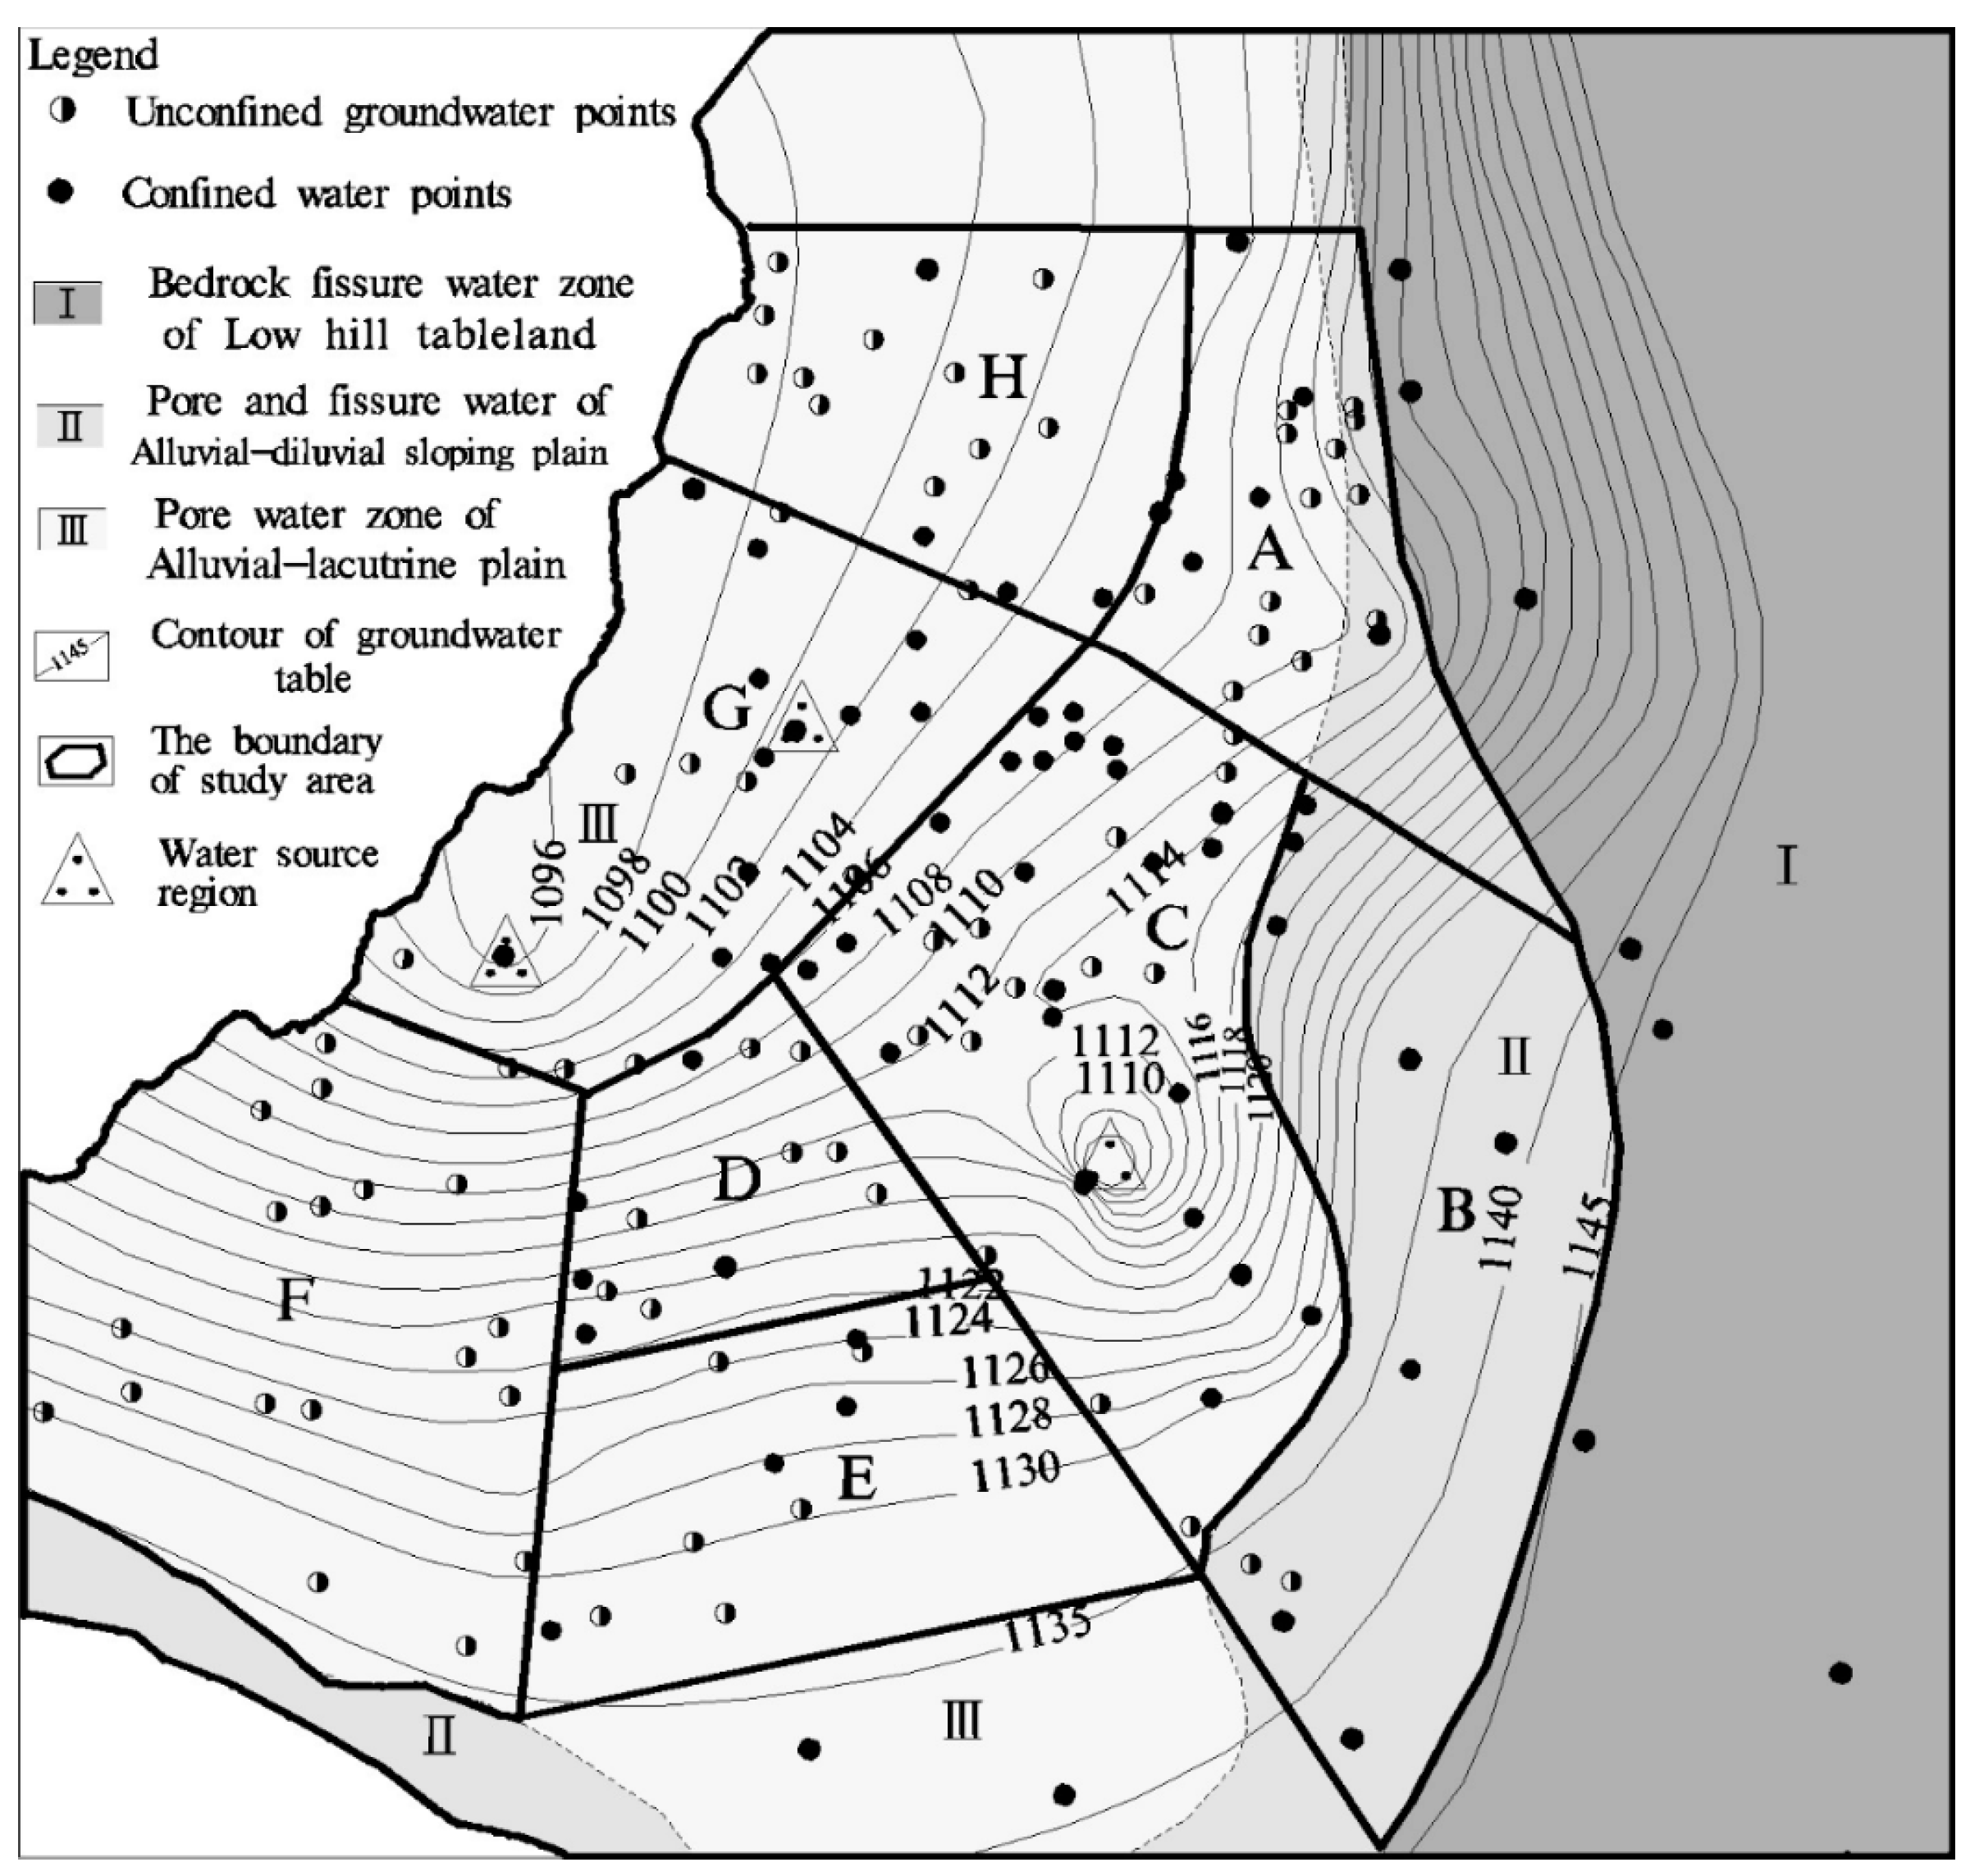
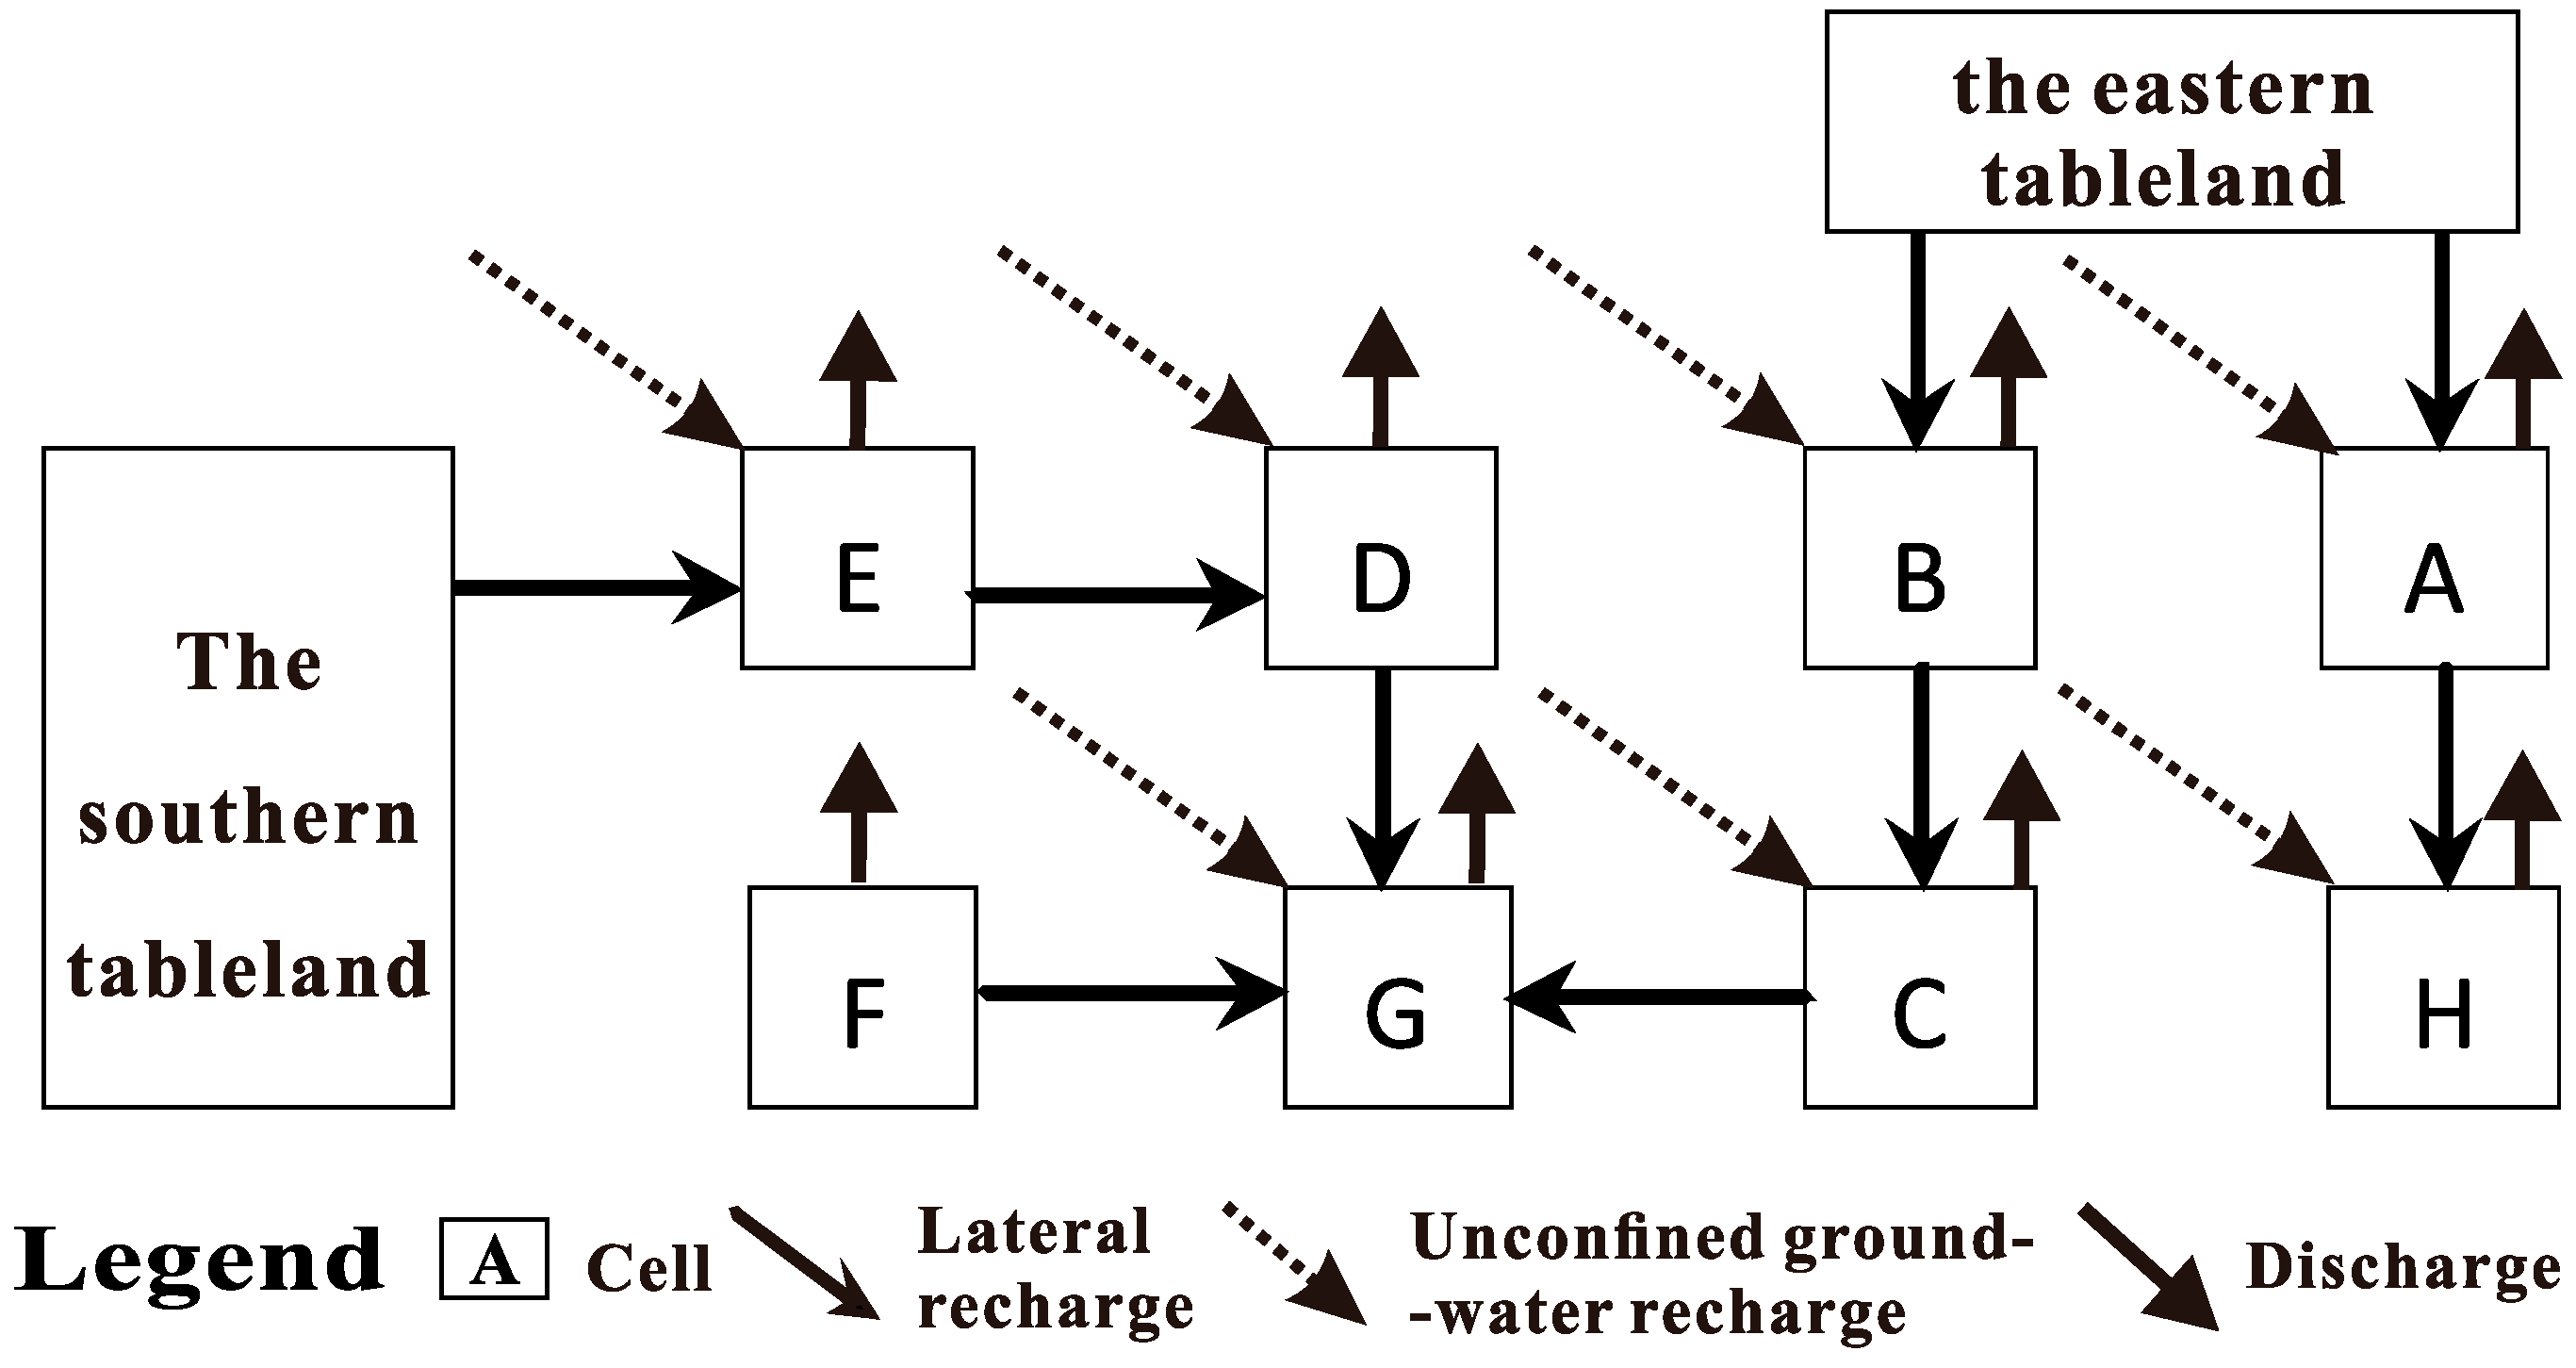
6.1. Construction of a Conceptual Model of Groundwater Flow Unconfined Groundwater

Based on the above results and the conditions of groundwater exploitation, we constructed a conceptual model of groundwater flow, and the constructed conceptual model was basically same as the research results of other scholars [28,31].
In gently sloping tableland, fissure water system receives recharge from precipitation, surface water, and lateral runoff. There are not extraction wells in this zone, and the discharge of groundwater is lateral runoff to surface valley, such as Dahezi River and Changliushui River (Figure 1), and to alluvial-diluvial sloping plain area downstream. In alluvial-diluvial sloping plain, porous unconfined groundwater receives recharge from precipitation and irrigation water, and then recharges the down confined water. The discharge of groundwater in this zone mainly consists of pumping from wells and moving downward to alluvial-lacustrine plain. In alluvial-lacustrine plain, the groundwater is dived into three types: the single structure phreatic zone, unconfined aquifer, and confined aquifer. Unconfined groundwater receives recharge from precipitation, surface water and irrigation water, and then downward recharge the confined water beneath. In the lateral direction, both of the unconfined aquifer and confined aquifer receive recharge from single structure phreatic zone. Discharge of unconfined groundwater consists of evaporation, draining to ditches and exploitation from wells, and discharge of confined water is mainly pumping from wells. Figure 9 shows the general water flow relations between different geological units and hydrogeological partitions.

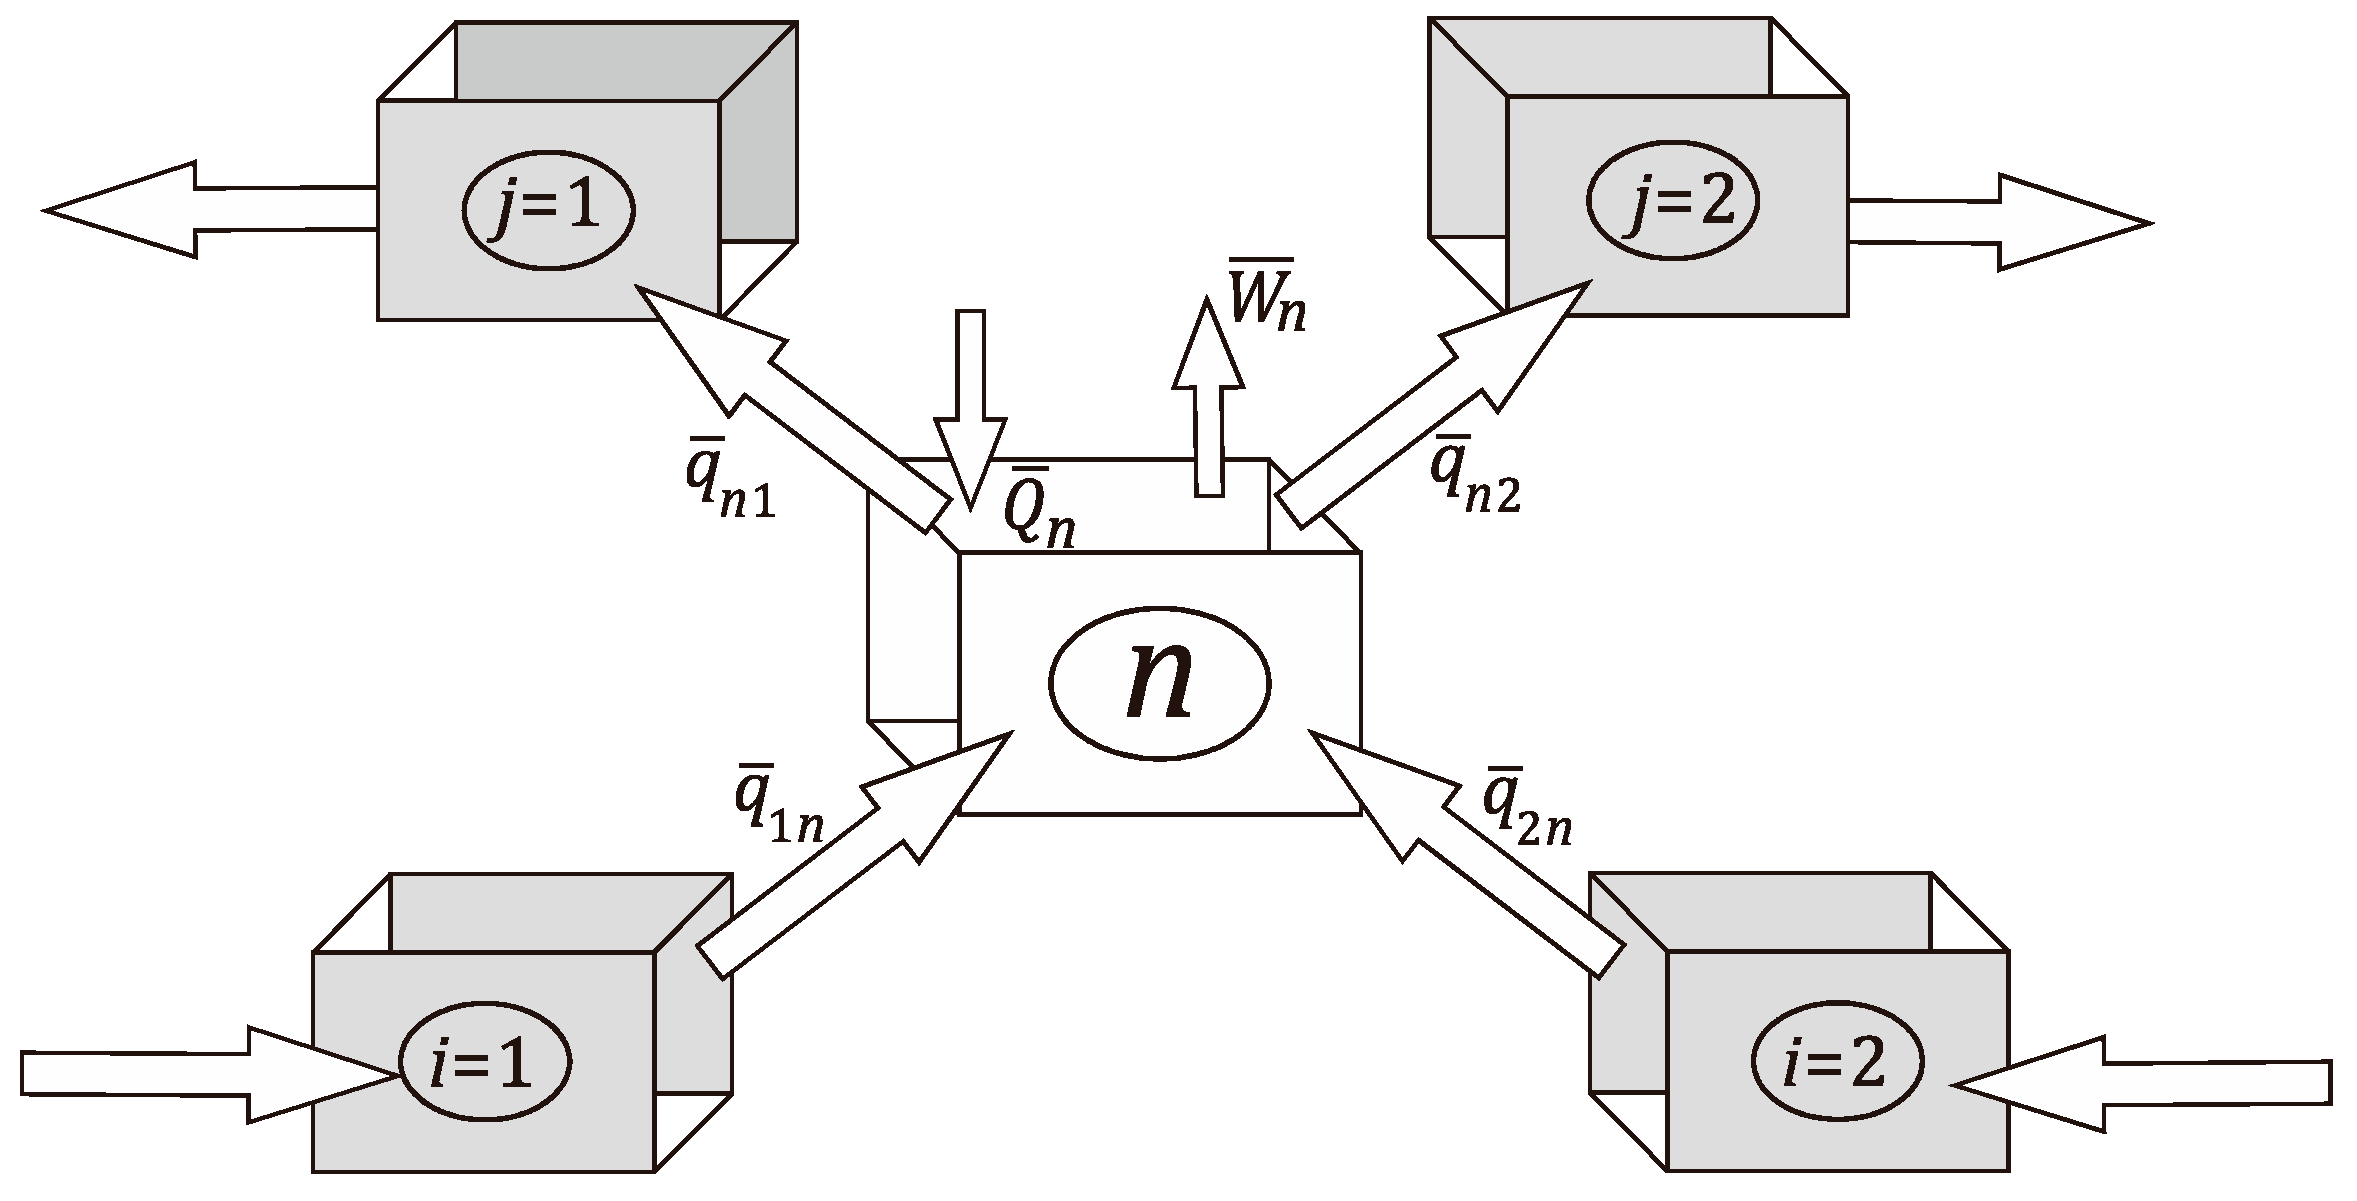
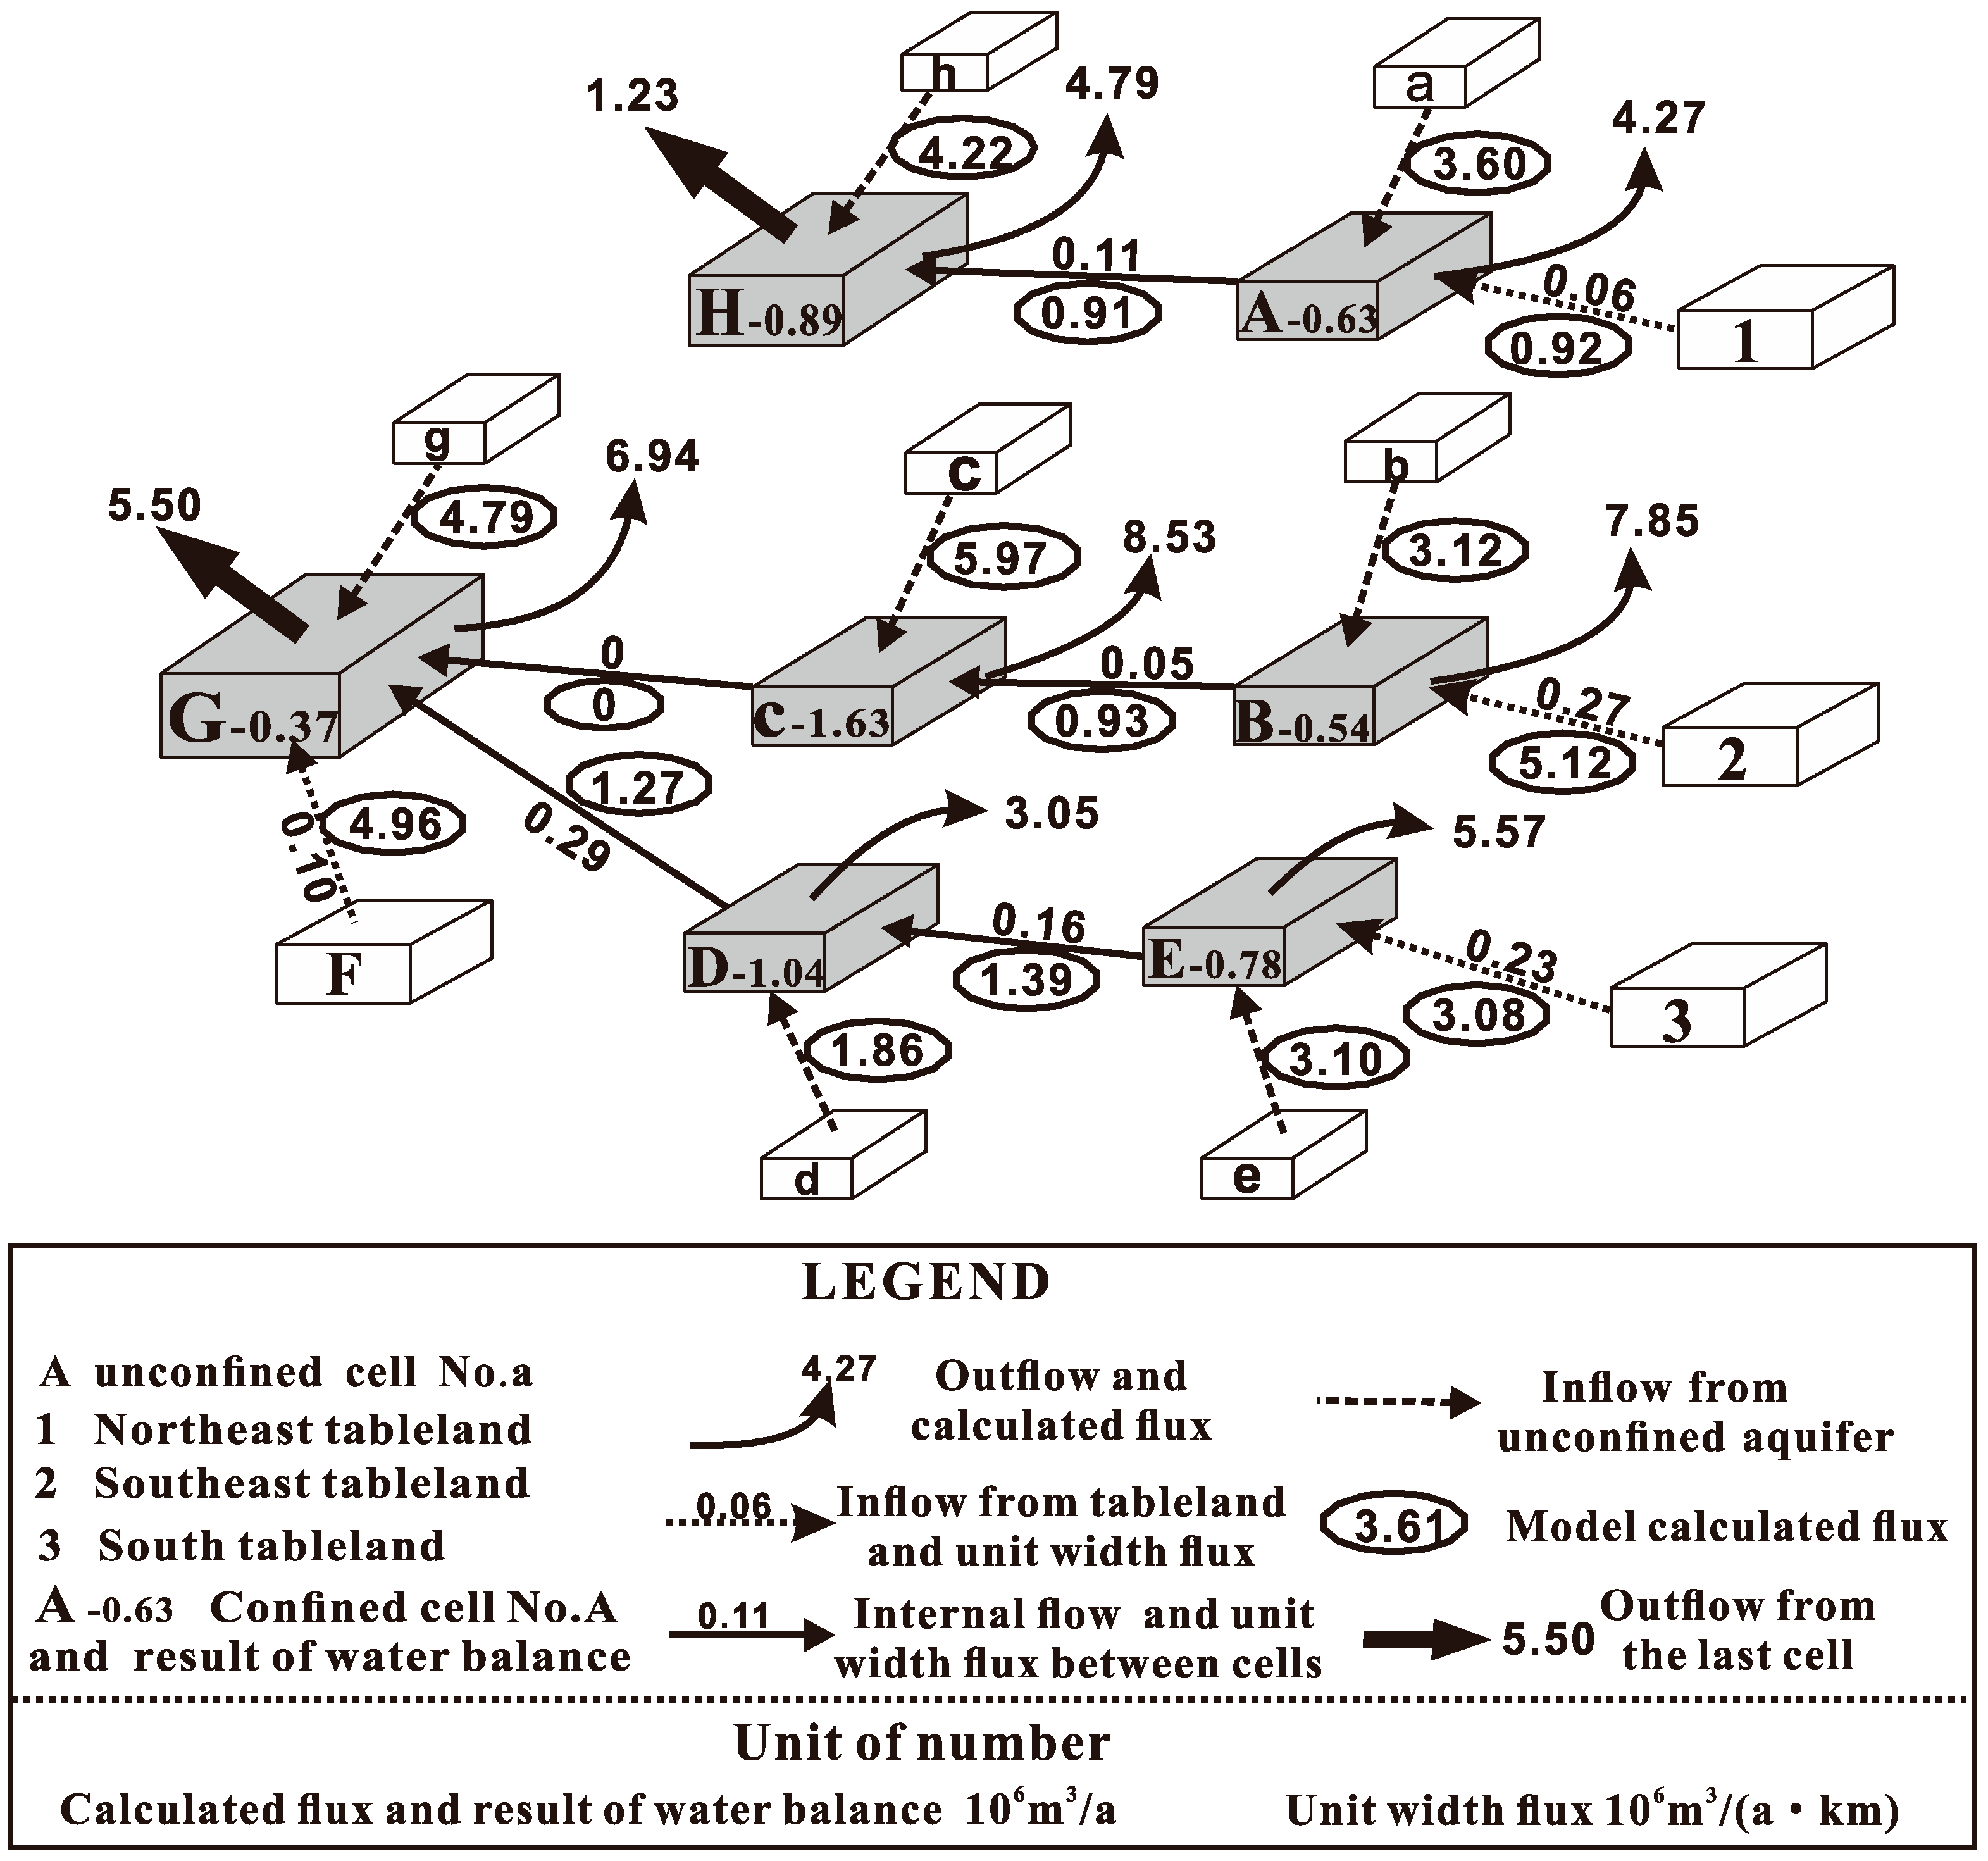
6.2. Mixing Cell Model Construction

The confined aquifer of the study area was divided into eight cells based on the following criteria: (1) Along groundwater flow paths and the contour shapes; dividing the study area into cells along groundwater flow paths, it will help to decrease unknown parameters; (2) As far as possible, cells did not span different hydrogeological units; different hydrogeological units store different types of ground water, and the ionic compositions are different. If a cell spans two or more hydrogeological units, the simulation error of the MCM model will be amplified; (3) There were available water sampling points in each cell; (4) The depression cone was only in one cell; if a depression cone span different cells, unknown parameters and items will increase in model.
The confined aquifer was distributed in the alluvial-diluvial sloping plain and the alluvial-lacustrine plain. The confined aquifer cells obtained by applying the above criteria are shown in Figure 10, and are labeled as A, B, C, D, E, F, G, and H. Cell B was in the alluvial-diluvial sloping plain, and the other cells were in the alluvial-lacustrine plain. Cells E and F were close to the southern alluvial-diluvial sloping plain. Cell F was a single phreatic zone and, in this study, was regarded as a recharge source for the confined aquifer. Cells G and H, adjacent to the Yellow River, were discharge cells. The recharge/discharge relationships among the aquifer cells are shown in Figure 11.
Confined water cells A, B, C, D, E, G, and H receive recharge from the overlying upper unconfined groundwater, and the corresponding source water cells have been labeled as a, b, c, d, e, g, and h. The hydrochemical and isotopic compositions of each cell are shown in Table 1.
The main discharge of confined water was pumping from wells distributed throughout the study area. The quantity of confined water extracted was calculated as 0.41 × 10⁸ m3/a based on information from the Water Resources Bulletin of the Ningxia Hui Autonomous Region. The amount of confined water consumption of each cell was calculated from the area ratio of each cell (Table 2). Cells G and H were the final lateral discharge cells, and the lateral outputs of G and H were calculated by Darcy’s Law (Table 3). The groundwater hydraulic gradient and the width of aquifer from cell G and H were measured on the vector map, and the conductivity and thickness of aquifer from cell G and H were consistent with relevant research [31].

6.3. Analysis of the Modeling Results and Construction of the Quantitative Water Circulation Model

The results of the MCM model indicate that the total water recharge to the confined aquifer was 40.73 × 10⁶ m3/a and the actual amount extracted from confined aquifer was 45.12 × 10⁶ m3/a. These results show that the confined aquifer is overexploited by 4.39 × 10⁶ m3/a.
Analysis of the model output (Table 4) shows that leakage from the upper unconfined groundwater (Table 5) accounted for 65.43% of the recharge of the confined aquifer, and was the main source of recharge. By adding the recharge of cells A and B, we estimated that 14.83% of the recharge was from the eastern tableland (Table 4). We also found that, by adding the recharge amounts from cell E and G, 19.74% of the recharge was from the southern tableland and alluvial−diluvial plain (Table 4). Out of all the confined aquifer cells, cell B had the smallest unit area recharge from the above unconfined groundwater. With the exception of cell B, all of the cells were in the crop irrigation area, and therefore received more irrigation water. Cell B was in the alluvial−diluvial sloping plain area, and because of the depth to the water table, the irrigation water barely reached the groundwater.
The quantitative flow scheme of confined water, derived from the results of the water balance and the model output, shows that the unit width flux between the cells is apparently influenced by the water source exploitation (Figure 12). For example, the lateral recharge from cell B to cell C is 0.05 × 10⁶ m3/(a·km), but there is no water exchange from cell C to cell G. This is because the Daquan water supply area in cell C (Figure 10) transforms the flux that should flow into next cell in an exploited quantity. Because of over extraction, the difference between the inflow and outflow to cell C is −1.63 × 10⁶ m3/a. The difference between the inflow and the outflow for cell C was the largest for the study area.

7. Conclusions

A qualitative model of water circulation was constructed from geological and hydrogeological information from the study area. The MCM was used to construct a quantitative water circulation model, which provided quantitative information about the confined aquifer, the main water supply aquifer for domestic drinking water in the study area.
Leakage from the upper unconfined groundwater and lateral flow (from the eastern and southern tablelands) were the main sources of recharge to the confined aquifer in the study area. Unconfined groundwater and lateral flow contributed 67.69% and 32.31% of the recharge, respectively. It is therefore very important to protect the phreatic aquifer of study area, as the confined aquifer is the main source of drinking water.
The quantitative groundwater circulation model provided us with quantitative information about water circulation in different parts (represented by cells A–F) of the study area. This information provides a robust scientific basis for sustainable water resource development and use in different parts of the study area.
Our study demonstrates that, in areas where there is insufficient hydrogeological data, such as arid areas in northwest China, the MCM is a useful and effective tool that can transform limited groundwater chemical data into quantitative information about an aquifer.
Compared with previous research in the area [28,29,30,31], we identified the recharge sources and their relative contributions to the confined aquifer at the first time. We are encouraged by the fact that the results of MCM are supported by geological, hydrogeological, irrigated, and extracted information from the study area. However, because the pumping information from individual extraction wells and water source areas in the study area are unavailable, the simulated results might have some deviation from the actual values. Once the pumping data of the wells are available and be input into MCM of the study area, the quantitative water circulation model will give more reasonable and reliable results.

Acknowledgments

This work was supported by the National Natural Science Foundation of China (41172205).

Author Contributions

Fugang Wang and Qinglin Li conceived and designed the concept model; Hongyan Liu tested the water samples; Xinxin Geng contributed to constructing the qualitative water circulation mode; Qinglin Li and Fugang Wang wrote and revised the paper.

Conflicts of Interest

The authors declare no conflict of interest.

References

  1. Reynolds, J.F.; Stafford Smith, D.M.; Lambin, E.F.; Turner, B.L.; Mortimore, M.; Batterbury, S.P.J.; Downing, T.E.; Dowlatabadi, H.; Fernandez, R.J.; Herrick, J.E.; et al. Global desertification: Building a science for dryland development. Science 2007, 316, 847–851. [Google Scholar] [CrossRef] [PubMed]
  2. Wang, L.; Li, G.; Dong, Y.; Han, D.; Zhang, J. Using hydrochemical and isotopic data to determine sources of recharge and groundwater evolution in an arid region: A case study in the upper-middle reaches of the Shule River basin, northwestern China. Environ. Earth Sci. 2014, 73, 1901–1915. [Google Scholar] [CrossRef]
  3. Mayzelle, M.M.; Viers, J.H.; Medellin-Azuara, J.; Harter, T. Economic feasibility of irrigated agricultural land use buffers to reduce groundwater nitrate in rural drinking water sources. Water 2015, 7, 12–37. [Google Scholar] [CrossRef]
  4. Fugang, W. The Application of Isotope Techniques in the Hydrological Cycle of Overground Section (Henan Section) of the Lower Reaches of Yellow River. Ph.D. Thesis, Jilin University, Changchun, China, 2006. [Google Scholar]
  5. Klaus, J.; Külls, C.; Dahan, O. Evaluating the recharge mechanism of the Lower Kuiseb Dune area using mixing cell modeling and residence time data. J. Hydrol. 2008, 358, 304–316. [Google Scholar] [CrossRef]
  6. Dahan, O.; McGraw, D.; Adar, E.; Pohll, G.; Bohm, B.; Thomas, J. Multi-variable mixing cell model as a calibration and validation tool for hydrogeologic groundwater modeling. J. Hydrol. 2004, 293, 115–136. [Google Scholar] [CrossRef]
  7. Marques, J.M.; Eggenkamp, H.G.M.; Graca, H.; Carreira, P.M.; Matias, M.J.; Mayer, B.; Nunes, D. Assessment of recharge and flowpaths in a limestone thermomineral aquifer system using environmental isotope tracers (Central Portugal). Isot. Environ. Health Stud. 2010, 46, 156–165. [Google Scholar] [CrossRef] [PubMed]
  8. Hagedorn, B. Hydrochemical and 14 C constraints on groundwater recharge and interbasin flow in an arid watershed: Tule Desert, Nevada. J. Hydrol. 2015, 523, 297–308. [Google Scholar] [CrossRef]
  9. Yang, Q.; Xiao, H.L.; Zhao, L.J.; Yang, Y.G.; Li, C.Z.; Zhao, L.A.; Yin, L. Hydrological and isotopic characterization of river water, groundwater, and groundwater recharge in the heihe river basin, northwestern china. Hydrol. Process. 2011, 25, 1271–1283. [Google Scholar] [CrossRef]
  10. Cook, P.G.; Herczeg, A.L. Environmental Tracers in Subsurface Hydrology; Springer Science & Business Media: New York, NY, USA, 2012. [Google Scholar]
  11. Eastoe, C.J.; Rodney, R. Isotopes as tracers of water origin in and near a regional carbonate aquifer: The southern Sacramento Mountains, New Mexico. Water 2014, 6, 301–323. [Google Scholar] [CrossRef]
  12. Kebede, S.; Travi, Y.; Alemayehu, T.; Ayenew, T. Groundwater recharge, circulation and geochemical evolution in the source region of the Blue Nile River, Ethiopia. Appl. Geochem. 2005, 20, 1658–1676. [Google Scholar] [CrossRef]
  13. Zhu, C. Estimate of recharge from radiocarbon dating of groundwater and numerical flow and transport modeling. Water Resour. Res. 2000, 36, 2607–2620. [Google Scholar] [CrossRef]
  14. Davisson, M.; Smith, D.; Kenneally, J.; Rose, T. Isotope hydrology of southern nevada groundwater: Stable isotopes and radiocarbon. Water Resour. Res. 1999, 35, 279–294. [Google Scholar] [CrossRef]
  15. Gibson, J.; Edwards, T.; Birks, S.; St Amour, N.; Buhay, W.; McEachern, P.; Wolfe, B.; Peters, D. Progress in isotope tracer hydrology in Canada. Hydrol. Process. 2005, 19, 303–327. [Google Scholar] [CrossRef]
  16. Viville, D.; Ladouche, B.; Bariac, T. Isotope hydrological study of mean transit time in the granitic strengbach catchment (Vosges massif, France): Application of the FlowPC model with modified input function. Hydrol. Process. 2006, 20, 1737–1751. [Google Scholar] [CrossRef]
  17. Clark, J.F.; Stute, M.; Schlosser, P.; Drenkard, S.; Bonani, G. A tracer study of the Floridan aquifer in southeastern Georgia: Implications for groundwater flow and paleoclimate. Water Resour. Res. 1997, 33, 281–289. [Google Scholar] [CrossRef]
  18. Ofterdinger, U.; Balderer, W.; Loew, S.; Renard, P. Environmental isotopes as indicators for ground water recharge to fractured granite. Ground Water 2004, 42, 868–879. [Google Scholar] [PubMed]
  19. Weyhenmeyer, C.E.; Burns, S.J.; Waber, H.N.; Macumber, P.G.; Matter, A. Isotope study of moisture sources, recharge areas, and groundwater flow paths within the eastern Batinah coastal plain, Sultanate of Oman. Water Resour. Res. 2002, 38, 2-1–2-22. [Google Scholar] [CrossRef]
  20. Pang, Z. Isotope and chemical geothermometry and its applications. Sci. China Ser. E Technol. Sci. 2001, 44, 16–20. [Google Scholar] [CrossRef]
  21. Adar, E.M.; Nativ, R. Use of hydrochemistry and isotopes in a mixing-cell model to quantify the relative contribution of multiple-source contaminants to seepage from a fractured chalk aquitard. In Proceedings of the TraM’2000 Conference, Liège, Belgium, May 2000; pp. 315–320.
  22. Adar, E.M.; Neuman, S.P.; Woolhiser, D.A. Estimation of spatial recharge distribution using environmental isotopes and hydrochemical data, I. Mathematical model and application to synthetic data. J. Hydrol. 1988, 97, 251–277. [Google Scholar] [CrossRef]
  23. Adar, E.M.; Neuman, S.P. Estimation of spatial recharge distribution using environmental isotopes and hydrochemical data, II. Application to aravaipa valley in southern arizona, USA. J. Hydrol. 1988, 97, 279–302. [Google Scholar] [CrossRef]
  24. Fraser, C.; Roulet, N.; Lafleur, M. Groundwater flow patterns in a large peatland. J. Hydrol. 2001, 246, 142–154. [Google Scholar] [CrossRef]
  25. Partington, D.; Brunner, P.; Simmons, C.T.; Therrien, R.; Werner, A.D.; Dandy, G.C.; Maier, H.R. A hydraulic mixing−cell method to quantify the groundwater component of streamflow within spatially distributed fully integrated surface water–groundwater flow models. Environ. Model. Softw. 2011, 26, 886–898. [Google Scholar] [CrossRef]
  26. Brouyère, S.; Orban, P.; Wildemeersch, S.; Couturier, J.; Gardin, N.; Dassargues, A. The hybrid finite element mixing cell method: A new flexible method for modelling mine ground water problems. Mine Water Environ. 2009, 28, 102–114. [Google Scholar] [CrossRef]
  27. Schubert, M.; Scholten, J.; Schmidt, A.; Comanducci, J.F.; Pham, M.K.; Mallast, U.; Knoeller, K. Submarine groundwater discharge at a single spot location: Evaluation of different detection approaches. Water 2014, 6, 584–601. [Google Scholar] [CrossRef]
  28. Dongyan, G. Study of Groundwater Circulation Mechanism in Ling Wu Daquan Area. Master’s Thesis, Jilin University, Changchun, China, 2012. [Google Scholar]
  29. Tianhei, G. Probe into underground water fluorine enrichment and distribution pattern in Mianzishan Foreland, Lingwu. Coal Geol. China 2009, 11, 017. [Google Scholar]
  30. Xirong, H.; Guisheng, X. The characteristics of petrography and quality and geological interpretation of coal of yanan formation in lingwu coalfield. Coal Geol. China 1999, 2, 004. [Google Scholar]
  31. Huiming, Y. A Constitute Ananlysis of Groundwater Resources in Lingwu Daquan. Master’s Thesis, China University of Geosciences (Beijing), Beijing, China, 2011. [Google Scholar]
  32. Xiaosi, S.; Xueyu, L.; Zisheng, L.; Jinsheng, W. Variation of isotopes in the Yellow River along the flow path and its affecting factors. Geochimica 2003, 32, 349–357. [Google Scholar]
  33. Jun, L. Environmental Isotope Trace of Groundwater in Yinchuan Plain. Master’s Thesis, Changan’s University, Xi’an, China, 2007. [Google Scholar]
Figure 1. The location of the study area and hydrogeological zones within it.
Water 08 00354 g001
Figure 2. A schematic for the mass conservation equation construction.
Water 08 00354 g002
Figure 3. The hydrogeological profile of the study area.
Water 08 00354 g003
Figure 4. Unconfined groundwater contour lines.
Water 08 00354 g004
Figure 5. Confined water contour lines.
Water 08 00354 g005
Figure 6. Contour lines of groundwater δ18O (‰).
Water 08 00354 g006
Figure 7. Contour lines of groundwater δD (‰).
Water 08 00354 g007
Figure 8. Changes in the values of δD and δ18O (‰).
Water 08 00354 g008
Figure 9. Qualitative groundwater circulation in the study area.
Water 08 00354 g009
Figure 10. Cells in the confined aquifer and the distribution of the water chemistry sampling points.
Water 08 00354 g010
Figure 11. Relationships between the cells.
Water 08 00354 g011
Figure 12. Quantitative water circulation model of the confined aquifer cells.
Water 08 00354 g012
Table 1. Hydrochemical and isotopic data of each cell.
NameConstituentK+Na+Ca2+Mg2+ClSO42−HCO3D18O
AAverage value0.085.354.225.054.353.925.43−63.15−8.04
Square error09.681.682.192.682.723.8911.81.79
BAverage value0.064.242.842.862.73.434.05−60.78−7.58
Square error05.952.910.050.181.152.384.150.07
CAverage value0.0824.414.653.522.533.295.98−67.17−8.57
Square error01.471.030.110.460.560.168.590.01
DAverage value0.0413.762.543.372.342.283.6−72.14−9.45
Square error00.398.240.780.171.255.75//
EAverage value0.074.513.884.112.412.976.41−67.33−7.38
Square error00.093.838.020.552.345.82//
GAverage value0.074.483.043.33.083.216.87−77.57−10.54
Square error00.720.41.530.281.371.41//
HAverage value0.075.324.015.23.584.125.81−73.26−9.15
Square error00.813.940.690.022.30.78//
aAverage value0.087.255.586.965.255.857.54−75.32−9.61
Square error010.254.143.347.734.141.7623.640.1
bAverage value0.076.913.254.55.986.073.17−66.57−7.96
Square error00.021.292.087.860.130.214.140.22
cAverage value0.095.753.784.255.55.148.34−79.57−9.85
Square error02.655.334.457.952.822.660.030.02
dAverage value0.066.314.813.083.143.57.69−79.06−10.16
Square error05.381.283.730.761.94823.771.41
eAverage value0.096.013.733.533.13.268.64−76.38−9.8
Square error06.461.131.540.130.510.99//
fAverage value0.093.344.113.342.262.785.86−80.94−10.96
Square error00.762.952.580.220.873.04//
gAverage value0.16.024.795.933.534.38.68−81.87−11.28
Square error00.170.521.110.060.481.07//
hAverage value0.095.715.185.924.754.158.9−80.05−10.51
Square error019.432.693.4112.062.924.51//
Northeast tablelandAverage value0.064.030.530.083.013.554.9−65.5−7.96
Square error05.952.910.050.181.152.384.150.07
Southeast tablelandAverage value0.033.190.892.132.362.84.19−62.28−8.65
Square error00.170.521.110.060.481.07//
South tablelandAverage value0.074.215.74.562.543.46.26−65.61−9.83
Square error0.024.330.780.062.213.053.9−58.72−6.95
Notes: (1) Concentrations are in meq·L−1 unless otherwise indicated, Deuterium (‰), Oxygen −18 (‰); (2) “/” means that we have only one sampling point and the Square error cannot be calculated.
Table 2. Water consumption of each cell.
CellsABCDEGH
Area (km2)21.9440.3243.8215.6428.635.6124.59
Consumption (106 m3/a)4.277.858.533.055.576.944.79
Note: “a” stands for per annum.
Table 3. Lateral groundwater discharge of Cells G and H.
Cell CodeWidth of Aquifer (km)Thickness of Aquifer (m)Hydraulic Conductivity (m/d)Hydraulic GradientConsumption (106 m3/a)
H5.25121.57.91/15001.23
G8.514.61/10005.50
Note: “d” stands for per day.
Table 4. Quantity of recharge from external systems received by the confined aquifer (106 m3/a).
CellsABCDEGHTotalProportion
Unconfined groundwater inflow3.603.125.971.863.14.784.2226.6565.43%
East tableland−inflow0.925.126.0414.83%
South tableland−inflow3.084.968.0419.74%
Table 5. Unit area recharge quantity from the upper unconfined aquifer.
CellsABCDEGH
Unconfined groundwater inflow (106 m3/a)3.603.125.971.863.104.784.22
Area (km2)21.9440.3243.8215.6428.635.6124.59
Inflow of unit area (106 m3/a·km2)0.160.080.140.120.110.130.17

