Article

Evaluation of Satellite Precipitation Products with Rain Gauge Data at Different Scales: Implications for Hydrological Applications

1
Key Laboratory of Watershed Geographic Sciences, Nanjing Institute of Geography and Limnology, Chinese Academy of Sciences, No. 73 East Beijing Road, Nanjing 210008, China
2
University of Chinese Academy of Sciences, No. 19 Yuquan Road, Beijing 100049, China
*
Author to whom correspondence should be addressed.
Water 2016, 8(7), 281; https://doi.org/10.3390/w8070281
Submission received: 21 February 2016 / Revised: 27 June 2016 / Accepted: 29 June 2016 / Published: 9 July 2016

Abstract

:
Rain gauge and satellite-retrieved data have been widely used in basin-scale hydrological applications. While rain gauges provide accurate measurements that are generally unevenly distributed in space, satellites offer spatially regular observations and common error prone retrieval. Comparative evaluation of gauge-based and satellite-based data is necessary in hydrological studies, as precipitation is the most important input in basin-scale water balance. This study uses quality-controlled rain gauge data and prevailing satellite products (Tropical Rainfall Measuring Mission (TRMM) 3B43, 3B42 and 3B42RT) to examine the consistency and discrepancies between them at different scales. Rain gauges and TRMM products were available in the Poyang Lake Basin, China, from 1998 to 2007 (3B42RT: 2000–2007). Our results show that the performance of TRMM products generally increases with increasing spatial scale. At both the monthly and annual scales, the accuracy is highest for TRMM 3B43, with 3B42 second and 3B42RT third. TRMM products generally overestimate precipitation because of a high frequency and degree of overestimation in light and moderate rain cases. At the daily scale, the accuracy is relatively low between TRMM 3B42 and 3B42RT. Meanwhile, the performances of TRMM 3B42 and 3B42RT are highly variable in different seasons. At both the basin and pixel scales, TRMM 3B43 and 3B42 exhibit significant discrepancies from July to September, performing worst in September. For TRMM 3B42RT, all statistical indices fluctuate and are low throughout the year, performing worst in July at the pixel scale and January at the basin scale. Furthermore, the spatial distributions of the statistical indices of TRMM 3B43 and 3B42 performed well, while TRMM 3B42RT displayed a poor performance.

1. Introduction

Precipitation is an output flux of atmospheric processes and a driving force of hydrological processes. It is a critical component of the hydrological cycle, regardless of whether one is primarily concerned with global, regional, or local hydrology [1,2]. The significance of accurate precipitation measurements is evident in the context of hydrological, meteorological and climatological processes. There are three primary sources of precipitation observations, including surface networks, ground-based radar and satellite estimations. Surface networks provided the only totally direct point measurement of precipitation and likely provide the most accurate measurements with the help of traditional rain gauges. In addition, disdrometers, another way to obtain point precipitation data at the surface, have quickly been spreading in recent years [3]. The global distribution of surface networks is uneven. Over landmasses, some regions have relatively high densities of gauges, while few gauges are available in others. Over the oceans, few gauges exist [4]. Ground-based radar observations are excellent alternatives with relatively high accuracy [3]. However, these ground instruments are not distributed globally, leaving many precipitation areas unsampled, such as high-altitude regions and oceans, due to their fixed position, limited sampling range and relatively high costs of operation and maintenance [5]. Satellites offer another practical approach for estimating precipitation, overcoming the limitations of ground techniques, especially in places where ground instruments are sparsely distributed or unsampled, at different spatial and temporal resolutions [3,6,7,8].
Satellite estimates of precipitation can be derived from a range of observations with many different sensors. The retrieval approaches can be primarily categorized into visible/infrared (VIS/IR) techniques, microwave (MW) techniques and multi-sensor combined techniques [9,10,11]. The Tropical Rainfall Measuring Mission (TRMM), which was launched on 27 November 1997, provides an exceptional opportunity to monitor precipitation over tropical and subtropical regions, particularly with the help of the TRMM Microwave Imager (TMI) and precipitation radar (PR) [12]. Many approaches have been proposed to retrieve precipitation from TRMM data [13,14,15]. One of the best retrieval algorithms is TRMM Multi-Satellite Precipitation Analysis (TMPA), which is based on TMI and geostationary IR data. It provides global coverage of precipitation over the 50° S–50° N latitude belt at 0.25° × 0.25° spatial and 3 h temporal resolutions for 3B42RT, 3B42 and monthly temporal resolution for 3B43 [16]. TRMM 3B42RT includes merged satellite data while TRMM 3B42 and 3B43 are based on TRMM 3B42RT with gauge data.
The TMPA products have been widely used for various applications [17,18,19,20,21]. A prerequisite for reliable use of satellite products is the accuracy of the products. Dinku et al. [22] compared the TRMM 3B43 products with nine other satellite products using a rain gauge network over Ethiopia. Their results showed that TRMM 3B43 performed very well with a bias of less than 10% and a root mean square error (RMSE) of approximately 25%. Fleming et al. [23] evaluated TRMM 3B43 with monthly 0.25° × 0.25° values gridded from rain gauge data collected over Australia in 1998–2007. The results indicated that TRMM 3B43 had a high correlation of >0.80 with the gridded data, which was strongest in summer. Chokngamwong and Chiu [24] evaluated the TRMM 3B43 and 3B42 products with daily and monthly 1° × 1° values of gridded Global Precipitation Climatology Centre (GPCC) data over Thailand in 1998–2002. The results indicated that TRMM 3B42 performed very well, with a bias of less than −0.12 mm·day−1, while TRMM 3B43 exhibited low biases. As-Syakur et al. [25] demonstrated that the 3B42 and 3B43 products showed the same levels of relationships at the monthly scale during the wet season and dry season, and a poor relationship was found at the daily scale in Bali islands in 1998–2002. Semire et al. [26] reported that TRMM 3B43 performed well, with an error bias of ±15% at the monthly scale, based on 22 rain gauges distributed over Malaysia in 2001–2010. Accuracy assessment of the TRMM products has become a common research topic worldwide in recent decades [27,28,29,30,31].
Most existing studies use rain gauge data, either in situ or gridded, as references to evaluate satellite precipitation products. In situ and pixel scale precipitation is very important to meteorological services, but larger scale and basin-scale precipitation is more meaningful for hydrological applications [32,33]. While the products may have retrieval errors due to inherent limitations in precipitation retrieval algorithms or the limited sensitivity of satellite sensors, they can also be improperly evaluated due to unevenly or sparsely distributed rain gauge stations. Given the advantages of satellite observations in capturing spatial distributions of precipitation, the accuracy of basin-scale precipitation is often undocumented in existing validation studies. Seasonal and spatial precipitation are also important to hydrological processes, yet the accuracy of different product, with or without gauge adjustment procedures, is usually unstated at such different scales, resulting in deficiency in hydrological studies.
This study evaluates the TRMM products (TRMM 3B43, 3B42 and 3B42RT) at different scales in the Poyang Lake Basin, which is a part of the global terrestrial transects defined in the Global Change and Terrestrial Ecosystems (GCTE) project of the International Geosphere–Biosphere Programme (IGBP) [34]. The paper is structured as follows. Section 2 details the study area, data, methods and indices in the accuracy assessment. Section 3 presents the accuracy of the TRMM products at different scales. Section 4 and Section 5 summarize the useful and important points found in this article.

2. Materials and Methods
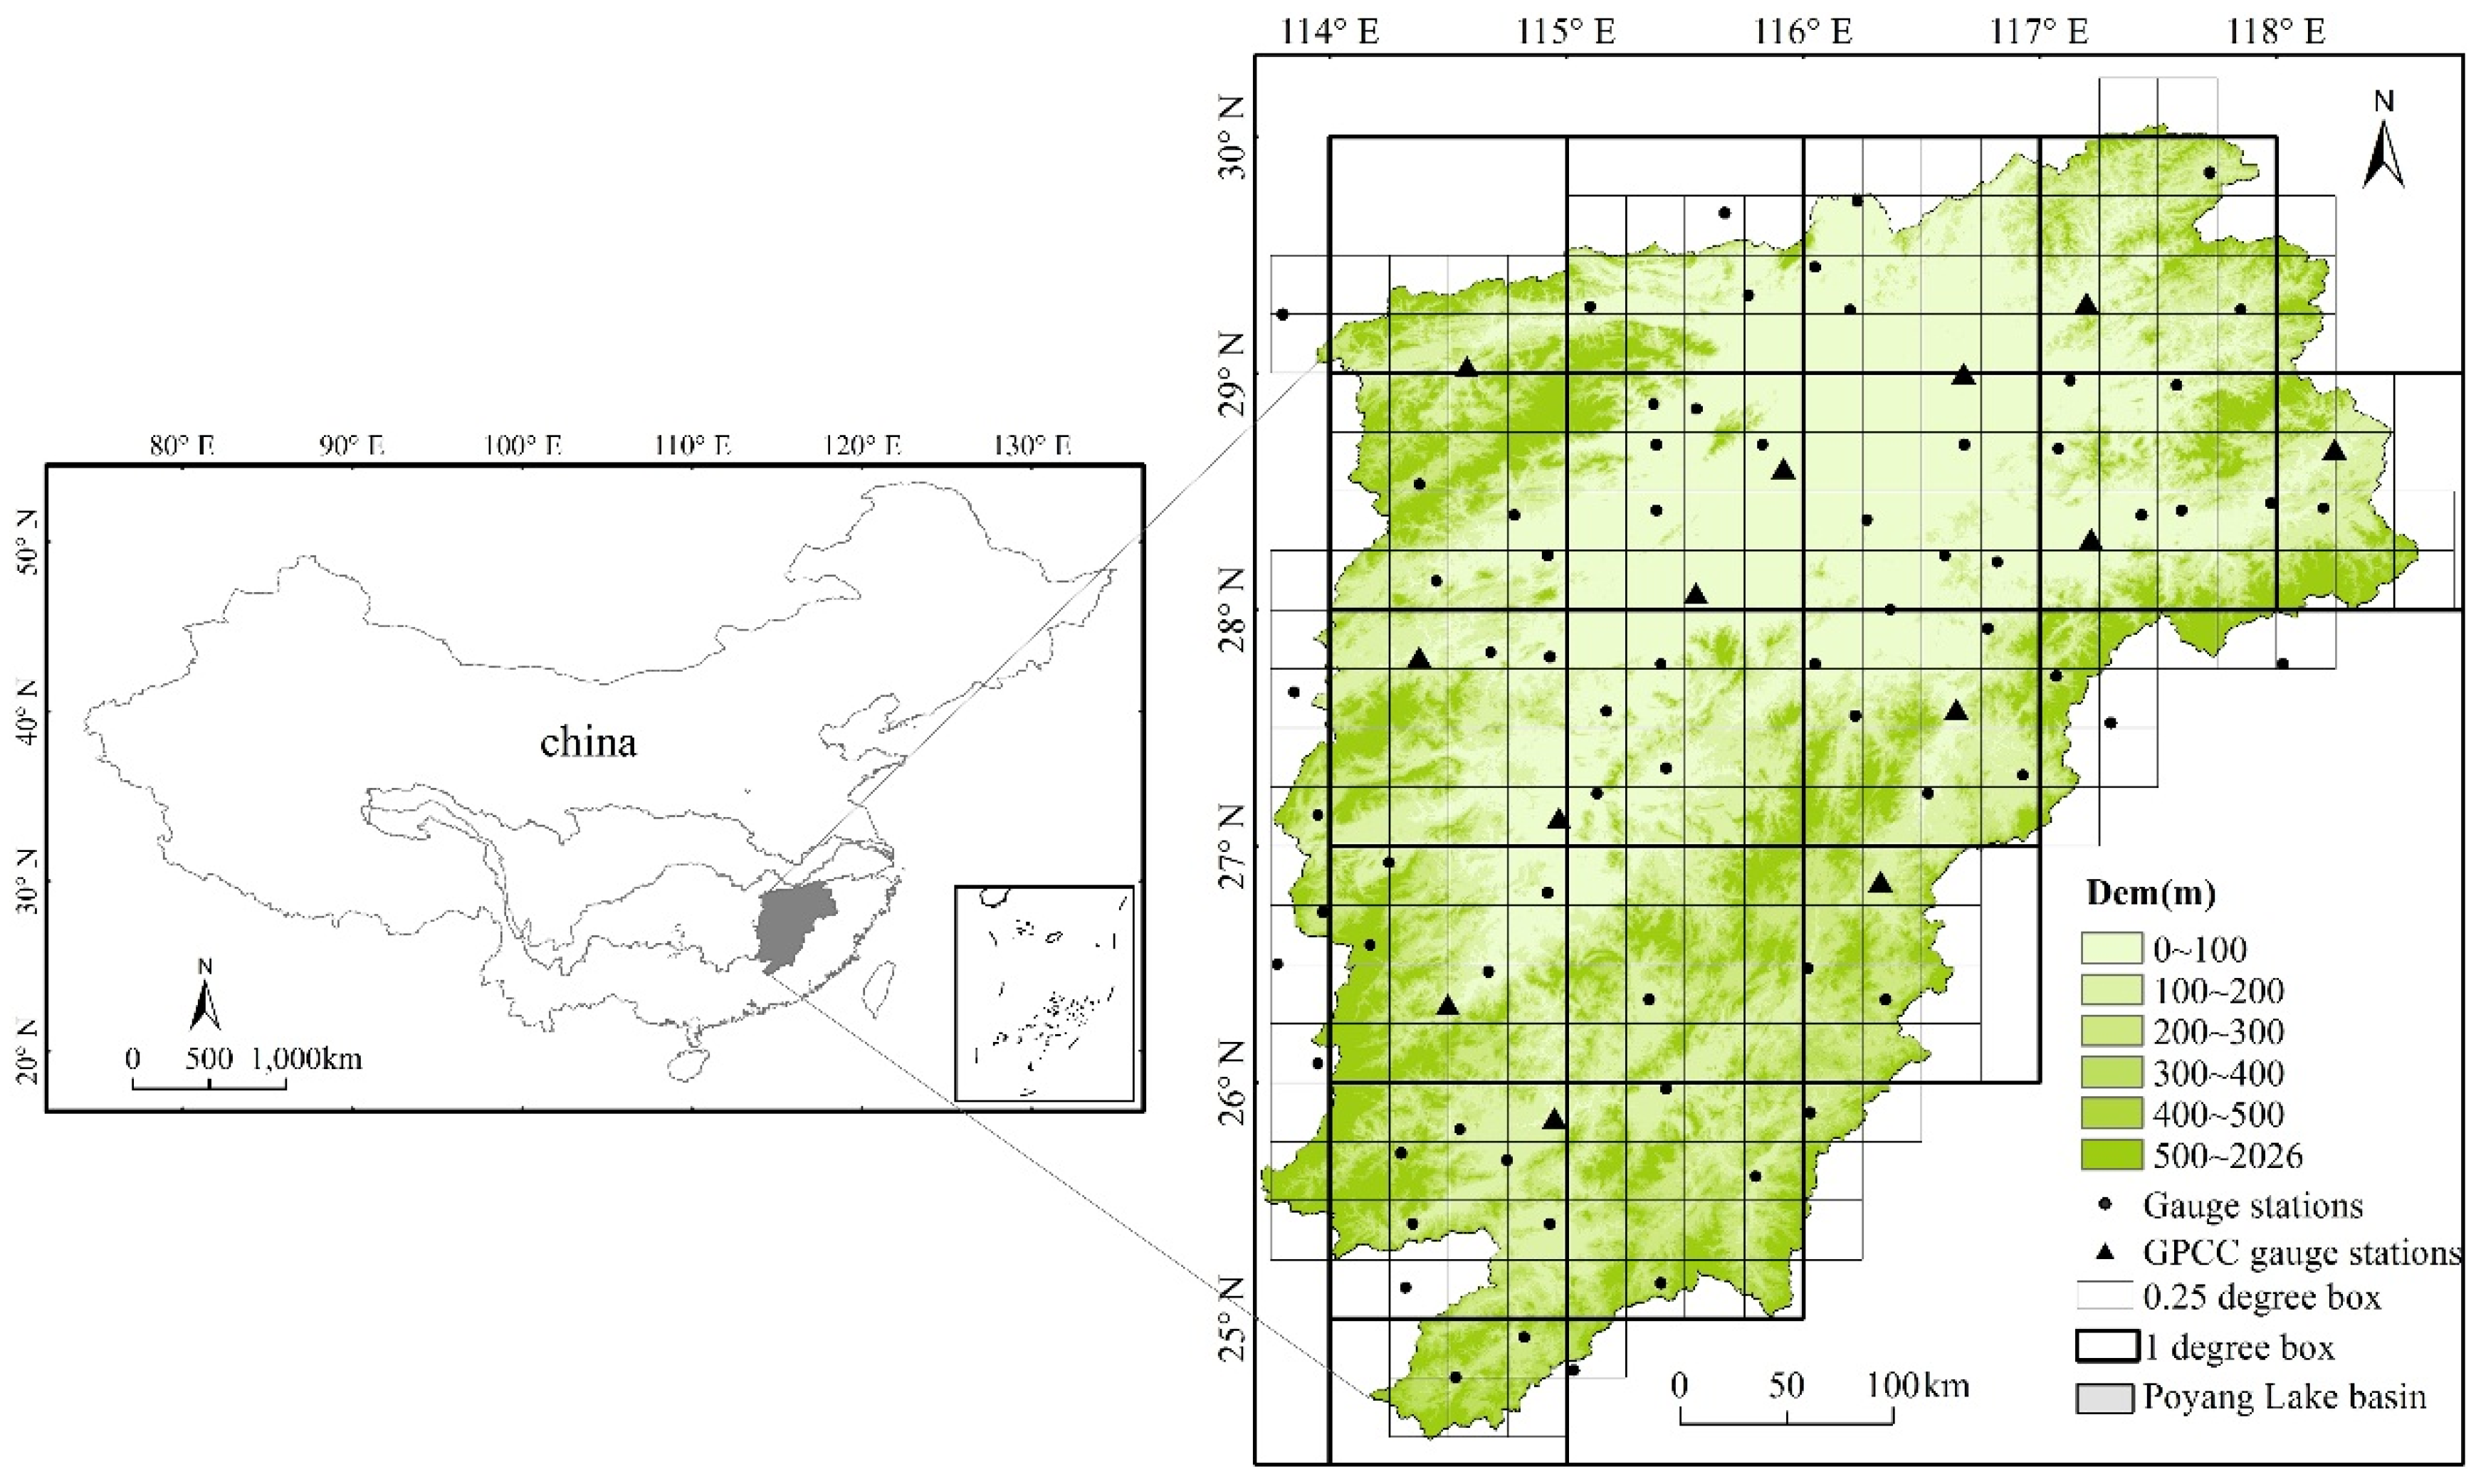
2.1. Study Area

The study area is the Poyang Lake Basin, lying between 24°29’ N to 30°04’ N and 113°34’ E to 118°28’ E. It has an area of 162,225 km2. The basin is a part of the global terrestrial transects defined in the GCTE project of the IGBP [34]. The basin is located in a humid subtropical climate zone with a mean annual precipitation of 1635.9 mm from 1960 to 2010 [33]. Precipitation is mainly distributed from April to July, accounting for 50 percent of the annual precipitation. The Poyang Lake wetland is well known as the first batch of the Ramsar List of Wetlands of International Importance [35]. It has great hydrological, biological, ecological, and economic significance. The surface elevation of the basin ranges from 5 to 2100 m above sea level. Most parts of the basin are dominated by hilly or mountainous topography. The dominant land covers include forest, agricultural fields, grasslands, bare lands, and water surfaces.

2.2. Data Acquisition and Processing

TRMM products (version 7, National Aeronautics and Space Administration, Washington, DC, USA) data were obtained from 1998 to 2007 (3B42RT: 2000–2007) (ftp://disc2.nascom.nasa.gov). They cover the 50° S–50° N belt at a spatial resolution of 0.25° × 0.25° [16]. The temporal resolution is one month for TRMM 3B43 while 3 h for 3B42 and 3B42RT. The datasets were retrieved from the TRMM-calibrated multiple satellite microwave and infrared measurements using the TMPA algorithm [36].
The TMPA algorithm combines IR (Infrared) data from geostationary satellites and Passive Microwave (PMW) retrievals from different sources in four steps: (1) adjusting and combining the different PMW estimates; (2) calibrating IR estimates using the PMW estimates; (3) merging PMW and IR estimates; and (4) rescaling to monthly totals whereby gauge observations are used, indirectly, to adjust the combined satellite product. The 3B42 product is available 2 days after the end of each month. The near-real-time version (3B42RT) is a product of the third step above. Thus, 3B42RT does not use gauge adjustment, and it is available with a lag time of a few hours after the IR and PMW inputs are obtained. The TRMM 3B43 and 3B42 datasets were optimally corrected using global monthly rain gauge data from the Climate Assessment and Monitoring System (CAMS) and GPCC. The data covering the Poyang Lake Basin were extracted from the datasets.
Rain gauge data were obtained from the National Meteorological Information Centre of the China Meteorological Administration (CMA) (http://cdc.cma.gov.cn/home.do). The datasets consist of daily precipitation records from 1998 to 2007 at 82 rain gauge stations containing 13 gauge data sets from GPCC (Figure 1). A strict quality control process has been applied by the CMA to check and validate extreme values [37,38]. The daily data were adjusted to monthly precipitation values. In the case that more than one station was located within the same grid/pixel, the values were averaged to represent the 0.25° × 0.25° or 1° × 1° pixel (Figure 1). The gauge station that is inside the grid box (pixel) is used in the pixel analysis. In the basin analysis, all gauge stations within the basin are averaged to a reference value based on the Thiessen polygon method, and all grid boxes (pixels) were averaged based on satellite values. Thus, TRMM and rain gauge data were not collected at the same scale for basin analysis, which might influence the results [39,40]. Statistical analyses were performed to obtain precipitation statistics, statistical relationships and error distributions.

2.3. Metrics for Accuracy Assessment

Several statistical scores were used for accuracy assessment in terms of consistency and discrepancy [41,42,43,44]. Consistency refers to the proximity or similarity between the true and estimated quantities, while the discrepancy is the difference or the ratio between the true and estimated quantities [3,45]. The former includes the slope coefficient of linear regression and coefficient of determination (R2). The linear regression can be described as follows [46]:
y s = a x g + b
where xg represents rain gauge precipitation and ys denotes the precipitation obtained by the linear regression. The a and b are the linear regression coefficients. If a is close to unity, a high level of consistency is expected between the satellite estimates and gauge measurements.
R2 is another widely used index for effective assessment of consistency. It measures the degree of linear association between the estimates and measurements, which can be expressed as follows:
R = i = 1 n ( G i G ) ( S i S ) i = 1 n ( G i G ) 2 i = 1 n ( S i S ) 2
where Gi denotes rain gauge precipitation, G represents the average of the gauge measurements, Si denotes a satellite estimate, S represents the average of the estimates, and N is the number of data pairs.
The discrepancy between satellite estimates and rain gauge measurements can be quantified by the root mean square error (RMSE), mean absolute error (MAE), mean error (ME), normalized root mean squared error (NRMSE) and normalized mean absolute error (NMAE) as follows [45,46]:
E = S i G i
R E = S i G i G i × 100
M E = 1 n i = 1 n ( S i G i )
B i a s = M E G × 100
M A E = 1 n i = 1 n | S i G i |
R M S E = 1 n i = 1 n ( S i G i ) 2
N R M S E = R M S E G
N M A E = M A E G
Among these scores, E (error) and RE (relative error) measure individual error, and others measure overall error. The E representing the difference between an estimated value and a true value (gauge measurement in this paper), is a measure of how far ‘off’ a measurement is from a true value, while the RE (relative error) expresses how large the error is compared to a true value. The ME represents the average discrepancy between satellite estimates and gauge measurements. The bias is computed as the ME divided by mean precipitation of rain gauge data, and it can be used to evaluate the overall deviation from the reference, reflecting the degree to which the estimate is over-or under-estimated. The MAE is the average of the absolute errors for quantifying the overall error magnitude. The RMSE measures the average difference between satellite estimates and gauge measures. The NRMSE (NMAE) is computed as the RMSE (MAE) divided by the mean precipitation of rain gauge data, and they can be used to evaluate the reliability of the estimates. These scores, R2, ME, bias, RMSE (NRMSE) and MAE (NMAE), were used in comparing satellite products to rain gauge data (Section 3.1 and Section 3.2) and analysing seasonal pattern of TRMM accuracy (Section 3.4), while R2, RMSE (NRMSE) and MAE (NMAE) in spatial characteristics of TRMM products performance (Section 3.5). E and RE were to quantify TRMM accuracy according to rain rate (Section 3.3).

3. Results

3.1. Comparison for Grid Boxes with or without GPCC Reporting Gauges

Figure 2 compares the validation results between satellite products (TRMM 3B43, 3B42 and 3B42RT) and the rain gauge data with or without GPCC reporting gauges. For the reference data with GPCC reporting gauges, TRMM 3B43, 3B42 and 3B42RT had R2 values of 0.87, 0.86, and 0.71, respectively, with the rain gauge (Figure 2a,c,e). The linear regression coefficients (a = 0.91, 0.91, 1.04) demonstrated good agreement between the two datasets. Meanwhile, the ME (bias) values were 7.73 mm·month−1 (5.51%), 6.00 mm·month−1 (4.29%) and 9.15 mm·month−1 (6.83%), respectively, indicating that TRMM slightly overestimated precipitation. The respective discrepancies were 42.83 mm·month−1 (30.56%), 43.64 mm·month−1 (31.23%) and 68.55 mm·month−1 (51.16%) for RMSE (NRMSE) and 28.45 mm·month−1 (20.30%), 29.60 mm·month−1 (21.18%), and 47.84 mm·month−1 (35.70%) for MAE (NMAE).
For reference data without GPCC reporting gauges, TRMM 3B43, 3B42 and 3B42RT had equally close relationships with the rain gauge data (R2 = 0.86, 0.85 and 0.71) (Figure 2b,d,f), and the linear regression coefficient (a = 0.90, 0.91 and 1.04) also showed equally close correlations between the two datasets. In addition, the respective discrepancies were 44.05 mm·month−1 (31.43%), 44.85 mm·month−1 (32.06%) and 84.12 mm·month−1 (62.59%) for RMSE (NRMSE) and 29.20 mm·month−1 (20.83%), 30.35 mm·month−1 (21.69%) and 47.70 mm·month−1 (35.49%) for MAE (NMAE), all of which were slightly greater than those of reference data with GPCC reporting gauges, indicating that TRMM products had a closer relationship with reference data with GPCC reporting gauges than those without GPCC reporting gauges. The results indicated the TRMM products performed slightly better in reference to the data with GPCC reporting gauges than that without the reporting gauges. The reference data are used hereafter without GPCC reporting gauges.

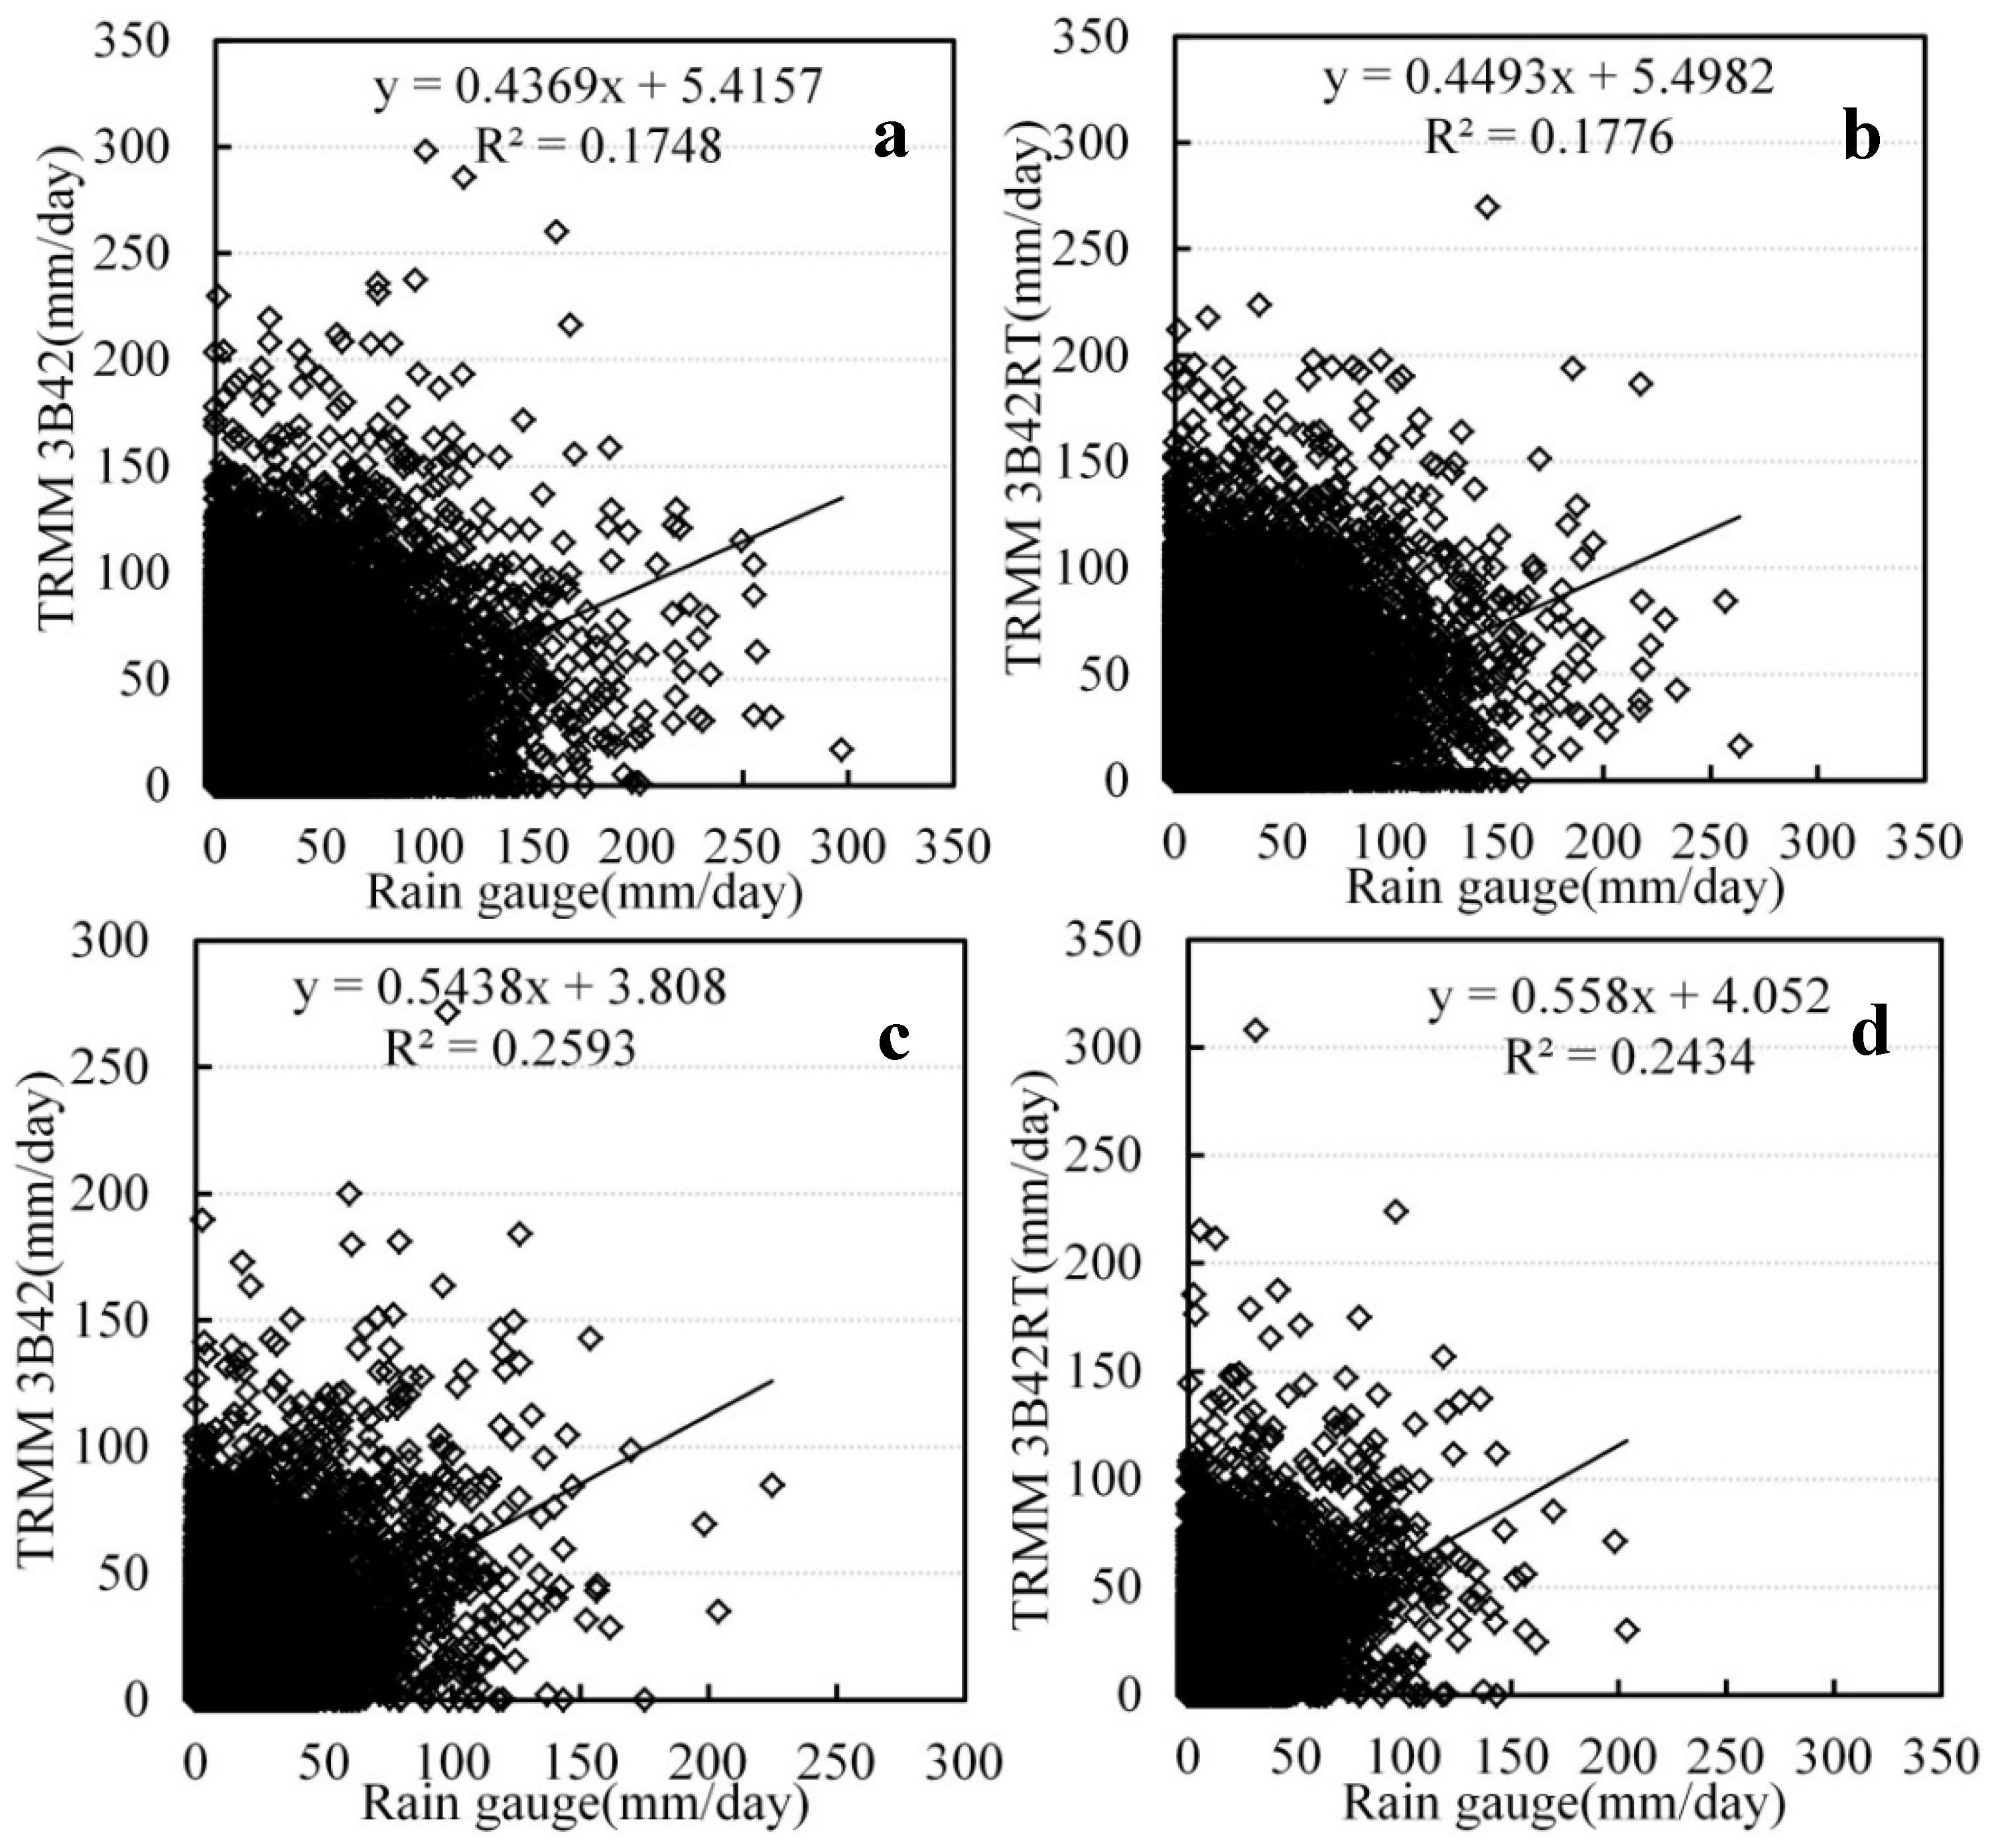
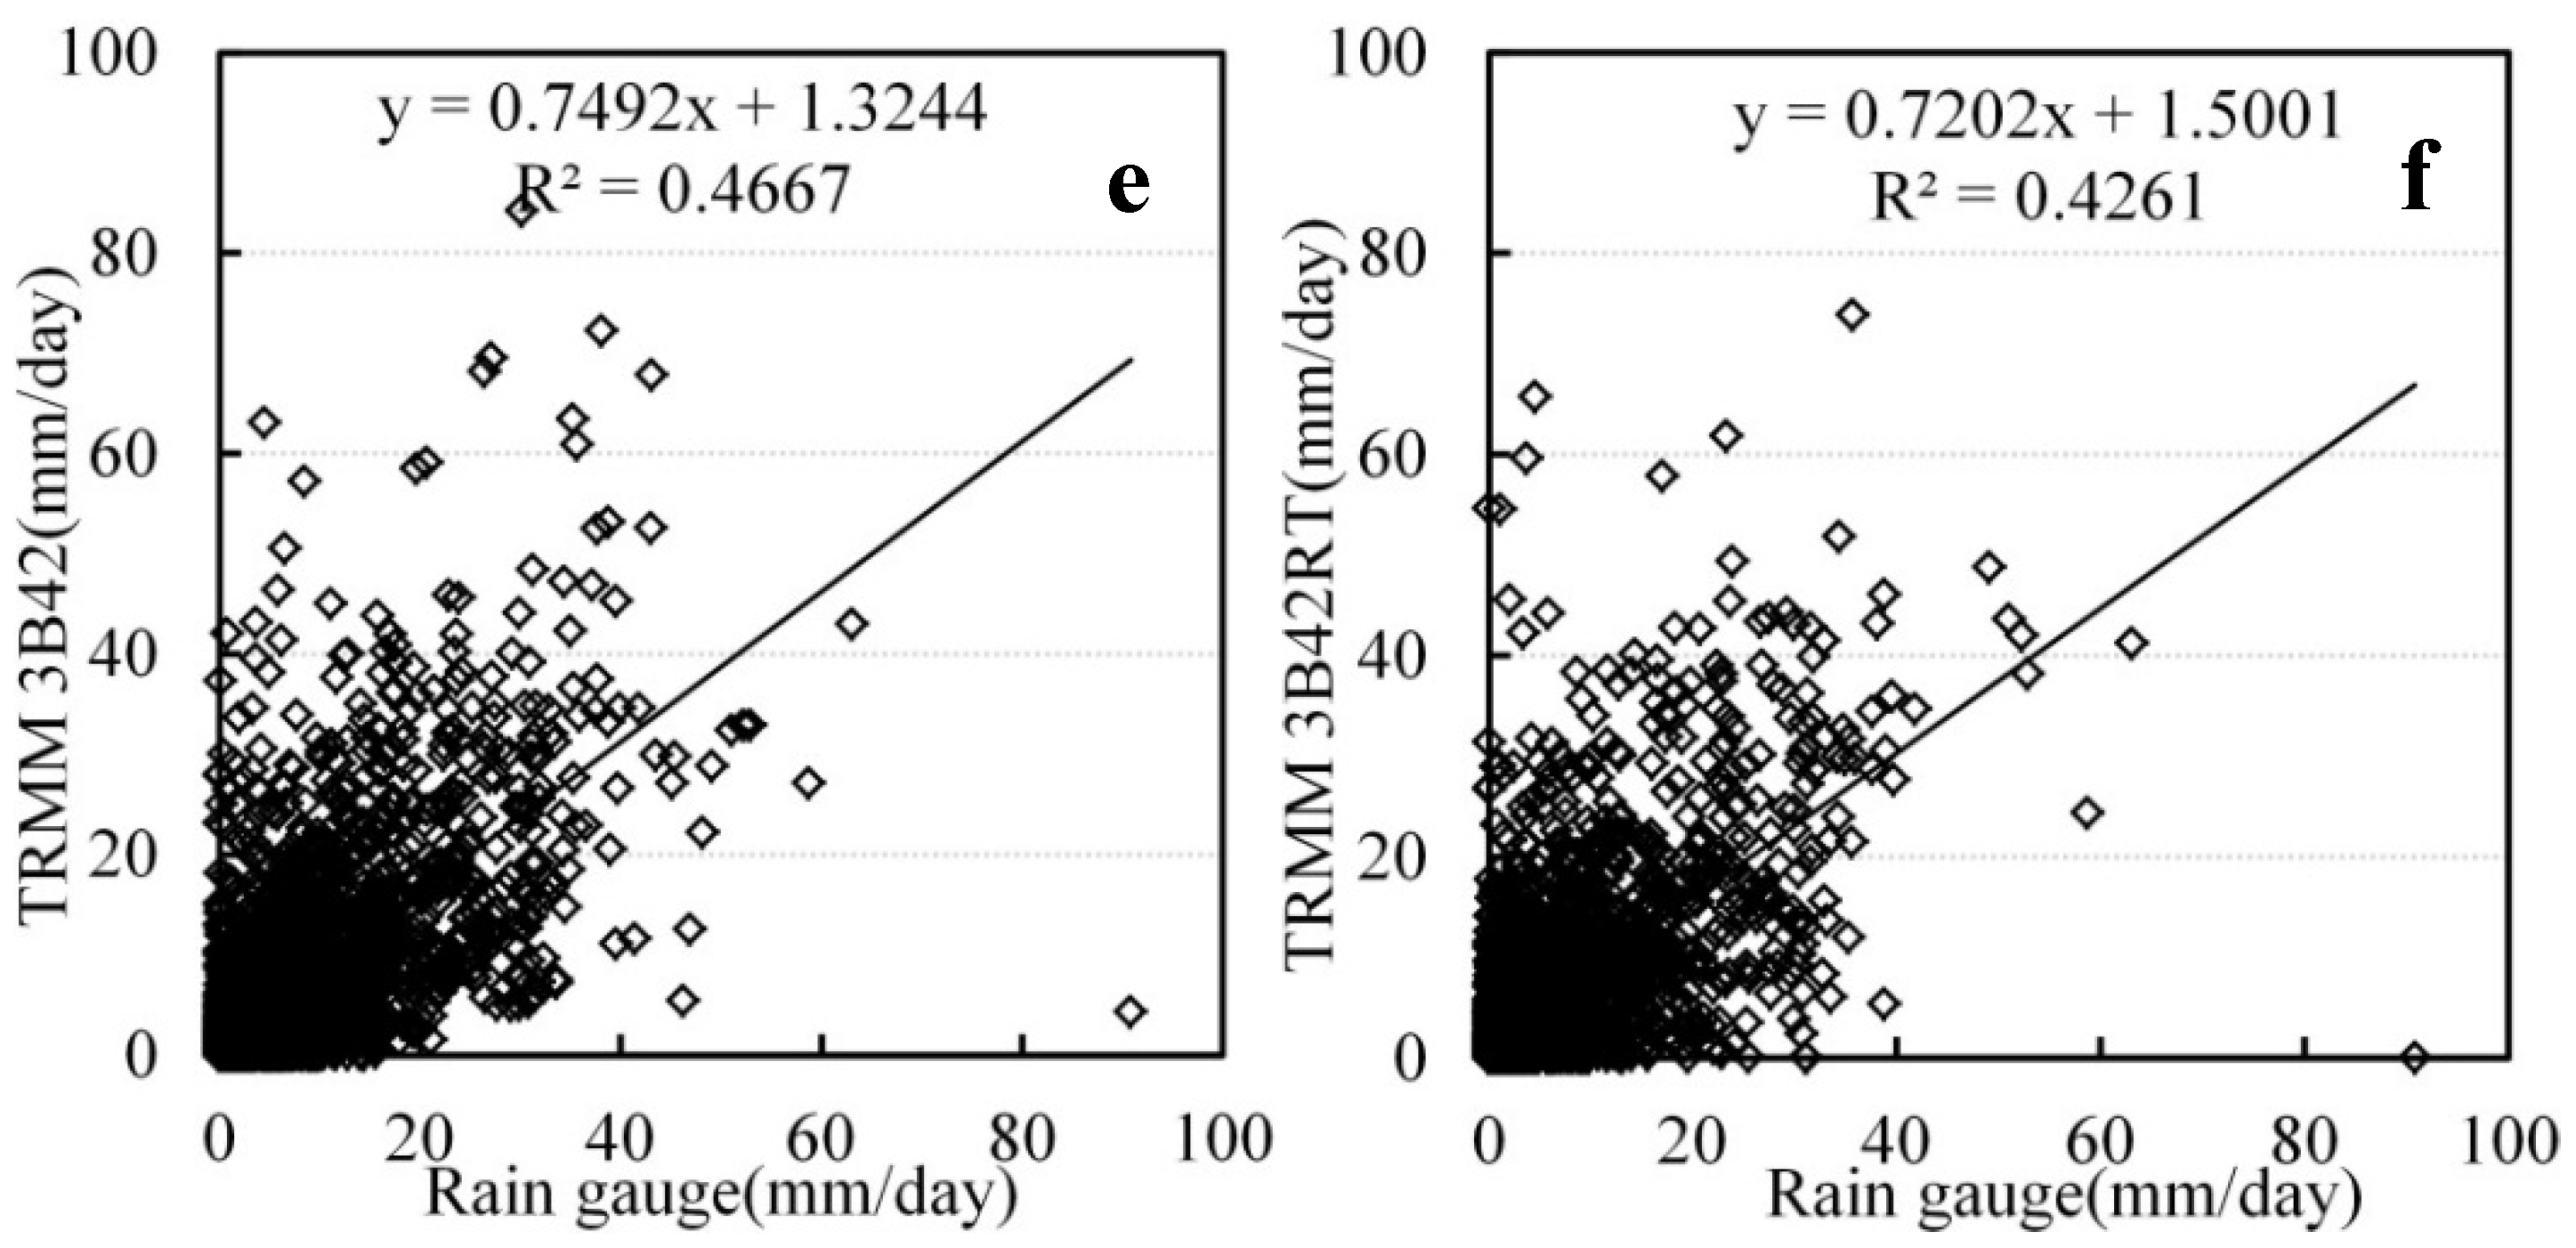
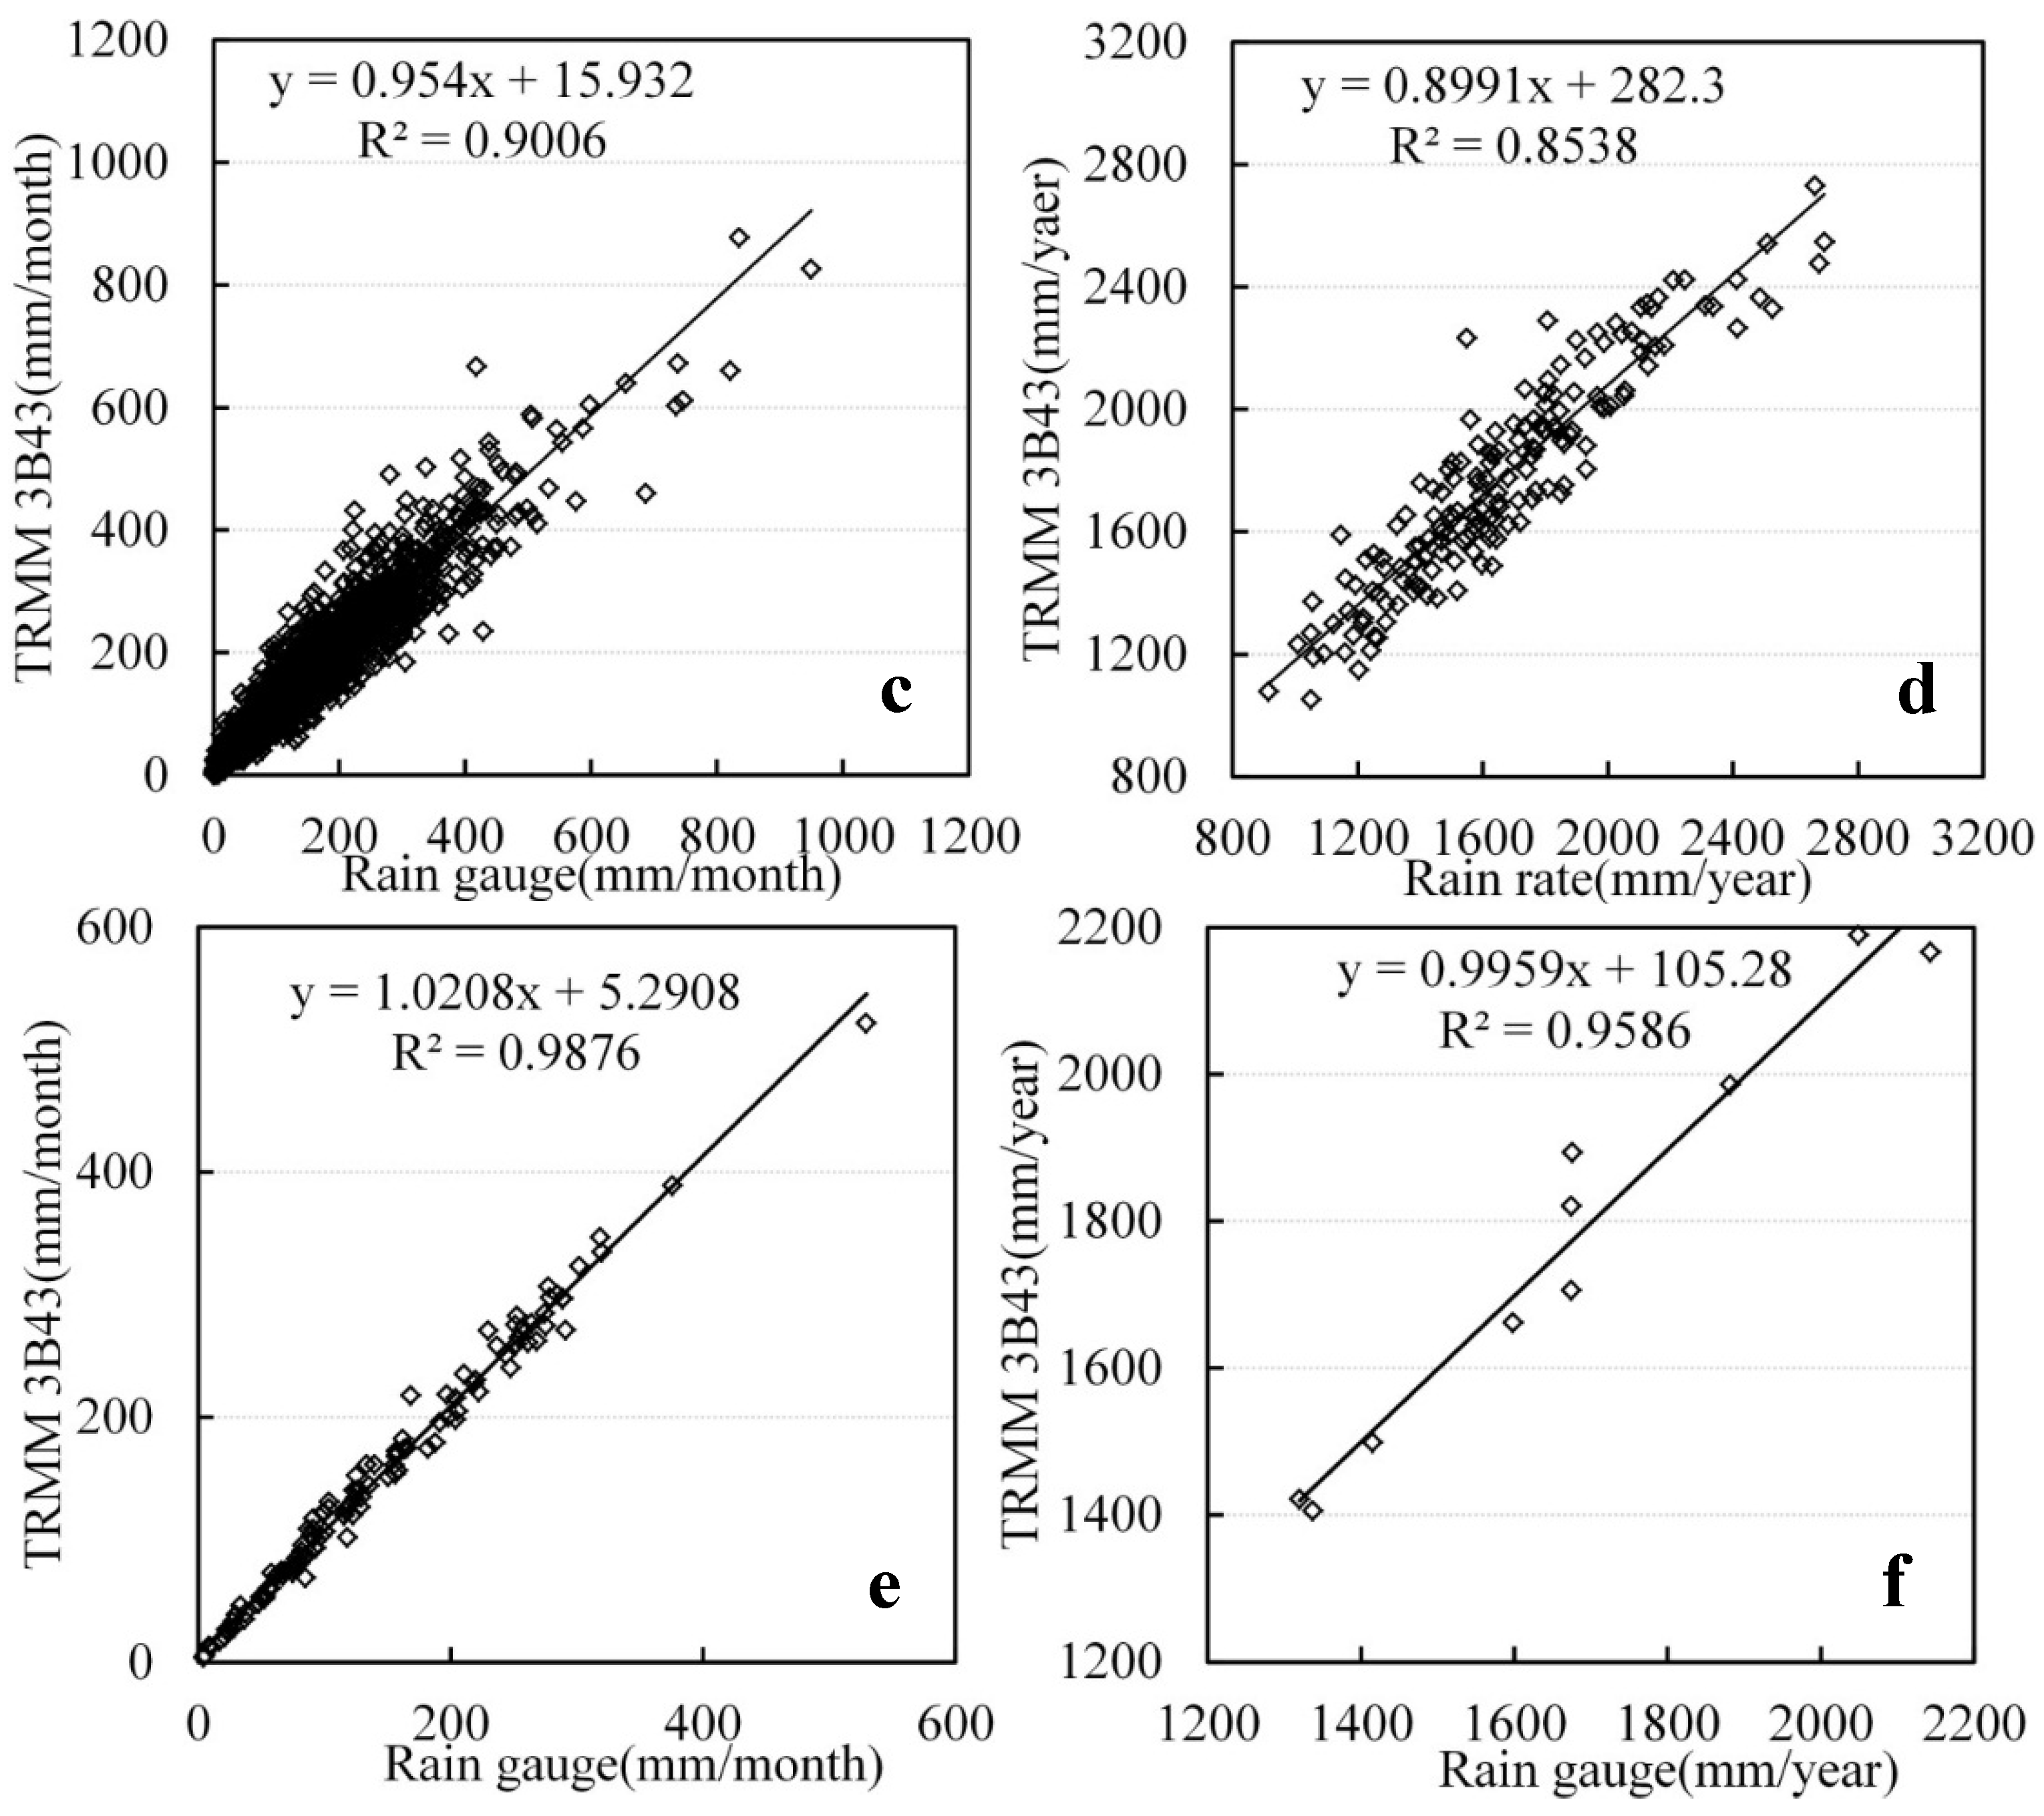
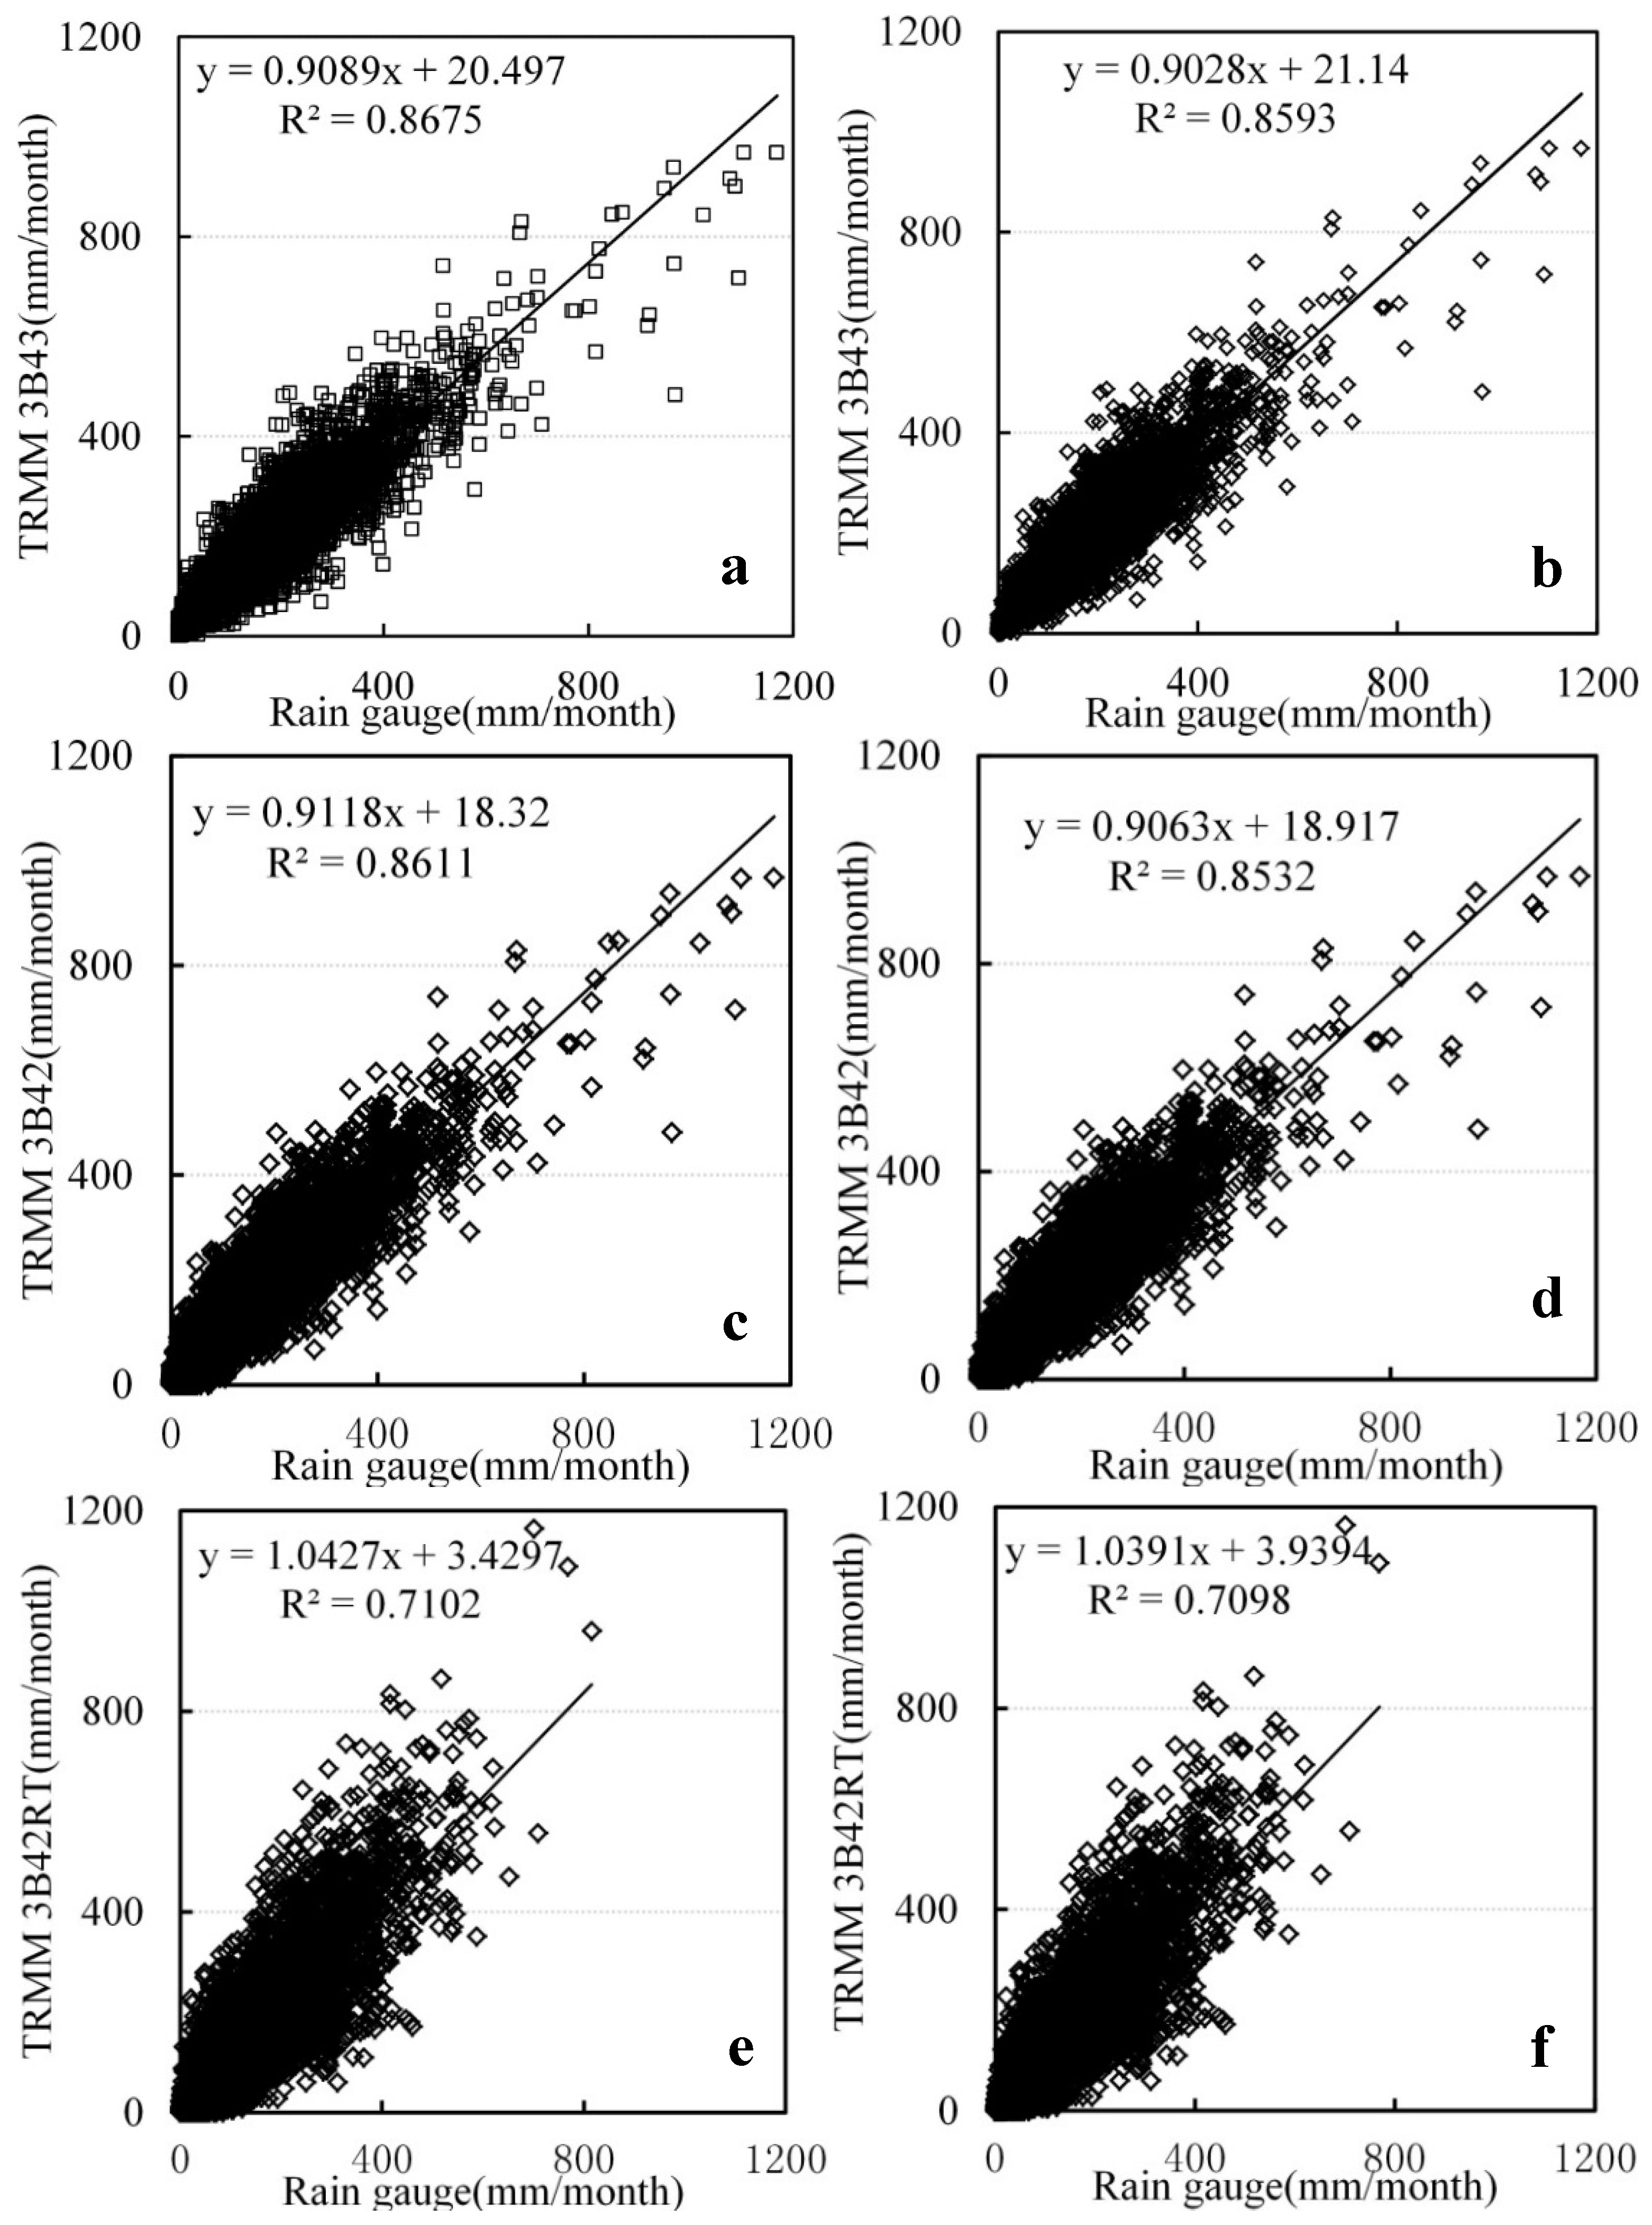
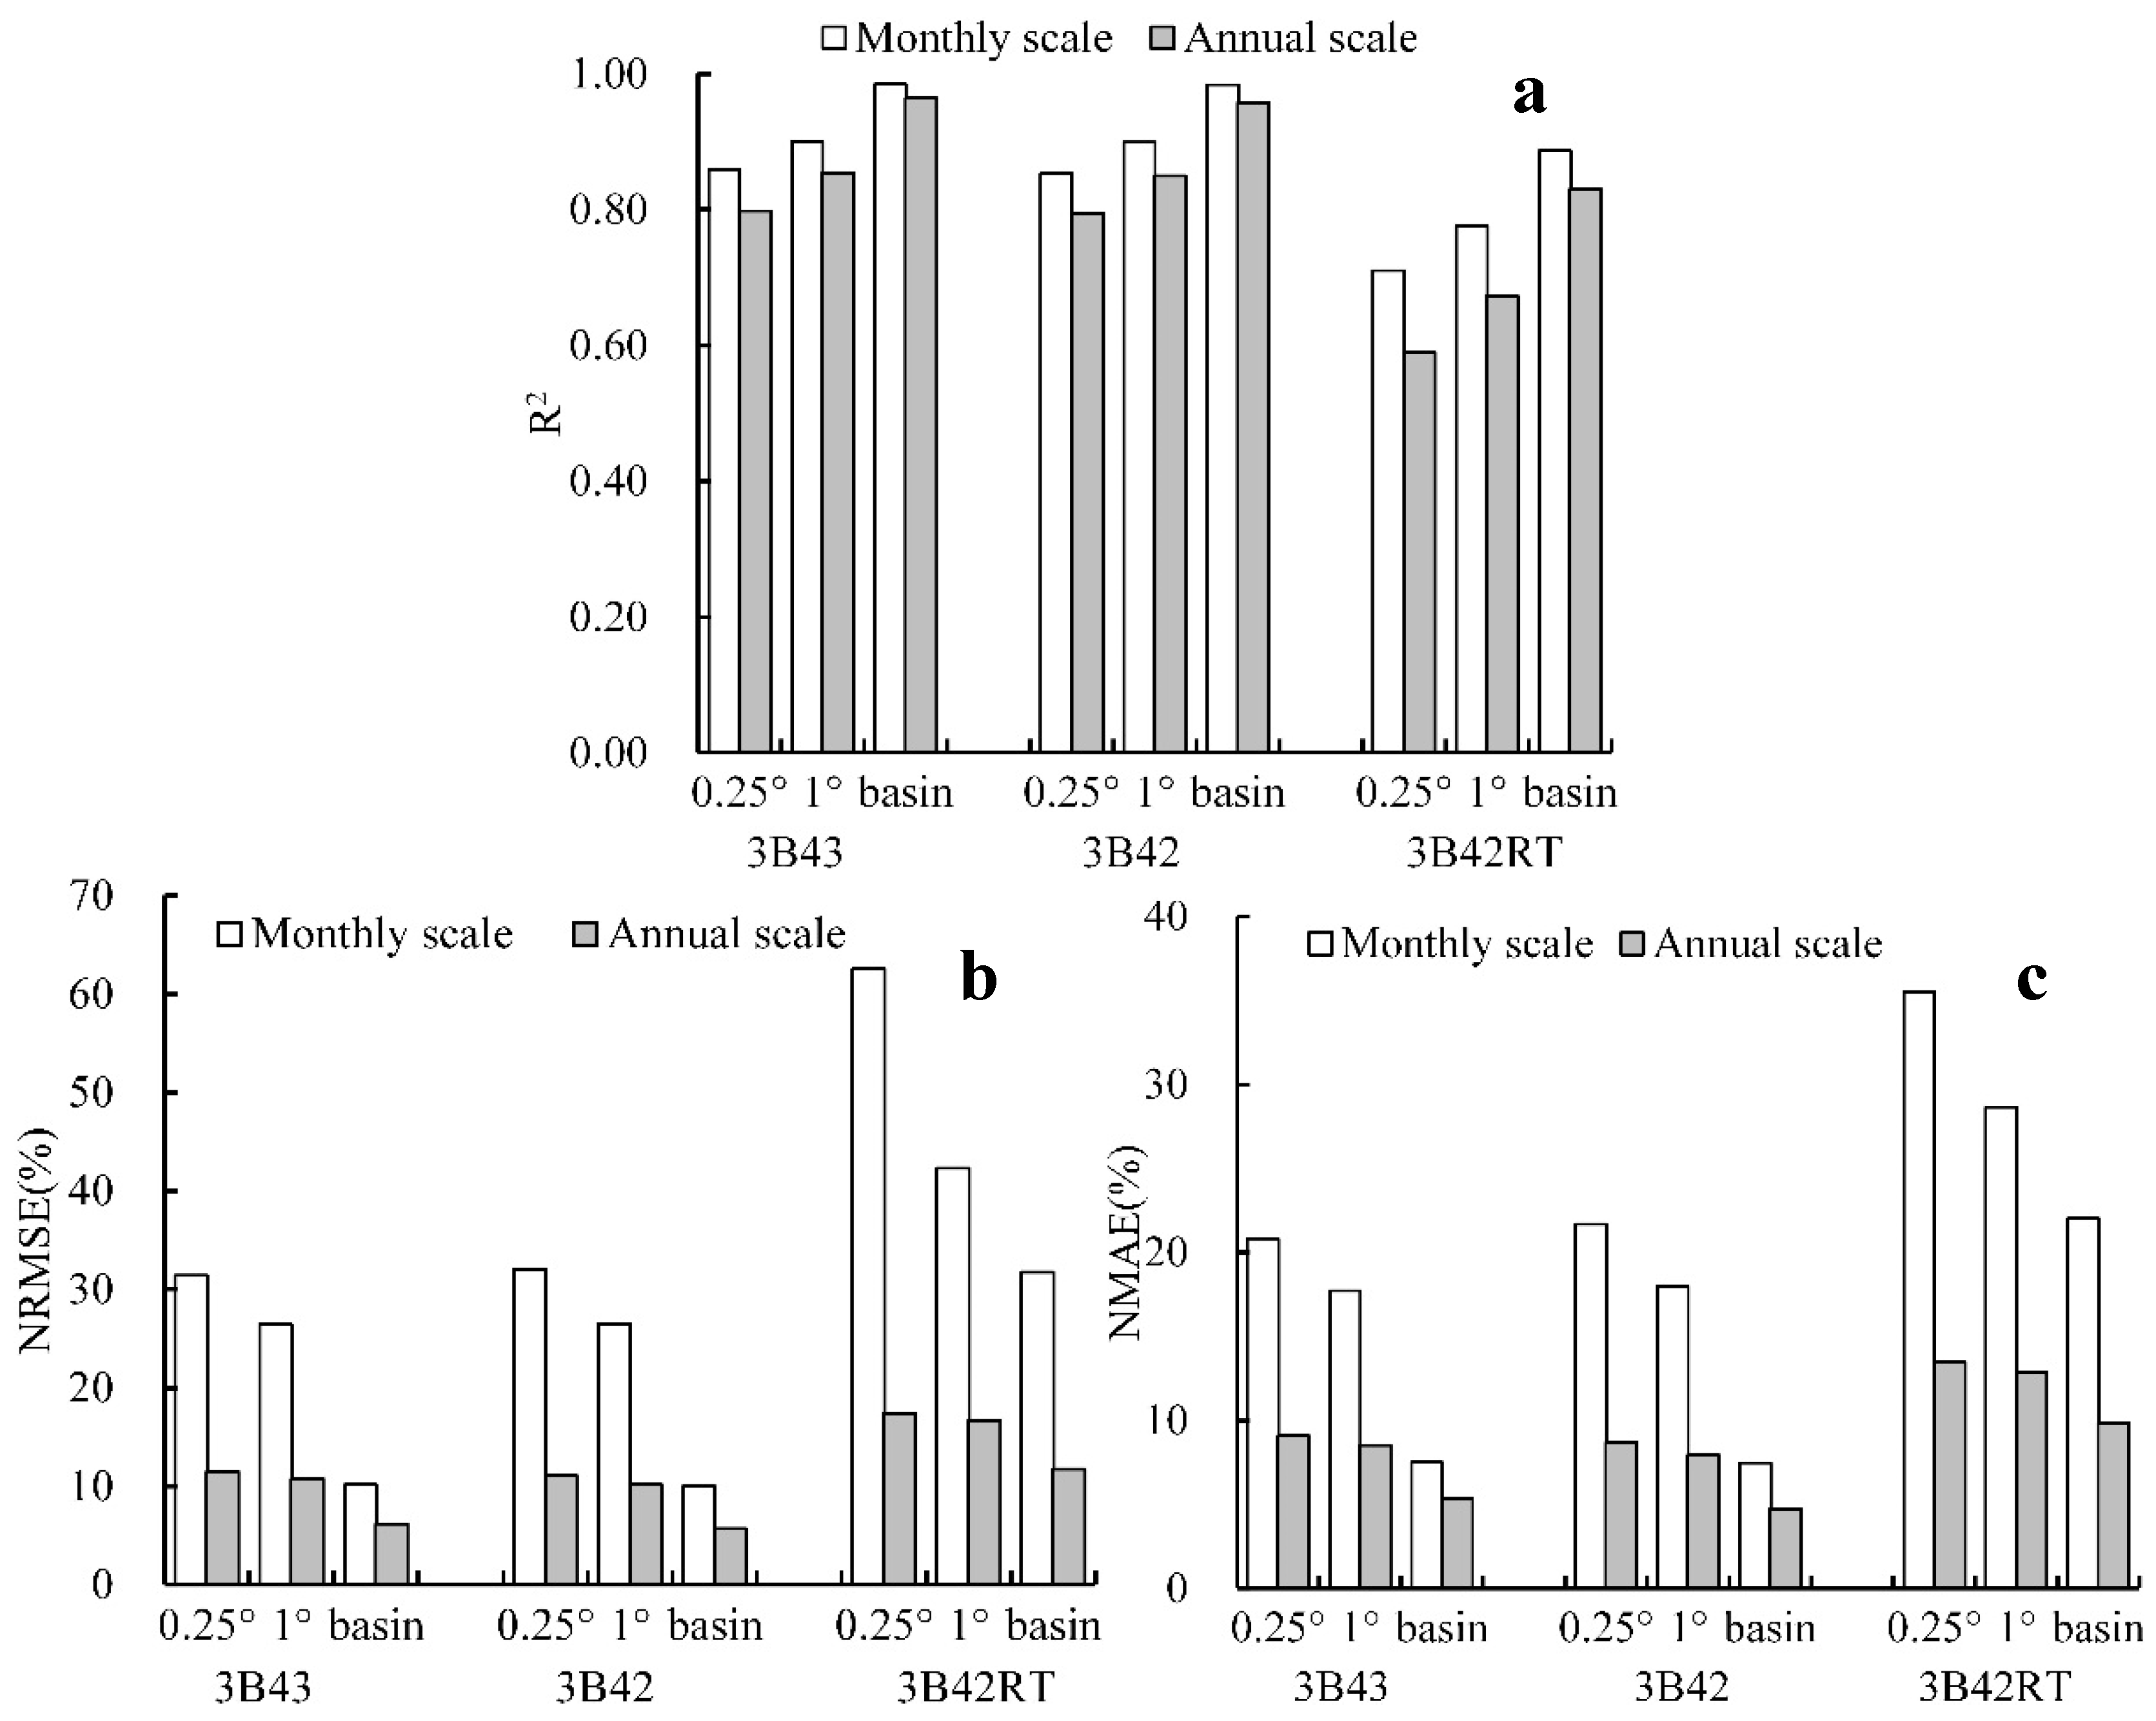
3.2. Inter-Comparison between Satellite Produncts and Rain Gauge Data

Figure 3a,c,e shows the relationships between TRMM 3B42 and the rain gauge data at the daily scale. At the 0.25° × 0.25° pixel scale (Figure 3a), TRMM 3B42 had an R2 of 0.1748 with the rain gauge. The linear regression coefficient (a = 0.44) demonstrated a very low agreement between the two datasets. Meanwhile, the ME (bias) value was 0.32 mm·day−1 (3.55%). The discrepancy was 18.10 mm·day−1 (200.04%) for RMSE (NRMSE) and 10.03 mm·day−1 (110.84%) for MAE (NMAE). At the 1° × 1° pixel scale, the TRMM data had an R2 of 0.2593 with the rain gauge data (Figure 3c). In addition, the discrepancy was 14.27 mm·day−1 (189.60%) for RMSE (NRMSE) and 7.59 mm·day−1 (100.88%) for MAE (NMAE). At the basin scale, R2 was 0.4667 (Figure 3e). Meanwhile, the discrepancy was 6.63 mm·day−1 (143.41%) for RMSE (NRMSE) and 3.31 mm·day−1 (71.63%) for MAE (NMAE), both of which were smaller than those at the 1° × 1° pixel scale. The results suggest that the accuracy is highest at the basin scale, with the 1° × 1° pixel scale second and the 0.25° × 0.25° pixel scale third at the monthly scale. The accuracy of 3B42RT is similar to that of TRMM 3B42 at the daily scale (Figure 3b,d,f).
Figure 4a,c,e shows the relationships between TRMM 3B43 and the rain gauge data at the monthly scale. At the 0.25° × 0.25° pixel scale, the TRMM data had an R2 of 0.8593 with the rain gauge (Figure 4a). The linear regression coefficient (a = 0.90) demonstrated a good agreement between the two datasets. Meanwhile, the ME (bias) value was 7.52 mm·month−1 (5.36%), indicating TRMM slightly overestimated precipitation. The discrepancy was 44.05 mm·month−1 (31.43%) for RMSE (NRMSE) and 29.20 mm·month−1 (20.83%) for MAE (NMAE). At the 1° × 1° pixel scale, the TRMM data had a closer relationship with the rain gauge data (R2 = 0.90) (Figure 4c). In addition, the discrepancy was 36.53 mm·month−1 (26.43%) for RMSE (NRMSE) and 24.47 mm·month−1 (17.71%) for MAE (NMAE), which were both smaller than those at the 0.25° × 0.25° pixel scale. At the basin scale, R2 was 0.99 (Figure 4e). Meanwhile, the discrepancy was 13.66 mm·month−1 (9.78%) for RMSE (NRMSE) and 10.02 mm·month−1 (7.17%) for MAE (NMAE), both of which were much smaller than those at the 1° × 1° pixel scale. These results suggest that the accuracy is highest at the basin scale, with the 1° × 1° pixel scale second and the 0.25° × 0.25° pixel scale third at the monthly scale. Table 1 gives validation statistics at the annual scale. It demonstrates the highest performance at basin scale, followed by that at 1° × 1° and 0.25° × 0.25° pixel scales, which is similar to those at the monthly scale.
Figure 5 compares the validation indices for TRMM 3B43, 3B42 and 3B42RT at the 0.25° pixel scale, 1° pixel scale and basin scale. For R2 (Figure 5a), TRMM 3B43 topped the group, with 3B42 second and 3B42RT third. Meanwhile, R2 generally increased with increasing spatial scale, which was similar for both monthly and annual data. For NRMSE (Figure 5b), TRMM 3B42RT topped the group, with 3B42 second and 3B43 third. In addition, NRMSE generally decreased with increasing spatial scale at both the monthly and annual scales. For NMAE (Figure 5c), the result was same as that of NRMSE.
In summary, the TRMM products (TRMM 3B43, 3B42 and 3B42RT) performed well with slight overestimation at the monthly and annual scales. The accuracy is highest for TRMM 3B43, with 3B42 second and 3B42RT third. The accuracy is relatively low and similar for TRMM 3B42 and 3B42RT at the daily scale. Meanwhile, the results suggest that performance generally increased with increasing spatial scale.

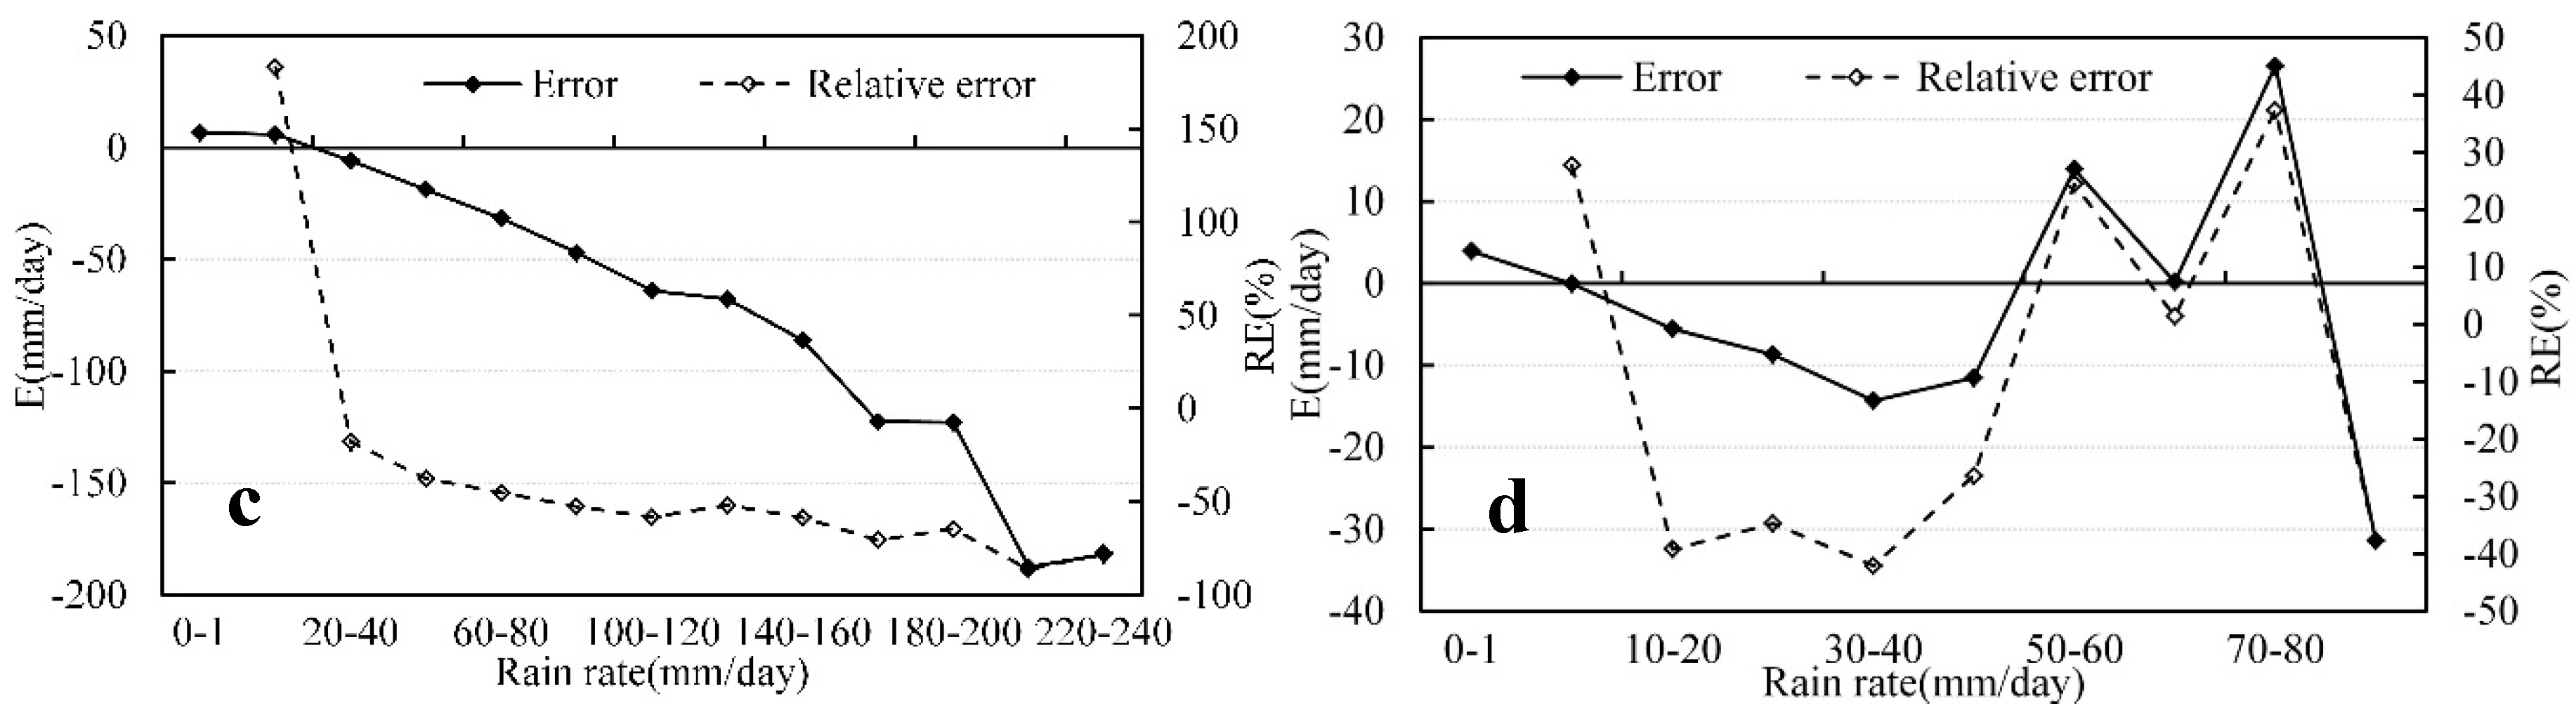
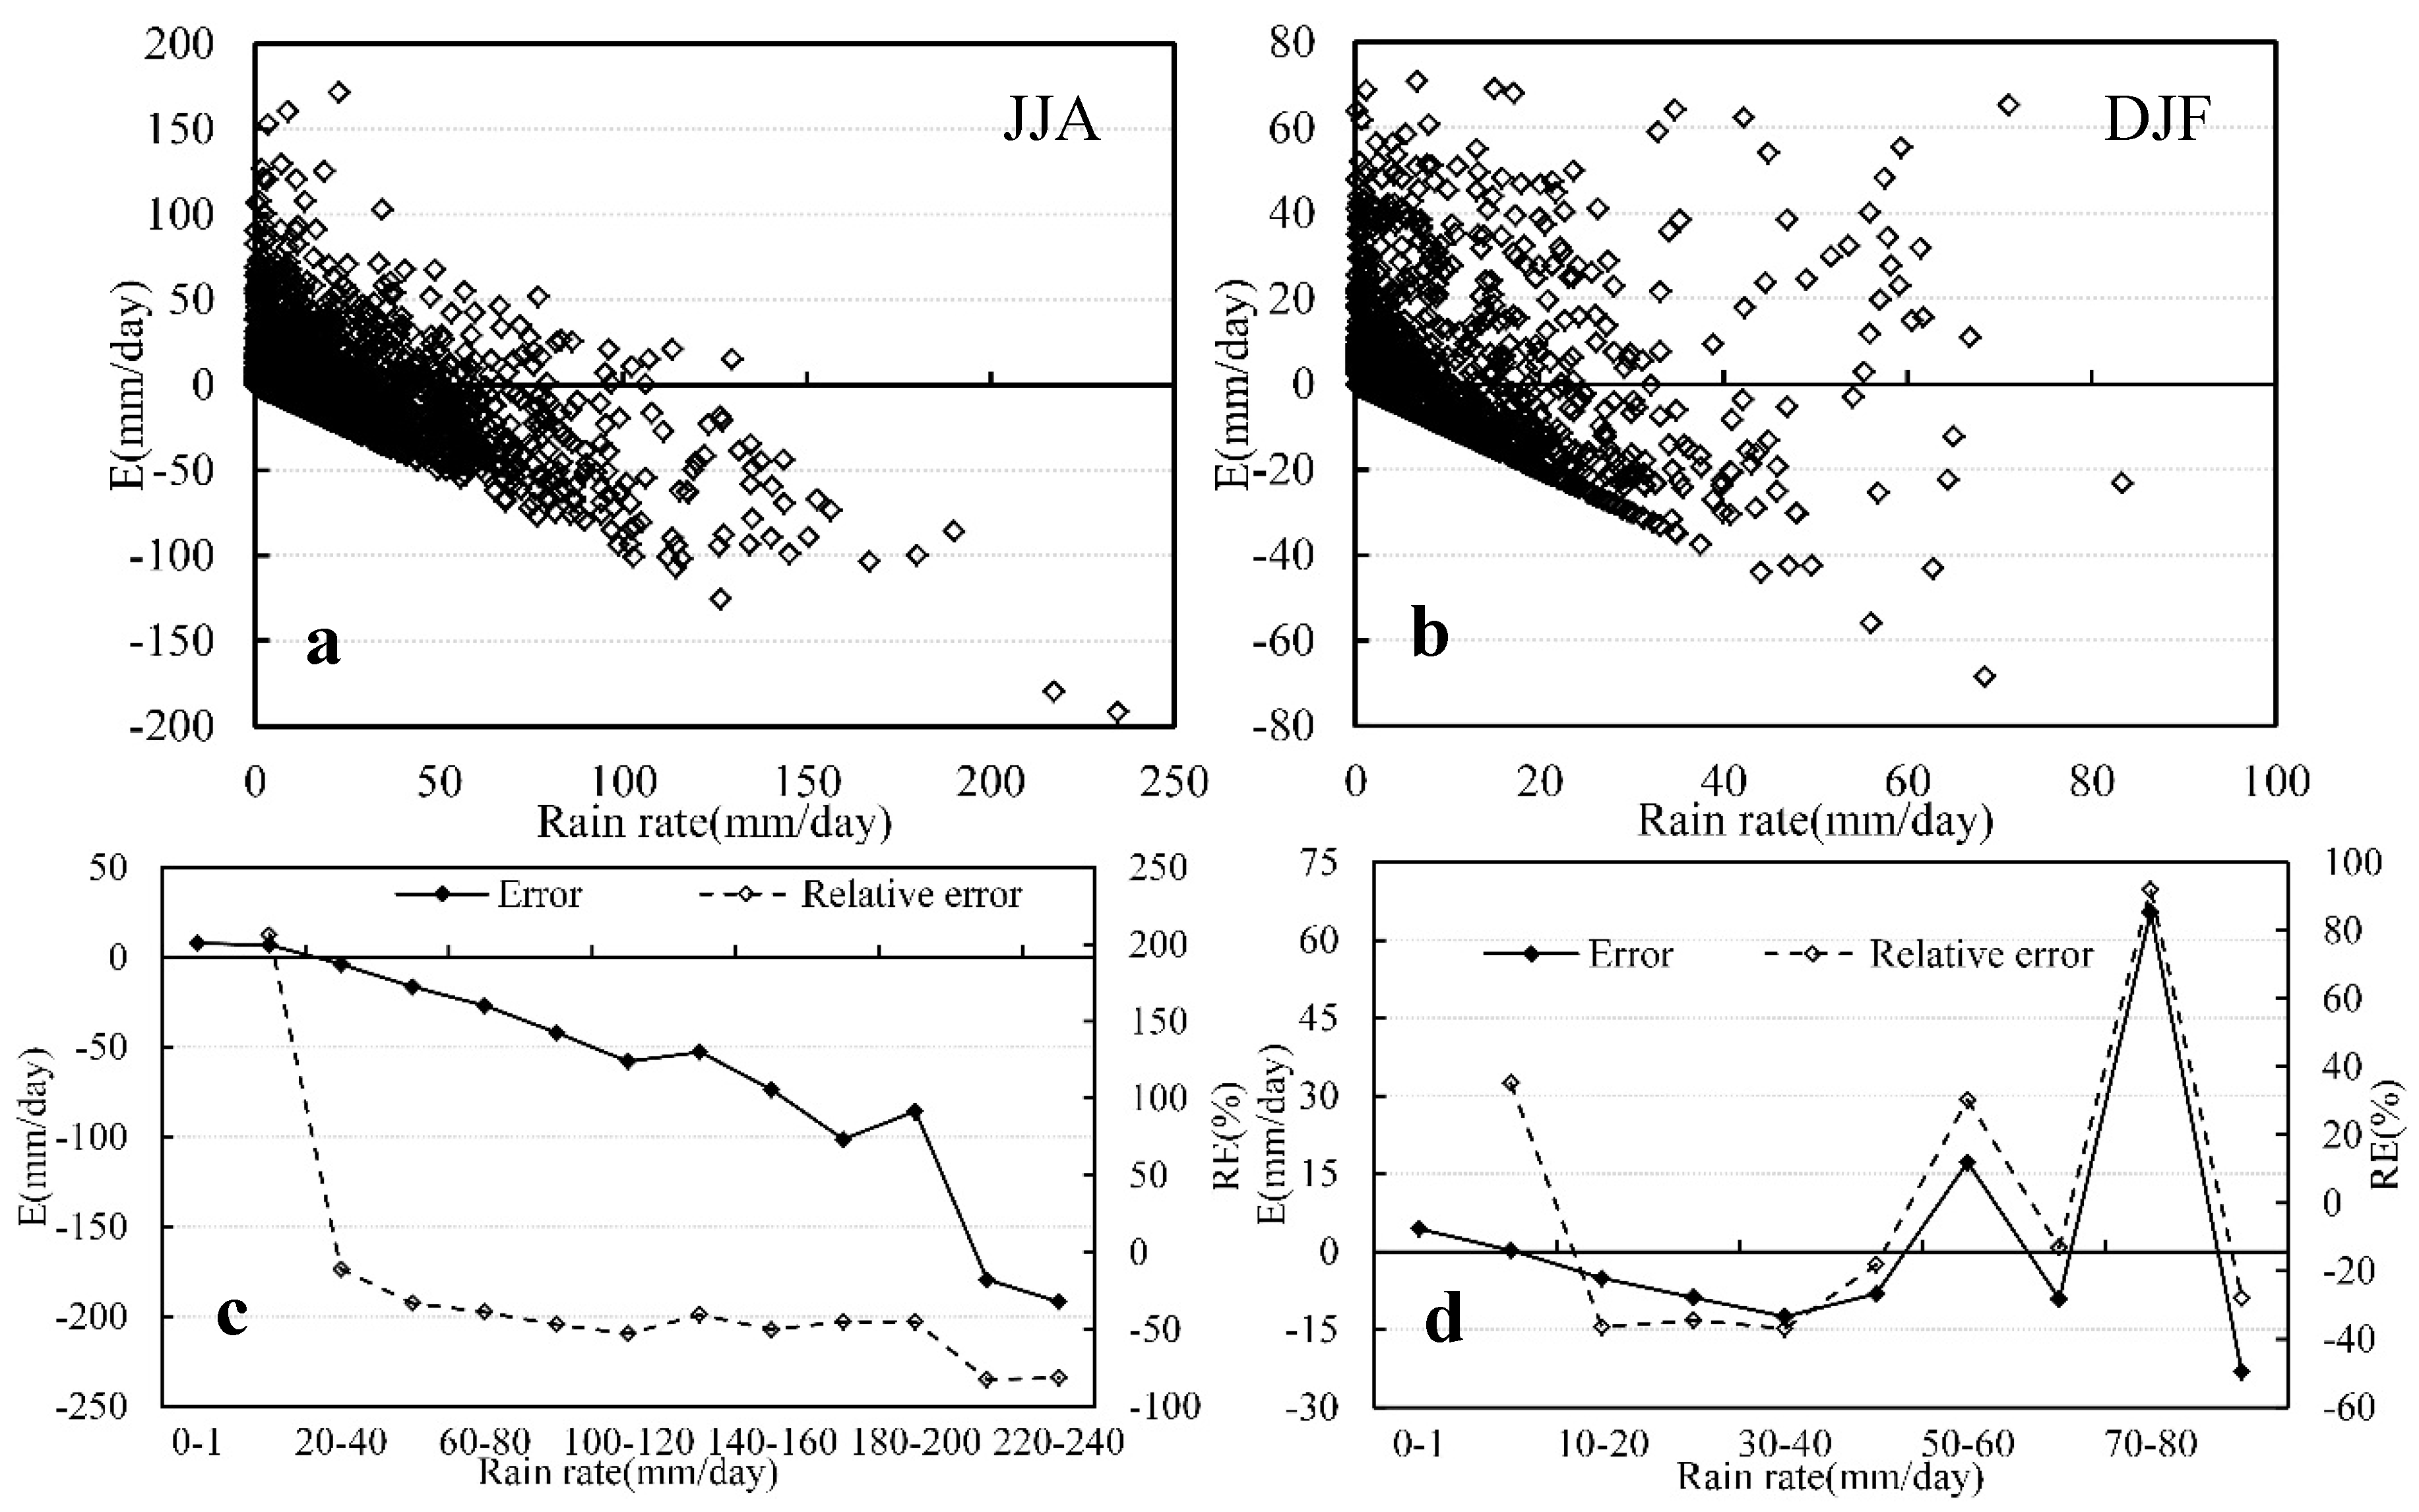
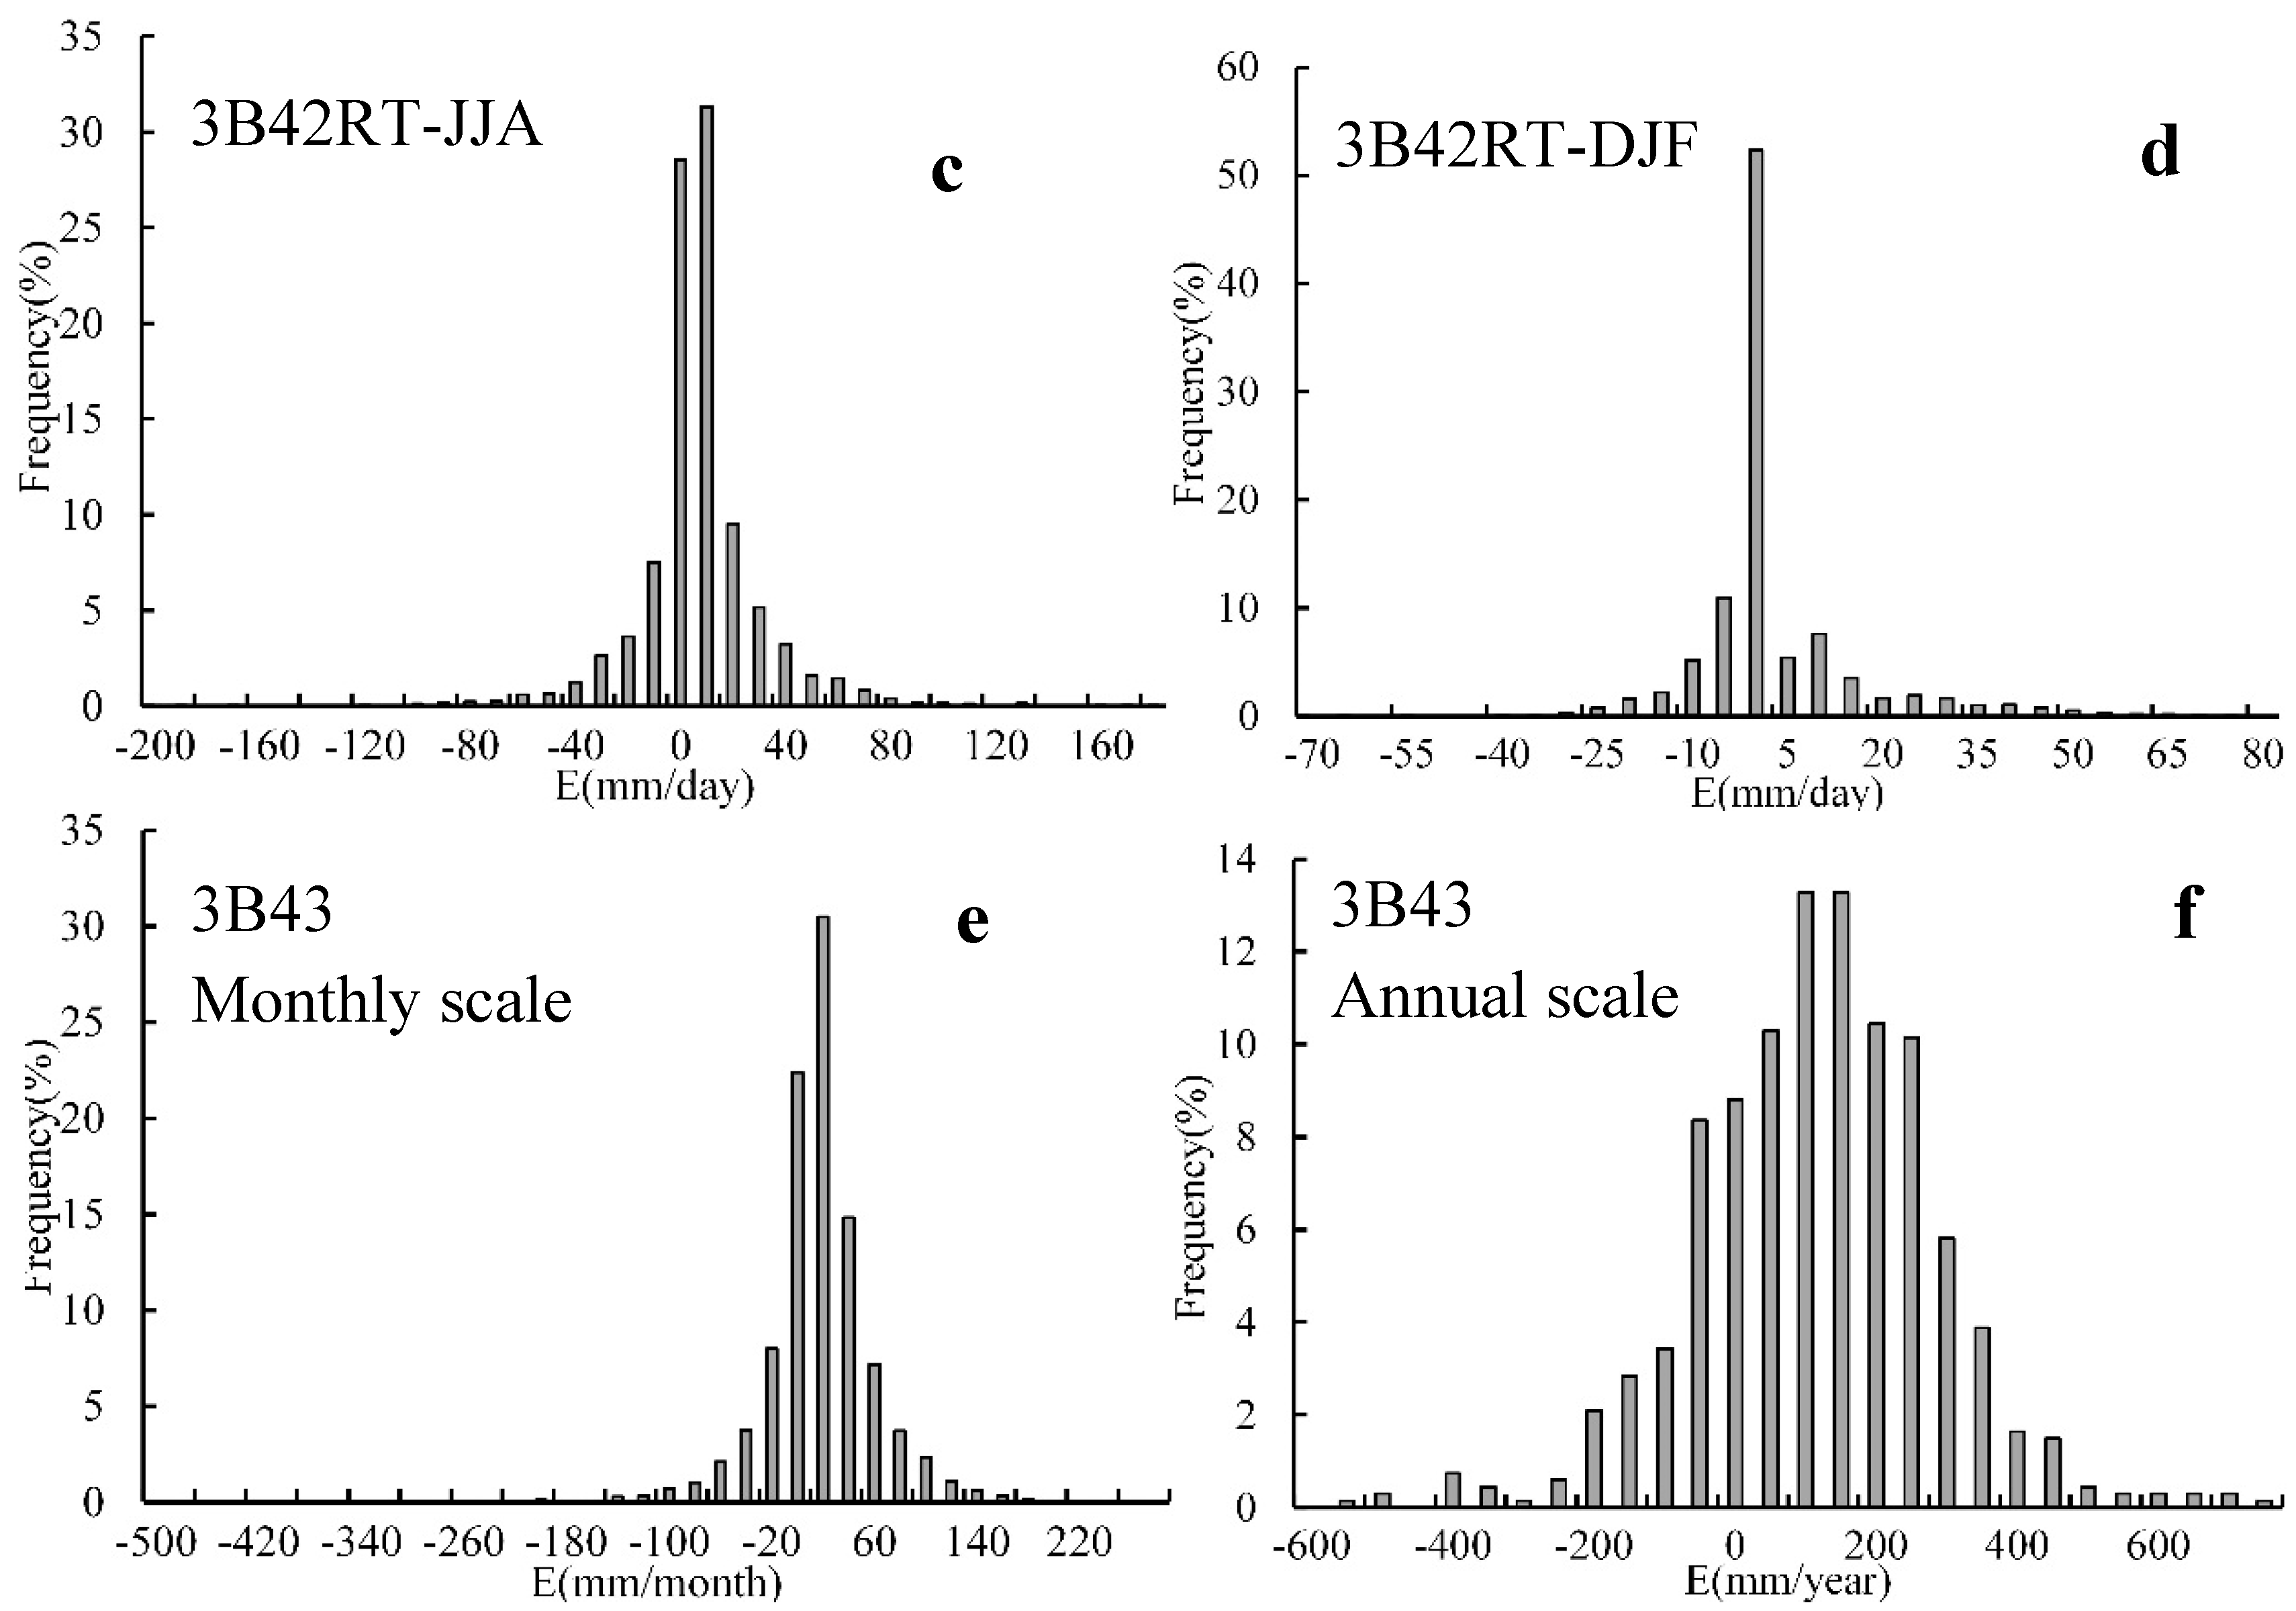
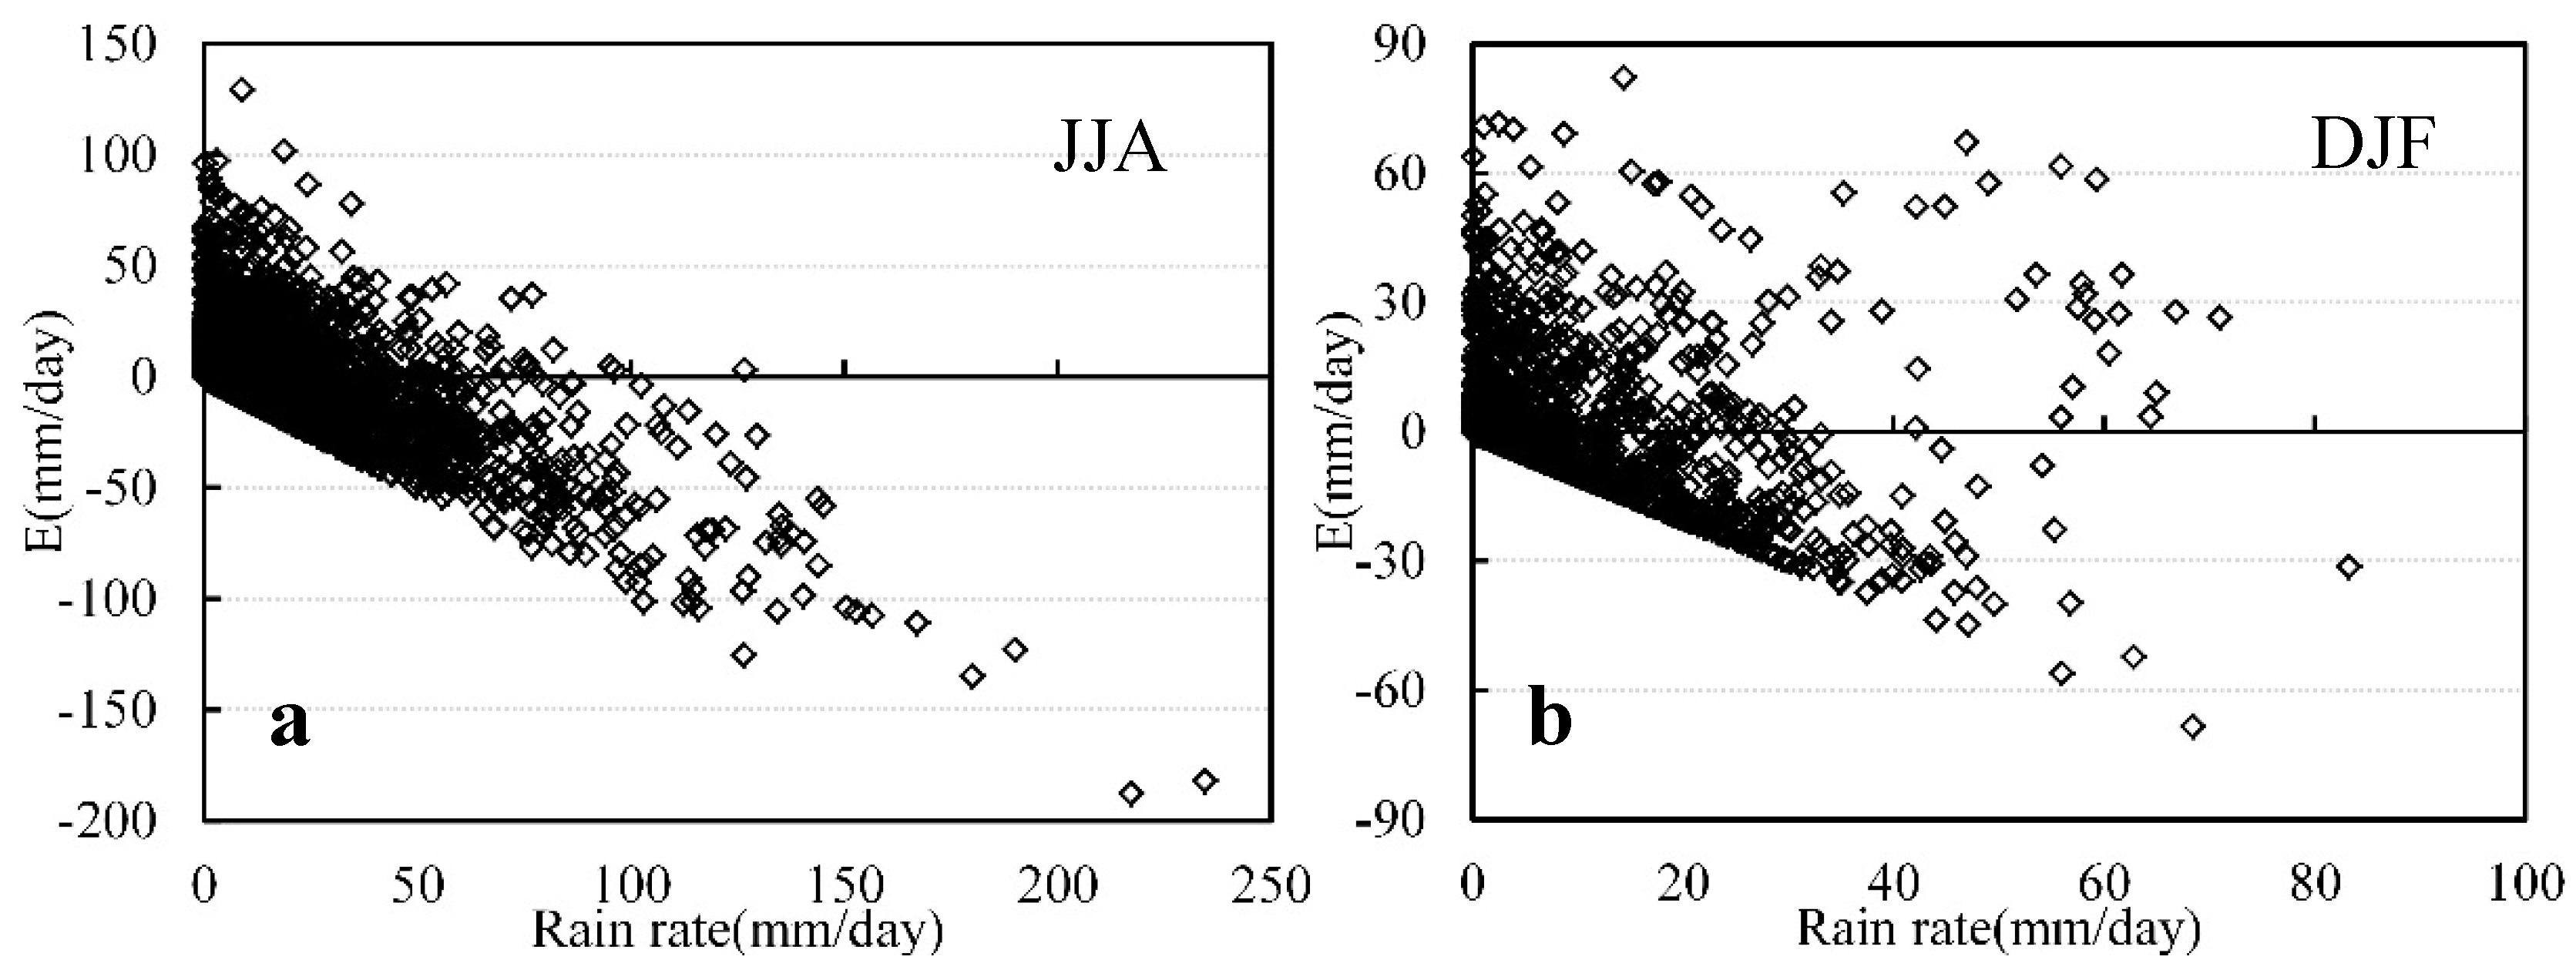
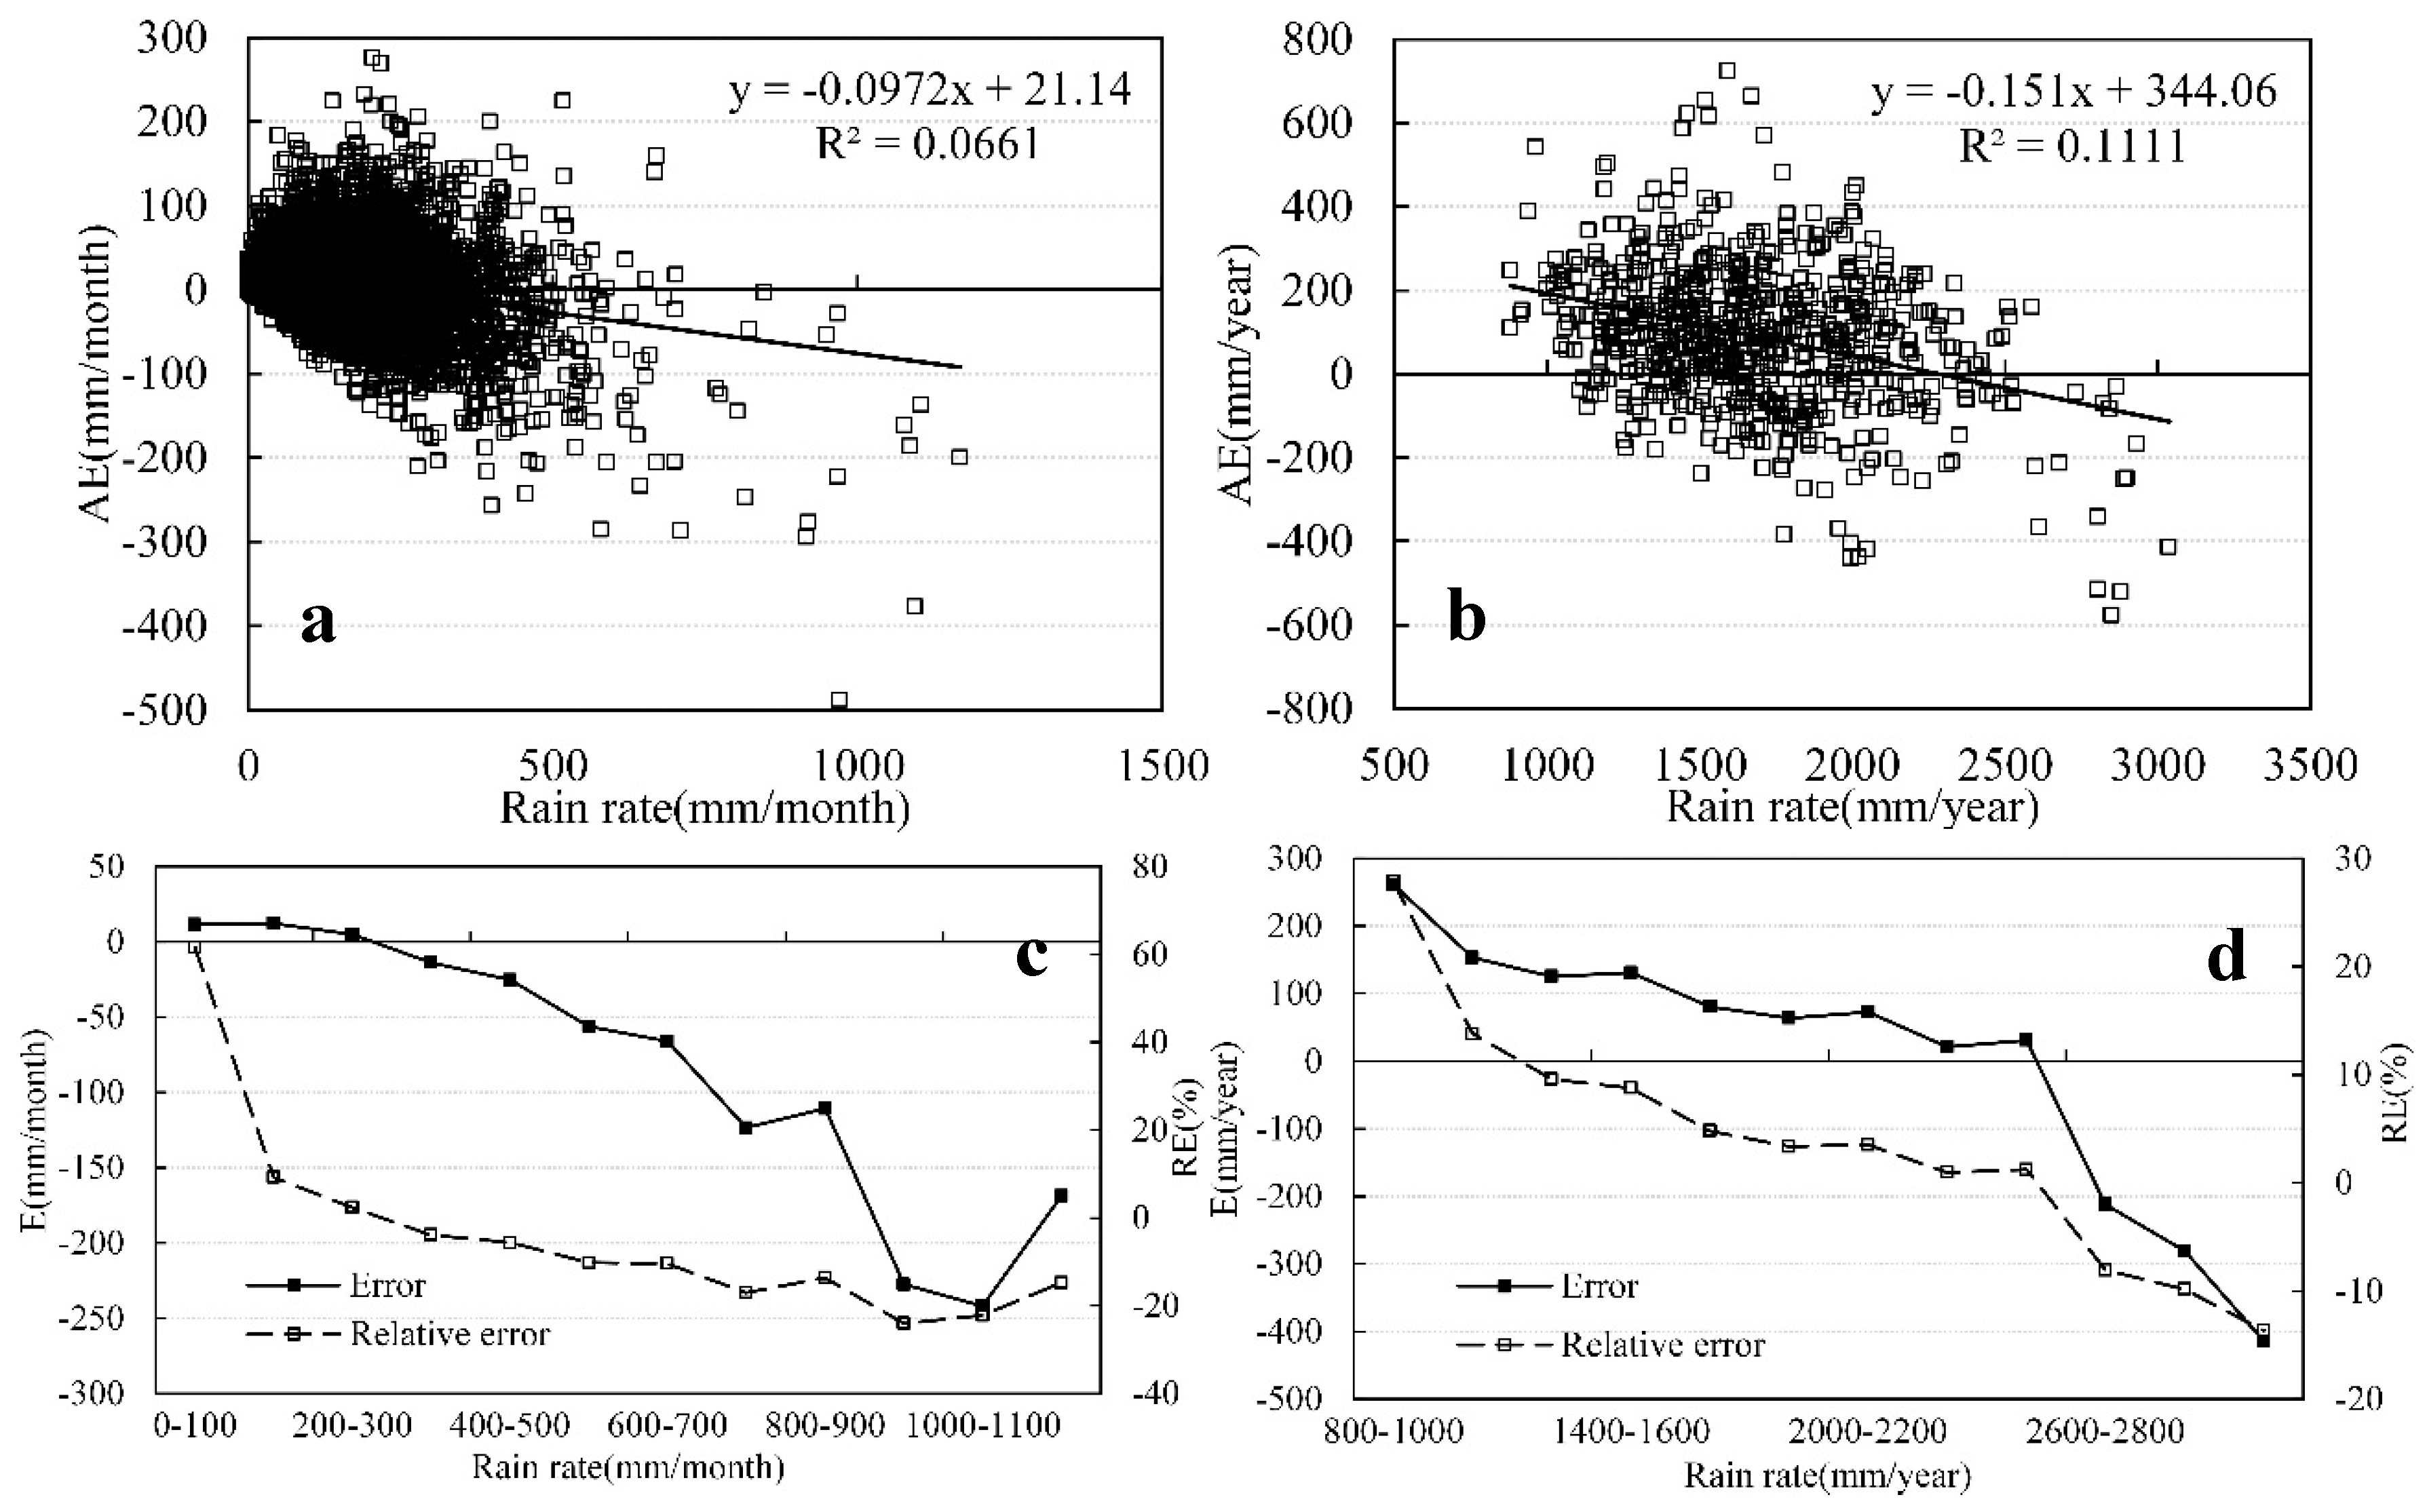
3.3. TRMM Accuracy for Different Rain Rates

At the daily scale, TRMM 3B42 generally overestimates rain rates for light and moderate rain cases and underestimates for heavy rain cases (Figure 6a,b). In the wet season (June, July and August, JJA), TRMM 3B42 generally overestimates precipitation by 183.15% when rain rate is <20 mm·day−1 and underestimates precipitation by 56.49% when the rain rate is >40 mm·day−1 (Figure 6c). The overestimation (underestimation) is more significant at lower (higher) rain rate. In the dry season (December, January and February, DJF), TRMM 3B42 generally overestimates precipitation by 27.70% (Figure 6d) when the rain rate is <10 mm·day−1 and underestimates precipitation by 35.61% when the rain rate is 10–50 mm·day−1. Additionally, it overestimates precipitation by 21.07% when the rain rate fall is 50–70 mm·day−1, demonstrating inconsistency compared to that in JJA.
At the daily scale, TRMM 3B42RT displays similar characteristics as TRMM 3B42 (Figure 7a,b). In JJA (Figure 7c), TRMM 3B42RT overestimates precipitation by 206.17% at rain rates less than 20 mm·day−1 and underestimates precipitation by 48.06% at rain rate larger than 40 mm·day−1. In DJF (Figure 7d), TRMM 3B42RT overestimates precipitation by 35.26% at rain rates less than 10 mm·day−1, underestimates precipitation by 31.43% at rain rates from 10 to 50 mm·day−1, and overestimates precipitation by 36.39% at rain rates from 50 to 70 mm·day−1.
At the monthly scale, TRMM 3B43 generally overestimates rain rates for light and moderate rain cases and underestimates for heavy rain cases (Figure 8a). TRMM 3B43 generally overestimates precipitation by 24.40% when the rain rate is <300 mm·month−1 and underestimates precipitation by 13.54% when the rain rate is >400 mm·month−1 (Figure 8c). The overestimation (underestimation) is more significant at lower (higher) rain rate. At the annual scale, TRMM 3B43 overestimates precipitation by 9.07% when the rain rate is <2400 mm·year−1 and underestimates by 10.52% when the rain rate is >2800 mm·year−1, demonstrating the consistency similar to that at the monthly scale (Figure 8b,d).
To quantitatively understand the discrepancies between the TRMM products (TRMM 3B43, 3B42 and 3B42RT) and the rain gauge data at the pixel scale. Figure 9 illustrates the histogram distribution of E. At the daily scale, most Es between TRMM 3B42 and gauge data are greater than 0 mm·day−1, and fall within 0–20 mm·day−1 (Figure 9a,b). In JJA (Figure 8a), approximately 81% of E values fall within 0–50 mm·day−1, and 16% fall within −50–0 mm·day−1. Similarly, In DJF (Figure 9b), approximately 79% of E values between TRMM 3B42RT and gauge data fall within 0–50 mm·day−1, and 16% fall within −50–0 mm·day−1 (Figure 9c). In DJF (Figure 9d), approximately 78% of E values fall within 0–50 mm·day−1, and 21% fall within −50–0 mm·day−1. The high frequency of overestimation of light and moderate rain cases is the major reason for the overall overestimation at the daily scale in both JJA and DJF.
At the monthly scale, most E values are greater than 0 mm·month−1 and fall within 0–40 mm·month−1 (Figure 9e). Approximately 81% of E values fall within 0–100 mm·month−1, and 16% fall within −100–0 mm·month−1. The high frequency of overestimation of light and moderate rain cases is the major reason for the overall overestimation. At the annual scale, most E values fall within 50–250 mm·year−1 (Figure 9f). Approximately 78% of E values fall within 0–400 mm·year−1, and 27% fall within −400–0 mm·year−1. Similar to the trend at the monthly scale, most E values are greater than 0 mm·year−1. Therefore, the same results are obtained at the monthly scale and annual scale.
In summary, TRMM products generally overestimate precipitation because of high frequency overestimation of light and moderate rain cases. At the daily scale, the performance of TRMM products is considerably different in different seasons. Approximately 80% of E values fall within 0–50 mm·day−1, and 16% fall within −50–0 mm·day−1 in both JJA and DJF. At the monthly and annual scales, TRMM 3B43 generally overestimates precipitation when the rain rate is <200 mm·month−1 (2400 mm·year−1) and underestimates precipitation when the rain rate is >400 mm·month−1 (2800 mm·year−1). Approximately 81% of E values fall within 0–100 mm·month−1 at the monthly scale, and approximately 78% fall within 0–400 mm·year−1 at the annual scale.

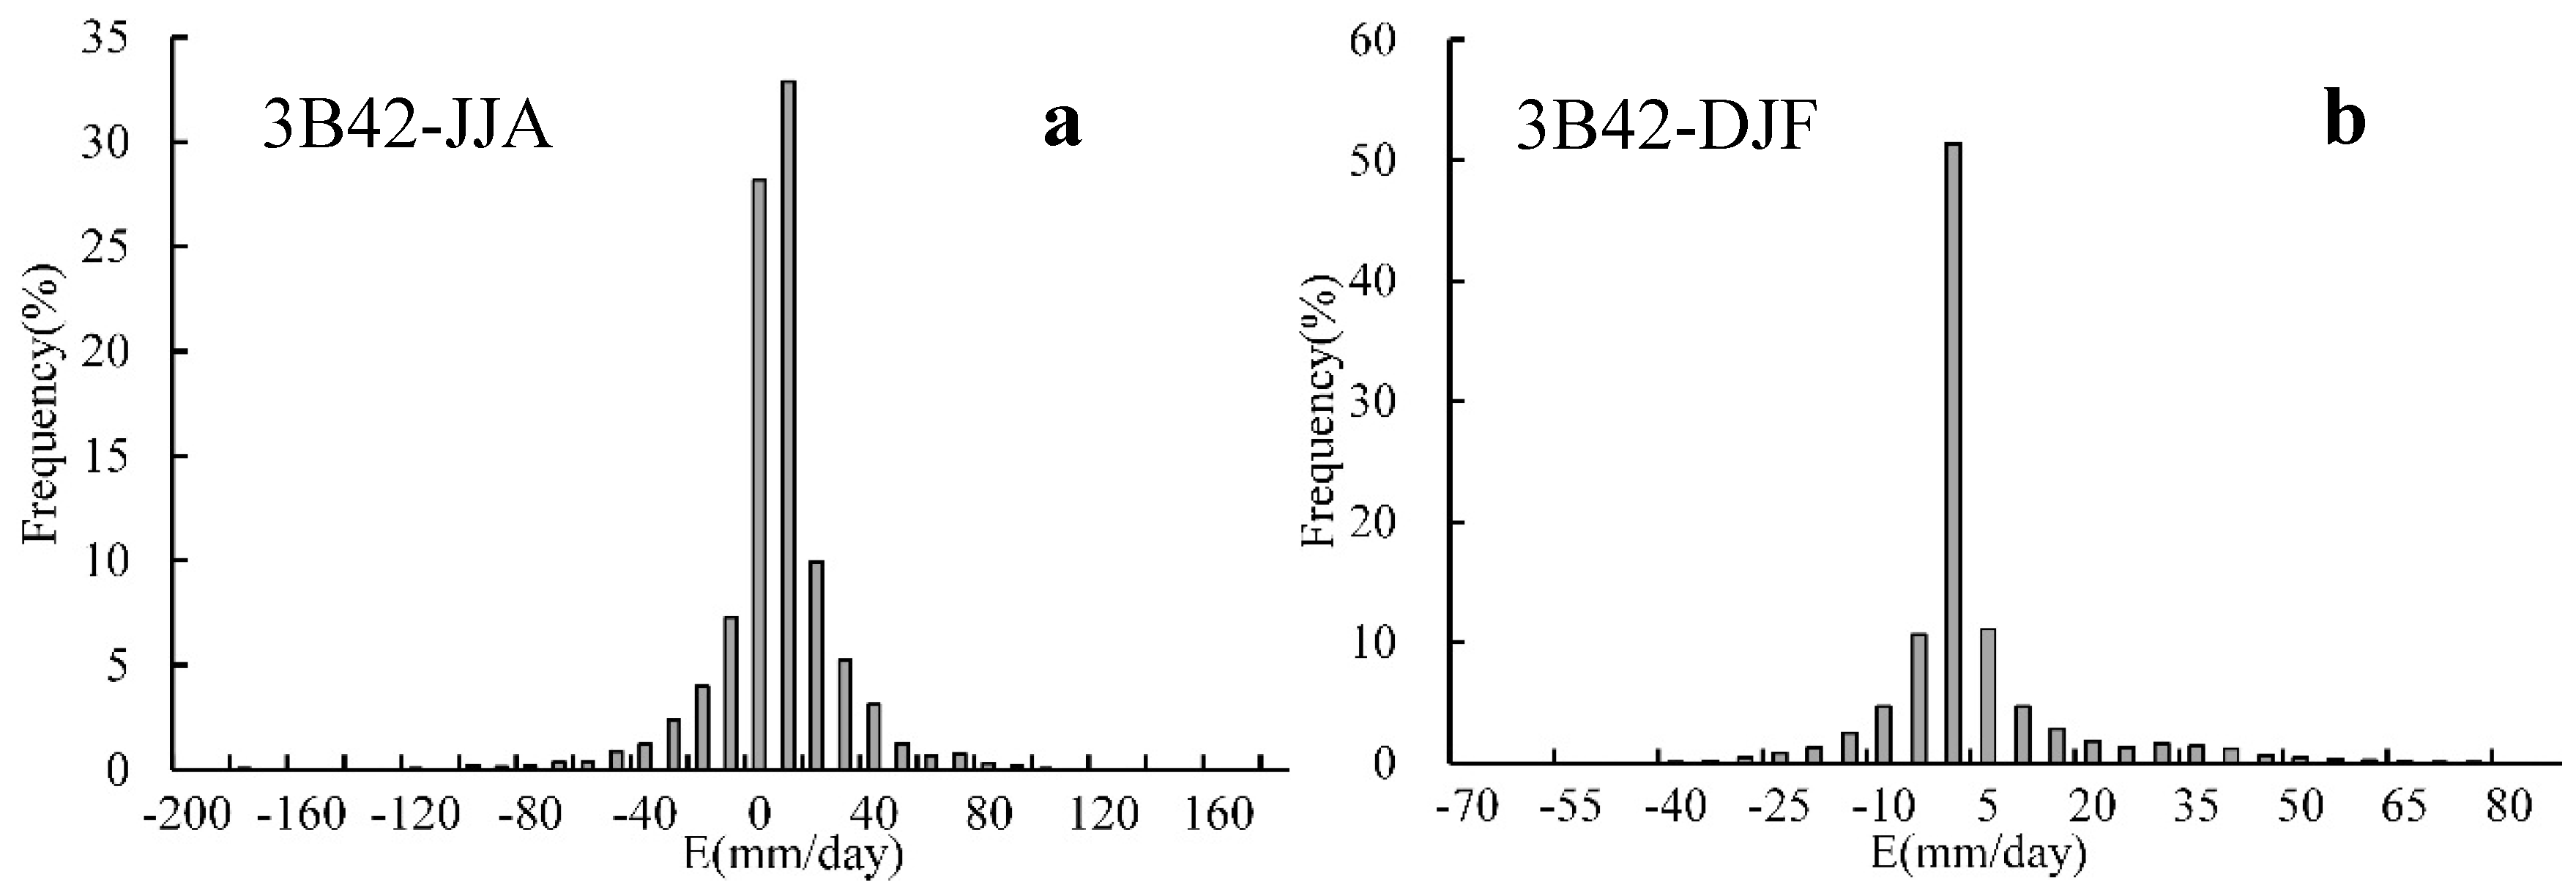
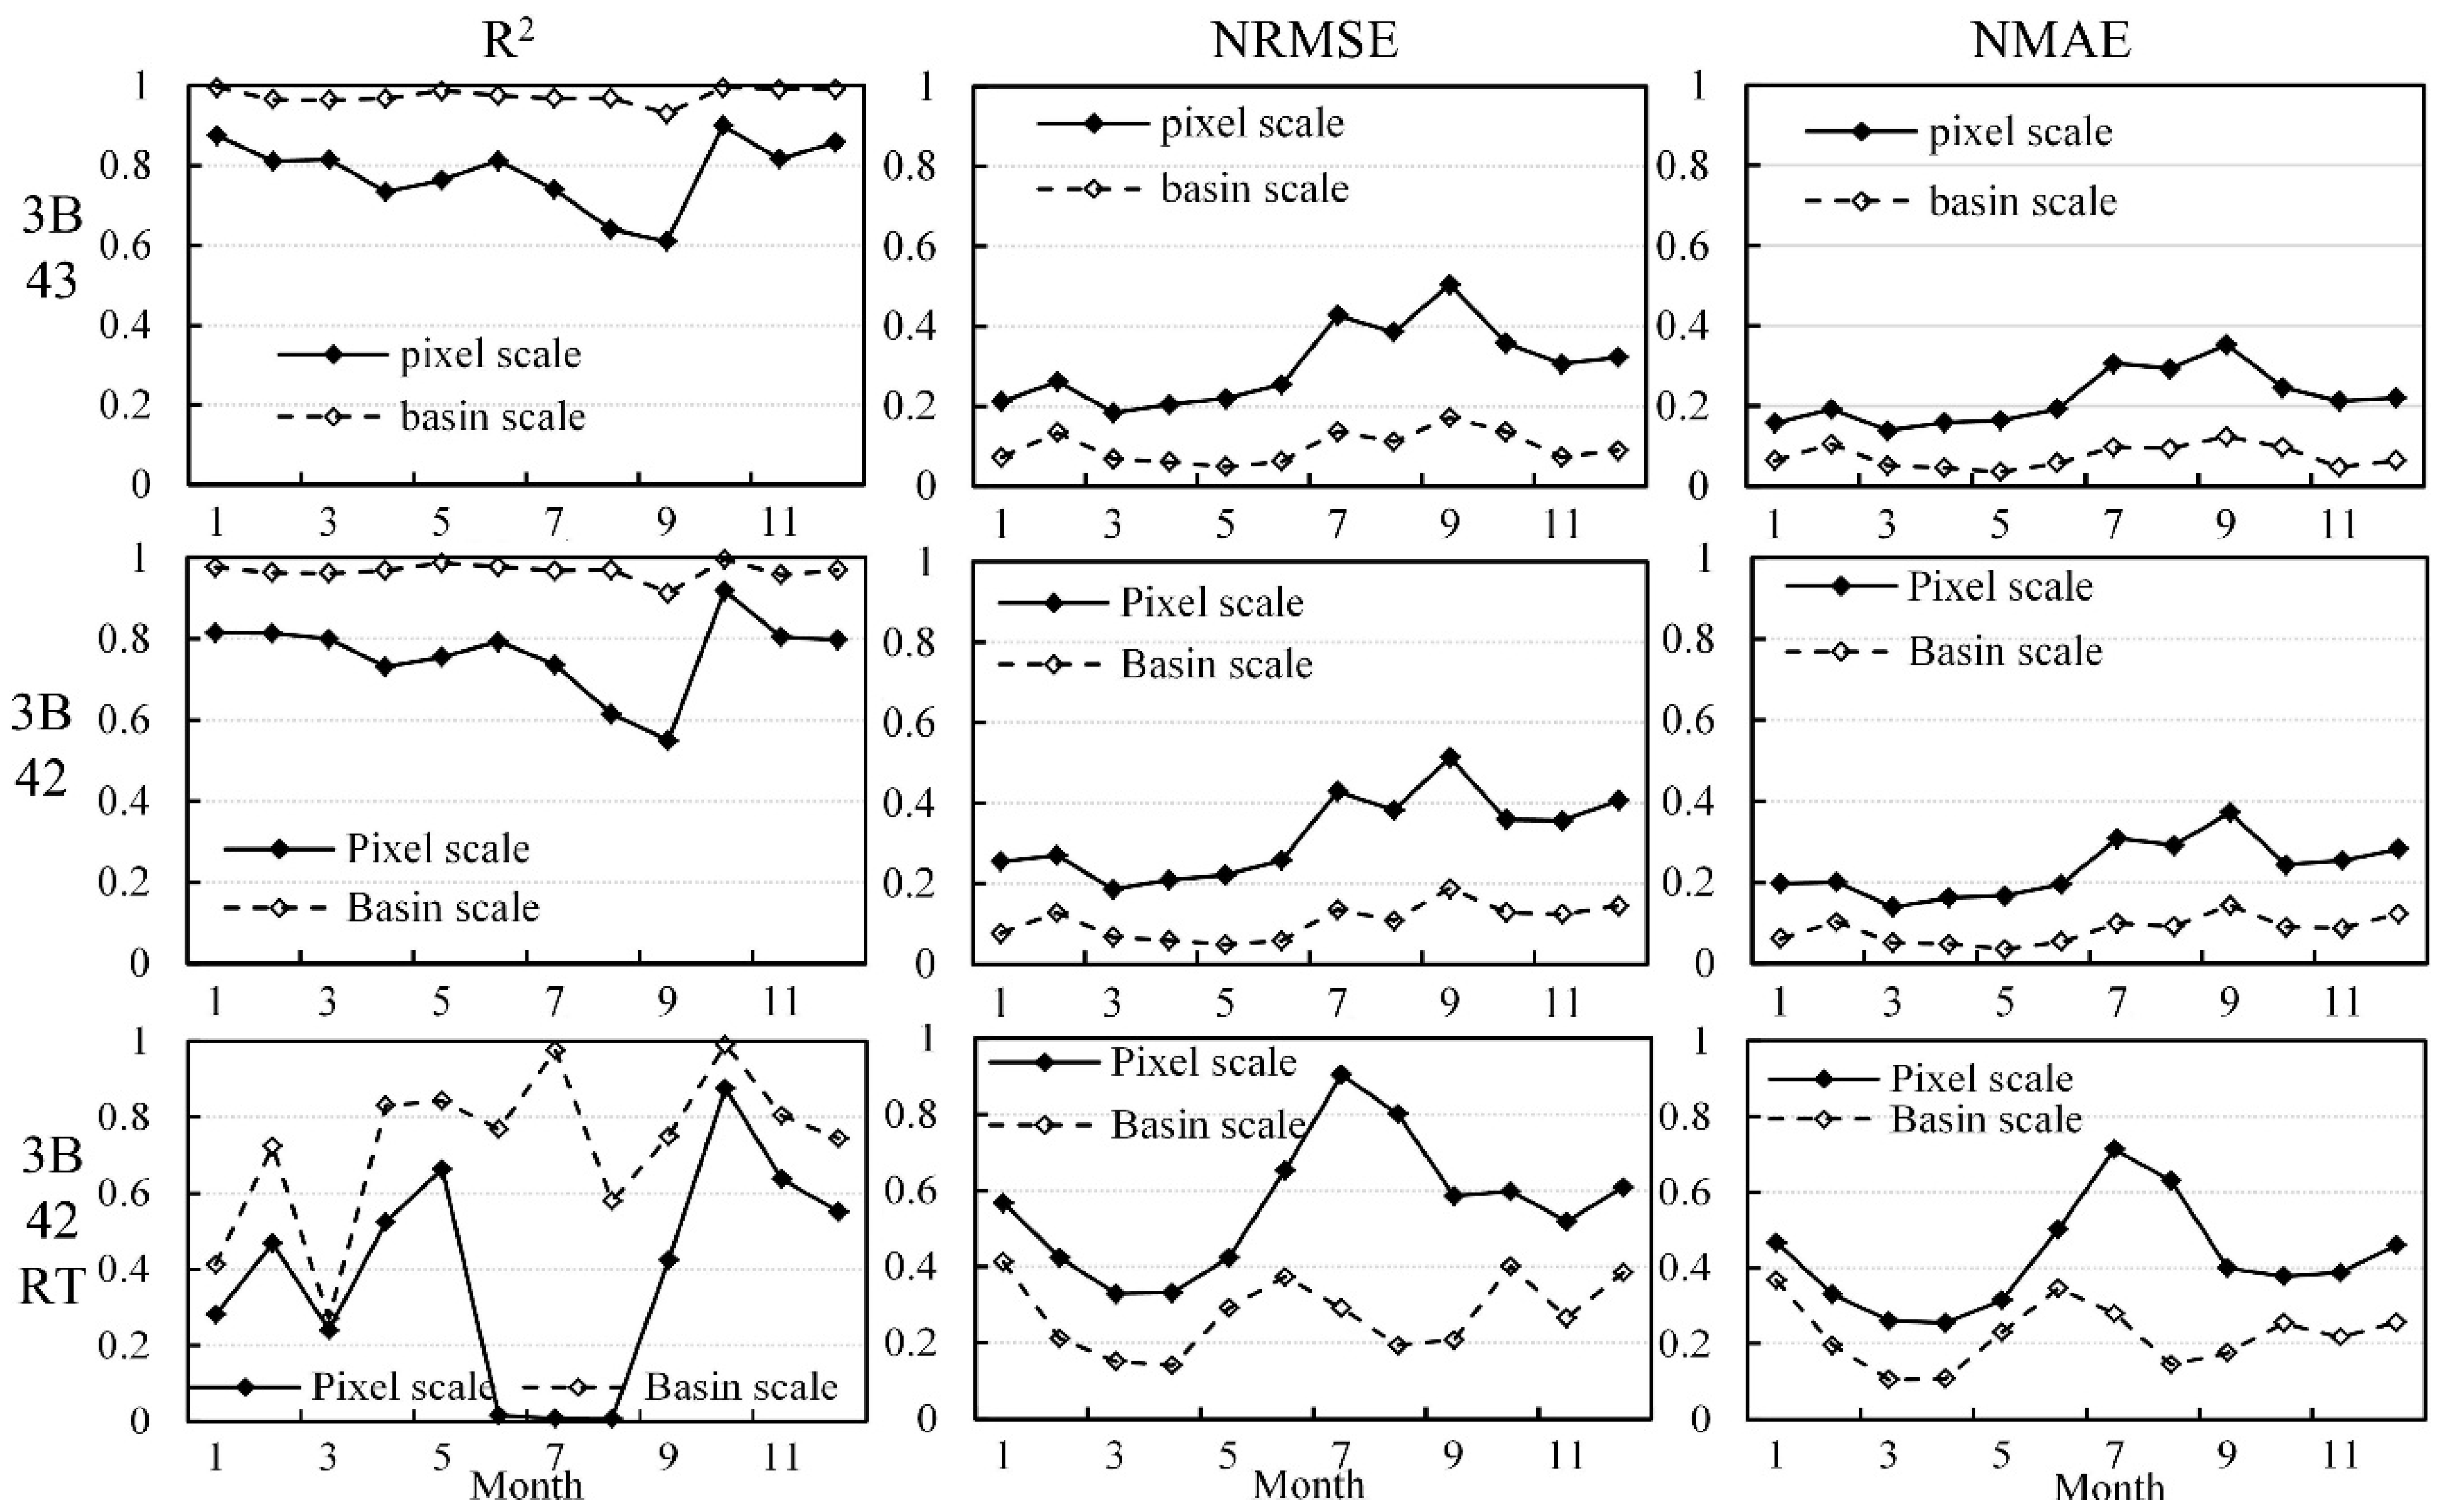
3.4. Seasonal Pattern of TRMM Accuracy

Figure 10 compares the seasonal patterns of statistical indices between the two datasets at the pixel scale and basin scale. At the pixel scale, TRMM 3B43 (the first solid line in Figure 10) had an R2 > 0.75 except in July (R2 = 0.74), August (R2 = 0.64) and September (R2 = 0.56). The coefficient of determination remains stable form November to June (R2 = 0.81–0.90), but it experiences a change from July to September (R2 = 0.61–0.90). The NRMSE shows a unimodal distribution. The peak values occurs in September. The NMAE also exhibits the same pattern. Overall, significant discrepancies (NRMSE: 36%–50% and NMAE: 25%–31%) can be found between the two data sets from July–September at the pixel scale. The largest discrepancy occurs in September. TRMM 3B42 (the second solid line in Figure 10) had a similar seasonal pattern. The coefficient of determination remains stable from November to June (R2 = 0.73–0.81), but it experiences a change from July to September (R2 = 0.55–0.91). Significant discrepancies (NRMSE: 38%–51% and NMAE: 29%–37%) can be found between the two data sets from July to September. The largest discrepancy occurs in September. TRMM 3B42RT (the last solid line in Figure 10) generally had an R2 from 0.00 to 0.88. The coefficient of determination fluctuates throughout the year, and is relatively low from June to August (R2 = 0.00–0.01). The NRMSE shows a unimodal distribution. The peak value occurs in July (90%). The NMAE also has the same pattern. Overall, significant discrepancies (NRMSE: 65%–90% and NMAE: 50%–71%) can be found between the two data sets from June to August at the pixel scale. The largest discrepancy occurs in July.
At the basin scale, the seasonal patterns of statistical indices of TRMM 3B43 (the first dotted line in Figure 10) and 3B42 (the second dotted line in Figure 10) are similar to those at the pixel scale. The coefficient of determinations are closer to unity (>0.9), indicating a higher proximity to the reference data, and all indices representing discrepancy are lower than those at the pixel scale. Additionally, the largest discrepancies (for 3B43, NRMSE: 17% and NMAE: 12%; for 3B42, NRMSE: 19% and NMAE: 14%) can be found in September. For TRMM 3B42RT (the last dotted line in Figure 10), the seasonal pattern of the coefficient of determination is similar to that at the pixel scale, except in June and July. NRMSE and NMAE fluctuate throughout the year are lower than those at the pixel scale. The largest discrepancy occurs in January (NRMSE: 40% and NMAE: 36%).
In summary, TRMM products perform better in different seasons at the basin scale than at the pixel scale. For TRMM 3B43 and 3B42, significant discrepancies can be found from July to September, and the worst performance occurs in September at both the basin scale and pixel scale. For TRMM 3B42RT, all statistical indices fluctuate throughout the year, and the worst performance occurs in July at the pixel scale and January at the basin scale.

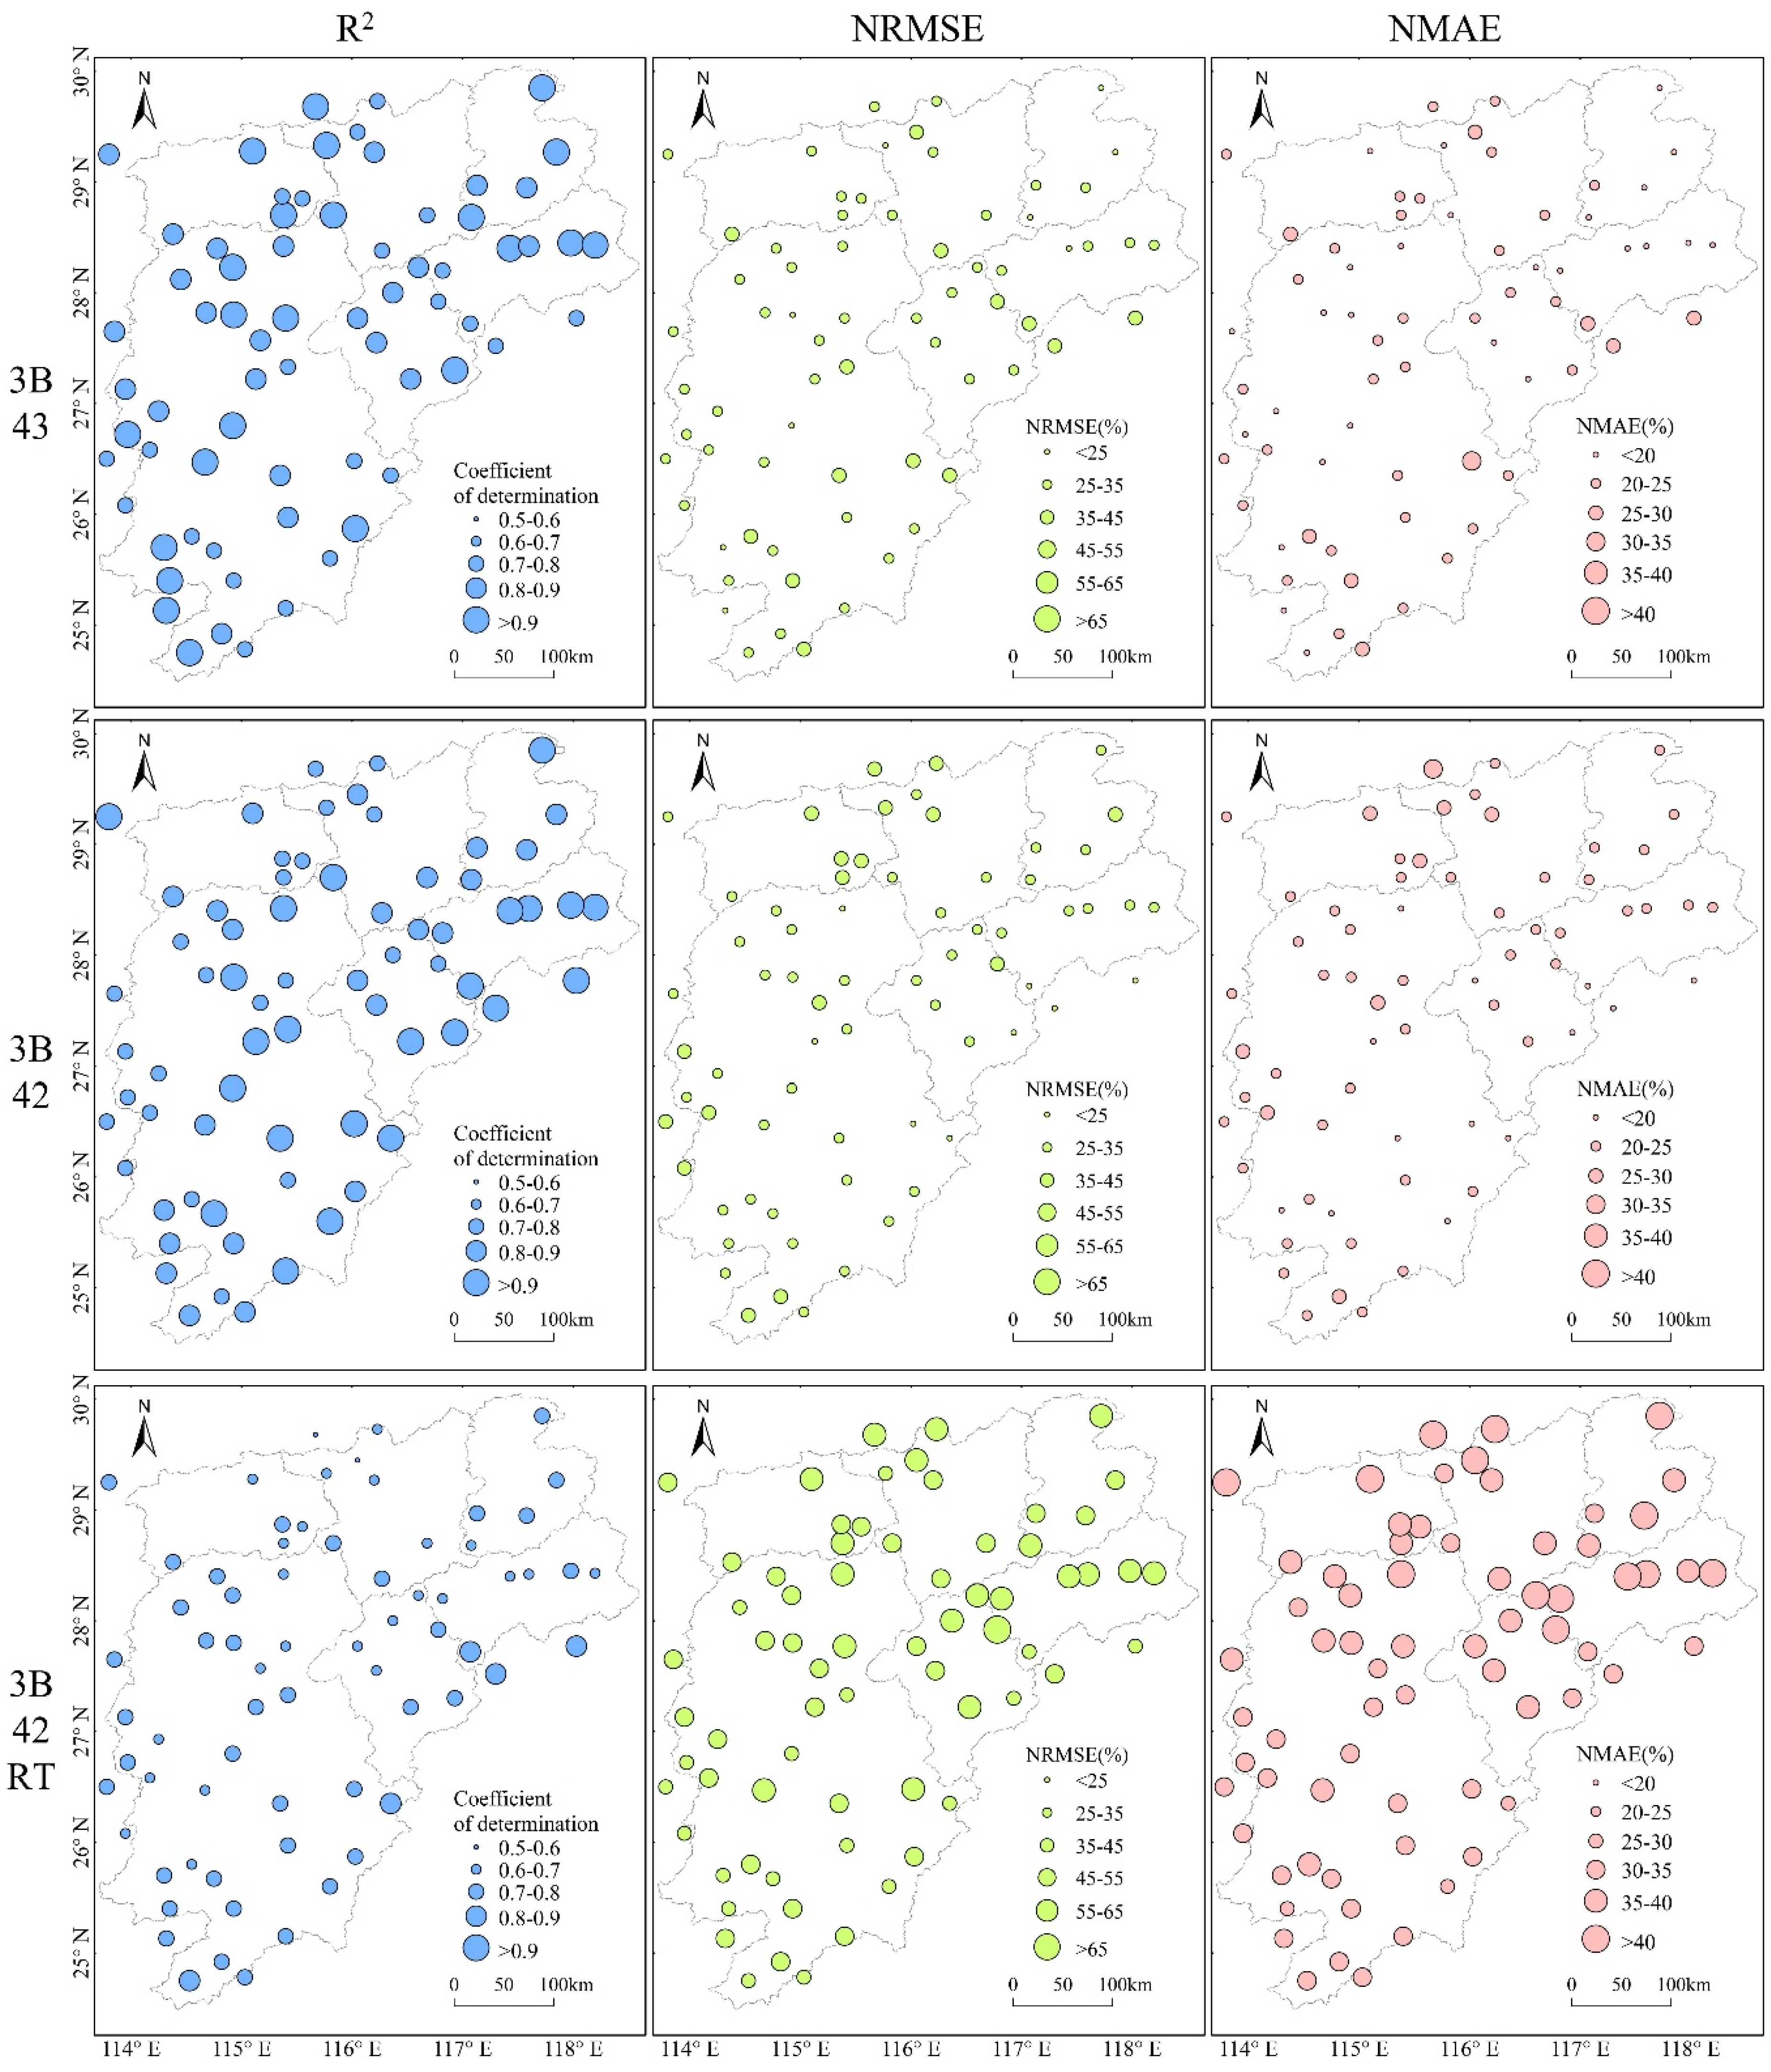
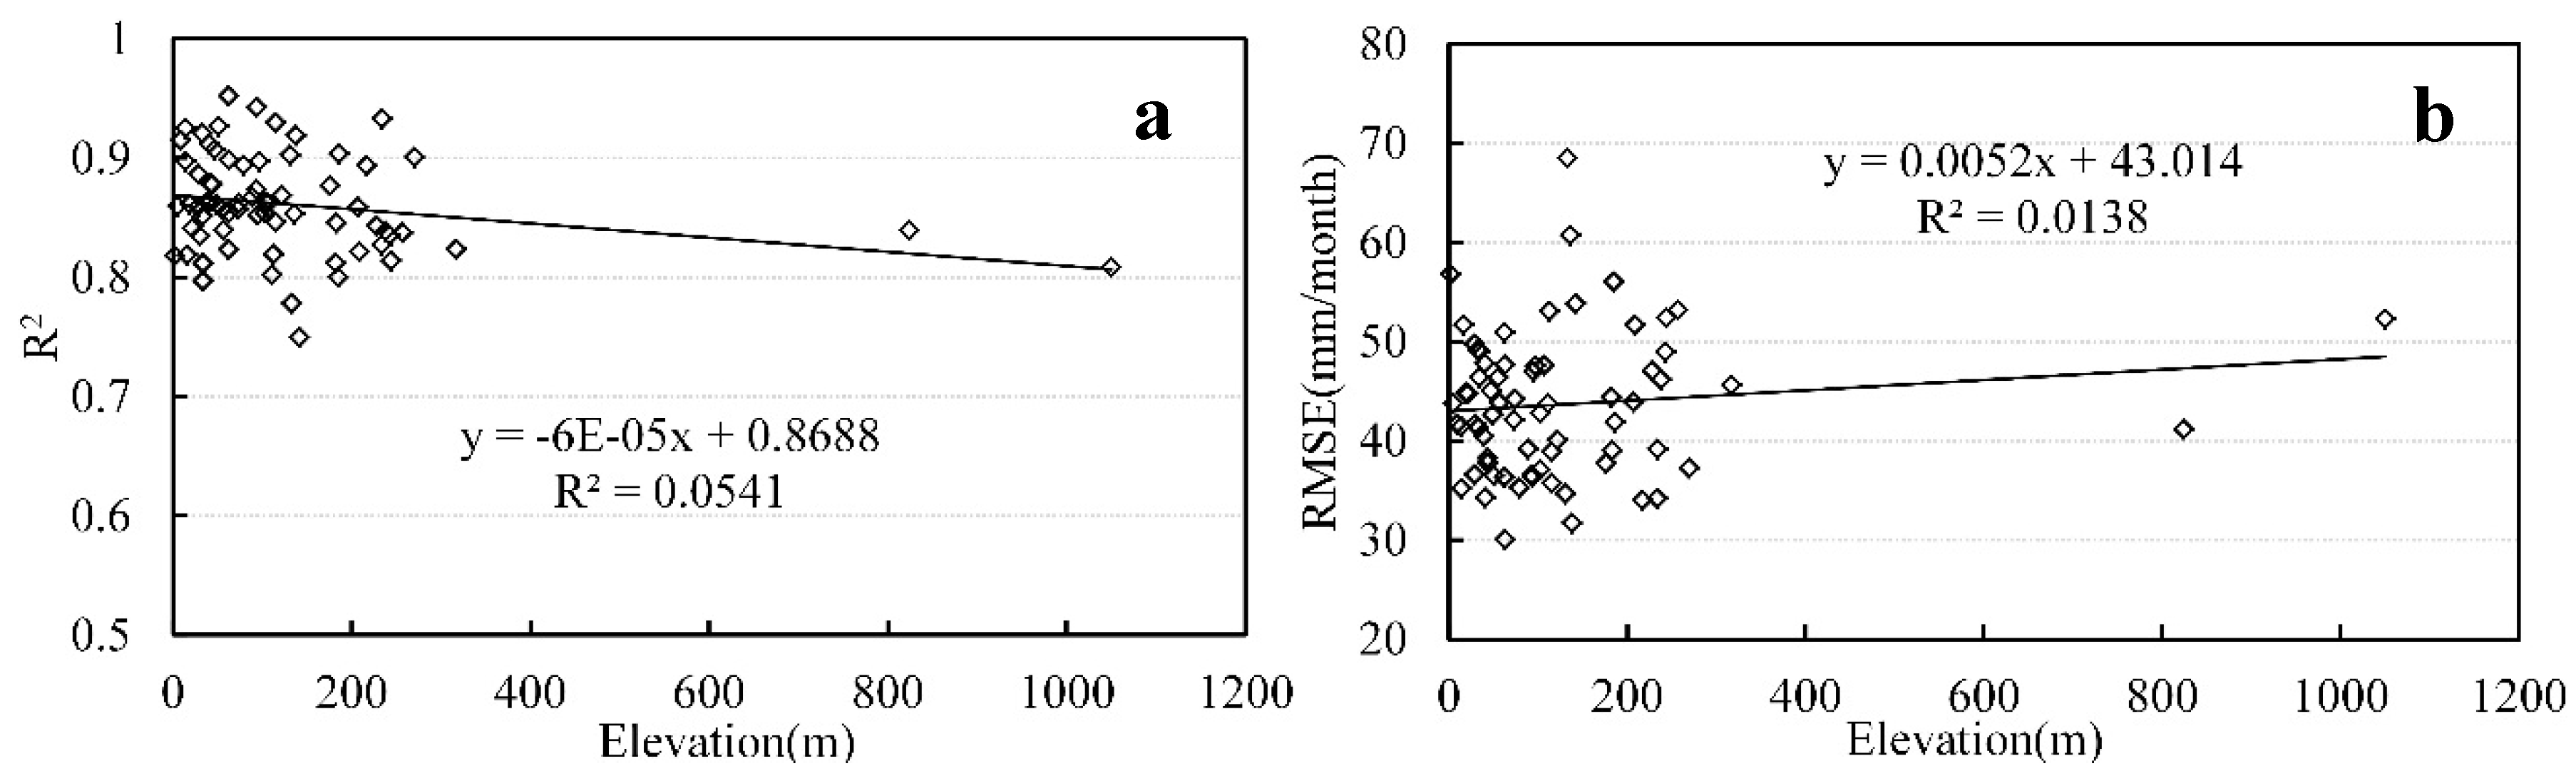
3.5. Spatial Characteristics of TRMM Product Performance

Figure 11 shows the spatial distributions of R2, NRMSE, and NMAE at the monthly scale. The TRMM 3B43 (the first line in Figure 11) correlated best with the rain gauge observations, with R2 values larger than 0.74 (most >0.80). NRMSE values mainly ranged between 21% and 35%, while NMAE was between 15% and 25%. TRMM 3B42 (the second line in Figure 11) trends are similar to those of TRMM 3B43. TRMM 3B43 performed relatively poorly in the south-east, while TRMM 3B42 performed relatively poorly in the north-west. TRMM 3B42RT (the last line in Figure 11) had a poorer relation with the rain gauge data (R2: 0.51–0.75). NRMSE values mainly ranged between 45% and 65%, while NMAE ranged from 30% to 40%, indicating a larger discrepancy with rain gauge data than those of TRMM 3B43 and 3B42. TRMM 3B42RT performed relatively poorly in the northern areas. The south, west and east marginal region are dominated by hilly or mountainous topography with high surface elevation, especially in northwest and southeast regions. The average surface elevation of the basin is about 2000 m in northwest area, while in the southwest area of about 1700 m. Therefore, TRMM products performance is negatively related with surface elevation. Figure 12 shows the relationships between statistical indices and elevation. The regressions demonstrated a negative relationship between R2 and surface elevation, and a positive relationship between RMSE and surface elevation. The results further confirmed the negative effect of surface elevation on the performance of TRMM products.

4. Discussion

The analysis presented in this study provides a quantitative comparison between TRMM precipitation products (TRMM 3B43, 3B42 and 3B42 RT) and gauge based precipitation data at different scales in the Poyang Lake Basin, showing that different products perform differently at different scales. The basin is located in a humid subtropical climate zone, and the surface elevation of the basin ranges from 5 to 2100 m above sea level. Many efforts have been devoted to evaluating TRMM precipitation products in different research areas [22,23,24,25,26,27]. However, the results in this paper provide important evidence that TRMM precipitation data sets are comparable to rain gauge measurements. Additionally, the findings support the considerable potential for the application of satellite products not only in the Poyang Lake basin but also in other similar regions.
This paper first compares the validation results between satellite products (TRMM 3B43, 3B42 and 3B42RT) and rain gauge data with or without GPCC reporting gauges at the monthly scale. The result showed that TRMM products performed slightly better using reference data with GPCC reporting gauges than did data without GPCC reporting gauges (Figure 2). Nevertheless, reference data used hereafter are all without GPCC reporting gauges. Most existing studies use rain gauge data, either in situ or gridded, as references to evaluate satellite precipitation products at the pixel scale, which is very important for meteorological services. However, basin-scale precipitation is more meaningful for hydrological applications [32,33]. Here, we first evaluates satellite precipitation products at different scales (Figure 3, Figure 4 and Figure 5), demonstrating that performance generally increases with increasing spatial scale. The accuracy is relatively low and similar for TRMM 3B42 and 3B42RT at the daily scale, while the accuracy is highest for TRMM 3B43, with 3B42 second and 3B42RT third at both the monthly scale and annual scale.
It should be noted that TRMM products generally overestimates rain rates for light and moderate rain cases and underestimates for heavy rain cases [22,27]. Our results (Figure 6, Figure 7, Figure 8 and Figure 9) also support this point well, and provide quantitative values for light and moderate rain cases and heavy rain cases. At the daily scale, the rain rate threshold for light and moderate rain cases (heavy rain cases) is defined as less than 20 mm·day−1 (larger than 40 mm·day−1) in JJA. In DJF, TRMM products overestimate precipitation at rain rates less than 10 mm·day−1, underestimate precipitation at rain rates from 10 to 50 mm·day−1, and overestimate precipitation from 50 to 70 mm·day−1. The performance varies considerably in different seasons, potentially due to different rain cloud types. There are mainly two rain cloud types, including convection clouds and stratiform clouds. Further analysis suggests that TRMM products generally overestimate precipitation because of the high frequency and degree of overestimation for light and moderate rain cases (different definition at different scales and in different seasons). The current study is limited regarding in-depth analysis of inherent limitations in precipitation retrieval algorithms. Meanwhile, it could be meaningful to analyse several types of precipitation events if hourly gauge precipitation data were available, allowing comparative analyses under various situations.
TRMM products perform better in the dry season than in the wet season [25]. Our results (Figure 10) are consistent with these findings. Furthermore, we compare the performance of monthly TRMM data at the basin scale and pixel scale. The results further suggest that they perform better at the basin scale than at the pixel scale in different seasons. It further provides evidence that TRMM products can be applied to basin-scale hydrological processes, especially in ungauged or sparsely gauged basins, despite the relatively poor performance of TRMM 3B42RT. In addition, the spatial distribution of statistical indices at the monthly indicated TRMM 3B43 and 3B42 performed well while TRMM 3B42RT exhibited a poor performance. TRMM products performance is negatively related with surface elevation.
The breakthrough point in this paper is the analysis at different scales. Researchers face a difficult challenge associated with different scales of measurements and gridded precipitation data. Gauges provide point measurements of precipitation, while satellite precipitation data are spatially gridded. Validation is most often based on comparing data from gauges with satellite precipitation products at the pixel scale [47], which suffers from scale mismatch issue. Further validation methods are needed to overcome this problem. Furthermore, this study focuses on the performance of satellite-based precipitation products, providing evidence for the application of TRMM products to basin-scale hydrological processes. Additionally, this study relates TRMM product performance with surface elevation.

5. Conclusions

This paper mainly evaluates TRMM products (3B43, 3B42 and 3B42RT) at different scales in the Poyang Lake Basin by employing a large data set comprising rain gauges and TRMM products from 1998 to 2007 (for 3B42RT, 2000–2007) and using the associated scatterplot distributions, statistical relationships and the error values.
This paper first compares the validation results between satellite product (TRMM 3B43, 3B42 and 3B42RT) and rain gauge data with or without GPCC reporting gauges at the monthly scale. The TRMM products performed slightly better using reference data with GPCC reporting gauges than did data without GPCC reporting gauges. Both TRMM 3B43 and 3B42 merge GPCC gauges; thus, the reference data used hereafter are without GPCC reporting gauges. The results show that the TRMM products (TRMM 3B43, 3B42 and 3B42RT) performed well, with slight overestimation at the monthly and annual scales. The accuracy is highest for TRMM 3B43, with 3B42 second and 3B42RT third at both the monthly and annual scale. The accuracy is relatively low and similar for TRMM 3B42 and 3B42RT at the daily scale. Meanwhile, the performance generally increased with increasing spatial scale, which is more meaningful for hydrological applications.
Then, we quantitatively analysed discrepancies between the TRMM products and the rain gauge data at the pixel scale. TRMM products generally overestimate precipitation because of the high frequency and degree of overestimation in light and moderate rain cases, despite different thresholds of rain rate. At the daily scale, the performance of TRMM products considerably varies in different seasons. The threshold of rain rate for light and moderate rain cases (heavy rain cases) is defined as less than 20 mm·day−1 (larger than 40 mm·day−1) in JJA. In DJF, TRMM products overestimate precipitation for rain rates less than 10 mm·day−1, underestimate precipitation for rain rates falling from 10 to 50 mm·day−1, and overestimate precipitation from 50 to 70 mm·day−1. Approximately 80% of E values fall within 0–50 mm·day−1, while 16% fall within −50–0 mm·day−1 in both JJA and DJF. At the monthly and annual scales, TRMM 3B43 generally overestimates precipitation when the rain rate is <200 mm·month−1 (2400 mm·year−1) and underestimates for the precipitation when the rain rate >400 mm·month−1 (2800 mm·year−1). Approximately 81% of E values fall within 0–100 mm·month−1 at the monthly scale while approximately 78% fall within 0–400 mm·year−1 at the annual scale.
Finally, we compare seasonal patterns and spatial characteristics of TRMM accuracy. The results further suggest that there is a better performance at the basin scale than at the pixel scale in different seasons. It further provides evidence that TRMM products can be applied to basin-scale hydrological processes, especially in ungauged or sparsely gauged basins, despite the relatively poor performance of TRMM 3B42RT. For TRMM 3B43 and 3B42, significant discrepancies can be found from July to September, and the worst performances occur in September at both the basin and pixel scale. For TRMM 3B42RT, all statistical indices fluctuate throughout the year, and the worst performance occurs in July at the pixel scale and January at the basin scale. In addition, the spatial distributions of statistical indices at the monthly scale indicated that TRMM 3B43 and 3B42 perform well while TRMM 3B42RT displayed a poor performance. TRMM product performance is negatively related with surface elevation.

Acknowledgments

This work was supported in part by the State Key Program of the National Natural Science of China under Grant 41430855 and in part by the National High Technology Research and Development Program under Grant 2013AA12A301.

Author Contributions

Ruofang Guo designed the study, collected remote sensing and field data, performed data analysis and wrote the manuscript. Yuanbo Liu designed the study and acquired funding for the project.

Conflicts of Interest

The authors declare no conflict of interest.

Abbreviations

The following abbreviations are used in this manuscript:
TMPATRMM multi-satellite precipitation analysis
TMITRMM microwave imager
PRprecipitation radar
RMSEroot mean square error
GCTEglobal change and terrestrial ecosystems
IGBPproject of the International Geosphere–Biosphere Programme
CAMSClimate Assessment and Monitoring System
GPCCGlobal Precipitation Climatology Centre
CMACenter of the China Meteorological Administration
MEmean error
Eerror
RErelative error
RMSEroot mean square error
MAEmean absolute error
NRMSEnormalized root mean squared error
NMAEnormalized mean absolute error

References

  1. Barrett, E.C.; Beaumont, M.J. Satellite rainfall monitoring for agrometeorology: Operational problems, practices and prospects. EARSeL Adv. Remote Sens. 1993, 2, 66–72. [Google Scholar]
  2. Barrett, E.C.; Beaumont, M.J. Satellite rainfall monitoring: An overview. Remote Sens. Rev. 1994, 11, 23–48. [Google Scholar] [CrossRef]
  3. Krajewski, W.F. Ground Networks: Are We Doing the Right Thing? In Measuring Precipitation from Space; Springer: Dordrecht, The Netherlands, 2007; pp. 403–417. [Google Scholar]
  4. Kidd, C. Satellite rainfall climatology: A review. Int. J. Climatol. 2001, 21, 1041–1066. [Google Scholar] [CrossRef]
  5. Durkee, J. Precipitation measurement and the advancement toward global observations. Geogr. Compass 2010, 4, 956–978. [Google Scholar] [CrossRef]
  6. Michaelides, S.C. Precipitation: Advances in Measurement, Estimation and Prediction; Springer: Heidelberg, Germany, 2008. [Google Scholar]
  7. Kidd, C.; Levizzani, V.; Bauer, P. A review of satellite meteorology and climatology at the start of the twenty-first century. Progr. Phys. Geogr. 2009, 33, 474–489. [Google Scholar] [CrossRef]
  8. Kidd, C.; Levizzani, V. Status of satellite precipitation retrievals. Hydrol. Earth Syst. Sci. 2011, 15, 1109–1116. [Google Scholar] [CrossRef]
  9. Wilheit, T.; Adler, R.; Avery, S.; Barrett, E.; Bauer, P.; Berg, W.; Chang, A.; Ferriday, J.; Grody, N.; Goodman, S.; et al. Algorithms for the retrieval of rainfall from passive microwave measurements. Remote Sens. Rev. 1994, 11, 163–194. [Google Scholar] [CrossRef]
  10. Iguchi, T.; Kozu, T.; Meneghini, R.; Awaka, J.; Okamoto, K. Rain-profiling algorithm for the TRMM precipitation radar. J. Appl. Meteorol. 2000, 39, 2038–2052. [Google Scholar] [CrossRef]
  11. Levizzani, V.; Amorati, R.; Meneguzzo, F.; Amorati, R.; Meneguzzo, F. A review of satellite-based rainfall estimation methods. In European Commission Project MUSIC Report (EVK1-CT-2000-00058); Istituto di Biometeorologia-CNR: Bologna, Italy, 2002; p. 66. [Google Scholar]
  12. Kummerow, C.; Barnes, W.; Kozu, T.; Shiue, J.; Simpson, J. The tropical rainfall measuring mission (TRMM) sensor package. J. Atmos. Ocean Technol. 1998, 15, 809–817. [Google Scholar] [CrossRef]
  13. Joyce, R.J.; Janowiak, J.E.; Arkin, P.A.; Xie, P. CMORPH: A method that produces global precipitation estimates from passive microwave and infrared data at high spatial and temporal resolution. J. Hydrometeorol. 2004, 5, 487–503. [Google Scholar] [CrossRef]
  14. Turk, F.J.; Miller, S.D. Toward improved characterization of remotely sensed precipitation regimes with MODIS/AMSR-E blended data techniques. IEEE Trans. Geosci. Remote Sens. 2005, 43, 1059–1069. [Google Scholar] [CrossRef]
  15. Ushio, T.; Sasashige, K.; Kubota, T.; Shige, S.; Okamoto, K.; Aonashi, K.; Inoue, T.; Takahashi, N.; Iguchi, T.; Kachi, M.; et al. A Kalman filter approach to the Global Satellite Mapping of Precipitation (GSMaP) from combined passive microwave and infrared radiometric data. J. Meteorol. Soc. Jpn. 2009, 87, 137–151. [Google Scholar] [CrossRef]
  16. Huffman, G.J.; Adler, R.F.; Bolvin, D.T.; Gu, G.; Nelkin, E.J.; Bowman, K.P.; Hong, Y.; Stocker, E.F.; Wolff, D.B. The TRMM multisatellite precipitation analysis (TMPA): Quasi-global, multiyear, combined-sensor precipitation estimates at fine scales. J. Hydrometeorol. 2007, 8, 38–55. [Google Scholar] [CrossRef]
  17. Minobe, S.; Miyashita, M.; Kuwano-Yoshida, A.; Tokinaga, H.; Xie, S.P. Atmospheric response to the gulf stream: Seasonal variations*. J. Clim. 2010, 23, 3699–3719. [Google Scholar] [CrossRef]
  18. Ji, X.; Chen, Y. Characterizing spatial patterns of precipitation based on corrected TRMM 3B43 data over the mid Tianshan Mountains of China. J. Mt. Sci. 2012, 9, 628–645. [Google Scholar] [CrossRef]
  19. Naumann, G.; Barbosa, P.; Carrao, H.; Singleton, A.; Vogt, J. Monitoring drought conditions and their uncertainties in Africa using TRMM data. J. Appl. Meteorol. Clim. 2012, 51, 1867–1874. [Google Scholar] [CrossRef]
  20. As-syakur, A.R.; Tanaka, T.; Osawa, T.; Mahendra, M.S. Indonesian rainfall variability observation using TRMM multi-satellite data. Int. J. Remote Sens. 2013, 34, 7723–7738. [Google Scholar] [CrossRef]
  21. Rahman, S.H.; Debasis, S.; Ravichran, M. Variability of Indian summer monsoon rainfall in daily data from gauge and satellite. J. Geophys. Res. Atmos. 2009, 114, 767–773. [Google Scholar] [CrossRef]
  22. Dinku, T.; Ceccato, P.; Grover-Kopec, E.; Lemma, M.; Connor, S.J.; Ropelewski, C.F. Validation of satellite rainfall products over East Africa's complex topography. Int. J. Remote Sens. 2007, 28, 1503–1526. [Google Scholar] [CrossRef]
  23. Fleming, K.; Awange, J.L.; Kuhn, M.; Featherstone, W.E. Evaluating the TRMM 3B43 monthly precipitation product using gridded raingauge data over Australia. Aust. Meteorol. Oceangr. J. 2011, 61, 171–184. [Google Scholar]
  24. Chokngamwong, R.; Chiu, L.S. Thailand Daily Rainfall and Comparison with TRMM Products. J. Hydrometeorol. 2008, 9, 256–266. [Google Scholar] [CrossRef]
  25. As-Syakur, A.R.; Tanaka, T.; Prasetia, R.; Swardika, I.K.; Kasa, I.W. Comparison of TRMM multisatellite precipitation analysis (TMPA) products and daily-monthly gauge data over Bali. Int. J. Remote Sens. 2011, 32, 8969–8982. [Google Scholar] [CrossRef]
  26. Semire, F.A.; Mohd-Mokhtar, R.; Ismail, W.; Mohamad, N.; Mandeep, J.S. Ground validation of space-borne satellite rainfall products in Malaysia. Adv. Space Res. 2012, 50, 1241–1249. [Google Scholar] [CrossRef]
  27. Karaseva, M.O.; Prakash, S.; Gairola, R.M. Validation of high-resolution TRMM-3B43 precipitation product using rain gauge measurements over Kyrgyzstan. Theor. Appl. Climatol. 2012, 108, 147–157. [Google Scholar] [CrossRef]
  28. Feidas, H. Validation of satellite rainfall products over Greece. Theor. Appl. Climatol. 2010, 99, 193–216. [Google Scholar] [CrossRef]
  29. Prakash, S.; Mahesh, C.; Gairola, R.M. Comparison of TRMM Multi-satellite Precipitation Analysis (TMPA)-3B43 version 6 and 7 products with rain gauge data from ocean buoys. Remote Sens. Rev. 2013, 4, 677–685. [Google Scholar] [CrossRef]
  30. Nair, S.; Srinivasan, G.; Nemani, R. Evaluation of Multi-Satellite TRMM Derived Rainfall Estimates over a Western State of India. J. Meteorol. Soc. Jpn. 2009, 87, 927–939. [Google Scholar] [CrossRef]
  31. Yashon, O.O.; Owiti, T.; Kipkorir, E.; Kibiiy, J.; Tateishi, R. Multitemporal comparative analysis of TRMM-3B42 satellite-estimated rainfall with surface gauge data at basin scales: Daily, decadal and monthly evaluations. Int. J. Remote Sens. 2012, 33, 7662–7684. [Google Scholar]
  32. Zhang, Q.; Liu, Y.; Yang, G.; Zhang, Z. Precipitation and hydrological variations and related associations with large-scale circulation in the Poyang Lake basin, China. Hydrol. Process. 2011, 25, 740–751. [Google Scholar] [CrossRef]
  33. Liu, Y.; Wu, G.; Zhao, X. Recent declines in China’s largest freshwater lake: Trend or regime shift? Environ. Res. Lett. 2013, 8, 014010. [Google Scholar] [CrossRef]
  34. Canadell, J.G.; Steffen, W.L.; White, P.S. IGBP/GCTE terrestrial transects: Dynamics of terrestrial ecosystems under environmental change. J. Veg. Sci. 2002, 13, 298–300. [Google Scholar] [CrossRef]
  35. Finlayson, M.; Harris, J.; McCartney, M.; Young, L.; Chen, Z. Report on Ramsar Visit to Poyang Lake Ramsar Site, P.R. China. Report Prepared on Behalf of the Secretariat of the Ramsar Convention. 12–17 April 2010. Available online: http://www.ramsar.org/pdf/Poyang_lake_report_v8.pdf (accessed on 13–14 April 2010).
  36. Chiu, L.S.; Liu, Z.; Vongsaard, J.; Morain, S.; Budge, A.; Neville, P.; Bales, C. Comparison of TRMM and water district rain rates over New Mexico. Adv. Atmos. Sci. 2006, 23, 1–13. [Google Scholar] [CrossRef]
  37. China Meteorological Administration. Ground Meteorological Observation Standard; Meteorological Press: Beijing, China, 2003. [Google Scholar]
  38. National Meteorological Center of China Meteorological Administration. Complilation of 30-Year Conventional Climate Data and Their Statistics; Standards Press of China: Beijing, China, 2004. [Google Scholar]
  39. Gires, A.; Tchiguirinskaia, I.; Schertzer, D.; Schellart, A.; Berne, A.; Lovejoy, S. Influence of small scale rainfall variability on standard comparison tools between radar and rain gauge data. Atmos. Res. 2014, 138, 125–138. [Google Scholar] [CrossRef]
  40. Jaffrain, J.; Berne, A. Influence of the Subgrid Variability of the Raindrop Size Distribution on Radar Rainfall Estimators. J. Appl. Meteorol. Climatol. 2012, 51, 780–785. [Google Scholar] [CrossRef]
  41. Ebert, E.E.; Manton, M.J.; Arkin, P.A.; Allam, R.J.; Holpin, G.E.; Gruber, A. Results from the GPCP algorithm intercomparison programme. Bull. Am. Meteorol. Soc. 1996, 77, 2875–2887. [Google Scholar] [CrossRef]
  42. Behrangi, A.; Khakbaz, B.; Jaw, T.C.; AghaKouchak, A.; Hsu, K.; Sorooshian, S. Hydrologic evaluation of satellite precipitation products over a mid-size basin. J. Hydrol. 2011, 397, 225–237. [Google Scholar] [CrossRef]
  43. Romilly, T.G.; Gebremichael, M. Evaluation of satellite rainfall estimates over Ethiopian river basins. Hydrol. Earth Syst. Sci. 2011, 15, 1505–1514. [Google Scholar] [CrossRef]
  44. Gao, Y.C.; Liu, M.F. Evaluation of high-resolution satellite precipitation products using rain gauge observations over the Tibetan Plateau. Hydrol. Earth Syst. Sci. 2013, 17, 837–849. [Google Scholar] [CrossRef]
  45. Prakash, S.; Sathiyamoorthy, V.; Mahesh, C.; Gairola, R.M. An evaluation of high-resolution multisatellite rainfall products over the Indian monsoon region. Int. J. Remote Sens. 2014, 35, 3018–3035. [Google Scholar] [CrossRef]
  46. Ebert, E.E. Methods for verifying satellite precipitation estimates. In Measuring Precipitation from Space; Springer: Dordrecht, The Netherlands, 2007; pp. 345–356. [Google Scholar]
  47. Villarini, G.; Mandapaka, P.V.; Krajewski, W.F.; Moore, R.J. Rainfall and sampling uncertainties: A rain gauge perspective. J. Geophys. Res. 2008, 113, 3078. [Google Scholar] [CrossRef]
Figure 1. Geographical location of Poyang Lake basin and the spatial distribution of rain gauges.
Water 08 00281 g001
Figure 2. Scatter plots of monthly satellite products (Tropical Rainfall Measuring Mission (TRMM) 3B43, 3B42 and 3B42RT) versus monthly rain-gauge data at 0.25° × 0.25° pixel scale for the period from 1998 to 2007 (3B42RT: 2000–2007), with (a,b) for TRMM 3B43; (c,d) for TRMM 3B42; (e,f) for TRMM 3B42RT; (a,c,e) for reference data with Global Precipitation Climatology Centre (GPCC) reporting gauges; (b,d,f) reference data without GPCC reporting gauges.
Water 08 00281 g002
Figure 3. Scatter plots of TRMM 3B42 or 3B42RT versus rain-gauge data for the period from 1998 to 2007, with (a,b) for 0.25° × 0.25° pixel scale; (c,d) for 1° × 1° pixel scale; (e,f) for basin scale; (a,c,e) for TRMM 3B42; (b,d,f) for TRMM 3B42RT.
Water 08 00281 g003aWater 08 00281 g003b
Figure 4. Scatter plots of TRMM 3B43 versus rain-gauge data for the period from 1998 to 2007, with (a,b) for 0.25° × 0.25° pixel scale; (c,d) for 1° × 1° pixel scale; (e,f) for basin scale; (a,c,e) for monthly scale; (b,d,f) for annual scale.
Water 08 00281 g004aWater 08 00281 g004b
Figure 5. Comparison of validation indices for TRMM 3B43, 3B42 and 3B42RT at different spatial scale, with (a) for R2; (b) for normalized root mean squared error (NRMSE); (c) for normalized mean absolute error (NMAE).
Water 08 00281 g005
Figure 6. The relations between precipitation difference and rain rate at daily scale for TRMM 3B42, with (a,c) for June, July and August (JJA); (b,d) for December, January and February (DJF). (The interval for 0–20 mm·day−1 is subdivided into 0–1 mm·day−1 and 1–20 mm·day−1 for great value of relative error (RE) under 0–1 mm·day−1).
Water 08 00281 g006aWater 08 00281 g006b
Figure 7. The relations between precipitation difference and rain rate at daily scale for TRMM 3B42RT, with (a,c) for JJA; (b,d) for DJF. (the interval for 0–20 mm·day−1 is subdivided into 0–1 mm·day−1 and 1–20 mm·day−1 for great value of RE under 0–1 mm·day−1).
Water 08 00281 g007
Figure 8. The relations between precipitation difference and rain rate, with (a,c) for monthly scale; (b,d) for annual scale.
Water 08 00281 g008
Figure 9. The distribution of histogram of E, with (a,c) for TRMM 3B42; (b,d) for TRMM 3B42RT; (e,f) for TRMM 3B43.
Water 08 00281 g009aWater 08 00281 g009b
Figure 10. Monthly averaged statistical indices at pixel scale and basin scale, including R2, NRMSE and NMAE.
Water 08 00281 g010
Figure 11. Spatial distribution of statistical indices at monthly scale, including R2, NRMSE and NMAE.
Water 08 00281 g011
Figure 12. Scatter plots of statistical indices versus elevation for TRMM 3B43, with (a) for R2; (b) for RMSE.
Water 08 00281 g012
Table 1. Validation statistics comparing satellite rainfall estimates with gauge data at the annual scale.
ProductsTRMM 3B43TRMM 3B42TRMM 3B42RT
0.25°Basin0.25°Basin0.25°Basin
R20.800.850.960.790.850.960.590.670.83
RMSE193.76178.48103.76186.18168.4395.10276.88261.37186.48
MAE152.83141.4690.18146.18132.0379.60215.13201.25156.60
ME90.18114.9490.1869.6996.1377.00127.72168.53152.26
NRMSE11.5210.766.1711.0910.165.6617.4116.6611.72
NMAE9.098.535.368.717.964.7413.5212.839.85
Bias5.366.935.364.155.804.598.0310.749.57

