1. Introduction
Multi-stresses of decreasing water availability, increasing water demand and water pollutant discharge have resulted in worldwide issues of water scarcity and pollution [
1]. Decision-makers and researchers are seeking solutions to these issues to support sustainable socioeconomic development [
2]. However, they are confronted with the challenge of selecting significant assessment indicators as decision variables for policy proposals [
3]. In order to propose effective socioeconomic and environmental policies oriented towards mitigating water scarcity and pollution, a detailed analysis and follow-up of the economic-environmental system need to be carried out. As a systematic and sophisticated approach, an input-output (I-O) model can facilitate quantitative analysis of complex interdependencies of economic activities, environmental impacts induced and various resources consumed [
4,
5,
6]. Some assessment indicators (such as footprint and linkages) combined with an I-O framework have the potential to provide critical support for policy-making [
7].
As a consumption-based indicator, the water footprint (WF), initially developed by Hoekstra and Hung [
8], is closely linked to the virtual water (VW) concept proposed by Allan [
9]. WF is the total volume of water needed during production processes, accounted over the whole supply chain [
7,
10]. It can measure the direct and indirect water use of an individual, business, region or a nation through consumption of commodities and services [
11]. VW is defined as the total volume of water required to produce a unit commodity or service [
9]. It can be used to recognize products that have more influence on the water resource system and provide a way of water saving [
12]. The main difference between the concepts of WF and VW is that the former is defined from the perspective of consumption and the latter is defined from the perspective of production [
13].
Generally, there are two approaches to calculating VW and WF: bottom-up and top-down [
14]. The bottom-up approach based on detailed process information has been widely used to analyze the VW of products and WF of one process or within a certain geographical region [
8,
15,
16,
17,
18]. However, this approach fails to distinguish intermediate water use from final water use [
13]. Conversely, the top-down approach moves from the highest level to the lower level according to the boundaries of a defined system and subsystem [
7]. The I-O model initially developed by Leontief [
19], a top-down technique, has been extensively applied to assess VW and WF, as well as sectoral water use on a regional or national scale [
20,
21,
22,
23,
24,
25,
26,
27,
28,
29]. Due to the high level of aggregation, the I-O technique is not adept at providing detailed calculation of a specific technique or product [
13].
As one of the components of WF, the grey water footprint is used in order to express water pollution in terms of a volume polluted, so that it can be compared with water consumption [
30]. When dealing with total water pollution control issues, we usually focus on the kind and amount of pollutants (with the unit as ton or kilogram) discharged into the environment [
31,
32], which the grey water fails to provide specifically. Therefore in this paper, we newly introduce the water pollutant footprint (WPF) that denotes the total amount of a certain kind of pollutant discharged within the whole supply chain. Additionally, we define the regional WPF as the amount of water pollutants discharged directly or indirectly, to produce a unit commodity or service consumed by the inhabitants in a certain area. The same as the notion of VW, the virtual water pollutant (VWP) is newly introduced and set as water pollutants discharged to produce a unit commodity or service.
Recently, some contributions have found that the concepts of WF and VW alone are not sufficient to support policy-making on optimal strategies regarding water uses, without analysis of other related factors on water use decisions [
7,
33,
34,
35,
36]. Thus, this paper initially combines WF and VW with inter-sectoral linkages to perform an integrated analysis aimed at tackling water scarcity and pollution while considering economic development [
37]. Given today’s increasingly pressing environmental problems, linkage analysis has been expanded to address emissions of carbon dioxide and air pollutants [
38,
39], water pollution [
40,
41,
42] and water use [
38]. The backward linkage (BL) and forward linkage (FL) are effective in clarifying the economic structure in terms of water use and water pollutant discharge (WPD). Thus, they are capable of identifying the key sectors that have the greatest influence on the economy, water pollution and water use.
In this study, we originally propose a definition of an indicator package that includes WF, WPF, VW, VWP, BL and FL (in terms of the economy, WPD and water use). The indicator package is intended to quantitatively analyze the water environment-economy system and provide a theoretical basis for the selection and determination of feasible policies on water pollution and scarcity mitigation and industrial restructuring. An environmental extended I-O model will be constructed and employed to calculate regional WF and WPF, and VW and VWP in trade flows. The results are expected to orient where the policies should be implemented. Considering the feasibility of policy implementation and actual economic development, BL and FL will be utilized to assess the backward and forward effects of production, water use and WPD, associated with inputs and outputs of industrial sectors. Through identifying industrial groups (constrained and encourage groups), inter-sectoral linkage analysis provides information on reducing water use and WPD in a way of industrial restructuring without affecting the economy substantially. The outcomes of these analyses along with some regulations are expected to provide reliable policy instruments used in an integrated optimization simulation model [
6,
43].
2. Materials and Methods
Water use and water pollutants discharged in economic activities can be calculated by physical water and pollutant accounting vectors, which are incorporated in an environmental extended hybrid I-O model. Water use in this study refers to freshwater consumption (FC), excluding water loss in transmission and reused water in the production processes.
2.1. Total Freshwater Consumption and Water Pollutant Discharge
Supply and demand of commodities and services in traditional I-O table can be expressed as [
44]:
where
X is total output of sectors (vector),
Y is final demand (vector);
is input coefficients (matrix);
(I − A)−1 is the Leontief inverse matrix, whose element α
ij denotes the direct and indirect requirements for sector
i to satisfy the increase in final demand of sector
j by one unit.
The direct or the first round effects of sectoral interaction in the economy on FC and WPD can be explained by the direct coefficients of FC and WPD:
where
is the direct coefficient of
s, and superscript
s denotes the category (1 = FC, 2 = WPD, the same as in the following context);
is the amount of freshwater consumed (
s = 1) or water pollutants discharged (
s = 2) by sector
j;
Xj is total output of sector
j.
For the combination of direct and indirect FC and WPD, total FC multipliers and total WPD multipliers are calculated by:
where
Ts is total FC (
s = 1) or total WPD (
s = 2) of sectors in the economy (vector);
is the diagonal matrix of the direct coefficients of
s.
Another area of interest to investigate is the “drag” effect on FC and WPD. An accounting multiplier is introduced to clarify the contributions of direct FC and WPD.
where
is the direct influence indicator of total FC (
s = 1) or total WPD (
s = 2).
2.2. Freshwater and Water Pollutant Footprints
Exploration of the solutions to water scarcity and pollution is often region or river basin-based. Thus, in this study, regional freshwater footprints (FWF, focusing on blue WF) and WPF are calculated within the I-O framework to provide potential dimensions for proposing policies. The total freshwater footprint of one region is composed of internal and external freshwater footprints [
45]. The component of total WPF is set in the same way as total FWF. Net imported VW and VWP will also be analyzed to clarify the VW and VWP embodied in trade flows. For disposing the import column in the I-O table, we assume that the I-O structure of imports (from other regions) are the same as domestic products [
20], and domestic supplies and imports are decomposed into two rows as shown in
Table 1.
Based on the decomposed I-O table, the new balance equations are display as:
where
is the output of sector
i,
is the imports in monetary flow of sector
i,
denotes the intermediate input of domestically produced commodities and services from sector
i to sector
j,
is the imports from sector
i abroad to domestic sector
j,
denotes the domestic consumption of domestically produced products of sector
i,
is the imports from sector
i abroad to domestic consumption of final demand,
is the exports of domestically produced products from sector
i,
denotes the imports from sector
i abroad to the domestic country for re-exportation.
The internal FWF and internal WPF are defined as the use of domestic water resources and water pollutants discharged to produce the commodities and services consumed in the target area, respectively [
21,
45]. Thus, in order to calculate internal FWF and internal WPF, the direct input coefficient of traditional I-O model needs to be decomposed as:
where
Ad is the domestic input coefficient matrix for domestically produced commodities and services, and
Am denotes the imported input coefficient matrix. According to the Import Proportionality Assumption [
46,
47], imported products are substitutes for domestic products and are proportional in domestic use for intermediate use or final deliveries.
Am and
Ad are then calculated as:
where
is a diagonal matrix of vector
R that denotes the import portion of direct input coefficient.
ri is the element of vector
R. The internal FWF and internal WPF can be calculated by:
where
denotes internal FWF (
s = 1) or internal WPF (
s = 2) (vector);
Fd is the vector of domestic consumption of domestic produced products and its element is
as in
Table 1.
The external FWF is defined as freshwater required in other regions to produce commodities and services imported and consumed in the target area [
21]. It is equal to the VW imported into the target area minus the amount of VW exported to other regions or countries as a result of re-export of imported products [
20,
45]. The concept of external water pollutant footprint is set in the same way as external FWF. Thus, external water footprints and water pollutant footprints can be displayed as:
where
indicates external FWF (
s = 1) or external WPF (
s = 2) (vector);
M denotes import in monetary flow (vector), and its element is
mi as in
Table 1.
Me is the vector of re-export of imported products and its element is
as in
Table 1.
Therefore, total FWF and total WPF of the target area (
) can be represented by:
Net imported VW and VWP are calculated by the VW and VWP embodied in trade flows. They can be calculated by:
where
indicates net imported VW (
s = 1) or VWP (
s = 2) (vector);
E denotes the vector of export in monetary flow and its element is
ei:
where
ei is the total export of sector
i in monetary in traditional I-O table.
2.3. Inter-Sectoral Linkges
Quantitative indicators of FWF, WPF, VW and VWP in trade flows are able to provide some potential suggestions for industrial restructuring and rearrangement of trades to mitigate water pollution and scarcity. However, effective strategies cannot be determined by focusing on water and pollutants alone without considering the economy. BL and FL can explore which sectors have greater influence on the economy, environment and resources. BL of the I-O model (
) illustrates the output of all sectors generated from unit final demand of sector
j; and FL (
) illustrates the effect on output of all sectors of unit change in primary inputs for sector
i [
48].
where
βij denotes each element of
(I − B)−1, a matrix defined in the supply-side of the I-O model [
49], in which
;
and
are relative productive backward and forward linkage coefficients, respectively.
In terms of FC and WPD, backward linkages are displayed as the capacity of sector
j to influence FC and WPD of the sectors providing inputs to sector
j, respectively; and forward linkages are expressed as the capacity of sector
i to stimulate production of other sectors and therefore FC and WPD [
21,
48].
where
denotes BL of FC (
s = 1) or WPD (
s = 2);
is FL of FC (
s = 1) or WPD (
s = 2);
denotes the element of
;
is the element of row vectors of the direct coefficient of
s;
is the element of column vectors of the direct coefficient of
s.
On the basis of such indicators, normalized measures have been developed to determine the key sectors. Relative backward and forward linkage coefficients of FC and WPD can be defined as:
If
> 1, it means that a unit increase in the final demand of sector
j will generate an above-average increase in
s of all sectors in the entire economy. Similarly,
> 1, a unit increase in the availability of primary inputs to sector
i will lead to an above-average increase in
s of sector
i. Accordingly, if
> 1 and
> 1, this sector can be recognized as a key sector for
s; therefore, it will influence the whole FC and WPD processes in the economy to a great extent. In contrast, if
< 1 and
< 1, this sector can be recognized as a non-significant sector for
s [
21].
2.4. Empirical Study
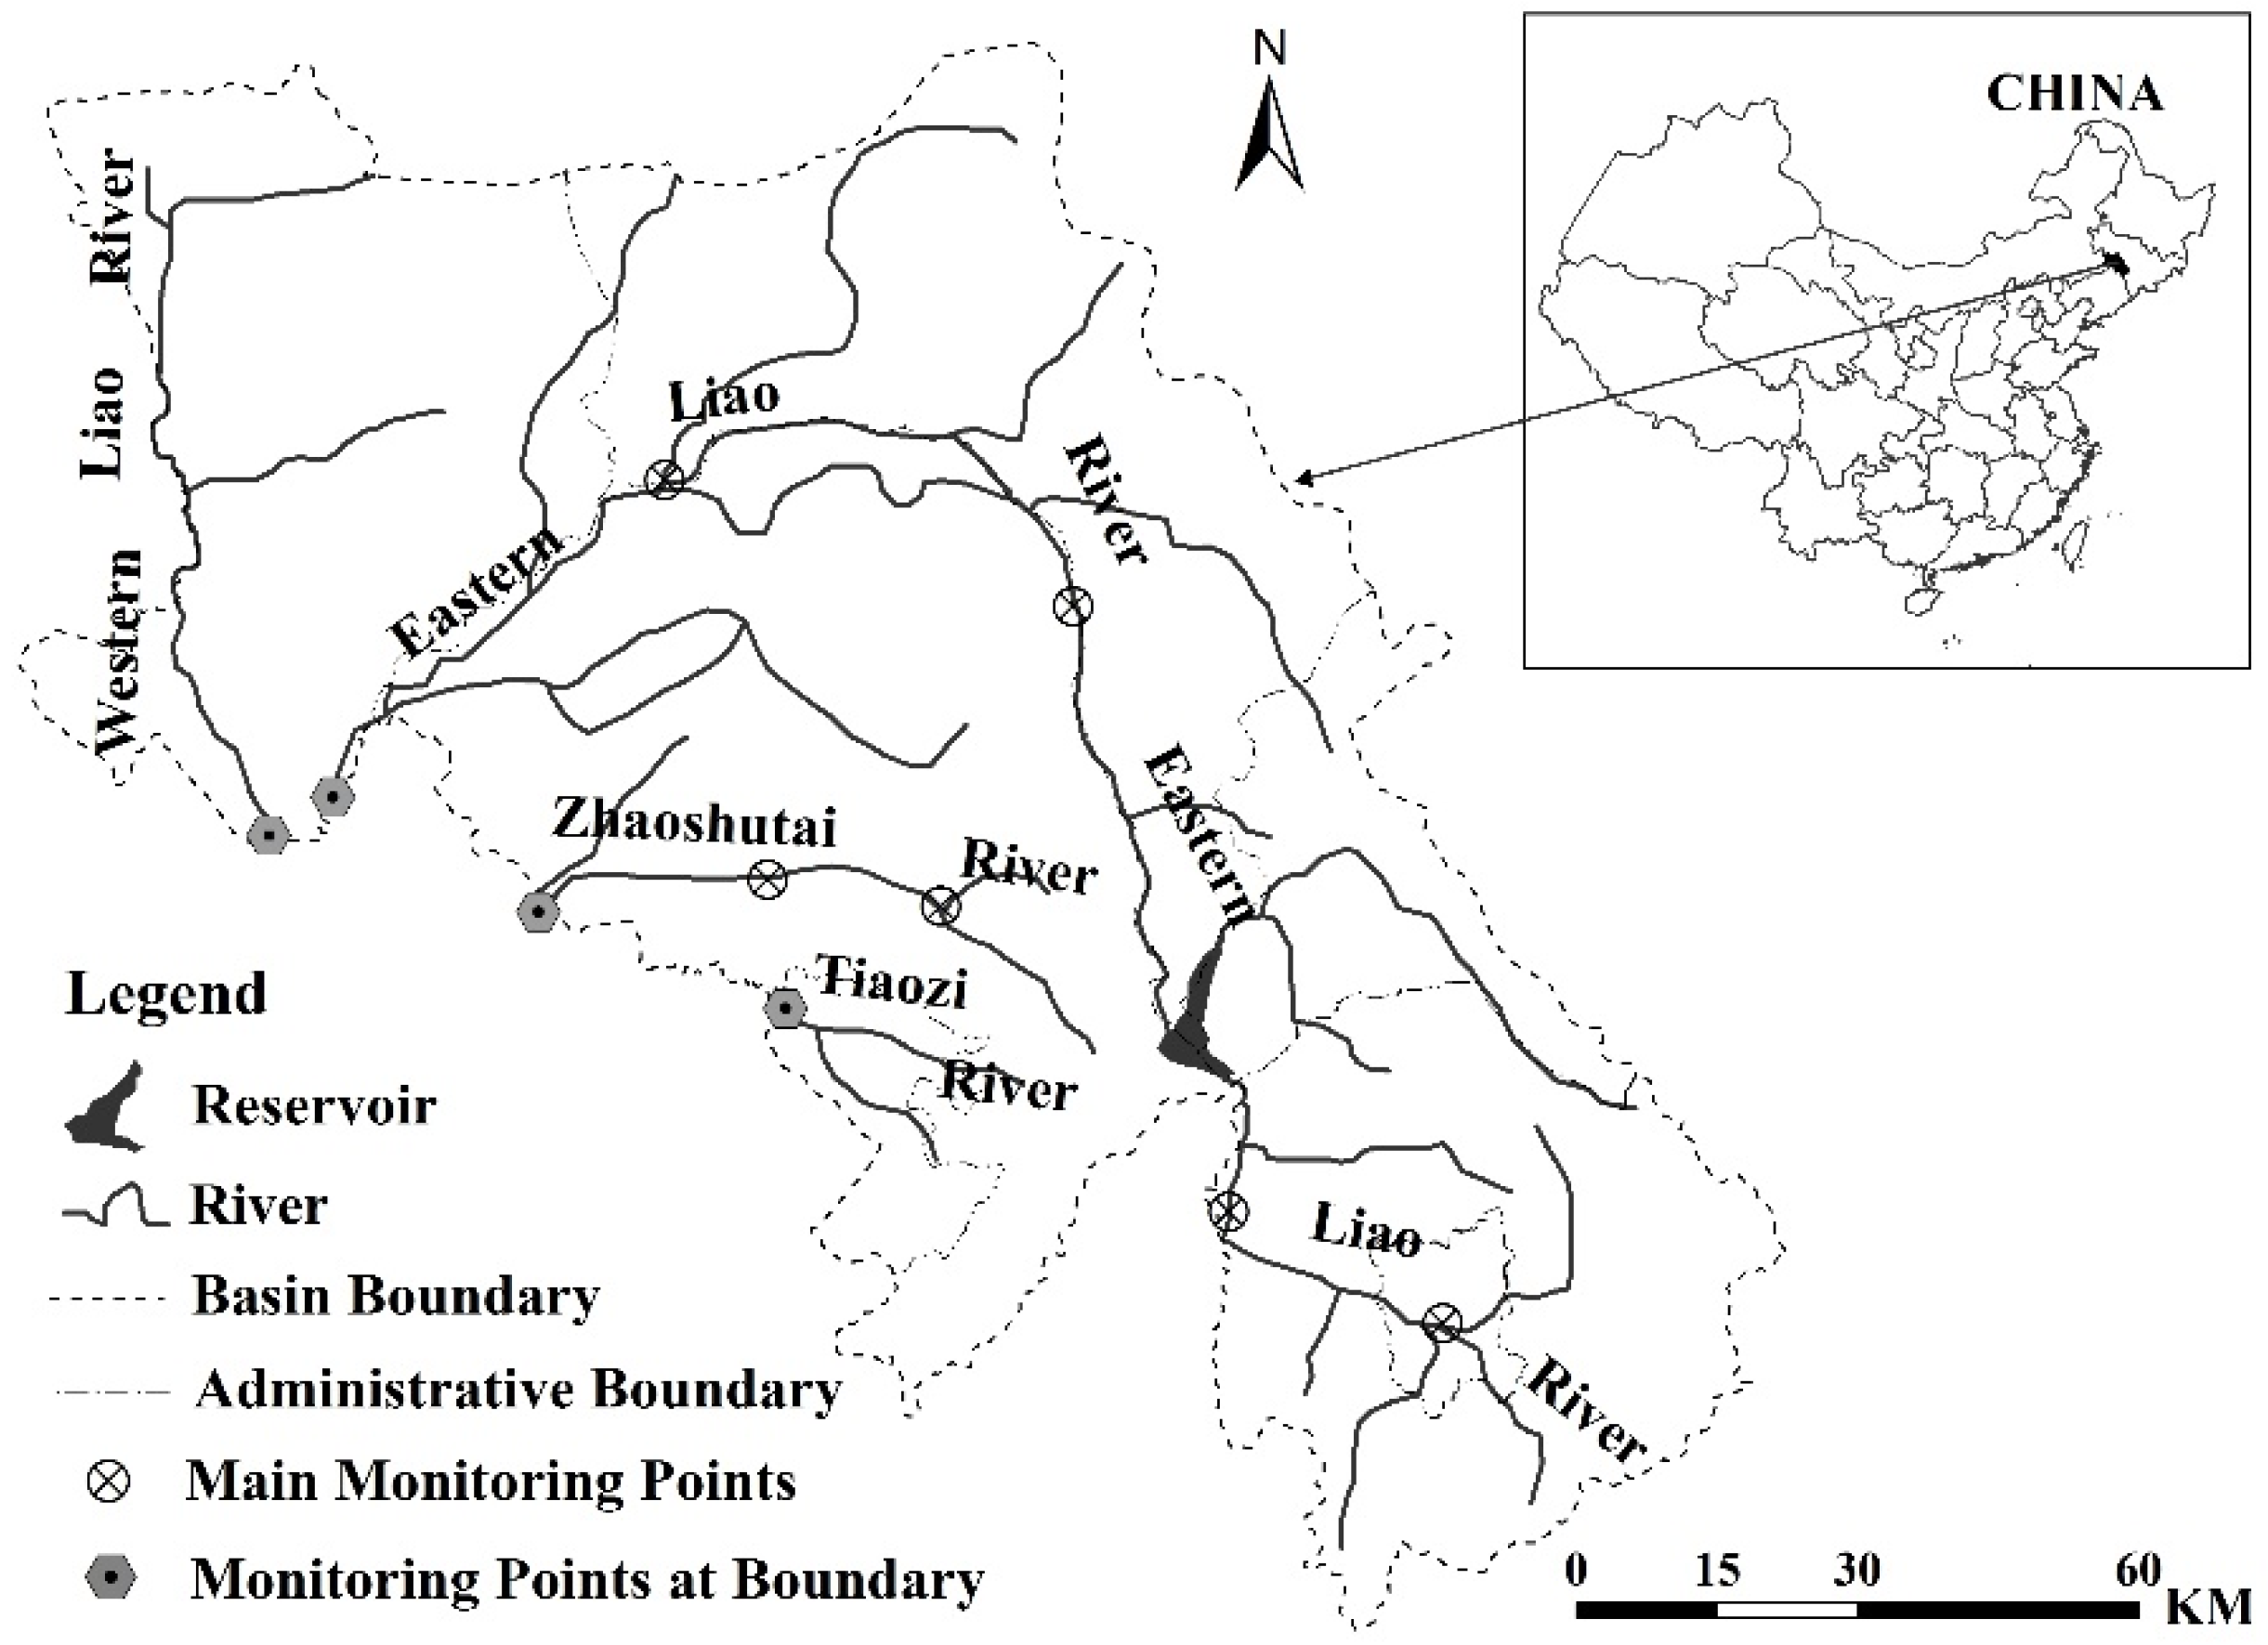
The Source Region of Liao River (SRLR), characterized by water scarcity and heavy water pollution (mainly organic pollution), was selected as the empirical target area. SRLR, located in northeastern China, is a core area for commodity grain production and livestock and poultry breeding of Jilin Province (
Figure 1). It covers an area of 14,288 km
2 with 4 main rivers providing surface water for a population of 3.61 million (in 2010). SRLR has been undergoing rapid economic development without appropriate and effective water environmental management instruments [
43]. As a result, the water quality is seriously deteriorating without meeting the requirements of surface water function zoning [
6]. SRLR is also facing the challenge of water scarcity with a capita water resource of 619 m
3, which is only 1/4 of the national level. The exploitation of surface water resources exceeds 80% of all surface water of SRLR, much larger than the international exploitation cordon of river water resources (40%). Furthermore, due to the shortage of available surface water, the groundwater has been overexploited for irrigation and manufacturing [
50]. The low water availability is limiting regional sustainable socioeconomic development [
43].
According to data accessibility for FC and WPD, the characteristics of the economic structure of SRLR, and the updating cycle of the I-O table in China, an 11-sector I-O table aggregated based on the Jilin I-O extension table of 2010 has been newly compiled for SRLR. Essential data for construction of regional I-O table including production, consumption, investment, import, export and capital stock are collected and calculated based on the Statistical Yearbook of Jilin Province, Siping City and Liaoyuan City [
51,
52,
53]. The classification of industrial sectors is displayed in
Table 2. In this study, total nitrogen (TN), total phosphorus (TP) and chemical oxygen demand (COD) are used as water pollution indicators considering the organic pollution characteristics of SRLR. The data of the treatment and discharge of domestic sewage and industrial wastewater are obtained from the Environmental Statistics Data of Liaoyuan and Siping [
54,
55]. Water pollutant discharge coefficients are also calculated with Environmental Statistical Data [
54,
55]. The FC data for each sector are extracted and calculated based on the Siping and Liaoyuan Water Bulletins [
56,
57]. The FC and WPD coefficients for one person in daily life have been determined with reference to Domestic Emission Coefficients in China [
58] and Environmental Statistical Data [
54,
55].
3. Results
3.1. Total FC and WPD
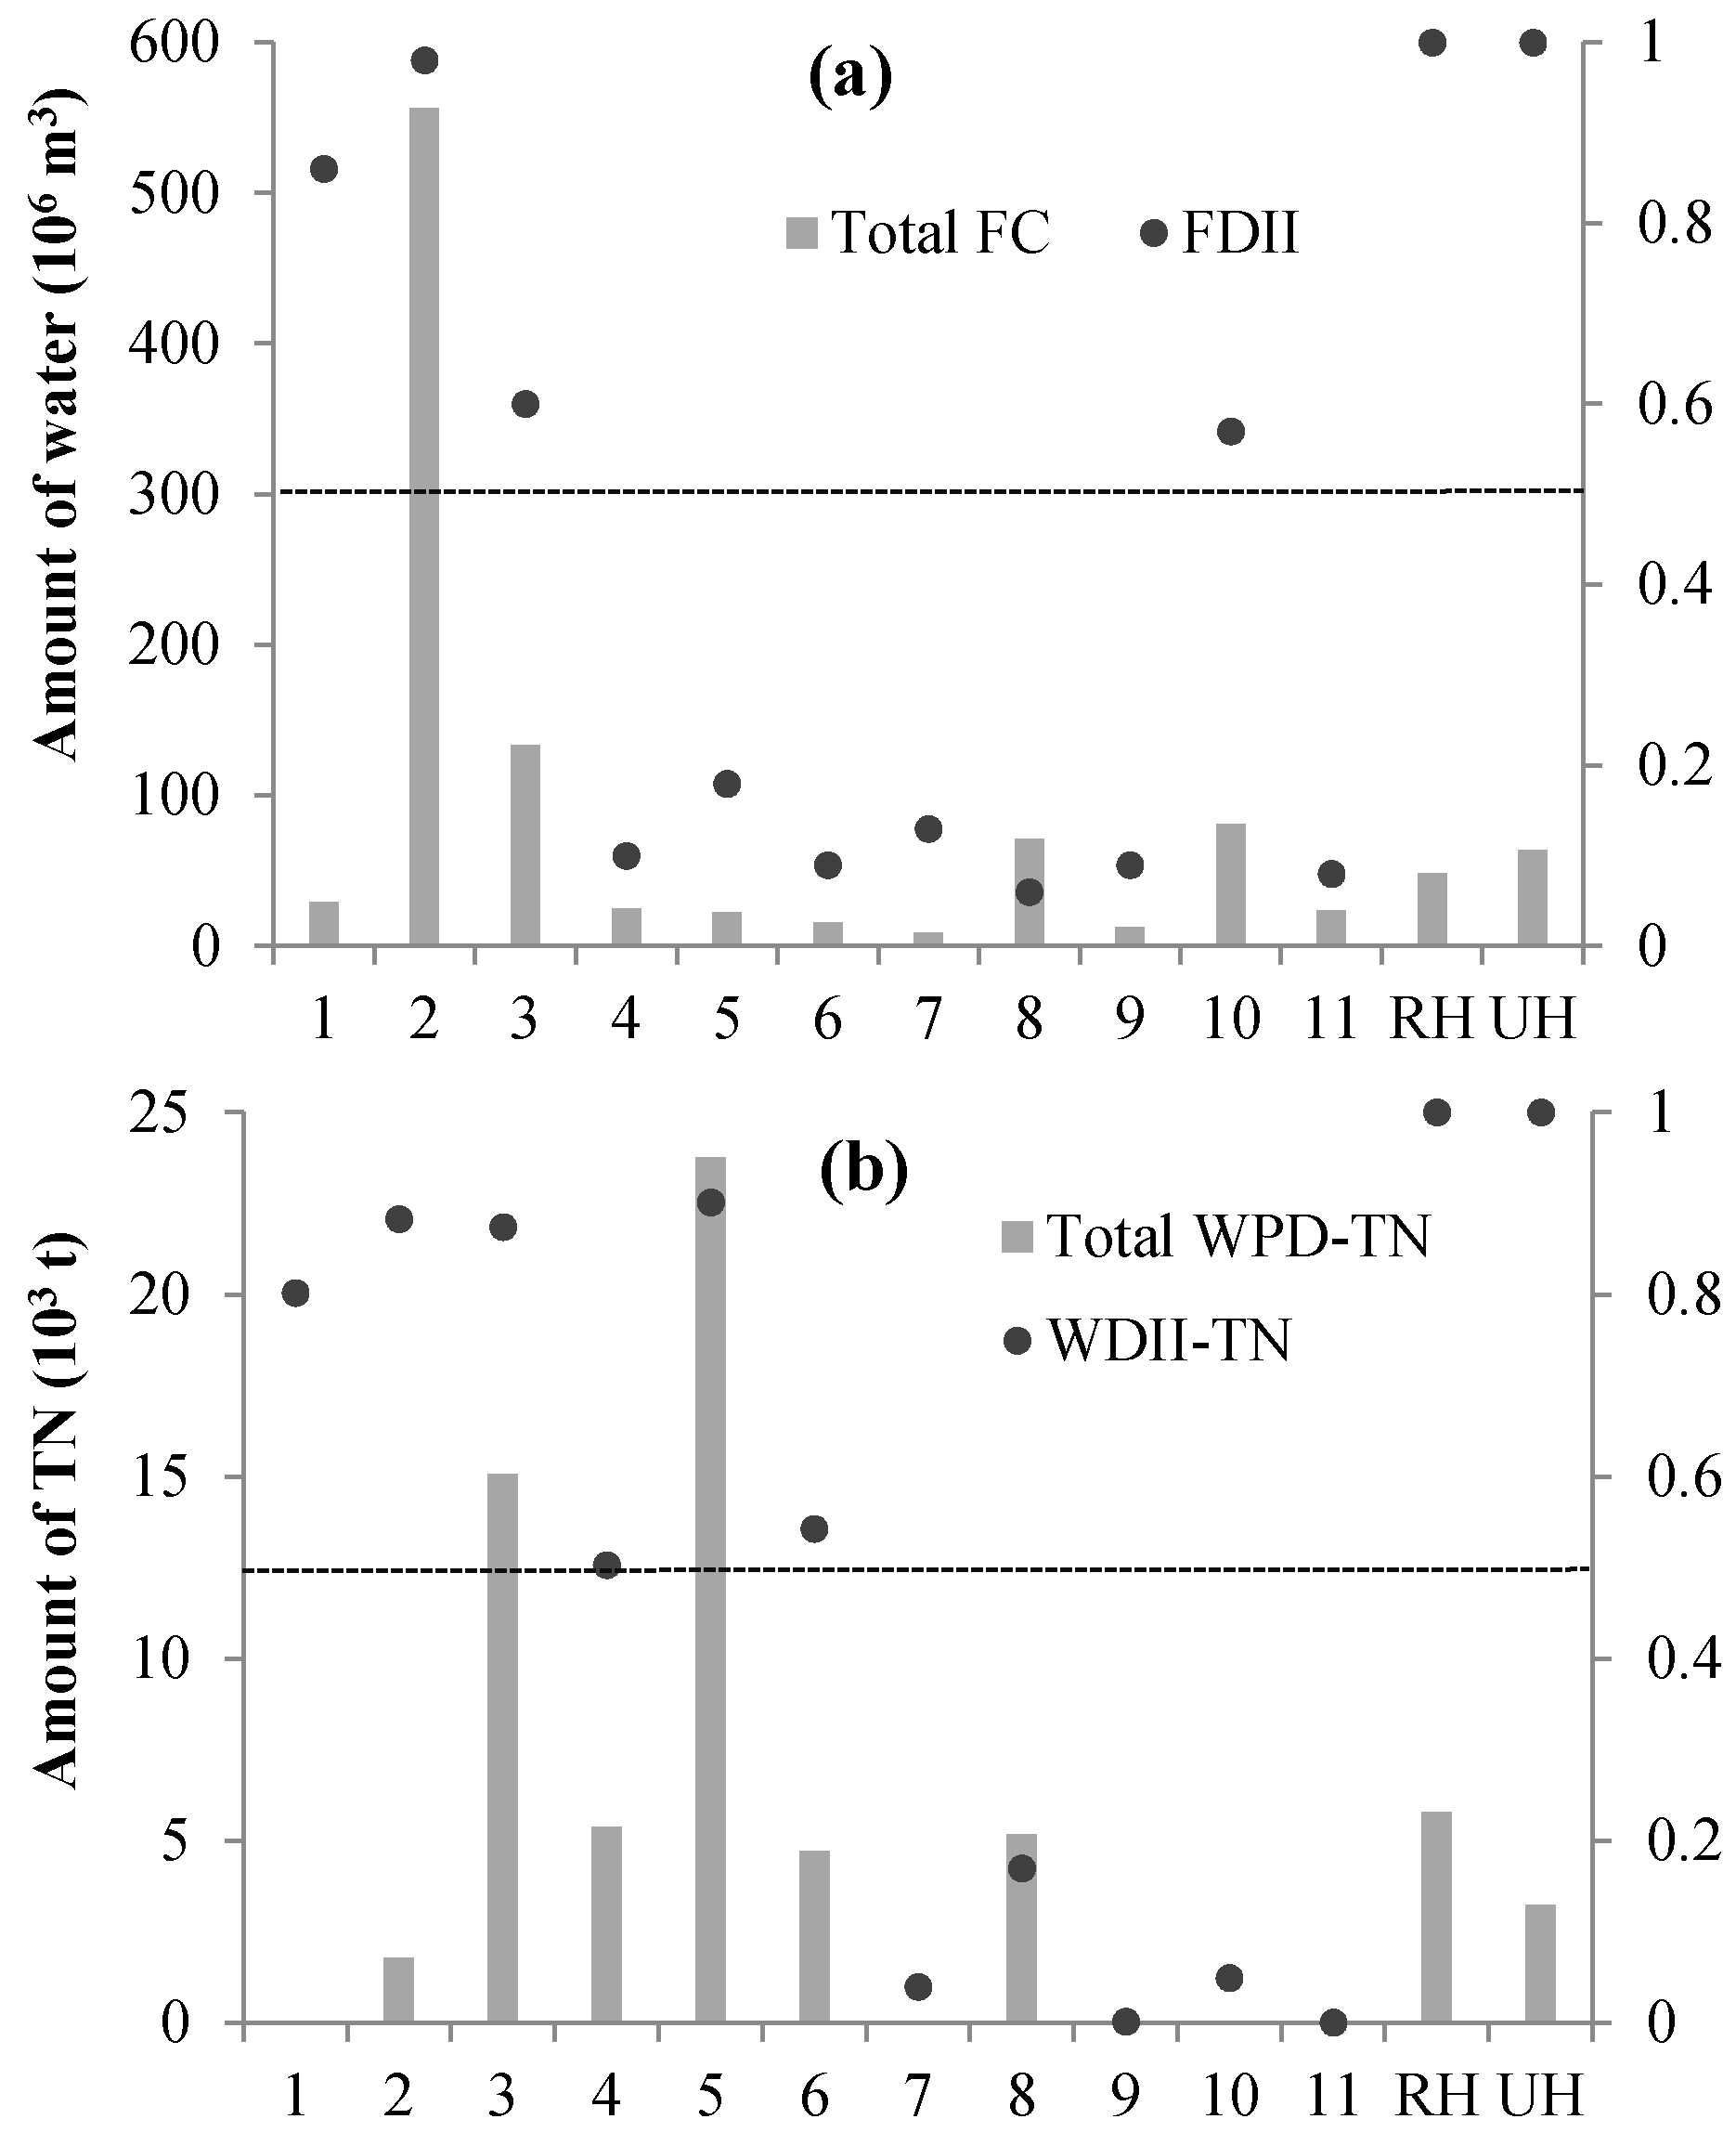
Total FC and WPD that denote the final demand of FC and WPD including direct and indirect dimensions depict a holistic picture of the FC and WPD of SRLR (see Formula (4) and
Figure 2).
Growing of rice contributes to the most FC accounting for 51.04% followed by
growing of cereals,
leguminous crops and others,
production and supply of electricity, gas and water (
PSEGW) and
manufacturing. For WPD,
growing of cereals,
leguminous crops and others, breeding industries (sector 4–6 in
Table 2) and
manufacturing are major contributors. Urban and rural households should be focused on as important WPD sources. In particular, rural household is characterized by diffuse pollution, which is more difficult to control compared with point source pollution.
Further analysis on the direct and indirect effects of FC and WPD needs to be undertaken. The direct influence indicator of the total FC of
fishery, farming industries (sector 2–3 in
Table 2) and
PSEGW are larger than 0.5 (see Formula (5) and
Figure 2), indicating that direct water input for production is larger than indirect water input, which is embedded in products as inputs for these sectors. Other sectors reflect opposite conditions. Specifically,
breeding of pigs is taken as an example to give further explanation. A large amount of grain is needed by
breeding of pigs, which can be calculated by the input coefficient. Farming industries have relatively larger FC coefficients. Thus, the amount of indirect FC is much larger than that of direct FC. Similarly, the component of total FC in other sectors can be understood by reference to the input coefficients and FC coefficients (see
Table A1) of industrial sectors. From the distribution of the direct influence indicator of total WPD of all sectors in
Figure 2 (Formula (5)), it can be concluded that direct discharge of TN, TP and COD during production processes of
fishery, breeding and farming industries (sector 2–6 in
Table 2) account for more than 50% of total WPD. For other sectors like
mining,
construction and
transportation and service, total WPD is mostly contributed by indirect WPD through using the products provided by other sectors with relatively higher WPD coefficients.
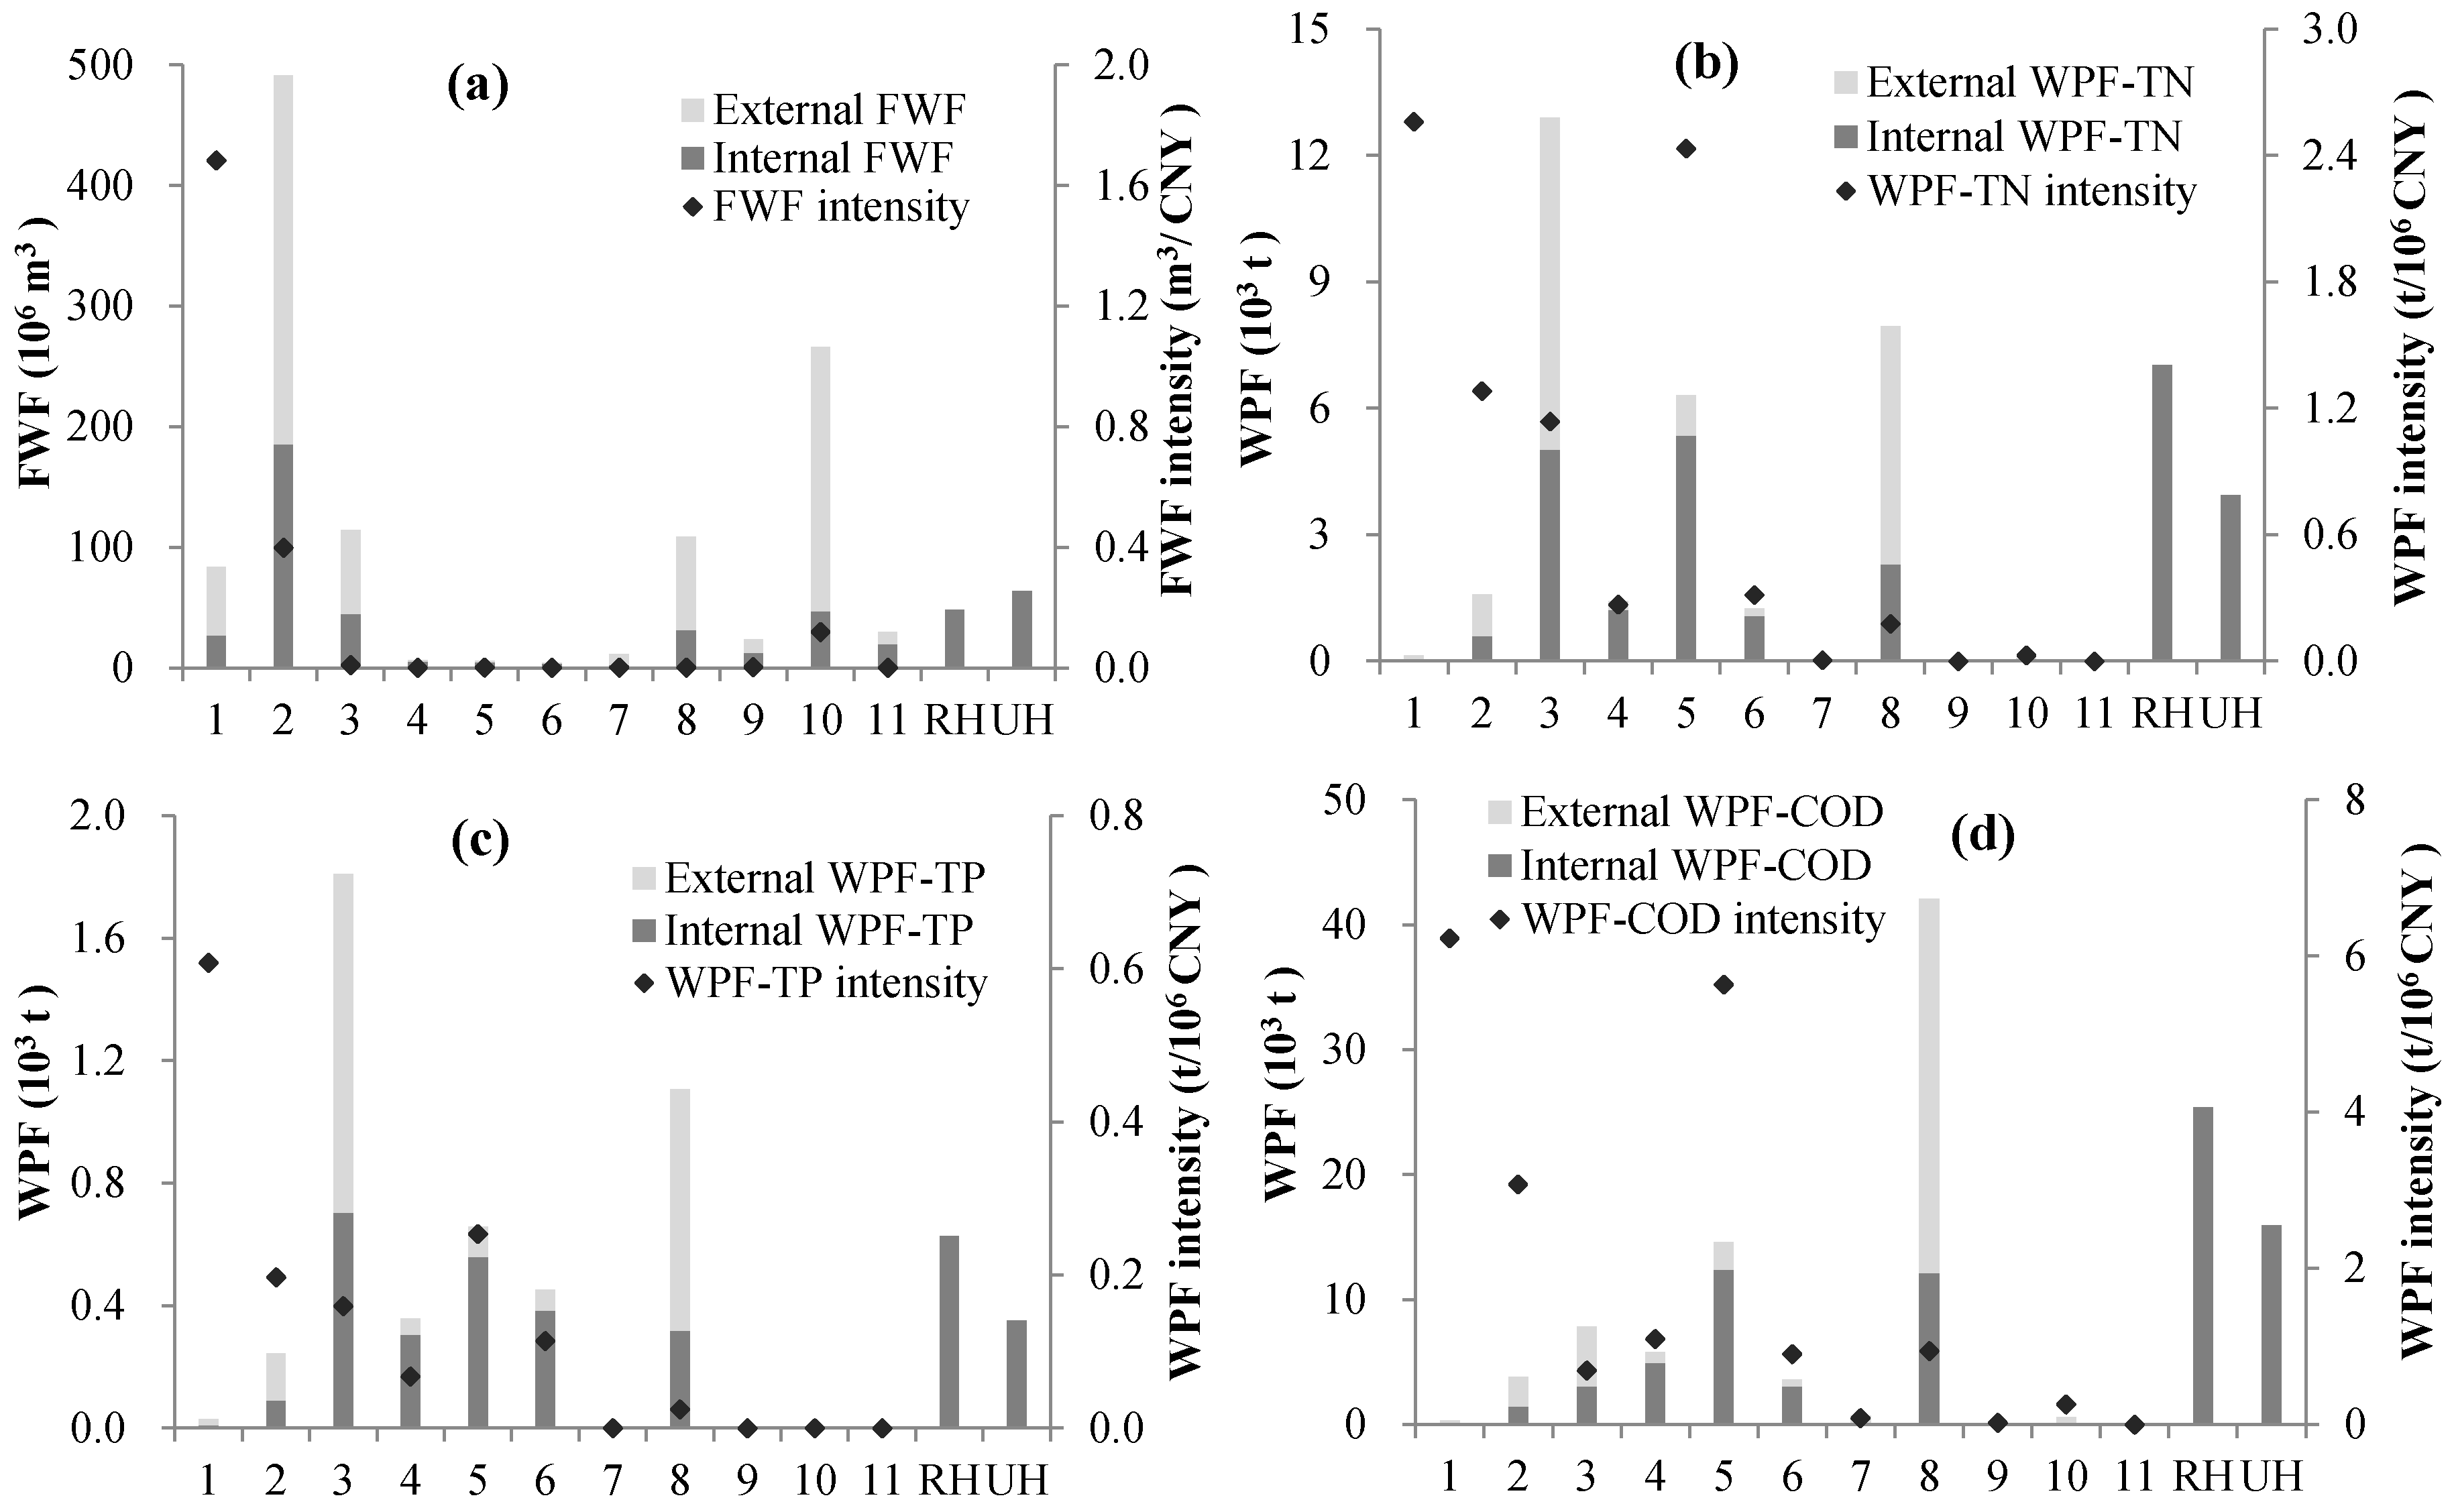
3.2. Footprints of FC and WPD
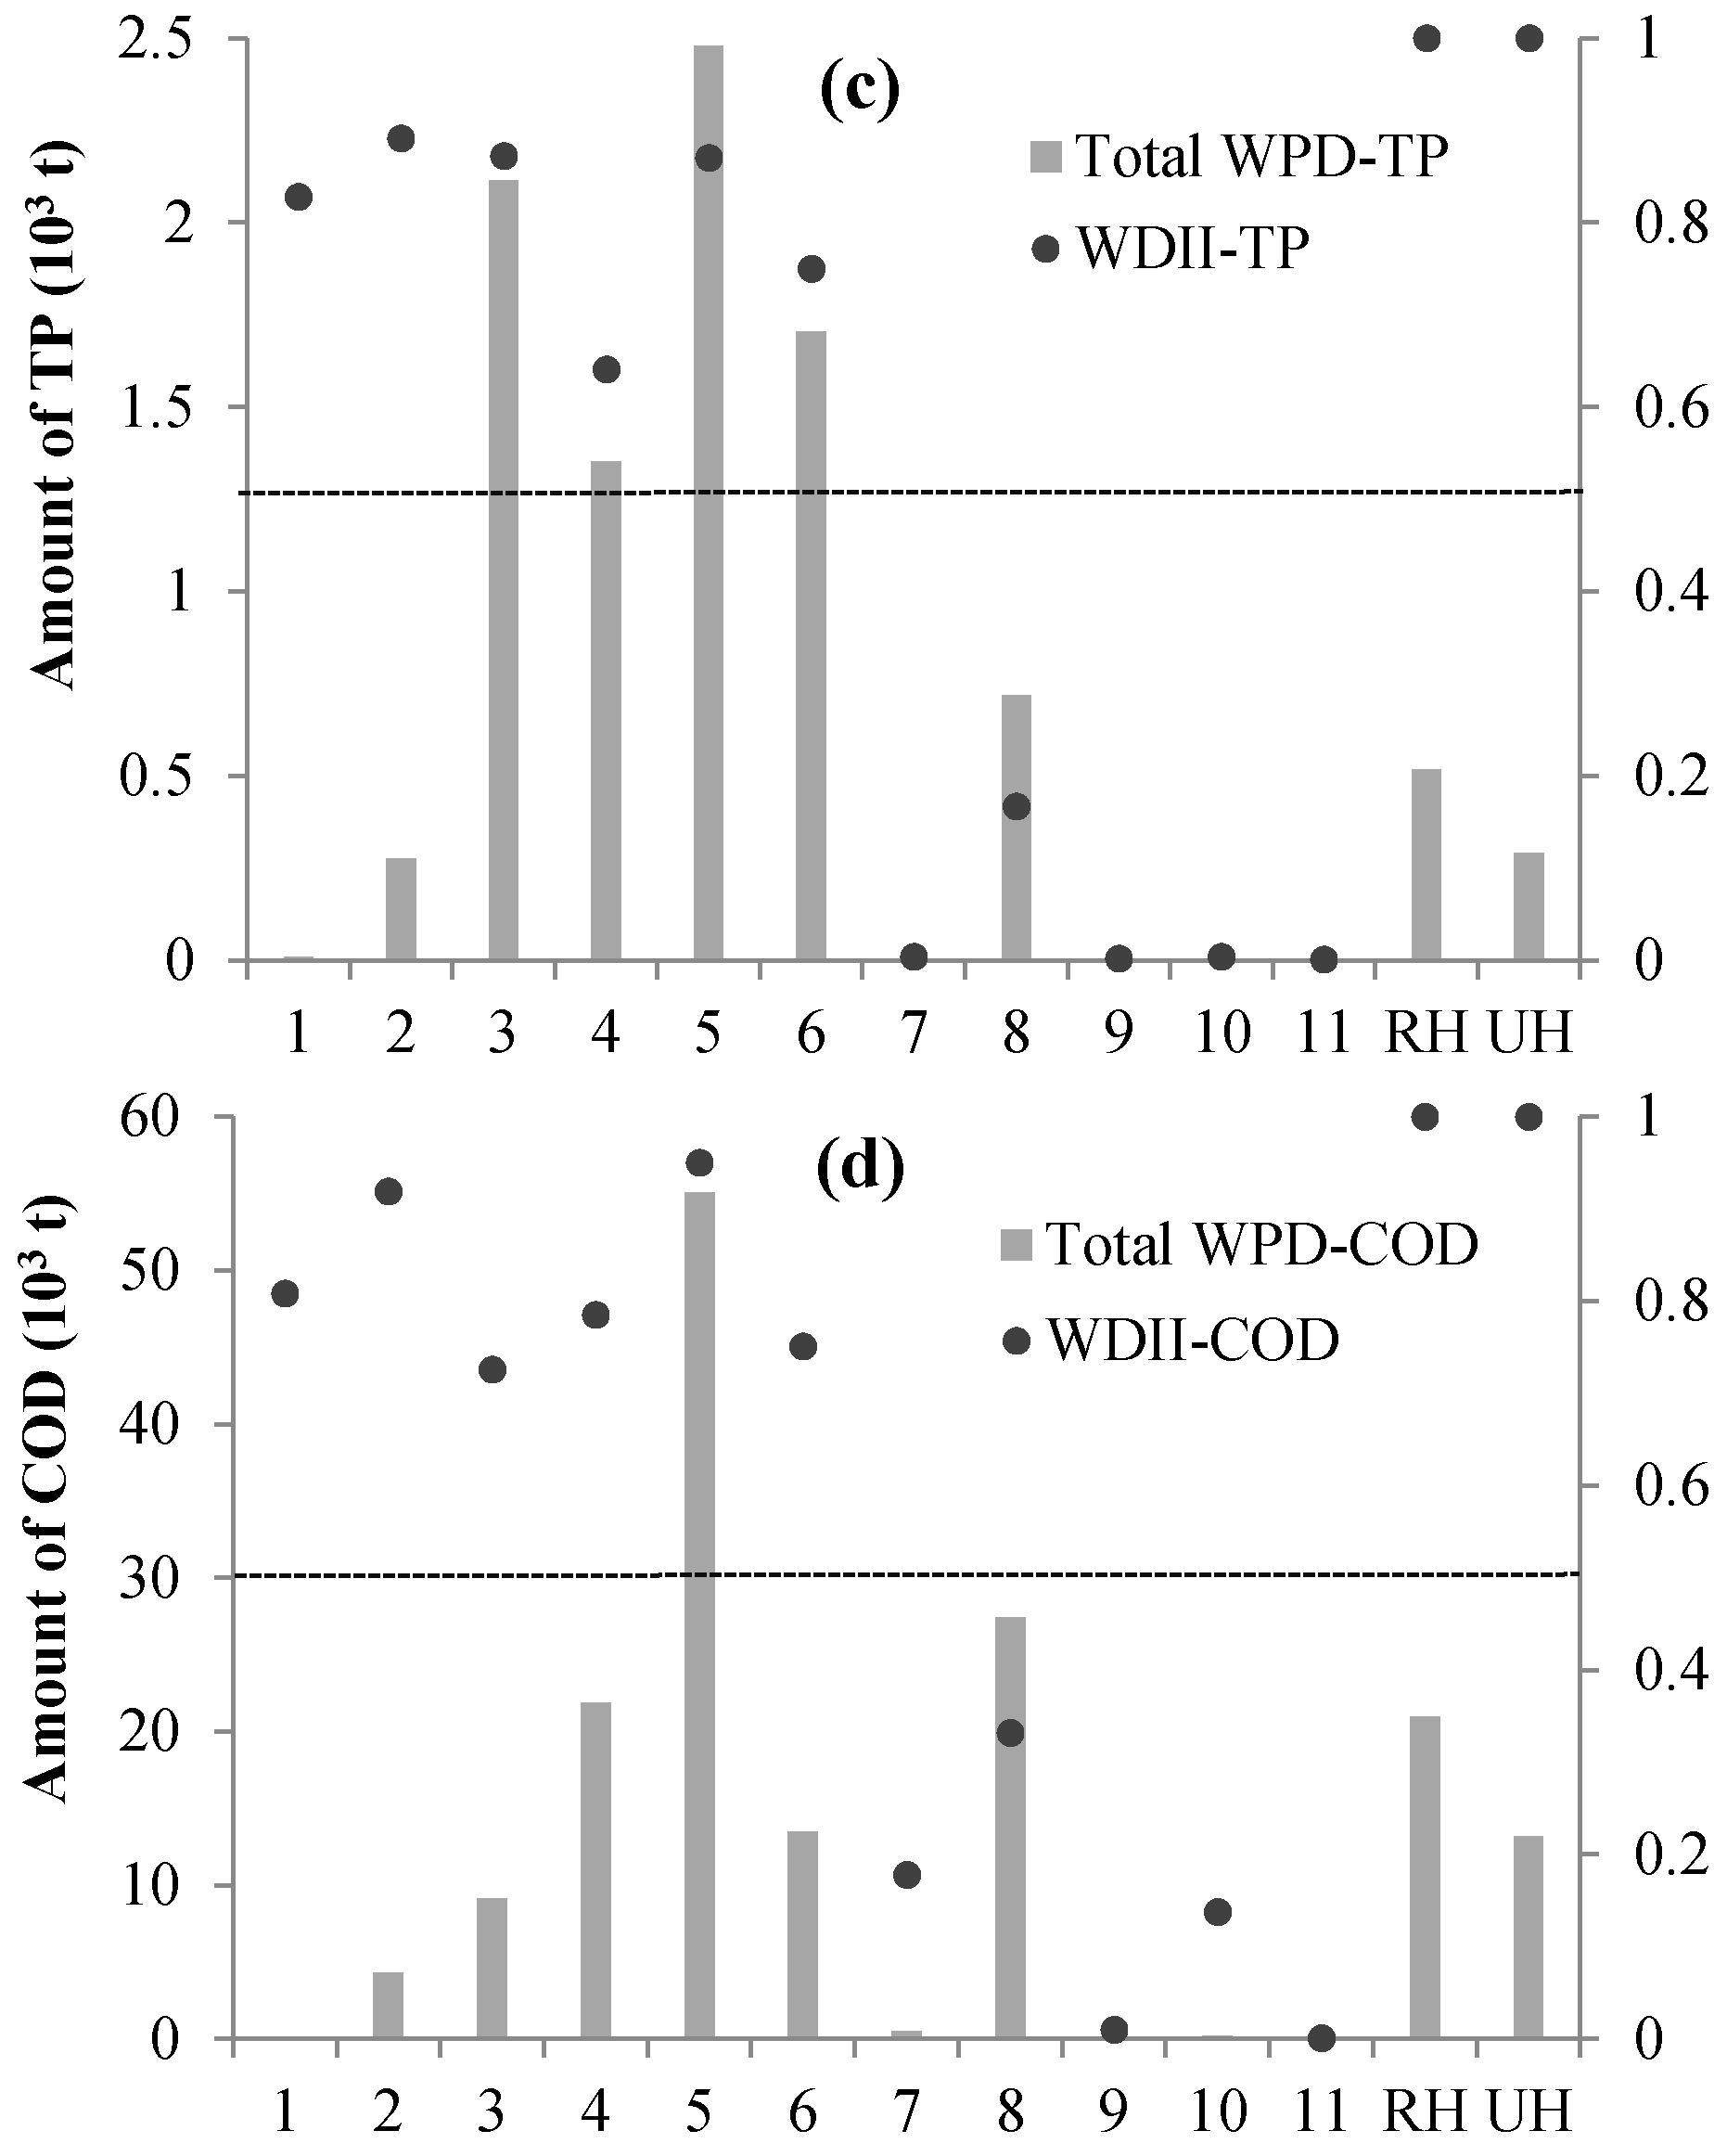
The introduction of regional footprints of FC and WPD is used to calculate FC and WPD during production processes of products to meet domestic final demand (Formulas (6)–(16)). Total FWF and total WPF (in terms of TN, TP and COD) of the target area in 2010 are 1258.05 × 10
6 m
3, 42.63 × 10
3 t, 5.64 × 10
3 t and 120.78 × 10
3 t, respectively. Farming industries,
PSEGW and
manufacturing have relatively higher internal FWF and external FWF (see
Figure 3). These sectors with relatively larger FC coefficients contribute to the most total FWF in the economy. Total WPF of COD of
manufacturing is the largest among all sectors followed by
breeding of cattle;
growing of cereals,
leguminous crops and others accounts for the largest proportion of total WPF of TN and TP followed by
manufacturing. Water consumed and water pollutants discharged by households are set as internal dimensions and account for 8.89%, 25.72%, 17.36% and 34.21% of the total regional footprints of FC and WPD, respectively.
For farming industries,
manufacturing and
PSEGW, their internal footprints of FC and WPD are larger than external footprints as shown in
Figure 3. The reason is that imports of some of these sectors for intermediate input and domestic final demand are larger than the products produced and consumed domestically by the target area. For breeding industries, total FWF and total WPF are mainly contributed by internal FWF and internal WPF, respectively. This is because regional demand of livestock and poultry products is mostly met by local breeding industries, and the amount of imported livestock and poultry products is small.
FWF intensity and WPF intensity calculated by dividing the volume of FWF and WPF with the value added of each sector could provide an effective tool for analyzing the relationships between FC and WPD and regional economic development. It is clear that
fishery has the largest FWF intensity (see
Figure 3). Large water demand of crop growth, traditional irrigation systems in the target area and a relatively lower value added rate contribute to the larger FWF intensity for
growing of rice. As the electricity supply structure of SRLR is dominated by thermal power that usually calls for large amount of freshwater, FWF intensity of
PSEGW is also relatively larger. WPF intensity of TN, TP and COD decreases with the order from
fishery,
breeding of cattle to farming industries as shown in
Figure 3. Even though total WPF of
manufacturing is large, its total WPF intensity is relatively small compared with that of breeding and farming industries. From the perspectives of FWF intensity and WPF intensity, the development of sector 7 to 11 should be promoted in priority compared with other sectors.
3.3. VW and VWP in Trade Flows
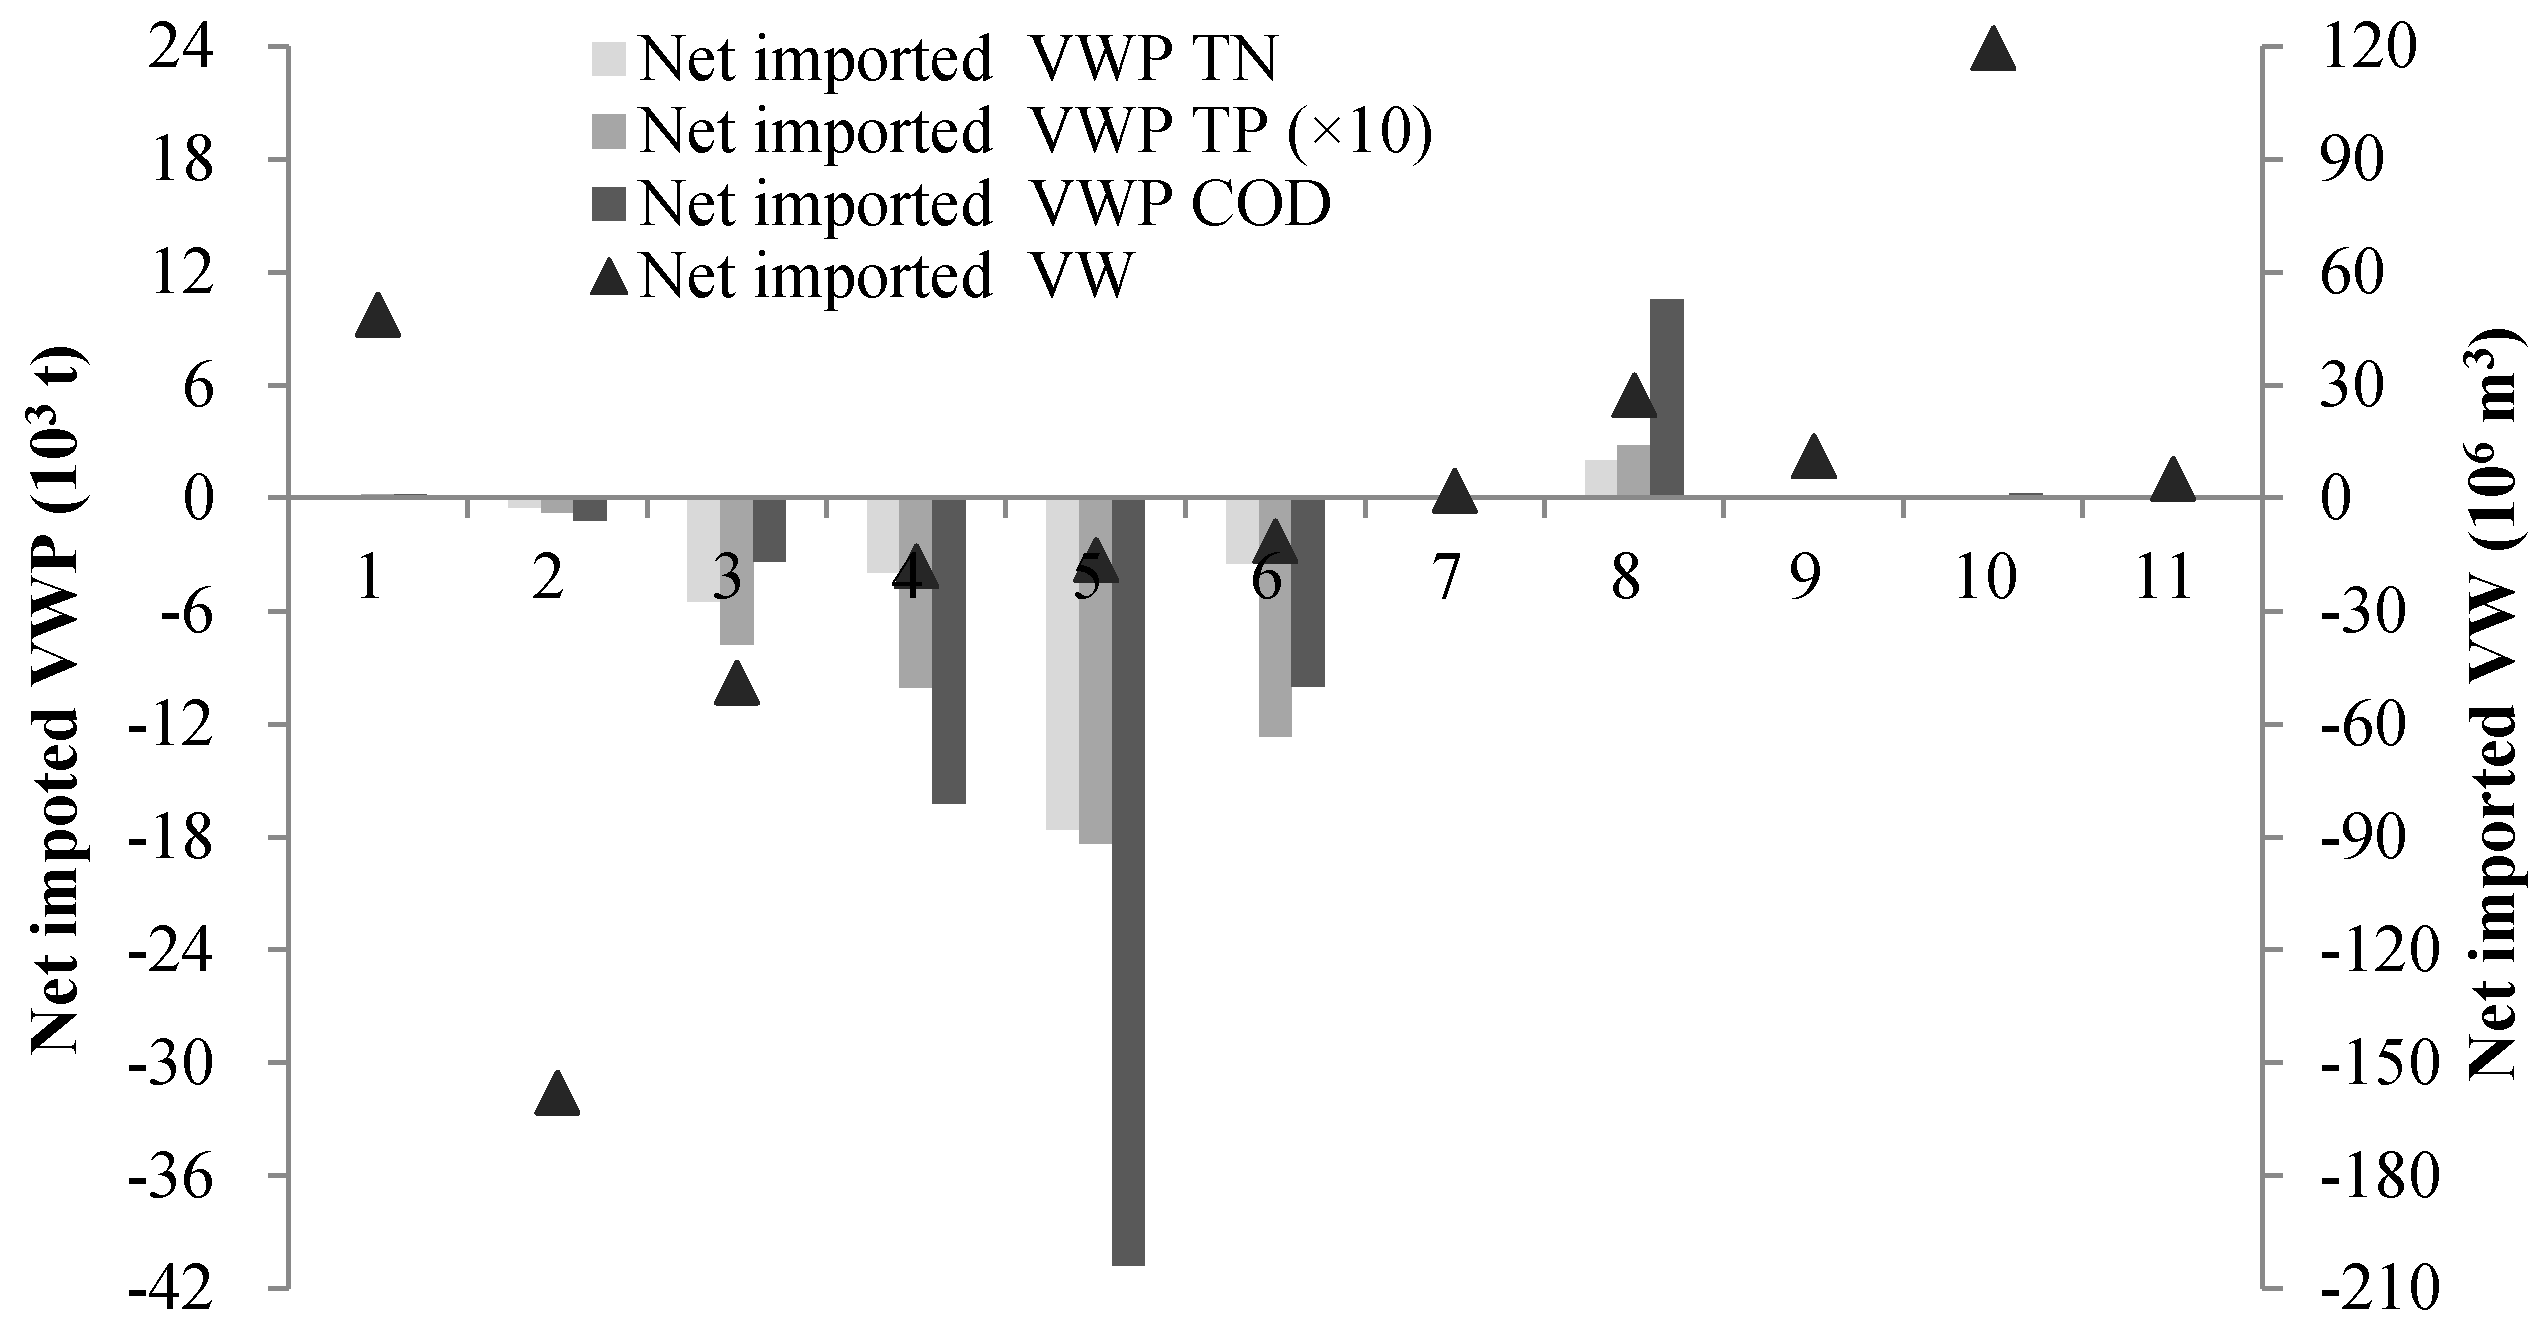
In terms of VW and VWP in trade flows holistically (see Formula (15) and
Figure 4), the target area is an net exporter with respect to both VW and VWP (39.64 × 10
6 m
3, 29.01 × 10
3 t, 4.66 × 10
3 t, 60.38 × 10
3 t, respectively).
Fishery,
manufacturing and
PSEGW are major contributors for net imported VW.
Manufacturing is also a major net VWP importer through importing products from other regions. On the contrary, farming and breeding industries export large amounts of VW and WPD. The trade flow of the target area is characterized by the net export of water-intensive products (products of farming industries) and pollution-intensive products (products of the breeding industry) to other regions, and with net import of products with less embedded VW and VWP. Therefore, there is the theoretical potential to reduce FC and WPD through regulation of trading.
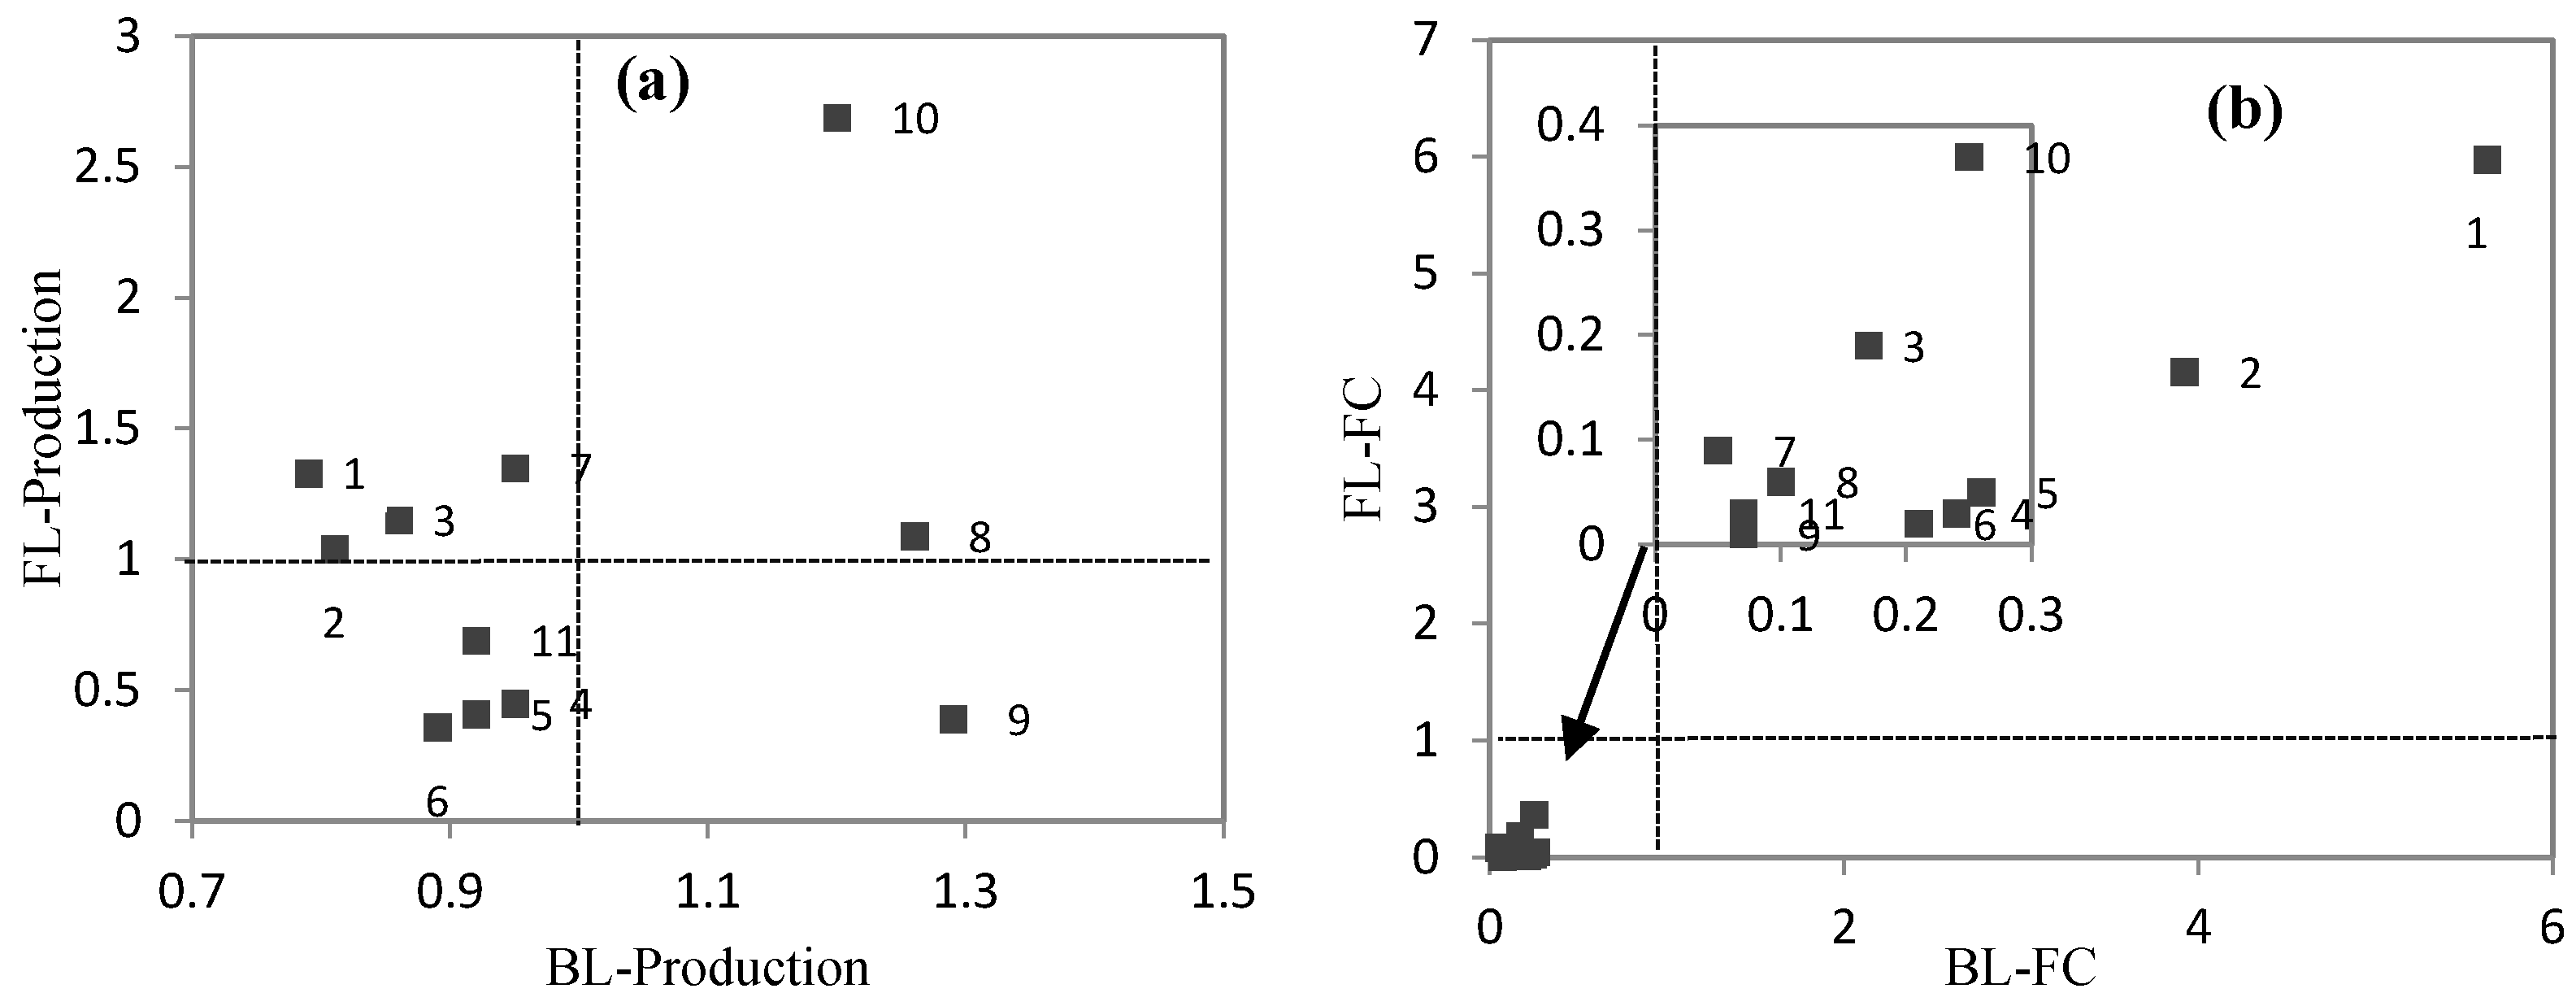
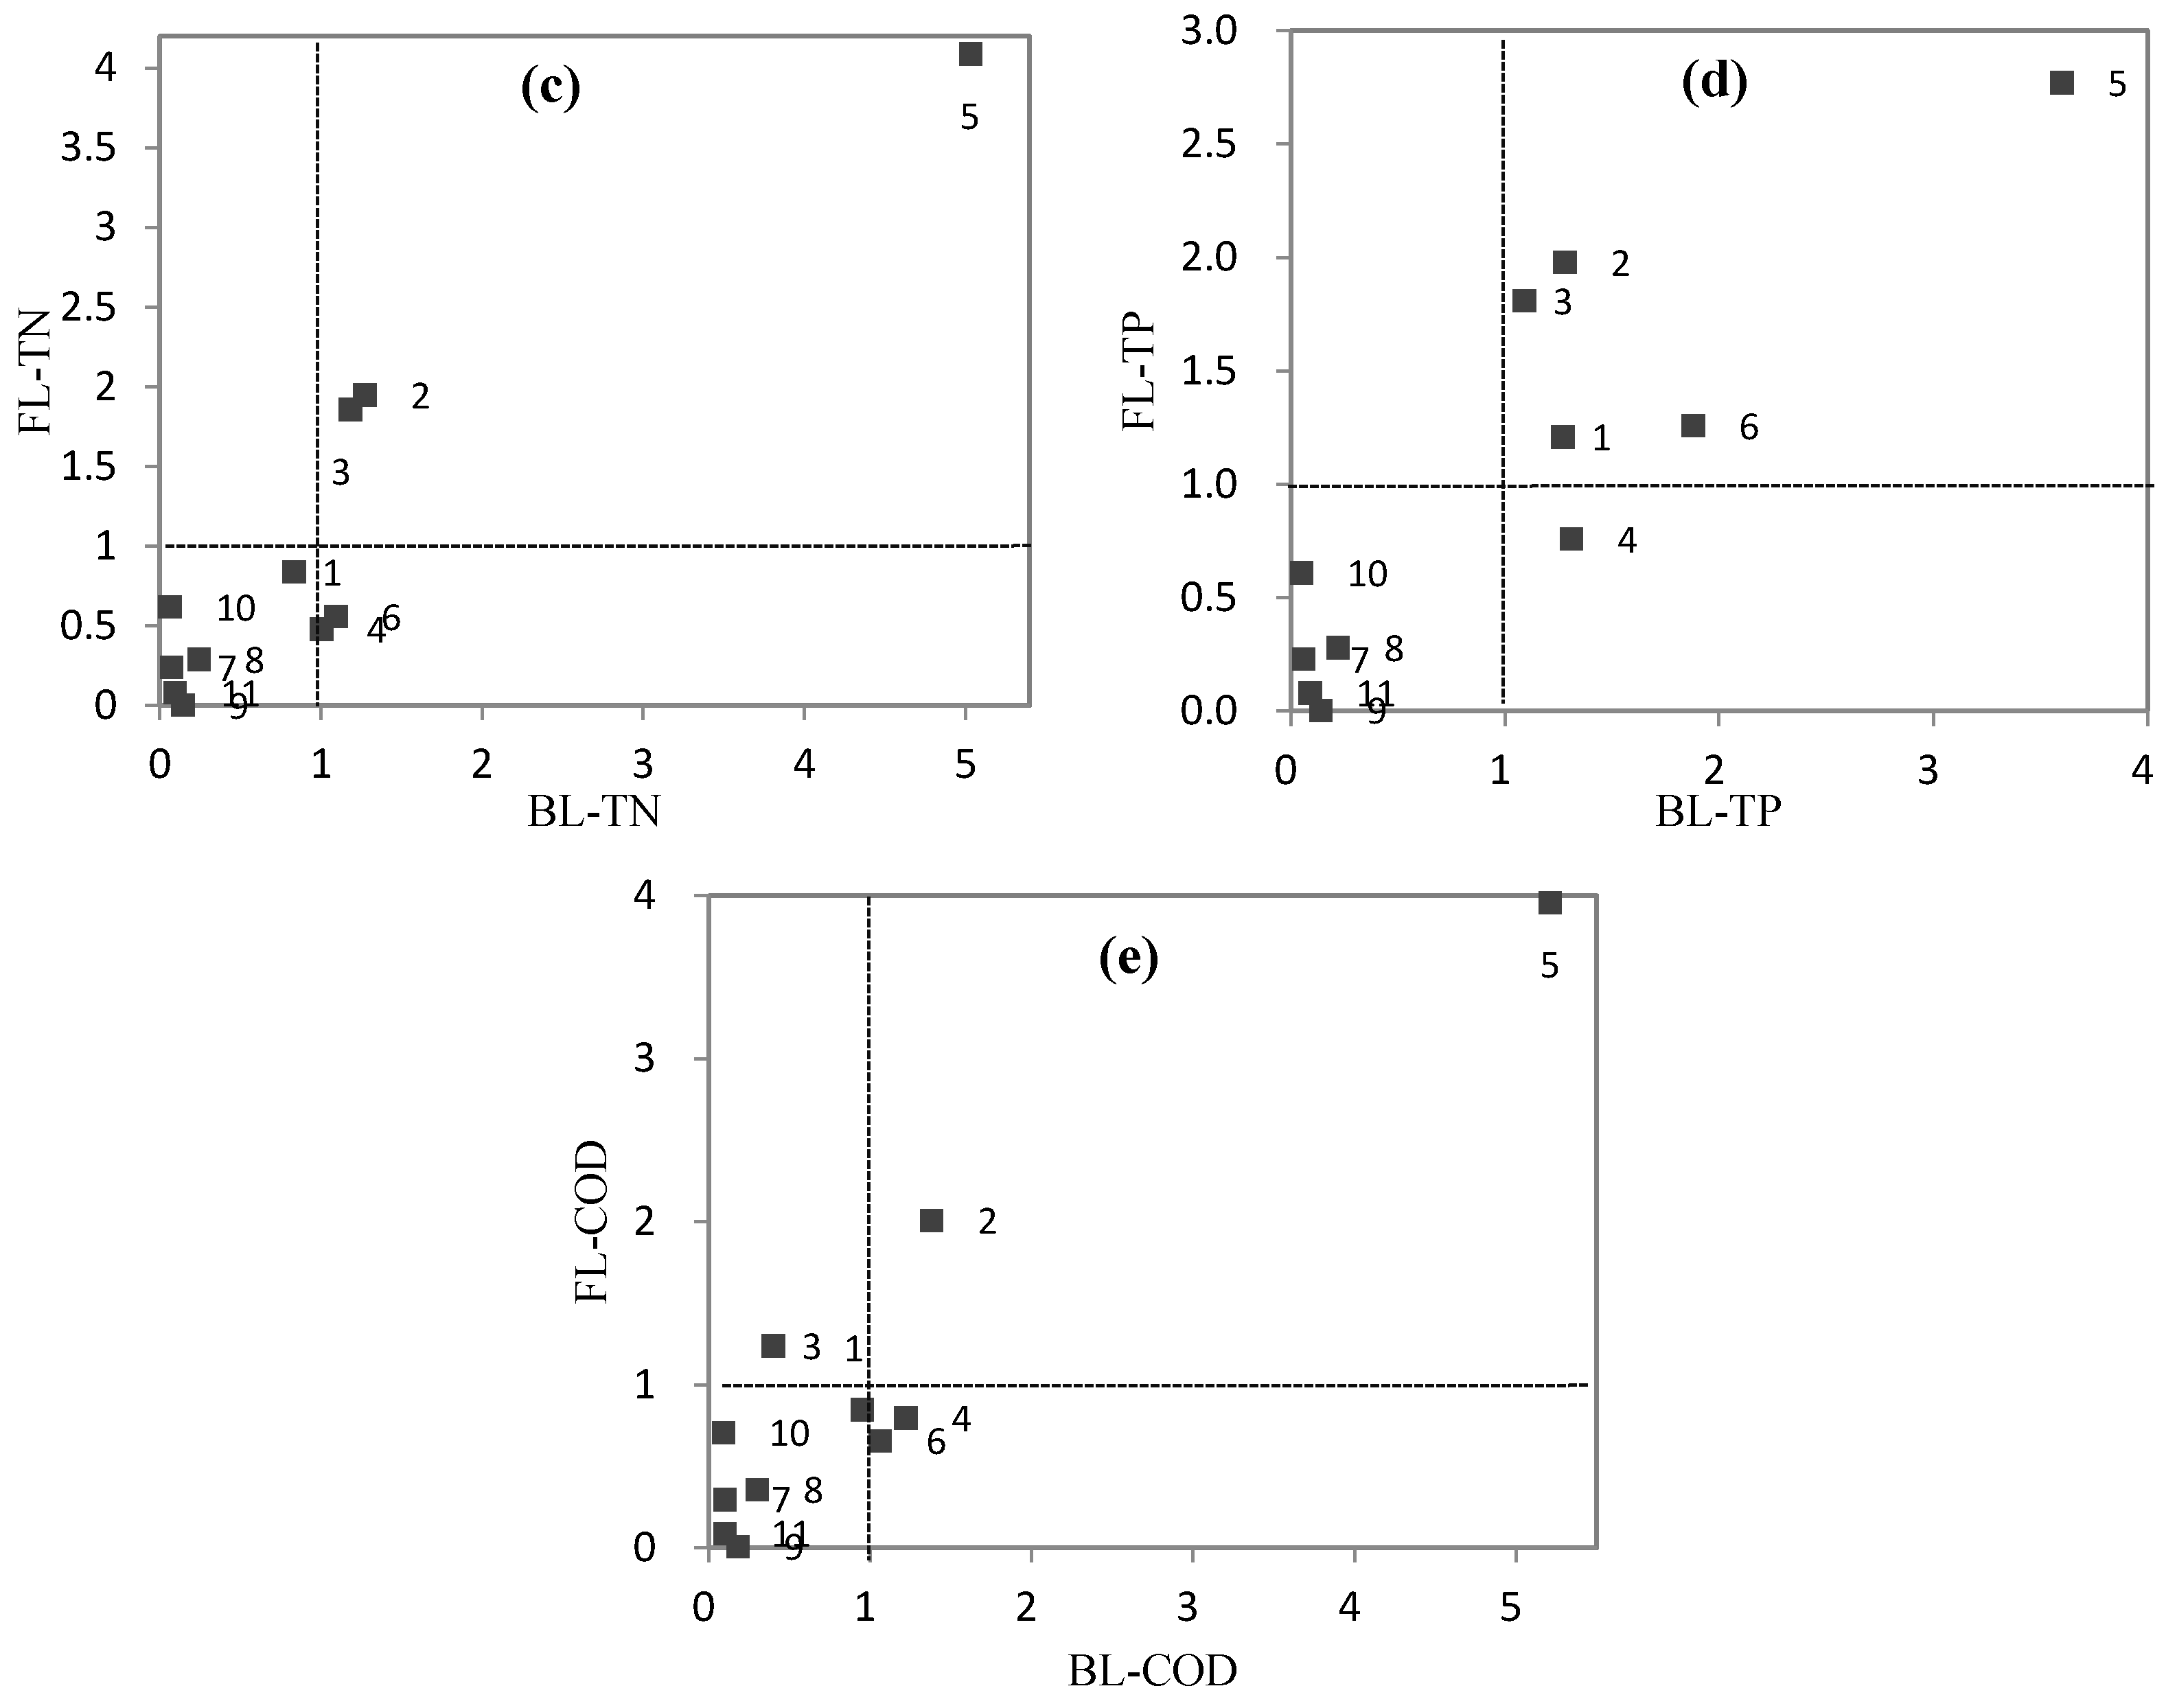
3.4. Inter-Sectoral Linkage Analysis
Through the analysis of total FC and WPD, footprints, and VW and VWP in trade flows, some corresponding policies with respect to water pollution control and water saving can be proposed. However, in order to realize sustainable development, regional economic development should be ensured, especially when undertaking industrial restructuring and trade regulation. As critical indicators to reflect the interdependences of production sectors, BL can quantify the extent to which a sector relies on other sectors for their inputs; FL can quantify the extent to which a sector supplies inputs to other sectors throughout the entire economy [
21]. Inter-sectoral linkage analysis is also capable of clarifying the key sectors (defined in
Section 2.2) that have great influence on the whole economy and the processes of WPD and FC (Formula (17)–(24)). If linkages of industrial production, FC and WPD are jointly considered, the conflict between mitigation of water pollution and scarcity and economic development can be balanced. As an alternative way for mitigating water pollution and scarcity, industrial restructuring should be undertaken with industrial groups as objectives, which corresponds to the characteristics of BL and FL. If the sectors are key sectors for FC and WPD and non-significant sectors for production, they can be set as the constrained group. If the sectors are non-significant sectors for FC and WPD and key sectors for production, they can be set as the encouraged group.
Relative backward and forward linkage coefficients in terms of production, FC and WPD are shown in
Figure 5. With respect to production,
manufacturing and
PSEGW industries are key sectors.
Fishery and
growing of rice are key sectors with regard to FC.
Breeding of cattle and farming industries are key sectors in terms of TN; for TP,
fishery,
breeding of cattle,
breeding of other livestock and poultry and farming industries are key sectors; for COD, only
breeding of cattle and
growing of rice are key sectors. These sectors have above-average linkage effects and small changes in these key sectors in terms of production, FC and WPD have significant effects on the economy, WC and WPD in the target area, respectively. Because
manufacturing and
PSEGW are key sectors for the economy and non-significant sectors for FC and WPD, they can be set as the encouraged group. Even though key sectors regarding FC, discharge of TN, TP and COD are not completely consistent, it is applicable to set farming and breeding industries as the constrained group. These sectors are non-significant sectors and do not have a drastic influence on the economy compared with key sectors in terms of production.
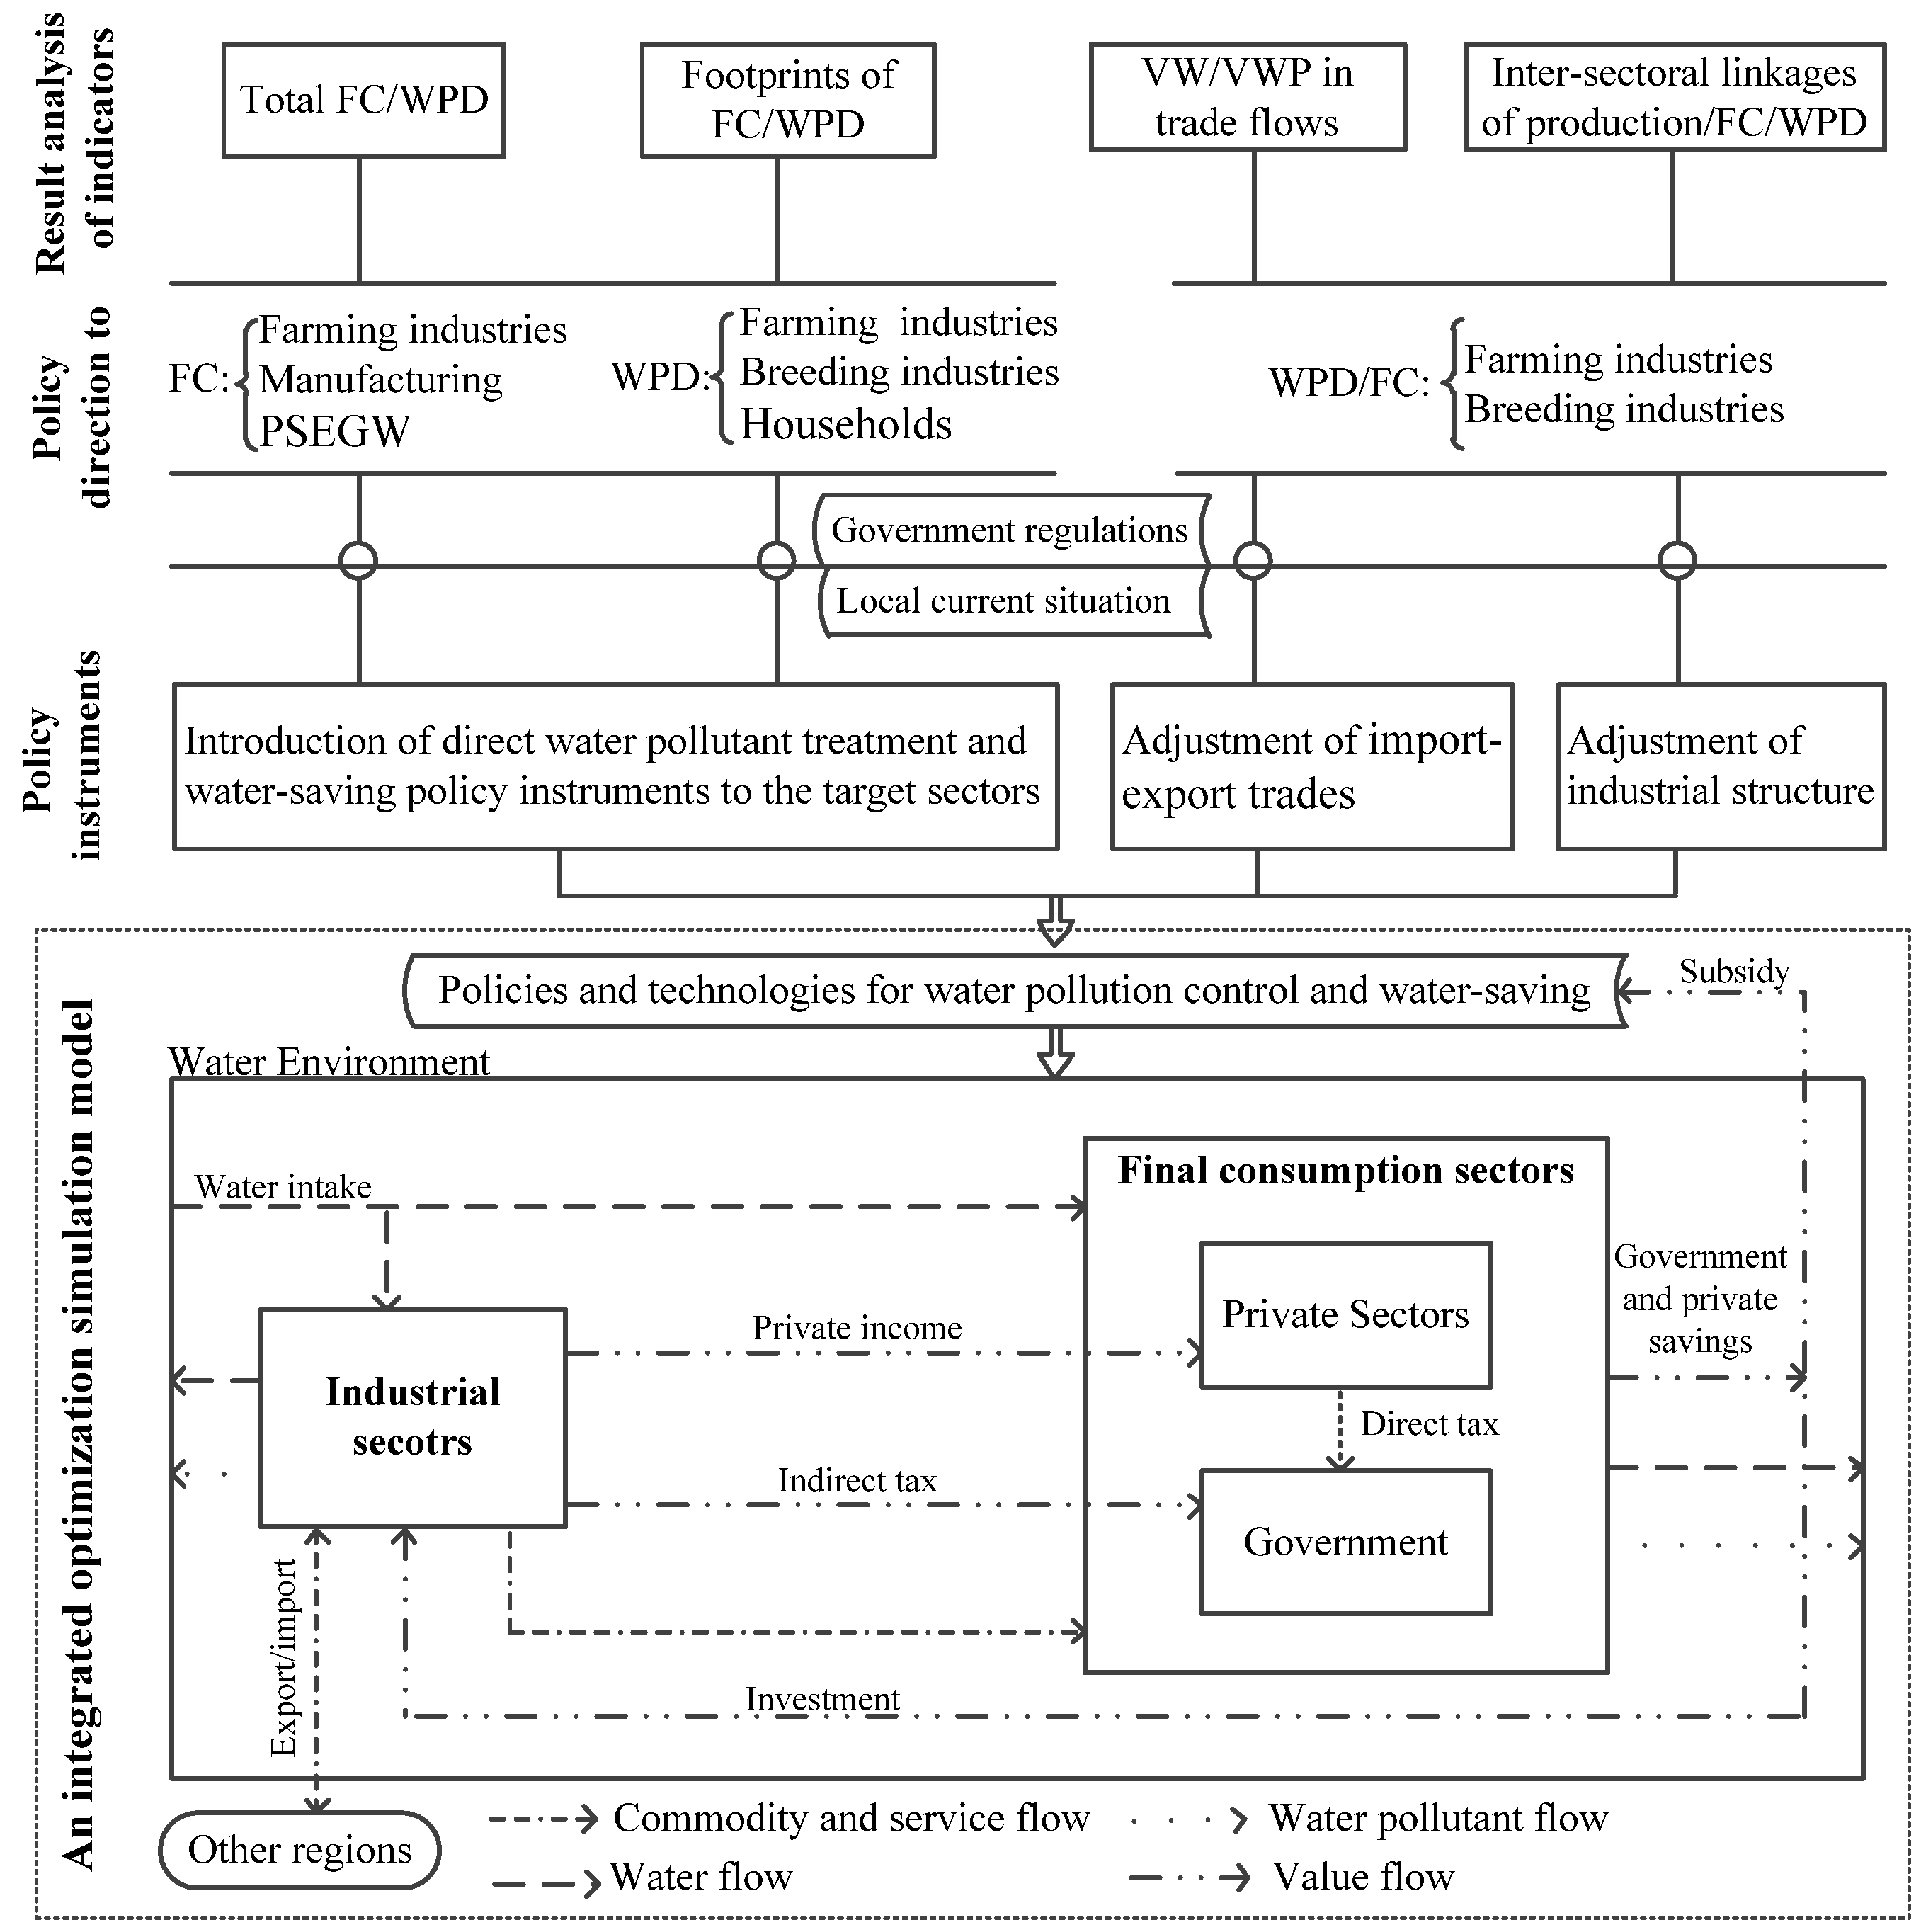
4. Discussions and Policy Implications
Confronted with the challenges of sustainable use of resources and environment, policy makers and researchers are making efforts to find the ways that simultaneously fulfill environmental preservation and economic development. The purpose of this study is to analyze the interrelationships among water use, WPD and economic activities of the target area systematically with a newly combined indicator package. The analysis results of the empirical study are expected to orient the policy implementation dimensions and providing reference for proposals of effective and applicable policies. In this study, we proposed two categories of policies based on the analysis the indicator package (see
Figure 6). One is to introduce direct water pollutant treatment and water saving policies to the target sectors; the other is to adjust import-export trades and industrial structure.
Total FC and total WPD could depict the holistic view of the FC and WPD of SRLR, respectively. Direct influence indicators of FC and WPD suggest that direct water pollutant treatment and water saving policy instruments should be focused on the industries that become major FC and WPD contributors through water consumption and WPD directly. Farming industries are identified as the greatest contributor to FC in the target area (larger than 60%) through the analysis of total FC. Thus, potential water saving policies and technologies should be applied to farming industries as a priority. With regards to the current irrigation pattern of SRLR, traditional surface flooding irrigation and inundation are inefficient; instead, water-saving technologies and systems should be adopted by farming industries. Farming and breeding industries and households are identified as major contributors in terms of WPD. SRLR covers large area of farmland (55.15% of the total area) and uses a large amount of inorganic fertilizers. According to the requirements of national grain production security, the area of basic arable land must be maintained. Compound and slow-release fertilizers are alternatives that could be adopted by farming industries to reduce TN and TP discharge. SRLR is the core area for breeding industries of Jilin Province. Prosperous development of breeding industries inevitably induces the discharge of large amounts of water pollutants. Waste-to-energy implementation such as biogas power generation is a potential way for breeding industries to deal with animal excrement. Some animal excrement can be also utilized to produce organic fertilizers to make up the requirement of the target area for organic fertilizer. According to the results, household is another important WPD contributor needing to be controlled. The treatment extent of domestic sewage of the target area is low. In fact, there is no treatment measure for rural domestic sewage. The septic tank is an alternative for rural sewage treatment corresponding to the local climatic characteristic (low temperature). Upgrading of current existing sewage treatment plants and construction of new treatment plants are measures for increasing the urban sewage treatment rate.
Footprints of FC and WPD are used to calculate the water resources consumed and water pollutants discharged for meeting the requirements of local consumption. They could clarify local FC and the induced WPD and those of other regions due to import of products. From the results of total FWF and total WPF, it is known that besides farming industries, attention should also be given to manufacturing and PSEGW in terms of FC. Based on the local practical situation, use of reclaimed water is an alternative to reduce freshwater demand in these two industries. Growing of cereals, leguminous crops and others and breeding of cattle and manufacturing are major contributors to TN and TP discharge; manufacturing and breeding of cattle are leading sectors in COD discharge. These sectors correspond to the industries discussed above for which policies should be introduced. What needs to be additionally mentioned, is that external FWF and external WPF are larger than internal FWF and internal WPF of farming industries, manufacturing, PSEGW, indicating that the target area imports related products to reduce local FC and WPD.
However, the VW and VWP embodied in trade flows of the target area cannot be fully reflected by only external and internal footprints. The target area imports large amounts of products of manufacturing, fishery and PSEGW imported from other regions, making these sectors net importer in terms of VW and VWP. Even though external footprints of farming industries are larger than internal footprints, farming industries export large amounts of water-intensive agricultural products, making them net exporters in terms of VW and VWP. Large grain yield and numerous grain processing enterprises of the target area facilitate active imports and exports of agricultural products. The target area is a net exporter of VWP overall, mainly contributed by breeding industries through exporting pollution-intensive products. Thus, it is an alternative way to control FC and WPD through adjusting the import-export trades (exporting fewer products of farming and breeding industries).
Industrial restructuring provides another choice for the mitigation of water pollution and scarcity; however, local economic development has to be considered at the same time. Inter-sectoral linkage analysis is employed to simultaneously consider FC, WPD and economic development. The analysis of BL and FL indicates that the changes in farming and breeding industries as the constrained groups affect the whole FC and WPD processes in the economy to a great extent. The production of farming and breeding industries could be constrained to reduce FC and WPD without severe impacts on the whole economy. The target area is a net exporter of water-intensive products of farming industries and water pollution-intensive products of breeding industries. Production constraints in these sectors to reduce export of related products do not affect local final demand for these sectors’ products. As the government regulates that the area of basic arable land should not be decreased to ensure the security of grain production, it implies that production of farming industries should not be decreased. Thus, only production from breeding industries could be constrained to reduce FC and WPD.
The above policy instruments proposed according to the indicator package have distinct ability of mitigating water pollution and scarcity and call for distinct investment and government financial support. The introduction of these policies would bring various impacts on the economy of the target area. This imposes difficulty on integrating all the policies optimally and determining the implementation extent of each policy. For example, if only industrial restructuring is undertaken to achieve the preset target for pollution control, it would have less practical applicability. The results could not be compared with the economic and environmental benefits of adopting other policy implementations. From the point of the holistic environmental and economic benefits, this necessitates the integration of all policies into an integrated optimization simulation model (model framework see
Figure 6), which is capable of simulating water supply and demand, WPD and socioeconomic systems to obtain an optimal policy combination. We have constructed and applied the above model to SRLR in other two published articles [
6,
43].
5. Conclusions
In light of increasing concern about water scarcity and pollution, this paper aims at proposing feasible and practical policy instruments for mitigating water scarcity and pollution by using analytical indicators as decision variables. An integrated indicator package is formed based on an environmental extended I-O model, including regional WF and WPF, VW and VWP in trade flows, BL and FL in terms of industrial production, FC and WPD. As a demonstration, these indicators are applied to SRLR in 2010 to formulate some policy instruments based on deep and well-structured analysis of FC, WPD and the economy as well as their implicated relationships.
Through the analysis of total FC and WPD, and regional WF and WPF, it is found that farming industries and PSEGW are the leading contributors to FC, and farming and breeding industries, manufacturing and households should be focused on with respect to more WPD in the target area. Analysis of direct and indirect effects of FC and WPD indicates that not only FC efficiency and WPD coefficients of production on site but also the intermediate inputs should be the focus. From a holistic view of VW and VWP in trade flows, it is illustrated that net exports of VW and VWP (TN, TP and COD) of the target area are 39.64 × 10⁶ m3, 29.01 × 10³ t, 4.66 × 10³ t, 60.38 × 10³ t, respectively, mainly contributed by farming and breeding industries. The constrained group (key sectors in terms of FC and WPD, non-significant sectors in terms of production) is identified as farming and breeding industries aided by inter-sectoral linkages analysis. The result analysis of the empirical study succeeds in orienting the dimensions of policy implementation and elucidating the reference and support for policy proposals. Finally, the policies are proposed along with the situation and government regulations of target area. Two categories of policies are proposed as: introduction of direct water pollutant treatment and water-saving policies and technologies to the target sectors and adjustment of import-export trades and industrial structure.
However, some limitations of this work have to be presented. Due to the shortage in data accessibility, a high level of aggregation for industrial sectors does not provide detailed information for specific sectors. The highly aggregated sectors inevitably induce an aggregation bias problem for linkage analysis to a certain extent [
59]. During industrial restructuring, in addition to water use, WPD and economic development, other critical factors should be taken into consideration, such as energy consumption, air pollutants, and greenhouse gases in future work.
Acknowledgments
We gratefully thank the anonymous reviewers for their comments and suggestions, which have substantially improved the quality of the paper, as well as the editors for their help with the paper. This research is supported by the “China Scholarship Council” (201206170029) and “National Water Pollution Control and Management Project” (2012ZX07202-009).
Author Contributions
Wei Yang and Junnian Song conceived the idea for the manuscript, carried out the data collection and processing, performed the analysis and wrote the whole manuscript. Yoshiro Higano and Jie Tang provided advice throughout the process.
Conflicts of Interest
The authors declare no conflict of interest.
Abbreviations
The following abbreviations are used in this manuscript:
| BL | Backward linkage |
| COD | Chemical oxygen demand |
| CNY | Chinese yuan |
| FC | Freshwater consumption |
| FL | Forward linkage |
| FWF | Freshwater footprint |
| I-O | Input-output |
| PSEGW | Production and supply of electricity, gas and water |
| SRLR | Source Region of Liao River |
| TN | Total nitrogen |
| TP | Total phosphorus |
| VW | Virtual water |
| VWP | Virtual water pollutant |
| WF | Water footprint |
| WPD | Water pollutant discharge |
| WPF | Water pollutant footprint |
Appendix A
Table A1.
Sectoral coefficients of water pollutant discharge and freshwater consumption.
Table A1.
Sectoral coefficients of water pollutant discharge and freshwater consumption.
| Sectors | Freshwater Consumption Coefficients (m3/103 CNY) | Water Pollutant Discharge Coefficients (Kg/106 CNY) |
|---|
| TN | TP | COD |
|---|
| Fishery | 463.06 | 704.32 | 167.23 | 1713.44 |
| Growing of rice | 366.81 | 1180.37 | 181.62 | 2828.39 |
| Growing of cereals, leguminous crops and others | 9.58 | 1080.37 | 151.62 | 656.44 |
| Breeding of pigs | 2.41 | 528.27 | 132.83 | 2148.58 |
| Breeding of cattle | 4.49 | 4770.22 | 497.59 | 11047.59 |
| Breeding of other livestock and poultry | 2.04 | 619.65 | 223.36 | 1769.26 |
| Mining | 0.68 | 2.81 | 0.03 | 39.96 |
| Manufacturing | 0.58 | 42.62 | 5.93 | 225.80 |
| Construction | 0.61 | 0.23 | 0.03 | 4.30 |
| Production and supply of electricity and gas | 13.35 | 3.21 | 0.04 | 28.92 |
| Transportation, Service etc. | 0.49 | 0.11 | 0.02 | 0.32 |
References
- Liu, J.; Yang, W. Water sustainability for China and beyond. Science 2012, 337, 649–650. [Google Scholar] [CrossRef] [PubMed]
- Water Impact Index. Available online: http://www.veolia.com/fr/wiix-water-impact-index (accessed on 9 April 2016).
- Ewing, B.R.; Hawkins, T.R.; Wiedmann, T.O.; Galli, A.; Ercin, A.E.; Weinzettel, J.; Steen-Olsen, K. Integrating ecological and water footprint accounting in a multi-regional input-output framework. Ecol. Indic. 2012, 23, 1–8. [Google Scholar] [CrossRef] [Green Version]
- Munksgaard, J.; Wier, M.; Lenzen, M.; Dey, C. Using input-output analysis to measure the environmental pressure of consumption at different spatial levels. J. Ind. Ecol. 2005, 9, 169–185. [Google Scholar] [CrossRef]
- Song, J.N.; Yang, W.; Higano, Y.; Wang, X.E. Introducing renewable energy and industrial restructuring to reduce GHG emission: Application of a dynamic simulation model. Energy Convers. Manag. 2015, 96, 625–636. [Google Scholar] [CrossRef]
- Yang, W.; Song, J.N.; Higano, Y.; Tang, J. Exploration and assessment of optimal policy combination for total water pollution control with a dynamic simulation model. J. Clean. Prod. 2015, 102, 342–353. [Google Scholar] [CrossRef]
- Yang, H.; Pfister, S.; Bhaduri, A. Accounting for a scarce resource: Virtual water and water footprint in the global water system. Curr. Opin. Environ. Sustain. 2013, 5, 599–606. [Google Scholar] [CrossRef]
- Hoekstra, A.Y.; Hung, P.Q. Virtual Water Trade: A Quantification of Virtual Water Flows between Nations in Relation to International Crop Trade; Value of Water Research Report Series No. 11; UNESCO-IHE: Delft, The Netherlands, 2002; pp. 1–11. [Google Scholar]
- Allan, J.A. Overall perspectives on countries and regions. In Water in the Arab World: Perspectives and Prognoses; Rogers, P., Lydon, P., Eds.; Harvard University Press: Cambridge, MA, USA, 1994; pp. 65–100. [Google Scholar]
- Hoekstra, A.Y.; Chapagain, A.K.; Aldaya, M.M.; Mekonnen, M.M. The WF Assessment Manual: Setting the Global Standard; Earthscan: London, UK, 2011; pp. 7–16. [Google Scholar]
- Hoekstra, A.Y.; Chapagain, A.K.; Aldaya, M.M.; Mekonnen, M.M. Water Footprint Manual: State of the Art 2009; Water Footprint Network: Enschede, The Netherlands, 2009; pp. 11–17. [Google Scholar]
- Hoekstra, A.Y. Virtual Water Trade: Proceedings of the International Expert Meeting on Virtual Water Trade; Value of Water Research Series; UNESCO-IHE: Delft, The Netherlands, 2003; Volume 12, pp. 16–23. [Google Scholar]
- Zhao, C.F.; Chen, B. Driving Force Analysis of the Agricultural Water Footprint in China Based on the LMDI Method. Environ. Sci. Technol. 2014, 48, 12723–12731. [Google Scholar] [CrossRef] [PubMed]
- Okadera, T.; Geng, Y.; Fujita, T.; Dong, H.J.; Liu, Z.; Yoshida, N.; Kanazawa, T. Evaluating the water footprint of the energy supply of Liaoning Province, China: A regional input-output analysis approach. Energy Policy 2015, 78, 148–157. [Google Scholar] [CrossRef]
- Miglietta, P.P.; De Leo, F.; Ruberti, M.; Massari, S. Mealworms for Food: A Water Footprint Perspective. Water 2015, 7, 6190–6230. [Google Scholar] [CrossRef]
- Chapagain, A.K.; Hoekstra, A.Y. The blue, green and grey water footprint of rice from production and consumption perspectives. Ecol. Econ. 2011, 70, 749–758. [Google Scholar] [CrossRef]
- Lovarelli, D.; Bacenetti, J.; Fiala, M. Water Footprint of crop productions: A review. Sci. Total Environ. 2016, 548, 236–251. [Google Scholar] [CrossRef] [PubMed]
- Morera, S.; Corominas, L.I.; Poch, M.; Aldaya, M.M.; Comas, J. Water footprint assessment in wastewater treatment plants. J. Clean Prod. 2016, 112, 4741–4748. [Google Scholar] [CrossRef]
- Leontief, W. The Structure of the American Economy; Oxford University Press: Oxford, UK, 1941. [Google Scholar]
- Zhao, X.; Chen, B.; Yang, Z.F. National water footprint in an input-output framework—A case study of China 2002. Ecol. Modell. 2009, 220, 245–253. [Google Scholar] [CrossRef]
- Yu, Y.; Hubacek, K.; Feng, K.S.; Guan, D.B. Assessing regional and global water footprints for the UK. Ecol. Econ. 2010, 69, 1140–1147. [Google Scholar] [CrossRef]
- Zhao, X.; Yang, H.; Yang, Z.Y.; Chen, B.; Qin, Y. Applying the Input-Output Method to Account for Water Footprint and Virtual Water Trade in the Haihe River Basin in China. Environ. Sci. Technol. 2010, 44, 9150–9157. [Google Scholar] [CrossRef] [PubMed]
- Feng, K.S.; Hubacek, K.; Minx, J.; Siu, Y.L.; Chapagain, A.; Yu, Y.; Guan, D.B.; Barrett, J. Spatially Explicit Analysis of Water Footprints in the UK. Water 2011, 3, 47–63. [Google Scholar] [CrossRef]
- Zhang, Z.; Shi, M.; Yang, H.; Chapagain, A. An input-output analysis of trends in virtual water trade and the impact on water resources and uses in China. Econ. Syst. Res. 2011, 23, 431–446. [Google Scholar] [CrossRef]
- Antonelli, M.; Roson, R.; Sartori, M. Systemic input-output computation of green and blue virtual water ‘flows’ with an illustration for the Mediterranean region. Water Resour. Manag. 2012, 26, 4133–4146. [Google Scholar] [CrossRef]
- Wang, Z.Y.; Huang, K.; Yang, S.S.; Yu, Y.J. An input-output approach to evaluate the water footprint and virtual water trade of Beijing, China. J. Clean. Prod. 2013, 42, 172–179. [Google Scholar] [CrossRef]
- Zhang, C.; Anadon, L.D. A multi-regional input-output analysis of domestic virtual water trade and provincial water footprint in China. Ecol. Econ. 2014, 100, 159–172. [Google Scholar] [CrossRef]
- Chouchane, H.; Hoekstra, A.Y.; Krol, M.S.; Mekonnen, M.M. The water footprint of Tunisia from an economic perspective. Ecol. Indic. 2015, 52, 311–319. [Google Scholar] [CrossRef]
- Dong, H.J.; Geng, Y.; Sarkis, J.; Fujita, T.; Okadera, T.; Xue, B. Regional water footprint evaluation in China: A case of Liaoning. Sci. Total Environ. 2013, 442, 215–224. [Google Scholar] [CrossRef] [PubMed]
- Chapagain, A.K.; Hoekstra, A.Y.; Savenije, H.H.G.; Gautam, R. The water footprint of cotton consumption: An assessment of the impact of worldwide consumption of cotton products on the water resources in the cotton producing countries. Ecol. Econ. 2006, 60, 186–203. [Google Scholar] [CrossRef]
- Pfister, S.; Koehler, A.; Hellweg, S. Assessing the Environmental Impacts of Freshwater Consumption in LCA. Environ. Sci. Technol. 2009, 43, 4098–4104. [Google Scholar] [CrossRef] [PubMed]
- Liang, S.; Wang, Y.F.; Cinnirella, S. Atmospheric mercury footprints of nations. Environ. Sci. Technol. 2015, 49, 3566–3574. [Google Scholar] [CrossRef] [PubMed]
- Wichelns, D. Do the Virtual Water and Water Footprint Perspectives Enhance Policy Discussions? Int. J. Water Resour. Dev. 2011, 27, 633–645. [Google Scholar]
- Gawel, E.; Bernsen, K. Do We Really Need a Water Footprint? Global Trade, Water Scarcity and the Limited Role of Virtual Water. GAIA 2011, 20, 162–167. [Google Scholar]
- Wiedmann, T.; Barrett, J. Policy-relevant applications of environmentally extended mrio databases-experiences from the UK. Econ. Syst. Res. 2013, 25, 143–156. [Google Scholar] [CrossRef]
- Wichelns, D. Virtual water and water footprints do not provide helpful insight regarding international trade or water scarcity. Ecol. Indic. 2015, 52, 277–283. [Google Scholar] [CrossRef]
- Rasmussen, P.N. Studies in Intersectoral Relations; North-Holland: Amsterdam, The Netherlands, 1956. [Google Scholar]
- Lenzen, M. Environmentally important paths, linkages and key sectors in the Australian economy. Struct. Chang. Econ. Dyn. 2003, 14, 1–34. [Google Scholar] [CrossRef]
- Tarancon Ángel, M.; del Río, P. A combined input-output and sensitivity analysis approach to analyse sector linkages and CO2 emissions. Energy Econ. 2007, 29, 578–597. [Google Scholar] [CrossRef]
- Duarte, R.; Sanchez-Choliz, J. Analysis of water pollution with input-output models. In Applied Sciences and the Environment; Almorza, D., Ramos, H.M., Eds.; WIT Press: Southampton, UK, 1998; pp. 311–329. [Google Scholar]
- Sánchez-Chóliz, J.; Duarte, R. Analysing pollution by way of vertically integrated coefficients, with an application to the water sector in Aragon. Camb. J. Econ. 2003, 27, 433–448. [Google Scholar] [CrossRef]
- Sánchez-Chóliz, J.; Duarte, R. Water pollution in the Spanish economy: Analysis of sensitivity to production and environmental analysis. Ecol. Econ. 2005, 53, 325–338. [Google Scholar] [CrossRef]
- Yang, W.; Song, J.; Higano, Y.; Tang, J. An Integrated Simulation Model for Dynamically Exploring the Optimal Solution to Mitigating Water Scarcity and Pollution. Sustainability 2015, 7, 1774–1797. [Google Scholar] [CrossRef]
- Leontief, W. Environmental repercussions and the economic structure: An input-output approach. Rev. Econ. Stat. 1970, 52, 262–271. [Google Scholar] [CrossRef]
- Hoekstra, A.Y.; Chapagain, A.K. Water footprints of nations: Water use by people as a function of their consumption pattern. Water Resour. Manag. 2007, 21, 35–48. [Google Scholar] [CrossRef]
- Johson, R.C.; Noguera, G. Accounting for intermediates: Production sharing and trade in value added. J. Int. Econ. 2012, 86, 224–236. [Google Scholar] [CrossRef]
- Timmer, P.M.; Dietzenbacher, E.; Los, B.; Stehrer, B.; Vries, G.J. The World Input-Output Database: Content, Concepts and Applications. 2014. Available online: http://www.ggdc.net/publications/memoran-dum/gd144.pdf#search='Import+Proportionality+Assumption' (accessed on 9 April 2016).
- Miller, R.E.; Blair, P.D. Input-Output Analysis: Foundations and Extensions; Prentice-Hall, Inc.: Upper Saddle River, NJ, USA, 1985. [Google Scholar]
- Ghosh, A. Input-output approach in an allocation system. Economica 1958, 25, 58–64. [Google Scholar] [CrossRef]
- Xu, F.; Zhao, Y.W.; Yang, Z.F.; Zhang, Y. Multi-scale evaluation of river health in Liao River Basin, China. Front. Environ. Sci. Eng. 2011, 5, 227–235. [Google Scholar] [CrossRef]
- Jilin Statistical Bureau. Jilin Statistical Year Book 2011; China Statistics Press: Beijing, China, 2011. (In Chinese)
- Liaoyuan Statistical Bureau. Liaoyuan Statistics Year Book 2010; China Statistics Press: Beijing, China, 2011. (In Chinese)
- Siping Statistical Bureau. Siping Statistics Year Book 2011; China Statistics Press: Beijing, China, 2011. (In Chinese)
- Liaoyuan Environmental Protection Bureau. Environment Statistics Data of Liaoyuan 2010; Liaoyuan Statistics Press: Liaoyuan, China, 2011. (In Chinese)
- Siping Environmental Protection Bureau. Environment Statistics Data of Siping 2010; Siping Statistics Press: Siping, China, 2011. (In Chinese)
- Water Resources Bureau of Liaoyuan. Liaoyuan Water Resources Bulletin 2010; Water Resources Bureau of Liaoyuan Press: Liaoyuan, China, 2011. (In Chinese)
- Water Resources Bureau of Siping. Siping Water Resources Bulletin 2010; Water Resources Bureau of Siping Press: Siping, China, 2011. (In Chinese)
- South China Institute of Environmental Sciences. Domestic Emission Coefficients in China; SCIES Press: Guangzhou, China, 2010. (In Chinese) [Google Scholar]
- Lenzen, M. Aggregation versus disaggregation in input-output analysis of the environment. Econ. Syst. Res. 2011, 23, 73–89. [Google Scholar] [CrossRef]
© 2016 by the authors; licensee MDPI, Basel, Switzerland. This article is an open access article distributed under the terms and conditions of the Creative Commons Attribution (CC-BY) license (http://creativecommons.org/licenses/by/4.0/).


