
Methodology for Selecting Best Management Practices Integrating Multiple Stakeholders and Criteria. Part 2: Case Study

Abstract
:1. Introduction
2. Methodology
3. Application to a Case Study
3.1. Problem Definition
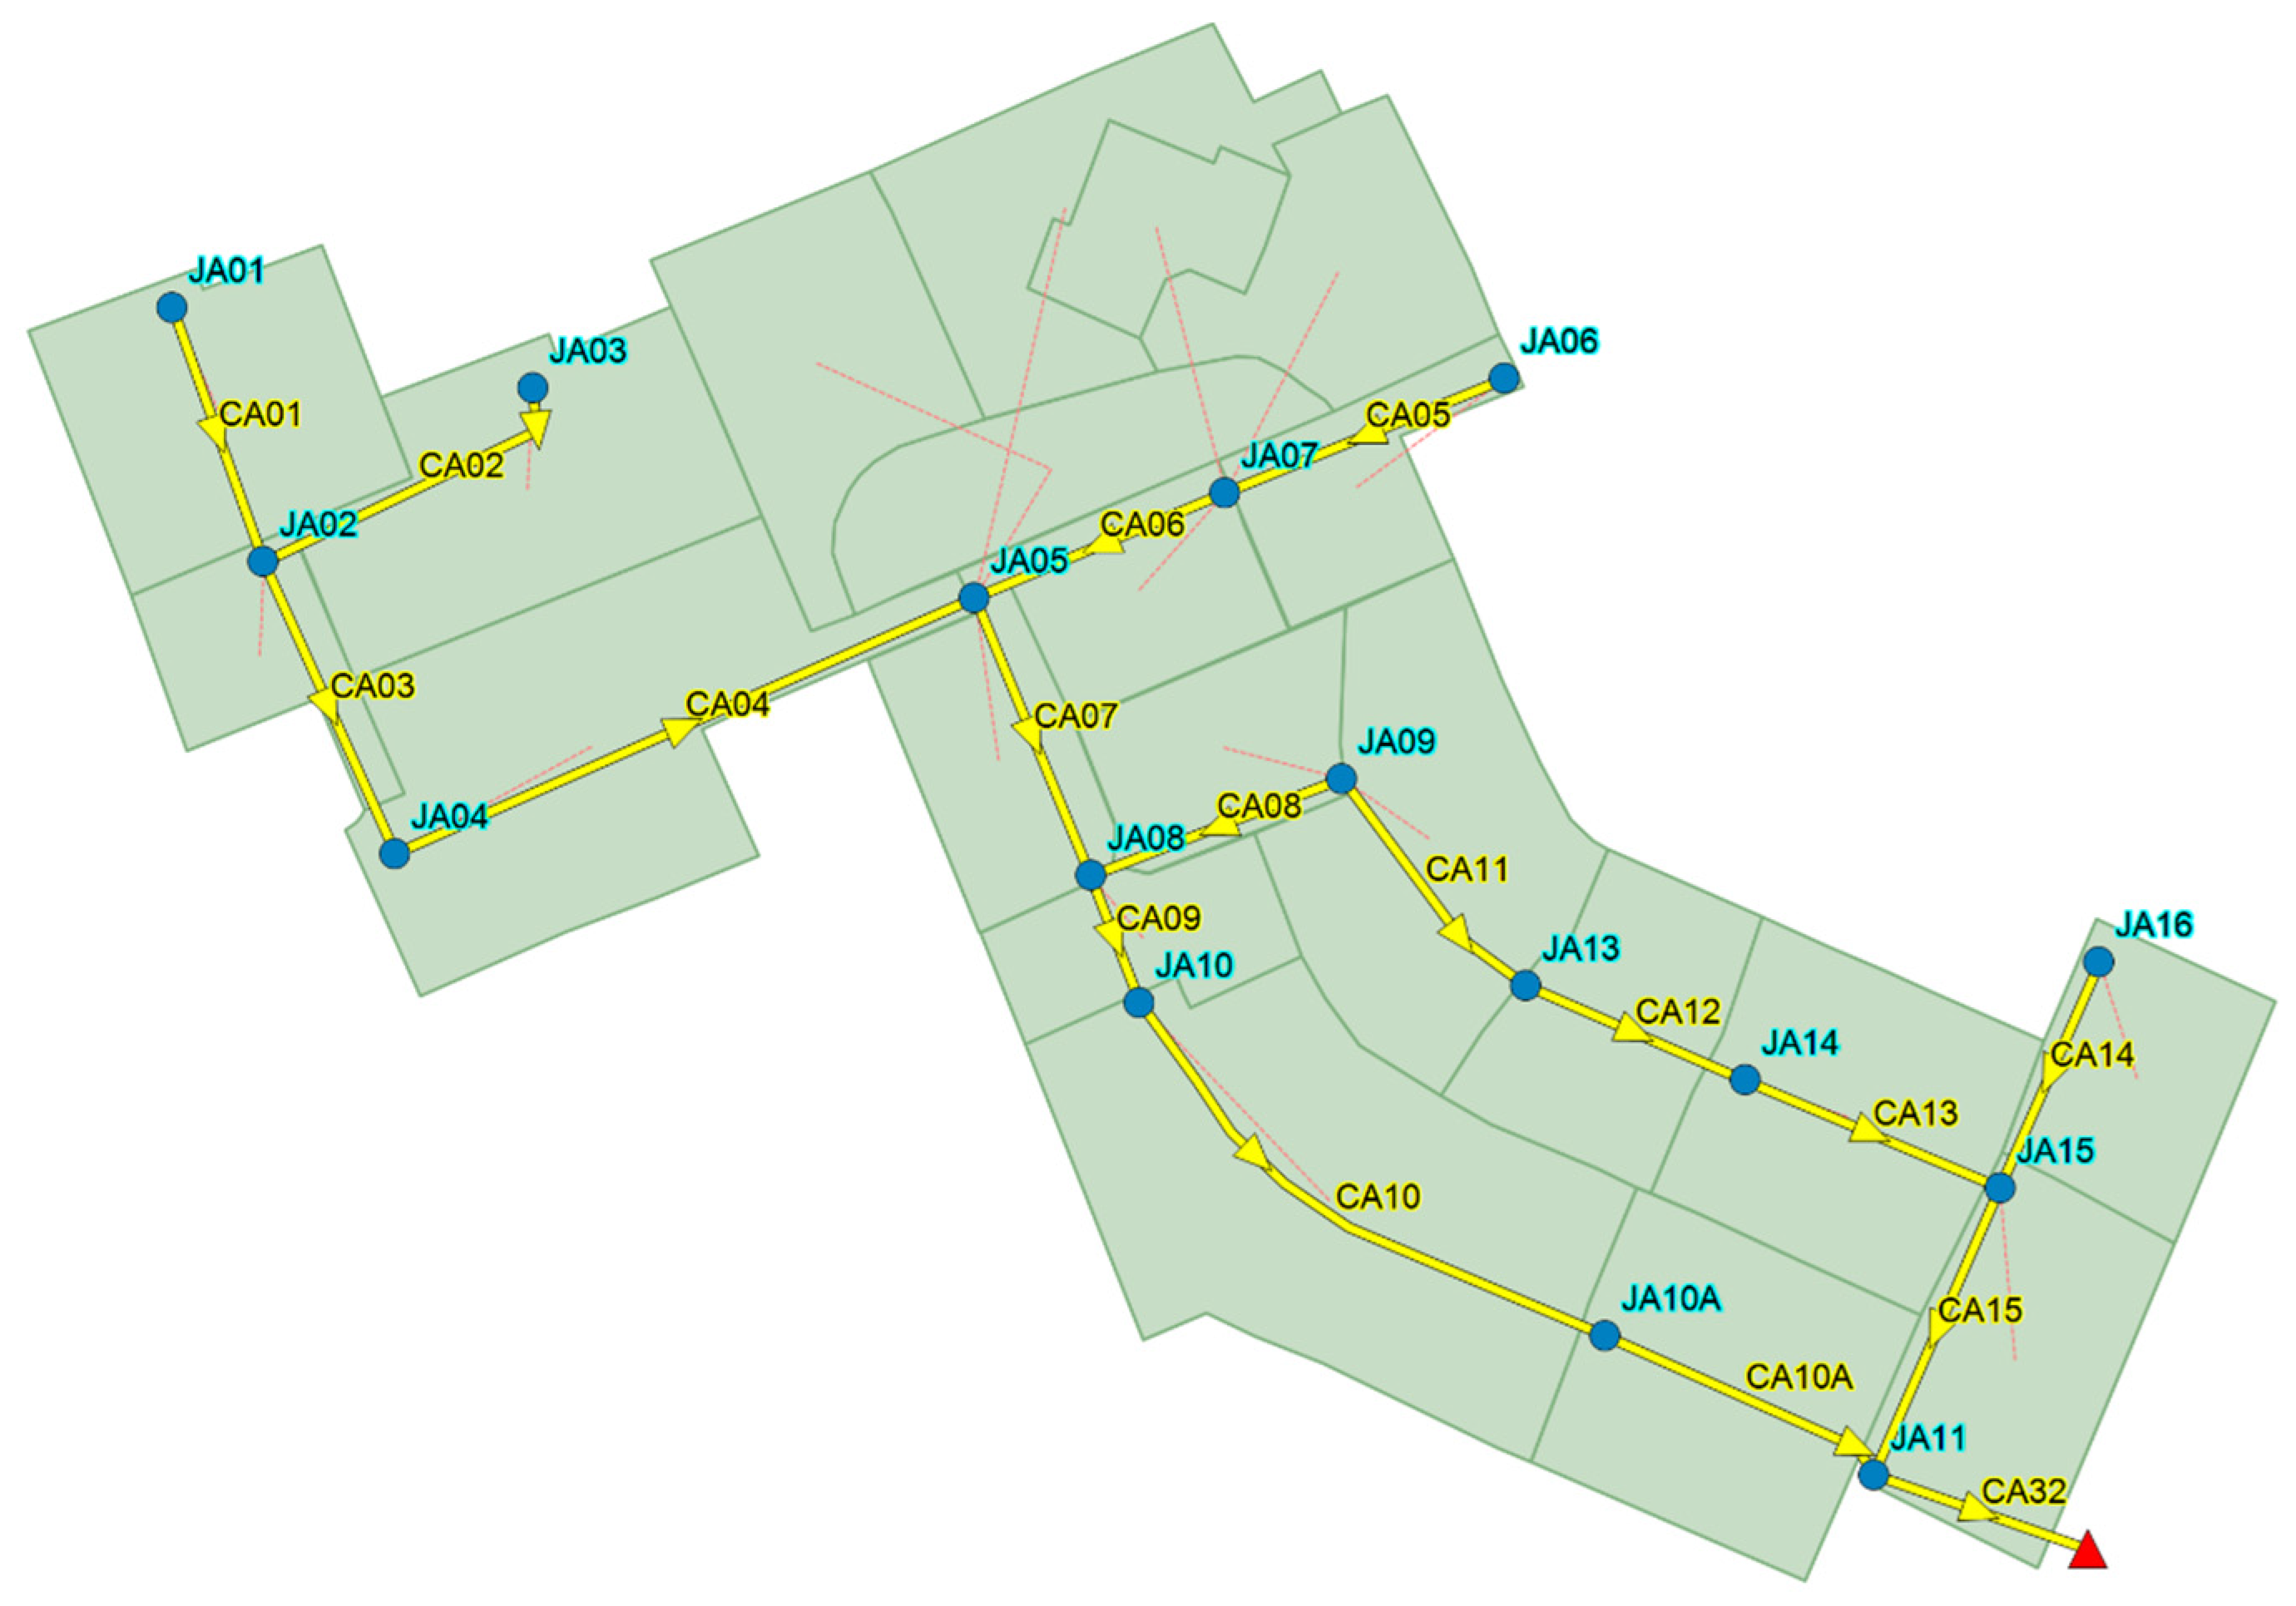
3.2. Preliminary Site Analysis

| BMP | Topography | Soil Infiltration | Groundwater | Drained Area | % of BMP Area from Total Drained Area |
|---|---|---|---|---|---|
| (1) Green roofs | 20° roof slope | NA | NA | NA | NA |
| (2) Rainwater Capture | NA | NA | NA | NA | NA |
| (3) Downspout Disconnection | NA | NA | NA | NA | NA |
| (4) Infiltration drains | NA | Min rate 15 mm/h | >1 m below bottom | <0.5 ha | NA |
| (5) Infiltration trenches | NA | Min 15 mm/h | >1 m below bottom | <2 ha | Variable |
| (6) Permeable pavement | <5% slope | * Min 12.5 mm/h | >1.2 m below bottom | <4 ha | >50% ** |
| (7) Filter strips | 1%–5% slope | *** None | >0.5 m below bottom | <2 ha | >16.7% |
| (8) Rain gardens | <2% slope | * Min 25 mm/h | >1.2 m below bottom | <2 ha | >5% |
| (9) Vegetated swales | 1%–4% longitudinal | NA | NA | <2 ha | Variable |
| (10) Perforated pipes | NA | Min 15 mm/h | >1 m below bottom | NA | X |
| (11) Dry ponds | NA | NA | NA | >5 ha | Retention volume variable |
| (12) Wet ponds | NA | NA | NA | >5 ha | |
| (13) Wetlands | NA | NA | NA | >5 ha | |
| * Smaller values accepted for partial infiltration | ** Proportional to impervious area drained | *** If not conceived for infiltration | |||
- Green roofs (GR): to be installed in the flat roof of the school.
- Rainwater harvesting (Br): for individual households (maximum two per household).
- Permeable pavement (PP) (partial infiltration): pervious asphalt to be installed on driveways.
- Rain gardens (RG) (partial infiltration): for implementation on front lawns.
3.3. Analysis of Alternatives

| Pollutant | Residential | Commercial | Non Developed | Roads |
|---|---|---|---|---|
| TSS (mg/L) | 48 | 43 | 51 | 99 |
| TN (mg/L) | 2.00 | 2.20 | 1.20 | 2.30 |
| TP (mg/L) | 0.30 | 0.22 | 0.25 | 0.25 |
| Parameter | Result |
|---|---|
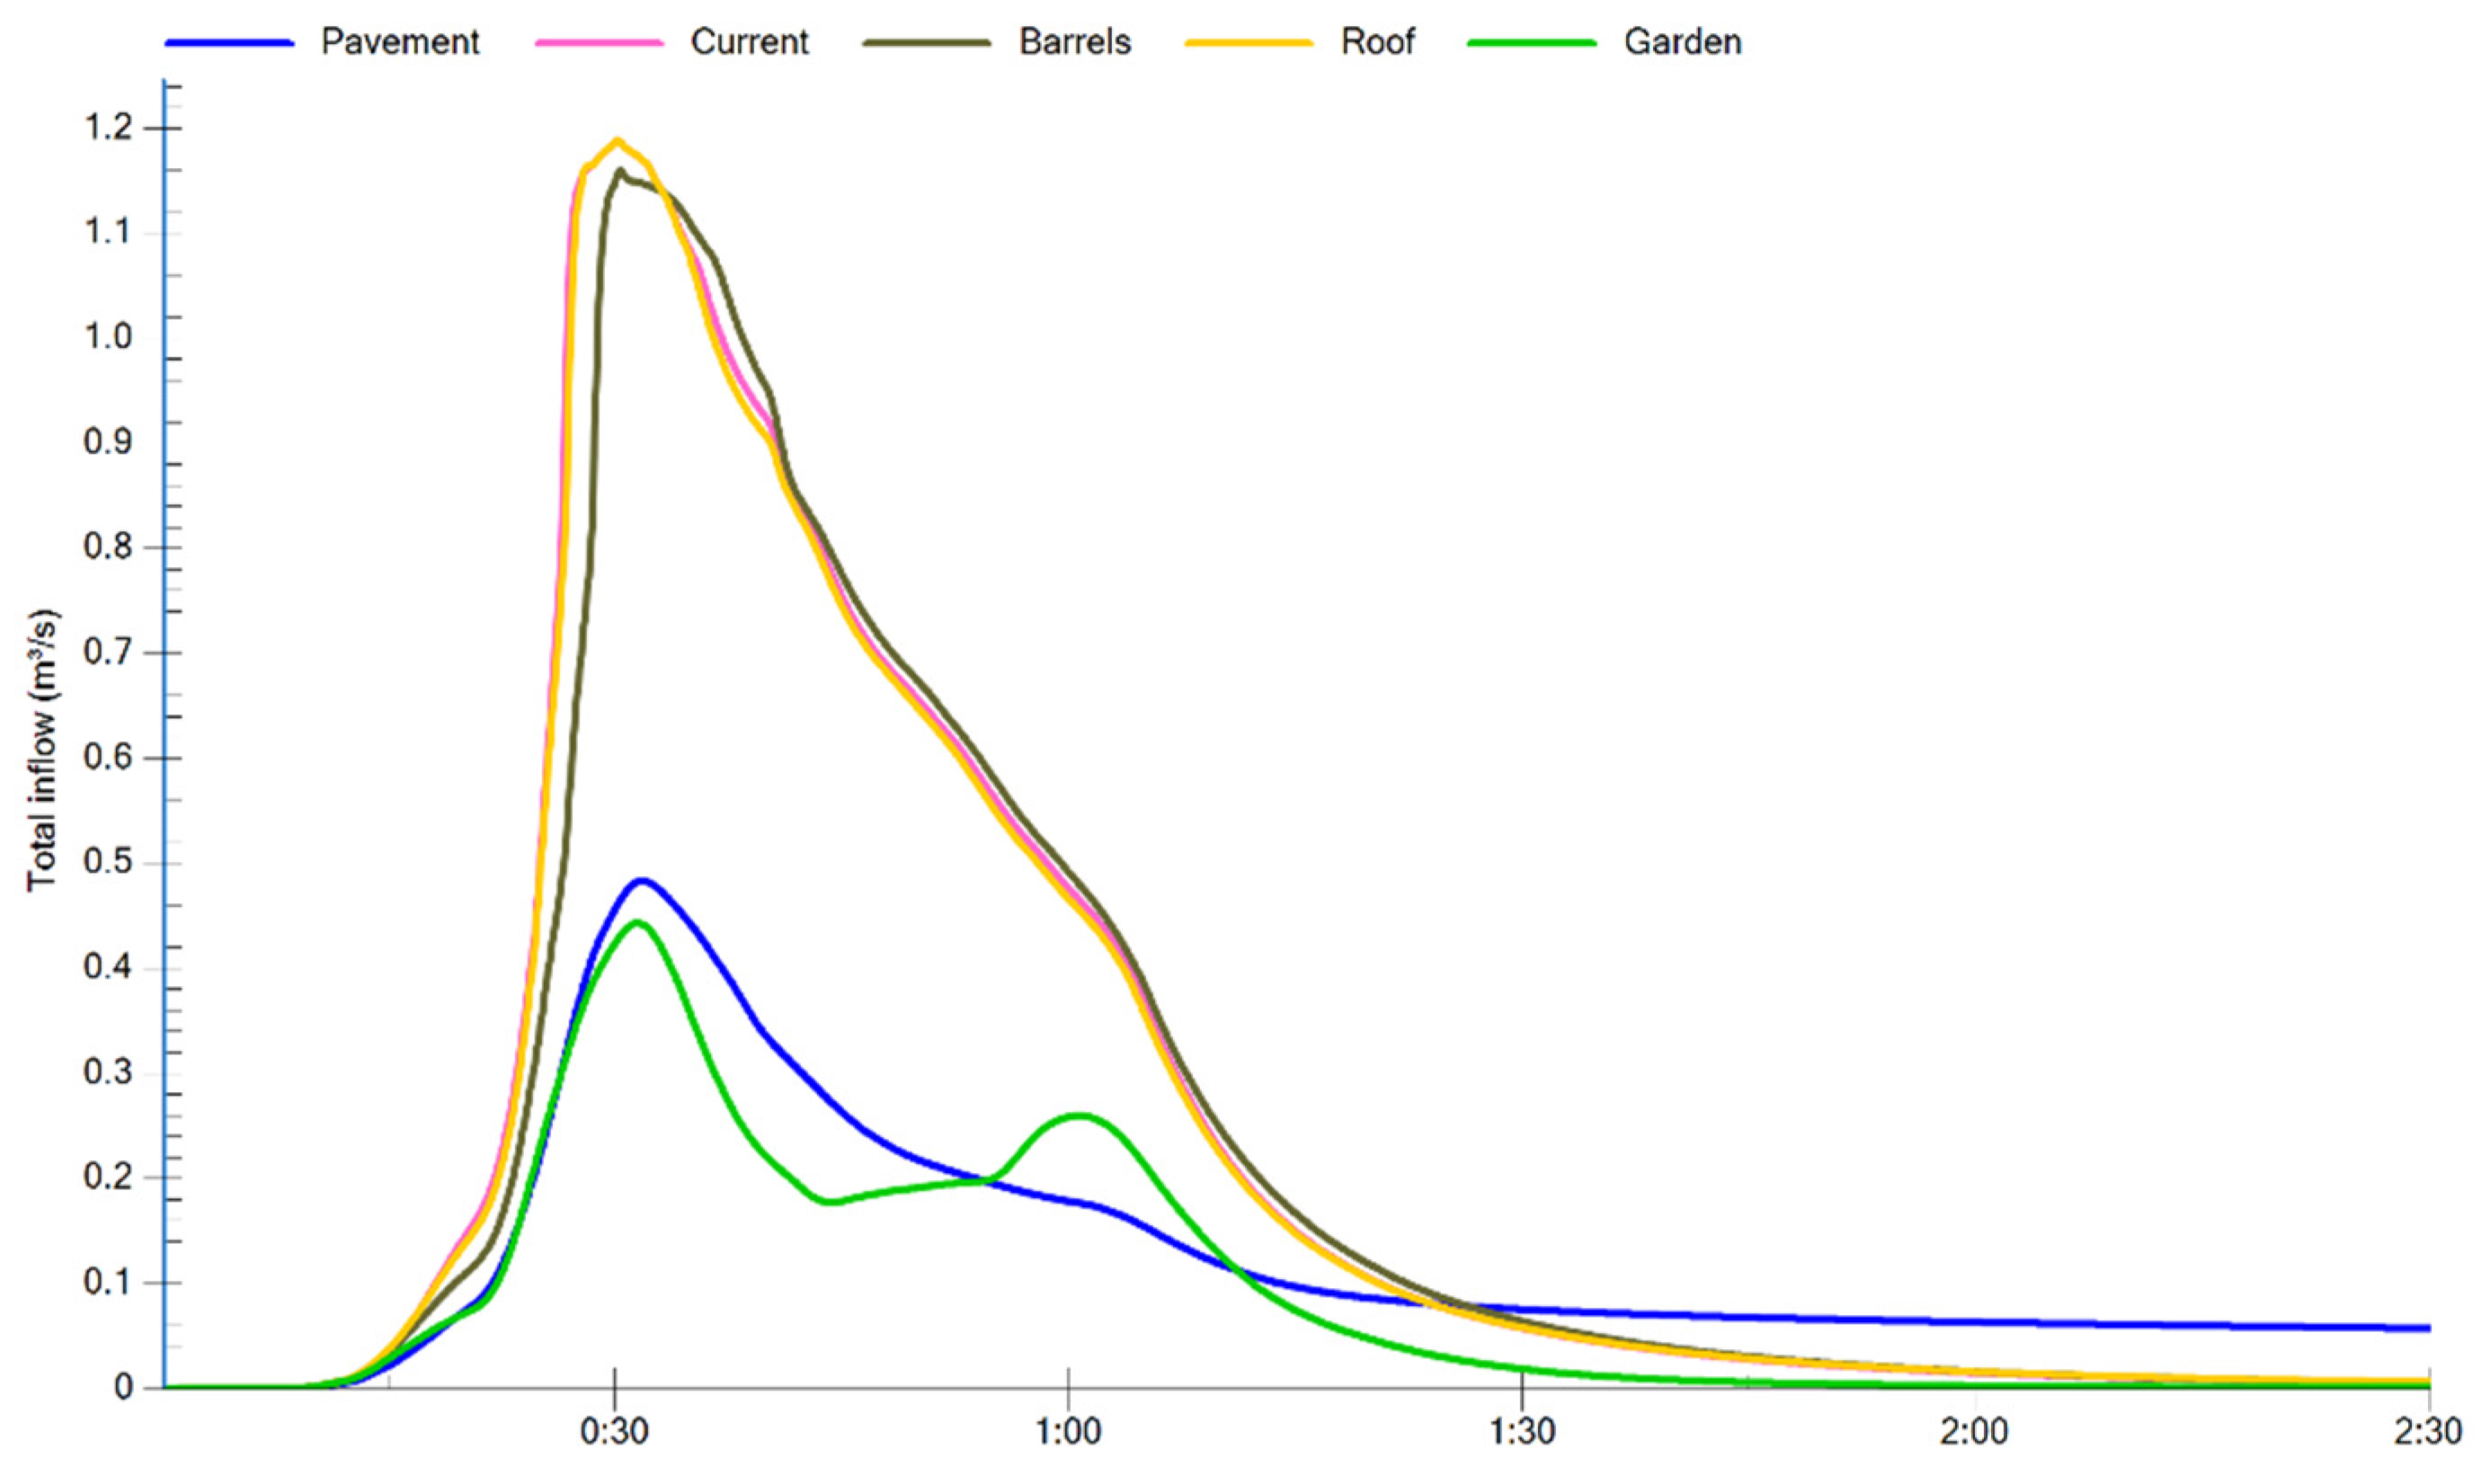
| Peak flow (m3/s) | 1.189 |
| Time to peak (min) | 30 |
| Water volume through outfall (m3) | 2288 |
| Water Volume through Outfall (m3) | TSS (kg) | TN (kg) | TP (kg) |
|---|---|---|---|
| 1581 | 164.69 | 5.08 | 0.681 |

| Layer | Parameter | RG | GR | PP | Br |
|---|---|---|---|---|---|
| Surface | Berm Height (mm) | 250 | 5 | 2.5 | - |
| Vegetative Cover Fraction | 0.1 | 0.1 | 0 | - | |
| Surface roughness (Manning) | 0 | 0 | 0.03 | - | |
| Surface slope (%) | 0 | 0 | 2 | - | |
| Pavement | Thickness (mm) | - | - | 100 | - |
| Void ratio | - | - | 0.165 | - | |
| Impervious surface fraction | - | - | 0 | - | |
| Permeability (mm/h) | - | - | 36000 | - | |
| Clogging Factor | - | - | 0 | - | |
| Soil | Thickness (mm) | 600 | 150 | - | - |
| Porosity | 0.453 | 0.453 | - | - | |
| Field Capacity (fraction) | 0.19 | 0.19 | - | - | |
| Wilting Point (fraction) | 0.085 | 0.085 | - | - | |
| Saturated Conductivity (mm/h) | 10.92 | 10.92 | - | - | |
| Conductivity curve slope | 7.5 | 7.5 | - | - | |
| Suction head (mm) | 110 | 110 | - | - | |
| Storage | Height (mm) | 400 | - | 700 | 1300 |
| Void ratio | 0.4 | - | 0.4 | - | |
| Filtration rate (mm/h) | 1 | - | 1 | - | |
| Clogging Factor | 0 | - | 0 | - | |
| Drainage Mat | Thickness (mm) | - | 25.4 | - | - |
| Void ratio | - | 0.33 | - | - | |
| Surface roughness (Manning) | - | 0.2 | - | - | |
| Drain | Drain Coefficient | 1.47 | - | 1.1 | 3.0 |
| Drain Exponent | 0.5 | - | 0.5 | 0.5 | |
| Drain offset height (mm) | 0 | - | 0 | 0 | |
| Drain Delay (h) | - | - | - | 24 |

| Alternative | TSS Removal (%) | TN Removal (%) | TP Removal (%) |
|---|---|---|---|
| Br | 9.42 | 9.35 | 9.25 |
| RG | 70.00 | 73.44 | 76.51 |
| GR | 1.17 | 2.83 | 2.79 |
| PP | 66.82 | 62.54 | 58.00 |
| Br + RG | 70.06 | 73.52 | 76.65 |
| Br + GR | 10.59 | 12.17 | 11.89 |
| Br + PP | 67.36 | 64.00 | 60.06 |
| RG + GR | 69.75 | 73.31 | 76.36 |
| RG + PP | 81.83 | 85.39 | 87.81 |
| GR + PP | 67.97 | 65.33 | 60.65 |
| Br + RG + GR | 69.81 | 73.39 | 76.51 |
| Br + RG + PP | 81.91 | 85.49 | 87.96 |
| Br+ GR + PP | 68.51 | 66.79 | 62.70 |
| RG + GR + PP | 81.65 | 85.26 | 87.67 |
| Br + RG + GR + PP | 81.65 | 85.33 | 87.67 |
- Demolition Cost: $3.75 per ft2
- Subbase and excavation: $1.88 per ft2
- Pavement installation: $1.87 per ft2
- Annual Maintenance Cost: $0.04 per ft2
3.4. Stakeholder Analysis
| Criterion | Citizens | Engineers | Planners |
|---|---|---|---|
| Technical Criteria | 3 | 5 | 4 |
| Peak flow reduction | 4 | 4 | 4 |
| Volume reduction | 4 | 5 | 4 |
| Peak flow delay | 3 | 4 | 4 |
| Water Quality Criteria | 5 | 4 | 3 |
| TSS Removal | 4 | 4 | 3 |
| TN Removal | 4 | 3 | 2 |
| TP Removal | 4 | 3 | 2 |
| Economic NPV | 4 | 5 | 3 |
| Social Criteria | 3 | 5 | 3 |
| Aesthetics | 3 | 4 | 3 |
| Acceptability | 3 | 4 | 3 |
| Life Quality Contributions | 4 | 5 | 3 |
| Sust. Dev. Contributions | 4 | 5 | 4 |
| Criterion | Barrels | Rain Gardens | Green Roof | Pervious Pavement |
|---|---|---|---|---|
| Aesthetics | 0 | 4 | 3 | 2 |
| Acceptability | 2 | 3 | 4 | 2 |
| Life Quality | 2 | 3 | 3 | 2 |
| Sust. Dev. | 3 | 3 | 3 | 2 |
3.5. MCDA Method Application
| Alternative | Peak Flow Reduction (m3/s) | Volume Reduction (m3)s | TSS Removal (%) | TN Removal (%) | TP Removal (%) | NPV ($) | Aesthetics | Accep. | Life Quality | Sust. Dev. |
|---|---|---|---|---|---|---|---|---|---|---|
| RG | 0.746 | 491 | 70.0 | 73.4 | 76.5 | 2,805,967 | 4.00 | 3.00 | 3.00 | 3.00 |
| PP | 0.706 | 44 | 66.8 | 62.5 | 58.0 | 866,135 | 2.00 | 2.00 | 2.00 | 2.00 |
| Br + RG | 0.746 | 607 | 70.1 | 73.5 | 76.7 | 3,686,044 | 3.94 | 3.00 | 2.99 | 2.99 |
| Br + PP | 0.709 | 126 | 67.4 | 64.0 | 60.1 | 1,746,212 | 1.98 | 2.01 | 2.00 | 2.00 |
| RG + GR | 0.746 | 523 | 69.7 | 73.3 | 76.4 | 3,172,915 | 3.74 | 3.00 | 3.00 | 3.26 |
| RG + PP | 0.900 | 515 | 81.8 | 85.4 | 87.8 | 3,672,103 | 2.83 | 2.41 | 2.41 | 2.41 |
| GR + PP | 0.739 | 75 | 68.0 | 65.3 | 60.6 | 1,233,082 | 2.19 | 2.19 | 2.19 | 2.39 |
| Br + RG + GR | 0.746 | 640 | 69.8 | 73.4 | 76.5 | 4,052,992 | 3.70 | 3.00 | 2.99 | 3.24 |
| Br + RG + PP | 0.900 | 624 | 81.9 | 85.5 | 88.0 | 4,552,180 | 2.81 | 2.42 | 2.41 | 2.41 |
| Br + GR + PP | 0.744 | 158 | 68.5 | 66.8 | 62.7 | 2,113,159 | 2.18 | 2.20 | 2.19 | 2.38 |
| RG + GR + PP | 0.900 | 547 | 81.6 | 85.3 | 87.7 | 4,039,050 | 2.85 | 2.49 | 2.49 | 2.61 |
| Br + RG + GR + PP | 0.900 | 657 | 81.7 | 85.3 | 87.7 | 4,919,127 | 2.83 | 2.49 | 2.48 | 2.61 |
- AHP: the binary comparisons for criteria and sub criteria were based on levels of importance obtained from the surveys. A difference of 1 level was given a score of 3 in the fundamental scale, a score of 5 for 2 levels of difference, 7 for 3 levels and 9 for 4. The performance of alternatives underwent linear normalization to obtain values in the fundamental scale. The criteria priorities were used as weights for all other methods.
- ELECTRE III: The criteria thresholds were fixed by the authors, considering a preference threshold set at twice the indifference threshold, and the veto threshold set to at least three times the preference threshold [19]. The effects of these values are considered in the sensitivity analysis. The values used are shown in Table 11.
- PROMETHEE II: To keep as much consistency as possible with ELECTRE III, most criteria were treated as Type 5, with a linear increase in preference after the indifference threshold was crossed. For the social criteria, considering the scale used, only one threshold was deemed relevant, and so they were treated as Type 2 criteria. The threshold values themselves were the same as those used in ELECTRE III. The only “cost” criterion was the economic NPV.
| Criterion | Indifference (q) | Preference (p) | Veto (v) |
|---|---|---|---|
| Peak flow | 0.03 m3/s | 0.06 m3/s | 0.18 m3/s |
| Volume | 50 m3 | 100 m3 | 400 m3 |
| TSS | 3% removal | 6% removal | 18% removal |
| TN | 3% removal | 6% removal | 18% removal |
| TP | 3% removal | 6% removal | 18% removal |
| NPV | $150,000 | $300,000 | $3,000,000 |
| Aesthetics | 0.5 | 1 | 3 |
| Acceptability | 0.5 | 1 | 3 |
| Life Quality | 0.5 | 1 | 3 |
| Sustainable Dev. | 0.5 | 1 | 3 |
4. Results
4.1. MCDA Rankings
| Alternative | AHP | ELECTRE III (Descending) | ELECTRE III (Ascending) | PROMETHEE II | MTOPSIS | ||||||||||
|---|---|---|---|---|---|---|---|---|---|---|---|---|---|---|---|
| C | E | P | C | E | P | C | E | P | C | E | P | C | E | P | |
| RG | 5 | 1 | 7 | 3 | 1 | 3 | 2 | 1 | 2 | 5 | 1 | 7 | 5 | 1 | 7 |
| PP | 11 | 11 | 12 | 5 | 2 | 8 | 3 | 2 | 3 | 9 | 10 | 12 | 1 | 5 | 12 |
| Br + RG | 7 | 3 | 8 | 8 | 2 | 3 | 10 | 1 | 4 | 7 | 2 | 5 | 8 | 3 | 1 |
| Br + PP | 12 | 12 | 11 | 9 | 4 | 8 | 7 | 6 | 8 | 11 | 11 | 11 | 3 | 6 | 11 |
| RG + GR | 6 | 2 | 6 | 4 | 7 | 4 | 5 | 3 | 7 | 6 | 3 | 8 | 6 | 2 | 4 |
| RG + PP | 1 | 6 | 3 | 1 | 2 | 1 | 1 | 2 | 1 | 1 | 5 | 4 | 7 | 9 | 8 |
| GR + PP | 9 | 9 | 10 | 6 | 3 | 3 | 6 | 5 | 5 | 10 | 9 | 10 | 2 | 4 | 10 |
| Br + RG + GR | 8 | 4 | 5 | 11 | 5 | 6 | 11 | 3 | 7 | 8 | 4 | 6 | 10 | 7 | 2 |
| Br + RG + PP | 3 | 8 | 4 | 7 | 4 | 2 | 7 | 5 | 1 | 3 | 7 | 2 | 11 | 11 | 3 |
| Br+ GR + PP | 10 | 10 | 9 | 12 | 8 | 7 | 8 | 7 | 5 | 12 | 12 | 9 | 4 | 8 | 9 |
| RG + GR + PP | 2 | 5 | 1 | 2 | 3 | 5 | 4 | 4 | 6 | 2 | 6 | 3 | 9 | 10 | 5 |
| Br + RG + GR + PP | 4 | 7 | 2 | 10 | 6 | 8 | 9 | 6 | 6 | 4 | 8 | 1 | 12 | 12 | 6 |
4.2. Ranking Analysis and Comparison
| Stakeholders | AHP | E. Descending | E. Ascending | PROMETHEE II | MTOPSIS |
|---|---|---|---|---|---|
| Citizens–Engineers | 0.54 | 0.63 | 0.39 | 0.54 | 0.59 |
| Citizens–Planners | 0.90 | 0.53 | 0.45 | 0.84 | 0.79 |
| Engineers–Planners | 0.48 | 0.44 | 0.44 | 0.40 | 0.07 |
| Main Criterion | Max Level of Importance | Min Level of Importance |
|---|---|---|
| Technical | 5 | 1 |
| Water quality | 5 | 1 |
| Economic NPV | 5 | 2 |
| Social Performance | 5 | 2 |
| Alternative Rank Variations | AHP | ELECTRE III (Des) | ELECTRE III (Asc) | PROMETHEE II | MTOPSIS |
|---|---|---|---|---|---|
| Minimum | 4 | 2 | 1 | 5 | 5 |
| Maximum | 11 | 9 | 8 | 11 | 11 |
| Average | 7.58 | 5.33 | 4.92 | 7.92 | 8.25 |
| Criteria Parameters | Peak Flow Reduction (m3/s) | Volume Reduction (m3) | Removal Rate (%) | Economic NPV ($) | Social Performance |
|---|---|---|---|---|---|
| Criteria weight | 0.075 | 0.225 | TSS: 0.06 TN, TP: 0.02 | 0.3 | Aesth, Accep: 0.038 LQ, SD: 0.113 |
| Initial Threshold value | 0.03 | 50 | 3 | 150,000 | 0.5 |
| Range of performance values | 0.19 | 613 | 30 | 4,052,993 | 2.02 |
| ELECTRE III Min acceptable value | 0 | 20 | 0.03 | 60,000 | 0.3 |
| ELECTRE III Max acceptable value | 0.092 | 613 | 6.71 | 706,000 | 2.02 |
| PROMETHEE II Min acceptable value | 0 | 17.8 | 0 | 0 | 0 |
| PROMETHEE II Max acceptable value | 0.19 | 613 | 30 | 245,000 | 0.9 |
5. Discussion
6. Conclusions
Supplementary Materials
Acknowledgments
Author Contributions
Conflicts of Interest
Abbreviations
| AHP | Analytical Hierarchy Process |
| BMPs | Best Management Practices |
| CHI | Computational Hydraulics International |
| ELECTRE | Elimination et Choix Traduisant la Réalité |
| EMC | Event Mean Concentration |
| IRDA | Institut de Recherche et de développement en Agroenvironnement |
| MCDA | Multi-criteria decision aid |
| MTOPSIS | Modified Technique for Order Preference by Similarity to Ideal Solutions |
| NPV | Net Present Value |
| PROMETHEE | Preference Ranking Organization Method for Enrichment of Evaluation |
| SCCT | Spearman’s rank Correlation Coefficient Test |
| SCS | Soil Conservation Society |
| STEP | Sustainable Technologies Program |
| SWMM | Storm Water Management Model |
| TN | Total Nitrogen |
| TP | Total Phosphorous |
| TSS | Total Suspenden Solids |
References
- Carvallo Aceves, M.; Fuamba, M. Methodology for Selecting Best Management Practices Integrating Multiple Stakeholders and Criteria. Part 1: Methodology. Water 2016, 8, 55. [Google Scholar]
- Rivard, G. Guide de Gestion des Eaux Pluviales; Ministère du Développement Durable Environnement et Lutte contre les Changements Climatiques: Quebec, QC, Canada, 2011; p. 386. [Google Scholar]
- Maystre, L.Y.; Pictet, J.; Simos, J.; Roy, B. Méthodes Multicritères ELECTRE: Description, Conseils Pratiques et cas D’application à la Gestion Environnementale; Presse Polytehcniques et Universitaires Romandes: Laussane, Switzerland, 1994; p. 323. [Google Scholar]
- Institut de Recherche et de Développement en Agriculture. Les grands-groupes de sol dominants du Québec méridional. Available online: http://www.irda.qc.ca/assets/documents/Pédologie/Cartes%20thématiques/Carte4_grand-groupe.pdf (accessed on 4 July 2015).
- Rivard, G. Gestion des Eaux Pluviales en Milieu Urbain: Concepts et Applications, 2nd ed.; ALIAS Communication and Design: Laval, QC, Canada, 2005; p. 329. [Google Scholar]
- Stormwater Source Controls Design Guidelines; Greater Vancouver Sewarage and Drainage District: Vancouver, BC, Canada, 2012; p. 306.
- Stormwater Management Planning and Design Manual; Ministry of Environment: Toronto, ON, Canada, 2003; p. 379.
- James, W.; Rossman, L.A.; James, W.R.C. User’s Guide to SWMM 5: [Based on Original USEPA SWMM Documentation], 13th ed.; CHI Press: Guelph, ON, Canada, 2010; p. 905. [Google Scholar]
- Chow, V.T.; Maidment, D.R.; Mays, L.W. Applied Hydrology; McGraw Hill: New York, NY, USA, 1988; p. 572. [Google Scholar]
- Cahill, T.H. Low Impact Development and Sustainable Stormwater Management; John Wiley & Sons: Hoboken, NJ, USA, 2012; p. 293. [Google Scholar]
- Dhalla, S.; Zimmer, C. Low Impact Development Stormwater Management Planning and Design Guide; Toronto and Toronto and Region Conservation Authority: Toronto, ON, Canada, 2010; p. 300. [Google Scholar]
- Ferguson, B.K. Porous Pavements; CRC Press: Boca Raton, FL, USA, 2005; p. 600. [Google Scholar]
- Schaus, L.K. Porous Asphalt Pavement Designs: Proactive Design for Cold Climate Use. Master’s Thesis, University of Waterloo, Waterloo, IA, USA, 2007; p. 95. [Google Scholar]
- Wark, C.; Wark, W. Green Roof Specifications and Standards. Available online: http://www.greenroofs.com/pdfs/newslinks-803_construction_specifier.pdf (accessed on 10 July 2015).
- Ahiablame, L.M.; Engel, B.A.; Chaubey, I. Effectiveness of low impact development practices: literature review and suggestions for future research. Water Air Soil Pollut. 2012, 223, 4253–4273. [Google Scholar] [CrossRef]
- Technical Support For The Bay-Wide Runoff Reduction Method Version; Technical Bulletin No. 4 Version 2; Chesapeake Stormwater Network: Baltimore, MD, USA, 2012; p. 49.
- Minnesota Pollution Control Agency. Calculating Credits for Green Roofs. Available online: http://stormwater.pca.state.mn.us/index.php/Calculating_credits_for_green_roofs (accessed on 20 June 2015).
- Sustainable Technologies Evaluation Program, Toronto and Region Conservation Authority. Low Impact Development Life Cycle Costs. Available online: http://www.sustainabletechnologies.ca/wp/home/urban-runoff-green-infrastructure/low-impact-development/low-impact-development-life-cycle-costs/ (accessed on 4 July 2015).
- Rogers, M.G.; Bruen, M.; Maystre, L.Y. Electre and Decision Support: Methods and Applications in Engineering and Infrastructure Investment; Kluwer Academic Publishers: Boston, MA, USA, 2000; p. 208. [Google Scholar]
- Sheskin, D.J. Handbook of Parametric and Nonparametric Statistical Procedures; CRC Press: Boca Raton, FL, USA, 2003; p. 1193. [Google Scholar]
- Chitsaz, N.; Banihabib, M.E. Comparison of Different Multi Criteria Decision-Making Models in Prioritizing Flood Management Alternatives. Water Resour. Manag. 2015, 29, 2503–2525. [Google Scholar] [CrossRef]
- Maté Marín, A. Sustainable stormwater management: Development of a decision-making tool to help in best management practices selection, case study in Laval (Canada). Master’s Thesis, Universitat Politècnica de València, València, Spain, July 2012; p. 171. [Google Scholar]
© 2016 by the authors; licensee MDPI, Basel, Switzerland. This article is an open access article distributed under the terms and conditions of the Creative Commons by Attribution (CC-BY) license (http://creativecommons.org/licenses/by/4.0/).
Share and Cite
Aceves, M.C.; Fuamba, M. Methodology for Selecting Best Management Practices Integrating Multiple Stakeholders and Criteria. Part 2: Case Study. Water 2016, 8, 56. https://doi.org/10.3390/w8020056
Aceves MC, Fuamba M. Methodology for Selecting Best Management Practices Integrating Multiple Stakeholders and Criteria. Part 2: Case Study. Water. 2016; 8(2):56. https://doi.org/10.3390/w8020056
Chicago/Turabian StyleAceves, Mauricio Carvallo, and Musandji Fuamba. 2016. "Methodology for Selecting Best Management Practices Integrating Multiple Stakeholders and Criteria. Part 2: Case Study" Water 8, no. 2: 56. https://doi.org/10.3390/w8020056