Article

Spatial-Temporal Distribution of Soil Salt Crusts under Saline Drip Irrigation in an Artificial Desert Highway Shelterbelt

1
Key Laboratory of Plant Nutrition and the Agri-environment in Northwest China, Ministry of Agriculture, Northwest A&F University, Yangling 712100, China
2
Xinjiang Institute of Ecology and Geography, CAS, Urumqi 830011, China
*
Authors to whom correspondence should be addressed.
These authors contributed equally to this work.
Water 2016, 8(2), 35; https://doi.org/10.3390/w8020035
Submission received: 2 July 2015 / Revised: 20 November 2015 / Accepted: 12 January 2016 / Published: 22 January 2016

Abstract

:
Understanding the formation and spatial-temporal distribution of soil salt crusts (SSCs) is important for the sustainable management of the artificial shelterbelt and high-salinity groundwater utility in the Taklimakan Desert in Northwest China. The SSCs in this area were sampled, and their thickness and electrical conductivity (EC) were analyzed to examine the formation mechanism and the spatial-temporal patterns of the SSCs in the shelterbelt, which is drip irrigated with high-salinity groundwater in the Taklimakan Desert. Results demonstrated the following: (1) Soil-moisture depletion and salt accumulation at the soil surface occurred simultaneously. The soil water and salt in the different areas around the drip irrigation emitter showed different temporal dynamics in an irrigation cycle; (2) SSCs EC increased at a logarithmic rate, and SSCs thickness increased linearly with irrigation water salinity; (3) SSCs showed evident spatial distribution around the drip irrigation emitter. The EC initially increased with increasing distance from the emitter but subsequently decreased in different directions around the emitter. The highest EC was recorded at 40 cm from the emitter; (4) Topography had a significant effect on the spatial distribution of SSCs. The EC at the upslope of the emitter was higher than that at the downslope; (5) SSCs thickness showed an initial rapid increase with shelterbelt age, which was followed by a gradual increase. However, EC decreased with shelterbelt age. Our findings can contribute to the shelterbelt design, construction, utility, and sustainable management and the soil and water conservation in shifting desert regions.

1. Introduction

A soil salt crust (SSC) is a special layer of topsoil with high concentrations of soluble salts, which mainly include Na+, Mg2+, Ca2+, Cl, and/or SO42− [1,2,3]. It is significantly different from physical and biological soil crusts. SSCs develop in some regions with shallow groundwater levels [1,2,4,5,6], saline-water irrigation [3,7], and saline surface and groundwater [8].
The Taklimakan Desert Highway Shelterbelt, which borders 436 km of the Taklimakan Desert Highway in Northwest China, was constructed in 2005. The shelterbelt successfully reduced the movement of shifting sand dunes on both sides of the highway and greatly protected the highway from the damage of shifting sand [9]. The plants in the shelterbelt are drip irrigated with local high-salinity groundwater (with salinities of 2.82–29.70 g·L−1) as a result of an extreme freshwater resource shortage. The high evaporative demand in the region results in a soluble salt accumulation at the topsoil and SSCs formation [10]. Although SSCs are widely distributed in the shelterbelt, the salt content in the rooting zone remains relatively low and is thus insufficient to injure plants [7,10].
The influence of long-term saline irrigation on the ecology of the Taklimakan Desert Highway Shelterbelt was examined by Lei et al. [9]. Shimojima et al. [11] established a relationship between evaporation and salinization. Zhang et al. [10] studied factors influencing salt accumulation in shifting sandy soils. Fujimaki et al. [12] simulated the soil evaporation process influenced by an SSC. Zhang et al. [3] discovered that SSCs reduced soil evaporation and that its chemical properties significantly changed across the different ages of the Taklimakan Desert Highway Shelterbelt. However, information on the formation and spatial-temporal distribution of SSCs when the shifting sands are subjected to high-salinity drip irrigation is inadequate.
This study aims to (1) explain the process of SSCs formation under high-salinity drip irrigation; (2) identify the effect of irrigation water salinity on SSCs formation; (3) examine the interannual dynamics of SSCs formation and SSCs microspatial distribution around the drip irrigation emitter; and (4) determine the best placement of drip irrigation emitters for water conservation and for the reduction of soil salt accumulation in the shelterbelt.

2. Materials and Methods
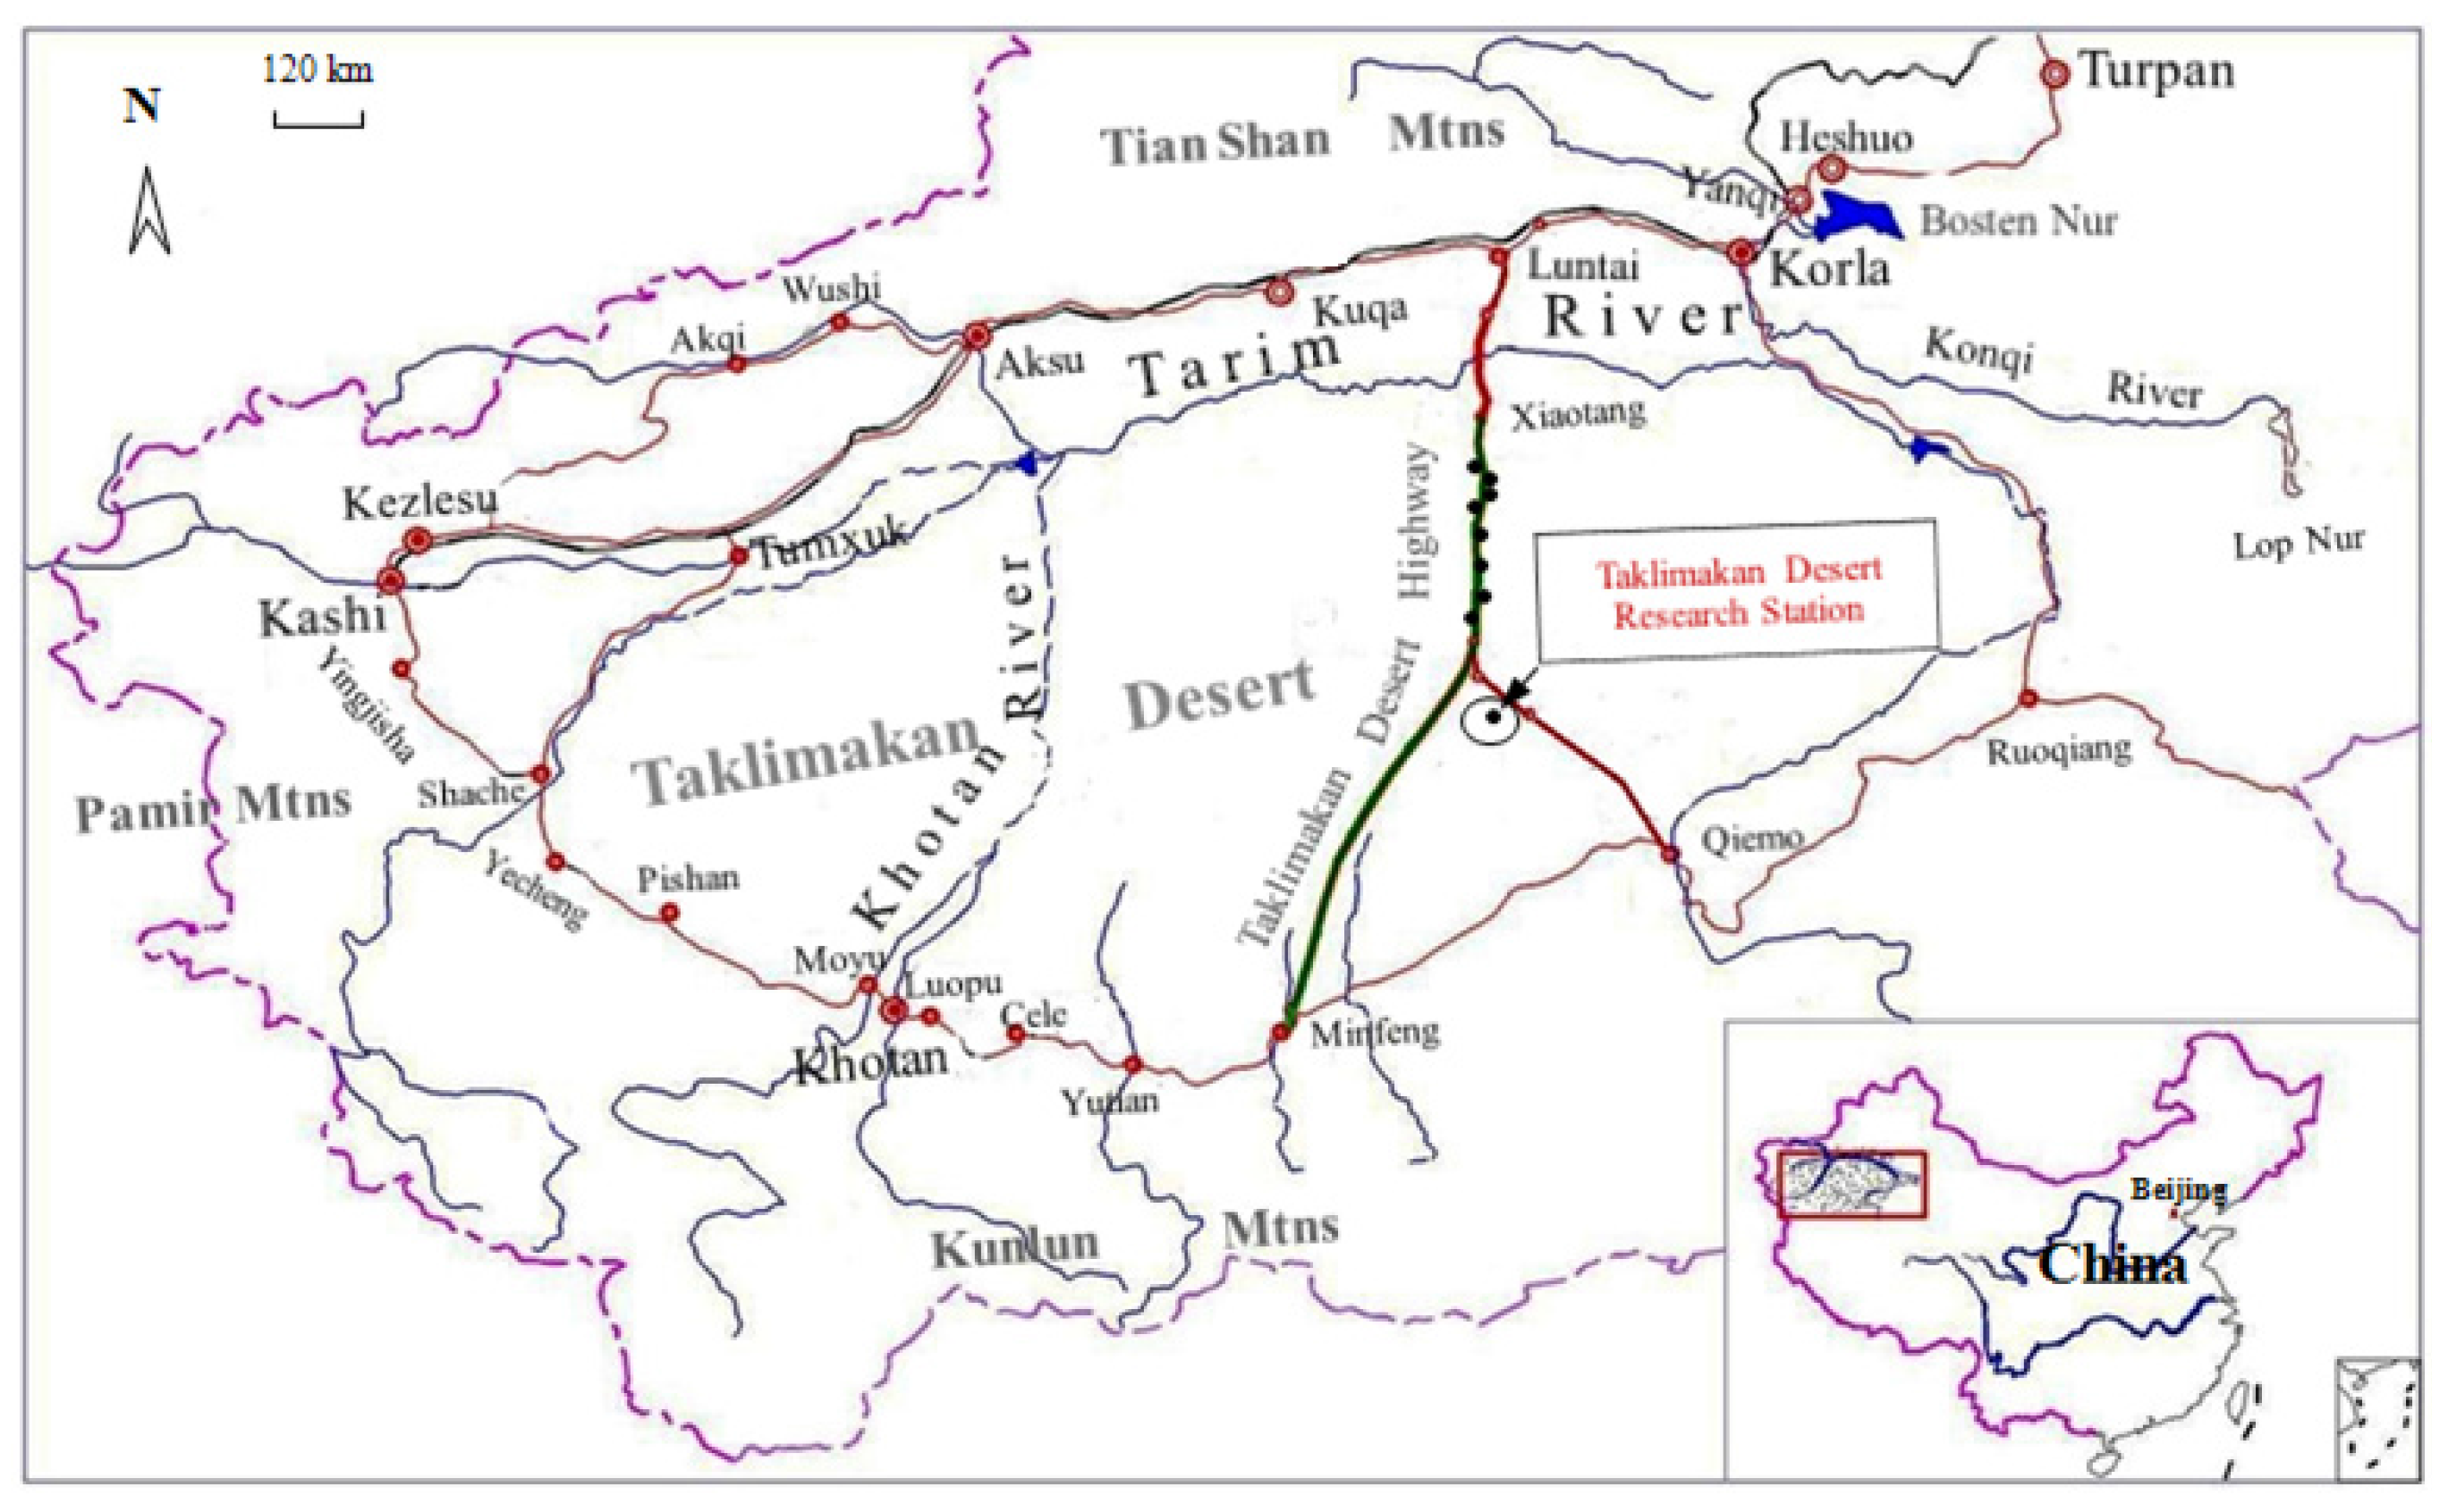
2.1. Study Site

This study was conducted along the Taklimakan Desert Highway Shelterbelt, which is known as the “Great Green Wall” in the Taklimakan Desert in Northwest China. The Taklimakan Desert Highway Shelterbelt begins in Luntai County (0 km) and ends in Minfeng County (562 km) (Figure 1). The region is characterized by extreme drought, with an average annual precipitation of 24.6 mm, an annual potential evaporation of 3639 mm, and an average annual relative humidity of 29.4%. The annual mean air temperature is 12.4 °C, with the coldest month being December (mean temperature of −8.1 °C) and the warmest month being July (mean temperature of 28.2 °C). The average annual wind speed is 2.5 m·s−1, with the maximum instantaneous wind of 20.0 m·s−1 at a height of 10 m. The 436 km highway transects the Taklimakan Desert, which is devoid of human settlement. The lack of water, severe shifting sand hazards, and inability to produce agricultural products render the region inhospitable to humans.
Figure 1. Taklimakan Desert Highway Shelterbelt and the sampling locations [3]. The green line indicates the Taklimakan Desert Highway Shelterbelt, and the black dots represent the sampling locations.
Water 08 00035 g001
Natural vegetation is extremely sparse along the Taklimakan Desert Highway, except for few highly drought-resistant shrubs growing in the interdune areas. The landscape is characterized by mobile dunes and large complex dune chains. The soils are mainly shifting Aeolian sands, which have salt contents of 1.26–1.63 g·kg−1 and pH values of 8–9 (Table 1). The groundwater levels of the interdune areas range from 3 to 5 m, the groundwater salinity range is 2.82–29.70 g·L−1, and the ionic contents are primarily Cl, SO42−, Na+, and K+ (Table 2).
Most portions of the shelterbelt were constructed in 2003, except for the shelterbelts at and nearby the Taklimakan Desert Research Station, which have been planted yearly since 1997. The plant species of the shelterbelt in the study area are mainly drought- and salt-tolerant bushes with excellent windbreak and sand fixation properties. The predominant species include Calligonum L., Tamarix L., and Haloxylon Bunge, and they are interspersed along rows with a spacing of 1 m × 2 m between plants. The plants are drip irrigated with local high-salinity groundwater with a salinity range of 2.82–29.70 g·L−1 (Table 2). The irrigation intervals are 15 days in March, April, May, September, and October and 10 days in June, July, and August. The irrigation application rate is 30 L per plant each time. Along the shelterbelt, nine sites (shown in Figure 1 and Table 2), which are irrigated at different salinities, were selected for SSC sampling. The salinities of the irrigation water from north to south are 29.70, 25.90, 20.99, 10.00, 18.36, 13.99, 4.82, 2.82, and 4.04 g·L−1. The freshwater used for the irrigation of the Taklimakan Desert Research Station served as the control in this study. Each site covers an area of 4 km in length and 72–76 m in width, except for the Taklimakan Desert Research Station, which covers an area of 70 hm2 with shelterbelts planted in different years. The plants at the Taklimakan Desert Research Station are customarily irrigated with 4.04 g·L−1 groundwater except under some special control experimental conditions. Only the Taklimakan Desert Research Station has available meteorological data. Thus, we assume the research station and the Taklimakan Desert Highway Shelterbelt as one unit, having a single climate situation.

2.2. Experimental Design

In this study, the spatial distribution and temporal dynamics of the SSCs in the study area were defined by its EC and thickness. The spatial-temporal characteristics of the SSCs were observed within the Taklimakan Desert Highway Shelterbelt and the Taklimakan Desert Research Station. Five distinct studies on SSCs formation were conducted as described in the following subsections.

2.2.1. Dynamics of Soil Moisture and Salt during a 10-Day Irrigation Cycle

In June 2012, the surface soils at the Taklimakan Desert Research Station before SSCs formation and the crusted layers were collected daily after irrigation (1) within the irrigated area (within 30 cm of the emitter); (2) in the horizontal wetting front (at a distance of 30–40 cm from the emitter); and (3) outside the wetting front (at a distance of 40–50 cm from the emitter). The thickness of the SSCs formed in the irrigated area was approximately 0.5 cm, so a topsoil (0–0.5 cm) sample was collected before SSCs formation. The soil moisture and EC values in the horizontal wetting front and outside the wetting front were relatively stable [10]. Thus, we collected soil samples only within the irrigated area at depths of 0–0.5, 0.5–10, 10–20, and 20–30 cm with a soil drill (diameter × height = 5 cm × 20 cm). The samples were analyzed for soil moisture and EC. The salinity of irrigation water at the Taklimakan Desert Research Station is 4.04 g·L−1; groundwater salinity presents more than 50% sections of the shelterbelt, so we chose it to monitor the moisture-salt dynamics and SSCs formation.
Table 1. Physicochemical properties of the shifting Aeolian sand in the study area.
pH (1:5)Total Salt Content (g·kg−1)Ions Composition (g·kg−1)Particle Composition (%)
CO32−HCO3ClSO42−Ca2+Mg2+Na+K+ClaySiltSand
8.26 ± 0.4321.33 ± 0.1460.02 ± 0.0230.11 ± 0.0520.70 ± 0.2550.01 ± 0.0020.10 ± 0.0230.01 ± 0.0140.32 ± 0.1260.06 ± 0.03011.41 ± 1.2416.94 ± 5.5871.65 ± 9.82
These values are the average of all the values obtained from the nine locations along the Taklimakan Desert Highway Shelterbelt. Three samples were collected at each location and were analyzed with common analytical methods [13].
Table 2. Chemical properties of the irrigation groundwater in the study area.
Sampling Location NumberLocation along the Desert Highway (km)Salinity (g·L−1)pHIon Composition (g·L−1)
HCO3ClSO42−Ca2+Mg2+K+ & Na+
1122.9929.707.800.2312.185.990.761.089.43
2125.0025.907.980.2010.545.470.730.967.46
3148.8020.997.580.198.974.850.690.835.40
4164.8018.368.090.177.844.240.600.734.74
5176.0013.998.020.135.983.230.460.553.61
6155.8010.008.020.094.372.140.240.312.84
7201.104.827.850.071.801.070.100.251.52
8255.202.827.400.061.070.690.070.090.83
9TDRS4.047.760.081.501.010.110.151.07
These values were obtained from the nine wells along the Taklimakan Desert Highway Shelterbelt, as shown in Figure 1, and were analyzed in the laboratory [13]. TDRS = Taklimakan Desert Research Station.

2.2.2. SSCs Formation Irrigated at Different Salinities

The plants at each site were irrigated with groundwater from that site. The salinity of the groundwater differed across the sites (excluding the Taklimakan Desert Research Station whose salinity is 4.04 g·L−1): 29.7, 25.9, 20.99, 10, 18.36, 13.99, 4.82, and 2.82 g·L−1. The salinities were stable based on the study of Fan et al. [14]. The chosen locations and chemical properties of the groundwater are shown in Figure 1 and Table 2. 5 emitters with well-formed SSCs were randomly selected, and SSCs outside the irrigated area were collected, because SSCs outside the irrigated area is least affected by irrigation and is most stable on EC and thickness.

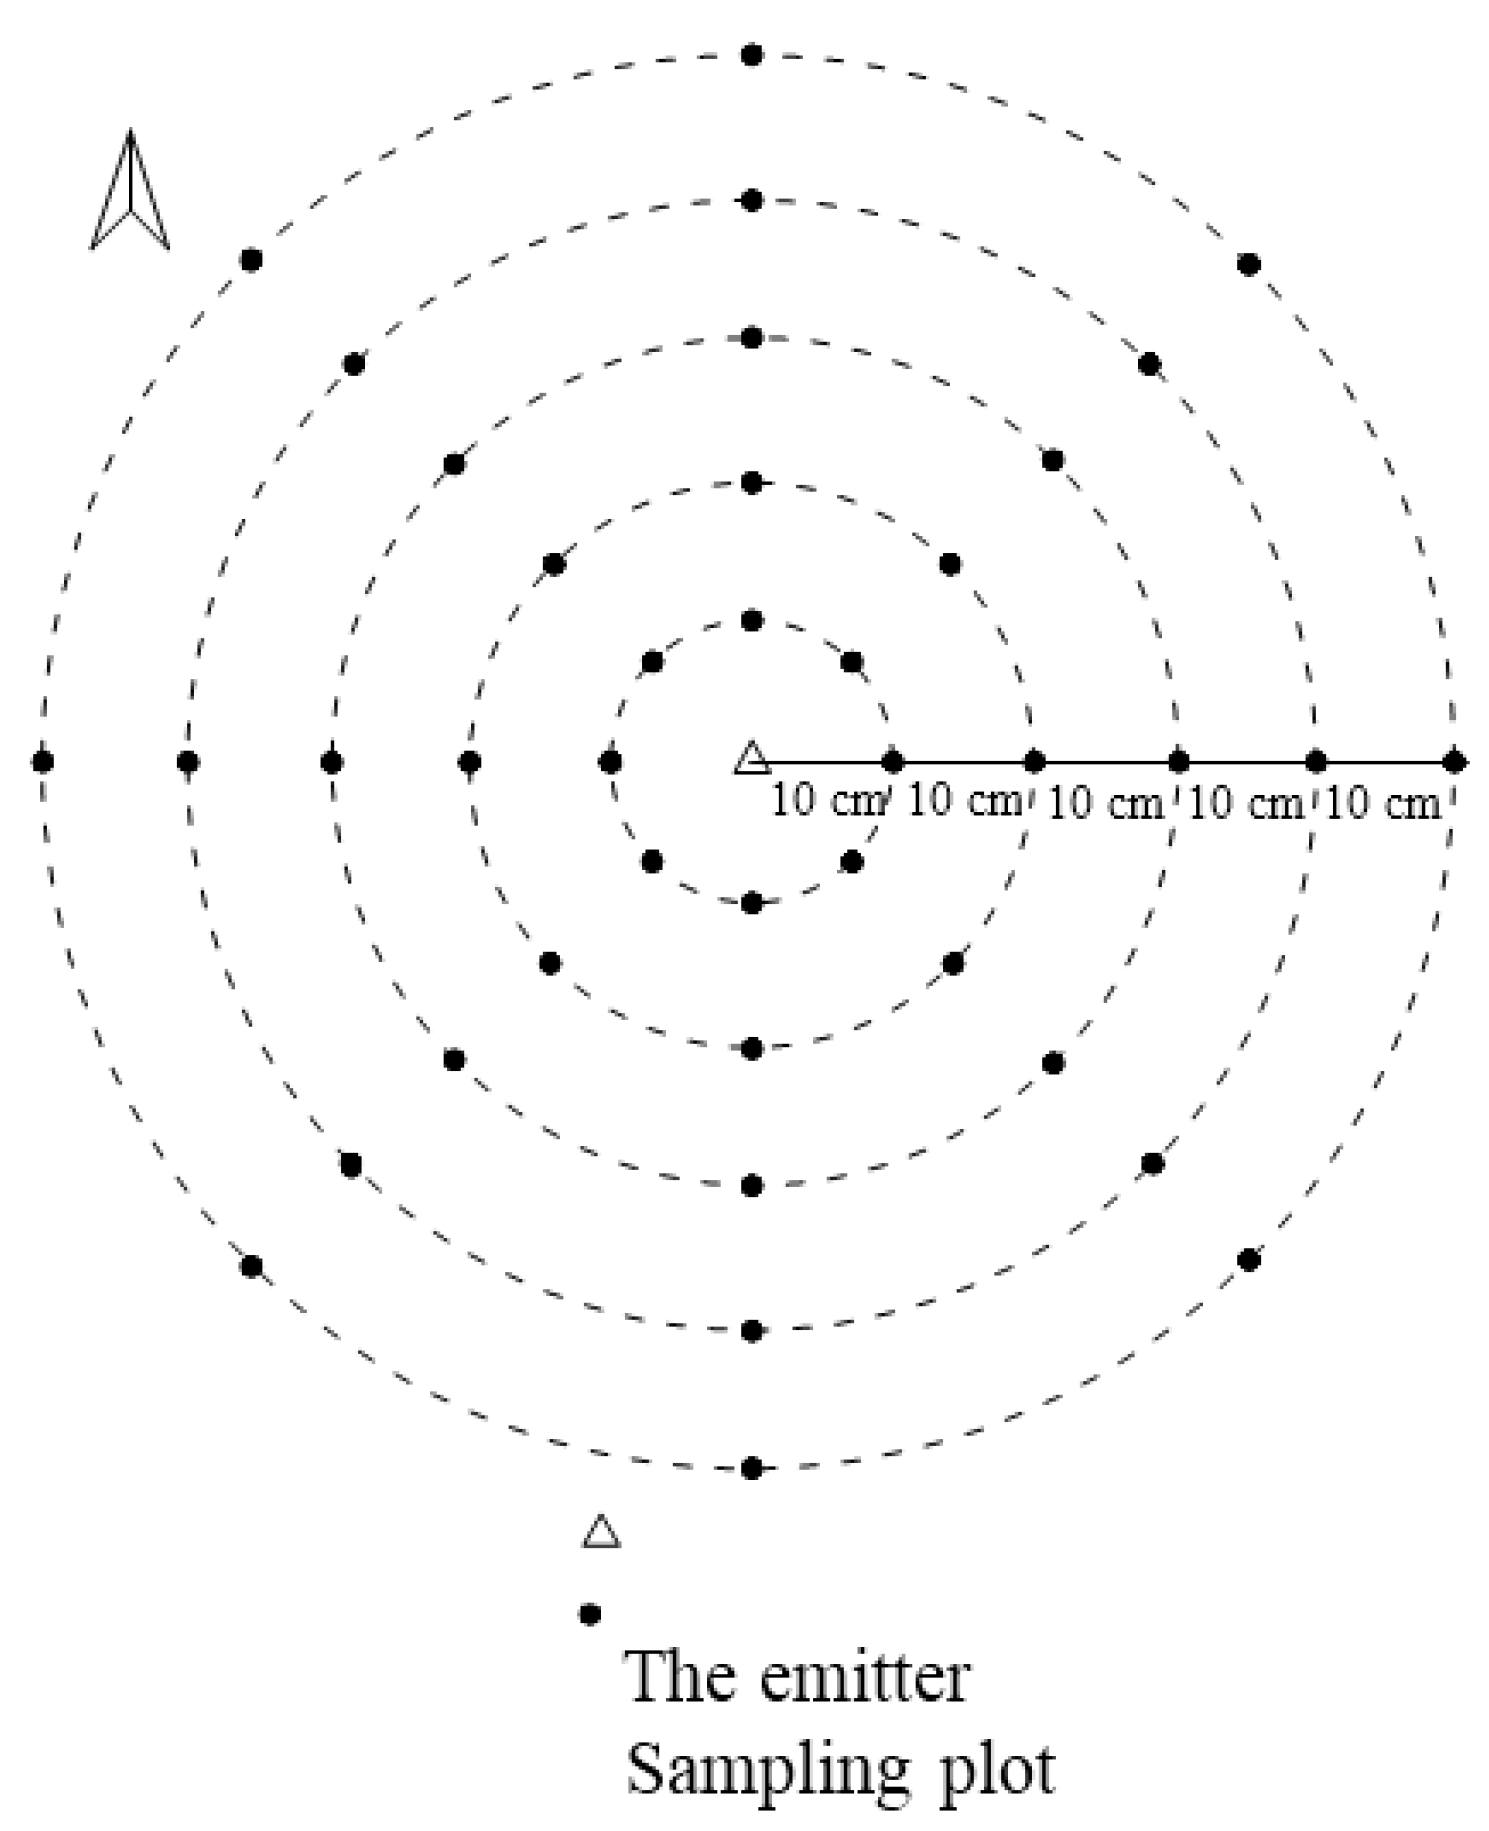
2.2.3. SSCs Spatial Distribution around the Emitter

For this study, we selected and considered two types of topography—flat sandy land and south-facing dune slopes with angles of 15°–25°. The SSCs formed at the shady dune slopes was similar to that formed at the south-facing dune slopes. From the shelterbelts planted in 2003 at these two types of topography near the Taklimakan Desert Research Station, five emitters were chosen at each topography type with a well-formed SSC. The SSCs were sampled in June 2013 to examine the spatial characteristics of the SSCs EC at different distances in eight radial directions from a chosen emitter (sampling spots are shown in Figure 2). The angle between two adjacent directions was 45°. 40 SSCs samples around each emitter were collected, and surface soil (0–0.5 cm) under the emitter was also collected. The spatial average was calculated after the analysis. The distance from one spot to another in one direction was 10 cm, and the longest distance from the drip emitter was 50 cm because the planting space in the shelterbelt is 1 m × 2 m.
Figure 2. Distribution of soil salt crust (SSC) sampling plots around the drip irrigation emitter.
Water 08 00035 g002

2.2.4. Monthly SSCs Dynamics

Five SSCs near the Taklimakan Desert Research Station were sampled on the 13th day of every month from May to September of 2012 to evaluate the monthly SSCs variation. The average values of the different treatments were calculated. The sampling method is the same as Section 2.2.2.

2.2.5. Annual SSCs Dynamics

The oldest shelterbelt was constructed in 1997, and the other shelterbelts were planted successively. Plant growth, microclimate, and soil properties significantly changed [9,15]. The SSCs in 1-, 4-, 7-, and 10-year-old shelterbelts at the flat sandy lands were sampled in June 2013. The shifting sandy soils were collected as the control. Quintuplicate samples were collected. The sampling method is the same as Section 2.2.2. We assumed that the samples could be compared according to the age of the shelterbelt because the shelterbelts were planted in different years under the same irrigation schedule.

2.3. Analysis of SSC Samples

During sampling, all samples were placed in a plastic bag in the field and then taken to the laboratory for further analysis. SSCs thickness was measured with a vernier caliper during sampling. Five pieces of the crust at each sample location were fractured to determine the largest edge. The thickness was then measured. The moisture content was determined through the sample mass loss after dehydration at 105 °C for 12 h. The EC was determined with a conductivity meter. Before EC analysis, the samples were air-dried, ground in a mortar, and then sieved through a 1 mm mesh. The samples were then placed in a flask containing one part soil and five parts distilled water, and subsequently shaken for 10 min in a thermostatic shaker [13].

2.4. Data Analysis and Treatment

At each location shown in Figure 1, a random sampling method was used to determine the area where the SSC samples were collected. Note that the sampling plots should not be located at the margin of the shelterbelt, and the growth of chosen plants should be normal and typical. All of the values were calculated from 5 replicates of a same treatment. The spatial distribution of SSCs EC was drawn using Golden Surfer 11.0, and the regression equations were obtained using Excel 2013.

3. Results

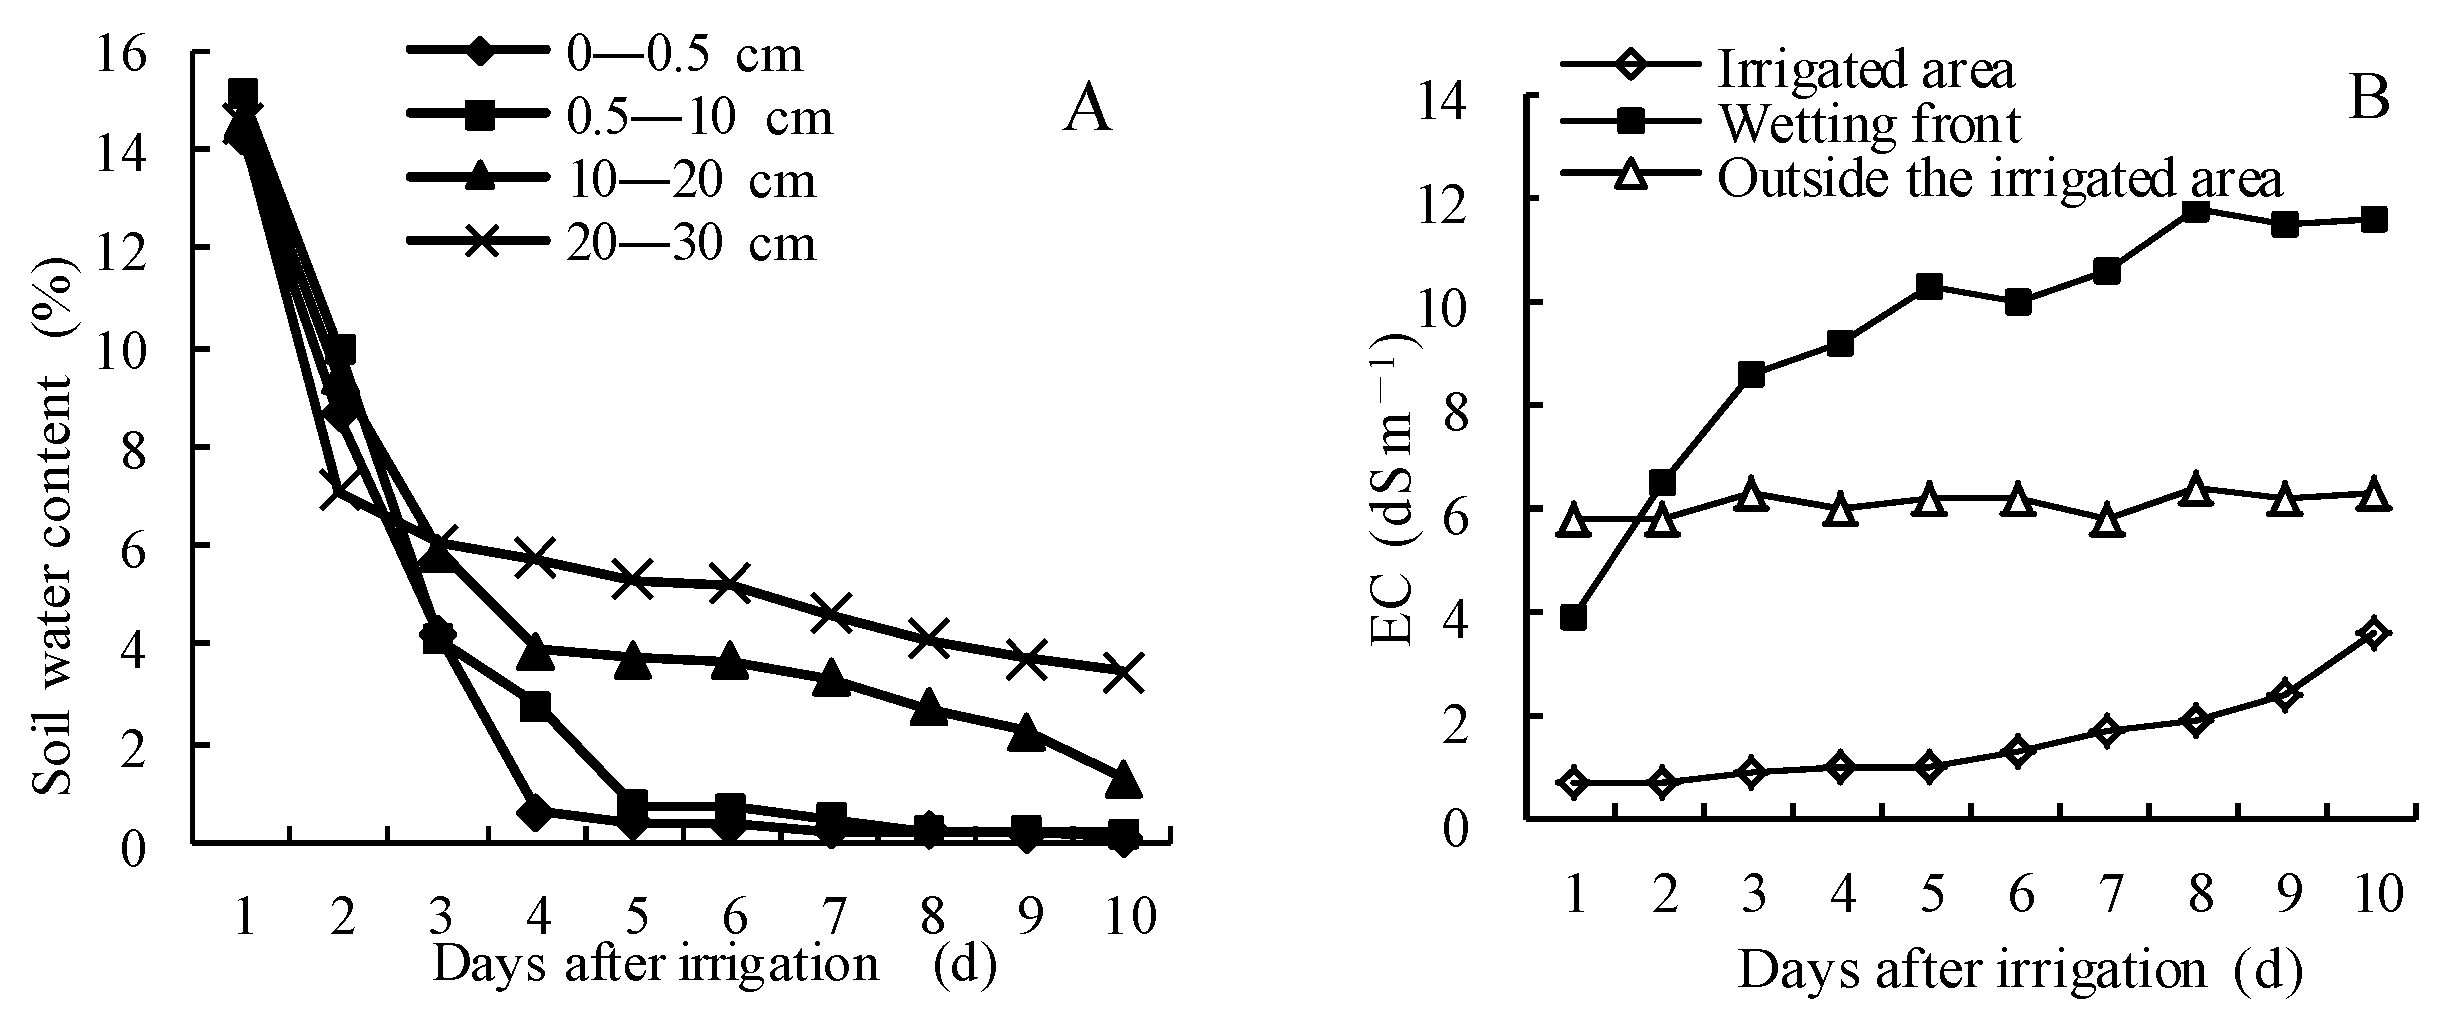
3.1. Dynamics of Soil Moisture and Salt during One Irrigation Cycle

Figure 3 shows the moisture dynamics of shallow soils (0–30 cm) in the irrigated area and the process of salt accumulation in different areas around the emitter during a 10-day irrigation cycle. Soil moisture depletion and salt accumulation occurred simultaneously. The rates of moisture loss and salt accumulation in the surface soil were the most rapid at one day after irrigation, but these rates diminished over time (Figure 3A). The SSCs EC in the irrigated area and the horizontal wetting front increased over time, whereas the EC outside the wetting front remained stable, with values ranging from 5.82 to 6.46 dS·m−1 (Figure 3B). As the EC rose as a consequence of salt accumulation at the soil surface, an SSCs formed on the fourth day after irrigation in the irrigated area. Meanwhile, the SSCs in the horizontal wetting front and outside the wetting front were always well formed before and after irrigation. The results demonstrated that SSCs formed when the EC was 1.03 dS·m−1 and the moisture was 0.6%. The EC in the horizontal wetting front was the highest, that in the irrigated area was the lowest, and that outside the irrigated area was medium. An SSC developed between emitters such that a continuous crust formed between emitters. The SSC in the irrigated area was destroyed after irrigation but reformed on the fourth day after irrigation.
Figure 3. (A) Soil moisture dynamics in the irrigated area under different soil depths; (B) salt accumulation process in different areas around the emitter.
Water 08 00035 g003

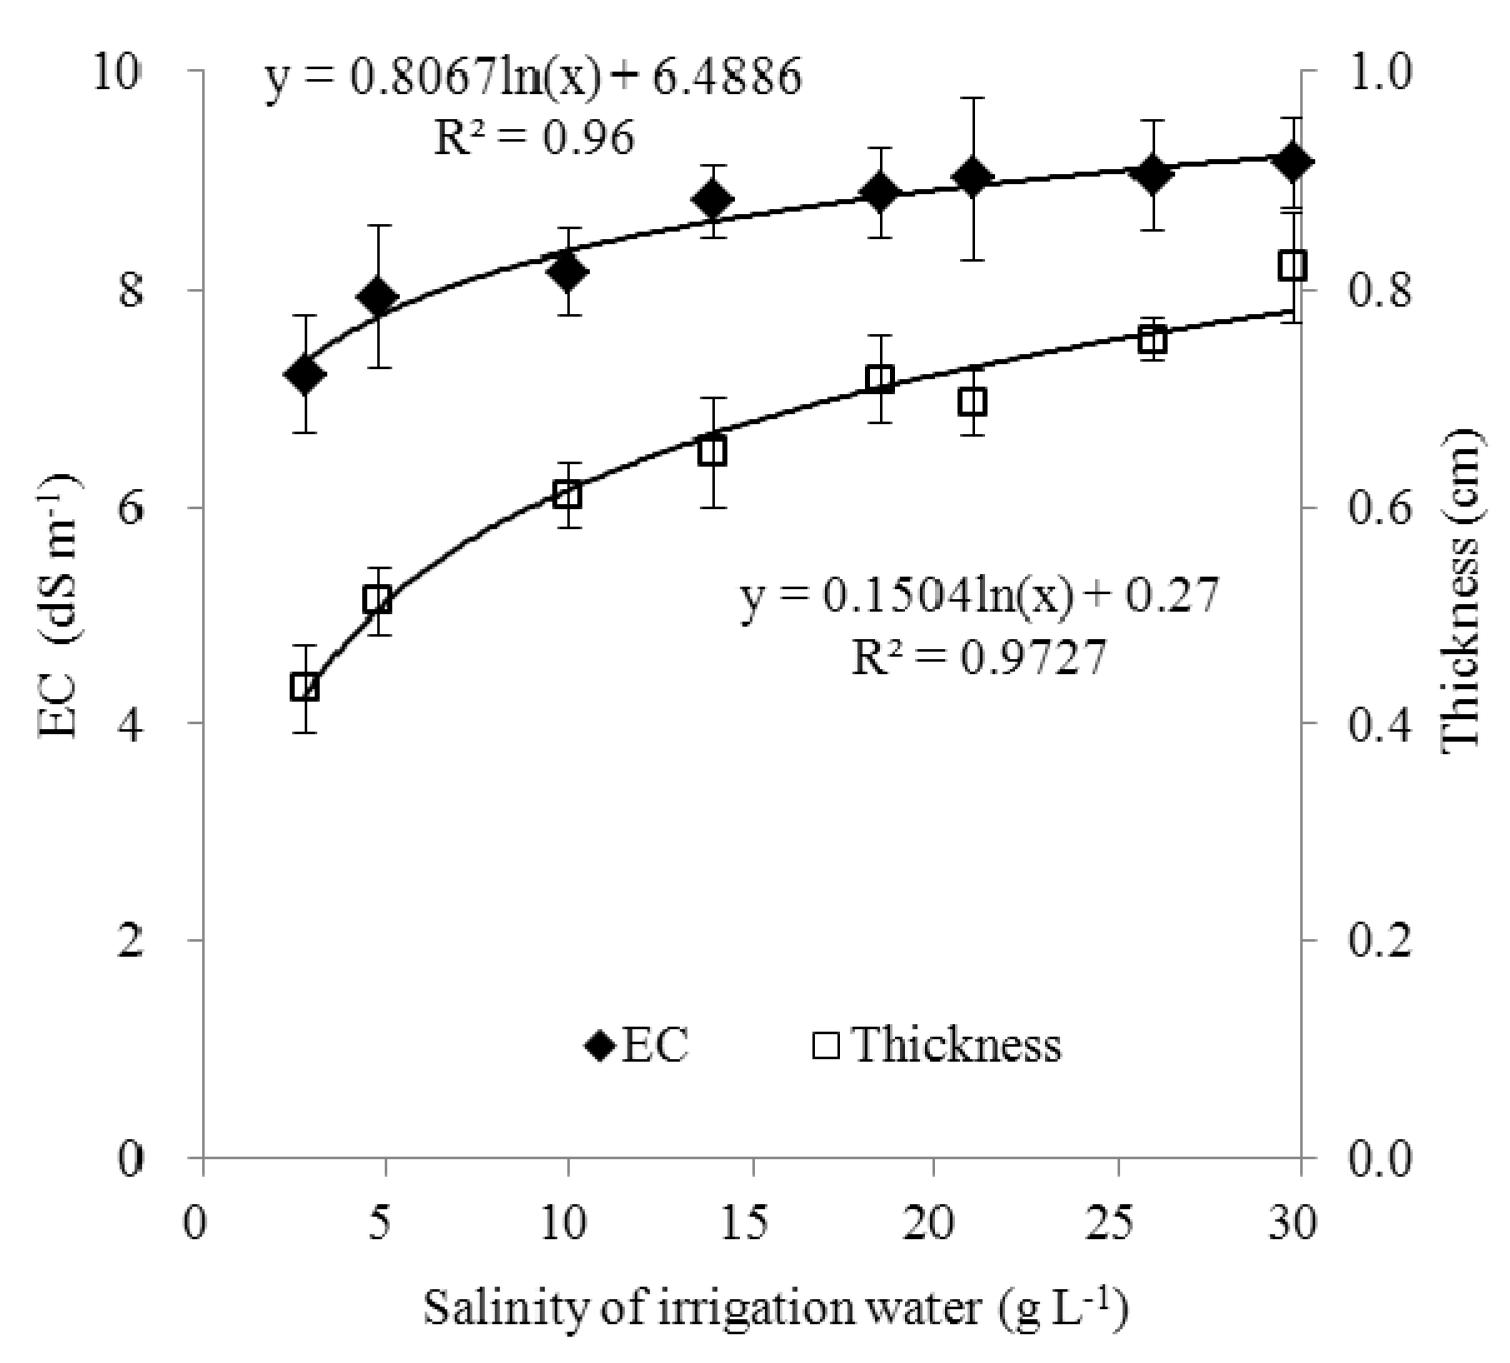
3.2. Effects of Irrigation Water Salinity on SSCs

Figure 4 shows that the lowest EC of SSC was 1.91 dS·m−1, and the smallest thickness was 0.35 cm under freshwater irrigation. On the contrary, the highest EC was 9.15 dS·m−1, and the largest thickness was 0.82 cm under 29.78 g·L−1 irrigation. SSC EC increased at a logarithmic rate, and the thickness linearly increased with irrigation water salinity (≤30 g·L−1). Under the same irrigation amount and irrigation cycle, irrigation water of a higher salinity transported more salts into the soil, thereby resulting in a higher degree of salt accumulation in the topsoil under an analogous potential evaporation. However, a high salinity level can reduce moisture evaporation [11], and an SSC, which easily forms under higher-salinity irrigation, can further reduce moisture evaporation [12,16]. Thus, as salinity increases, evaporation is reduced, thereby reducing the EC increment because of the lower amount of salt transported to the soil surface.
Figure 4. Variations in EC and thickness of soil salt crust drip irrigated with waters of different salinity levels in the Taklimakan Desert Highway Shelterbelt (corresponding sampling locations were shown in Figure 1). Error bars show 1 standard deviation.
Water 08 00035 g004

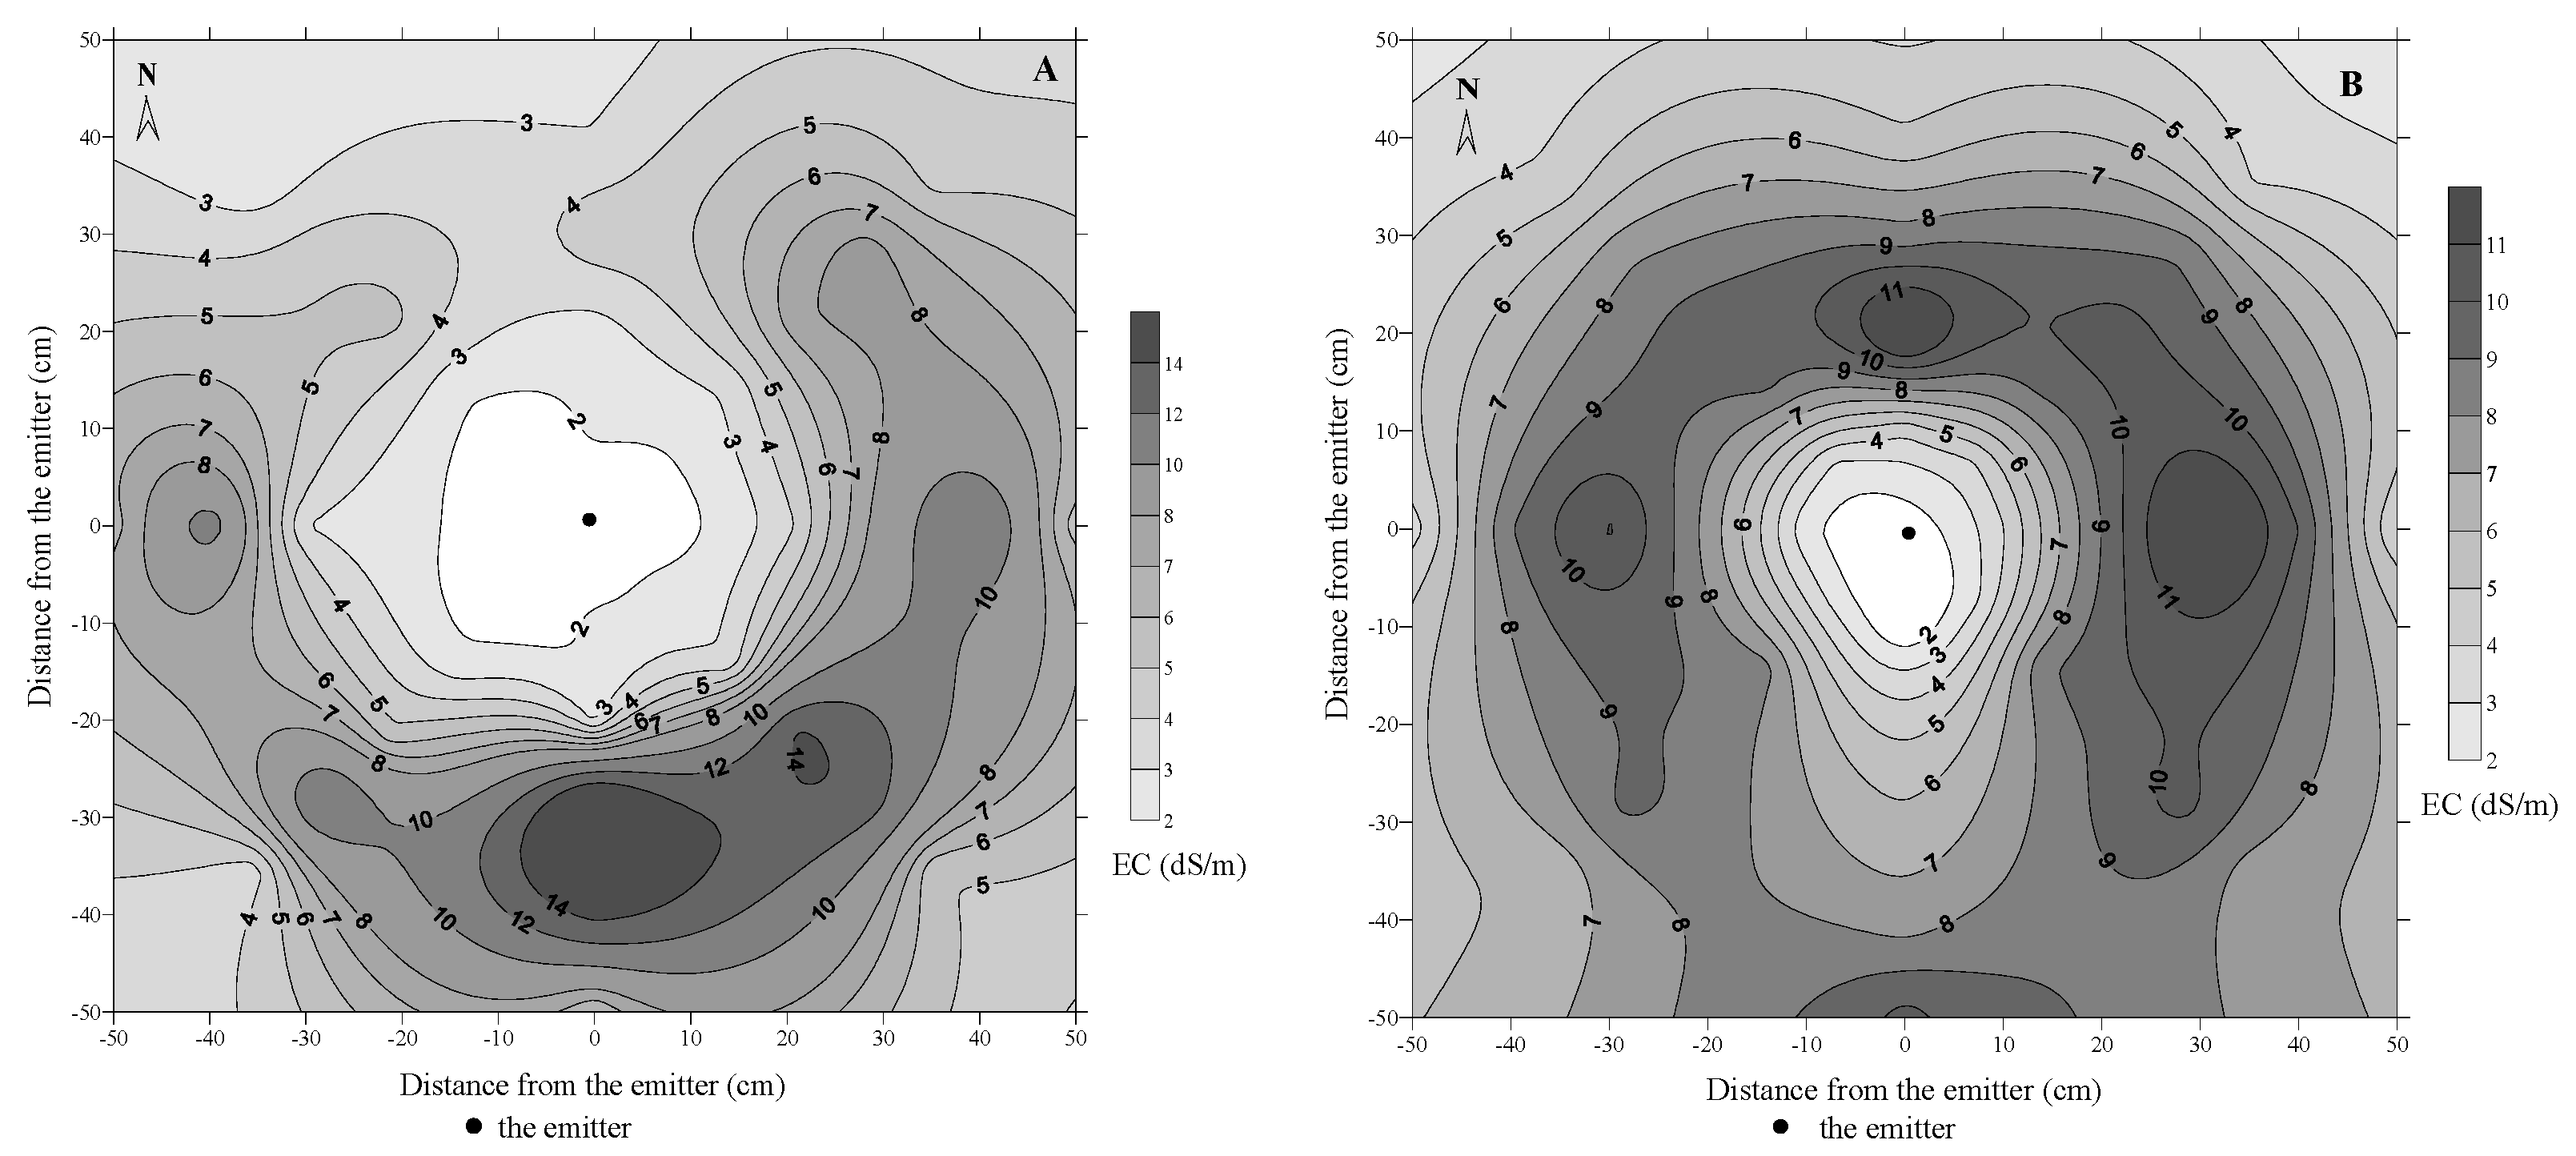
3.3. Spatial Variation in SSCs Affected by Emitting Positions

A crusted area of a certain size formed around an emitter, and the size of the crusted area was determined by the wetting area of the surface soil, the water output of the emitter, and the irrigation duration [7]. Figure 5 shows the spatial distribution of the SSC EC values around the emitters at the flat sandy land and the sunny dune slopes. The EC increased with the distance from the emitters and then decreased in different directions around the emitter. The EC values near the emitters were the lowest, with values of <2 dS·m−1. The highest EC value was recorded at 40 cm from the emitter.
Figure 5. Spatial distributions of soil salt crust EC values around the emitters at (A) the flat sandy land; and (B) the south-facing dune slopes with angles of 15°–25°.
Water 08 00035 g005
The EC at the flat sandy land (Figure 5A) was the lowest (approximately 2 dS·m−1) near the emitter. By contrast, the EC was high at 30–50 cm from the emitter toward the east, south, and west. The EC was the highest toward the south, whereas the EC in the north was considerably lower than those in the other directions. As shown in Figure 5B, in the sunny dune slope of 32°, the lowest EC distribution area was near the emitter (0–10 cm). The EC in the northeastern direction of the emitter was higher, whereas the EC at the downslope of the emitter was lower. The high SSC EC values appeared at the upslope 20–30 cm from the emitter, but they appeared farther (40–50 cm) from the emitter at the downslope. The EC values at the upslope were higher than those at the downslope.

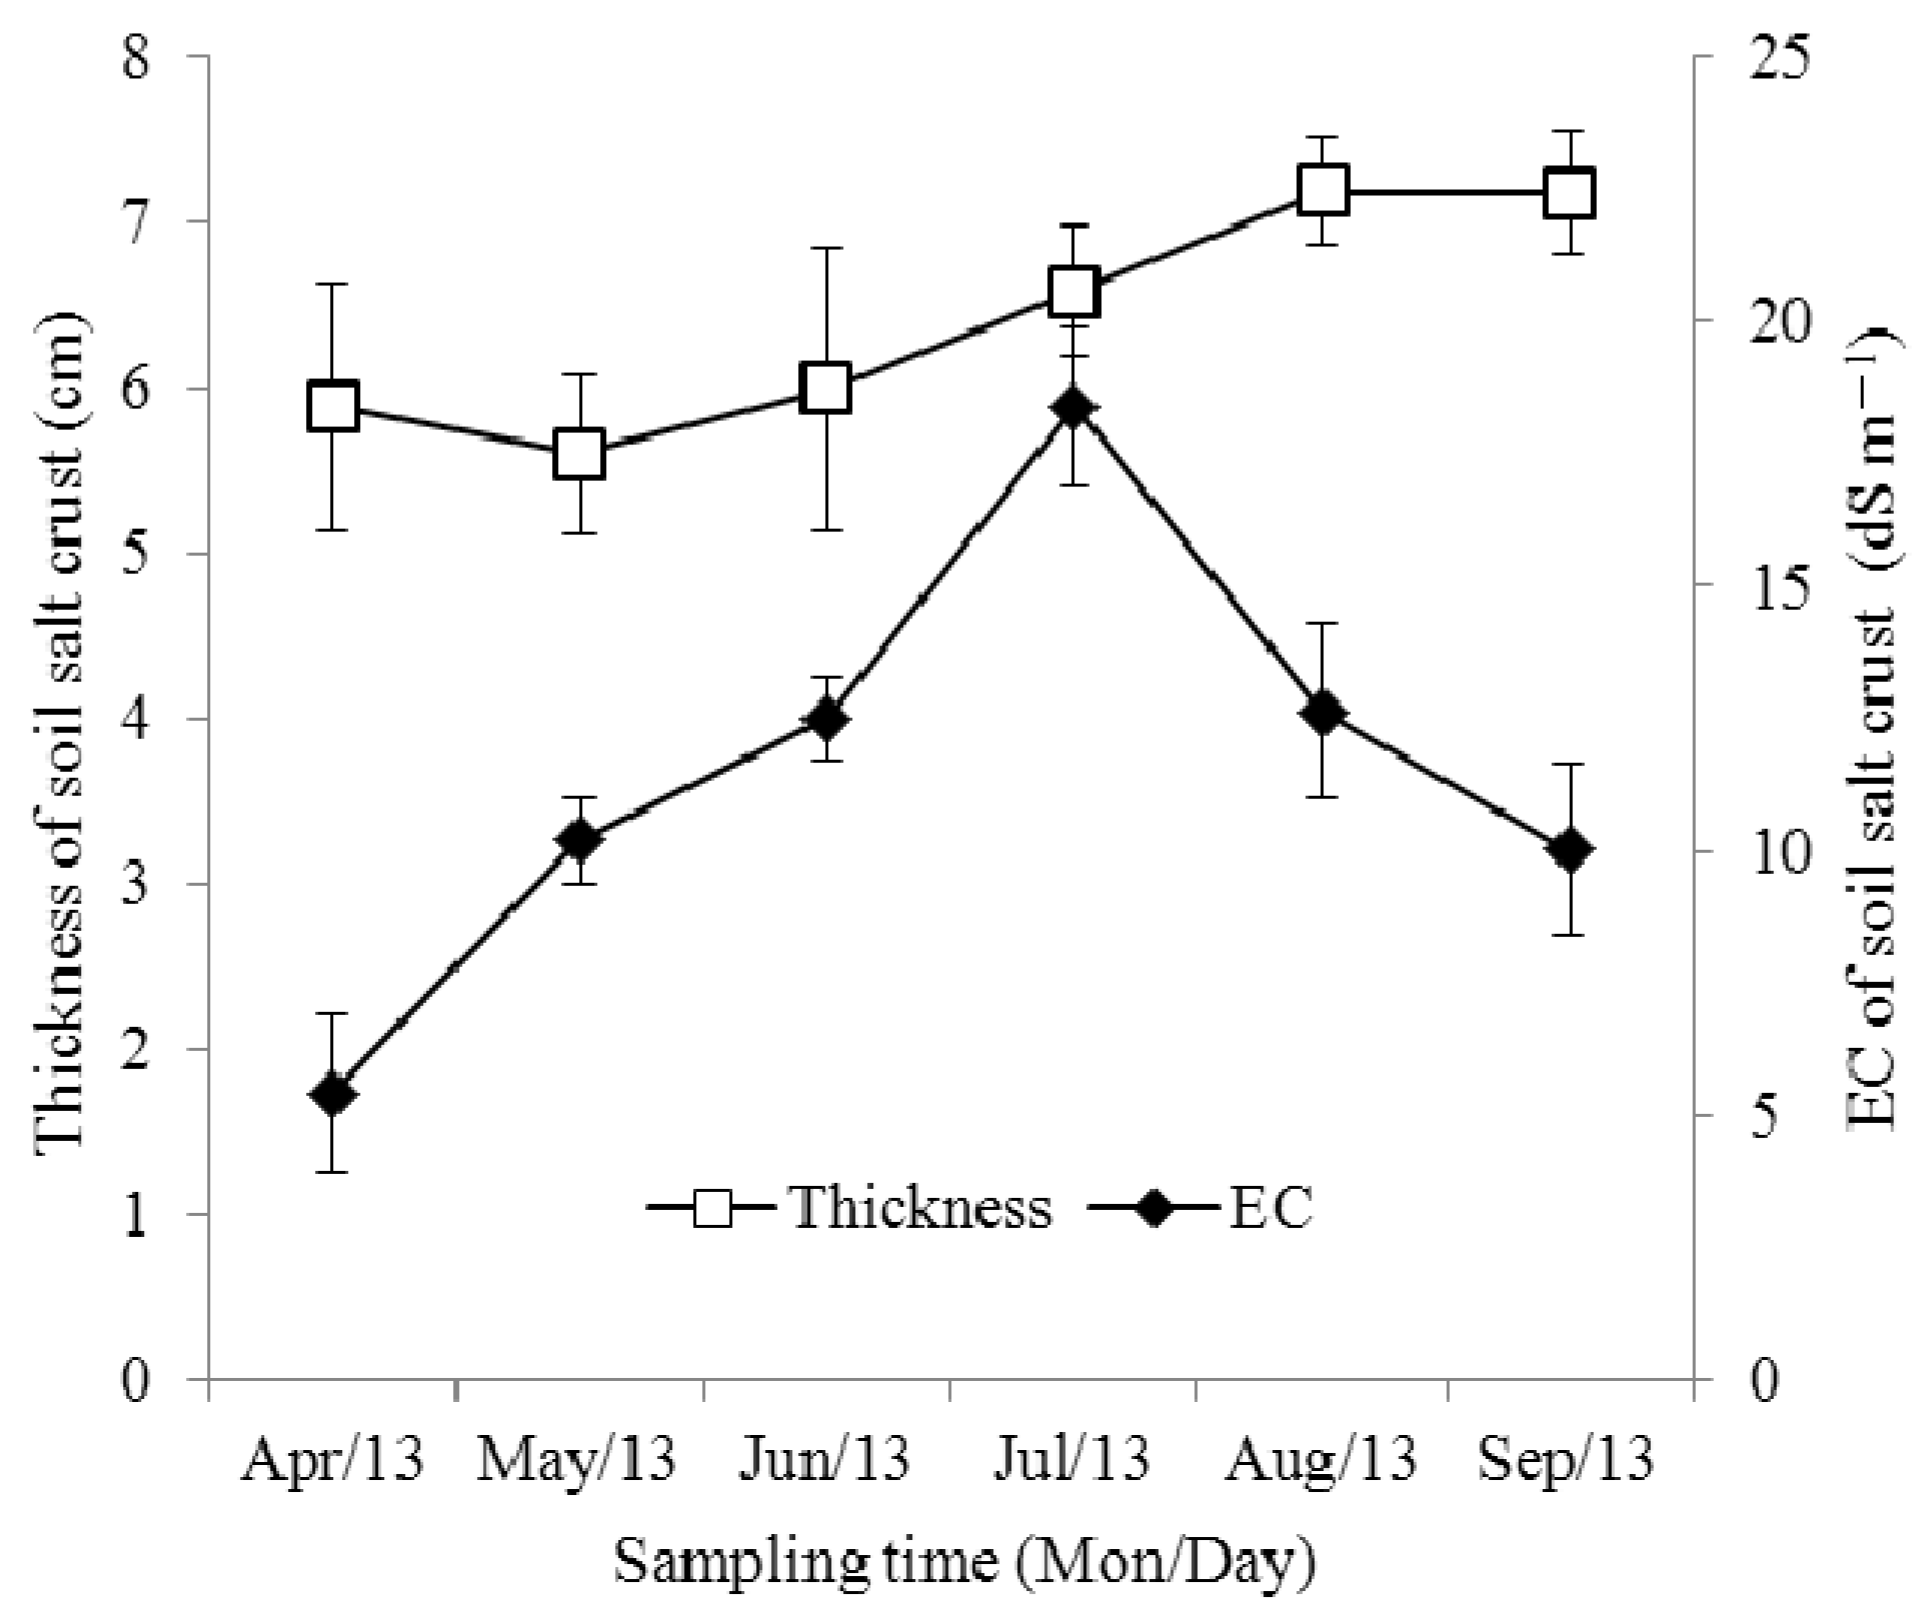
3.4. Monthly Variations

The EC and thickness of the SSCs showed obvious monthly variations during the growing season, as shown in Figure 6. The temperature in the study area also showed monthly variation [17], and our study showed that the EC exhibited a good consistency with the monthly average temperature, which means that SSCs EC demonstrated a high value when the average temperature was high. The highest EC was 18.40 dS·m−1 in July, whereas the lowest EC was 5.41 dS·m−1 in April, with a difference of 12.99 dS·m−1. However, the thickness increased from April to September and showed no positive connection with EC. The largest thickness was 7.19 cm in August, whereas the smallest thickness was 5.6 cm in May.
Figure 6. Monthly variations in soil salt crust thickness and EC during the growing season in the Taklimakan Desert Highway Shelterbelt irrigated with 4.04 g·L−1 groundwater. Error bars show 1 standard deviation.
Water 08 00035 g006

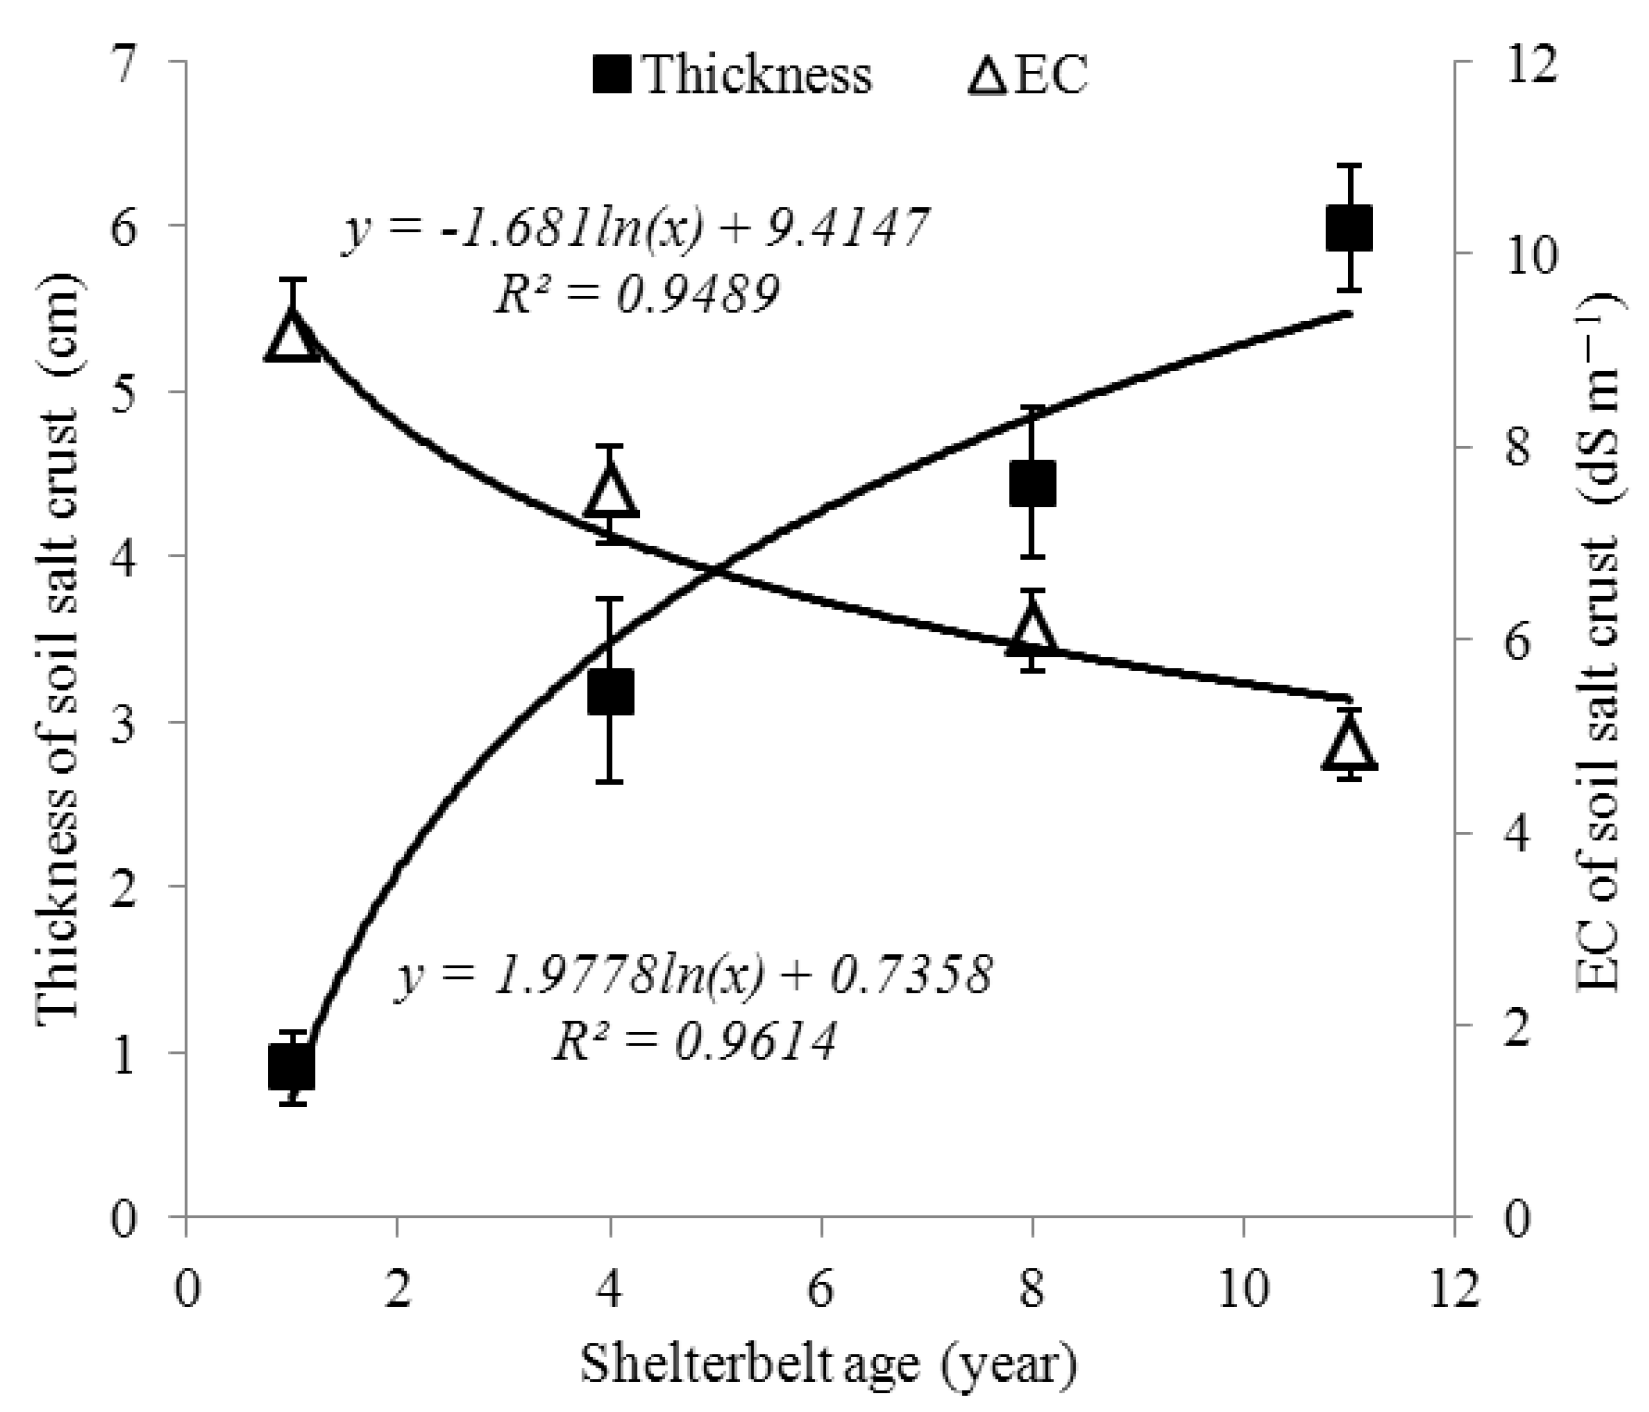
3.5. Effects of Shelterbelt Age on SSCs

Figure 7 shows the variations in SSC EC and thickness with shelterbelt age. A rapid increase in the thickness of SSC was initially observed, but, as the shelterbelt age increased, the increase became gradual. We assume that SSC thickness will stabilize in the 12th or 13th year after shelterbelt planting. The average SSC thicknesses were 0.91, 3.19, 4.45, and 5.99 cm for the 1-, 4-, 7-, and 10-year-old shelterbelts, respectively.
However, EC variation exhibited a trend opposite to that of thickness variation. The EC decreased with shelterbelt age. The average SSC EC values in the 1- and 4-year-old shelterbelts were 9.19 and 7.55 dS·m−1, respectively, showing a 17.78% reduction. The average SSC EC in the 7-year-old shelterbelt was 6.13 dS·m−1, which was 33.3% and 21.62% lower than the average EC values in the 1- and 4-year-old shelterbelts, respectively. The average SSC EC in the 10-year-old shelterbelt was 4.93 dS·m−1, which decreased is 19.50% lower than the average SSC EC in the 7-year-old shelterbelt.
Figure 7. Annual variations in soil salt crust thickness and EC in Taklimakan Desert Highway Shelterbelt irrigated with 4.04 g·L−1 groundwater. Error bars show 1 standard deviation.
Water 08 00035 g007

4. Discussion

4.1. Temporal Distribution of SSCs

The results of this study show that SSCs demonstrate daily dynamics in an irrigation cycle, monthly change, and annual variation under saline drip irrigation in the Taklimakan Desert Highway Shelterbelt. The soil moisture in the study area is mainly derived from irrigation because the groundwater levels are deeper than 15 m in most Taklimakan Desert areas, and the groundwater cannot rise to the monitored soil layers. After irrigation, the soluble salts move upward with soil water and accumulate at or near the soil surface because of increased available evaporative moisture at the early stage. These soluble salts then gradually move and accumulate slower as soil moisture decreases.
The atmospheric relative humidity in the study area is very low (29.40%) throughout the year. Low humidity enhances evaporative demand, causing salt accumulation in SSCs. Salt accumulation and leaching by irrigation occur simultaneously during the growing season [10]. Salt leaching by precipitation is weak in the Taklimakan Desert because the region receives less than 50 mm of annual precipitation. Irrigation results in some leaching of salts, thereby causing the monthly variation in EC.
SSC thickness increases, whereas EC decreases with shelterbelt age. Meanwhile, SSCs EC and thickness in shelterbelts planted for 1 and 4 years exhibit a positive and linear relationship (Figure 8). The SSCs in younger shelterbelts show higher EC and smaller thickness. The correlation coefficients of the relationship equations decrease as the shelterbelt age increases. Thus, the correlations of SSCs thickness and EC decrease with shelterbelt age. However, it seems that the regression relationships for 7 and 10 years are not robust. The thickness showed a larger range with the shelterbelt age increase, but EC tended to be more stable and lower. At the early stage of shelterbelt construction, when the plants are still small, the low coverage leads to high soil evaporation, which is ultimately conducive to salt accumulation on the topsoil [18]. Plant litter or residue increases with shelterbelt age; thus, a higher shelterbelt age results in soil-moisture evaporation reduction and less salt accumulation at the topsoil [19]. The growth of a shelterbelt results in the expansion of plant shade, the accumulation of atmospheric dust and plant litter at the soil surface, and the concealment of irrigation pipes with the accumulated sand and plant litter [20]. These factors may influence soil evaporation, SSCs formation, and composition.
Figure 8. Linear regression relationships between SSCs EC and thickness in shelterbelts planted in different years. (a): 1 year; (b) 4 years; (c) 7 years and (d) 10 years.
Water 08 00035 g008

4.2. Spatial Distribution of SSCs

The SSCs in the Taklimakan Desert Highway Shelterbelt demonstrate spatial variations around the emitter at different directions and different landforms. Irrigation water infiltrates vertically and horizontally simultaneously. This finding indicates that soluble salts leach to the wetting front vertically and horizontally. Meanwhile, moisture evaporates, and soluble salts accumulate at the topsoil, particularly in the wetting front [21]. Under drip irrigation, numerous durative small water entities form, and these entities can leach soluble salts to deeper soils and simultaneously push the salt outward in a pulsatile manner, thereby resulting in salt accumulation in the wetting front [10,22]. Consequently, minimal soil salt exists near the emitters. SSCs EC increases with the distance from the emitters in the wetting fronts and decreases outside the wetting fronts. An SSC is nearly circular with a radius of approximately 1 m around a single emitter. However, the planting spacing of the shelterbelt was 1 m × 2 m; thus, the SSCs in the shelterbelt are connected to one another. Plant shade strongly affects soil evaporation [17]. In the sampling field, the average height of the plants is approximately 65 cm, the average crown width is 67 cm × 60 cm, and the shadows are on the north side during sun exposure, thereby reducing moisture evaporation and decreasing salt accumulation. The SSC EC values in the east, south, and west directions are higher, owing to a higher degree of salt accumulation resulting from the more rapid evaporation in these directions as a consequence of longer sun exposure. At the dune slope, a large amount of soil water moves downward, whereas a minimal amount of water moves upward because of gravitation during irrigation. The wetting front at the downslope is advanced compared with that at the upslope. Thus, the amount of soluble salts leached to the deep soil layers at the downslope is greater than that at the upslope. However, the leaching effect is weaker at the upslope than at the downslope. The soil moisture, salt movement, and salt leaching effects under drip irrigation lead to the aforementioned SSCs spatial distribution at the dune slope. Thus, during shelterbelt construction at the flat sandy land, irrigation emitters should be placed on the northern side of the plants to save water. At the dunes, irrigation emitters should be placed at the upslope of the plants.

4.3. Response of SSCs to Irrigation Water and Other Factors

Under the current irrigation system, higher-salinity irrigation water introduced an increased amount of soluble salts into the soil, thereby resulting in a higher degree of salt accumulation at the soil surface because of moisture evaporation. Thus, SSCs EC increases with irrigation water salinity. However, high salinity and SSCs can reduce moisture evaporation [11,12,16]; thus, EC slightly increases with an increase in salinity. It is discovered that most SSCs in the irrigated areas reformed on the fourth day during the experimental period. However, SSCs formation process is influenced by several factors including salinity of irrigation water, air temperature, wind speed, etc. that would affect soil evaporation [10]. The chemical properties of SSCs formed in shelterbelts of different ages significantly differed [3]. Meanwhile, we should be aware that ion composition of irrigation water and soil physio-chemical properties may influence SSCs formation and properties, which needs further research.
After the construction of the entire shelterbelt, mobile dunes are successfully stabilized on both sides of the Taklimakan Desert Highway, and the atmospheric dust and finer soil particles are retained, thereby promoting SSCs formation because of the litter and decomposition of plants [9,23]. Plant litter increases the soil macropores, thereby increasing the infiltration rate and decreasing salt accumulation. Atmospheric dust particles accumulate at the topsoil of the shelterbelt because plants slow down the wind that increases clay particles in SSCs [24]. Clay particles can enhance sandy soil capillarity, which is suitable for salt accumulation in crust layers. With the interannual SSCs variation as basis, we can deduce that the influence of plant litter on SSCs is considerably stronger than that of dust accumulation.

4.4. Role of SSCs in Shelterbelts

SSCs are widely distributed at the top soils in the Taklimakan Desert Highway Shelterbelt and play an important role in shelterbelt sustainability. First, SSCs can reduce soil-moisture evaporation because of their dense microstructure [12,16], which satisfies the needs of plants for soil moisture. Second, SSCs can mitigate wind erosion [25,26], which is good for soil conservation. However, SSCs could be a potential threat to shelterbelt plants. Given the high soluble salt content of SSCs, unexpected strong precipitations can leach soluble salts downward to the main roots of the distribution layers of young plants, which may cause minimal toxic effect or even death among plants [27]. SSCs have both benefits and disadvantages. Understanding how to rationally utilize SSCs and avoid their concomitant risks is important and requires further research.

5. Conclusions

The Taklimakan Desert is subjected to extremely low precipitation and high evaporative demand. It possesses an extremely arid continental climate. In such a climate, SSCs easily form; thus, SSCs are widely distributed in the topsoil in the Taklimakan Desert Highway Shelterbelt, which receives drip irrigation with local high-salinity groundwater. The results in this study demonstrated that SSCs EC shows different temporal and spatial dynamics around emitters at different areas. The EC values of the irrigated area and the horizontal wetting front increase over time after irrigation, whereas the EC outside the wetting front remains stable over a drying cycle following an irrigation event. Both SSCs EC and thickness are strongly influenced by irrigation water salinity. The EC increases at a logarithmic rate, and the thickness linearly increases with irrigation water salinity. Both SSCs EC and thickness show obvious temporal and spatial distributions. The EC initially increases and then decreases as the horizontal distance from the drip emitter increases. The thickness significantly changes within a distance of 40 cm from the emitter, with the maximum thickness recorded at 40 cm. The SSCs thickness slightly changes beyond 40 cm from the emitter. The SSCs at flat sandy land and at sunny dune slopes show significant differences. The thickness and EC of the SSCs at the upslope position of the drip emitter are larger than those at the downslope position. SSC thickness increases with shelterbelt age and gradually tends to stabilize. SSCs EC increases at the early planting stage of the shelterbelt and then decreases with shelterbelt age. Irrigation emitters should be placed on the northern side of the plants when constructing shelterbelts. Our findings can contribute to shelterbelt design, construction, utility, and sustainable management and to the soil and water conservation in shifting desert regions.

Acknowledgments

This study was supported by the National Natural Science Foundation of China (Grant Numbers: 41471222, 41371234 and 41271341) and Basic Research Funds of Northwest A&F University (2452015351). We also thank the staff of the Taklimakan Desert Research Station for assisting us with field and laboratory works.

Author Contributions

All authors contributed to the experimental design, fieldwork, sample analysis, and writing of this manuscript. Jianguo Zhang conducted the experiments of SSCs formation and temporal distribution, Yongdong Wang conducted the experiments of spatial distribution, and they both together prepared the first draft of the manuscript. Ying Zhao and Xinwen Xu contributed numerous ideas to the study. Jiaqiang Lei and Shengyu Li provided some important suggestions on the methods to use and manuscript writing.

Conflicts of Interest

The authors declare no conflict of interest.

References

  1. Goodall, T.M.; North, C.P.; Glennie, K.W. Surface and subsurface sedimentary structures produced by salt crusts. Sedimentology 2000, 47, 99–118. [Google Scholar] [CrossRef]
  2. Howari, F.M.; Goodell, P.C.; Miyamoto, S. Spectral properties of salt crusts formed on saline soils. J. Environ. Qual. 2002, 31, 1453–1461. [Google Scholar] [CrossRef] [PubMed]
  3. Zhang, J.G.; Xu, X.W.; Lei, J.Q.; Li, S.Y.; Hill, R.L.; Zhao, Y. The effects of high salinity irrigation and shelterbelt age on the formation of soil salt crusts and soil evaporation in the Taklimakan Desert Highway Shelterbelt of Northwest China. J. Soil Sci. Plant Nutr. 2013, 13, 1019–1028. [Google Scholar]
  4. Joeckel, R.M.; Clement, B.A. Surface features of the Salt Basin of Lancaster County, Nebraska. Catena 1999, 34, 243–275. [Google Scholar] [CrossRef]
  5. Mees, F.; Singer, A. Surface crusts on soils/sediments of the southern Aral Sea basin, Uzbekistan. Geoderma 2006, 136, 152–159. [Google Scholar] [CrossRef]
  6. Santos, J.S.; Oliveira, E.; Bruns, R.E.; Gennari, R.F. Evaluation of the salt accumulation process during inundation in water resource of Contas river basin (Bahia-Brazil) applying principal component analysis. Water Res. 2004, 38, 1579–1585. [Google Scholar] [CrossRef] [PubMed]
  7. Li, S.; Lei, J.; Xu, X.; Li, B.; Wang, X. Characteristics of salt crust layers in the forests irrigated with saline water in mobile desert. J. Beijing For. Univ. 2007, 29, 41–49. [Google Scholar]
  8. Grünberger, O.; Macaigne, P.; Michelot, J.; Hartmann, C.; Sukchan, S. Salt crust development in paddy fields owing to soil evaporation and drainage: Contribution of chloride and deuterium profile analysis. J. Hydrol. 2008, 348, 110–123. [Google Scholar] [CrossRef]
  9. Lei, J.Q.; Li, S.Y.; Jin, Z.Z.; Fan, J.L.; Wang, H.F.; Fan, D.D.; Zhou, H.W.; Gu, F.; Qiu, Y.Z.; Xu, B. Comprehensive eco-environmental effects of the shelter-forest ecological engineering along the Tarim Desert Highway. Chin. Sci. Bull. 2008, 53, 190–202. [Google Scholar] [CrossRef]
  10. Zhang, J.G.; Xu, X.W.; Lei, J.Q.; Sun, S.G.; Fan, J.L.; Li, S.Y.; Gu, F.; Qiu, Y.Z.; Xu, B. The salt accumulation at the shifting aeolian sandy soil surface with high salinity groundwater drip irrigation in the hinterland of the Taklimakan Desert. Chin. Sci. Bull. 2008, 53, 63–70. [Google Scholar] [CrossRef]
  11. Shimojimaa, E.; Yoshioka, R.; Tamagawa, I. Salinization owing to evaporation from bare soil surfaces and its influence on the evaporation. J. Hydrol. 1996, 178, 109–136. [Google Scholar] [CrossRef]
  12. Fujimaki, H.; Shimano, T.; Inoue, M.; Nakane, K. Effect of a salt crust on evaporation from a bare saline soil. Vadose Zone J. 2006, 5, 1246–1256. [Google Scholar] [CrossRef]
  13. Bao, S.D. Soil and Agrochemical Analysis; China Agriculture Press: Beijing, China, 2000. [Google Scholar]
  14. Fan, J.L.; Xu, X.W.; Lei, J.Q.; Zhao, J.F.; Li, S.Y.; Wang, H.F.; Zhang, J.G.; Zhou, H.W. The temporal and spatial fluctuation of the ground-water level along the Tarim Desert Highway. Chin. Sci. Bull. 2008, 53, 53–62. [Google Scholar]
  15. Wang, H.F.; Lei, J.Q.; Li, S.Y.; Fan, J.L.; Li, Y.G.; Sun, S.G.; Chang, Q. Effect of the shelterbelt along the Tarim Desert Highway on air temperature and humidity. Chin. Sci. Bull. 2008, 53, 41–52. [Google Scholar] [CrossRef]
  16. Zhang, J.; Xu, X.; Lei, J.; Li, S. Effects of salt crust on soil evaporation condition with saline-water drip-irrigation in extreme arid region. Trans. CSAE 2010, 26, 34–39. [Google Scholar]
  17. Yang, Z.; Chen, W.; Chen, G.; Dong, Z. Characteristics of the weather in the hinterland of the Taklimakan Desert. J. Desert Res. 1995, 15, 293–298. [Google Scholar]
  18. Raz-Yaseef, N.; Rotenberg, E.; Yakir, D. Effects of spatial variations in soil evaporation caused by tree shading on water flux partitioning in a semi-arid pine forest. Agric. For. Meteorol. 2010, 150, 454–462. [Google Scholar] [CrossRef]
  19. Zhou, H.W.; Li, S.Y.; Sun, S.G.; Xu, X.W.; Lei, J.Q.; Liu, S.; Du, W.Y.; Yan, Z.; Wang, Y.C. Effects of natural covers on soil evaporation of the shelterbelt along the Tarim Desert Highway. Chin. Sci. Bull. 2008, 53, 137–145. [Google Scholar] [CrossRef]
  20. Zhang, J.; Zhao, Y.; Xu, X.; Lei, J.; Li, S.; Wang, Y. Effect of shifting sand burial on evaporation reduction and salt restraint under saline water irrigation in extremely arid region. Chin. J. Appl. Ecol. 2014, 25, 1415–1421. [Google Scholar]
  21. Zhao, X.; Xu, H.; Zhang, P.; Liu, X. Distribution characteristics of salinity in Elaeagnus angustifolia shelterbelt in extreme arid area. J. Soil Water Conserv. 2012, 26, 245–250. [Google Scholar]
  22. Zhang, P.; Zhao, X.; Zhang, T.; Zhang, G.; Li, B.; Xu, H.; Ye, M. Leaching salinity effect of drip irrigation on soil of oasis shelter forests in arid area. Trans. CSAE 2011, 27, 25–30. [Google Scholar]
  23. Sun, Y.; Li, S.; Xu, X.; Zhang, J.; Li, Y. Effects of the grain size and thickness of dust deposits on soil water and salt movement in the hinterland of the Taklimakan Desert. Chin. J. Appl. Ecol. 2009, 20, 1905–1911. [Google Scholar]
  24. Jia, B.Q.; Zhang, H.Q.; Zhang, Z.Q.; Ci, L.G. The study on the physical and chemical characteristics of sand soil crust in the Minqin County, Gansu Province. Acta Ecol. Sin. 2003, 23, 1442–1448. [Google Scholar]
  25. Langston, G.; Neuman, C.M. An experimental study on the susceptibility of crusted surfaces to wind erosion: A comparision of the strength properties of biotic and salt crusts. Geomorphology 2005, 72, 40–53. [Google Scholar] [CrossRef]
  26. Maurer, T.; Herrman, L.; Stahr, K. Wind erosion characteristics of Sahelian surface types. Earth Surf. Proc. Landf. 2010, 35, 1386–1401. [Google Scholar] [CrossRef]
  27. Zhang, J.; Xu, X.; Lei, J.; Li, S. Injury of unexpected strong precipitation to Calligonum under different factors: A case of the shelterbelt eco-project along the Tarim Desert highway. Arid Land Geogr. 2009, 32, 346–352. [Google Scholar]

