Article

Estimation of Variability Characteristics of Regional Drought during 1964–2013 in Horqin Sandy Land, China

School of Environment, Northeast Normal University, Changchun 130117, China
*
Author to whom correspondence should be addressed.
Water 2016, 8(11), 543; https://doi.org/10.3390/w8110543
Submission received: 21 August 2016 / Revised: 11 November 2016 / Accepted: 14 November 2016 / Published: 21 November 2016

Abstract

:
Drought has an important influence on the hydrological cycle, ecological system, industrial and agricultural production, and social life. Based on the different time scales of characteristics of drought variability, the standardized precipitation evapotranspiration index (SPEI), a multi-timescale index with consideration of evaporation, was used in this study to estimate the spatial and temporal variability characteristics of drought. Climatic data from 15 meteorological stations across Horqin Sandy Land during 1964–2013 were used to calculate the SPEI of 1, 3, 6, and 12 months. In order to examine the relationship between droughts and other variables, 10 extreme climate indices were calculated based on the daily precipitation and maximum/mean/minimum temperature data of 15 meteorological stations, and linkages between SPEI-12 and atmosphere indices were established using by the cross wavelet transform method. The results indicated that the climate of Horqin Sandy Land had a tendency towards drought conditions, which is particularly apparent from the year 2000 onwards. During the study period, drought events were frequent in the region. Mild drought occurred in a quarter of the month, with that of moderate, severe, and extreme drought accounting for 0.11, 0.05, and 0.02 of the total months. The spatial trend of multi-timescale drought revealed that there was an increase in the severity of drought throughout Horqin Sandy Land, among which the magnitude in southern parts was larger than that of northern parts. The results also showed that the short time scale drought negatively correlated with precipitation extremes and positively correlated with temperature extremes. Furthermore, the long time scale drought (SPEI-12) was associated with atmosphere indices. Significant resonance periods were found between El Nino southern oscillation (ENSO), the East Asian summer monsoon index (EASMI), and SPEI-12.

1. Introduction

Continued global climate warming has led to increasingly frequent cases of extreme weather and has caused great challenges in human survival and sustainable development of the social economy. Among them, drought is one of the most serious meteorological disasters because of its high frequency, long duration, and wide range of effects [1,2]. In recent years, drought has caused huge losses to agriculture [3]. Moreover, it has prompted intensified desertification and a high frequency of dust storms and falling water levels, which poses a great threat to the ecological environment and social economy [4,5]. Droughts can be classified into four categories—meteorological drought, hydrological drought, agricultural drought, and socioeconomic drought [6,7]. Among these, meteorological drought, hydrological drought, and agricultural drought are phenomena of an imbalance of the water cycle in different regions [8]. A variety of meteorological factors leads to an imbalance of precipitation and evaporation, triggering the occurrence of meteorological drought [9]. The development of meteorological drought causes a loss of soil moisture, which results in agricultural drought [10]. Persistent meteorological drought increases the surface evaporation, or phreatic evaporation, and increases the expenditure of surface water and groundwater. In addition, it may lead to thickening and drying of the unsaturated zone, which reduces the runoff under the same precipitation conditions. This can reduce the amount of water supplied to the groundwater, which ultimately induces hydrological drought [11]. These three types of drought are interrelated and interact in the environment system; however, meteorological drought is the basic reason for the occurrence of the other two types of drought. Drought is a major disaster in China. Statistical data have shown that the meteorological drought area in China increased by a rate of 66%/10 year over the past 60 years [12]. The frequency of severe and extreme drought increased from 28.6% to 47.6% during 1950–2011. The economic losses caused by drought account for 1.1% of the total gross domestic product (GDP), although the proportion could reach 2.5%–3.5% in severe drought years [13]. Obviously, the drought situation has become critical in China.
The devastating effects of drought have led to extensive studies that use drought indices to detect the change characteristics of drought [14,15,16,17]. Among them, the Palmer drought severity index (PDSI) and the standardized precipitation index (SPI) are most widely used to monitor and analyze the process of global and regional drought. Although the PDSI is a drought index based on the principle of water balance, its application has been limited to its complex calculation processes and a fixed time scale [18]. The SPI is obtained by the calculation of cumulative probability and is standardized by using the probability density function. In the calculation process, no parameters are related to the spatial and temporal distribution of precipitation, which reduces the temporal variation of the index calculation to better reflect drought in a different time and scale [19]. However, the SPI considers only precipitation and fails to consider the formation mechanism of drought. Previous studies have reported that evapotranspiration can consume 80% of precipitation. When the evapotranspiration increases, the regional water demand also increases, which exacerbates the intensity and extent of drought [20,21]. On the basis of the SPI, Vicente–Serrano proposed the standardized precipitation evapotranspiration index (SPEI) in 2010 [22]. Based on precipitation and temperature data, the index integrates the sensitivity of demand for evaporation of the PDSI and includes simple calculation and the multiple space–time attribute of the SPI [23]. Current applications of the SPEI are focused mainly on the monitoring, risk assessment, and forecast warning of drought or its impact on land systems [17,24,25,26]. Regarding the formation mechanism of drought, many studies focus mainly on the relative contribution of the interaction between local land and atmospheres to the formation of drought. However, on the inter-decadal scale, the effect of large-scale atmospheric indices such as El Niño southern oscillation (ENSO), Pacific decadal oscillation (PDO), Arctic oscillation (AO), and the East Asian summer monsoon index (EASMI) may be very important for the formation of drought [27].
One of China’s four major sandy lands, Horqin Sandy Land, is located at the northeast edge of the Asian monsoon region. The environment in the area is fragile with a highly sensitive response to climate change. You et al. found that climate warming has caused many adverse effects in the local agriculture and animal husbandry [28]. Duan et al. deemed that the regional climate shifted toward warmer and drier conditions during 1975–2010, which was favorable to desertification in Horqin Sandy Land [4]. In addition, many relevant studies have shown that the temperature in Horqin Sandy Land is increasing at a rate far greater than that at the global level [29,30,31], which will make the dry climate more arid in this area. As a typical semi-arid region in Northeast China, Horqin Sandy Land has incurred increasingly serious adverse effects from drought. Therefore, estimation of the variability characteristics of drought and its relationship between regional and large-scale climatic factors has an important significance for combating desertification, aiding farming and animal husbandry, and maintaining sustainable development of the local society and economy.
However, the few existing studies on drought in Horqin Sandy Land are not comprehensive and lack drought research based on a multi-timescale drought index; a more systematic study would show the manner in which drought interacts with other variables. Hence, the primary objectives of this study are to explore the drought index in Horqin Sandy Land by using the SPEI based on 1964–2013 datasets of precipitation and temperature; to estimate the spatiotemporal variability characteristics of regional drought by using the multi-timescale SPEIs of 1, 3, 6, and 12 months; to examine the relationships between the multi-timescale SPEI and extreme climate indices; and to explore possible linkages between drought and large-scale atmospheric indices such as ENSO, PDO, AO and EASMI.

2. Materials and Methods

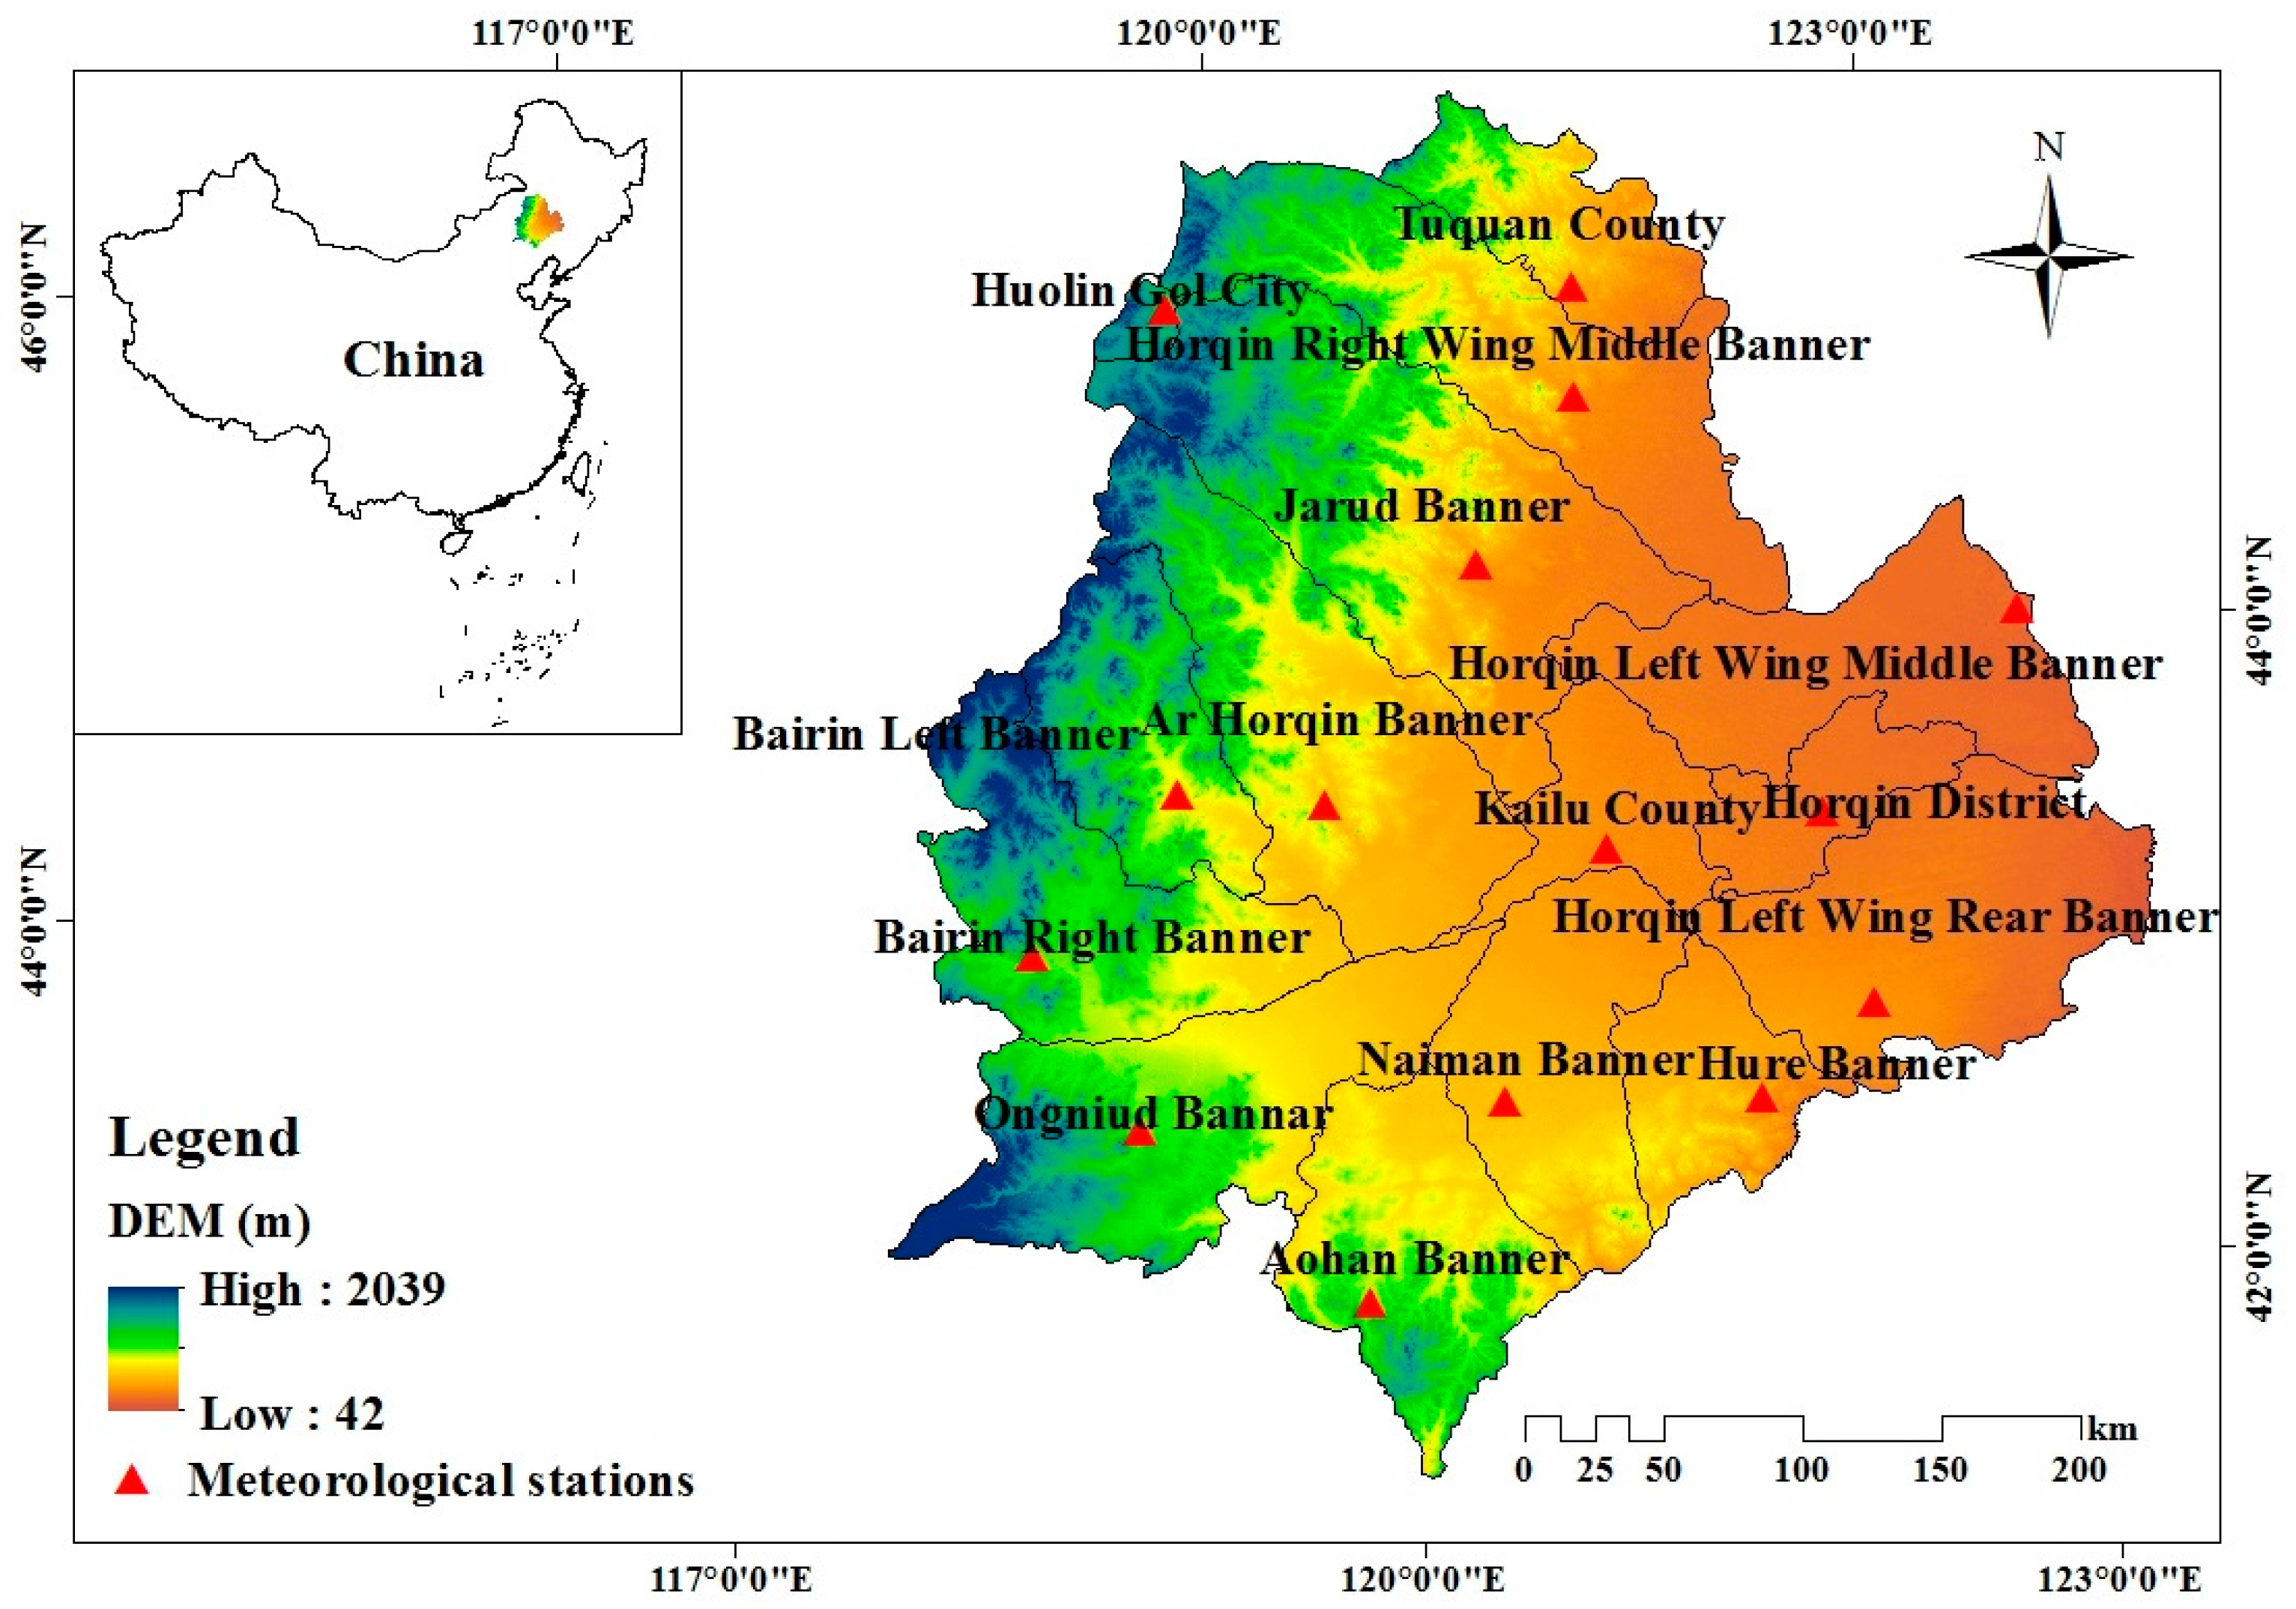
2.1. Study Area and Data

Horqin Sandy Land (117°49′–123°42′ E, 41°41′–46°05′ N) is located in the western part of Northeast China (Figure 1), which is the transition zone from the Mongolian Plateau to the northeast plain. The sandy land covers about 12.51 × 10⁴ km2 and includes the administrative regions of Tongliao City (Horqin District, Kailu County, Holin Gol City, Jarud Banner, Hure Banner, Naiman Banner, Horqin Left Wing Middle Banner, and Horqin Left Wing Rear Banner), part of Chifeng City (Barlin Right Banner, Barlin Left Banner, Aohan Banner, Ar Horqin Banner, and Ongniud Banner), and part of Hinggan League (Tuquan County and Horqin Right Wing Middle Banner). Horqin Sandy Land is a transition zone of semi-arid and semi-humid zones in China’s climatic regionalization. The annual average temperature in the area ranges from 6 to 9 °C. The annual precipitation is about 374 mm, of which 70%–80% occurs from June to August. Annual evaporation ranges from 1900 to 2000, which is about five times the precipitation. The predominant soil type in the area is aeolian sandy soil.
Daily precipitation and maximum/mean/minimum temperature records of 15 meteorological stations in Horqin Sandy Land recorded from 1 January 1964 to 31 December 2013 were collected from Meteorological Science Data Sharing Service of China. A pivot table in Excel was used to obtain the monthly records of the climate indices. In this study, monthly precipitation and mean temperature were chosen to calculate the SPEIs of 1-, 3-, 6-, and 12-month scales at 15 meteorological stations in Horqin Sandy Land. Daily precipitation and maximum/mean/minimum temperature were also used in the calculation of extreme climate indices.
Drought is ordinarily forced by extremes in natural climatic variations, which in turn are caused by internal interactions in the atmosphere and feedback from the oceans and land surface [32]. Many scholars have shown that droughts are likely to appear under the influence of atmospheric indices and have a certain influence on drought variability in China [33,34,35,36]. However, the effects of these atmospheric indices differ significantly in space. Thus, the use of mathematical statistics to reveal the relationship between atmospheric factors and drought in different regions has important significance for understanding the mechanism of drought formation. This study selected ENSO, PDO, AO, and EASM as four factors closely related to the formation of drought. ENSO refers to the mutual coupling of the tropical Pacific Ocean and the tropical atmosphere of Southern Oscillation [37]. A multivariate ENSO index (MEI), composed of sea-level pressure and zonal and meridional components of the surface wind, sea surface temperature, surface air temperature, and total cloudiness fraction of the sky, was chosen to characterize the phase and intensity of the ENSO phenomenon. Positive events of a MEI indicate El Niño events, which are warm events of ENSO [38]. The values for the MEI used here were obtained from Earth System Research Laboratory [39]. PDO is defined as the leading principal component of monthly sea surface temperature anomalies in the North Pacific Ocean, poleward of 20° N [40]. The warm position of PDO can cause and exacerbate regional drought [41]. The PDO index used in this study was obtained from College of the Environment, University of Washington [42]. AO is the main mode of the low-frequency variation of the atmospheric index in the Northern Hemisphere [36]. EASM is caused by the land–sea thermal contrast between the Pacific Ocean and the Eurasian continent, which affects the distribution of precipitation in East Asia [43]. The AOI and EASMI data used in this study were obtained from sharing data from Li’s personal home page [44].

2.2. Methodology

2.2.1. Standardized Precipitation Evapotranspiration Index

The SPEI is used to identify drought in a region with a deviation degree of difference between the precipitation and evapotranspiration from the average state [45,46].
1. The calculation of water balance was performed as follows:
D i = P i P E T i
where P i is precipitation (mm), and P E T i is the potential evapotranspiration (mm) obtained by the Thomthwaite method [21]. The main characteristics of this method are based on the monthly mean temperature (°C) and an established empirical formula considering the latitude factor (sunshine length). The calculation process is simple and can be expressed as
P E T i = 16.0 × ( 10 T i H ) A
where T i is the monthly mean temperature, H is the annual heat index, and A is the constant. The monthly heat index H i can be obtained by
H i = ( T i 5 ) 1.514 .
Then the annual heat index can be calculated by
H = i = 1 12 H i = i = 1 12 ( T i 5 ) 1.514 .
The constant is given by
A = 6.75 × 10 7 H 3 7.71 × 10 5 H 2 + 1.792 × 10 2 H + 0.49 .
When the monthly mean temperature is T i 0 , the monthly heat index is H i = 0 , and the potential evapotranspiration is P E T i = 0 .
2. The establishment of the water balance series in different time scales was performed as follows:
D n k = i = 0 k 1 ( P n i P E T n i ) , n k
where k is the time scale (month), and n is the calculation times.
3. Fitting the established series with three parameter log-logistic probability density function was performed as follows:
f ( x ) = β α ( x γ α ) β 1 [ 1 + ( x γ α ) β ] 2
where α is the scale parameter, β is the shape parameter, and γ is the original parameter. All of the parameters can be obtained by using the L-torque parameter estimation method. Then cumulative probability in a given time scale can be obtained as F ( x ) = [ 1 + ( α x γ ) β ] 1 .
4. After a standard normal distribution process, the SPEI can be obtained by
S P E I = W C 0 + C 1 W + C 2 W 1 + d 1 W + d 2 W + d 3 w ,   W = 2 ln ( P )
When P 0.5 , P = 1 F ( x ) ; When P > 0.5 , P = 1 P , and the symbol of the SPEI is reversed. The constants are C 0 = 2.515517 , C 1 = 0.802853 , C 2 = 0.010328 , d 1 = 1.432788 , d 2 = 0.189269 , and d 3 = 0.001308 . To fit the time scale of ADI, we used the SPEI time scales of 1, 3, 6, and 12 months, which are referred to as SPEI-1, SPEI-3, SPEI-6, and SPEI-12 in this paper. On the basis of regional characteristics and previous research result [47], the drought severity was classified according to the SPEI, as shown in Table 1.

2.2.2. Extreme Climate Indices

Extreme climate is a crucial driver of meteorological and hydrological hazards such as flooding and drought [48]. Therefore, it is of great importance to investigate the relationship between extreme climate indices and drought; similar studies could be helpful for understanding the mechanism of drought formation. At present, it is widely believed that drought events have increased owing to decreased precipitation and increased temperature [49]. Therefore, extreme precipitation and extreme temperature events should be associated with the existence of a certain degree of drought. The World Meteorological Organization (WMO) put forward 50 extreme climate indices [50], 10 of which, connected to extreme precipitation and high temperature, were selected for this study (Table 2). One kind of selected extreme precipitation indices are the number of days with precipitation including the number of heavy precipitation days (R 10mm), the number of very heavy precipitation days (R 20mm), and the number of consecutive dry days (CDD). The other shows the precipitation intensity including simple daily intensity index (SDII), annual total wet-day precipitation (PRCPTOT), and the number of very wet days (R95pTOT) [51]. The extreme temperature indices can be divided into extreme cold indices and extreme warm indices. Summer days (SU), tropical nights, (TR), and growing season length (GSL), which is defined by the absolute threshold, were chosen for this study. In addition, indices defined by the percentage threshold, including a warm spell duration indicator (WSDI), were selected [52]. The R-based program RClimDexV3, developed by the Climate Research Branch of the Meteorological Service of Canada, was applied in this study for extreme indices calculation [53]. Before data processing, storage of meteorological data must be ordered as year, month, day, daily precipitation, daily maximum temperature, and daily minimum temperature. A check revealed no missing values or error records, and the monthly values of the indices were calculated for 15 stations in Horqin Sandy Land during 1964–2013.

2.2.3. Statistical Method

1. Sen’s Slope Estimator

If a linear trend is present in a time series, then the true slope (change per unit time) can be estimated by using a simple non-parametric procedure developed by Sen [54]. The calculating formula of Sen’s slope is as shown as
Q k = m e d i a n ( X j X i ) j i ( k = 1 , , N )
where X j and X i are data values at times j and i ( j > i ), respectively. The median of these N values of Q k is Sen’s slope. In this study, Sen’s slope was used for examining the trends of the SPEI. Then, the Mann–Kendall (MK) statistical test was used to estimate the significance of the trends [55,56]. In this study, a significance level of 0.05 was applied.

2. Cross Wavelet Transform

Cross wavelet transform is a type of signal analysis method that combines wavelet transform and cross-spectrum analysis. This method considers the relationship of two time series in the time–frequency domain from the multi-timescale and can also reveal the consistency and correlation of the two series at different time scales to show the relationship in the time–frequency domain [57,58]. Cross wavelet transform defines the two time series X n and Y n as W x y = W X W Y * , where * is the complex conjugate. The cross wave spectrum is defined as | W X Y | , and the background power spectrum of the two series P k x and P k y can be defined as
D ( | W n x ( S ) W n Y * ( S ) | σ X σ Y < p ) = Z v ( p ) v P k X P k Y
where Z v ( p ) is the confidence level of probability, P, which is obtained from the square root of the product of the two χ 2 division wave spectra. The phase angle can describe the local relative phase relationship of the time series X and Y in the time frequency domain. The phase angle is defined as the circular mean of the set of angles:
α m = arg ( X , Y ) = arg [ i = 1 n cos ( a i ) , i = 1 n sin ( a i ) ] .
The standard deviation of the wavelet phase angle is calculated as
s = 2 ln ( R / n )
where s indicates the discrete trend metrics, which are in the range of 0 ~ . R = X ¯ 2 + Y ¯ 2 is the resultant length of the set of angles. The mean resultant length R/n is a measure of the concentration of angles ranging from 0 to 1.
Cross wavelet transform was adopted in this study to reveal the time–frequency transformation relationship between the SPEI and large-scale atmospheric indices. The “V”-type black line in figure indicates the threshold value of effective spectra. The area within this line indicates the effective spectral value, whereas that outside the line indicates an invalid spectral value. The black line in the figure represents the area in which the time scale of the oscillation passes the 0.05 level of significance of the noise standard spectrum. Arrows indicate the phase relationship between the two time series, in which → indicates that the SPEI and the atmosphere index are in phase. This indicates a positive correlation between the two series. On the contrary, ← indicates that the SPEI and the atmosphere index are in anti-phase, indicating a negative correlation between the two series. ↑ indicates that the SPEI is 90° behind, and ↓ indicates that the SPEI is 90° ahead. However, in the results, few of the phase angles were 90°. Different angles indicate the difference in the time when the SPEI is behind or ahead.

3. Results

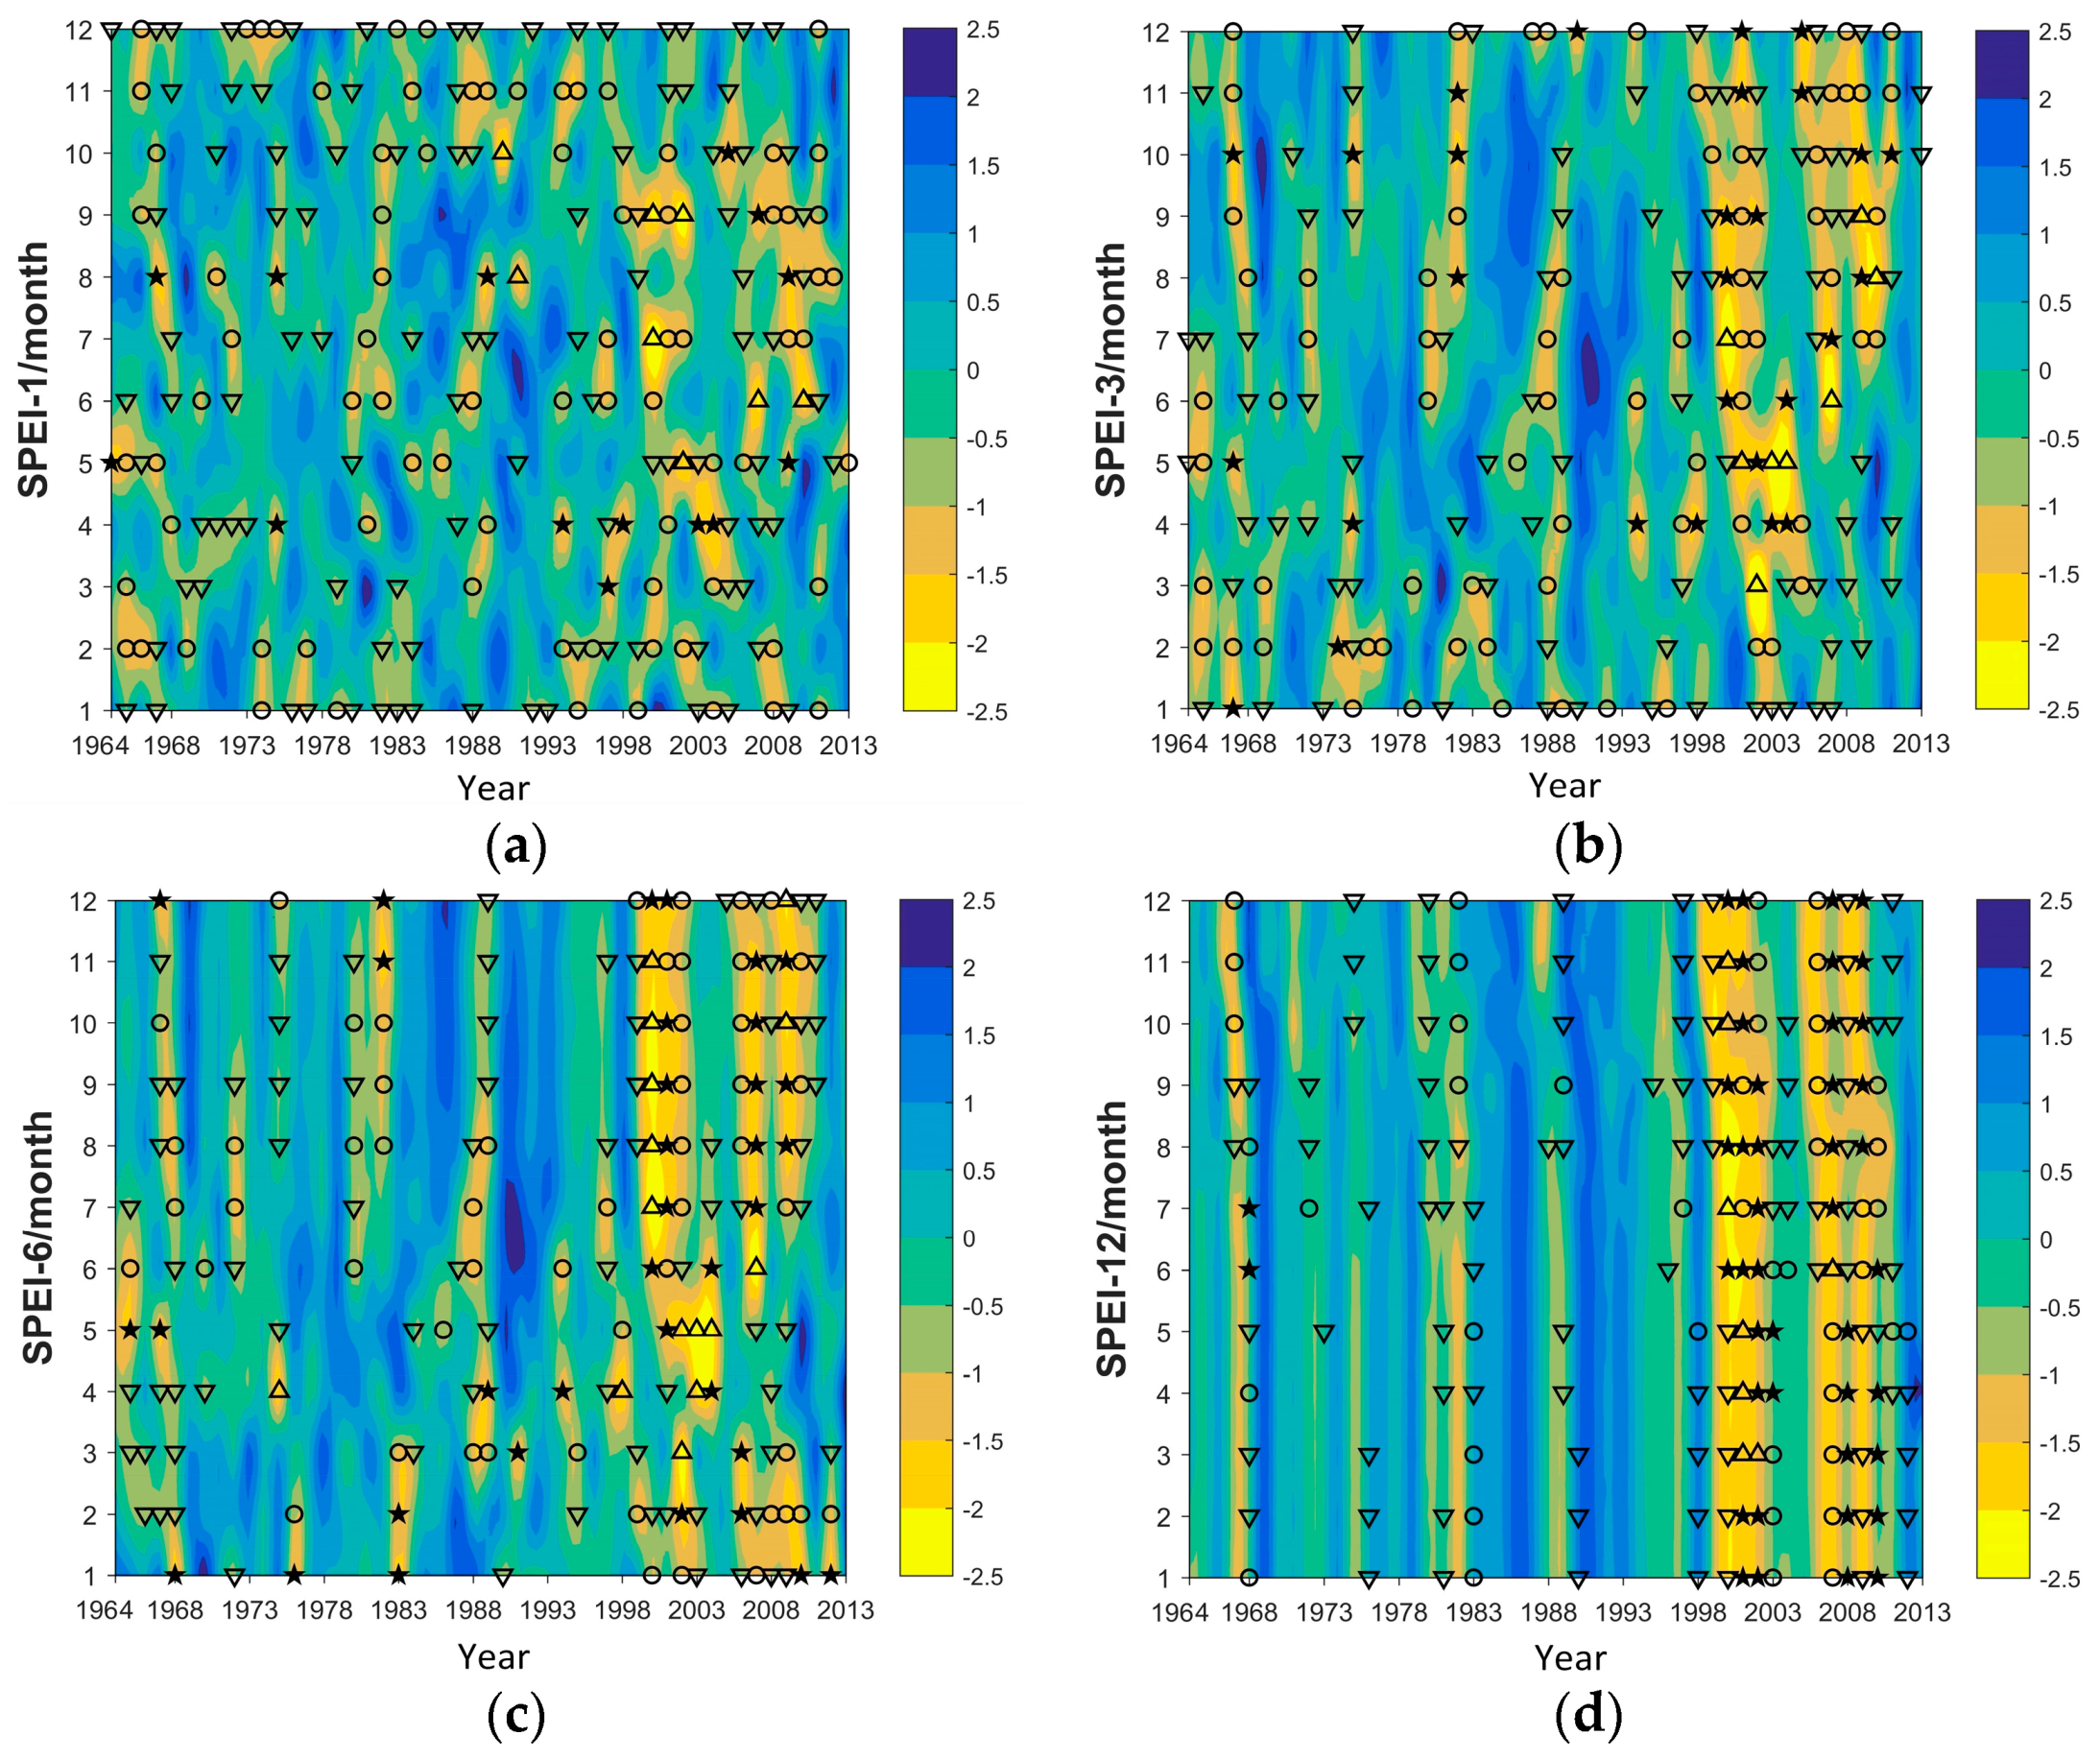
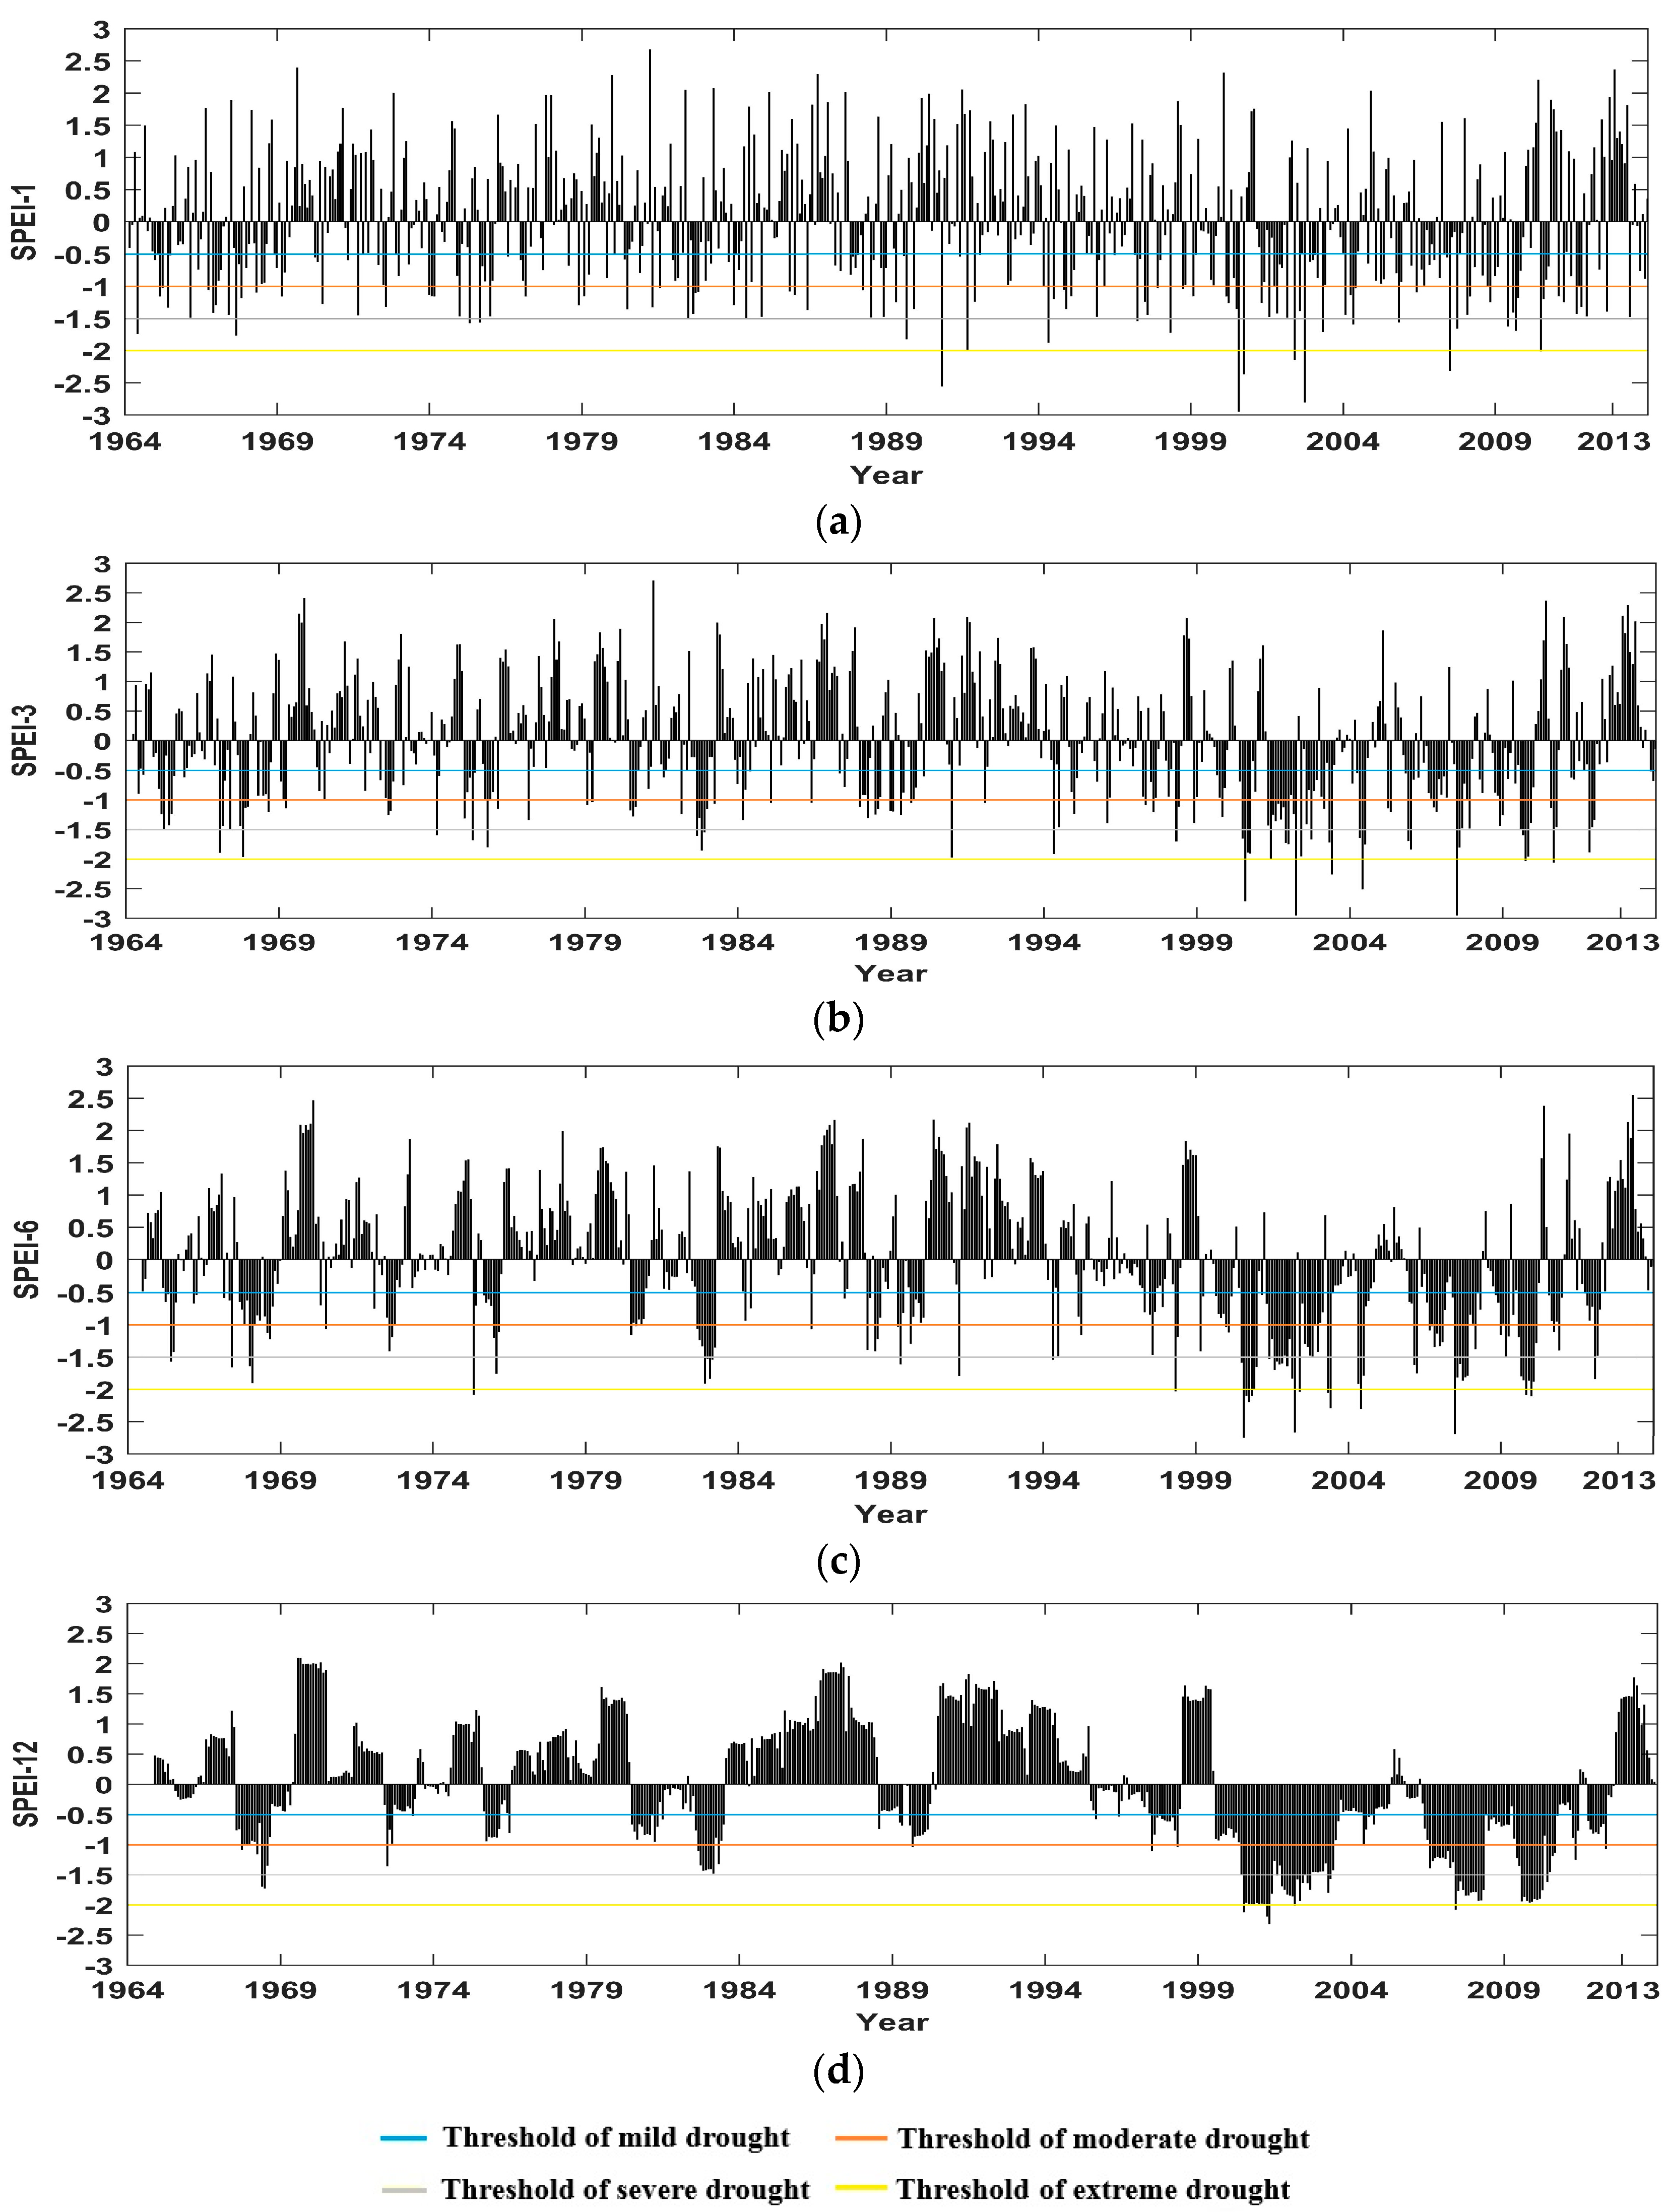
3.1. Temporal Variability Characteristics of Drought in Horqin Sandy Land

The SPEI values of 15 stations recorded in 1964–2013 were averaged, and the regional SPEI of the multi-timescale was obtained (Figure 2). The SPEI at different time scales can be used to detect different types of drought, of which SPEI-1 can reveal the rapid variability of drought reflected by precipitation and temperature on the monthly scale. As shown in Figure 2a, the value of SPEI-1 fluctuated at the zero scale line, reflecting alternating dry–wet conditions throughout 1964–2013 in Horqin Sandy Land. SPEI-3 reflects the characteristics of short-term drought and better reflects its seasonal variability. Figure 2b shows that the SPEI-3 value had a larger fluctuation frequency similar to that in SPEI-1, although it formed a shorter cycle. With an increase in time scale, the responses of SPEI-6 and SPEI-12 to short-term precipitation and temperature decreased, and the drought variation was stable. More obvious cycles of SPEI-6 and SPEI-12 can more clearly reflect the long-term characteristics of drought variability. Figure 2d shows that the late 1960s, early 1980s, and particularly the beginning of the 21st century was more arid periods in Horqin Sandy Land.
To reveal the distribution of drought events in different years, this study produced monthly contours for the multi-timescale SPEI. The corresponding drought events in varying severity were applied to the contours. As shown in Figure 3, the climate of Horqin Sandy Land showed an obvious tendency of drying and increased drought severity after 2000. Figure 3a shows that mild drought occurred most frequently with concentrations in January and December, followed by moderate drought. In the latter, the occurrence frequency of each month was more uniform. Severe and extreme drought events occurred mainly in April to October. This period is also the vegetation growth season; thus, the drought occurrence had a severe impact on crop growth. As shown in Figure 3b, seasonal severe and extreme droughts appeared in June to September of 2000, February to April of 2002, April to June of 2004, May to August of 2007, and July to September of 2009. The time of severe and extreme drought was significantly longer in SPEI-6. For example, long-term drought can be found in June to December of 2000, May to November of 2007, and July to December of 2009 (Figure 3c). SPEI-12 reflects typical drought years. Figure 3d shows that 1967 and 1982 were moderate drought years whereas 2007 and 2009 were severe drought years. SPEI-12 had a significant identification function on long-term drought. The study area was in a state of continuous drought and water shortage from 1999 to 2002.

3.2. Spatial Variability Characteristics of Drought in Horqin Sandy Land

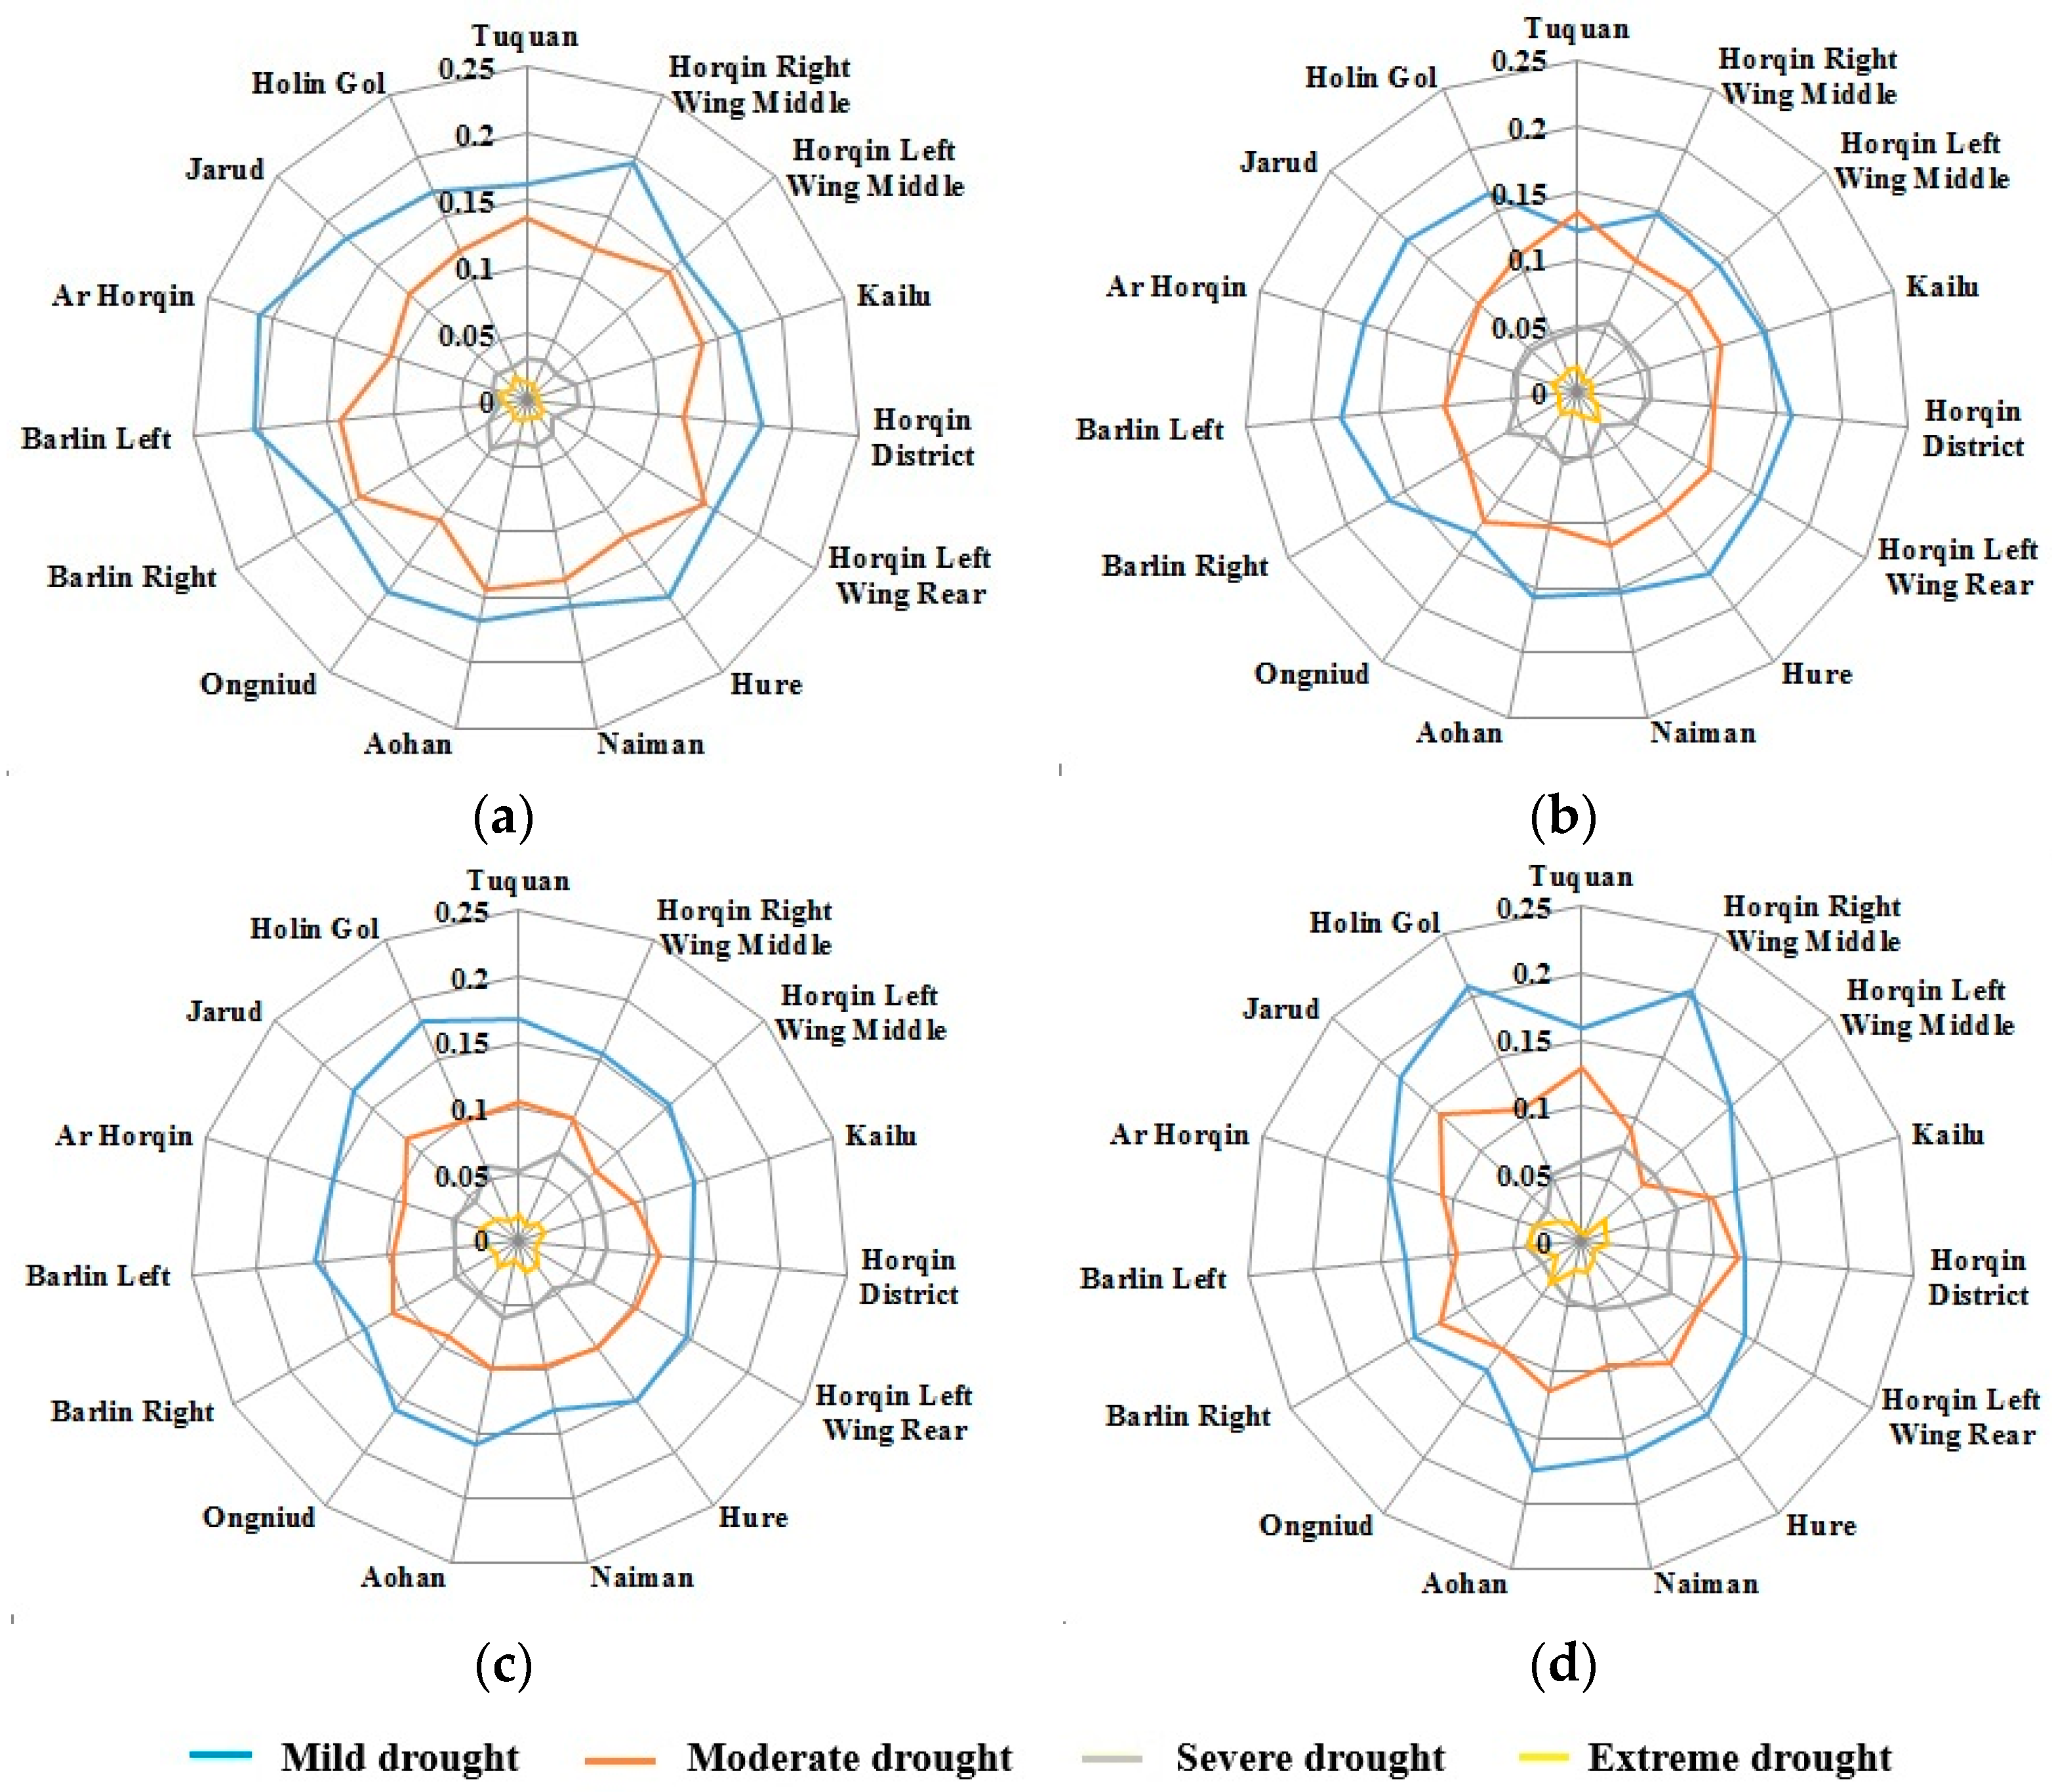
3.2.1. Spatial Distribution of the Drought Frequency

Figure 4 shows the drought frequency at 15 meteorological stations in Horqin Sandy Land revealed by the multi-timescale SPEI. When using SPEI-1, the frequency of drought in this region was higher in the east than that in the west. The frequency of drought occurrence in Barlin Left Banner and Ar Horqin Banner was the highest at more than 0.2, indicating that short-term droughts occurred during one-fifth of the month throughout the study period. The frequency of moderate drought in Horqin Left Wing Rear Banner exceeded 0.15, and that of Barlin Right, Barlin Left, Aohan, and Horqin Left Wing Middle Banner was also close to 0.15. The frequency of severe drought in Ongniud Banner was up to 0.04, and that of extreme drought in Ar Horqin Banner was 0.02 (Figure 4a). The frequency of mild drought revealed by using SPEI-3 was higher in the northwest and southeast; that of moderate drought was higher in the northern and southwestern parts, in which the frequencies at Tuquan County and Ongniud Banner were 0.13 and 0.12, respectively. Excluding Hure Banner, the frequency of severe drought at the 14 other stations was about 0.05, which is clearly more than that of drought used for SPEI-1. The frequency of extreme drought was highest in Hure Banner (Figure 4b). Compared with short-term drought, the frequency of mild drought revealed by SPEI-6 was relatively higher in the northwest parts of the study area. In the study area, the frequency of moderate drought was more uniform, at a maximum of 0.1 in the 15 stations across the monitoring period. The frequency of severe drought was relatively high in the northeastern parts of the study area, whereas that of extreme drought was high in the eastern parts (Figure 4c). The spatial distribution of drought frequency used for SPEI-12 showed a distinct difference. The frequency of mild drought was higher in the northern parts, whereas that of moderate drought was higher in the southwestern parts. The frequency of severe drought was higher in the east, and that of extreme drought was higher in the west (Figure 4d).

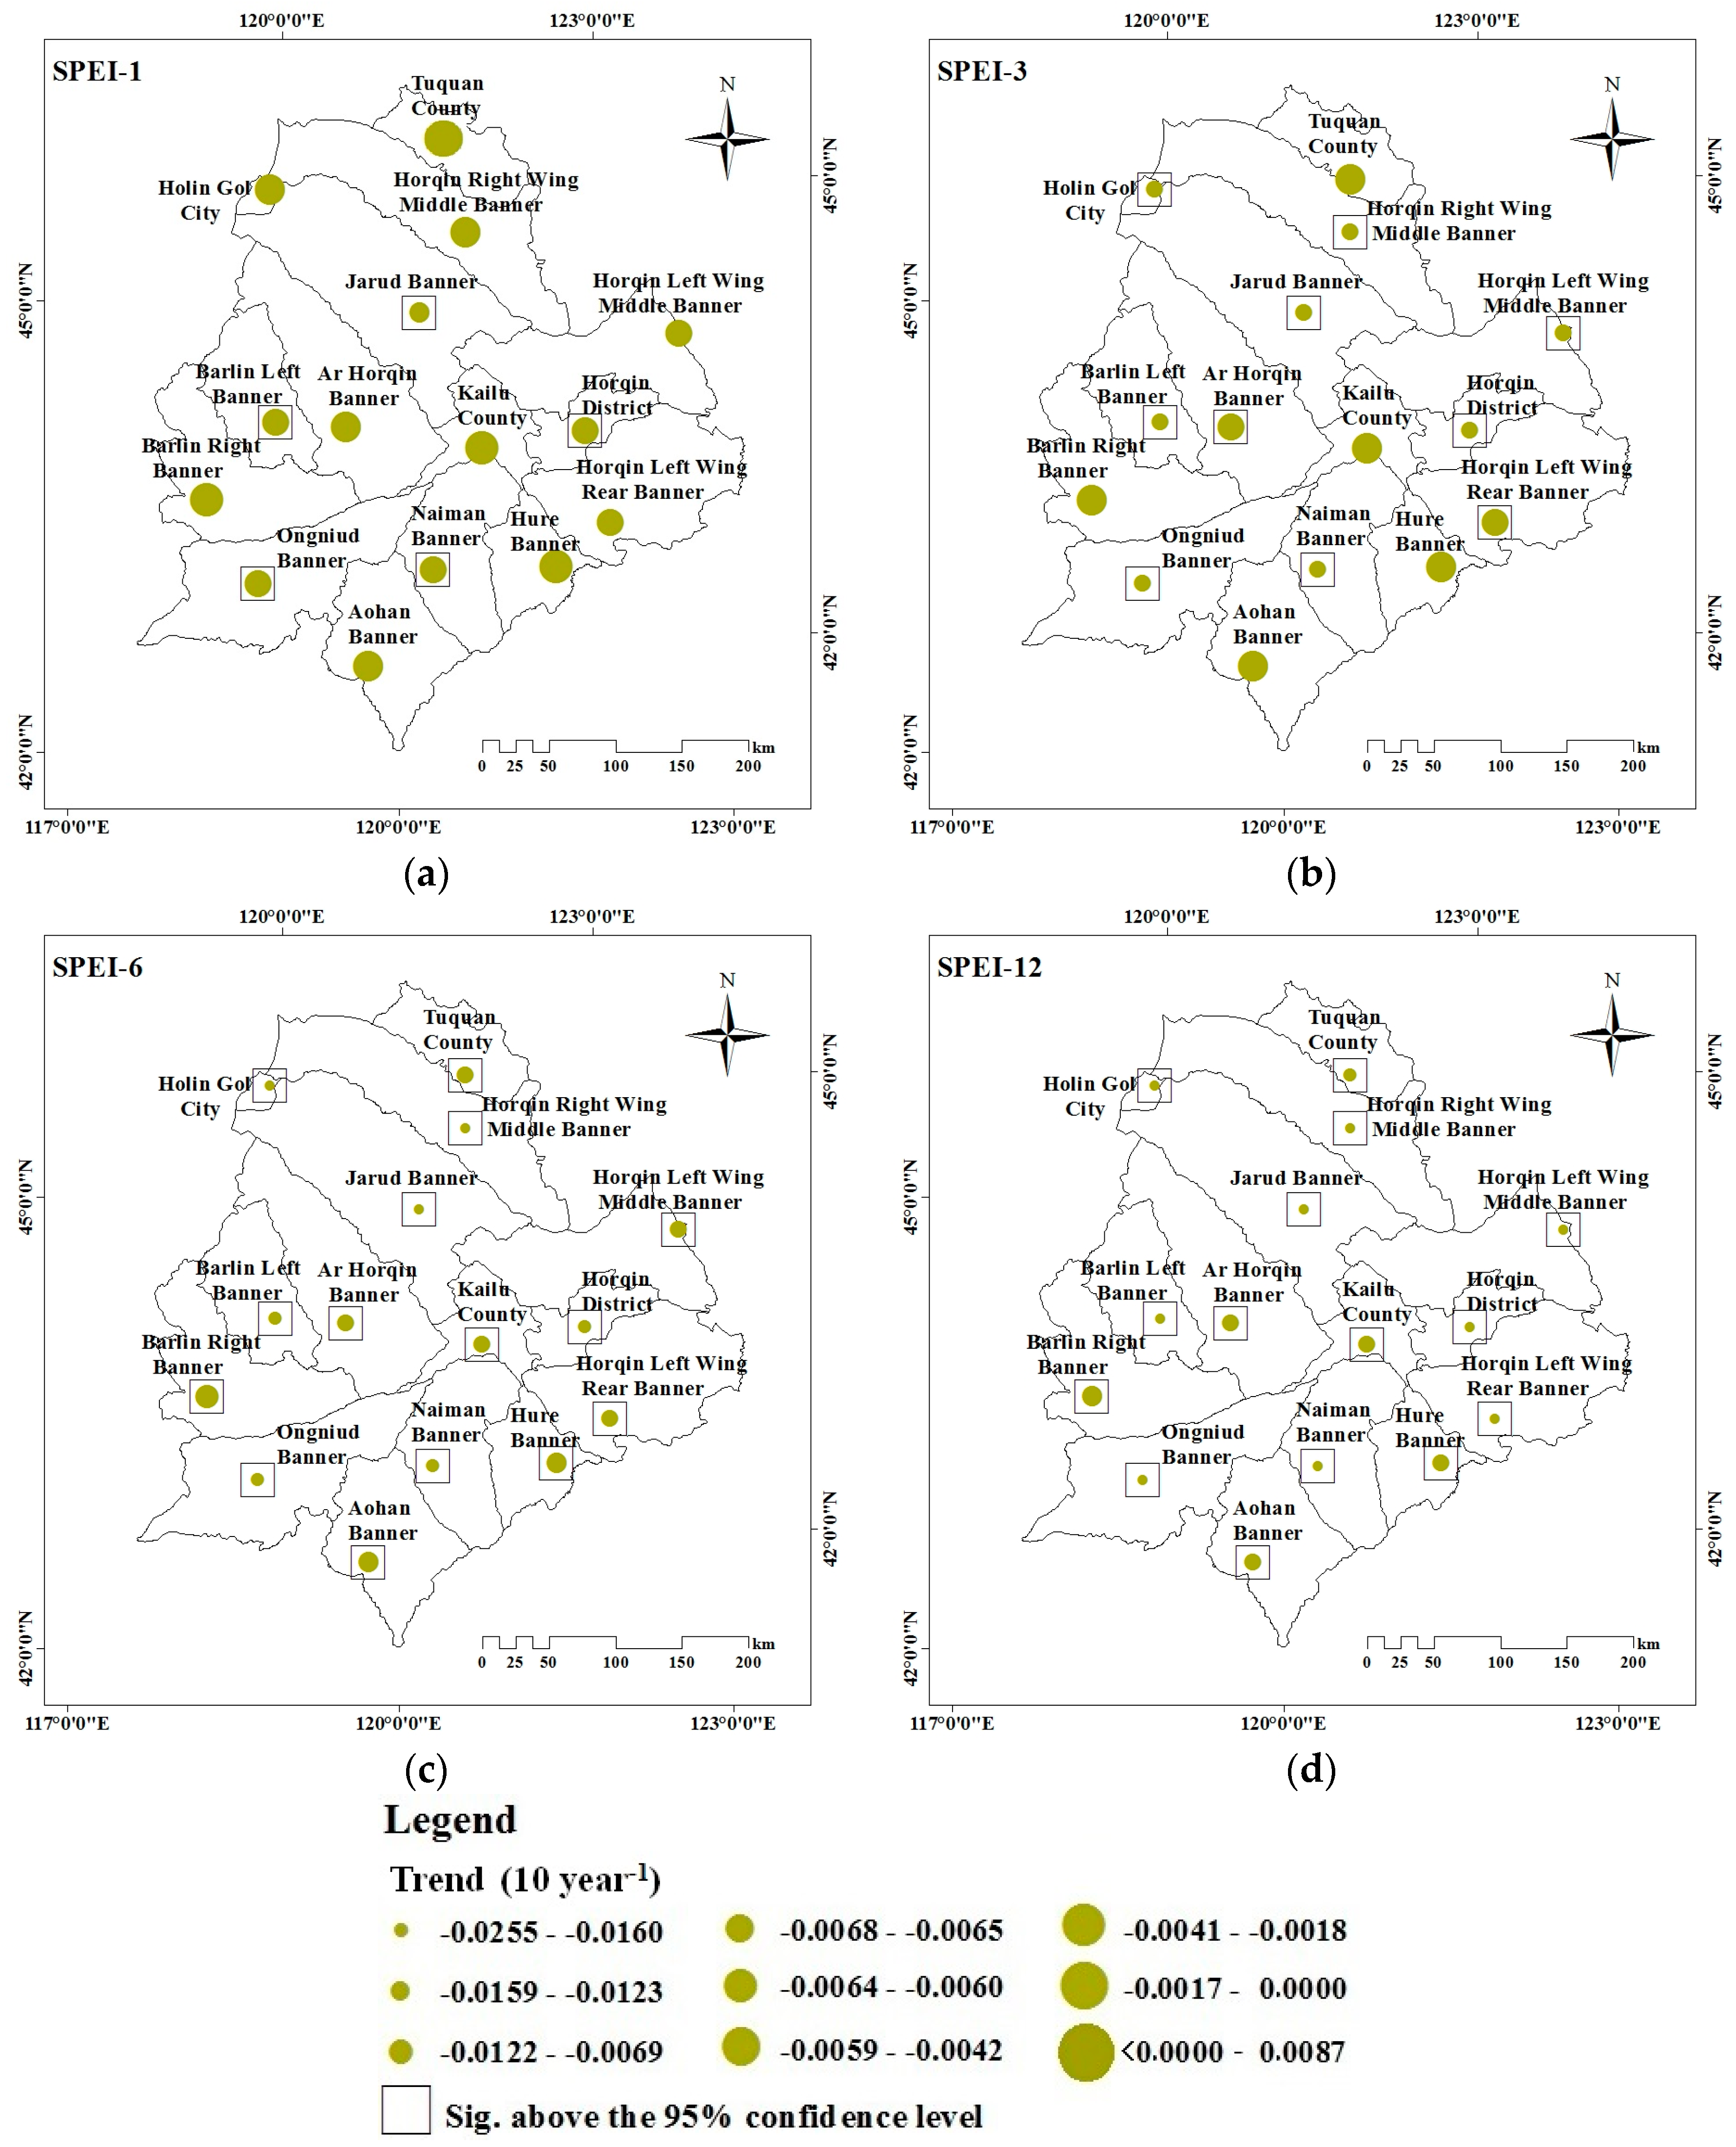
3.2.2. Spatial Trends of the Multi-Timescale SPEI

Based on the monthly values of SPEI at the 15 meteorological stations from 1964 to 2013, the climatic tendency (magnitude/10 year) and its significance of multi-timescale SPEI at each meteorological station was calculated by using the Sen’s slope and the MK method, and the characteristics of spatial trends of drought variability over Horqin Sandy Land were analysed (Figure 5). As shown in Figure 5a, an upward SPEI-1 trend occurred only in Tuquan County, with a magnitude of 0.0087/10 year. The tendency of the other 14 meteorological stations showed a downward trend, among which the areas with higher decreasing magnitude were concentrated in Hure, Barlin Right, Horqin Right Wing Middle Banner, and Tuquan County, with an averaged magnitude of −0.0014/10 year. However, a significant tendency was not detected in these areas. On the contrary, in Jarud, Barlin Left, Ongniud, Naiman Banner, and Horqin District, the averaged magnitude of −0.0054/10 year indicates an increasing severity in monthly drought events. The spatial variation of SPEI-3 was similar to that of SPEI-1, although all stations showed a downward trend. This indicates that the seasonal drought events increased, but the average magnitude (−0.0065/10 year) was lighter than that of SPEI-1 (Figure 5b). The tendency of SPEI-6 and SPEI-12 decreased significantly in all stations, and the spatial variation was similar to that of the short time scale of SPEI (Figure 5c,d). However, the average magnitudes were smaller, at −0.0116/10 year and −0.0157/10 year, respectively. The significant downward trend in SPEI at the long-term time scale shows the drought tendency of the regional climate and reflects the cumulative and persistent characteristics of drought.

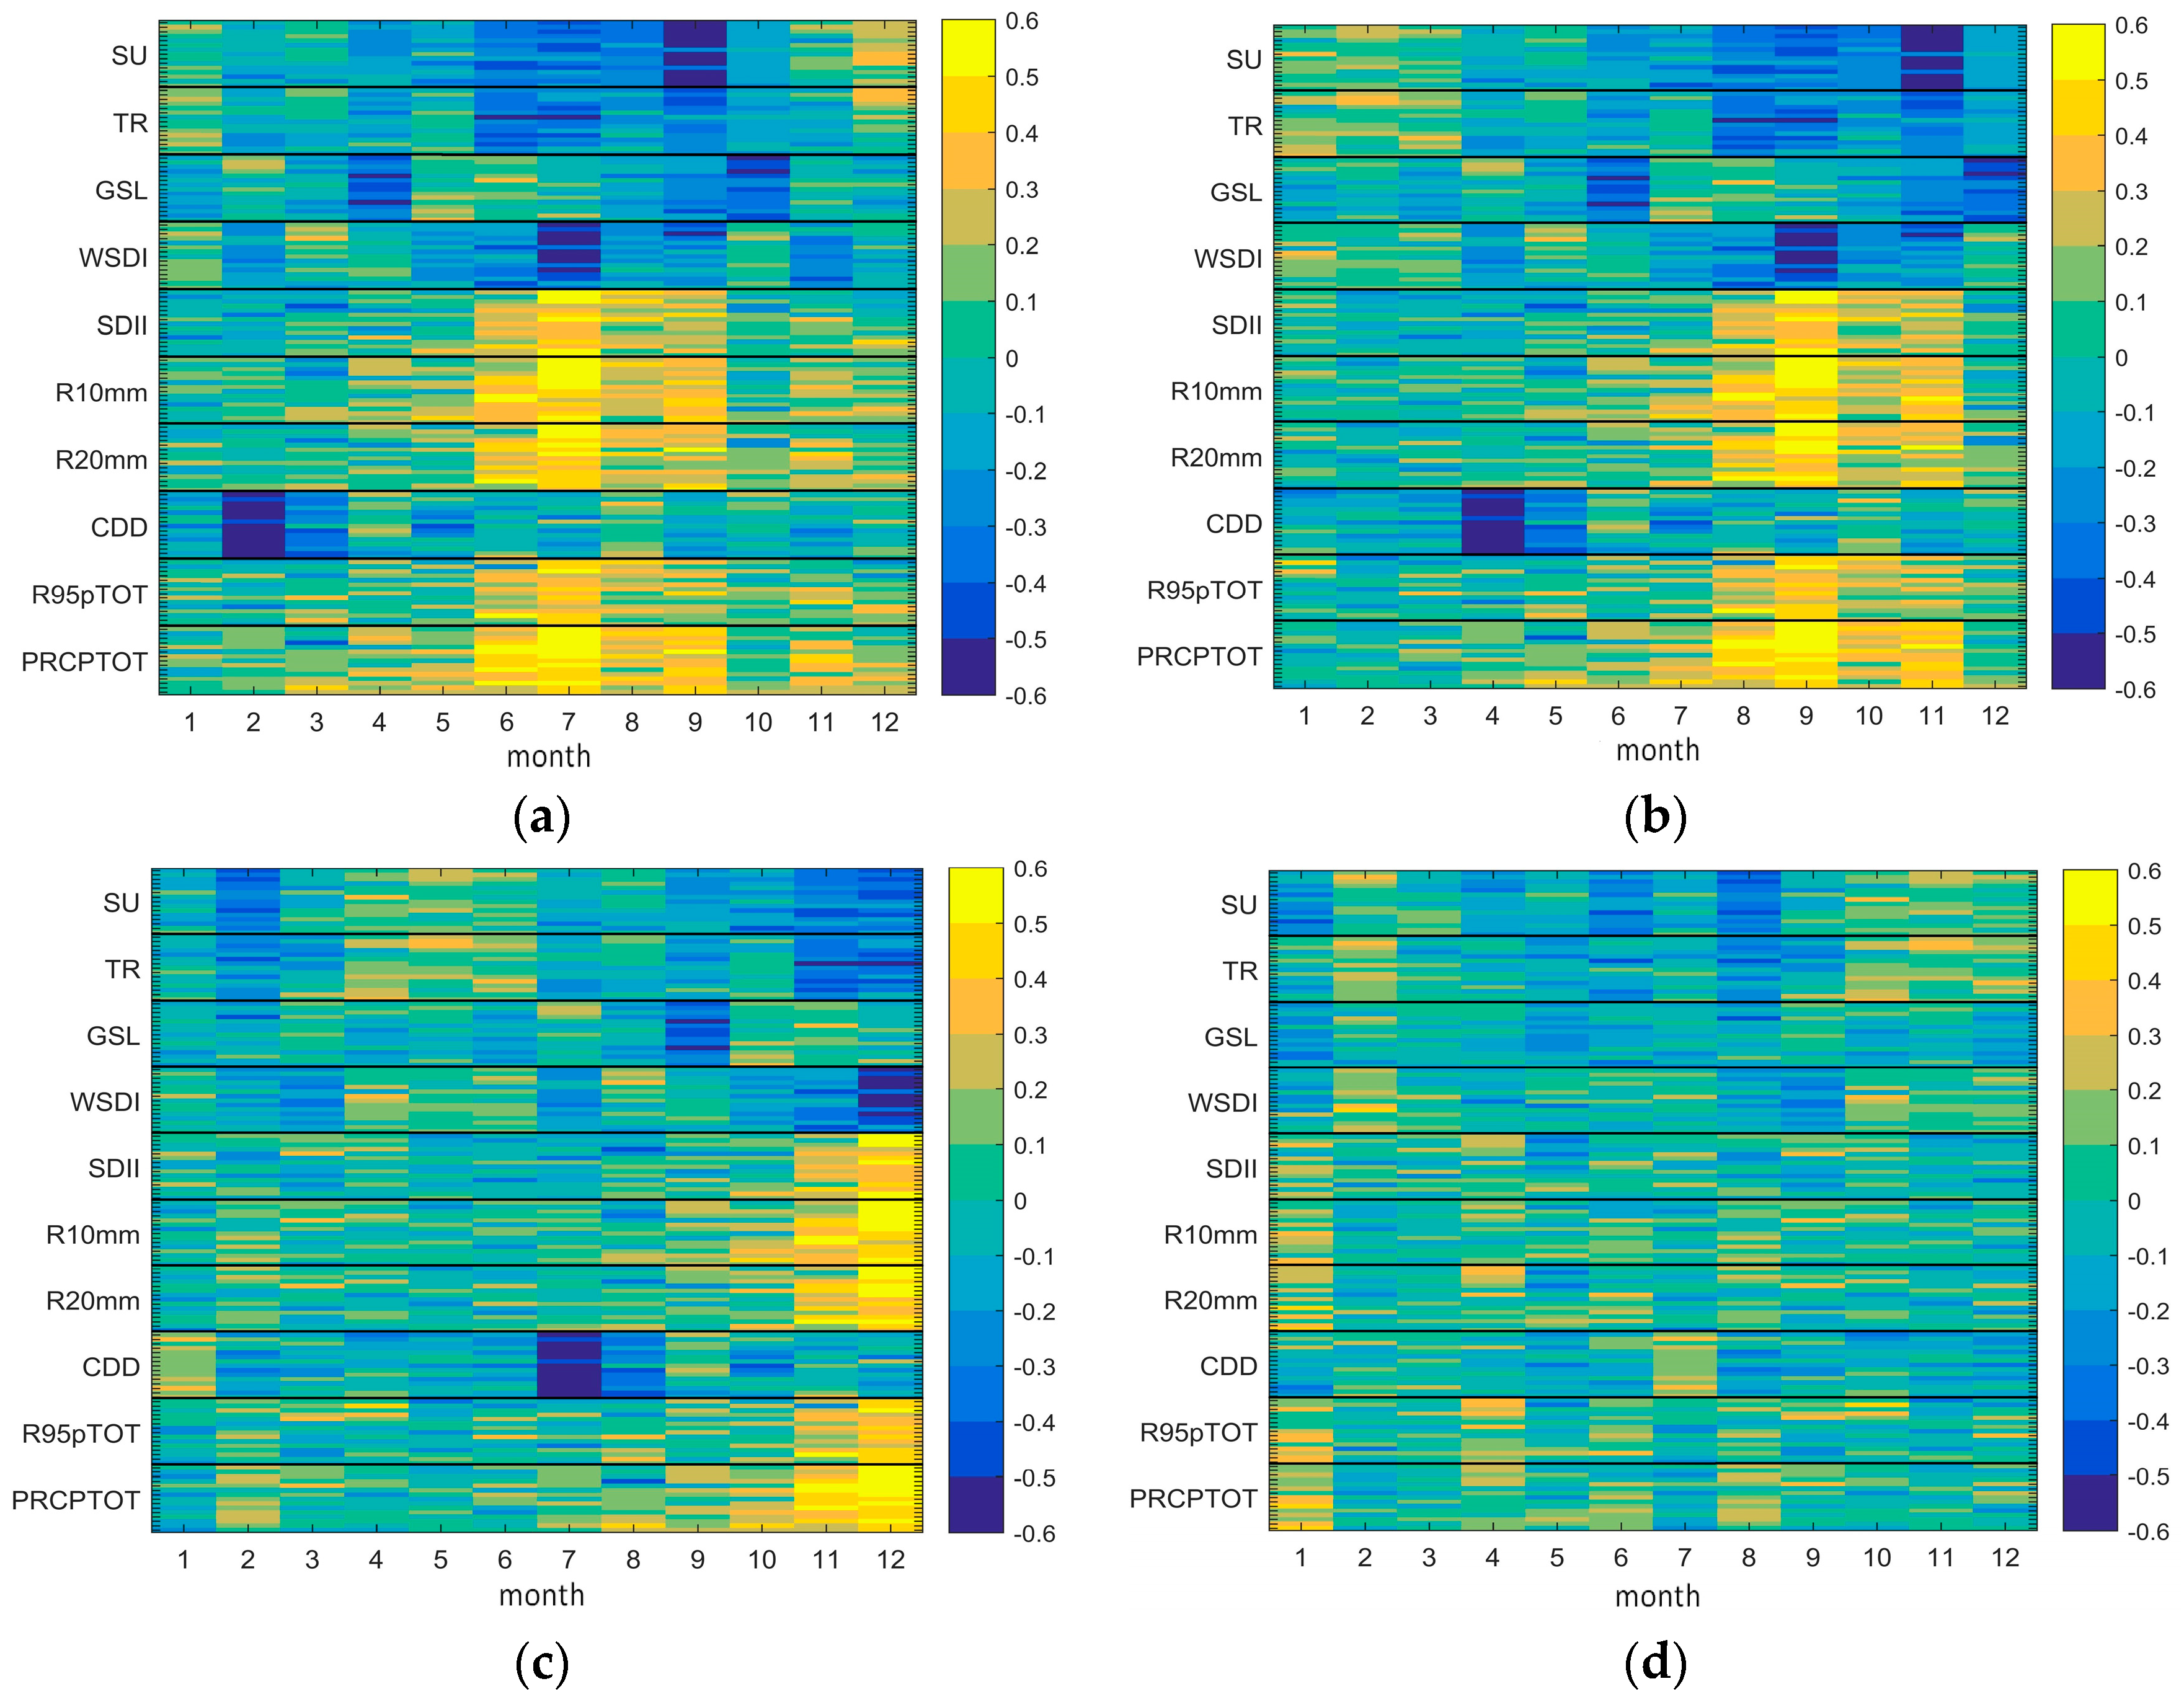
3.3. Relationships between the Multi-Timescale SPEI and Extreme Climate Indices

In order to analyze the relationship between the multi-timescale SPEI and extreme climate indices, the Pearson’s correlations between each monthly extreme climate index and the multi-timescale SPEI during 1964–2013 was calculated for Horqin Sandy Land, the results of which are provided in this section (Figure 6). It can be seen from Figure 6a that there were negative correlations between SPEI-1 and extreme temperature indices including SU, TR, and the WSDI, among which the good correlations can be found in June to September. In contrast to the extreme temperature indices, extreme precipitation indices including SDII, R 10mm, R 20mm, R95pTOT, and PRCPTOT exhibited positive correlations with SPEI-1 in Horqin Sandy Land, as well as the good correlations appeared in June to September. Like Figure 6a, the correlation is also presented in Figure 6b,c, but there was a sign of delay in time that the good correlations between the SPEI and extreme climate indices was concentrated from August to November and from November to December, respectively. CDD is an extreme precipitation index that represents dryness, which was negatively correlated with SPEI-1, SPEI-3, and SPEI-6 for most of the month, with the highest correlation coefficient in February, April, and July, respectively. GSL, an extreme temperature index, showed negative correlations with SPEI-1 in April and from August to October, and correlated with SPEI-3 in June, November, and December. In addition, negative relationships were observed between the GSL and SPEI-6 in September. It can be seen from Figure 6d that the extreme climate indices showed weak correlations with SPEI-12 in Horqin Sandy Land.

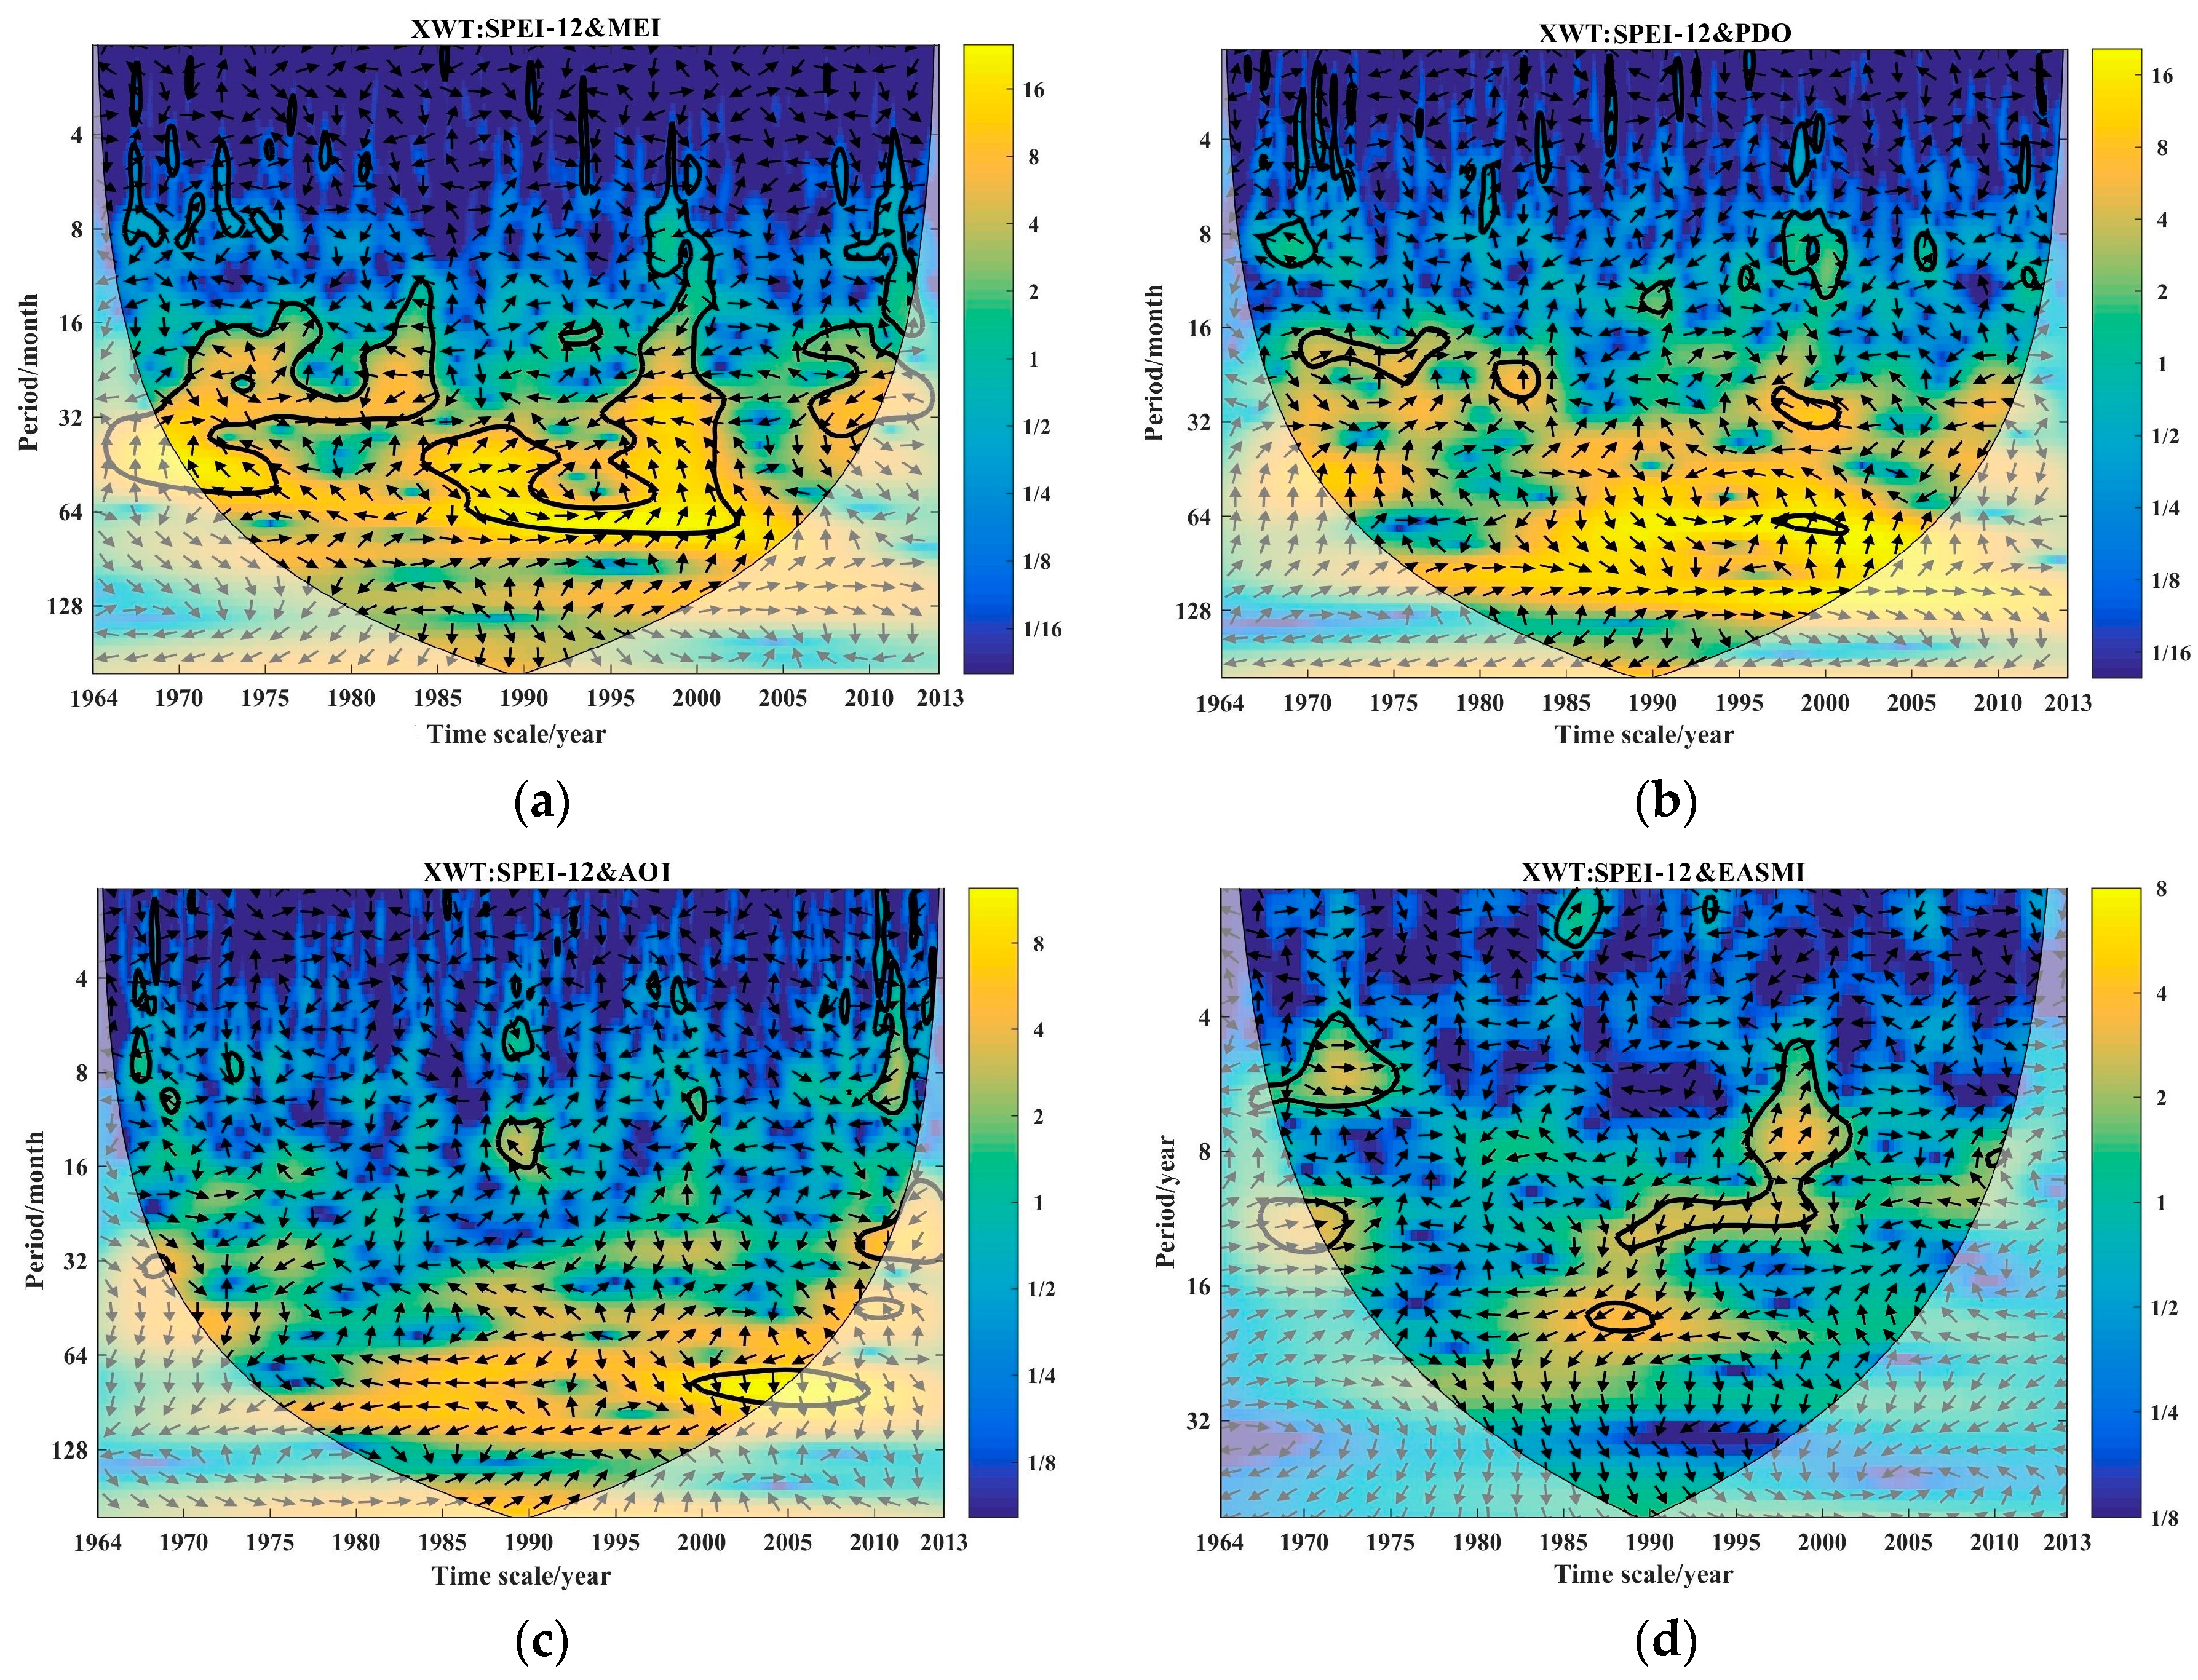
3.4. Relationships between Multi-Timescale SPEI-12 and Large Scale Atmosphereindices

Considering that the impact of the large-scale atmosphere index on drought formation is reflected mainly on the inter-decadal scale, the relationship of the MEI, PDO, the AOI, the EASMI, and SPEI-12 was analyzed by using the cross wavelet transform method. Cross wavelet transform can highlight the relationship between the large-scale atmosphere index and drought variety in the high-energy region of the time–frequency domain. Figure 7 shows the cross wavelet transform of SPEI-12 and atmospheric indices; resonance cycles of 16–32 months occurred between SPEI-12 and MEI during 1970–1985 and 1995–2002. The two series showed an anti-phase resonance in this frequency band, indicating a negative correlation between SPEI-12 and the MEI. Resonances cycle of 32–64 months was detected in 1968–1975 and 1984–2003. The change in the phase angle proves that SPEI-12 lagged behind in this cycle. Figure 7b shows that SPEI-12 and PDO had resonance cycles during the entire period, in which the cycles of 16–32 months during 1970–1978, 1980–1983, and 1997–2001 were statistically significant. The change in phase angle was similar to that in Figure 7a, indicating that SPEI-12 was behind the PDO, but the maintenance time was shorter. Figure 7c shows a significant resonance cycle of 80–100 months between SPEI-12 and the AOI after 2000, and SPEI-12 is ahead. Other resonance cycles failed to form for the shorter maintenance time. Only three months of data of the EASMI of each year were available; thus, the cross wavelet transform of SPEI-12 and the EAMSI was calculated at the scale of years. The results showed that these two indices had significant resonance cycles of three to seven years during 1969–1976 and 1996–2001, where SPEI-12 and the EAMSI showed a positive correlation in the first cycle and SPEI-12 was behind in the second cycle.

4. Discussion

According to the above analysis, it is evident that the multi-timescale SPEI in Horqin Sandy Land exhibited a significant a tendency of decline during 1964–2013, indicating that the climate of the study area was highly prone to drought, especially since the 21st century. Globally, the average surface temperature has significantly increased, and the changes in precipitation show more complicated spatial and temporal patterns in different climatic regions [59,60]. This may lead to extreme climate events, which in turn lead to regional drought. For China as a whole, although the long-term trend of drought-impacted areas changed little (0.045%/10 year) over the past 30 years, dry trends were identified in Northeastern and Southwestern China [61]. Zou et al. reported that significant increases in drought areas were found in North China as well [62]. Zhang et al. verified that the temperature showed an increasing trend and that the regional climate has a drying tendency in the Horqin region; their results are similar to those of our study [63]. We found spatial differences in the distribution of drought frequency, which were more obvious in SPEI-12. The frequency of mild drought revealed by the short time scale of the SPEI was higher than that of its long time scale. On the contrary, the frequency of severe and extreme drought was high when using the long time scale of the SPEI. The results verify that short-term drought occurs more frequently, although most are mild or moderate. In contrast, long-term droughts occur infrequently, but the number of severe or extreme droughts is relatively high. By using historical statistics data, Bao et al. discussed and studied the evolution of drought and flood in Horqin Sandy Land during the past 300 years. Although some differences were noted in data and methods, the results of drought frequency in our study are generally consistent with their results [64]. However, the use of historical data can reflect only the occurrence of drought in different severities; it cannot highlight the duration of droughts. Drought monitoring by using the SPEI has more advantages both in timescale and severity.
We also noted that the multi-timescale SPEI showed a downward trend in spatial pattern during 1964–2013, in which the linear tendency of the SPEI with a long time scale was obvious than that with a short time scale. The magnitude of short-term (long-term) drought was higher (lower), although the significance rate was relatively low (high). This shows a general increase in the severity of drought in Horqin Sandy Land, especially in long-term drought. The spatial patterns in our study are consistent with those of numerous regional studies reported previously. For example, we found a clear decreasing trend of SPEI-3 reported by Xu, who reported a drying trend in Northeastern China, which was statistically significant in areas corresponding to Horqin Sandy Land [65]. Elsewhere, Wang et al. identified a dry trend in Northeastern China [66].
Moreover, we found that SPEI-1 and SPEI-3 had good correlations with the extreme climate indices, which indicates that short-term drought has a certain relationship with extreme climates. These results are consistent with the actual climate conditions: Sustained high temperatures can cause an arid climate, whereas extreme precipitation is conducive to drought mitigation. We noted that the good correlation between extreme climate indices and SPEI-3 was concentrated mainly from August to November, which is in accordance with the occurrence time of drought, as shown in Figure 3c. This indicates that the occurrence of extreme climate events has accelerated the severity and frequency of droughts.
Cross wavelet results showed significant resonance periods between SPEI-12 and atmospheric indices, among which stable correlations appeared in SPEI-12 and ENSO, SPEI-12, and the EASMI. Sun et al. investigated the spatial distributions of land areas with dry-wet conditions connected to ENSO signals. They found that the influence of ENSO events is widespread dominating about 38% of the global land surface excluding Antarctica. When the value of the MEI is positive, ENSO is dominated by El Niño events, making the surface conditions drier in Northern China [34]. ENSO had a negative influence on the SPEI in Horqin Sandy Land, which is a typical semi-arid area in Northern China. This process increased the drought level in this area. The intensity of the EASM has a significant impact on the distribution of summer precipitation in China. Strong EASM results in greater than normal precipitation in Northern China [66]. We detected a significant positive correlation between the EASMI and SPEII-12, which confirms this theory. On the contrary, if the EASM is weak, Northern China will be drier with less precipitation.
It should be noted that the main weakness of this study is the failure to address the relationship between the SPEI and the large-scale atmospheric indices in space. We analyzed the influencing factors of drought from the aspects of extreme climate indices and atmospheric indices. The relationship between the factors and the deep formation mechanism of drought should be considered in future research. The climate of Horqin Sandy Land showed obvious drought tendencies, which create adverse impacts on desertification, agriculture, animal husbandry, and human society. Drought hazard is an important component of drought disaster risk [45], and the estimation of the characteristics of drought variability is a basic work for drought hazard assessment [46]. Thus, the results of this study will be useful for the risk assessment of drought disasters. Considering the relationship between meteorological drought and hydrological drought, the results of this study can also be used for rational utilization and the protection of water resources in Horqin Sandy Land.

5. Conclusions

In this study, we established a multi-timescale SPEI of 1, 3, 6, and 12 months to estimate the spatiotemporal variability characteristics of regional drought during 1964–2013 in Horqin Sandy Land. We investigated the relationship between extreme climate indices and the SPEI in a scale that considered extreme precipitation and extreme temperature indices. Then, we explored possible linkages between the SPEI and large-scale atmospheric indices including ENSO, PDO, the AOI, and the EASMI. The conclusions are summarized as follows.
1. It was determined that Horqin Sandy Land became dry during 1964–2013; especially after 2000, the dry periods markedly increased. On average, the frequencies of mild, moderate, severe, and extreme droughts were up to 0.16, 0.11, 0.05, and 0.02, respectively. The drought frequency characterized by the multi-timescale SPEI differed significantly in space; the difference was more obvious with SPEI-12. The frequencies of mild and moderate drought were higher in the western and eastern parts, whereas those of severe and extreme drought were higher in the northwest and northern parts of the study area.
2. The SPEI at 1, 3, 6, and 12 months showed decreasing trends with average linear tendencies of −0.0037/10 year, −0.0065/10 year, −0.0116/10 year, and −0.0157/10 year, respectively. The decline in the southern parts in Horqin Sandy Land was higher than that in the northern parts.
3. The extreme climate indices correlated with short-term drought. Among them, extreme temperature indices including SU, TR, and the WSDI showed negative correlations with the short time scale of the SPEI. In contrast, extreme precipitation indices including SDII, R 10mm, R 20mm, R95pTOT, and PRCPTOT showed positive correlations with the SPEI.
4. A significant correlation was noted between SPEI-12 and atmospheric indices; that of ENSO and the EASMI was more obvious. SPEI-12 and ENSO showed an anti-phase in the resonance cycles of 16–32 months during 1970–1985 and 1995–2002. SPEI-12 and the EAMSI were in phase between the resonance cycles of three to seven years during 1969–1976 and 1996–2001. In addition, SPEI-12 lagged behind during the resonance circles.

Acknowledgments

This study is supported by the National Key Technology R&D Program of China under Grant Nos. 2013BAK05B01 and 2013BAK05B02. Fundamental Research Funds for the Central Universities under Grant Nos. 2412016KJ046. China Special Fund for Meteorological Research in the Public Interest (No. 2015001). Fundamental Research Funds for the Central Universities (Project Name: Desertification Ecological Risk Assessment on Different Landform of Farmlands in Horqin Sand Land. Project Number: 12SSXT151).

Author Contributions

Jiquan Zhang was responsible for the original idea of the study; Zhenhua Dong was responsible for data compilation; Enliang Guo was responsible for the data processing and drawing; Lai Quan provides technical support in the revision process; Yongfang Wang drafted the manuscript. All authors read and revised the final manuscript.

Conflicts of Interest

The authors declare no conflicts of interest.

References

  1. Homdee, T.; Pongput, K.; Kanae, S. A Comparative Performance Analysis of Three Standardized Climatic Drought Indices in the Chi River Basin, Thailand. Agric. Nat. Resour. 2016, 50, 211–219. [Google Scholar] [CrossRef]
  2. Hao, Z.C.; Hao, F.H.; Singh, V.P. A General Framework for Multivariate Multi-Index Drought Prediction Based on Multivariate Ensemble Streamflow Prediction (MESP). J. Hydrol. 2016, 539, 1–10. [Google Scholar] [CrossRef]
  3. Wang, Q.F.; Wu, J.J.; Lei, T.J.; He, B.; Wu, Z.T.; Liu, M.; Mo, X.Y.; Geng, G.P.; Li, X.H.; Zhou, H.K.; et al. Temporal-spatial Characteristics of Severe Drought Events and Their Impact on Agriculture on a Global Scale. Quat. Int. 2014, 349, 10–21. [Google Scholar] [CrossRef]
  4. Duan, H.C.; Wang, T.; Xue, X.; Liu, S.L.; Guo, J. Dynamics of Aeolian Desertification and Its Driving Forces in the Horqin Sandy Land, Northern China. Environ. Monit. Assess. 2014, 186, 6083–6096. [Google Scholar] [CrossRef] [PubMed]
  5. Zhu, Y.; Wang, W.; Singh, V.P.; Liu, Y. Combined Use of Meteorological Drought Indices at Multi-time Scales for Improving Hydrological Drought Detection. Sci. Total Environ. 2016, 571, 1058–1068. [Google Scholar] [CrossRef] [PubMed]
  6. Wilhite, D.A.; Glantz, M.H. Understanding: The Drought Phenomenon: The Role of Definitions. Water Int. 1985, 10, 111–120. [Google Scholar] [CrossRef]
  7. American Meteorological Society (AMS). Statement on Meteorological Drought. Bull. Am. Meteorol. Soc. 2004, 85, 771–773. [Google Scholar]
  8. Mishra, A.K.; Singh, V.P. A Review of Drought Concepts. J. Hydrol. 2010, 391, 202–216. [Google Scholar] [CrossRef]
  9. Masud, M.B.; Khaliq, M.N.; Wheater, H.S. Analysis of Meteorological Droughts for the Saskatchewan River Basin using Univariate and Bivariate Approaches. J. Hydrol. 2015, 522, 452–466. [Google Scholar] [CrossRef]
  10. Van Loon, A.F. Hydrological Drought Explained. Water 2015, 2, 359–392. [Google Scholar] [CrossRef]
  11. Lorenzo-Lacruz, J.; Vicente-Serrano, S.M.; López-Moreno, J.I.; Beguería, S.; García-Ruiz, J.M.; Cuadrat, J.M. The Impact of Droughts and Water Management on Various Hydrological Systems in the Headwaters of the Tagus River (central Spain). J. Hydrol. 2010, 386, 13–26. [Google Scholar] [CrossRef] [Green Version]
  12. Zou, X.K.; Ren, G.Y.; Zhang, Q. Drought Variations in China Based on Compound Index of Meteorological Drought. Clim. Environ. Res. 2010, 15, 371–378. (In Chinese) [Google Scholar]
  13. Liu, X.L.; Yu, M.X. Investigation into Drought Evolution Characteristics of China in 60 Years. J. Arid Land Resour. Environ. 2015, 29, 177–183. (In Chinese) [Google Scholar]
  14. Farahmand, A.; AghaKouchak, A. A Generalized Framework for Deriving Nonparametric Standardized Drought Indicators. Adv. Water Resour. 2015, 76, 140–145. [Google Scholar] [CrossRef]
  15. Pedro-Monzonís, M.; Solera, A.; Ferrer, J.; Estrela, T.; Paredes-Arquiola, J. A Review of Water Scarcity and Drought Indexes in Water Resources Planning and Management. J. Hydrol. 2015, 527, 482–493. [Google Scholar] [CrossRef]
  16. Huang, J.; Sun, S.; Zhang, J. Detection of Trends in Precipitation during 1960–2008 in Jiangxi Province, Southeast China. Theor. Appl. Climatol. 2013, 114, 237–251. [Google Scholar] [CrossRef]
  17. Vicente-Serrano, S.M.; Cabello, D.; Tomás-Burguera, M.; Martín-Hernández, N.; Beguería, S.; Azorin-Molina, C.; Kenawy, A.E. Drought Variability and Land Degradation in Semiarid Regions: Assessment Using Remote Sensing Data and Drought Indices (1982–2011). Remote Sen. 2015, 7, 4391–4423. [Google Scholar] [CrossRef]
  18. Yan, H.; Wang, S.Q.; Wang, J.B.; Lu, H.Q.; Guo, A.H.; Zhu, Z.C.; Myneni, R.B.; Shugart, H.H. Assessing Spatiotemporal Variation of Drought in China and Its Impact on Agriculture during 1982–2011 by using PDSI Indices and Agriculture Drought Survey Data. J. Geophys. Res. Atmos. 2016, 121, 2283–2298. [Google Scholar] [CrossRef]
  19. Stagge, J.H.; Kohn, I.; Tallaksen, L.M.; Stahl, K. Modeling Drought Impact Occurrence based on Meteorological Drought Indices in Europe. J. Hydrol. 2015, 530, 37–50. [Google Scholar] [CrossRef]
  20. Abramopoulos, F.; Rosenzweig, C.; Choudhury, B. Improved Ground Hydrology Calculations for Global Climate Models (GCMs): Soil Water Movement and Evapotranspiration. J. Clim. 1988, 1, 921–941. [Google Scholar] [CrossRef]
  21. Thornthwaite, C.W. An Approach toward a Rational Classification of Climate. Geogr. Rev. 1948, 38, 55–94. [Google Scholar] [CrossRef]
  22. Vicente-Serrano, S.M.; Beguería, S.; López-Moreno, J.I. A Multiscalar Drought Index Sensitive to Global Warming: The Standardized Precipitation Evapotranspiration Index. J. Clim. 2010, 23, 1696–1718. [Google Scholar] [CrossRef] [Green Version]
  23. Kumar, K.N.; Rajeevan, M.; Pai, D.S.; Srivastava, A.K.; Preethi, B. On the Observed Variability of Monsoon Droughts over India. Weather Clim. Extrem. 2013, 1, 42–50. [Google Scholar] [CrossRef]
  24. Beguería, S.; Vicente-Serrano, S.M.; Reig, F.; Latorre, B. Standardized Precipitation Evapotranspiration Index (SPEI) Revisited: Parameter Fitting, Evapotranspiration Models, Tools, Datasets and Drought Monitoring. Int. J. Climatol. 2014, 34, 3001–3023. [Google Scholar] [CrossRef]
  25. Potopová, V.; Štěpánek, P.; Možný, M.; Türkott, L.; Soukup, J. Performance of the Standardised Precipitation Evapotranspiration Index at Various Lags for Agricultural Drought Risk Assessment in the Czech Republic. Agric. For. Meteorol. 2015, 202, 26–38. [Google Scholar] [CrossRef]
  26. Li, B.Q.; Zhou, W.; Zhao, Y.Y.; Ju, Q.; Yu, Z.B.; Liang, Z.M.; Acharya, K. Using the SPEI to Assess Recent Climate Change in the Yarlung Zangbo River Basin, South Tibet. Water 2015, 7, 5474–5486. [Google Scholar] [CrossRef]
  27. Meza, F.J. Recent Trends and ENSO Influence on Droughts in Northern Chile: An Application of the Standardized Precipitation Evapotranspiration Index. Weather Clim. Extrem. 2013, 1, 51–58. [Google Scholar] [CrossRef]
  28. You, L.; Wang, G.Q.; Yan, J.; Li, F. Impact of Climate Warming on Agriculture and Animal Husbandry in Horqin Sandy Land, Inner Mongolia. Meteorology 2007, 33, 31–40. (In Chinese) [Google Scholar]
  29. Zhang, M.J.; Chun, X.; Liang, A.R.N.; Liu, M.P.; Liu, Y. Climate Changes in Horqin Sandy Land in Recent 60 Years. J. Arid Land Resour. Environ. 2012, 26, 8–16. (In Chinese) [Google Scholar]
  30. Qu, C.P.; Guan, D.X.; Wang, A.Z.; Jin, C.J.; Yuan, F.H.; Wu, J.B.; Ni, P. Characteristics of Climate Change in Horqin Sandy Land in Past 56 Years. Chin. J. Ecol. 2009, 28, 2326–2332. (In Chinese) [Google Scholar]
  31. Wang, J.R.; Ma, L.; Liu, T.X.; Huang, X.; Liu, D.H.; Li, H.Y. Comparative Analysis of Temperature Before and after Abrupt Changes in Horqin Sandy Land from 1951 to 2012. Resour. Sci. 2016, 38, 690–703. (In Chinese) [Google Scholar]
  32. Seager, R.; Ting, M.; Li, C.; Naik, N.; Cook, B.; Nakamura, J.; Liu, H. Projections of Declining Surface-Water Availability for the Southwestern United States. Nat. Clim. Chang. 2013, 35, 482–486. [Google Scholar] [CrossRef]
  33. Wu, R.; Hu, Z.Z.; Kirtman, B.P. Evolution of ENSO-related Rainfall Anomalies in East Asia. J. Clim. 2003, 16, 3742–3758. [Google Scholar] [CrossRef]
  34. Su, M.; Wang, H. Relationship and Its Instability of ENSO—Chinese Variations in Droughts and Wet Spells. Sci. China Ser. D 2007, 50, 145–152. [Google Scholar] [CrossRef]
  35. Ma, Z.; Shao, L. Relationship between Dry/Wet Variation and the Pacific Decade Oscillation (PDO) in Northern China during the Last 100 Years. Chin. J. Atmos. Sci. 2006, 30, 464–474. (In Chinese) [Google Scholar]
  36. Gong, D.Y.; Wang, S.W. Influence of Arctic Oscillation on Winter Climate over China. J. Geogr. Sci. 2003, 13, 208–216. [Google Scholar]
  37. Park, T.; Jang, C.J.; Kwon, M.; Na, H.; Kim, K.Y. An Effect of ENSO on Summer Surface Salinity in the Yellow and East China Seas. J. Mar. Syst. 2015, 141, 122–127. [Google Scholar] [CrossRef]
  38. Wolter, K. Multivariate ENSO Index (MEI). Climate Diagnostics Center Report. Available online: www.cdc.noaa.gov (accessed on 15 November 2016).
  39. Earth System Research Laboratory. Available online: http://www.esrl.noaa.gov/psd/enso/mei/table.html (accessed on 6 July 2016).
  40. Zhang, Y.; Wallace, J.M.; Battisti, D.S. ENSO-like interdecadal variability: 1900–1993. J. Clim. 1997, 10, 1004–1020. [Google Scholar] [CrossRef]
  41. Xiao, M.; Zhang, Q.; Singh, V.P. Influences of ENSO, NAO, IOD and PDO on Seasonal Precipitation Regimes in the Yangtze River Basin, China. Int. J. Climatol. 2015, 35, 3556–3567. [Google Scholar] [CrossRef]
  42. College of the Environment, University of Washington. Available online: http://research.jisao.washington.edu/pdo/PDO.latest (accessed on 10 June 2016).
  43. Zhu, J.; Liao, H.; Li, J. Increases in aerosol Concentrations over Eastern China due to the Decadal-Scale Weakening of the East Asian Summer Monsoon. Geophys. Res. Lett. 2012, 39. [Google Scholar] [CrossRef]
  44. Jianping Li’s Home Page. Available online: http://ljp.gcess.cn/dct/page/1 (accessed on 28 May 2016).
  45. Zhang, Q.; Zhang, J.Q.; Wang, C.Y. Risk Assessment of Drought Disaster in Typical Area of Corn Cultivation in China. Theor. Appl. Climatol. 2016, 25, 1–8. [Google Scholar] [CrossRef]
  46. Zhang, Q.; Zhang, J. Drought Hazard Assessment in Typical Corn Cultivated Areas of China at Present and Potential Climate Change. Nat. Hazards 2016, 81, 1323–1331. [Google Scholar] [CrossRef]
  47. Wang, K.Y.; Li, Q.F.; Yang, Y.; Zeng, M.; Li, P.C.; Zhang, J.X. Analysis of Spatio-Temporal Evolution of Droughts in Luanhe River Basin Using Different Drought Indices. Water Sci. Eng. 2015, 8, 282–290. [Google Scholar] [CrossRef]
  48. Zhang, Q.; Gemmer, M.; Chen, J. Climate Changes and Flood/Drought Risk in the Yangtze Delta, China, during the Past Millennium. Quat. Int. 2008, 176–177, 62–69. [Google Scholar] [CrossRef]
  49. Dai, A.G.; Trenberth, K.E.; Qian, T.T. A Global Data Set of Palmer Drought Severity Index for 1870–2002: Relationship with Soil Moisture and Effects of Surface Warming. J. Hydrometeorol. 2004, 5, 1117–1130. [Google Scholar] [CrossRef]
  50. Klein Tank, A.M.G.; Können, G.P. Trends in Indices of Daily Temperature and Precipitation Extremes in Europe, 1946–1999. J. Clim. 2003, 16, 3665–3680. [Google Scholar] [CrossRef]
  51. Bartholy, J.; Pongrácz, R.; Kis, A. Projected Changes of Extreme Precipitation using Multi-model Approach. Q. J. Hung. Meteorol. Serv. 2015, 119, 129–142. [Google Scholar]
  52. Fang, S.; Qi, Y.; Han, G.; Zhou, G. Changing Trends and Abrupt Features of Extreme Temperature in Mainland China during 1960 to 2010. Earth Syst. Dyn. Discuss. 2015, 6, 979–1000. [Google Scholar] [CrossRef]
  53. Zhang, D.D.; Yan, D.H.; Wang, Y.C.; Lu, F.; Wu, D. Changes in Extreme Precipitation in the Huang-Huai-Hai River Basin of China during 1960–2010. Theor. Appl. Climatol. 2015, 120, 195–209. [Google Scholar] [CrossRef]
  54. Sen, P.K. Estimates of the Regression Coefficient based on Kendall’s Tau. J. Am. Stat. Assoc. 1968, 63, 1379–1389. [Google Scholar] [CrossRef]
  55. Mann, H.B. Nonparametric tests against trend. Econometrica 1945, 13, 245–259. [Google Scholar] [CrossRef]
  56. Kendall, M.G. Rank Correlation Methods; Griffin: London, UK, 1955. [Google Scholar]
  57. Axelson, J.N.; Sauchyn, D.J.; Barichivich, J. New Reconstructions of Streamflow Variability in the South Saskatchewan River Basin from a Network of Tree Ring Chronologies, Alberta, Canada. Water Resour. Res. 2009, 45, 318–326. [Google Scholar] [CrossRef]
  58. Zanchettin, D.; Rubino, A.; Matei, D.; Bothe, O.; Jungclaus, J.H. Multidecadal-to-centennial SST Variability in the MPI-ESM Simulation Ensemble for the Last Millennium. Clim. Dyn. 2012, 40, 1–18. [Google Scholar] [CrossRef]
  59. Solomon, S.; Qin, D.; Manning, M.; Marquis, M.; Marquis, M.; Averyt, K.B.; Tignor, M.; Miller, H.L. (Eds.) Climate Change 2007: The Physical Science Basis; Cambridge University Press: Cambridge, UK, 2007; p. 996.
  60. Dai, A.G.; Trenberth, K.E.; Karl, T.R. Global Variations in Droughts and Wet Spells: 1900–1995. Geophys. Res. Lett. 1998, 25, 3367–3370. [Google Scholar] [CrossRef]
  61. Wang, H.L.; Chen, A.F.; Wang, Q.F.; He, B. Drought Dynamics and Impacts on Vegetation in China from 1982 to 2011. Ecol. Eng. 2015, 75, 303–307. [Google Scholar] [CrossRef]
  62. Zou, X.; Zhai, P.; Zhang, Q. Variations in Droughts over China: 1951–2003. Geophys. Res. Lett. 2005, 32. [Google Scholar] [CrossRef]
  63. Zhang, G.Y.; Wang, C.M.; Bian, R.J.; Qu, X.J.; Yang, X.M. The Climate Change Analysis of Most Typical Region in Horqin Sandy Area for Nearly 50 Years. Chin. Agric. Sci. Bull. 2012, 28, 287–290. (In Chinese) [Google Scholar]
  64. Bao, H.H.; Bao, Y.W. Characteristics of Drought/Flood Spatial and Temporal Distribution in Horqin Sandy Land during the Last 300 Years. J. Arid Land Resour. Environ. 2008, 4, 100–107. (In Chinese) [Google Scholar]
  65. Xu, K.; Yang, D.; Yang, H.; Li, Z.; Qin, Y.; Shen, Y. Spatio-temporal Variation of Drought in China during 1961–2012: A Climatic Perspective. J. Hydrol. 2015, 526, 253–264. [Google Scholar] [CrossRef]
  66. Wang, L.; Wu, Z.; He, H.; Wang, F.; Du, H.; Zong, S. Changes in summer extreme precipitation in Northeast Asia and their relationships with the East Asian summer monsoon during 1961–2009. Int. J. Climatol. 2016. [Google Scholar] [CrossRef]
Figure 1. Horqin Sandy Land, Location, and the meteorological stations.
Water 08 00543 g001
Figure 2. Time series variability of the SPEI-1 (a); SPEI-3 (b); SPEI-6 (c); and SPEI-12 (d) from 1964–2013 in Horqin Sandy Land.
Water 08 00543 g002
Figure 3. Monthly contours of SPEI-1 (a); SPEI-3 (b); SPEI-6 (c); and SPEI-12 (d) and the mean droughts events in different severity grades across 15 meteorological stations during 1964–2013. Note: ▽, ○, ★, and △ represents the mild, moderate, severe, and extreme drought, respectively.
Water 08 00543 g003
Figure 4. Drought months of different grades of drought severity in Horqin Sandy Land based on SPEI-1 (a); SPEI-3 (b); SPEI-6 (c); and SPEI-12 (d).
Water 08 00543 g004
Figure 5. Spatial patterns of trends per decade for SPEI-1 (a); SPEI-3 (b); SPEI-6 (c); and SPEI-12 (d) in Horqin Sandy Land during 1964–2013.
Water 08 00543 g005
Figure 6. Correlation coefficients between indices of climate extremes and SPEI-1 (a); SPEI-3 (b); SPEI-6 (c); and SPEI-12 (d) in Horqin Sandy Land during 1964–2013.
Water 08 00543 g006
Figure 7. Cross wavelet transform of SPEI-12 and the MEI (a); SPEI-12 and PDO (b); SPEI-12 and the AOI (c); SPEI-12 and the EASMI (d).
Water 08 00543 g007
Table 1. The SPEI grade standard divided for drought.
GradeTypeSPEI Value
0Normal>−0.5
1Mild drought(−1.00, −0.5]
2Moderate drought(−1.50, −1.00]
3Severe drought(−2.00, −1.50]
4Extreme drought≤−2.00
Table 2. Definitions of the extreme climate indices.
AbbreviationFull NameDefinitionsUnit
SUSummer daysAnnual count when TX (daily maximum) > 25 °CDays
TRTropical nightsAnnual count when TN (daily minimum) > 20 °CDays
GSLGrowing season lengthAnnual (1 January to 31 December in NH, 1 July to 30 June in SH) count between first span of at least 6 days with TG > 5 °C and first span after July 1 (1 January in SH) of 6 days with TG < 5 °CDays
WSDIWarm spell duration indicatorAnnual count of days with at least 6 consecutive days when TX > 90th percentileDays
SDIISimple daily intensity indexAnnual total precipitation divided by the number of wet days (defined as PRCP ≥ 1.0 mm) in the yearmm/day
R 10mmNumber of heavy precipitation daysAnnual count of days when PRCP ≥ 10 mmDays
R 20mmNumber of very heavy precipitation daysAnnual count of days when PRCP ≥ 20 mmDays
CDDConsecutive dry daysMaximum number of consecutive days with RR < 1 mmDays
R95pTOTVery wet daysAnnual total PRCP when RR > 95th percentilemm
PRCPTOTAnnual total wet-day precipitationAnnual total PRCP in wet days (RR ≥ 1 mm)mm

