
Assessment of Shallow Groundwater Recharge from Extreme Rainfalls in the Sanjiang Plain, Northeast China


Abstract
:1. Introduction
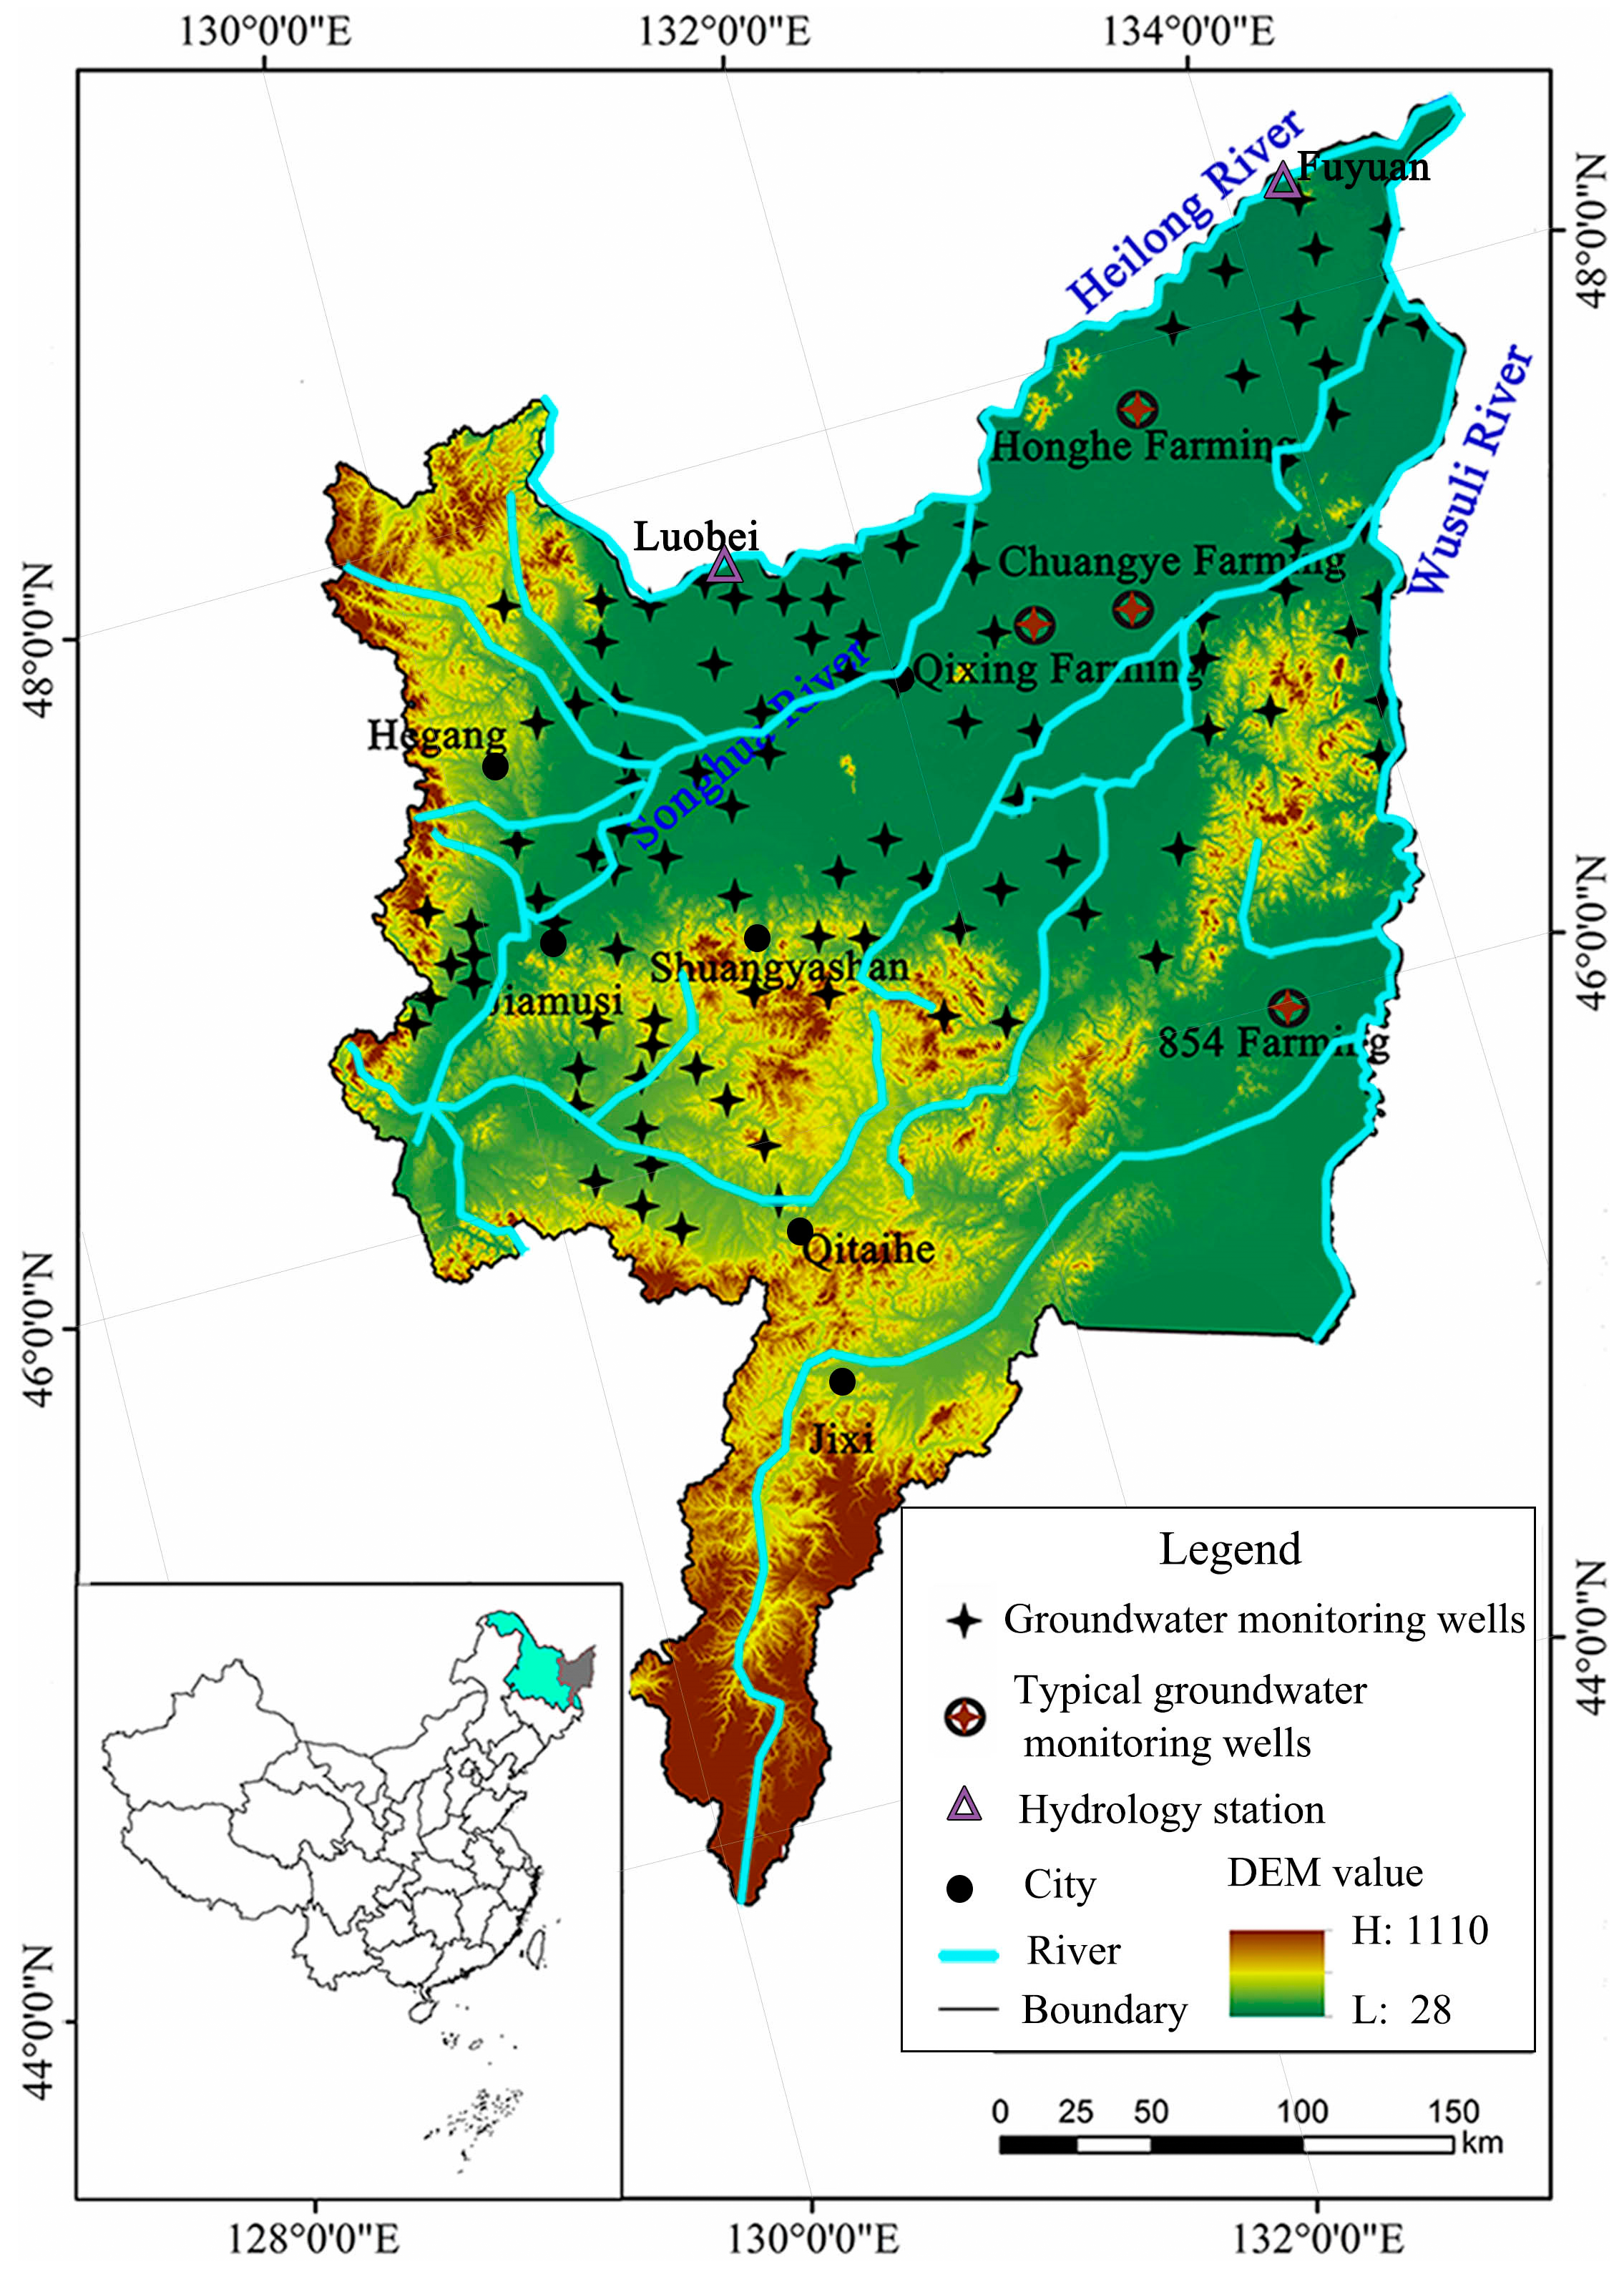
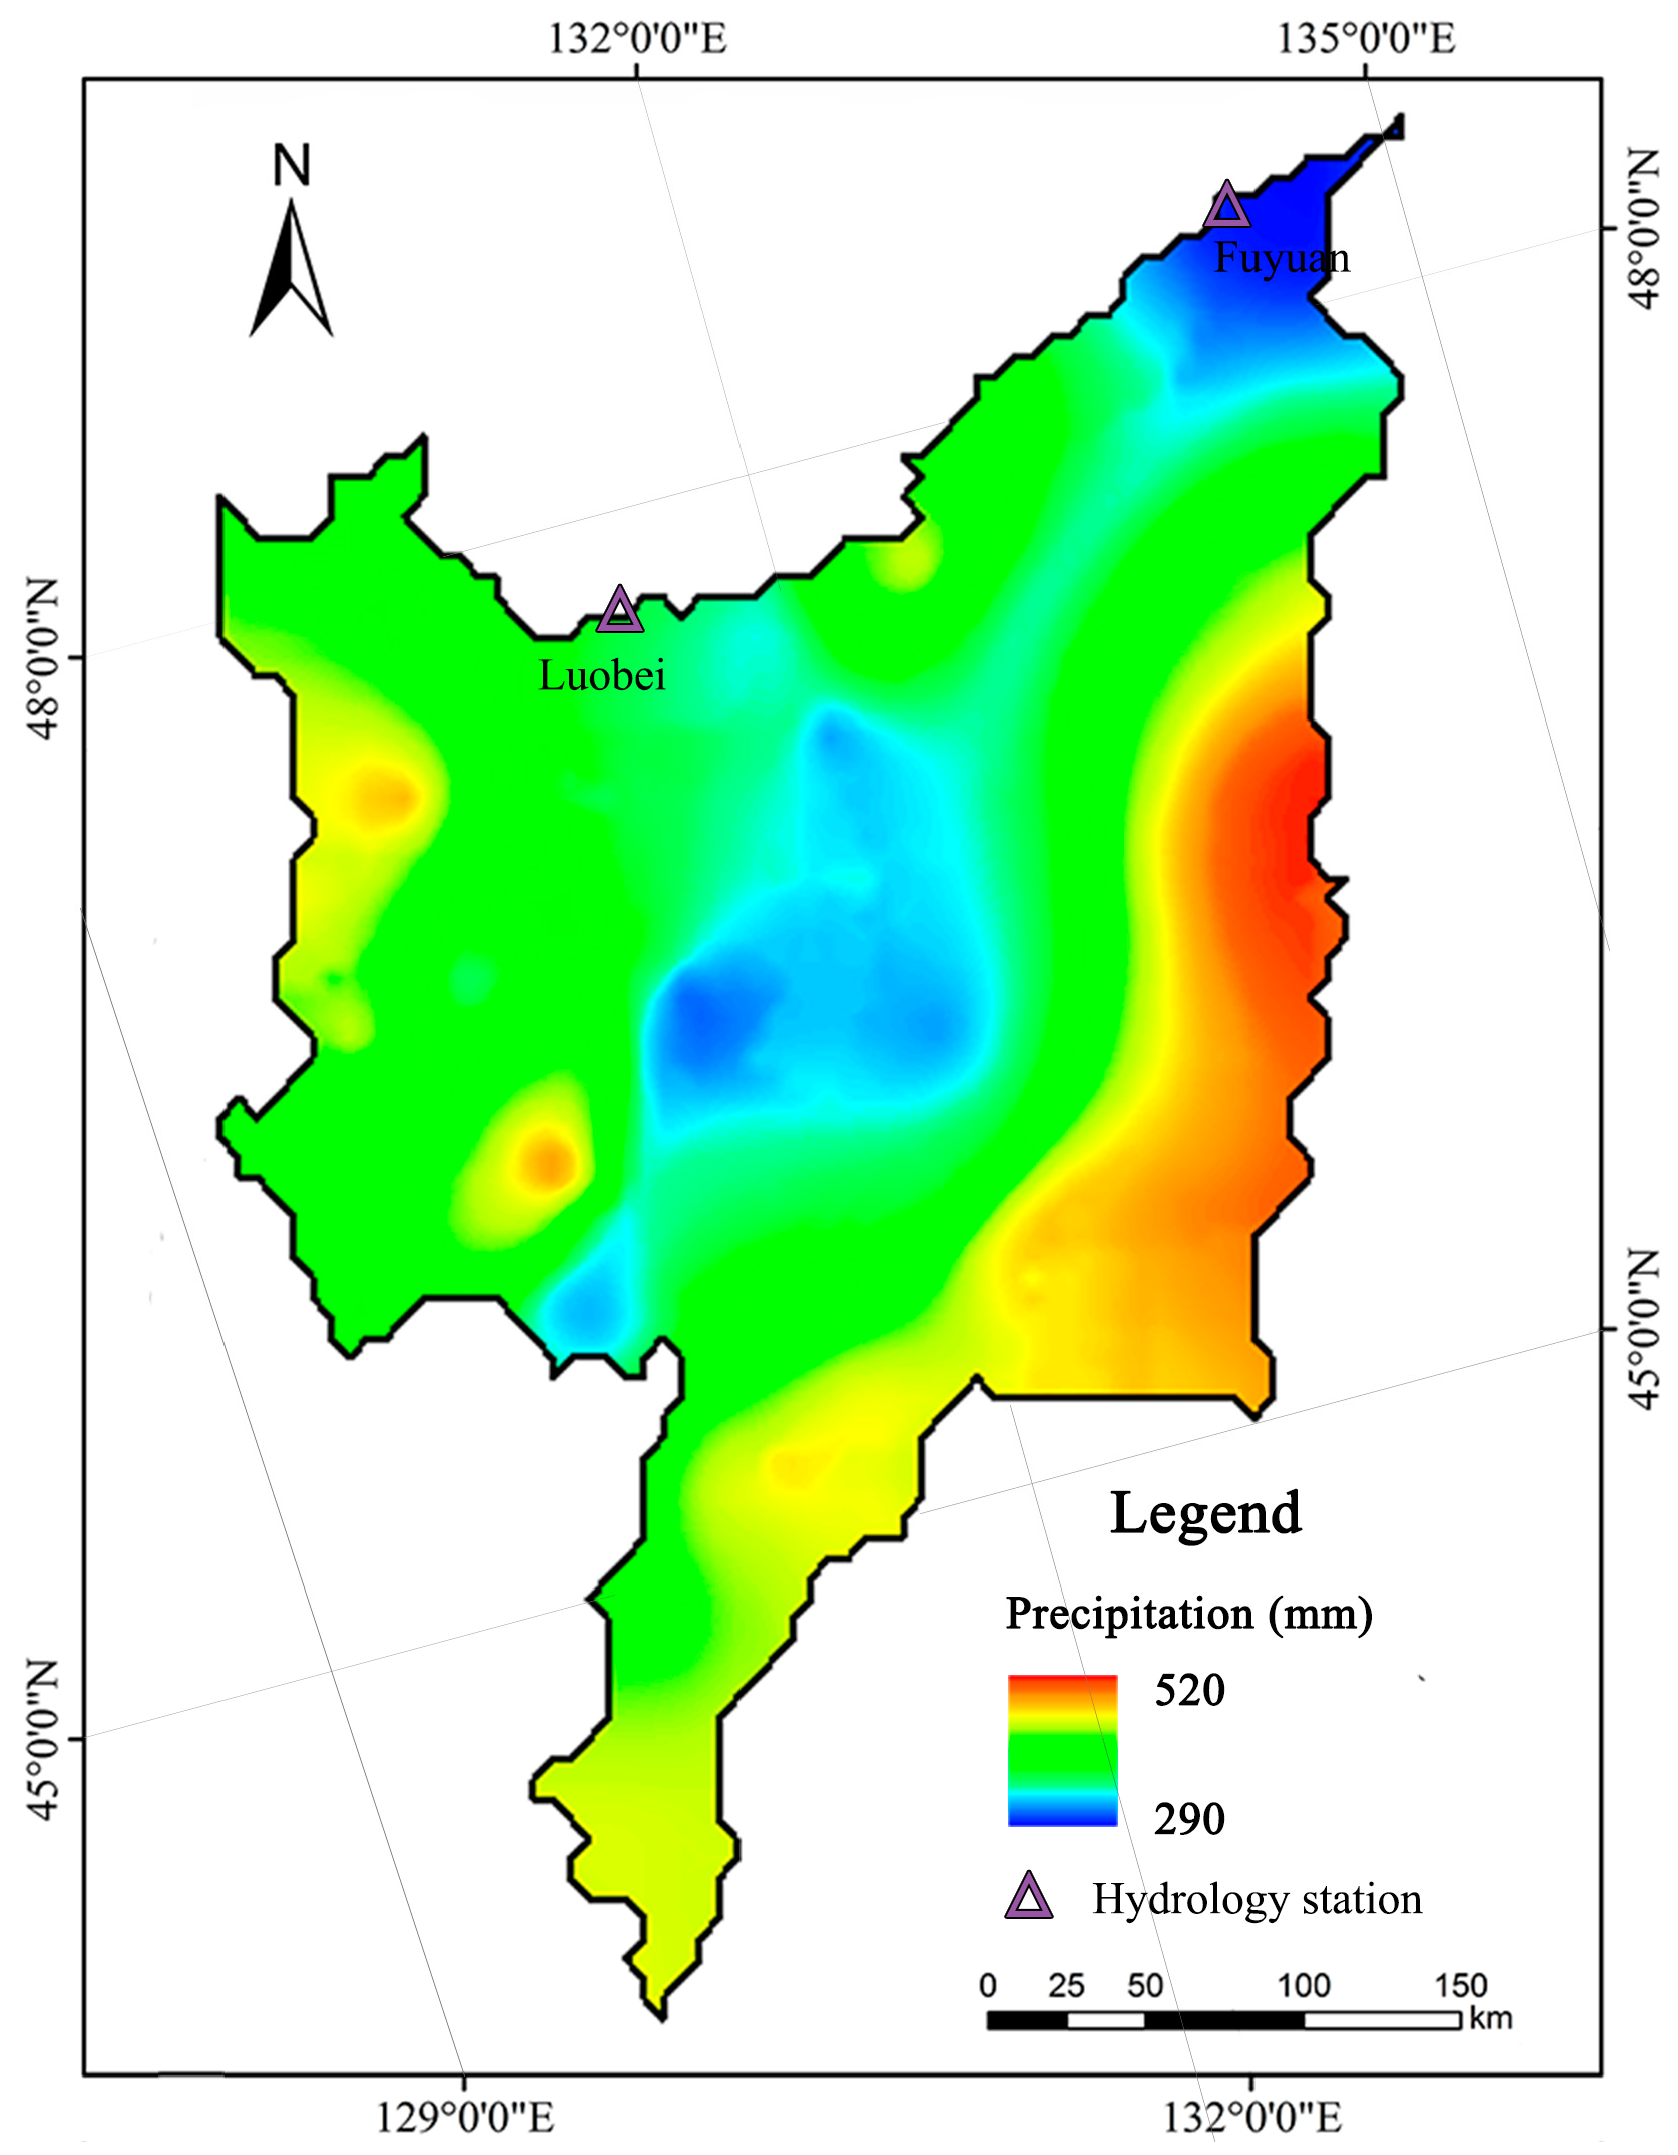
2. Study Area
3. Data and Methodology
3.1. Data
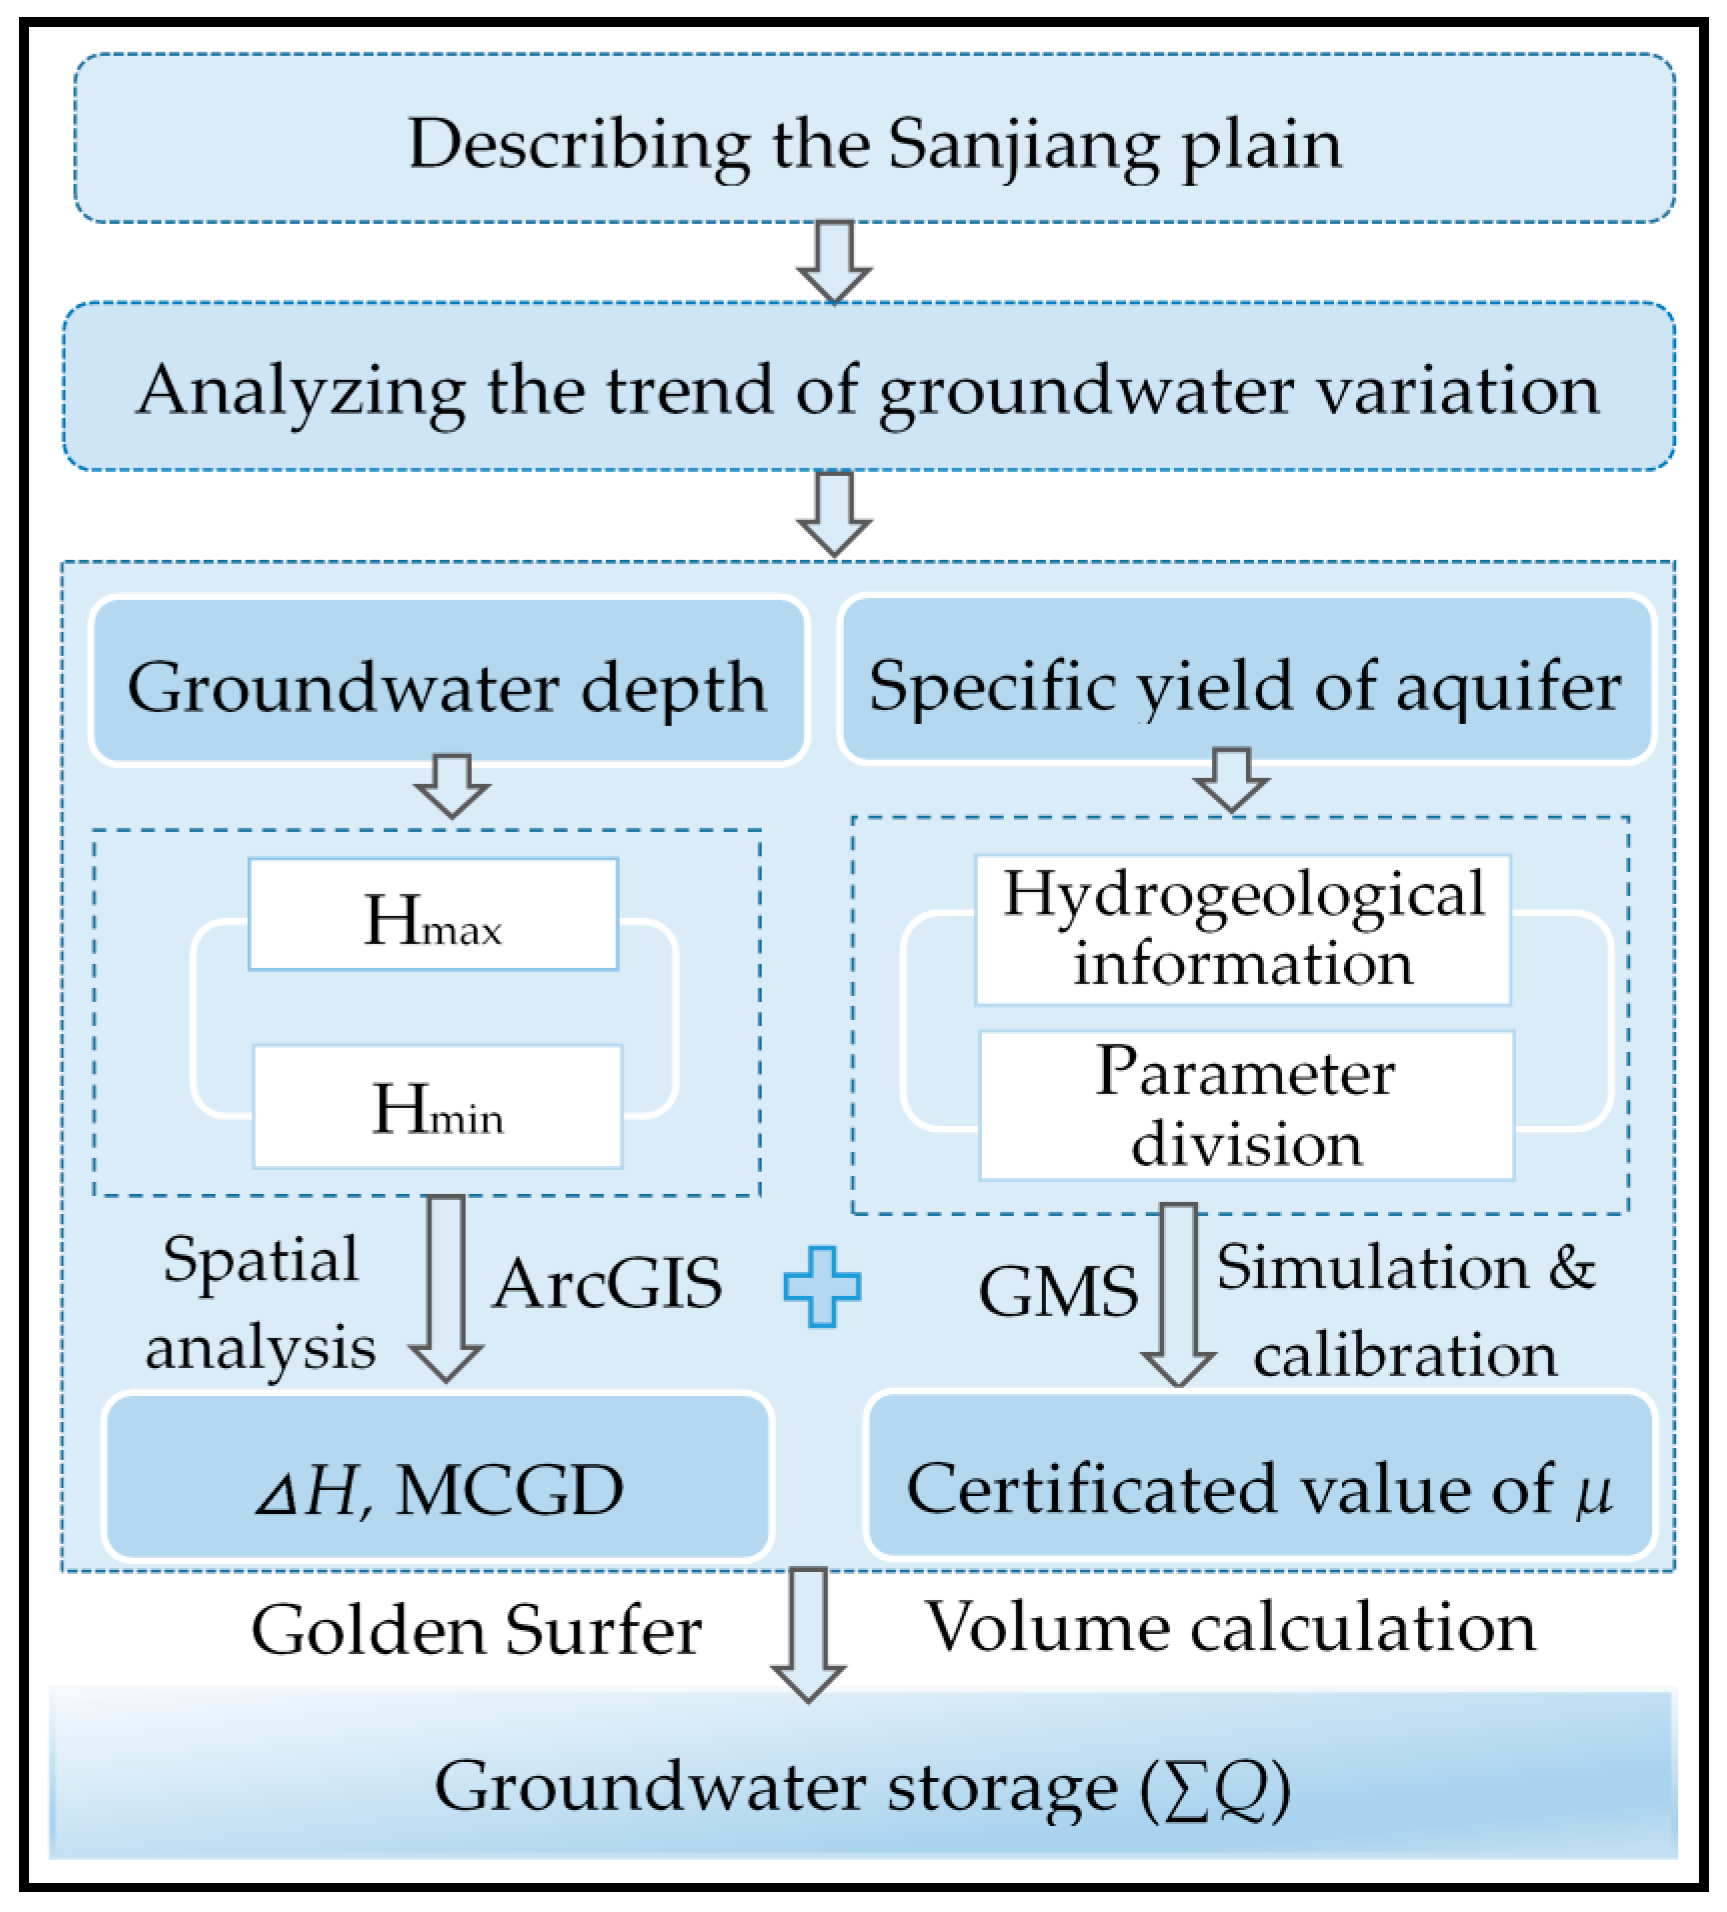
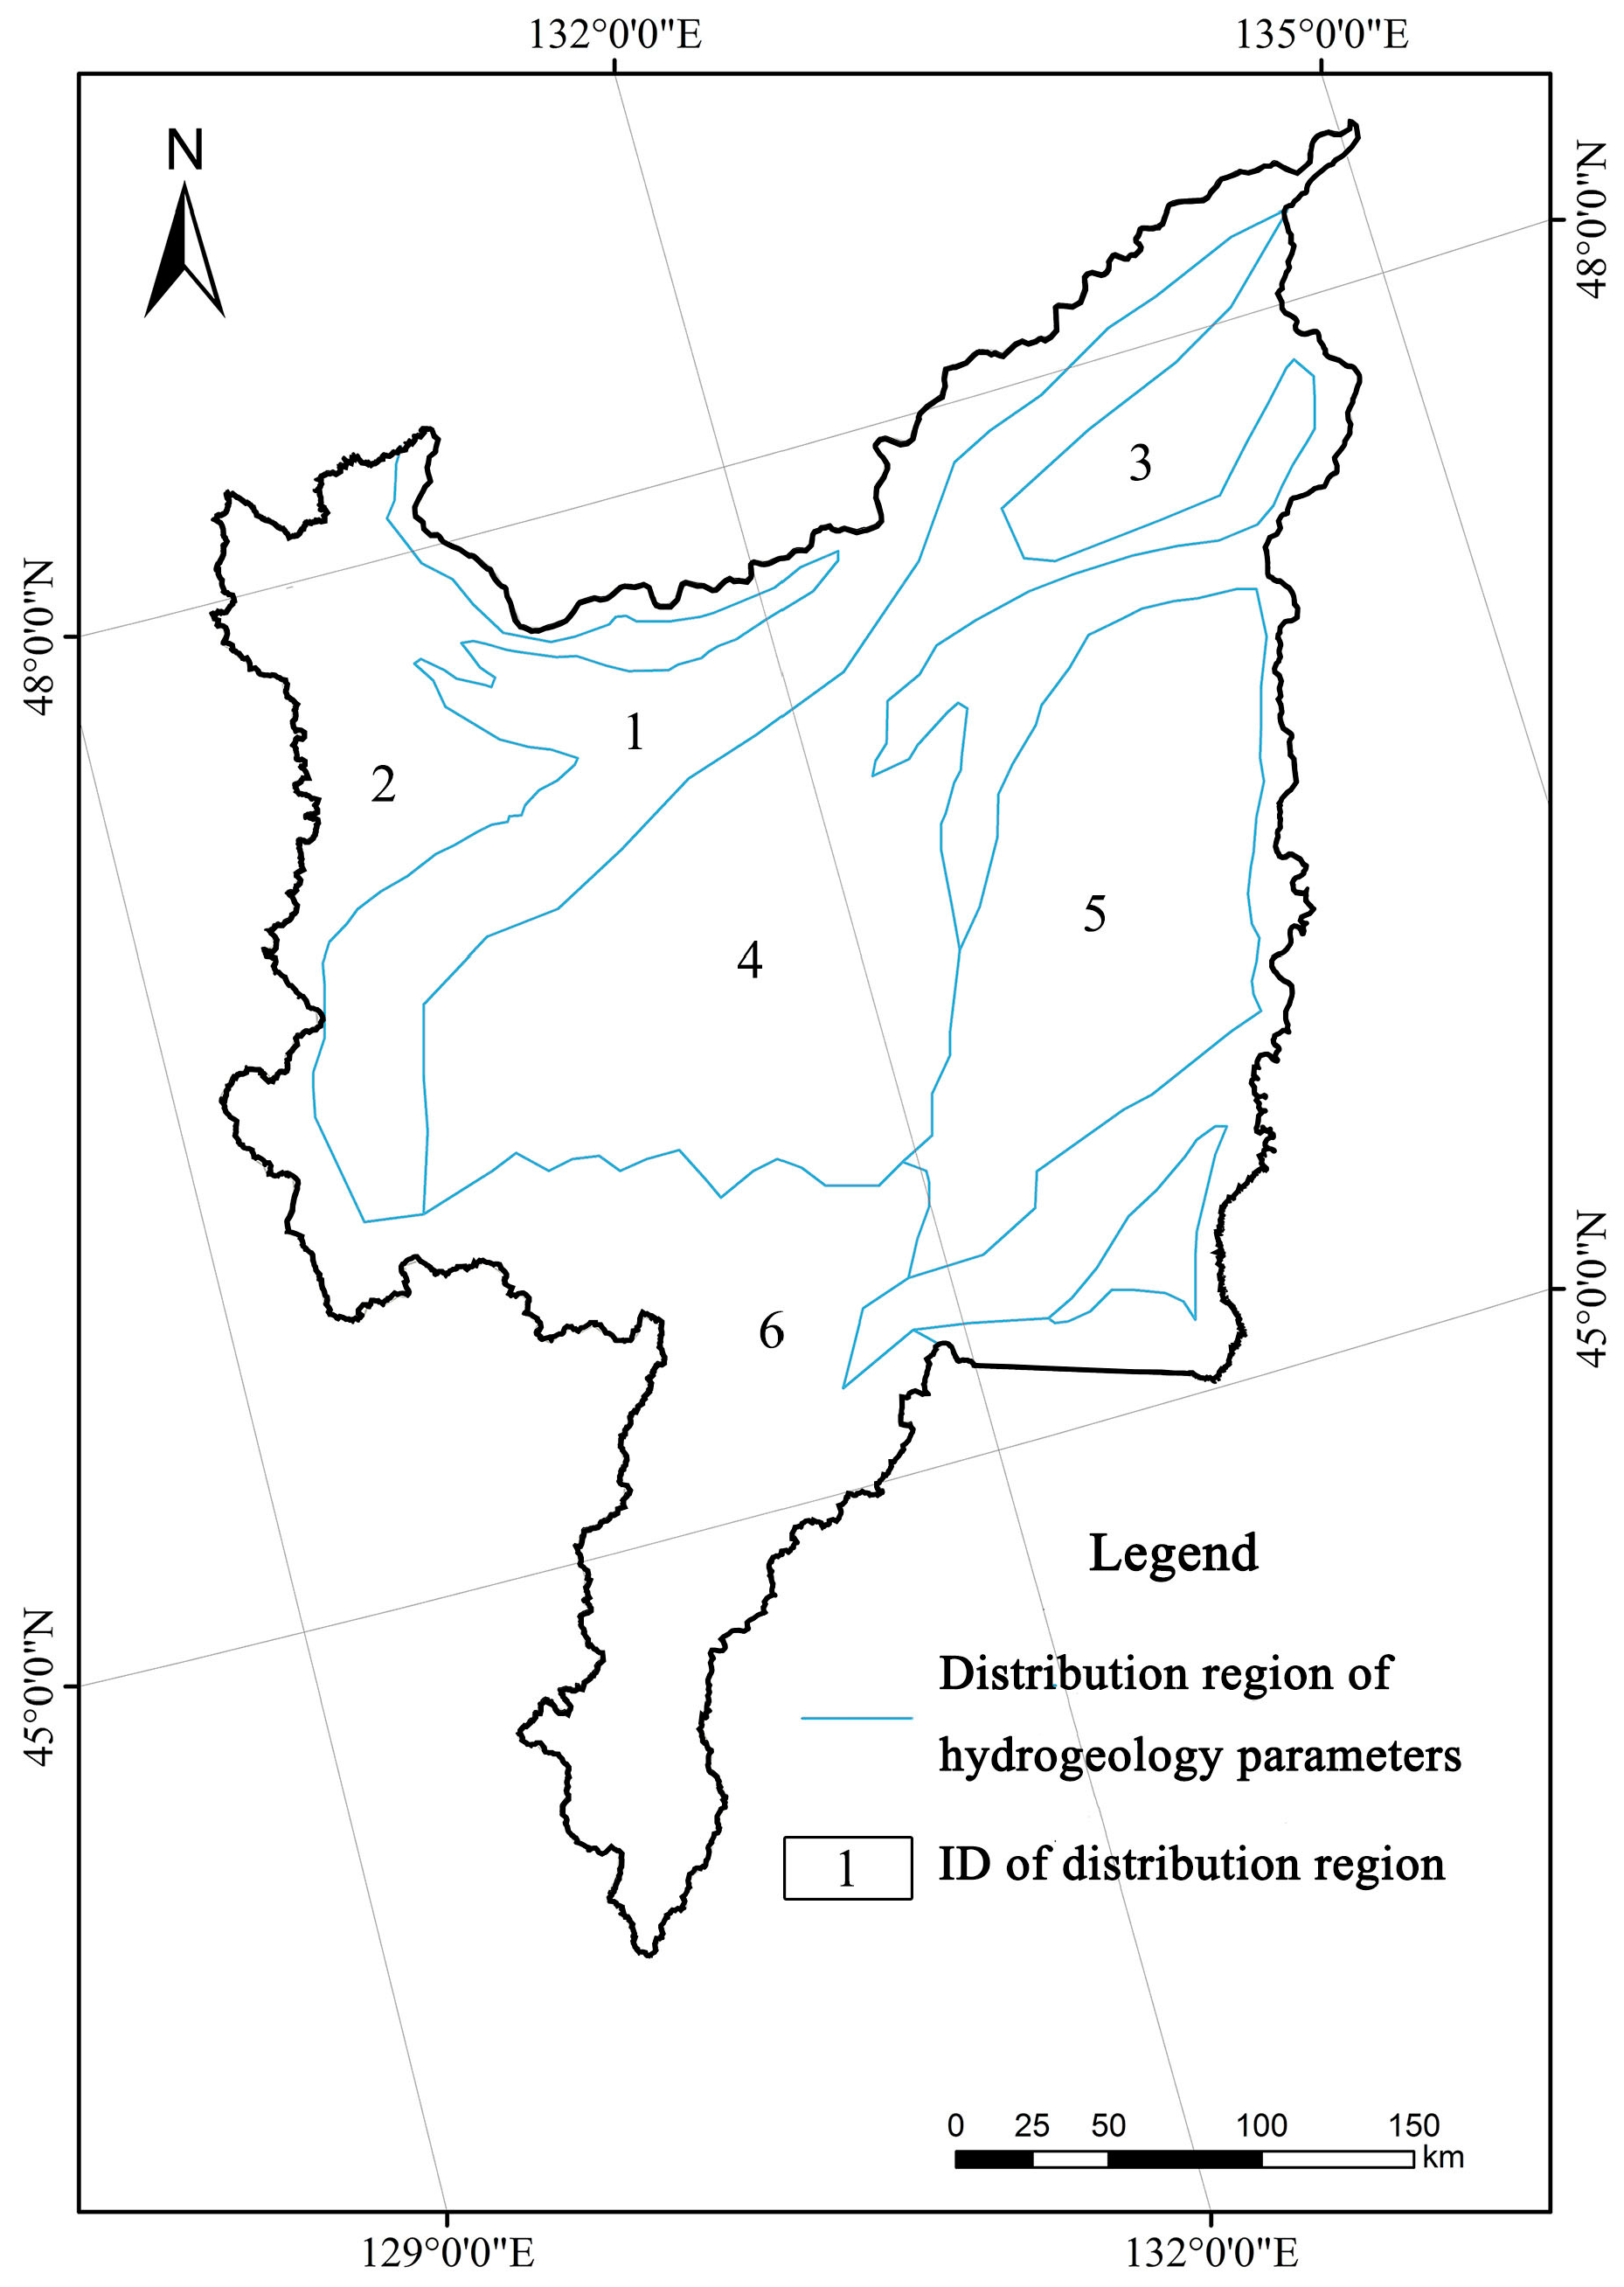
3.2. Methodology
4. Results
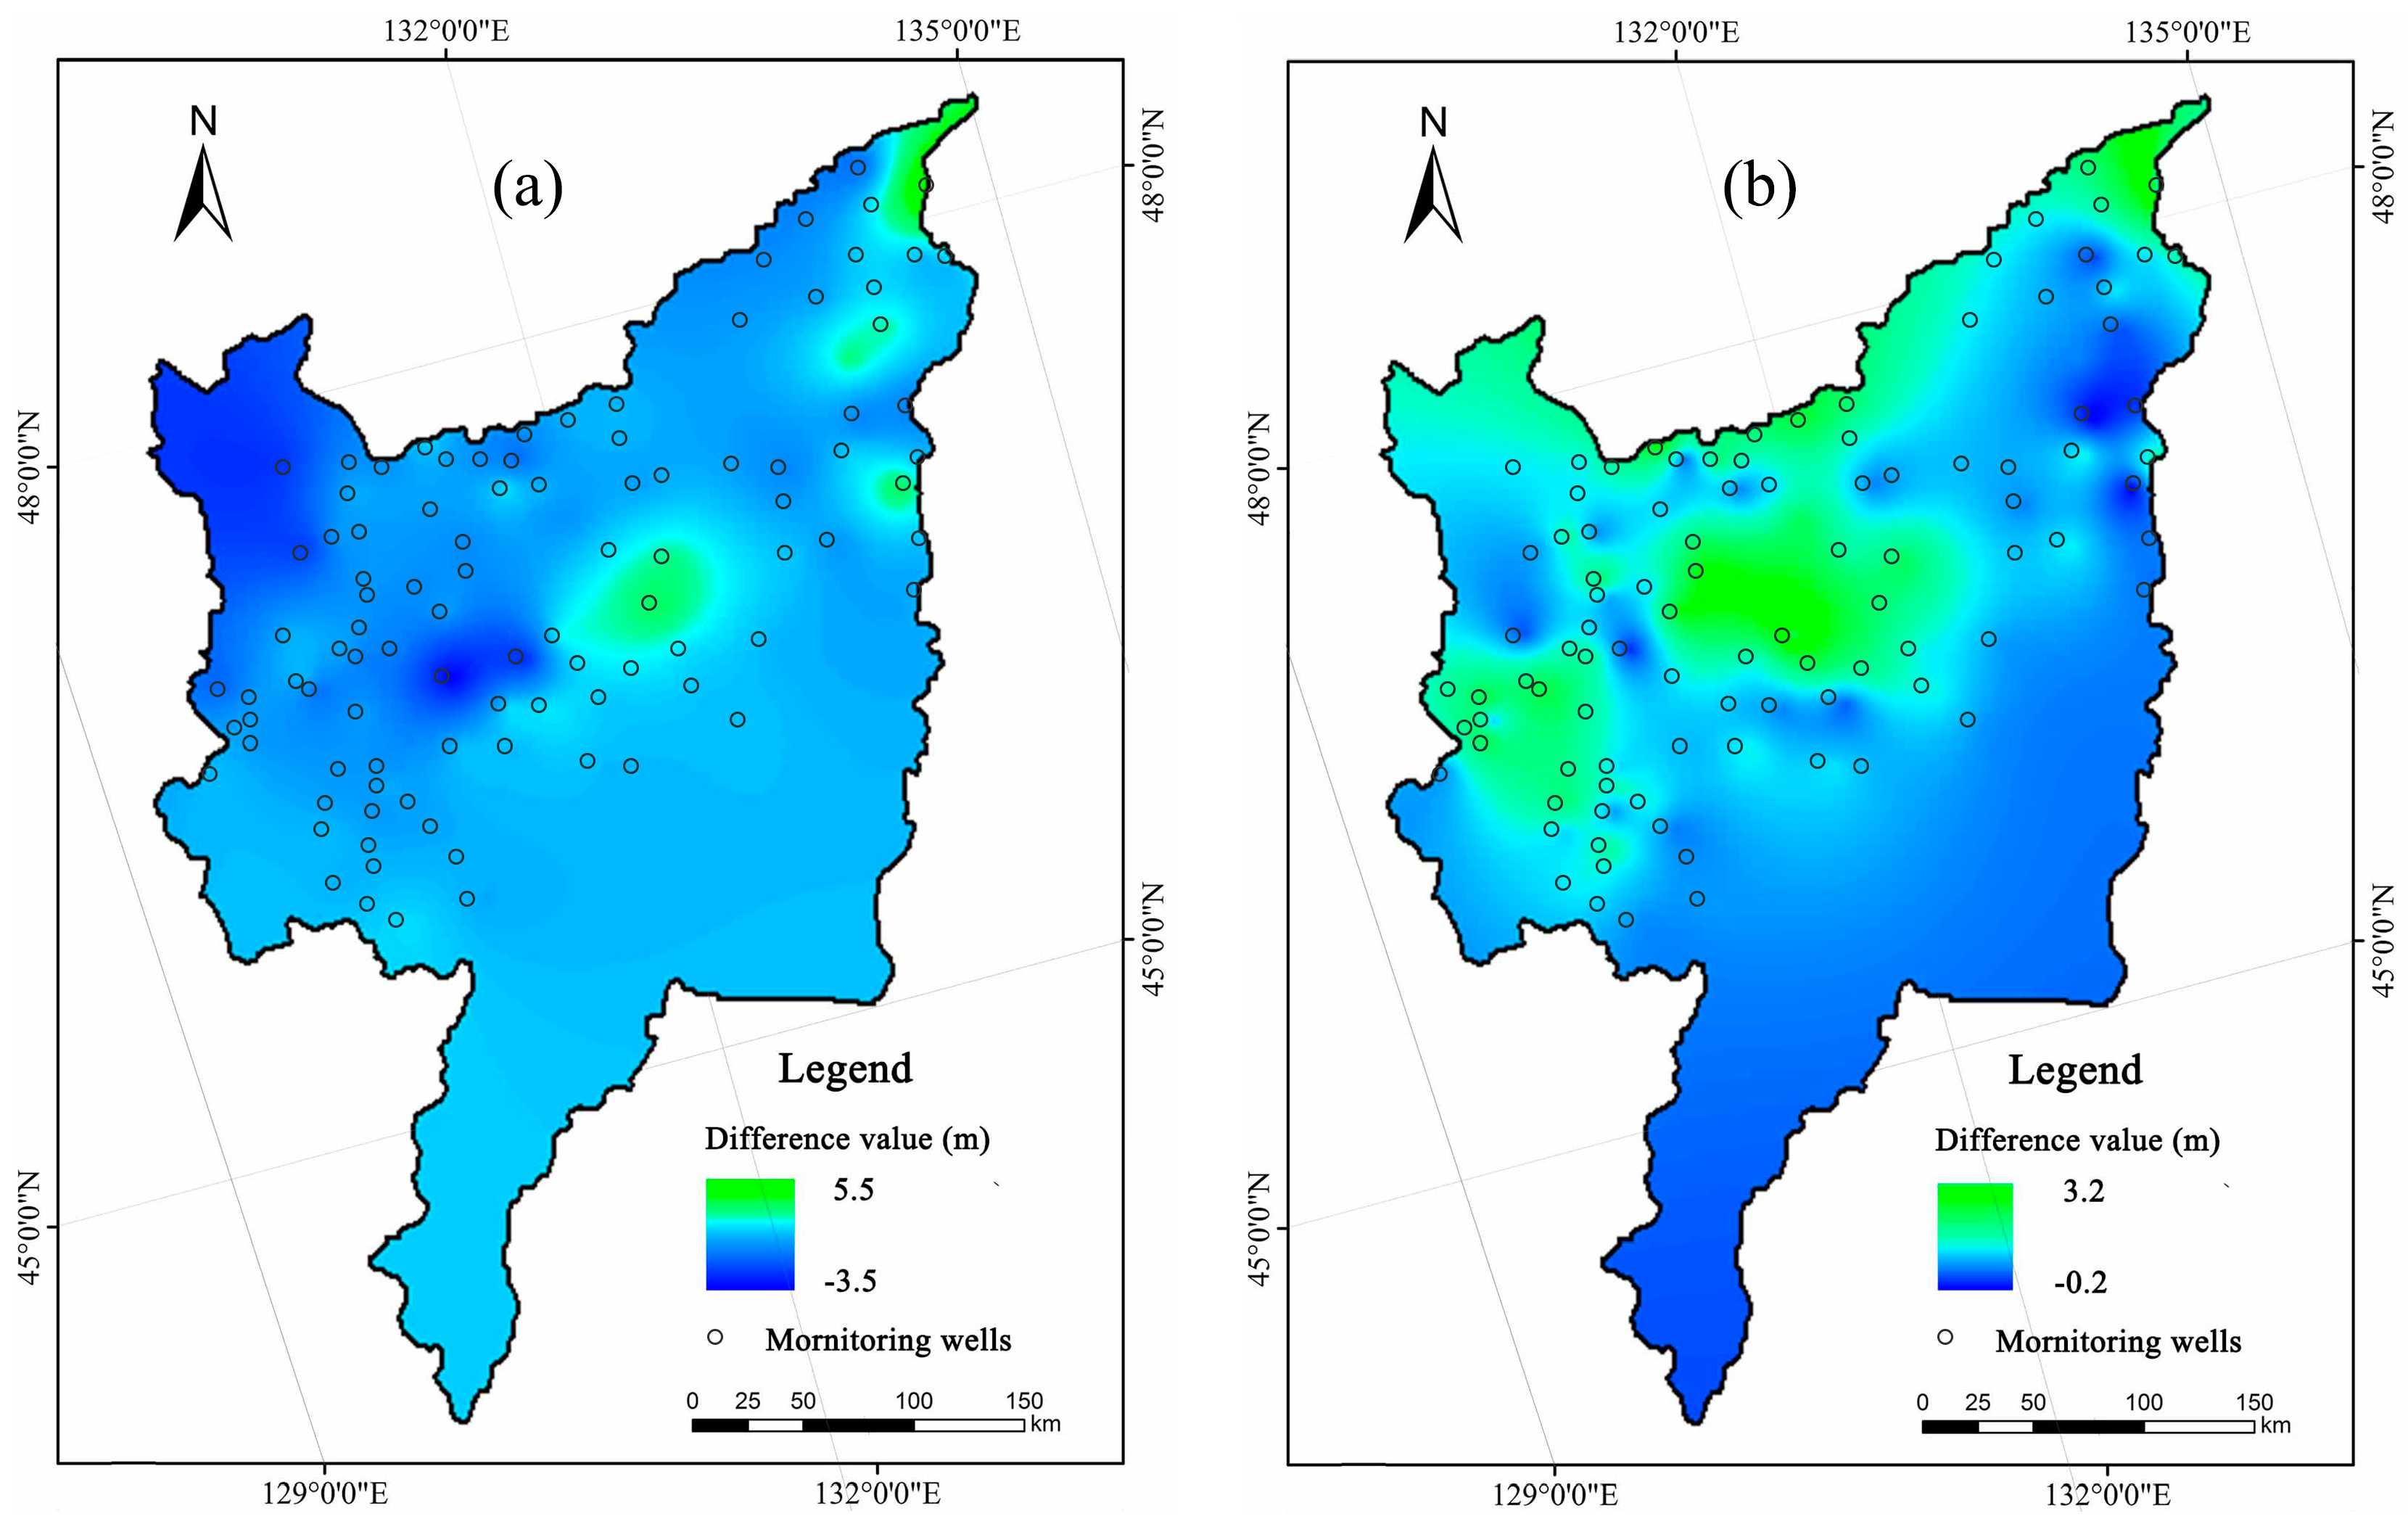
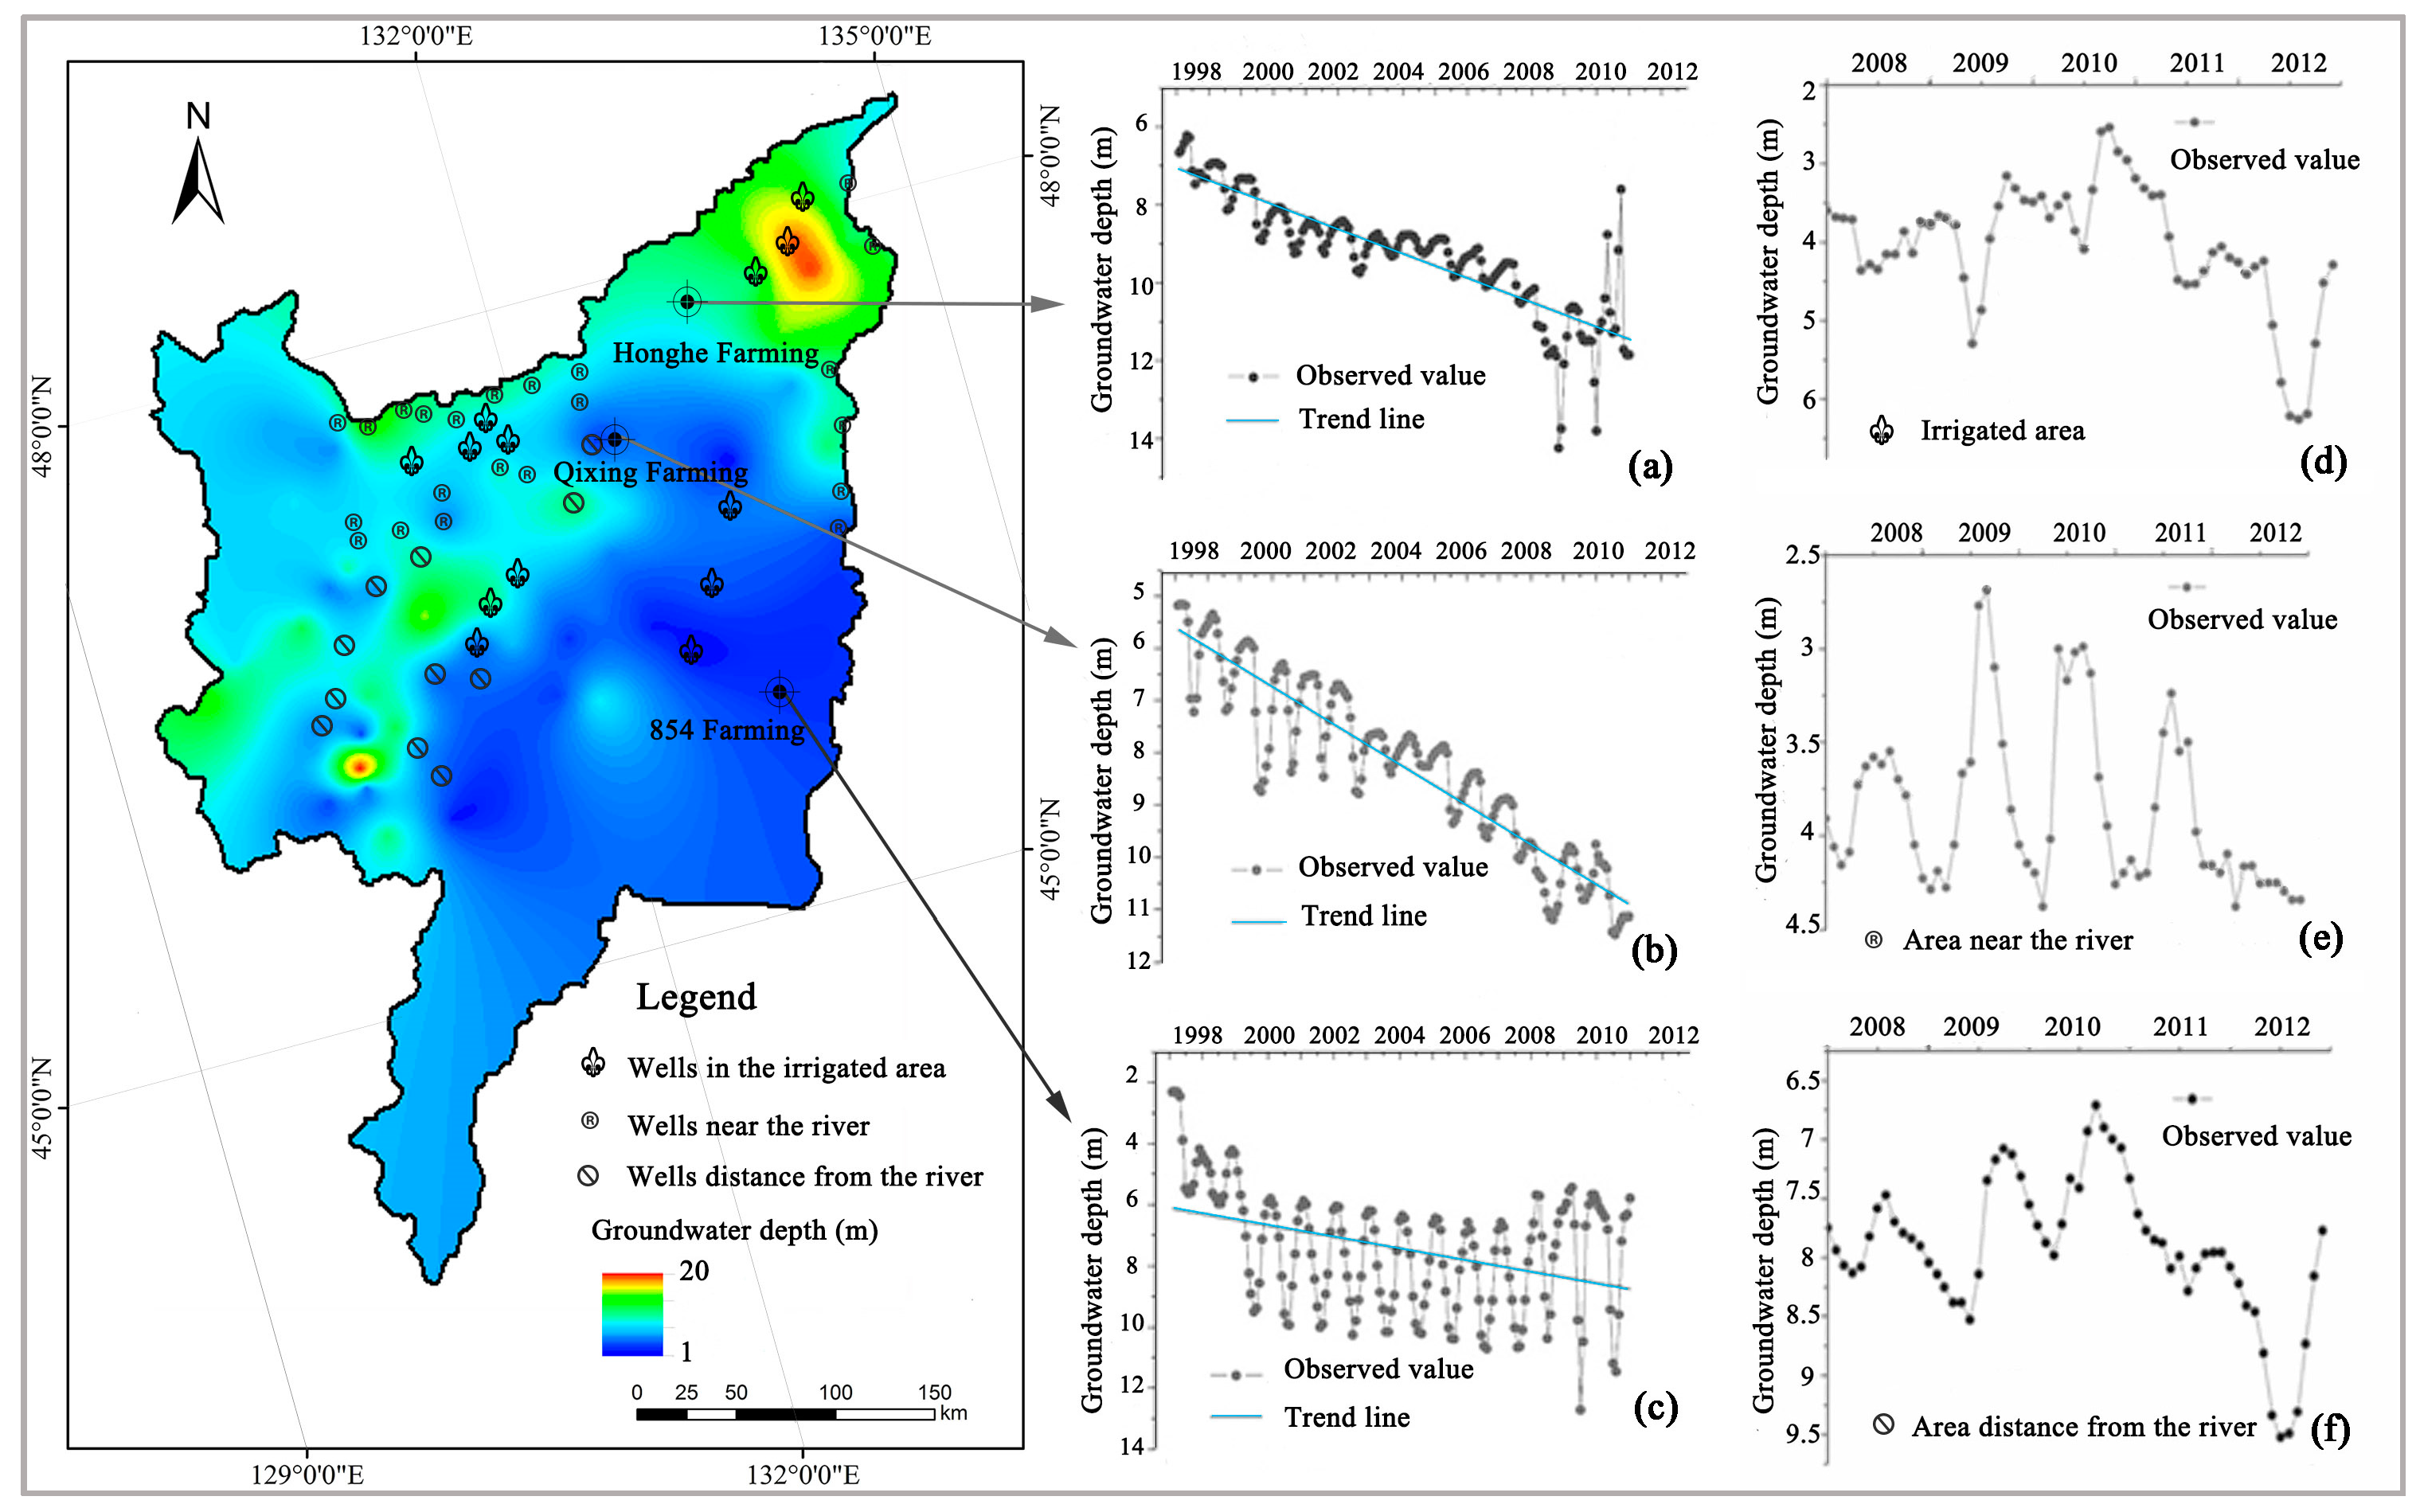
4.1. Trend of Groundwater Depth before the 2013 Extreme Rainfall
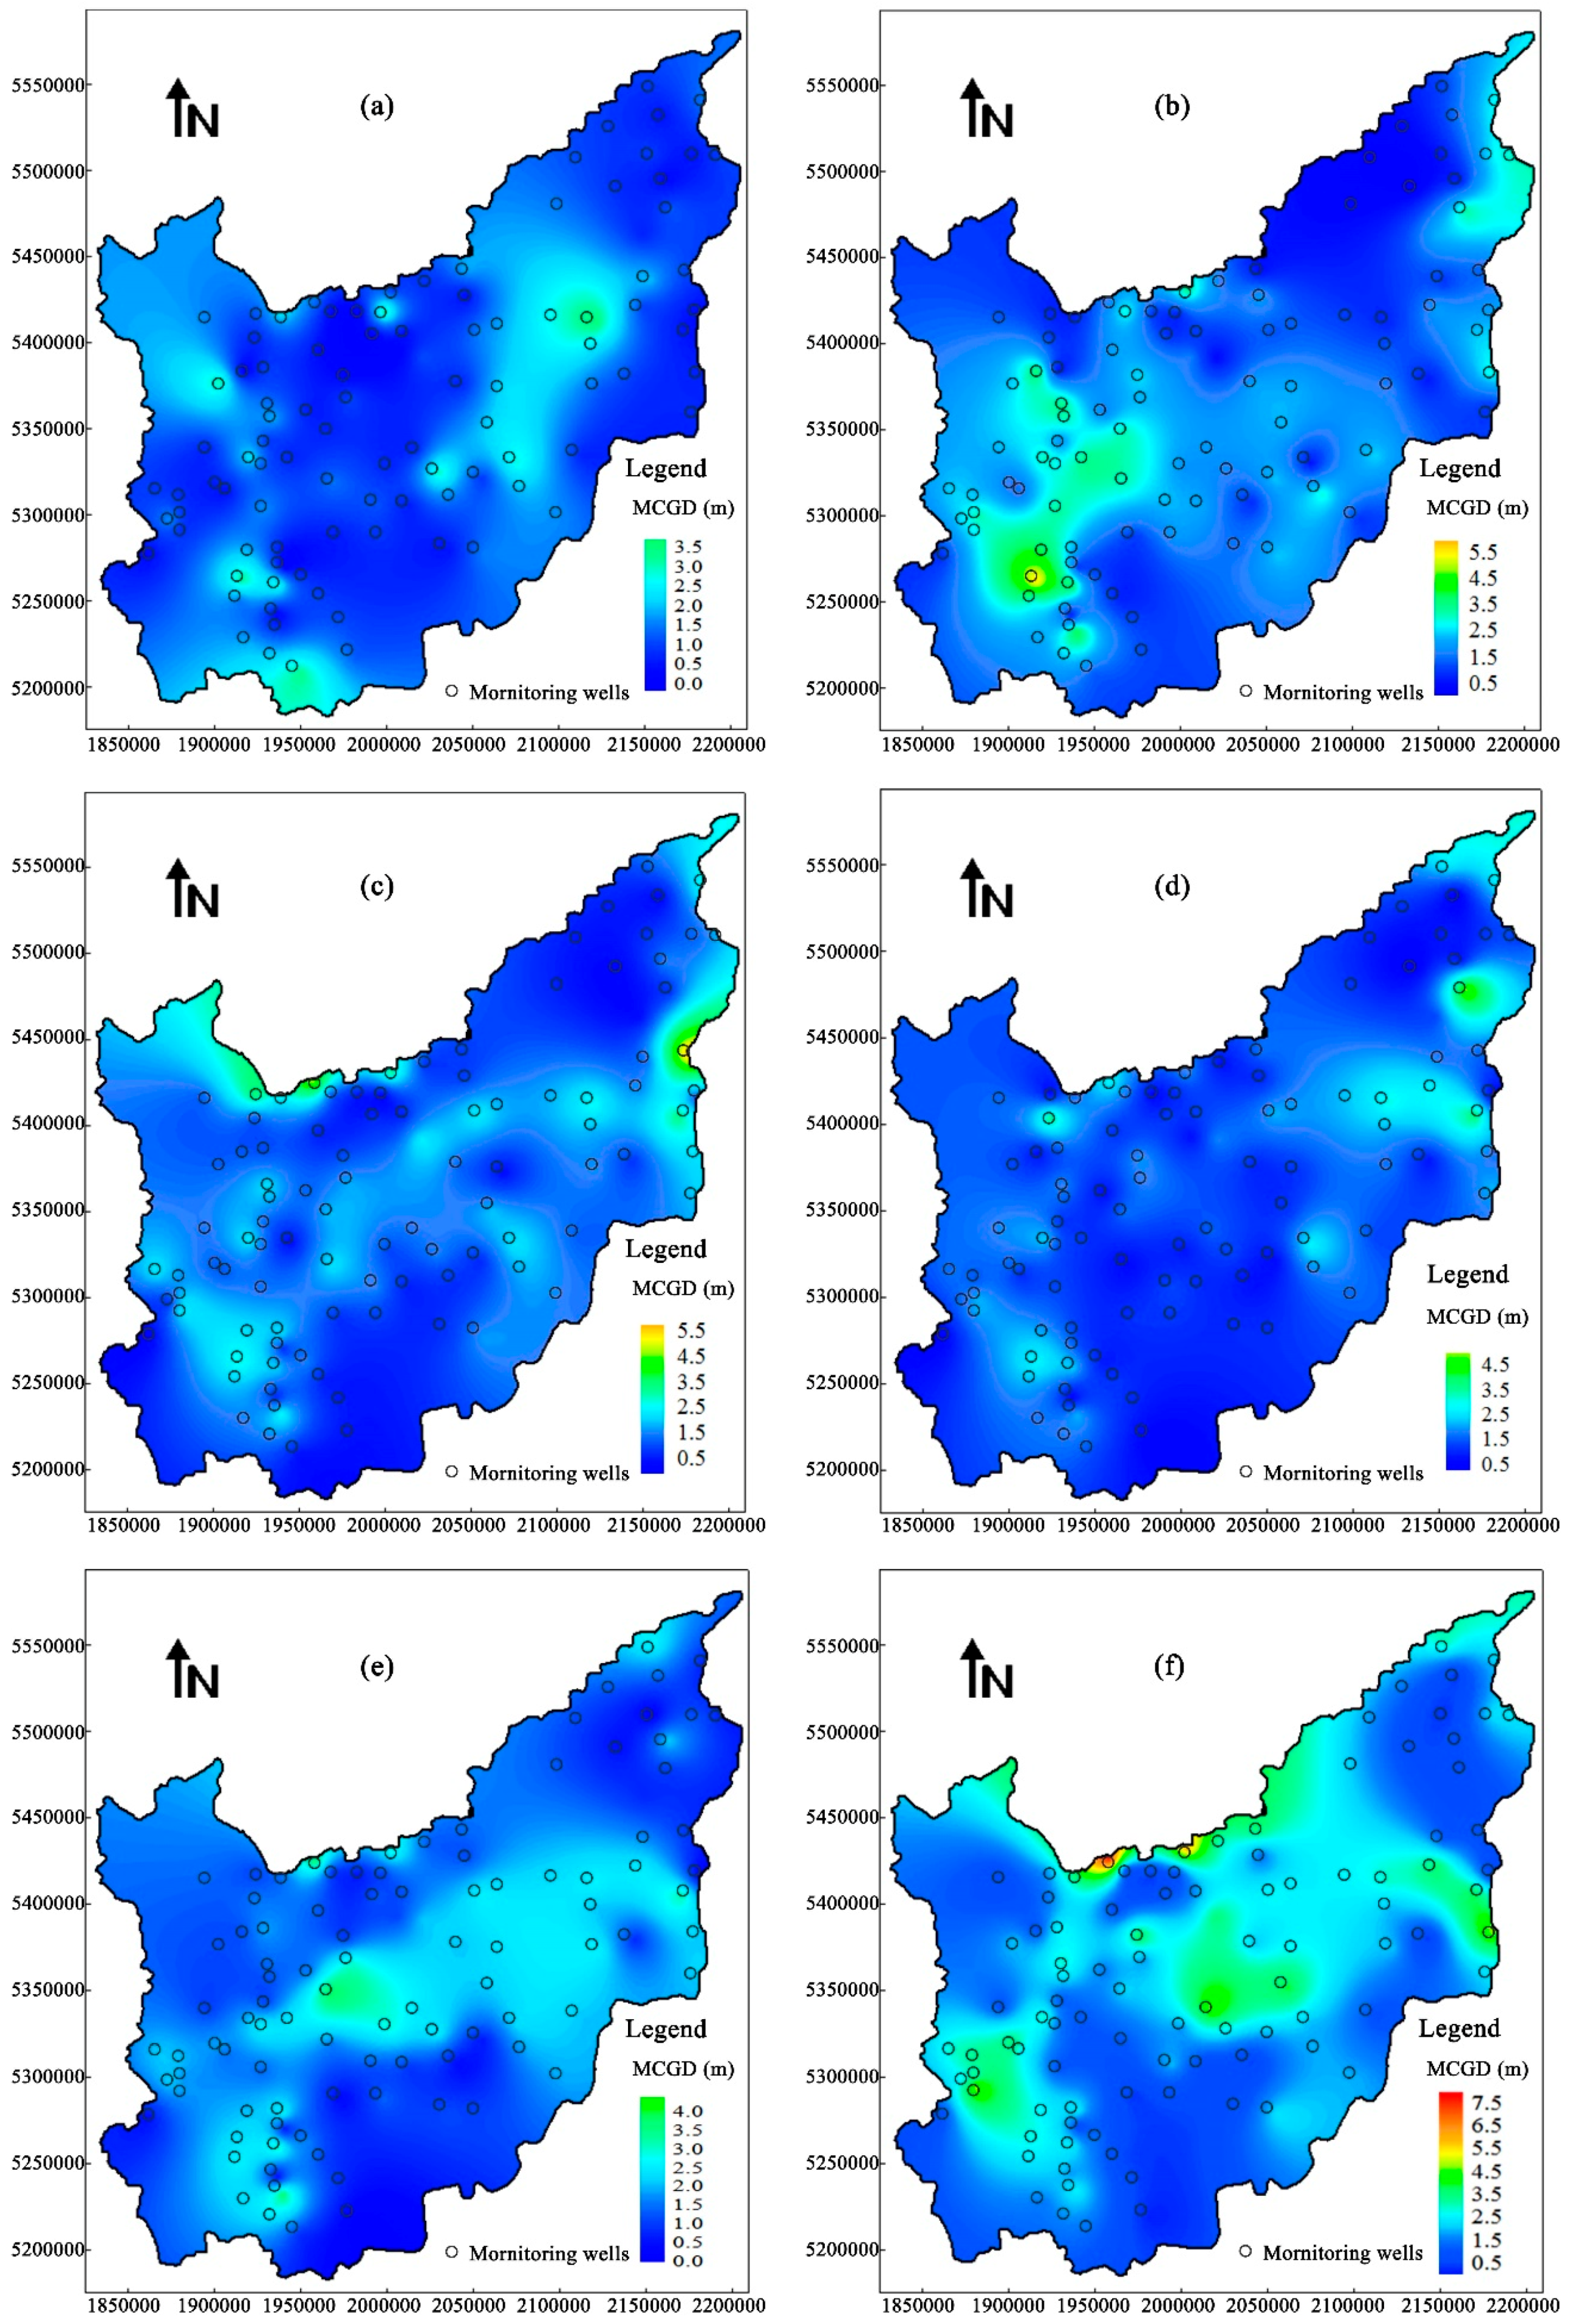
4.2. Groundwater Storage Change following the 2013 Extreme Rainfall
5. Discussion
5.1. Factors Influecing the Groundwater Storage Change
5.2. Uncertainties of this Study
6. Conclusions
Acknowledgments
Author Contributions
Conflicts of Interest
References
- Dahan, O.; Shani, Y.; Enzel, Y.; Yechieli, Y.; Yakirevich, A. Direct measurements of floodwater infiltration into shallow alluvial aquifers. J. Hydrol. 2007, 344, 157–170. [Google Scholar] [CrossRef]
- Wada, Y.; van Beek, L.P.; van Kempen, C.M.; Reckman, J.W.; Vasak, S.; Bierkens, M.F. Global depletion of groundwater resources. Geophys. Res. Lett. 2010, 37. [Google Scholar] [CrossRef]
- Gleeson, T.; Wada, Y.; Bierkens, M.F.; van Beek, L.P. Water balance of global aquifers revealed by groundwater footprint. Nature 2012, 488, 197–200. [Google Scholar] [CrossRef] [PubMed]
- Famiglietti, J.S. The global groundwater crisis. Nat. Clim. Chang. 2014, 4, 945–948. [Google Scholar] [CrossRef]
- Döll, P.; Schmied, H.M.; Schuh, C.; Portmann, F.T.; Eicker, A. Global-scale assessment of groundwater depletion and related groundwater abstractions: Combining hydrological modeling with information from well observations and GRACE satellites. Water Resour. Res. 2014, 50, 5698–5720. [Google Scholar] [CrossRef]
- Voss, K.A.; Famiglietti, J.S.; Lo, M.; Linage, C.; Rodell, M.; Swenson, S.C. Groundwater depletion in the Middle East from GRACE with implications for transboundary water management in the Tigris-Euphrates-Western Iran region. Water Resour. Res. 2013, 49, 904–914. [Google Scholar] [CrossRef] [PubMed]
- Margat, J.; van der Gun, J. Groundwater around the World: A Geographic Synopsis; CRC Press: Boca Raton, FL, USA, 2013. [Google Scholar]
- Amos, C.B.; Audet, P.; Hammond, W.C.; Buorgmann, R.; Johanson, I.A.; Blewitt, G. Uplift and seismicity driven by groundwater depletion in central California. Nature 2014, 509, 483–486. [Google Scholar] [CrossRef] [PubMed]
- Yang, X.; Scuderi, L.A.; Wang, X.; Scuderi, L.J.; Zhang, D.; Li, H.; Forman, S.; Xu, Q.; Wang, R.; Huang, W.; et al. Groundwater sapping as the cause of irreversible desertification of Hunshandake Sandy Lands, Inner Mongolia, Northern China. Proc. Natl. Acad. Sci. USA 2015, 112, 702–706. [Google Scholar] [CrossRef] [PubMed]
- Zhang, G.H.; Fei, Y.H.; Nie, Z.L.; Yan, M.J. Assessment Theories and Methods of Regional Groundwater Evolution; Science Press: Beijing, China, 2014; pp. 397–427. (In Chinese) [Google Scholar]
- Zhang, G.H.; Fei, Y.H.; Tian, Y.L.; Wang, Q.; Yan, M.J. Characteristics of alleviating the over-exploitation and its recharge on the rainstorm flood to the shallow groundwater in the southern plain of Haihe River basin. J. Hydraul. Eng. 2015, 46, 594–601. (In Chinese) [Google Scholar]
- Zhang, Z.Q.; Feng, C.Y.; Han, Y.T.; Chen, W.J. Calculation of groundwater recharge during a large infiltration test in the Hutuo River. South North Water Transf. Water Sci. Techonol. 2013, 99–102. (In Chinese) [Google Scholar]
- Barredo, J.I. Normalised flood losses in Europe: 1970–2006. Nat. Hazards Earth Syst. 2009, 9, 97–104. [Google Scholar] [CrossRef]
- Braman, L.M.; van Aalst, M.K.; Mason, S.J.; Suarez, P.; Ait-Chellouche, Y.; Tall, A. Climate forecasts in disaster management: Red Cross flood operations in West Africa, 2008. Disasters 2013, 37, 144–164. [Google Scholar] [CrossRef] [PubMed]
- Apel, H.; Aronica, G.T.; Kreibich, H.; Thieken, A.H. Flood risk analyses—How detailed do we need to be? Nat. Hazards 2009, 49, 79–98. [Google Scholar] [CrossRef]
- Lü, S.B.; Xu, S.G.; Feng, F. Floodwater utilization values of wetland services—A case study in Northeastern China. Nat. Hazards Earth Syst. 2012, 12, 341–349. [Google Scholar] [CrossRef]
- Li, X.; Guo, S.; Liu, P.; Chen, G. Dynamic control of flood limited water level for reservoir operation by considering inflow uncertainty. J. Hydrol. 2010, 391, 124–132. [Google Scholar] [CrossRef]
- Wang, D.L.; Zhang, G.H.; Feng, H.M.; Yan, M.J.; Tian, Y.L.; Wang, J.Z. Contribution degrees of precipitation and groundwater exploitation to the groundwater flow field in Shijiazhuang. Adv. Water Sci. 2014, 25, 420–427. (In Chinese) [Google Scholar]
- May, R.; Kenji, J.; Atsushi, T. Influence of flooding on groundwater flow in central Cambodia. Environ. Earth Sci. 2011, 63, 151–161. [Google Scholar] [CrossRef]
- Simpson, S.C.; Thomas, M.; James, F.H. The role of flood size and duration on stream flow and riparian groundwater composition in a semi-arid basin. J. Hydrol. 2013, 488, 126–135. [Google Scholar] [CrossRef]
- Masoud, A.A. Runoff modeling of the wadi systems for estimating flash flood and groundwater recharge potential in Southern Sinai, Egypt. Arab. J. Geosci. 2011, 4, 785–801. [Google Scholar] [CrossRef]
- Doble, R.C.; Crosbie, R.S.; Smerdon, B.D. Aquifer recharge from overbank floods. In Conceptual and Modeling Studies of Integrated Groundwater, Surface Water and Ecological Systems, Proceedings of the Symposium H01 Held during the IUGG GA in Melbourne, Melbourne, Australia, 28 June–7 July 2011; IAHS Publication: Wallingford, Oxfordshire, UK, 2011; pp. 169–174. [Google Scholar]
- Doble, R.C.; Crosbie, R.S.; Smerdon, B.D.; Peeters, L.; Cook, F. Groundwater recharge from overbank floods. Water Resour. Res. 2012, 48. [Google Scholar] [CrossRef]
- Belousova, A.P. Risk assessment of underflooding of areas by groundwater during floods. Water Resour. Regime Water Bodies 2011, 38, 30–38. [Google Scholar] [CrossRef]
- Wang, X.; Zhang, G.; Xu, Y.J. Impacts of the 2013 extreme flood in Northeast China on regional groundwater depth and quality. Water 2015, 7, 4575–4592. [Google Scholar] [CrossRef]
- Wang, X. Study on the Coupled Simulation and Regulation of Groundwater and Surface-Water in Sanjiang Plain, Northeast China; Northeast Institute of Geography and Agroecology, Chinese Academy of Sciences: Changchun, China, 2015. (In Chinese) [Google Scholar]
- Li, F.P.; Zhang, G.X.; Xu, Y.J. Spatiotemporal variability of climate and streamflow in the Songhua River Basin, northeast China. J. Hydrol. 2014, 514, 53–64. [Google Scholar] [CrossRef]
- Zhang, G.X. Measures for securing water safety of main grain production base and wetland ecological safety in Northeast China. China Water Resour. 2012, 15, 9–11. (In Chinese) [Google Scholar]
- Na, J.H.; Pan, H.S. Characteristics and enlightenment of the “Sanjiang” flood happened in Heilongjiang province in 2013. Heilongjiang Meteorol. 2013, 30, 1–2. (In Chinese) [Google Scholar]
- Wang, C.L. Preliminary analysis of Heilongjiang river major flood in 2013. Heilongjiang Sci. Technol. Water Conserv. 2016, 44, 68–73. (In Chinese) [Google Scholar]
- Cao, Z.Y.; Cao, Y.; Wu, M.G. Return period analysis on the middle and lower reaches of Heilongjiang in 2013. Heilongjiang Sci. Technol. Water Conserv. 2014, 56–59. (In Chinese) [Google Scholar]
- Pucci, A.A.; Murashige, J.A.E. Application of universal kriging to an aquifer study in New Jersey. Ground Water 1987, 25, 672–678. [Google Scholar] [CrossRef]
- Gundogdu, K.S.; Guney, I. Spatial analyses of groundwater levels using universal kriging. J. Earth Syst. Sci. 2007, 116, 49–55. [Google Scholar] [CrossRef]
- Healy, R.W.; Cook, P.G. Using groundwater levels to estimate recharge. Hydrogeol. J. 2002, 10, 91–109. [Google Scholar] [CrossRef]
- Yihdego, Y.; Becht, R. Simulation of lake-aquifer interaction at Lake Naivasha, Kenya using a three-dimensional flow model with the high conductivity technique and a DEM with bathymetry. J. Hydrol. 2013, 503, 111–122. [Google Scholar] [CrossRef]
- Chen, C.S.; Tu, C.H.; Chen, S.J.; Chen, C.C. Simulation of Groundwater Contaminant Transport at a Decommissioned Landfill Site—A Case Study, Tainan City, Taiwan. Int. J. Environ. Res. Public Health 2016, 13. [Google Scholar] [CrossRef] [PubMed]
- Wang, X.; Zhang, G.; Xu, Y.J. Groundwater and surface water availability via a jointed simulation with a double control of water quantity and ecologically ideal shallow groundwater depth: A case study on the Sanjiang Plain, Northeast China. Water 2016, 8. [Google Scholar] [CrossRef]
- Huang, N.; Liu, D.W.; Wang, Z.M. Study on mutual transformation characteristics between paddy field and dry land in Sanjiang Plain from 1986 to 2005. Resour. Sci. 2009, 31, 324–329. (In Chinese) [Google Scholar]
- Yang, X.; Yang, W.; Zhang, F.; Chu, Y.; Wang, Y. Investigation and Assessment of Groundwater Resources Potential and Eco-Environment Geology in Sanjiang Plain; Geological Publishing House: Beijing, China, 2008. (In Chinese) [Google Scholar]
- Liu, D.; Fu, Q.; Ma, Y.; Sun, A. Annual precipitation series wavelet analysis of well-irrigation area in Sanjiang Plain. In Computer and Computing Technologies in Agriculture II; Springer: New York, NY, USA, 2009; pp. 563–572. [Google Scholar]


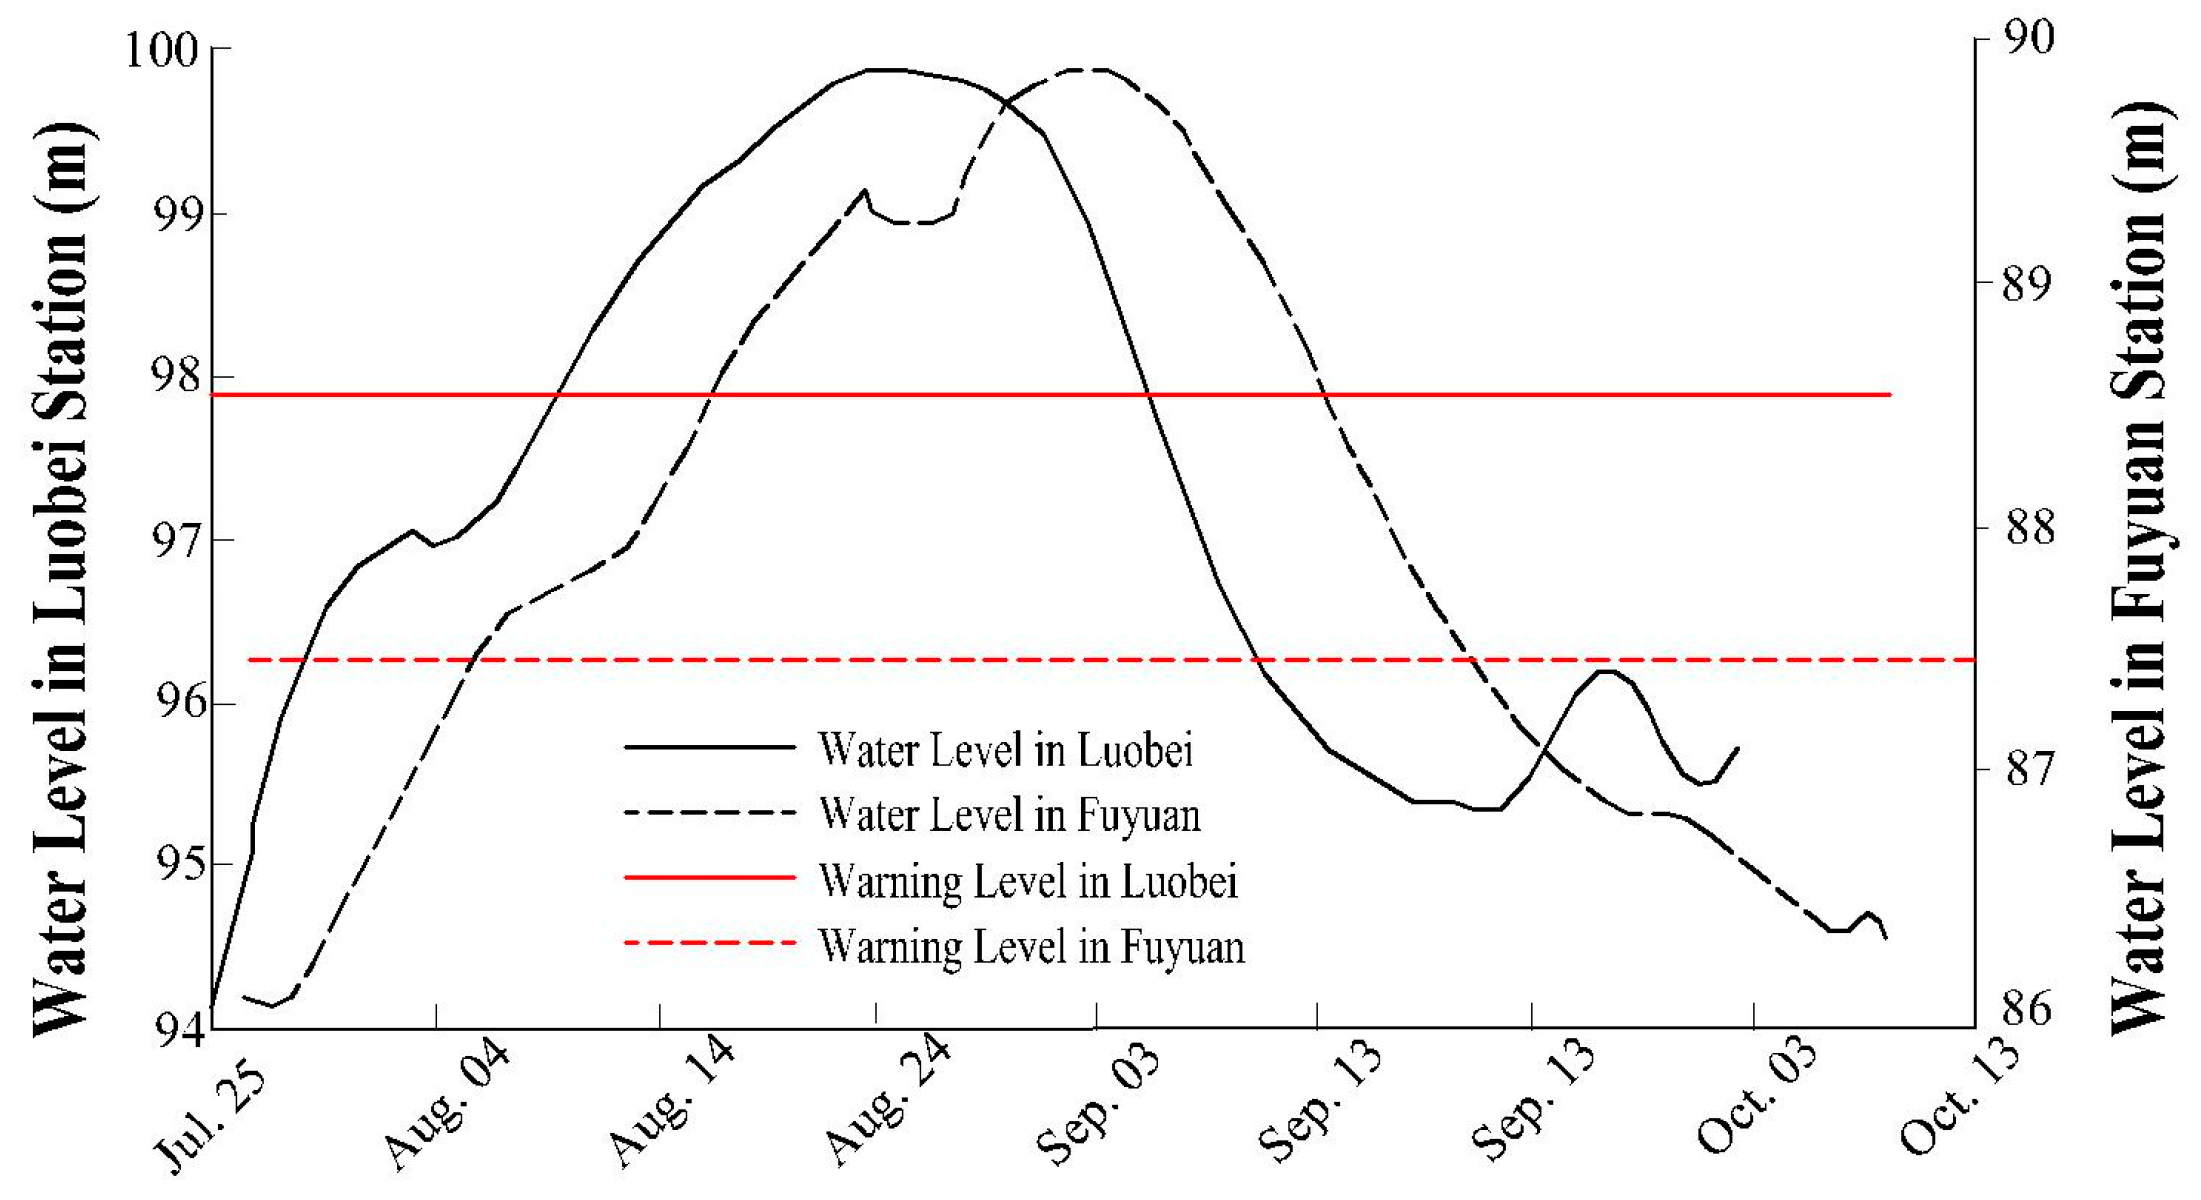
| Station | Warning Level (m) | Highest Record in 2013 | Highest Record in History | ||
|---|---|---|---|---|---|
| Water Level (m) | Time | Water Level (m) | Time | ||
| Luobei | 97.80 | 99.85 | 25 August | 99.57 | 23 August 1984 |
| Fuyuan | 87.50 | 89.88 | 2 September | 88.33 | 29 August 1984 |
| ID | 1 | 2 | 3 | 4 | 5 | 6 |
|---|---|---|---|---|---|---|
| Initial value | 0.3 | 0.24 | 0.21 | 0.1 | 0.05 | 0.03 |
| Certificated value | 0.25 | 0.14 | 0.21 | 0.11 | 0.05 | 0.03 |
| Year | MCGD (m) | Area (×108 m2) | Percentage (%) | Total Groundwater Storage (×108 m3) |
|---|---|---|---|---|
| 2013 | 0–1 | 156.43 | 19.64 | 207.67 |
| 1–3 | 574.11 | 72.09 | ||
| >3 | 65.83 | 8.27 | ||
| 1.72 | 796.36 | 100.00 | ||
| 2012 | 0–1 | 176.26 | 22.13 | 174.0 |
| 1–2 | 458.19 | 57.54 | ||
| >2 | 161.91 | 20.33 | ||
| 1.42 | 796.36 | 100.00 | ||
| 2011 | 0–1 | 311.26 | 39.09 | 152.52 |
| 1–2 | 431.37 | 54.17 | ||
| >2 | 53.73 | 6.75 | ||
| 1.13 | 796.36 | 100.00 | ||
| 2010 | 0–1 | 212.45 | 26.68 | 173.97 |
| 1–2 | 492.30 | 61.82 | ||
| >2 | 91.60 | 11.50 | ||
| 1.38 | 796.36 | 100.00 | ||
| 2009 | 0–1 | 178.28 | 22.39 | 174.61 |
| 1–2 | 420.88 | 52.85 | ||
| >2 | 197.20 | 24.76 | ||
| 1.53 | 796.36 | 100.00 | ||
| 2008 | 0–1 | 314.18 | 39.45 | 157.53 |
| 1–2 | 393.50 | 49.41 | ||
| >2 | 88.68 | 11.14 | ||
| 1.18 | 796.36 | 100.00 |
© 2016 by the authors; licensee MDPI, Basel, Switzerland. This article is an open access article distributed under the terms and conditions of the Creative Commons Attribution (CC-BY) license (http://creativecommons.org/licenses/by/4.0/).
Share and Cite
Liu, Y.; Jiang, X.; Zhang, G.; Xu, Y.J.; Wang, X.; Qi, P. Assessment of Shallow Groundwater Recharge from Extreme Rainfalls in the Sanjiang Plain, Northeast China. Water 2016, 8, 440. https://doi.org/10.3390/w8100440
Liu Y, Jiang X, Zhang G, Xu YJ, Wang X, Qi P. Assessment of Shallow Groundwater Recharge from Extreme Rainfalls in the Sanjiang Plain, Northeast China. Water. 2016; 8(10):440. https://doi.org/10.3390/w8100440
Chicago/Turabian StyleLiu, Yuyu, Xin Jiang, Guangxin Zhang, Y. Jun Xu, Xihua Wang, and Peng Qi. 2016. "Assessment of Shallow Groundwater Recharge from Extreme Rainfalls in the Sanjiang Plain, Northeast China" Water 8, no. 10: 440. https://doi.org/10.3390/w8100440