Article

Redox Dynamics and Oxygen Reduction Rates of Infiltrating Urban Stormwater beneath Low Impact Development (LID)

Department of Earth & Climate Sciences, San Francisco State University, San Francisco, CA 94132, USA
*
Author to whom correspondence should be addressed.
Water 2016, 8(10), 435; https://doi.org/10.3390/w8100435
Submission received: 30 May 2016 / Accepted: 23 September 2016 / Published: 4 October 2016
(This article belongs to the Special Issue Urban Drainage and Urban Stormwater Management)

Abstract

:
Low impact development (LID) best management practices (BMPs) collect, infiltrate, and treat stormwater runoff, and increase recharge to aquifers. Understanding the controls on reduction/oxidation (redox) conditions within LID BMPs is important for groundwater management because outflow from some LID BMPs can recharge aquifers and affect groundwater quality. Here we evaluate redox conditions of urban stormwater runoff in a LID infiltration trench in San Francisco, California, and quantify the relation between water saturation (%) and temperature (°C) and resulting dissolved oxygen (DO) concentrations, redox dynamics, and O2 reduction rates. The DO fluctuations have an inverse response to the duration of saturation of the trench. Anoxic (<0.5 mg/L) conditions often occurred within hours of stormwater events and persisted from a few hours to two days, which indicate that microbial respiration can be a limiting factor for DO. Temperature of stormwater runoff was not a statistically significant control on DO. The estimated O2 reduction rate is 0.003 mg·L‒1·min‒1, which is two to five orders of magnitude higher than in groundwater from previous studies. Higher rates of O2 reduction are a function of the more oxic and organic-rich stormwater runoff that drives faster microbial O2 reduction. Our findings have important implications for the design of infiltration trenches and other LID BMPs to achieve desired redox conditions for infiltrating stormwater toward minimizing groundwater contamination.

1. Introduction

Urbanization has adversely affected the quantity and quality of urban water resources [1,2] because of increased impervious surfaces, compaction of soils, and modifications to vegetation [3,4], which has reduced infiltration rates and increased stormwater runoff [5]. Impervious surfaces like pavement, rooftops, and parking lots increase stormwater runoff volume and contaminant loads in stormwater. Stormwater runoff from the impervious surfaces can be contaminated with suspended sediments, heavy metals, hydrocarbons, nutrients, and pathogens [6,7,8].
A major challenge for stormwater engineering and management in the 21st century is to develop strategies that encompass climate variability and change [9,10] and increasing impervious surfaces from the expansion of urbanized areas, while maintaining the health of the watershed and meeting regulatory requirements for stormwater quality [11]. In response to this challenge, low impact development (LID) planning and related best management practices (BMPs) have been increasingly used to reduce the adverse effects of urbanization on surface-water resources. LID is a stormwater management and planning strategy with a goal of mimicking the predevelopment hydrologic regime through the use of design techniques to create a functionally hydrologic landscape [12]. LID design techniques include micro-scale and spatially distributed BMPs such as bioretention-swales, rain-gardens, and infiltration trenches [13]. LID BMPs are constructed based on a combination of site characteristics such as land use, soil texture, drainage area, and key hydrological functions such as precipitation, infiltration, surface runoff, and groundwater recharge [12,13,14].
LID BMPs collect, infiltrate, and treat urban stormwater and improve the quality of receiving surface-water bodies [15,16]. LID has been shown to treat a range of pollutants in stormwater, including the removal of nitrate (NO3) and phosphate [17,18,19,20], metals [21,22], fecal indicator bacteria (FIB) [23,24,25], and other pathogens and pollutants. Although often considered a secondary benefit, LID has also recently been shown to increase recharge to local aquifers [26,27] beneath BMPs without an impermeable bottom layer and underdrain system. Newcomer et al. (2014) [27] demonstrated that recharge rates beneath some LID BMPs can be orders of magnitude larger than beneath other sources of urban recharge. The treatment of stormwater pollutants and enhancement of local groundwater recharge are benefits of using LID BMPs for stormwater management [28,29,30]. However, few studies have examined how the design features of LID BMPs influence the biogeochemical processes that occur in the vadose zone and the implications for the quality of recharge to urban aquifers. Because recharge is enhanced by some LID BMPs, they could be direct sources and preferential pathways for the transport of stormwater derived contaminants to reach the groundwater and (or) indirectly alter the biogeochemical conditions within the aquifer that subsequently mobilize contaminants beneath the water table.
Several biogeochemical processes are likely major controls on the quality of stormwater that infiltrates and eventually recharges urban aquifers. In particular, reduction/oxidation (redox) processes can: (i) affect the mobility and availability of organic micro-pollutants such as pharmaceutically-active compounds, pesticides, organic halogens, and other halogenated organic compounds; (ii) affect the fate and mobility of potentially toxic metals associated with naturally occurring aquifer material; (iii) contribute to the degradation or preservation of anthropogenic contaminants; and (iv) generate undesirable byproducts such as dissolved manganese (Mn2+), ferrous iron (Fe2+), hydrogen sulfide (H2S), and methane (CH4) [31,32,33,34]. Therefore, characterizing and quantifying the controls on redox conditions beneath LID BMPs is important to better understand and manage urban stormwater effects on groundwater quality.
A few previous studies have explored characteristics of LID that affect subsurface redox conditions. Datry et al. (2004) [35] reported that redox conditions in soils and groundwater are affected by the residence times of infiltrating water in the vadose zone beneath a stormwater infiltration basin. Similarly, von Rohr et al. (2014) [36] found that the hydraulic residence time, which is influenced by the infiltration rate, may affect the redox conditions during riverbank filtration. Greskowiak et al. (2005) [37] showed that the hydraulic regime immediately below an artificial recharge pond near Lake Tegel, Germany is characterized by cyclic changes between saturated and unsaturated conditions that influence the redox conditions. The saturation conditions in the soil, vadose zone, and groundwater influence microbial activity and, in turn, redox conditions because most redox processes are microbially catalyzed [32,33]. Additionally, microbial activity is temperature-dependent and thus a function of diel and seasonal cycles [32,33]. Datry et al. (2004) [35] reported that seasonal microbial respiration in an infiltration basin was stimulated by the increase in temperature, thereby leading to higher oxygen deficit in summer, whereas cold winter stormwater slightly re-oxygenated groundwater. During the seasons of cooler soil temperatures, often from November through March in the Northern Hemisphere, saturated soils take longer to become reducing [38].
Molecular oxygen (O2) acts as the preferred electron acceptor through aerobic respiration because it is the most energetically favorable reaction [39]. If the supply of O2 is consumed or absent, alternative electron acceptors are used by microbes. After O2, the descending sequential order of acceptor preferences is NO3, manganese (IV) (Mn4+), ferric iron (Fe3+), sulfate (SO42−), and finally carbon dioxide (CO2). This order of preferential electron acceptor utilization—O2 > NO3 > Mn4+ > Fe3+ > SO42− > CO2—is referred to as the ecological succession of terminal electron-accepting processes [32,33]. For the purpose of this study, a threshold concentrations of dissolved oxygen (DO) will be used to identify general redox conditions and processes following a framework developed by McMahon and Chapelle (2008) [32]. Under this framework, oxic conditions are present when the observed DO concentration is ≥0.5 mg·L‒1 (≥15.6 μmol·L‒1 O2) and thus O2 reduction is the predominant redox process. Anoxic conditions are present when the observed DO concentration is <0.5 mg·L‒1 (<15.6 μmol·L‒1 O2).
Similar to stormwater quality, the rate of O2 reduction has a significant influence on groundwater quality and the susceptibility of aquifers to contamination because the fate and transport of many groundwater contaminants largely depends on the redox processes that occur along flow paths [32,39]. Therefore, quantifying the rate of O2 reduction within LID features is an important indicator of the progression of redox reactions in the vadose zone and aquifer beneath the LID and is critically important to predict the risk of groundwater contamination. Under anoxic conditions, NO3 is the preferred electron acceptor and denitrification (NO3 reduction) is the predominant redox process when NO3 (as N) concentrations are >0.5 mg·L‒1 (and DO < 0.5 mg·L‒1, Mn2+ < 0.05 mg·L‒1, and Fe2+ < 0.1 mg·L‒1) [32]. After NO3 has been reduced, redox processes may continue along the ecological succession of terminal electron-accepting processes [32,33]. Understanding and predicting the onset of denitrification beneath LID BMPs is important because stormwater often contains elevated nutrients, including NO3. Nitrate is also the most ubiquitous contaminant of groundwater worldwide, and denitrification can release the greenhouse gas nitrous oxide and pose well-known ecological and human-health risks [40,41,42].
Therefore, the overall goal of this study is to better characterize and quantify the redox conditions in a LID BMP, which can be used to better understand and manage urban stormwater effects on groundwater quality. Here we use stormwater chemistry to evaluate redox conditions in a recently installed (2009) LID BMP infiltration trench. Specifically, this study addresses two primary research questions: (1) What is the dynamic relationship between water saturation (%) and temperature (°C) and the magnitude and duration of fluctuations in DO concentrations and redox conditions within the infiltration trench? (2) What are the O2 reduction rates in the infiltration trench? Addressing these research questions provides important insight into how to design LID BMPs toward optimizing the water saturation and temperature within a desired redox range (oxic versus anoxic) for infiltrating stormwater to help minimize the transport of redox sensitive pollutants and risk of groundwater contamination.

2. Materials and Methods
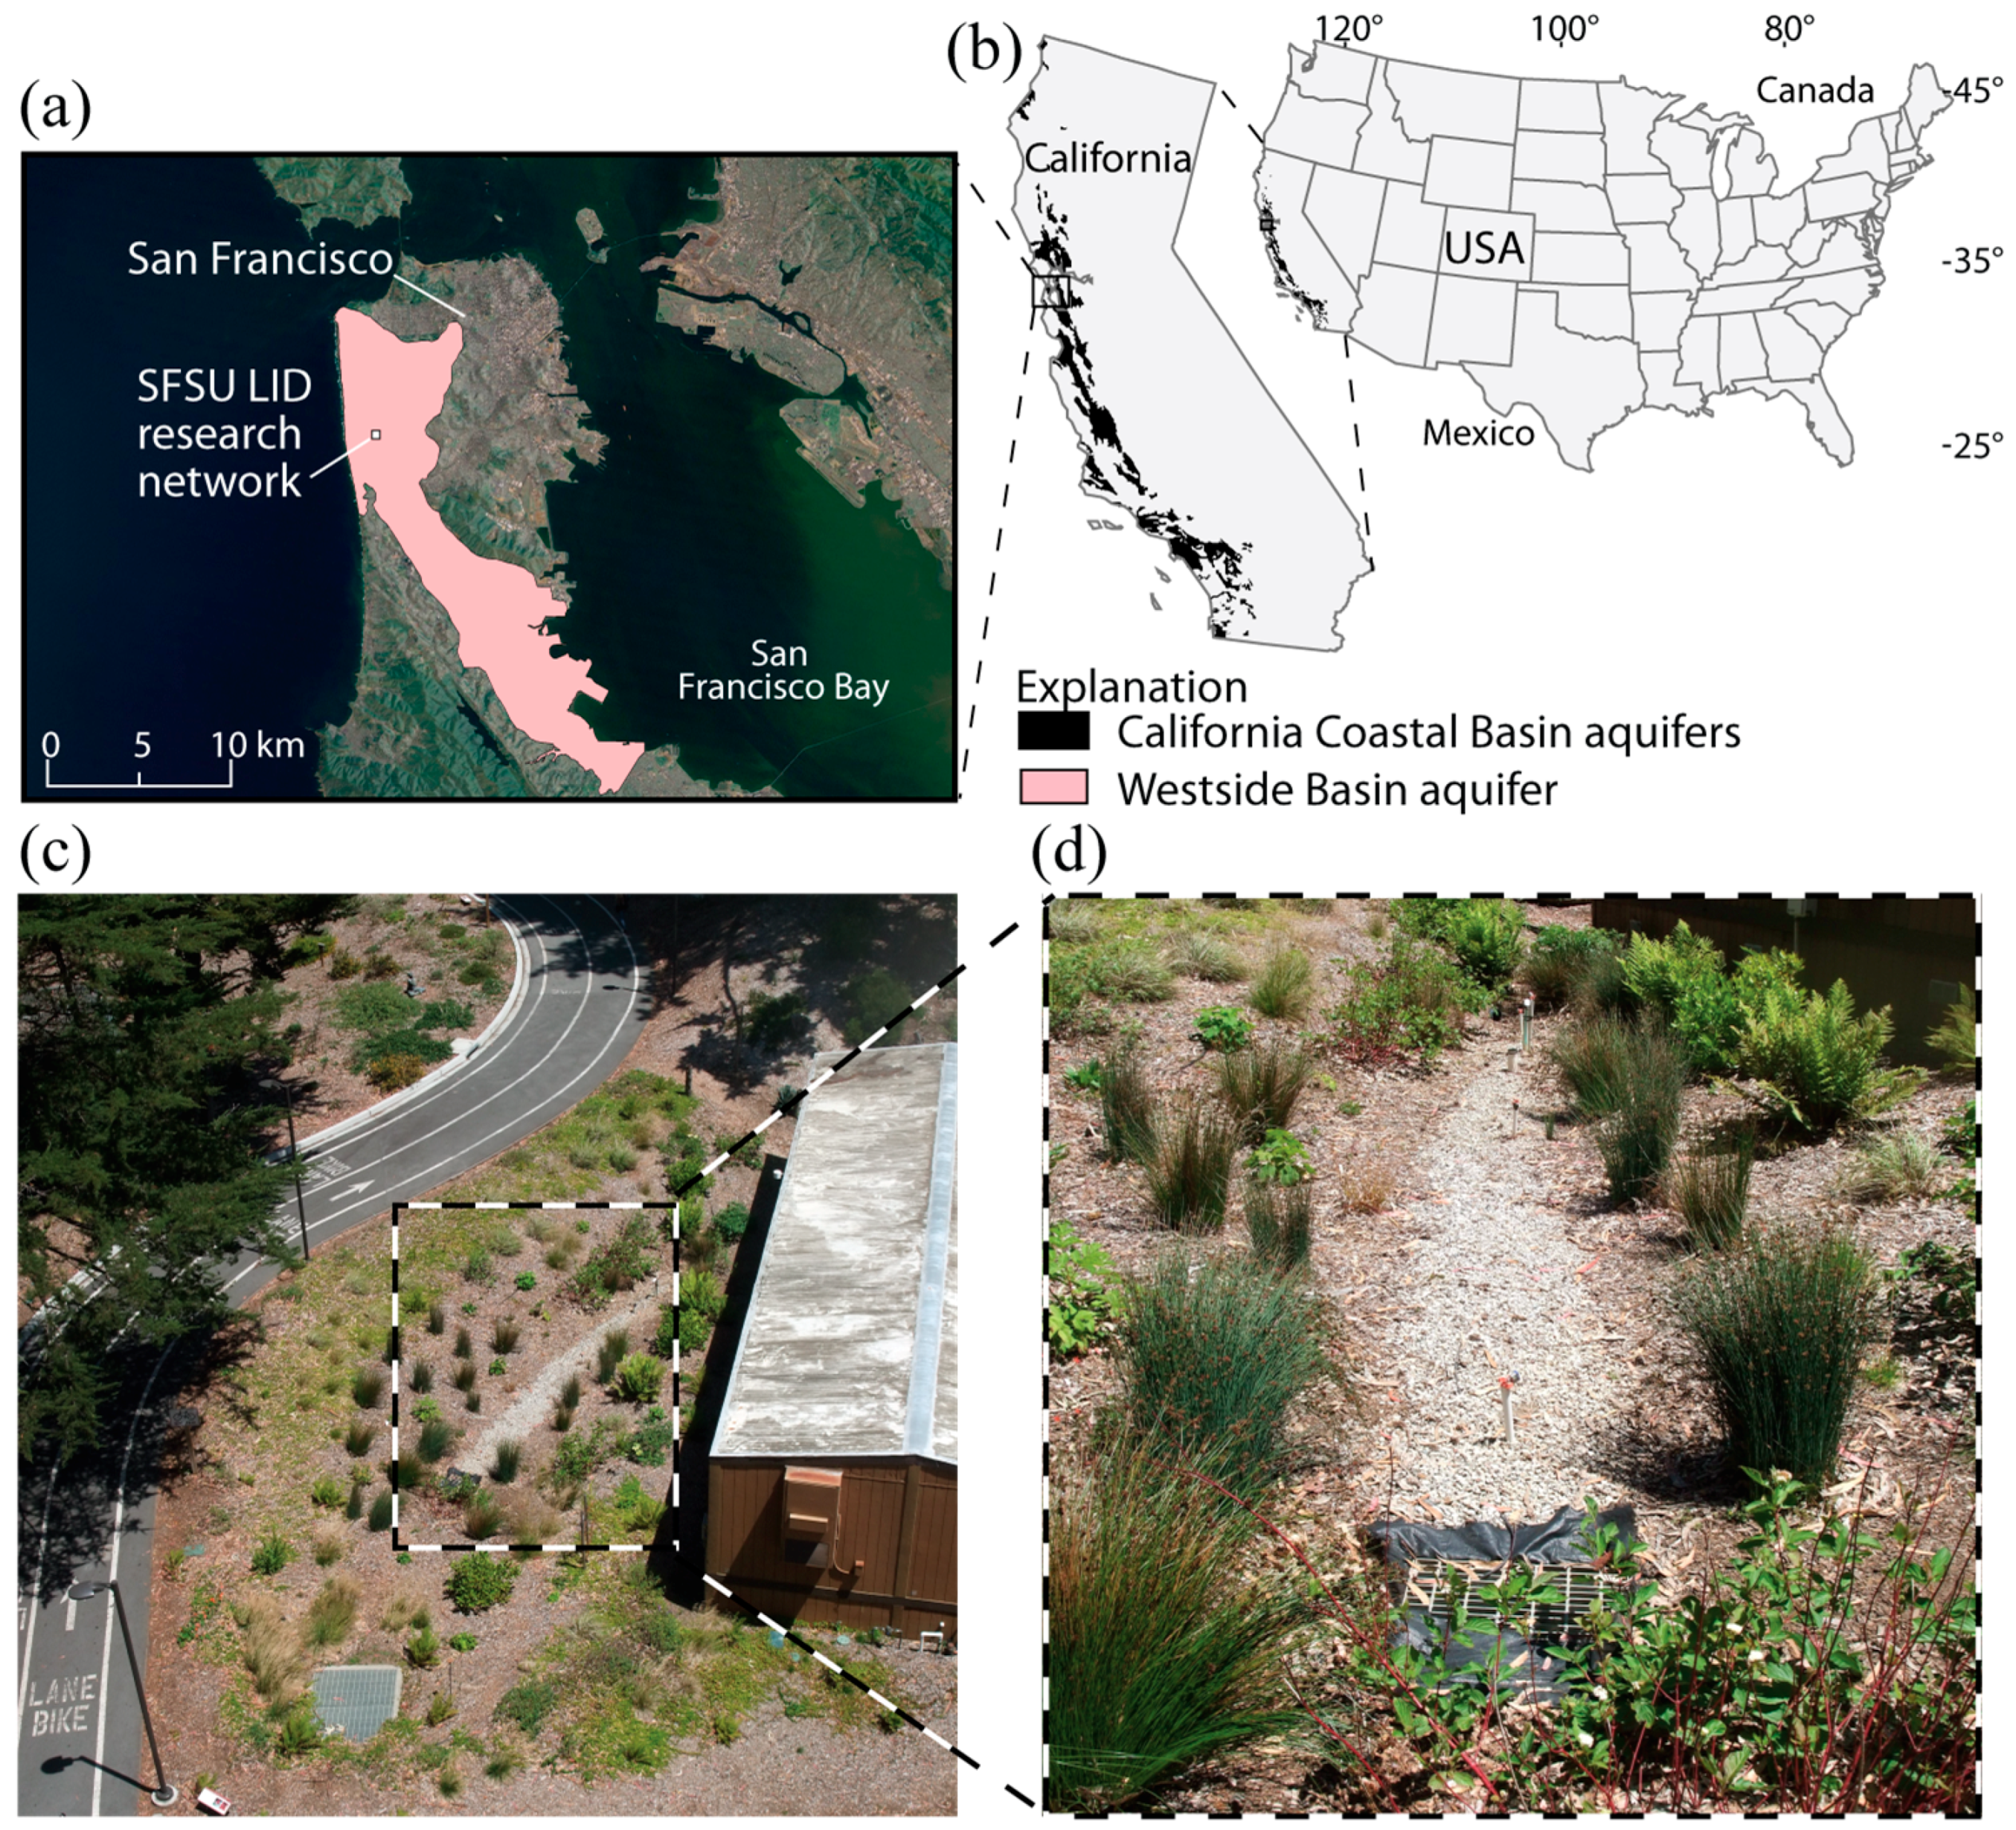
2.1. Study Area

The study area is a gravel infiltration trench site at the San Francisco State University (SFSU) LID research network, within the city of San Francisco, CA, USA (Figure 1a). The infiltration trench was installed in 2009 and instrumented in 2011, and has a surface area of 11 m2 (0.90 m × 12 m). The infiltration trench is located in the center of a vegetated depression that collects runoff from an impervious bike path, parking lot, surrounding roof tops, and vegetative landscape with an effective drainage area of 430 m2 (Figure 1c). The gravel trench has a maximum storage capacity of approximately 3.0 m3 assuming a gravel porosity of 0.35 [27]. The design of the infiltration trench follows the volume-based sizing method and a goal of 80% stormwater volume capture [43] for 1-h, 6-h, and 24-h precipitation events (design storms) with a two-year return interval.
The site of the infiltration trench is located above the Westside Basin aquifer (104 km2), which is part of the regionally important California Coastal Basin aquifers (Figure 1b). The Westside Basin aquifer system has a shallow (<30 m below sea level), unconfined aquifer and two deeper confined aquifers, and is bounded in the north and south by Franciscan Complex bedrock [44,45]. The aquifer sediments include coastal deposits of sand, silt, mud, gravel, and peat from the Merced and Colma Formations [45].

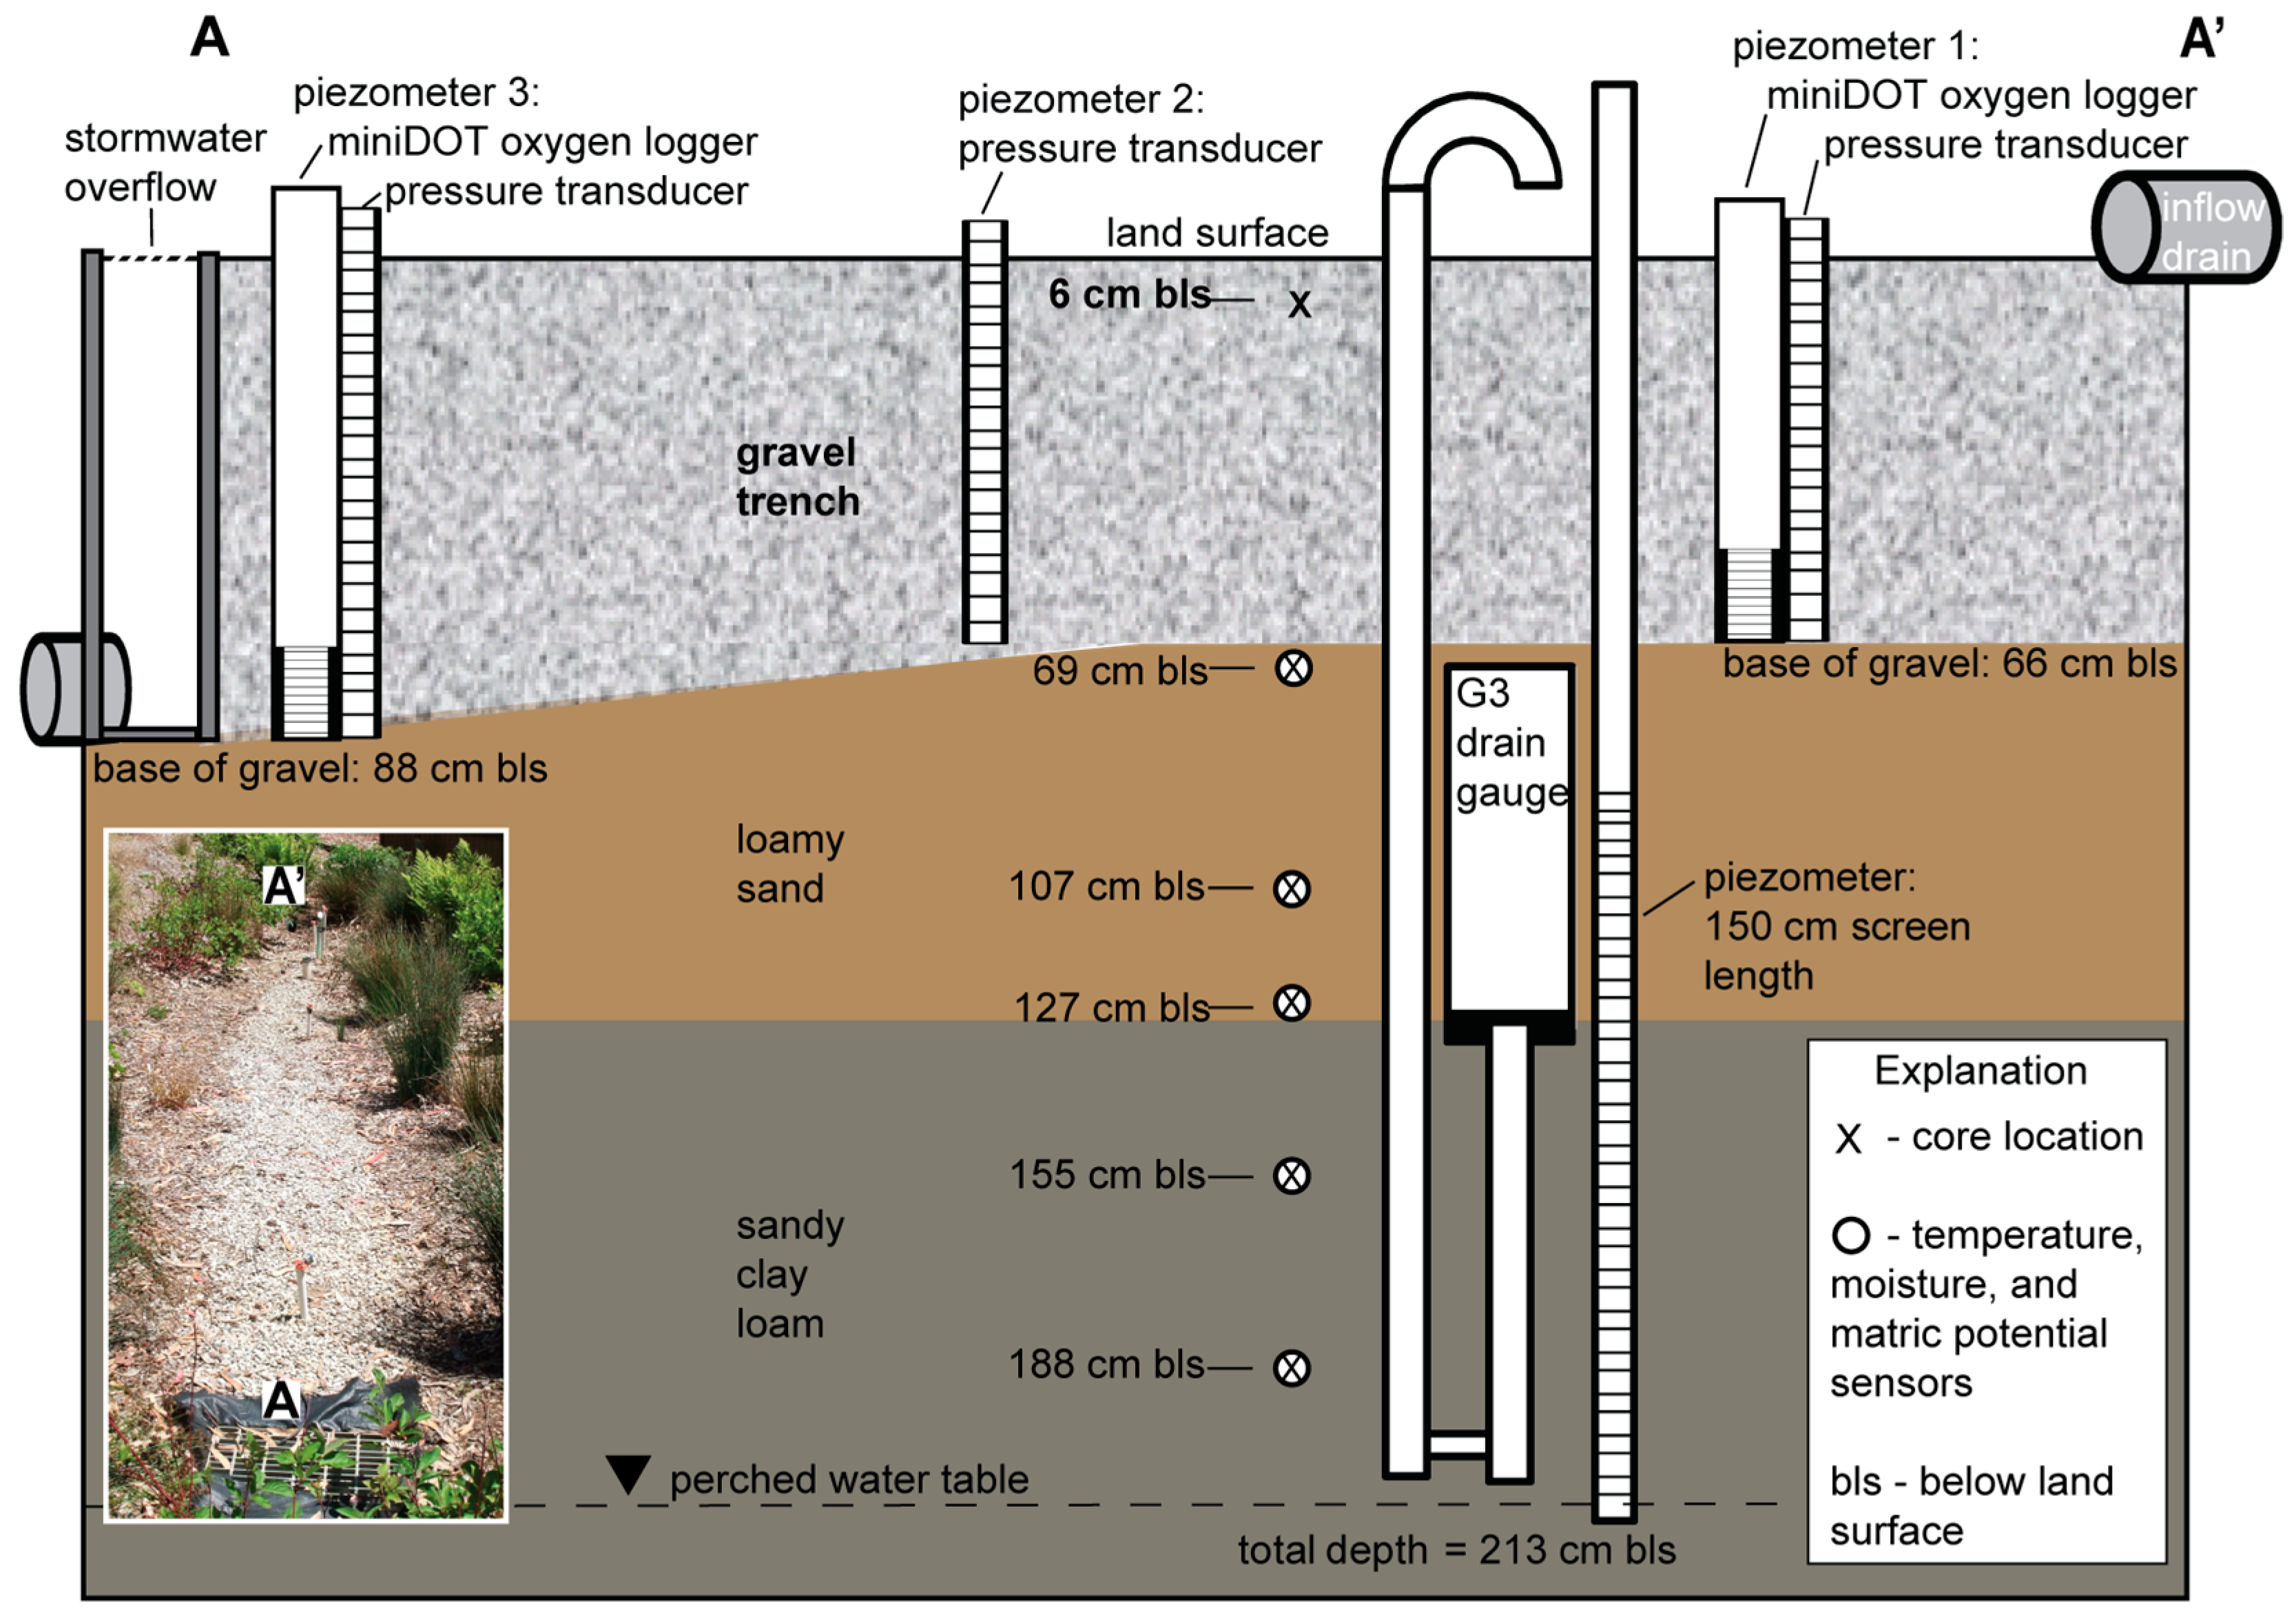
2.2. LID Data Collection

The infiltration trench site is instrumented with five Decagon 5TM soil temperature and moisture sensors, five Decagon MPS-1 matric potential sensors, and one Decagon G3 drain gauge (passive capillary lysimeter), which continuously record measurements at a two-minute interval to detect event-based changes in drainage beneath the gravel in the vadose zone (Figure 2). Additionally, one Decagon ECRN-100 rain gauge, one Solinst Inc. (Georgetown, ON, Canada) barometer, and three piezometers with Solinst Inc. pressure transducers (model 3001 LTC Levelogger junior) were installed at the infiltration trench site (Figure 2). The pressure transducers in each piezometer record the water level (cm), temperature (°C), and conductivity (μS/cm). A fourth piezometer was installed 2.13 m below land surface beneath the infiltration site to manually record water levels. Each piezometer was constructed of pvc pipe with a slotted screen. Soil texture and hydraulic properties of the vadose zone beneath the LID site are reported in [27].
MiniDOT oxygen loggers [46] were installed on 11 November 2013 to measure DO concentrations along the flow path in the infiltration trench. The miniDOT oxygen loggers were installed in 5 cm diameter piezometers adjacent to piezometers 1 and 3 (Figure 2). These loggers were programmed to make measurements at two-minute intervals, which is consistent with the sampling frequency of the other field instruments. For the DO sensors in the miniDOT oxygen loggers to be in contact with water, water levels in the 5 cm piezometers at locations 1 and 3 have to be at least 26 cm and 34 cm above the base of the gravel, respectively. The miniDOT oxygen loggers measure and record DO concentrations with an accuracy of ±10 μmol/L, DO range of 0%–150% saturation, and DO resolution of at least 0.05 μmol/L [46]. The miniDOT oxygen loggers also measure and record temperature with an accuracy of ±0.1 °C, range of 0–30 °C, and resolution of 0.01 °C [46].

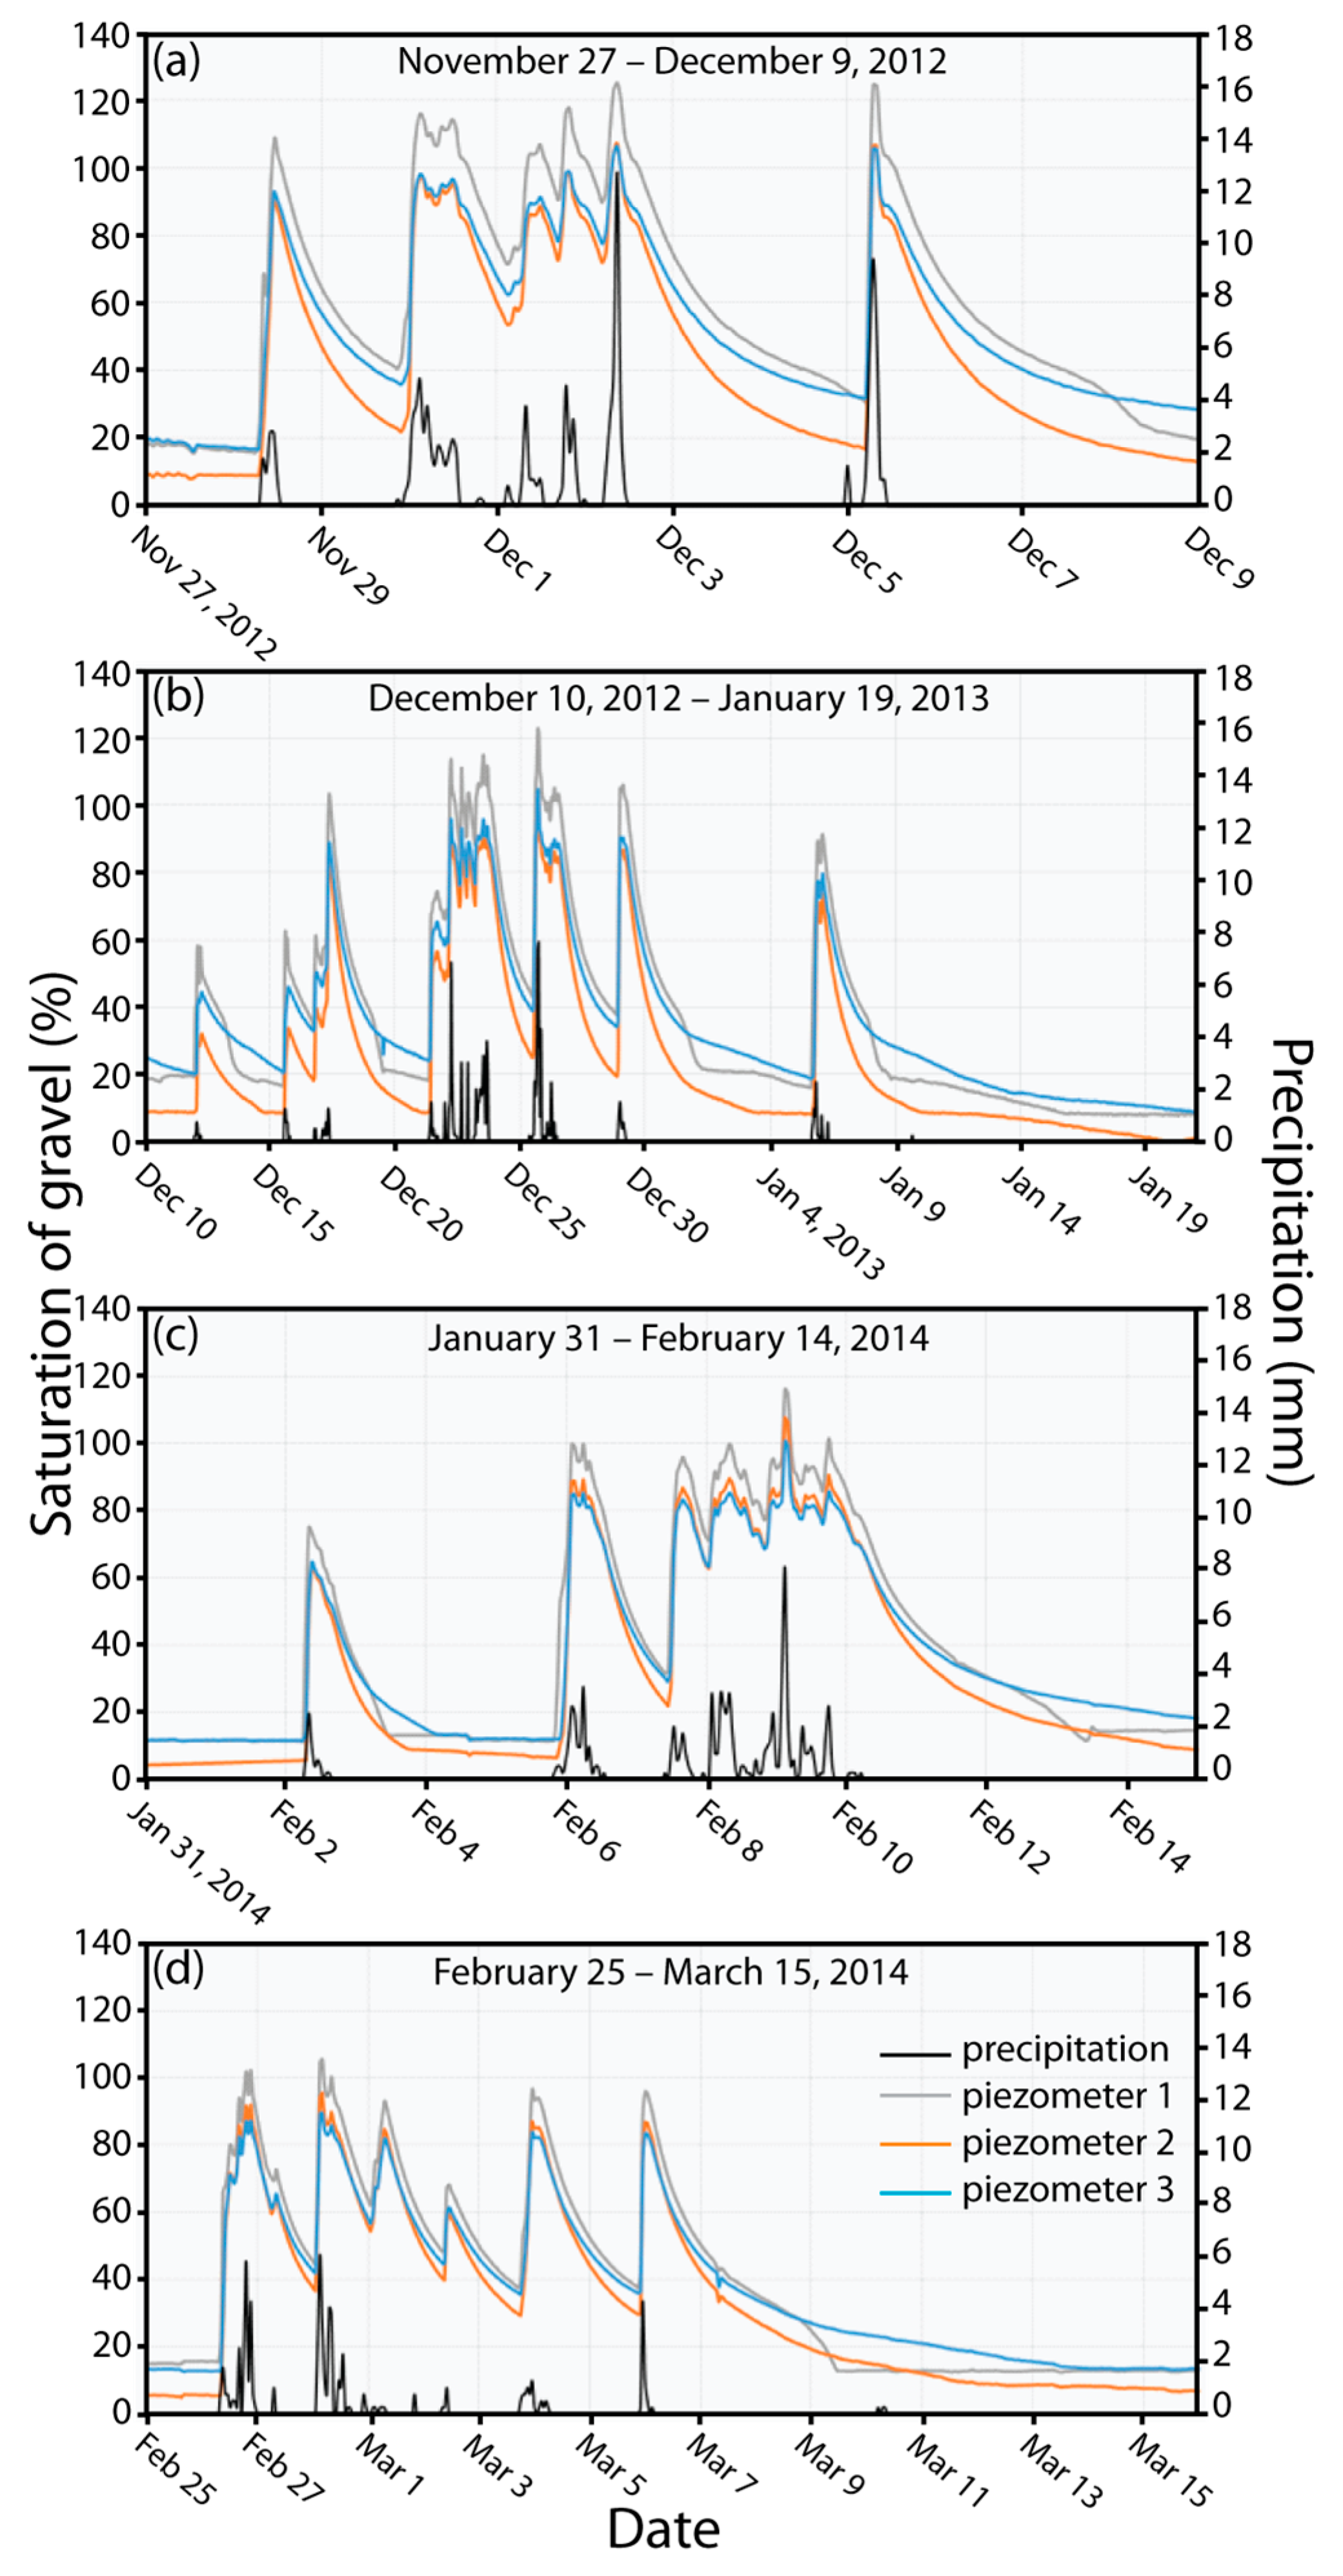
2.3. Saturation of the Gravel Trench

Saturation of the gravel trench was evaluated using water levels in the three piezometers and hourly precipitation during the period of field observation (July 2012–June 2014). Here, saturation of gravel (%) refers to the ratio of observed water level in the gravel to the thickness of the gravel at each of the three piezometer locations (Figure 2). Saturation of gravel (%) at each piezometer location is calculated as:
Saturation   ( % ) = Observed water level above base of gravel Gravel thickness × 100
where the observed water level above the base of the gravel (L) is the average water levels for each piezometer during an hourly time interval, and gravel thickness (L) is the thickness of the gravel at the piezometer location. The stormwater that collects in the gravel is assumed to infiltrate and eventually become recharge. Water loss due to evapotranspiration (ET) and evaporation is negligible because the gravel is not vegetated and the rapid infiltration into the gravel trench minimizes surface ponding and direct evaporation. When the saturation of gravel for the entire trench exceeds 100%, the excess stormwater overflows into the municipal stormwater system (Figure 2).
The duration of saturation of gravel (%) is defined as the length of time (reported as either hours or days) when water levels were elevated above the pre-rainfall event water level, and is analogous to the excess saturation of the gravel for a given storm. The duration of saturation of gravel (%) was determined using observed time series of water levels and precipitation.

2.4. Precipitation

Historical hourly and daily precipitation data from the San Francisco, Downtown station (NOAA Station ID: 047772) were evaluated for the entire data collection period at the LID BMP (July 2012–June 2014) [47]. Hourly precipitation time series were compared to the water level, temperature, and conductivity time series for the entire collection period and with DO concentrations between 22 February 2014 and 30 June 2014. The shorter collection period of DO concentrations reflects the fact that the miniDOT oxygen loggers were installed at a later time than the LTC Leveloggers. Hourly and daily precipitation data were used to develop hourly and daily runoff volumes for the entire data collection period.

2.5. Runoff

The infiltration trench collects stormwater runoff from an effective drainage area of 430 m2 that includes an impervious bike path, parking lot, and surrounding roof tops. Daily and hourly runoff to the infiltration trench was calculated for the period 2012 to 2014 using the TR-55 SCS curve number method [48]. The stormwater runoff was calculated as:
R = ( P - 0.2 S ) 2 ( P + 0.8 S )
S = 1000 CN - 10
where R is the runoff depth (L), P is the precipitation (L), S is the maximum retention (unit less), and CN is the composite curve number (unit less). A CN of 98, representing impermeable surfaces such as roofs and pavement was applied to the impermeable surfaces draining to the infiltration trench. Runoff volumes (L3) were calculated by multiplying daily or hourly runoff depths by the effective drainage area of 430 m2.

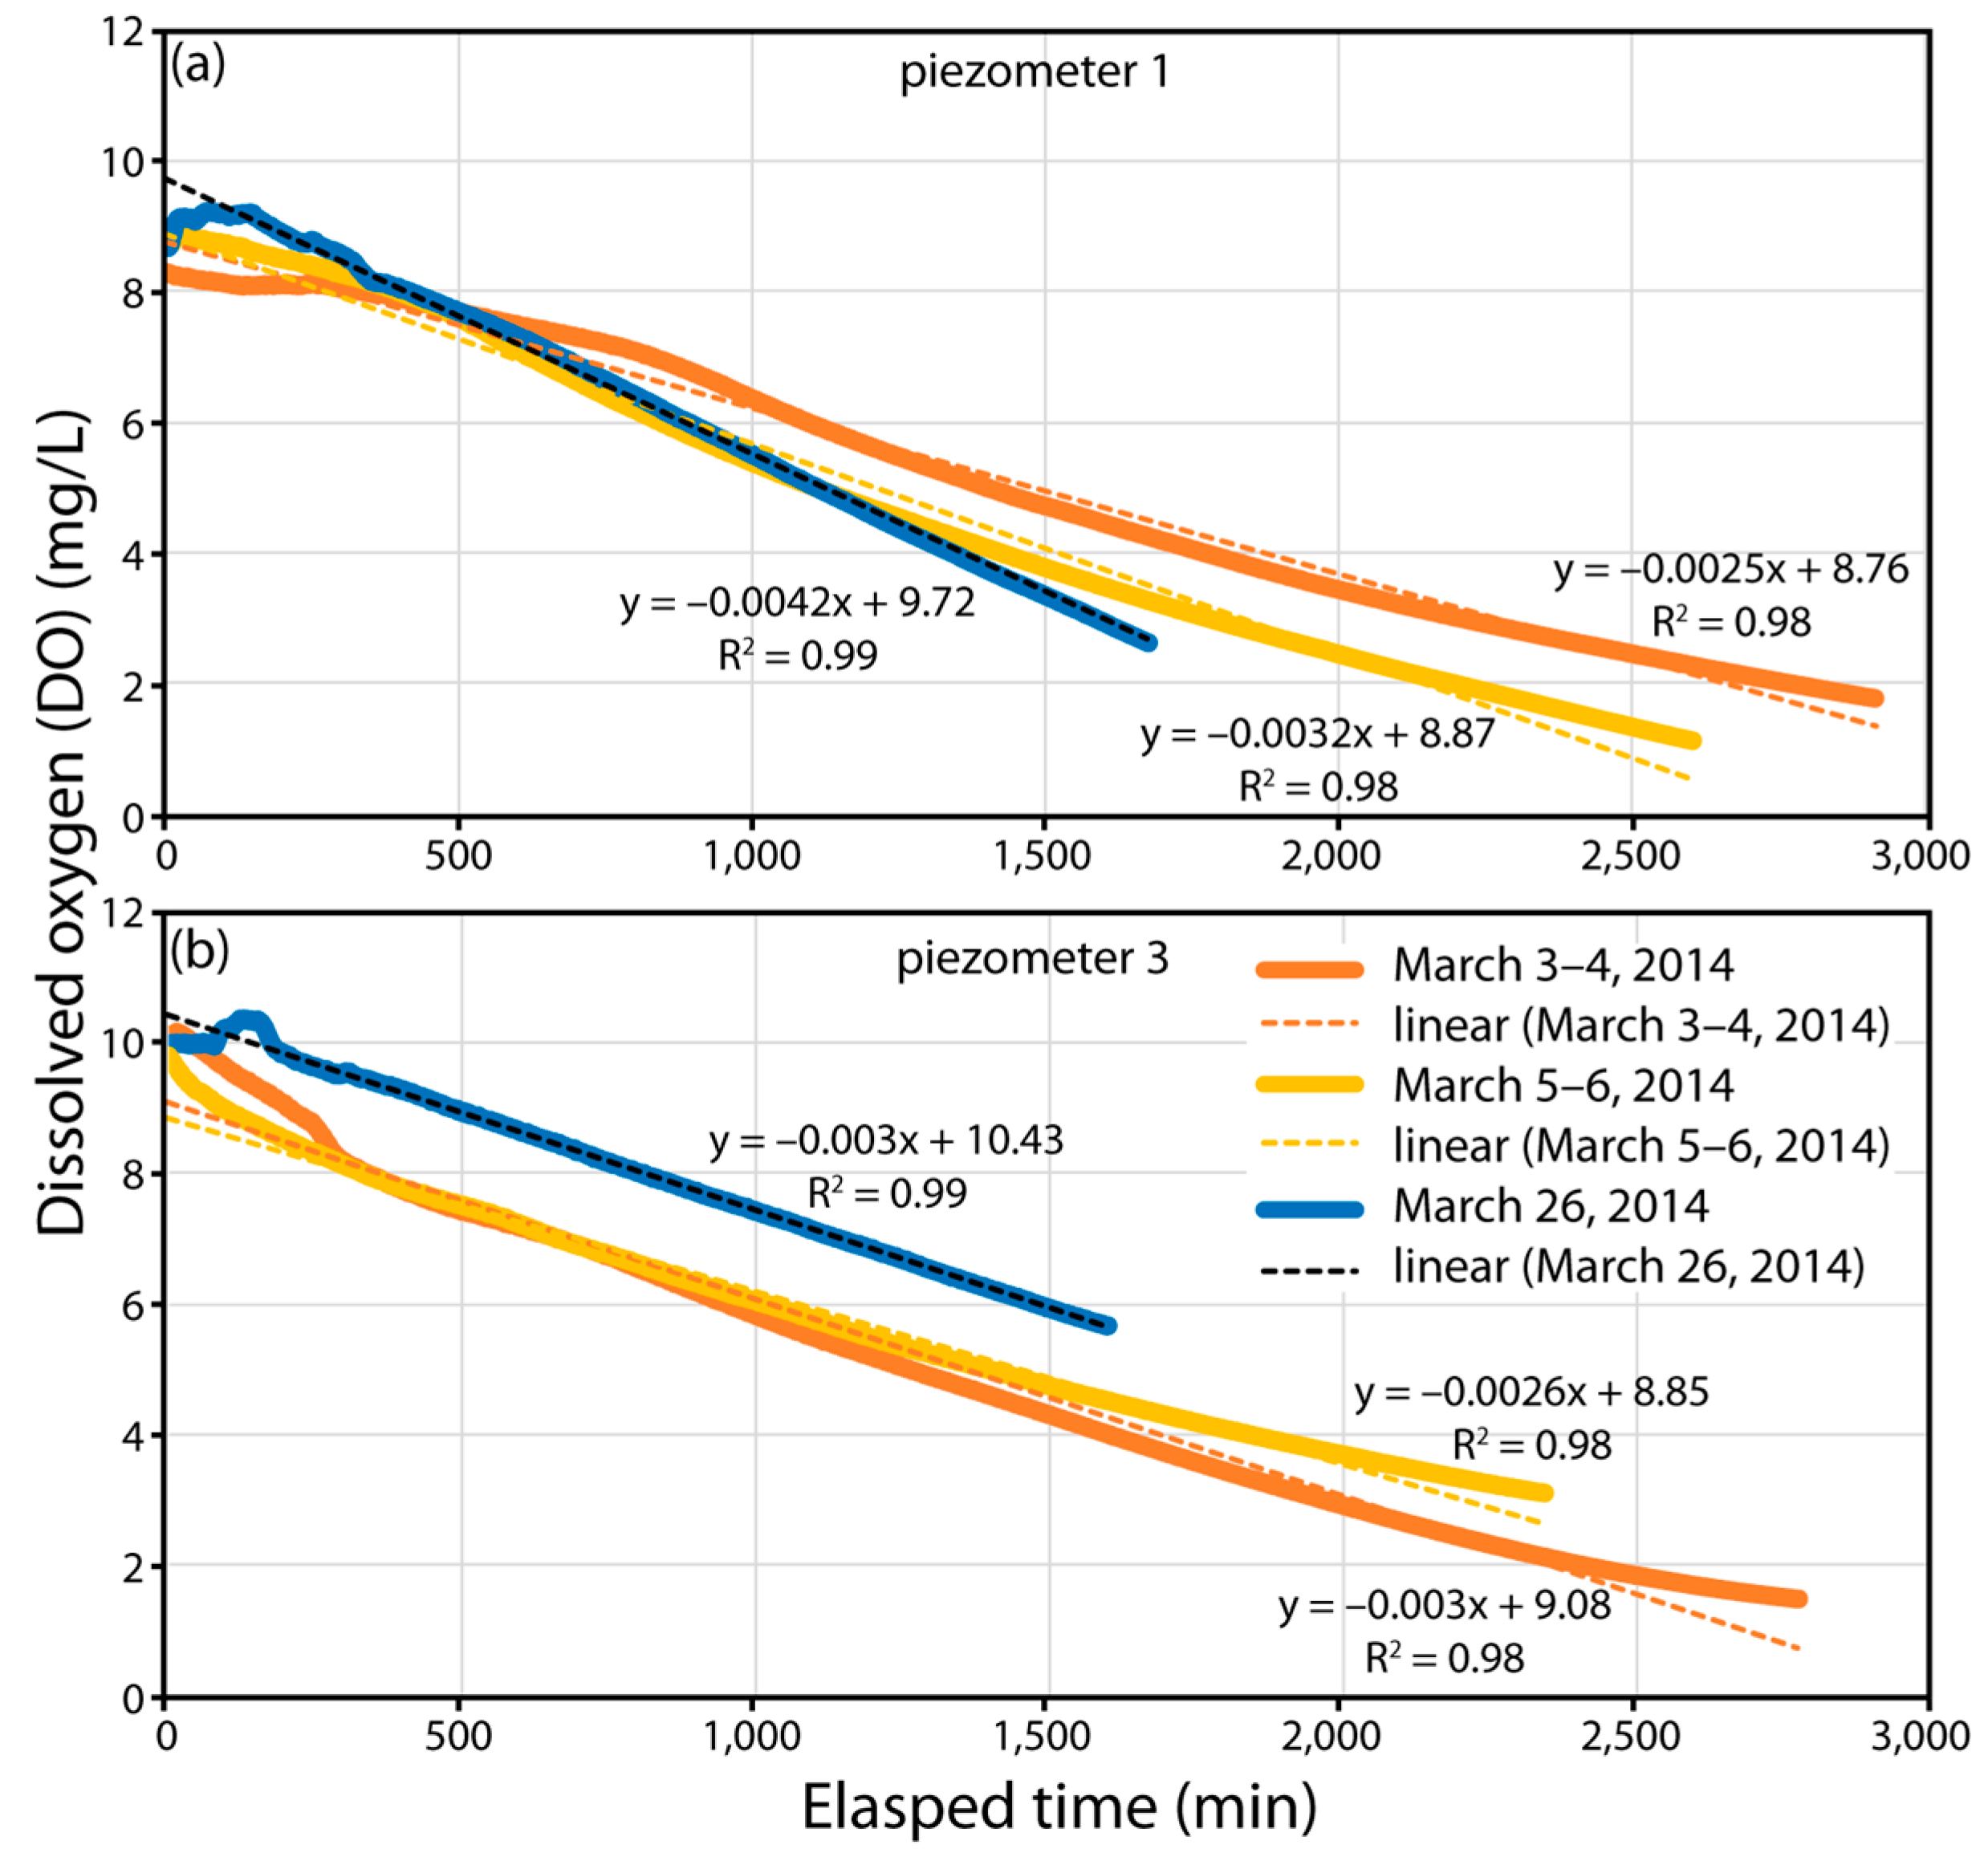
2.6. Rate of O2 Reduction

The rate of O2 reduction in the gravel infiltration trench was estimated by relating measured DO concentrations to the elapsed time since stormwater runoff into the trench, by modifying the approach described in [32,39]. Here, elapsed time is defined as the duration of time (minutes) from the beginning of a rain event to the time of the lowest measured DO concentrations before the recovery of DO levels to pre-event conditions. Zero-order reaction rates were estimated from changes in concentration of DO as a function of elapsed time using:
K 0 = Δ ( C C 0 ) Δ t
where −K0 is the rate (mg·L‒1·min‒1) for zero-order reaction kinetics, C is the concentration of DO at the time of interest (mg·L‒1), C0 is the initial concentration of DO (mg·L‒1), and Δt is the elapsed time (min). Zero-order rates were determined by fitting a linear regression curve to a plot of DO concentration versus elapsed time.

2.7. LID Oxygen Demand (LIDOD) Rate

The LID oxygen demand (LIDOD) rate is first defined here as the rate of DO consumption by microbial respiration processes in the gravel infiltration trench. Using a modified method from Heckathorn and Gibs (2010) [49] and Wilson (2014) [50], LIDOD was calculated during three storm events that represent a range of O2 reduction rates that were calculated during the period of field observation for DO. The measured DO concentrations for piezometers 1 and 3 were plotted as a function of elapsed time, resulting in a DO depletion curve. Elapsed time for each rain event was defined from the beginnings of the rain event to the time of lowest measured DO concentration before the recovery of DO levels to pre-event conditions. The slope of the linear segment of the oxygen-depletion curve was used to calculate the LIDOD rate as:
LIDOD T = V water V trench × b
where LIDODT is the LID oxygen demand rate (mg·m‒3·min‒1) at water temperature T; Vwater is the volume of water in the gravel (m3); Vtrench is the maximum volume capacity of the infiltration trench (m3); and b is the slope of the oxygen-depletion curve for each storm event (mg·m‒3·min‒1). The variable b is similar to −K0, but expressed in different units. In order to standardize DO measurements among different rain events and temperatures, the measured LIDOD rates are adjusted to 20 °C using the standard van’t Hoff equation [49]:
LIDOD 20 = LIDOD T / 1.065 ( T 20 )
where LIDOD20 is the LID oxygen demand rate (mg·m‒3·min‒1) at 20 °C, and T is the water temperature (°C).
Because DO concentrations and water temperature were measured at a 2-min interval, the LIDODT and the LIDOD20 rate were similarly calculated at 2-min intervals for each rain event for piezometers 1 and 3. Volume of water in the gravel was calculated based on an average water level from piezometers 1 and 3. An average of the calculated LIDOD20 rates for all rain events for piezometers 1 and 3 was calculated and this average represents the LIDOD20 for the entire infiltration trench.

3. Results and Discussion

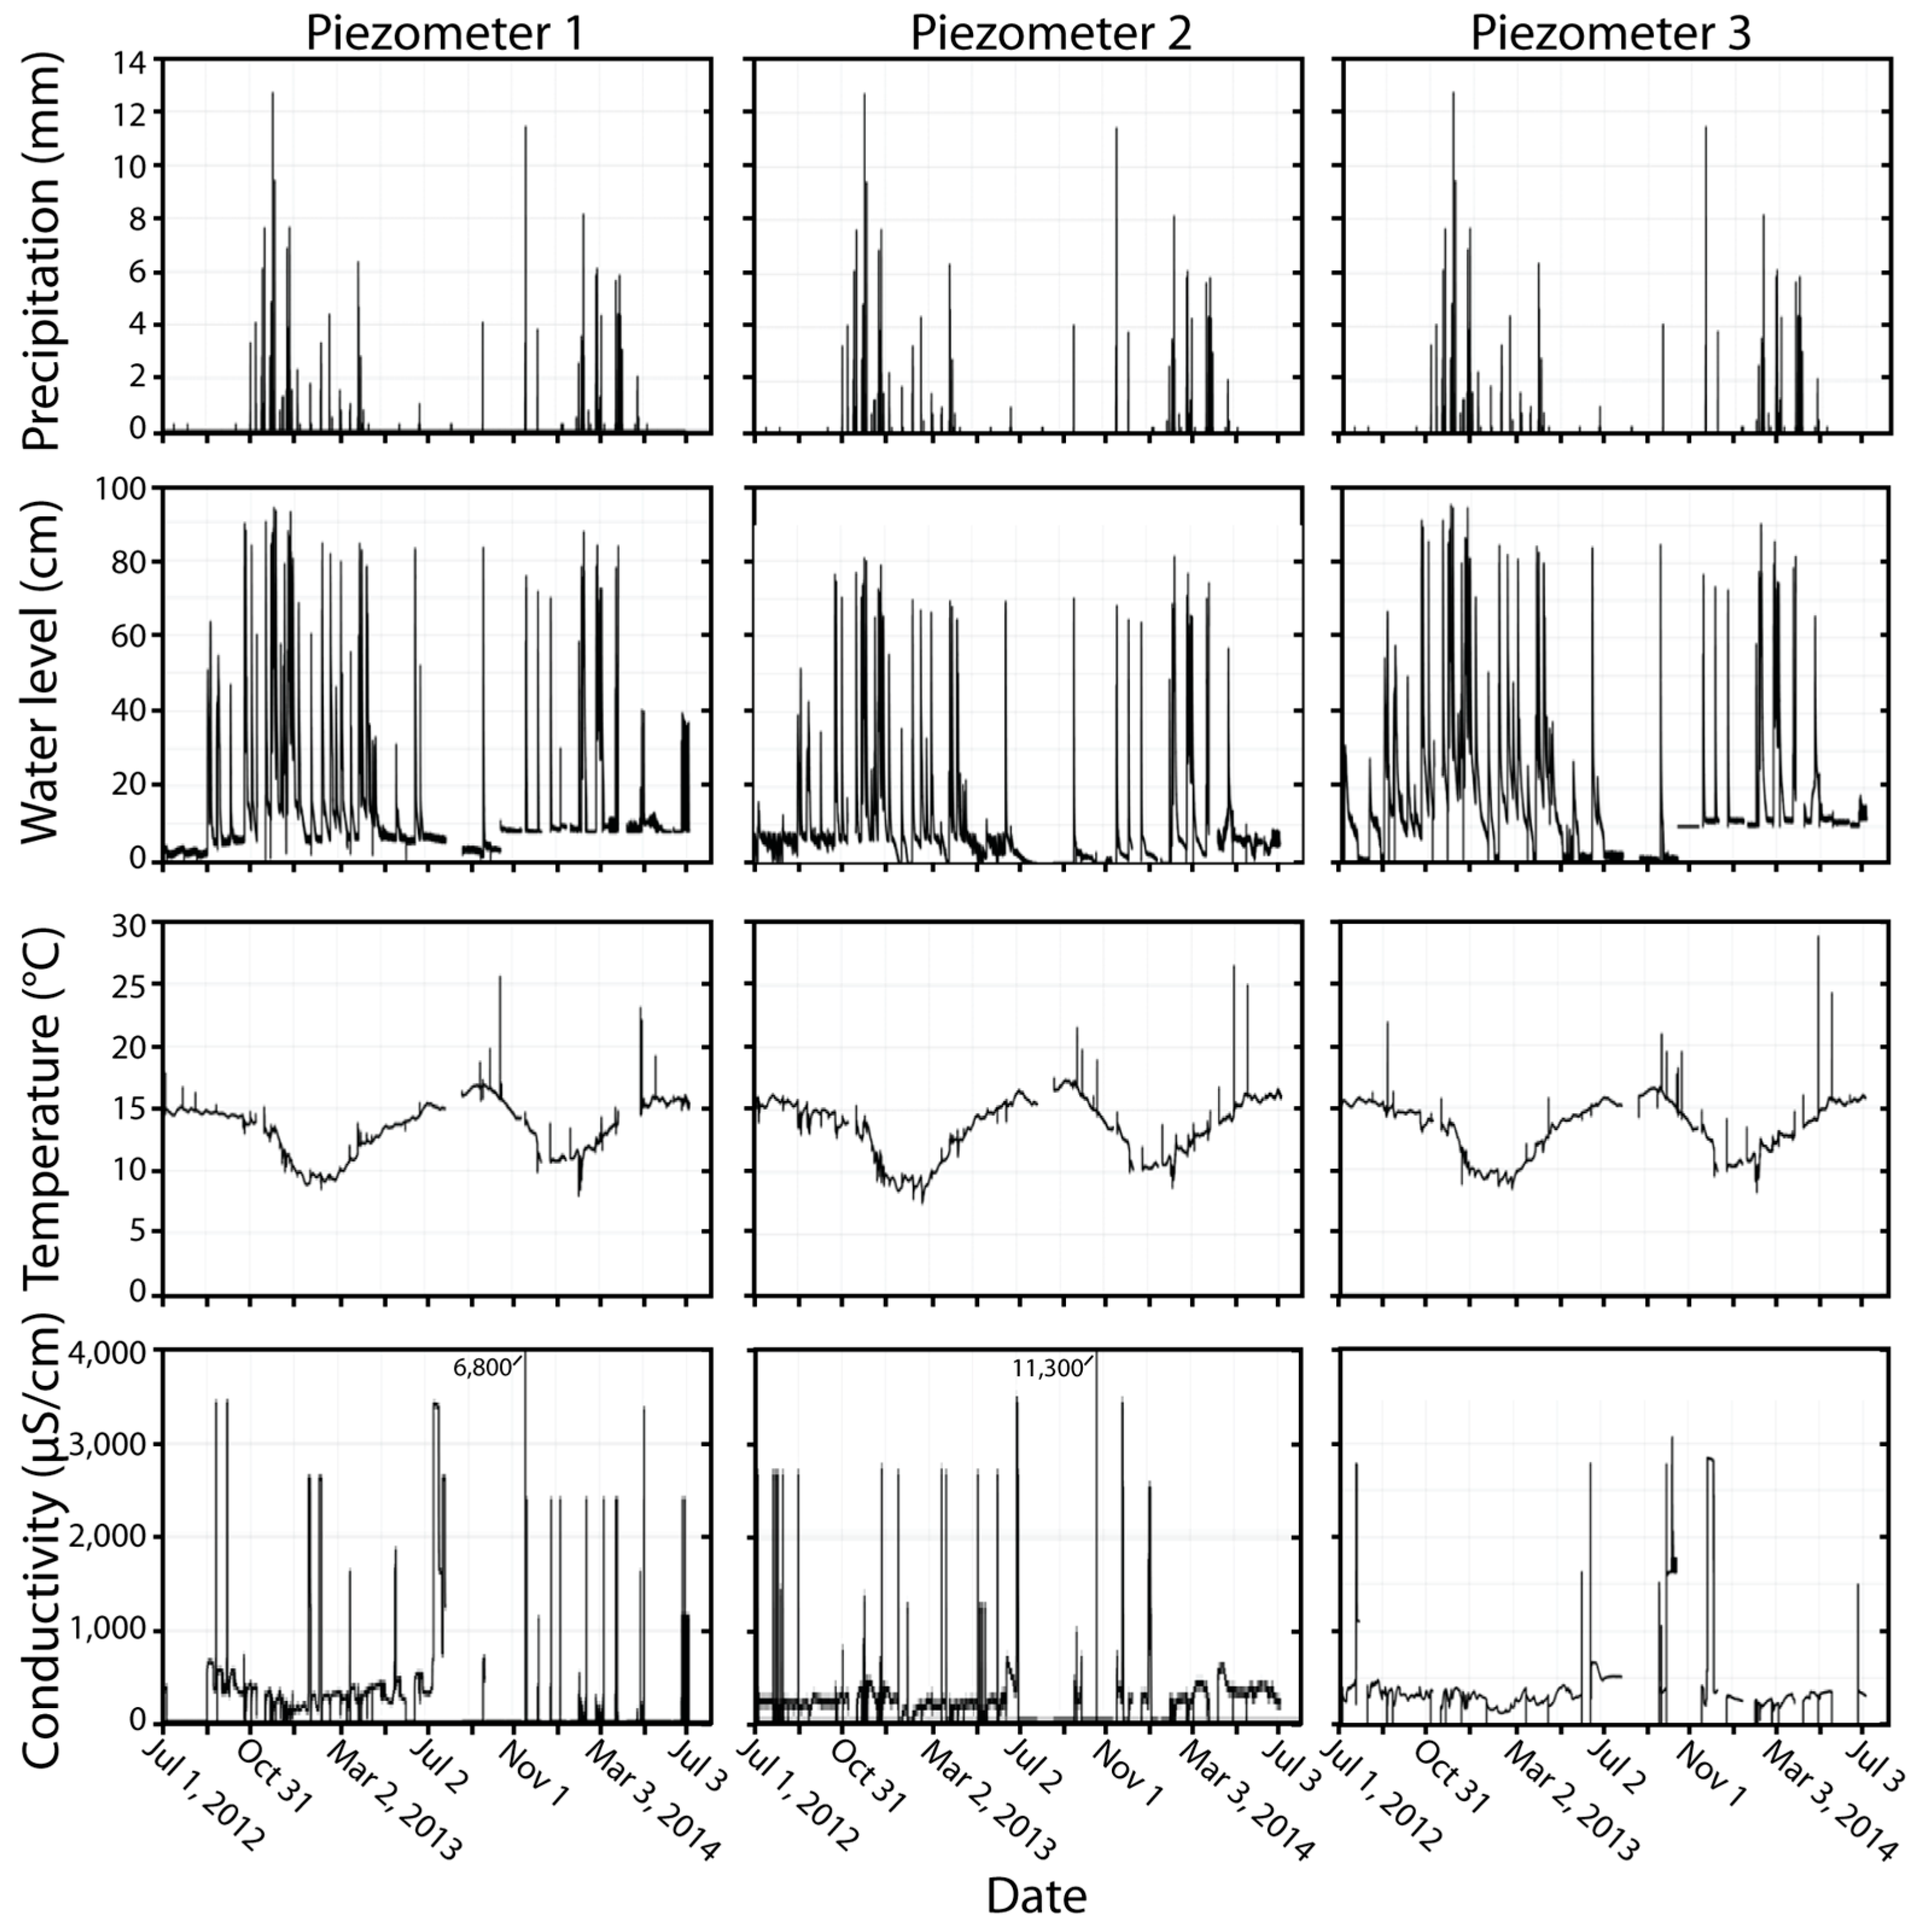
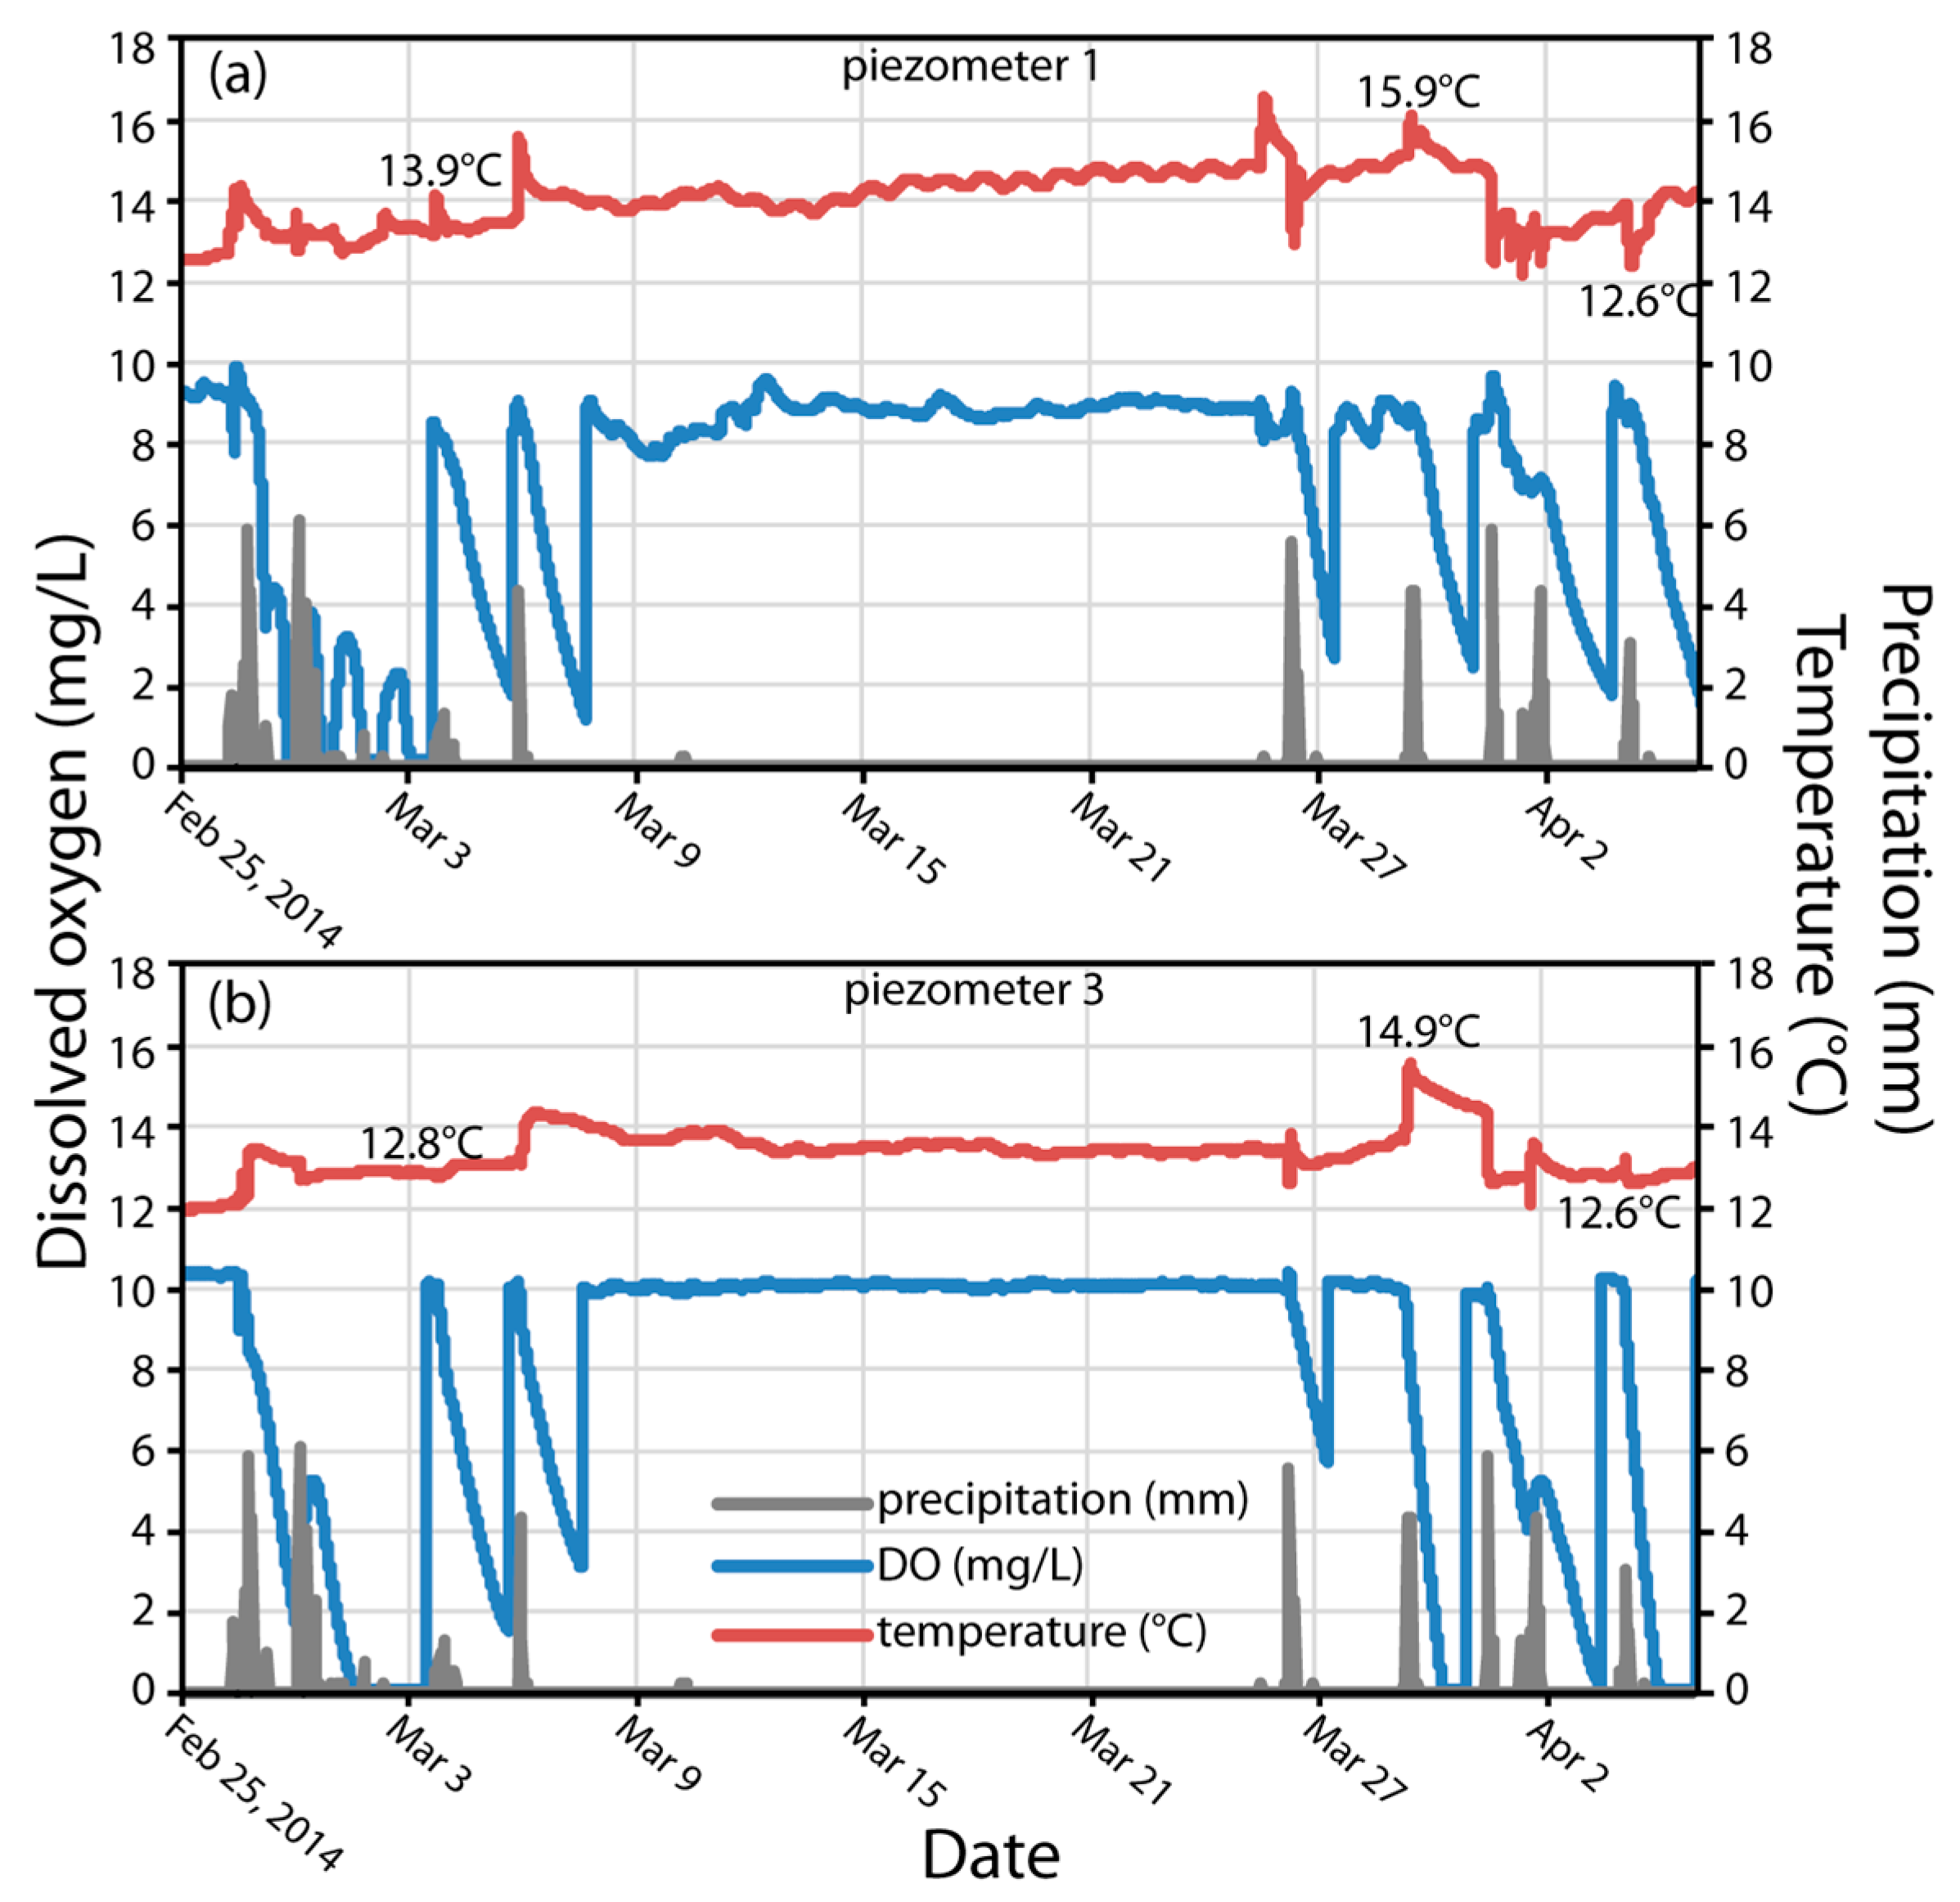
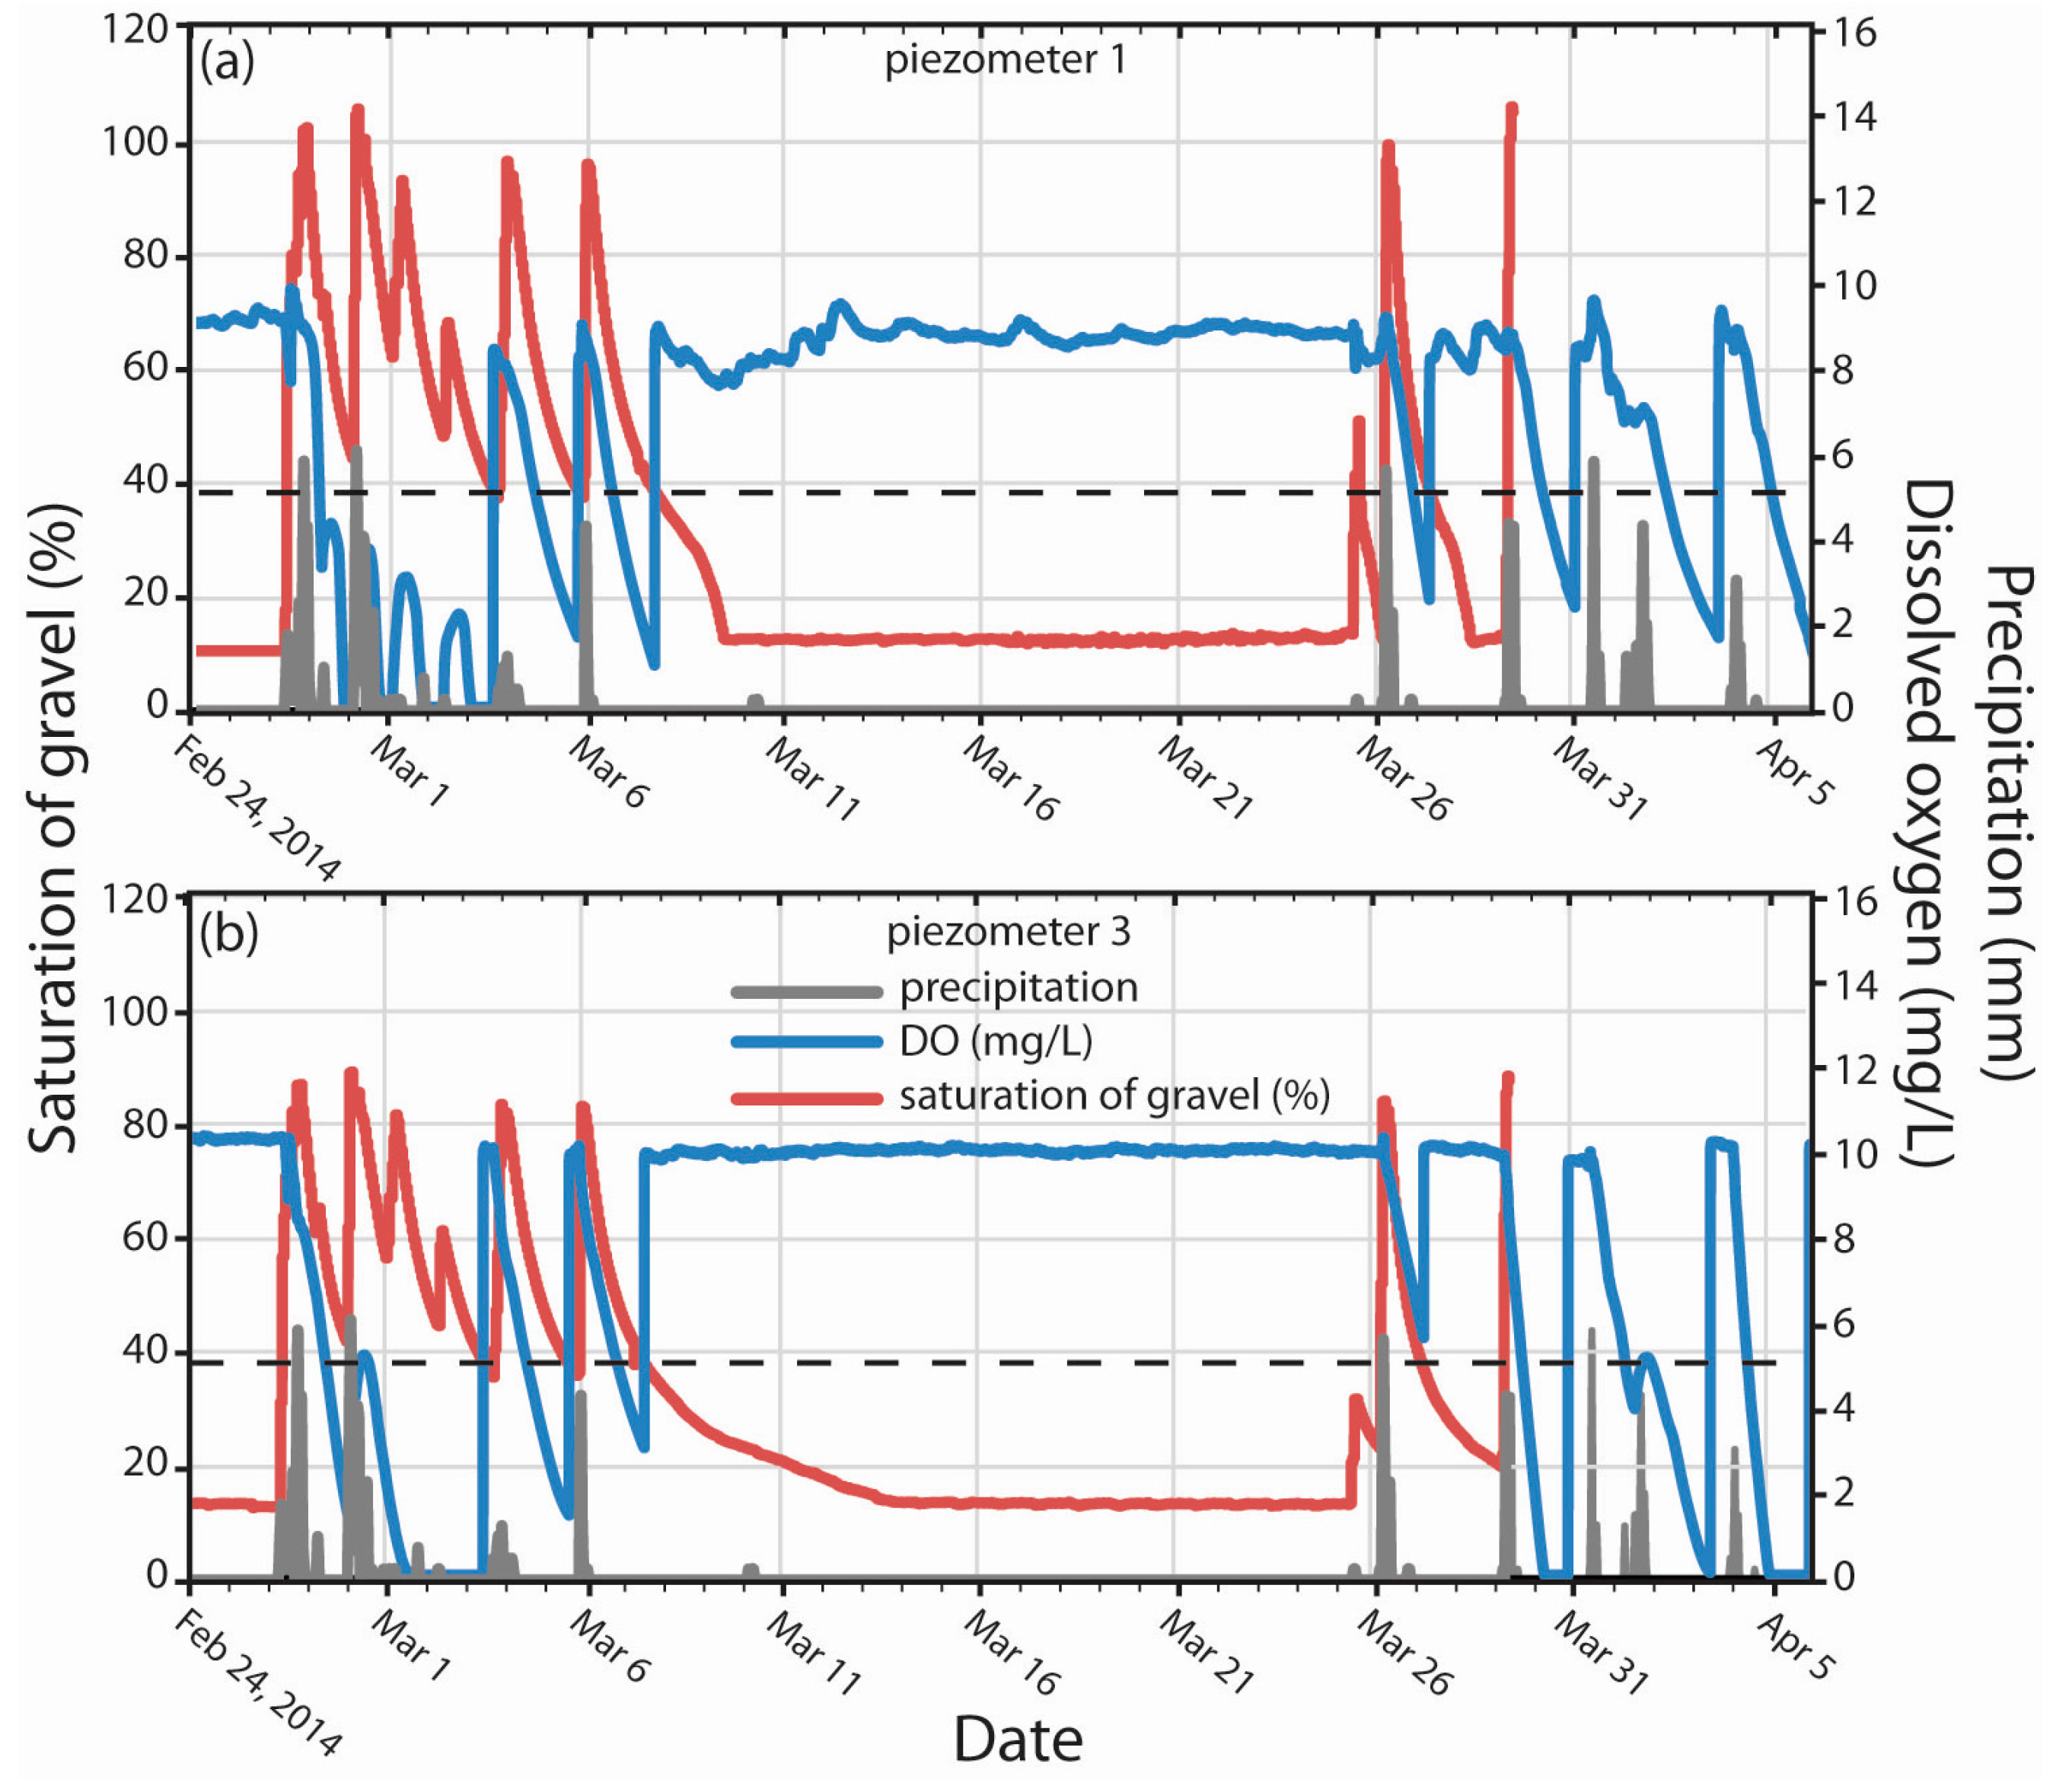
3.1. Water Levels, Saturation of Gravel, Temperature, and Conductivity in Response to Stormwater Runoff

During the period of observations (July 2012–June 2014), all of the hourly and daily precipitation were below the 2–5-year design storm values (<15 mm (Figure 3) and <60 mm (shown in [51]), respectively). The maximum hourly precipitation was 12.7 mm (Figure 3). Precipitation and stormwater events throughout the period of observation resulted in sharp and substantial increases in water levels in all three piezometers (Figure 3). A short time-lag (less than an hour) was observed between the beginning of the precipitation events to the first increase in water levels above pre-event values. This fast response in water levels to precipitation events is a function of the high CN number (98) of the effective drainage area and the relatively high infiltration capacity in the gravel trench, which enables effective capture and storage of stormwater. The infiltration of the stormwater below the gravel trench is recorded as water levels decline in the piezometers. A previous study [27] has reported that the infiltration of stormwater below the infiltration trench can result in very high recharge rates (1750 to 3710 mm·year‒1).
Time series of hourly precipitation and saturation of gravel (%) at each piezometer for events that occurred during the rainy season (November to March) of 2013 and 2014 are shown in Figure 4. During the rainy season, water levels were observed in the piezometers and saturation of gravel was always greater than 0%. Although the precipitation did not exceed the 2–5-year design storm, saturation of gravel exceeded 100% during several precipitation event (Figure 4), resulting in the ponding of stormwater at land surface. Ponding of stormwater at land surface was more frequently detected at the inflow to the LID near piezometer 1 than at locations near piezometers 2 or 3 (Figure 4).
The time series of the water levels and corresponding saturation of gravel (%) indicate spatial variation in the flow and storage of stormwater within the LID during the same rain events (Figure 4). Higher water levels and greater saturation of gravel (%) generally occur near piezometer 1 than piezometer 2 (Figure 4) as a result of piezometer 1 receiving more stormwater sooner due to proximity to the inlet pipe, causing temporary ponding as water infiltrates downward or laterally along the infiltration trench. However, water levels at piezometer 3 (located farthest from inlet pipe (Figure 2)) were occasionally observed to be higher than water levels in piezometers 1 and 2. Piezometer 3 is located near the cement stormwater overflow structure at the downstream end of the infiltration trench (Figure 2). The walls of the stormwater overflow structure acts as an impermeable surface, which prevents lateral water flow and occasionally results in greater saturation of gravel (%) near piezometer 3. However, no events were observed where the saturation of gravel exceeded 100% at all piezometer locations simultaneously (Figure 4), indicating that the maximum storage capacity of the LID trench was not exceeded during the period of observation.
The duration of saturation of gravel is a function of the intensity and duration of the precipitation, but generally lasted for several days after each storm event (Figure 4). The maximum duration that the infiltration trench was saturated above pre-event water levels was about 12–14 days for all three wells (Figure 4). Between 21–29 December 2012 (Figure 4b) and 26 February–5 March 2014 (Figure 4d), successive precipitation events resulted in some of the longest periods of saturation above pre-event water levels. Lower intensity and single rain events generally resulted in shorter periods of saturation above pre-event water levels, as was the case for the storm event on 2 February 2014 that took 2–3 days for saturation levels to return to pre-event conditions for all three piezometers (Figure 4b).
Time series of water temperatures for the period of observation are shown in Figure 3. Measured water temperatures in the three piezometers average about 15 °C, but fluctuate depending on the temperature of stormwater runoff. Observed water temperatures show variation before and after precipitation events during the rainy seasons of 2013 and 2014. Mixing of existing water in the gravel with relatively colder or warmer stormwater decreased or increased water temperature in the gravel, respectively (Figure 3).
Time series of conductivity (μS/cm) for the period of observation are shown in Figure 3. In general, the conductivity values decreased immediately following rising water levels from the inflow of stormwater during precipitation events (Figure 3; reference [51] has a detailed time series plots of conductivity and water levels). This inverse relationship is attributed to the dilution of stored water in the gravel trench by the inflow of stormwater runoff and is consistent with previous studies. Datry et al. (2004) [35] found that inflow to a stormwater infiltration basin resulted in a sharp decrease in conductivity in the infiltration bed. Appleyard (1993) [52] demonstrated similar findings that stormwater recharge through infiltration basins receiving runoff from large impervious catchments resulted in a substantial reduction in total dissolved solids to depths of more than 10 m below the water table.

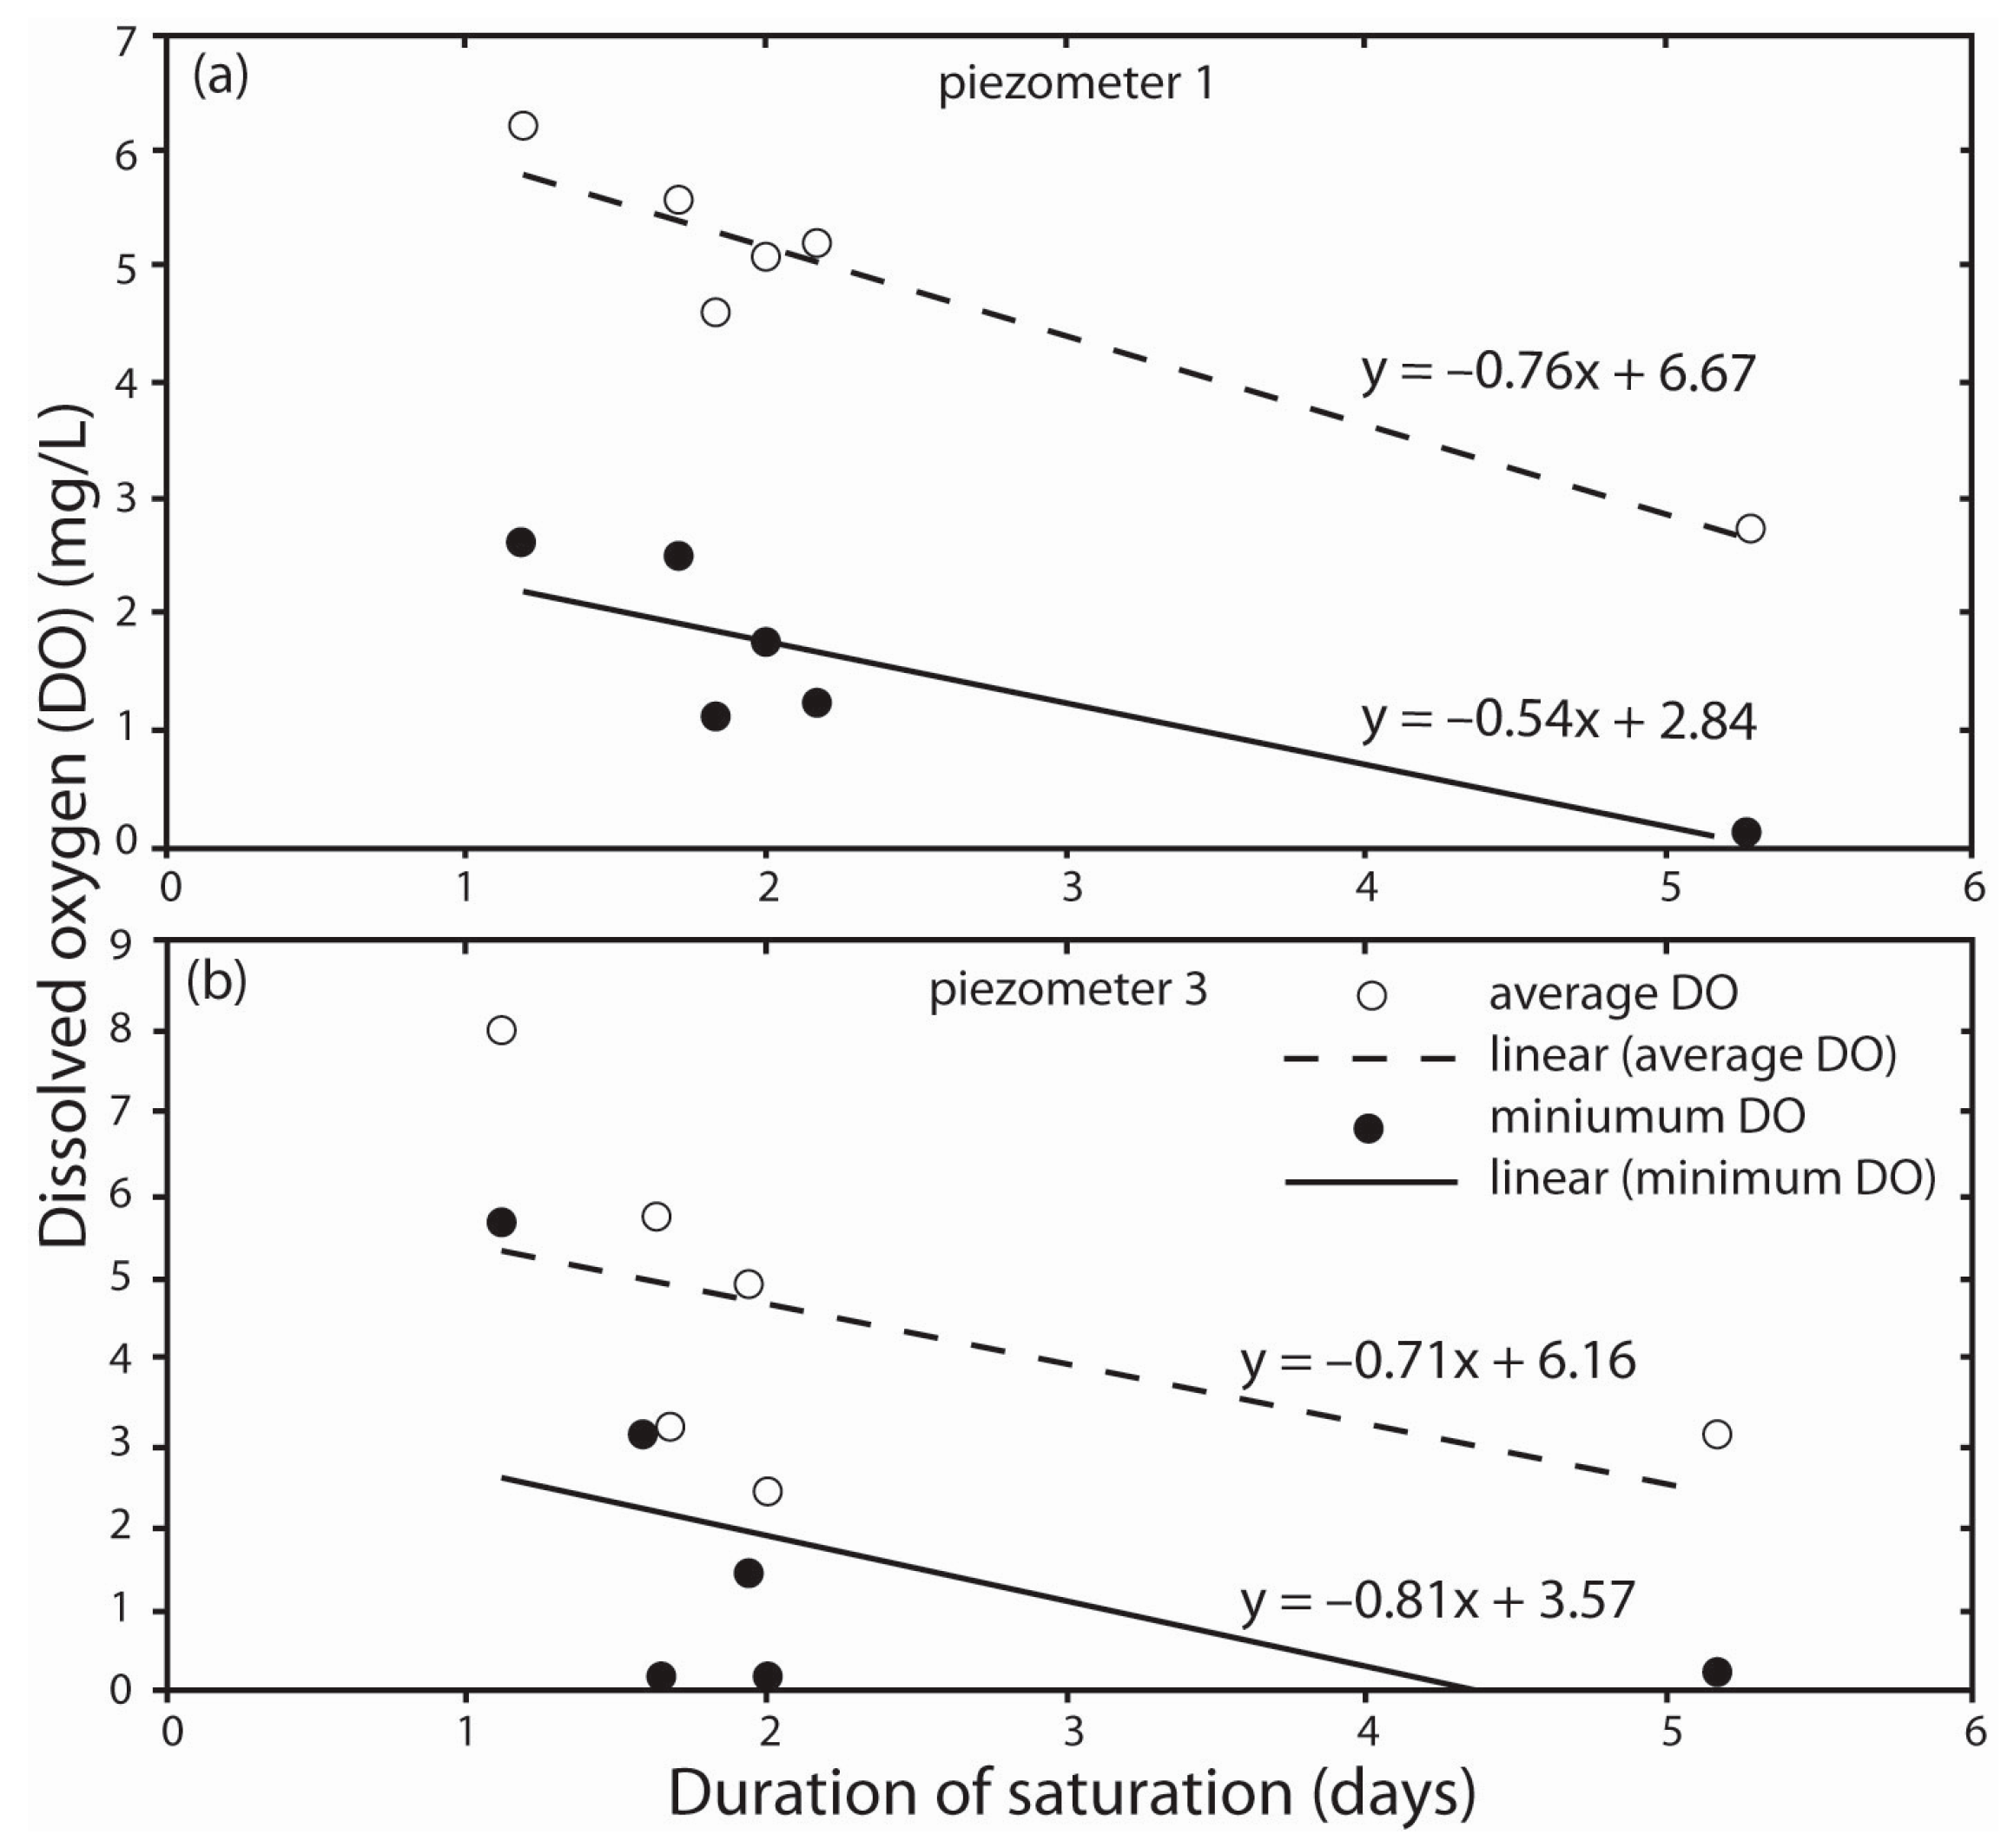
3.2. DO Dynamics in Response to Saturation of Gravel Magnitude and Duration

To illustrate the relation among precipitation, saturation of gravel (%), and DO concentrations, the time series for a period of the 2013–2014 rainy season (24 February to 5 April 2014) are shown in Figure 5. The rapid responses in water levels and saturation of gravel (%) to precipitation events and stormwater runoff have an important control of DO dynamics in the gravel infiltration trench (Figure 5). Due to the geometry of the miniDOT oxygen loggers inside the piezometers, the saturation of gravel (%) has to be ≥39% for the DO sensors to be in contact with stormwater that has collected in the gravel trench (Figure 5). When the saturation of gravel (%) is <39%, DO concentrations are highly oxic conditions (>8 mg·L‒1) and indicate that the miniDOT oxygen loggers are in direct contact with the atmosphere. After stormwater flows into the gravel trench and the saturation of gravel (%) exceeds 39%, we generally observed that DO concentrations decline rapidly, reaching anoxic conditions (<0.5 mg·L‒1) during some rain events (e.g., 1 March 2014 at piezometer 1 and 3) (Figure 5a,b). However, we also observed that DO concentrations increase with input of stormwater when DO concentrations in the gravel were anoxic or at lower concentrations than DO of the stormwater runoff (e.g., 6 March 2014 at piezometer 1 and 3) (Figure 5a,b). To confirm the DO concentrations of the stormwater runoff, we measured the DO of stormwater directly from the inflow drain (Figure 2) during the precipitation event on 26 February 2014, which had DO concentrations that ranged from 6.86 to 8.25 mg·L‒1. These DO concentrations are consistent with stormwater DO (6.00 to 9.90 mg·L‒1) reported from previous studies [35,53].
The time lag between the stormwater runoff, increased saturation of gravel (%), and corresponding changes to DO concentration was very short, often on the order of less than an hour to several days (Figure 5). For example, during the precipitation event on 26 February 2014 DO concentrations in piezometer 1 declined from 9.2 to 3.4 mg·L‒1 within one day (Figure 5a). Although a subsequent smaller precipitation event on 27 February resulted in a slight increase in DO to about 4.0 mg·L‒1 in piezometer 1, the DO continued a rapid decrease toward anoxic conditions (<0.5 mg·L‒1) by 28 February (Figure 5a). Subsequent precipitation events and stormwater runoff from 28 February to 2 March 2014 resulted in rapid DO fluctuations from anoxic to oxic (<4.0 mg·L‒1) conditions that closely matched the magnitude of fluctuations in saturation of gravel (%) (Figure 5a). Between 26 February and 2 March, anoxic conditions were observed for a relatively short period of about 15 h (Figure 5a). The DO returned to pre-event oxic conditions as the result of either the replenishment with oxic stormwater or infiltration-induced lowering of water levels in piezometer below 39% saturation of gravel (Figure 5a).
The DO fluctuations in piezometer 3 (Figure 5b) as a response to the magnitude of saturation of gravel (%) follow the same general pattern as those observed in piezometer 1. However, anoxic conditions were observed for almost 2 days in piezometer 3 during the same period of 26 February and 2 March (Figure 5b). These results indicate that even within a relatively short distance (<10 m), the duration of anoxic conditions can be substantially (about 3×) different between the two ends of the gravel infiltration trench (Figure 2). These findings indicate considerable spatial variability in the redox conditions and reactions that may occur within a LID BMP, even during the same precipitation and stormwater events.
The duration of saturation of gravel (days with >39% saturation of gravel) and corresponding DO concentrations in piezometers 1 and 3 for six precipitation events during the period of observation are summarized in Table 1 and Figure 6. The maximum values of DO shown in Table 1 refer to DO concentrations in the gravel at the time the precipitation event began, and minimum values refer to the DO concentrations at the end of saturation period when the water levels start recovering (increasing). Due to the geometry of the LTC Leveloggers and miniDOT oxygen loggers inside the piezometers, the reported values of duration of saturation of gravel (%) and DO concentrations (Table 1) underestimate the actual duration of time that the entire thickness of the gravel trench is saturated.
Table 1 and Figure 6 indicate an inverse relation between duration of saturation of the gravel (days) and DO concentration. Significant (α = 90%) and inverse Spearman correlations (N = 6) were observed between the duration of saturation of gravel (days) and average and minimum DO values for piezometer 1 (average rho = −0.77 (p = 0.072); minimum rho = −0.83 (p = 0.041)) and piezometer 3 (average rho = −0.71 (p = 0.110); minimum rho = −0.83 (p = 0.041)), respectively. These results indicate that a large percentage of the variation in DO concentrations can be explained by the corresponding duration of saturation of gravel (days). Due to the relatively low number of observations (N = 6) in Figure 6, the data point with duration of saturation >5 days has a strong influence on the linear regression. The duration of saturation >5 days is caused by the relatively longer period of precipitation (26 February to 3 March) than the other observations that typically had precipitation events lasting less than two days (Table 1). If the >5 days of saturation is treated as an outlier and not included in the analysis, we note less significant and inverse Spearman correlations (N = 5) for piezometer 1 (avg. rho = −0.60 (p = 0.284); min. rho = −0.70 (p = 0.188)) and piezometer 3 (avg. rho = −0.90 (p = 0.037); min. rho = −0.70 (p = 0.188)), respectively.
The less significant Spearman correlations between duration of saturation of gravel and DO for piezometer 3 than piezometer 1 is likely related to the previously mentioned spatial variation in flow geometry within the infiltration trench. Anoxic conditions in stormwater near piezometer 3 occurred more often and prevailed longer than piezometer 1 (Figure 5) and more rapidly during the first two days during saturation (Figure 6b), as compared to piezometer 1 (Figure 6a). The spatial variation in redox dynamics between piezometer 1 and piezometer 3 is a result of the proximity to the inflow drain where piezometer 1 (closest to inlet pipe) has a more immediate response to precipitation events due to receiving larger amount of oxic stormwater input sooner than piezometer 3, and the restricted lateral flow near piezometer 3 caused by the impermeable cement stormwater overflow structure. The duration of saturation of gravel is also a function of drainage rate of the gravel trench and the saturated hydraulic conductivity of the underlying loamy sand (see Table 1 in [27]). There are likely spatial heterogeneities in soil texture and corresponding hydraulic properties of the loamy sand and sandy clay loam beneath the gravel trench that may have an effect on the spatial variations in stormwater draining beneath the gravel trench. Additionally, infiltration rates beneath surface ponding are known to decrease with time, which leads to longer residence times of stormwater and reaction progress for DO consumption by microbial respiration in the gravel trench. Lower infiltration rates have been shown to result in more microbial oxygen consumption, leading to anoxic conditions in the vadose zone [36].
The observed DO dynamics in response to the hydraulic conditions and stormwater runoff exhibit a strong inverse relation between the saturation of gravel (%) and DO concentrations (Figure 5 and Figure 6). The rapid consumption of DO while the gravel is at >39% saturation is likely caused by microbial respiration in the gravel trench. Although not measured in this study, stormwater is often rich in organic matter [38,54], which we infer as an important electron donor for microbially mediated oxygen reduction in the gravel trench. Furthermore, observed water temperatures for the period of field observation of DO (February–June 2014) range between 7 °C and 23 °C (Figure 3), which are above the benchmark temperature referred to as biological zero (5 °C), below which microbial activity generally ceases [55].

3.3. DO Dynamics in Response to Water Temperature

To illustrate the relation between precipitation events, water temperature, and DO concentrations, time series for a period of the 2013–2014 rainy season (24 February to 5 April 2014) are shown in Figure 7. Measured water temperatures in the infiltration trench during this period ranged between 12 °C and 17 °C (Figure 7). As previously described in Figure 3, there was no consistent pattern of stormwater effect on water temperature in the gravel trench (Figure 7). Runoff of relatively cooler stormwater decreased the water temperature in the gravel trench and runoff of relatively warmer stormwater increased water temperatures in the infiltration trench (Figure 7).
Warmer water temperatures are associated with greater microbial activities in soils, and therefore higher rates of DO consumption [38]. Vaughan et al. (2009) [26] observed that during periods of cooler soil temperatures, saturated soils took longer to become reducing. However in this study, the observed variations in stormwater temperature have no apparent influence on the DO dynamics in the gravel trench (Figure 7). For example, the infiltration of relatively warmer stormwater on 29 March 2014 (16 °C) (Figure 7a) did not result in lower DO concentrations than infiltration of relatively cooler stormwater on 3 March 2014 (13.93 °C) and 4 April 2014 (12.62 °C) (Figure 7a). Using a t-test, we tested if the DO concentrations were statistically different during relatively warm or cold stormwater events (N = 6) for the period February to June 2014. Here we categorize warm or cold stormwater events relative to the average water temperature in the infiltration trench. Results of the t-test indicate no statistical difference (p < 0.0001) in DO concentration during the relatively warm or cold stormwater events.

3.4. Rates of O2 Reduction and LID O2 Demand (LIDOD)

Rates of O2 reduction for stormwater in piezometers 1 and 3 were estimated for six precipitation events during the period February–April 2014 (Table 2). O2 reduction plots show a linear relation with time from the beginning of the rain event to the lowest DO values during that event (plots shown in [51]), indicating a zero-order kinetics for the O2 reduction process in the gravel trench. The linear fit for the O2 reduction plots results in a relatively small range of O2 reduction zero-order rates: 0.002–0.004 mg·L‒1·min‒1 (0.10–0.25 mg·L‒1·h‒1) for stormwater in piezometer 1 and 0.002–0.005 mg·L‒1·min‒1 (0.12–0.27 mg·L‒1·h‒1) for stormwater in piezometer 3 (Table 2). The O2 reduction rate for the entire gravel trench was calculated as the average of all the zero-order rates from piezometers 1 and 3, resulting in a value of 0.003 mg·L‒1·min‒1 (0.179 mg·L‒1·h‒1).
The LIDODT and LIDOD20 (Table 2) were calculated using the measured DO concentrations for piezometers 1 and 3 plotted as a function of elapsed time (in minutes) from the beginning of the precipitation event until the lowest DO concentrations measured before recovery of DO levels to pre-event conditions (Figure 8). The slope of the best-fit regression line for each oxygen-depletion curve (mg·m‒3·min‒1) (b, Equation (5)) was calculated (Figure 8) and used to estimate the LIDODT and LIDOD20 for each event (Table 2). The range of LIDODT is 1.48–2.49 mg·m‒3·min‒1 for stormwater in piezometer 1 and 1.52–1.83 mg·m‒3·min‒1 for stormwater in piezometer 3. The LIDODT were converted to LIDOD20, which ranged between 2.23 and 3.59 mg·m‒3·min‒1 for piezometer 1 and 2.80 and 2.81 mg·m‒3·min‒1 for piezometer 3. The LIDOD20 for the entire gravel trench was calculated as the average of all the LIDOD20 values from piezometers 1 and 3, resulting in a value of 2.71 mg·m‒3·min‒1.
The average O2 reduction rate for the gravel trench (0.003 mg·L‒1·min‒1) is two to five orders of magnitude greater than the O2 reduction rates for groundwater estimated in recent studies [39,56]. Tesoriero and Puckett (2011) [39] estimated a range of zero-order O2 reduction rates of <3–140 μmol·L‒1·year‒1 (equivalent to <1.826 × 10⁻⁷–8.523 × 10⁻⁶ mg·L‒1·min‒1) in 12 shallow aquifers in the U.S., by relating dissolved O2 concentrations to groundwater age. Similarly, McMahon et al. (2008) [56] estimated zero-order O2 reduction rates in four Principal Aquifers of the U.S. that ranged between 0.03 and 6 mg·L‒1·year‒1 (equivalent to 5.707 × 10⁻⁸ and 1.1415 × 10⁻⁵ mg·L‒1·min‒1). The higher rates of O2 reduction reported here are attributed to the differences in the spatial and temporal scales of measurements between the LID infiltration trench and groundwater in aquifers. The dynamic flow system of the LID infiltration trench is in more direct contact with the atmosphere and receives more regular inflow of oxic recharge in the form of stormwater runoff as compared to groundwater in most aquifers that is deeper and more isolated from the atmosphere. Additionally, the stormwater runoff in the infiltration trench likely has greater organic matter content than recharge to deeper aquifers [54], and thus the more readily available electron donor promote more rapid microbial O2 reduction in the infiltration trench. Similarly, aerobic respiration rates are expected to be high in aquifers contaminated with organic compounds because the availability of electron donors as the primary factor affecting O2 reduction rates [39]. The importance of organic matter driving O2 reduction rates in the LID infiltration trench is further supported by the observations of Tesoriero and Puckett (2011) [39] that concentrations of dissolved organic carbon (DOC) were positively correlated with groundwater age at sites with high O2 reduction rates and negatively correlated at sites with lower rates.
The observation of anoxic conditions and rapid O2 reduction rates in the infiltration trench has important implications for many stormwater pollutants, and particularly for denitrification of NO3 in stormwater runoff. Previous studies identified <0.5 mg·L‒1 [32] as the O2 concentration threshold required for the onset of denitrification in groundwater, but the threshold could be as high as <1 mg·L‒1 [39] and <2 mg·L‒1 in some aquifers [57,58]. The estimated rates for O2 reduction in this study strongly indicate that redox conditions favorable for denitrification may be present in the infiltration trench. Based on O2 reduction rate of 0.003 mg·L‒1·min‒1 and a maximum initial DO concentration of 10 mg·L‒1, redox conditions in the infiltration trench may reach the lower end of O2 concentration threshold (<0.5 mg·L‒1) required for the onset of denitrification in about 2–3 days (and <2 days to reach <2 mg·L‒1). The time to reach anoxic conditions in the infiltration trench varies depending on the initial oxic conditions present at the beginning of the precipitation event and the duration the infiltration trench is saturated. Future work here at the SFSU LID research network will evaluate denitrification rates and removal of NO3 in stormwater runoff during anoxic conditions observed in the LID infiltration trench, and whether the observed 15 h to two days of continuous anoxic conditions in the gravel trench is representative of wetter precipitation scenarios or the vadose zone sediments beneath the gravel trench. We suspect that anoxic conditions in the underlying vadose zone sediments persist longer than what is observed in the trench gravel.

4. Conclusions and Implications for Designing LID BMPs

We find that the magnitude and duration of fluctuations in DO concentrations in the infiltration trench were influenced by hydraulic conditions in the gravel with an apparent inverse relation to the duration of saturation of gravel (%). DO was quickly consumed and conditions reached anoxic levels within hours to days of stormwater events, and strongly indicates that microbial respiration is a limiting factor for DO in the gravel trench. Anoxic conditions remained for short periods of time (from a few hours to maximum of two days) and returned relatively quickly to oxic conditions after the end of each precipitation event by either rapid infiltration of stormwater and drying of the gravel or by re-oxygenation with oxic stormwater runoff. In contrast, the temperature of stormwater runoff was not found to exhibit a major influence on redox dynamics in the infiltration trench, which may be a function of the relatively constant Mediterranean climate of San Francisco. Statistical analysis of stormwater events with different temperatures shows no significant difference between the DO concentrations in the gravel trench during relatively warm and cold stormwater runoff. Follow-on studies that monitor changes in dissolved organic carbon (DOC) and nitrogen (NO3, NH4+) and phosphorus (PO43−) species will gain additional insight into important biogeochemical controls on DO consumption and have a greater ability to generalize our findings to other LID systems.
We also find that the average O2 reduction rate for the infiltration trench is 0.003 mg·L‒1·min‒1, which is two to five orders of magnitude higher than the O2 reduction rates for groundwater from previous studies. Higher rates of O2 reduction reported here reflect the more dynamic flow system of the infiltration trench that receives more oxic water and organic carbon in stormwater runoff that drives faster microbial O2 reduction. The estimated O2 reduction rate and observed DO concentrations strongly indicates that anoxic conditions are temporally present and could possibly enable denitrification processes and removal of NO3, which is the most ubiquitous contaminant of groundwater resources worldwide. To confirm our hypothesis that denitrification is a possible O2 consumption pathway when anoxic conditions are reached, additional characterization of the pore-water quality, microbial communities in the biomass, and nitrification/denitrification or mineralization processes in the LID system is necessary and recommended for follow-on studies.
The findings from this study have important implications for the design of infiltration trenches and potentially other types of LID BMPs. The important hydraulic controls, such as the magnitude and duration of saturation of gravel on DO concentrations, O2 reduction rates, and resulting redox conditions could be altered through the design of the infiltration trench. In general, the relative dimensions of the surface area and average depth of the gravel trench could be manipulated to achieve desired redox dynamics and conditions within and beneath the infiltration trench. For illustration purposes of these concepts, we assume an infiltration trench with similar stormwater storage capacity (3.0 m3) and underlying soil texture as in this study, but consider two hypothetical design scenarios by altering the ratio of surface area to depth of the gravel trench. A similar stormwater storage capacity could be achieved by using a slightly lower ratio of gravel surface area to depth (smaller area and greater depth) or a slightly higher ratio of gravel surface area to depth (greater area and smaller depth). Therefore, the two hypothetical design scenarios would have the same saturation of gravel (%) under identical precipitation events, but different duration of saturation of gravel (minutes).
The lower ratio of area to depth design would create relatively higher water levels within the gravel and corresponding longer time to infiltrate into the underlying soil. This longer duration of saturation of gravel would enable longer time for microbial O2 reduction, resulting in possibly more frequent and longer periods of anoxic conditions within and beneath the gravel trench. Such a hypothetical LID design that enhances the frequency and duration of anoxic conditions may be best used to promote denitrification of elevated NO3 concentrations in stormwater from areas of high fertilizer use on lawns, golf courses, or agricultural land-use settings. Future work should address more complex systems that require coupled oxic-anoxic zones to oxidize ammonia to nitrate and then promote denitrification and reduce NO3. In contrast, the higher ratio of area to depth design would create relatively lower water levels within the gravel and corresponding shorter time to infiltrate into the underlying soil. This shorter duration of saturation of gravel would enable shorter time for microbial O2 reduction, resulting in possibly less frequent and shorter periods of anoxic conditions within and beneath the gravel trench. Such a hypothetical LID design that diminishes the frequency and duration of anoxic conditions may be best used to reduce the mobilization of redox sensitive heavy metals in stormwater from parking lots, roads, and other urban or industrialized land-use settings.
Although we found that the temperature of stormwater runoff was not a significant control on redox dynamics in the infiltration trench studies here, the two hypothetical design scenarios could potentially enhance a temperature effect on redox dynamics. The lower ratio of area to depth design could potentially result in relatively cooler stormwater temperatures in the gravel trench, while the higher ratio of area to depth design could potentially result in relatively warmer stormwater temperatures because of the relative differences in the penetration of solar radiation through the gravel trench. Additional study is needed to evaluate how these and other design scenarios may affect the microbial respiration rates and redox conditions of the stormwater within and beneath the LID BMPs. Altering the design of LID BMPs to manipulate redox processes could be an important tool to help protect groundwater quality from the infiltration and recharge of contaminated stormwater runoff beneath LID BMP features.

Acknowledgments

Funding for this research was provided by the Dawdy Hydrology Research Grant at San Francisco State University; G.A. Harris Research Instrumentation Grant from Decagon Devices, Inc.; and San Francisco State University ORSP-FOA 2010-2011. We thank Leonard Sklar and Bruce Manning (SFSU) for constructive comments on previous versions of this paper.

Author Contributions

The study was designed by Jason J. Gurdak, and Mays N. Danfoura led the field sampling and analysis. The text of this article was written by Mays N. Danfoura and Jason J. Gurdak.

Conflicts of Interest

The authors declare no conflict of interest.

References

  1. Paul, M.J.; Meyer, J.L. Streams in the urban landscape. Annu. Rev. Ecol. Evol. Syst. 2001, 32, 333–365. [Google Scholar] [CrossRef]
  2. Pitt, R.; Field, R.; Lalor, M.; Brown, M. Urban stormwater toxic pollutants: Assessment, sources, and treatability. Water Environ. Res. 1995, 67, 260–275. [Google Scholar] [CrossRef]
  3. Elliott, A.; Trowsdale, S. A review of models for low impact urban stormwater drainage. Environ. Model. Softw. 2007, 22, 394–405. [Google Scholar] [CrossRef]
  4. Maniquiz, M.C.; Lee, S.-Y.; Kim, L.-H. Long-Term Monitoring of Infiltration Trench for Nonpoint Source Pollution Control. Water Air Soil Pollut. 2010, 212, 13–26. [Google Scholar] [CrossRef]
  5. Fletcher, T.D.; Andrieu, H.; Hamel, P. Understanding, management and modelling of urban hydrology and its consequences for receiving waters: A state of the art. Adv. Water Resour. 2013, 51, 261–279. [Google Scholar] [CrossRef]
  6. Eriksson, E.; Baun, A.; Scholes, L.; Ledin, A.; Ahlman, S.; Revitt, M.; Noutsopoulos, C.; Mikkelsen, P.S. Selected stormwater priority pollutants—A European perspective. Sci. Total Environ. 2007, 383, 41–51. [Google Scholar] [CrossRef] [PubMed]
  7. Joshi, U.M.; Balasubramanian, R. Characteristics and environmental mobility of trace elements in urban runoff. Chemosphere 2010, 80, 310–318. [Google Scholar] [CrossRef] [PubMed]
  8. Barbosa, A.E.; Fernandes, J.N.; David, L.M. Key issues for sustainable urban stormwater management. Water Res. 2012, 46, 6787–6798. [Google Scholar] [CrossRef] [PubMed]
  9. Gurdak, J.J.; Hanson, R.T.; Green, T.R. Effects of Climate Variability and Change on Groundwater Resources of the United States; U.S. Geological Survey: Lakewood, CO, USA, 2009; p. 4.
  10. Kuss, A.J.M.; Gurdak, J.J. Groundwater level response in U.S. principal aquifers to ENSO, NAO, PDO, and AMO. J. Hydrol. 2014, 519, 1939–1952. [Google Scholar] [CrossRef]
  11. Barbu, I.A.; Ballestero, T.P.; Roseen, R.M. LID-SWM Practices as a Means of Resilience to Climate Change and Its Effects on Groundwater Recharge. In Proceedings of the World Environmental and Water Resources Congress, Great Rivers, Kansas City, MO, USA, 17–21 May 2009; pp. 1–10.
  12. U.S. Environmental Protection Agency. Low Impact Development (LID)—A Literature Review; USEPA, Office of Water: Washington, DC, USA, 2000; p. 35.
  13. Department of Environmental Resources. Low-Impact Development Hydrologic Analysis; Prince George’s County, Department of Environmental Resources: Marlboro, MD, USA, 1999.
  14. Facility for Advancing Water Biofiltration (FAWB). Adoption Guidelines for Stormwater Biofiltration Systems; FAWB, Monash University: Melbourne, Australia, 2009. [Google Scholar]
  15. Dietz, M.E.; Clausen, J.C. Saturation to improve pollutant retention in a rain garden. Environ. Sci. Technol. 2006, 40, 1335–1340. [Google Scholar] [CrossRef] [PubMed]
  16. Prince George’s County. Design Manual for Use of Bioretention in Stormwater Management; Prince George’s County (MD) Government, Department of Environmental Protection, Watershed Protection Branch: Landover, MD, USA, 1993.
  17. Kim, H.; Seagren, E.A.; Davis, A.P. Engineered bioretention for removal of nitrate from stormwater runoff. Water Environ. Res. 2003, 75, 355–367. [Google Scholar] [CrossRef] [PubMed]
  18. Zinger, Y.; Blecken, G.-T.; Fletcher, T.D.; Viklander, M.; Deletić, A. Optimising nitrogen removal in existing stormwater biofilters: Benefits and tradeoffs of a retrofitted saturated zone. Ecol. Eng. 2013, 51, 75–82. [Google Scholar] [CrossRef]
  19. Zhang, Z.; Rengel, Z.; Liaghati, T.; Antoniette, T.; Meney, K. Influence of plant species and submerged zone with carbon addition on nutrient removal in stormwater biofilter. Ecol. Eng. 2011, 37, 1833–1841. [Google Scholar] [CrossRef]
  20. Payne, E.G.I.; Fletcher, T.D.; Cook, P.L.M.; Deletic, A.; Hatt, B.E. Processes and drivers of nitrogen removal in stormwater biofiltration. Crit. Rev. Environ. Sci. Technol. 2013, 44, 796–846. [Google Scholar] [CrossRef]
  21. Blecken, G.-T.; Zinger, Y.; Deletić, A.; Fletcher, T.D.; Viklander, M. Impact of a submerged zone and a carbon source on heavy metal removal in stormwater biofilters. Ecol. Eng. 2009, 35, 769–778. [Google Scholar] [CrossRef]
  22. Davis, A.P.; Shokouhian, M.; Sharma, H.; Minami, C.; Winogradoff, D. Water quality improvement through bioretention: Lead, copper, and zinc removal. Water Environ. Res. 2003, 75, 73–82. [Google Scholar] [CrossRef] [PubMed]
  23. Chandrasena, G.I.; Pham, T.; Payne, E.G.; Deletic, A.; McCarthy, D.T. E. E. coli removal in laboratory scale stormwater biofilters: Influence of vegetation and submerged zone. J. Hydrol. 2014, 519, 814–822. [Google Scholar] [CrossRef]
  24. Rippy, M.A. Meeting the criteria: Linking biofilter design to fecal indicator bacteria removal. Wiley Interdiscip. Rev. Water 2015, 2, 577–592. [Google Scholar] [CrossRef]
  25. Li, Y.L.; Deletic, A.; Alcazar, L.; Bratieres, K.; Fletcher, T.D.; McCarthy, D.T. Removal of Clostridium perfringens, Escherichia coli and F-RNA coliphages by stormwater biofilters. Ecol. Eng. 2012, 49, 137–145. [Google Scholar] [CrossRef]
  26. Holman-Dodds, J.K.; Bradley, A.A.; Potter, K.W. Evaluation of hydrologic benefits of infiltration based urban storm water management. J. Am. Water Resour. Assoc. 2007, 39, 205–215. [Google Scholar] [CrossRef]
  27. Newcomer, M.E.; Gurdak, J.J.; Sklar, L.S.; Nanus, L. Urban recharge beneath low impact development and effects of climate variability and change. Water Resour. Res. 2014, 50, 1716–1734. [Google Scholar] [CrossRef]
  28. Dietz, M.E.; Clausen, J.C. A field evaluation of rain garden flow and pollutant treatment. Water Air Soil Pollut. 2005, 167, 123–138. [Google Scholar] [CrossRef]
  29. Lu, P.; Yuan, T. Low impact development design for urban stormwater management—A case study in USA. In Proceedings of the International Symposium on Water Resource and Environmental Protection (ISWREP), Xi’an, China, 20–22 May 2011; Volume 4, pp. 2741–2744.
  30. U.S. Environmental Protection Agency. Incorporating Low Impact Development into Municipal Stormwater Programs; U.S. Environmental Protection Agency: Washington, DC, USA, 2009; p. 11.
  31. Korom, S.F. Natural denitrification in the saturated zone: A review. Water Resour. Res. 1992, 28, 1657–1668. [Google Scholar] [CrossRef]
  32. McMahon, P.B.; Chapelle, F.H. Redox processes and water quality of selected Principal Aquifer systems. Ground Water 2008, 46, 259–271. [Google Scholar] [CrossRef] [PubMed]
  33. McMahon, P.B.; Cowdery, T.K.; Chapelle, F.H.; Jurgens, B.C. Redox Conditions in Selected Principal Aquifers of the United States; U.S. Geological Survey: Lakewood, CO, USA, 2009; p. 6.
  34. Kumar, A.R.; Riyazuddin, P. Seasonal variation of redox species and redox potentials in shallow groundwater: A comparison of measured and calculated redox potentials. J. Hydrol. 2012, 444–445, 187–198. [Google Scholar] [CrossRef]
  35. Datry, T.; Malard, F.; Gibert, J. Dynamics of solutes and dissolved oxygen in shallow urban groundwater below a stormwater infiltration basin. Sci. Total Environ. 2004, 329, 215–229. [Google Scholar] [CrossRef] [PubMed]
  36. Von Rohr, M.R.; Hering, J.G.; Kohler, H.-P.E.; von Gunten, U. Column studies to assess the effects of climate variables on redox processes during riverbank filtration. Water Res. 2014, 61, 263–275. [Google Scholar] [CrossRef] [PubMed]
  37. Greskowiak, J.; Prommer, H.; Massmann, G.; Johnston, C.D.; Nützmann, G.; Pekdeger, A. The impact of variably saturated conditions on hydrogeochemical changes during artificial recharge of groundwater. Appl. Geochem. 2005, 20, 1409–1426. [Google Scholar] [CrossRef]
  38. Vaughan, K.L.; Rabenhorst, M.C.; Needelman, B.A. Saturation and temperature effects on the development of reducing conditions in soils. Soil Sci. Soc. Am. J. 2009, 73, 663. [Google Scholar] [CrossRef]
  39. Tesoriero, A.J.; Puckett, L.J. O2 reduction and denitrification rates in shallow aquifers. Water Resour. Res. 2011, 47. [Google Scholar] [CrossRef]
  40. Fan, A.M.; Steinberg, V.E. Health implications of nitrate and nitrite in drinking water: An update on methemoglobinemia occurrence and reproductive and developmental toxicity. Regul. Toxicol. Pharmacol. 1996, 23, 35–43. [Google Scholar] [CrossRef] [PubMed]
  41. Spalding, R.F.; Exner, M.E. Occurrence of nitrate in groundwater—A Review. J. Environ. Qual. 1993, 22, 392–402. [Google Scholar] [CrossRef]
  42. Gurdak, J.J.; Qi, S.L. Vulnerability of recently recharged groundwater in principle aquifers of the United States to nitrate contamination. Environ. Sci. Technol. 2012, 46, 6004–6012. [Google Scholar] [CrossRef] [PubMed]
  43. California Stormwater Quality Association (CASQA). Stormwater Best Management Practice Handbook: New Development and Redevelopment; California Stormwater Quality Association: Menlo Park, CA, USA, 2003; p. 378. [Google Scholar]
  44. Clifton, H.E.; Hunter, R.E.; Gardner, J.V. Analysis of eustatic, tectonic, and sedimentologic influences on transgressive and regressive cycles in the Upper Cenozoic Merced Formation, San Francisco, California. In New Perspectives in Basin Analysis; Kleinspehn, K.L., Paola, C., Eds.; Springer: New York, NY, USA, 1988; pp. 109–128. [Google Scholar]
  45. Nzewi, O.; Gilman, J.A.; Bartow, G. 2009 Annual Groundwater Monitoring Report, Westside Basin; San Francisco Public Utilities Commission: San Francisco, CA, USA, 2010. [Google Scholar]
  46. Precision Measurement Engineering (PME). miniDOT User’s Manual; Precision Measurement Engineering: Vista, CA, USA, 2014. [Google Scholar]
  47. National Oceanic and Atmospheric Administration (NOAA). National Centers for Environmental Information. Available online: https://www.ncdc.noaa.gov/ (accessed on 13 May 2016).
  48. Pazwash, H. Urban Storm Water Management; CRC Press, Taylor & Francis Group: Florence, KY, USA, 2011. [Google Scholar]
  49. Heckathorn, H.A.; Gibs, J. Sediment Oxygen Demand in the Saddle River and Salem River Watersheds, New Jersey, July–August 2008; U.S. Geological Survey: Reston, VA, USA, 2010; p. 10.
  50. Wilson, T.P. In-Situ Sediment Oxygen Demand Rates in Hammonton Creek, Hammonton, New Jersey, and Crosswicks Creek, near New Egypt, New Jersey, August–October 2009; U.S. Geological Survey: Reston, VA, USA, 2014; p. 18.
  51. Danfoura, M.N. Effects of Low Impact Development Design on Redox Dynamics in the Vadose Zone and Urban Groundwater. Master’s Thesis, San Francisco State University, San Francisco, CA, USA, 2015. [Google Scholar]
  52. Appleyard, S.J. Impact of stormwater infiltration basins on groundwater quality, Perth metropolitan region, Western Australia. Environ. Geol. 1993, 21, 227–236. [Google Scholar] [CrossRef]
  53. Sansalone, J.J.; Hird, J.P.; Cartledge, F.K.; Tittlebaum, M.E. Event-Based Stormwater Quality and Quantity Loadings from Elevated Urban Infrastructure Affected by Transportation. Water Environ. Res. 2005, 77, 348–365. [Google Scholar] [CrossRef] [PubMed]
  54. Datry, T.; Malard, F.; Vitry, L.; Hervant, F.; Gibert, J. Solute dynamics in the bed sediments of a stormwater infiltration basin. J. Hydrol. 2003, 273, 217–233. [Google Scholar] [CrossRef]
  55. Brady, N.C.; Weil, R.R. The Nature and Property of Soils; Prentice Hall: Upper Saddle River, NJ, USA, 2001. [Google Scholar]
  56. McMahon, P.B.; Böhlke, J.K.; Kauffman, L.J.; Kipp, K.L.; Landon, M.K.; Crandall, C.A.; Burow, K.R.; Brown, C.J. Source and transport controls on the movement of nitrate to public supply wells in selected principal aquifers of the United States. Water Resour. Res. 2008, 44. [Google Scholar] [CrossRef]
  57. Böhlke, J.K.; Wanty, R.; Tuttle, M.; Delin, G.; Landon, M. Denitrification in the recharge area and discharge area of a transient agricultural nitrate plume in a glacial outwash sand aquifer, Minnesota. Water Resour. Res. 2002, 38. [Google Scholar] [CrossRef]
  58. McMahon, P.B.; Böhlke, J.K.; Christenson, S.C. Geochemistry, radiocarbon ages, and paleorecharge conditions along a transect in the central High Plains aquifer, southwestern Kansas, USA. Appl. Geochem. 2004, 19, 1655–1686. [Google Scholar] [CrossRef]
Figure 1. (a) Map showing the location of the San Francisco State University (SFSU) low impact development (LID) research network; and (b) the Westside Basin aquifer, which is part of the California Coastal Basin aquifers. The aquifer location data are modified from the California Department of Water Resources and the U.S. Geological Survey. Photographs of the infiltration trench from: (c) aerial view; and (d) zoomed-in view are modified from Newcomer et al. 2014 [27].
Water 08 00435 g001
Figure 2. Schematic depiction (not to scale) of the instrumentation and core locations along the longitudinal cross-section A–A’ (inset) of the infiltration trench site at San Francisco State University (SFSU) low impact development (LID) research network. Modified from Newcomer et al. 2014 [27].
Water 08 00435 g002
Figure 3. Hourly time series of precipitation (mm), water levels (cm), temperature (°C), and conductivity (μS/cm) in piezometers 1, 2, and 3 during the period of observation (July 2012 to July 2014).
Water 08 00435 g003
Figure 4. Hourly time series of precipitation (mm) and saturation of gravel (%) for piezometers 1, 2, and 3 during the rainy season of: (a,b) 2012–2013; and (c,d) 2014.
Water 08 00435 g004
Figure 5. Hourly time series of saturation of gravel (%) (red line), dissolved oxygen (DO) concentration (mg·L‒1) (blue line), and precipitation (mm) (gray line) for: (a) piezometer 1; and (b) piezometer 3 for 24 February to 5 April 2014. The dashed line at 39% saturation of gravel is the depth of the DO sensor. Saturation of gravel data are missing for 29 March to 5 April 2014.
Water 08 00435 g005
Figure 6. Average and minimum dissolved oxygen (DO) concentration (mg·L‒1) at: (a) piezometer 1; and (b) piezometer 3 as a function of duration of saturation (days) for six precipitation events between February and June 2014 (Table 1). Note that several of the DO measurements are below the MiniDOT reporting level of 0.3 mg/L (10 μmol/L).
Water 08 00435 g006
Figure 7. Hourly time series of precipitation (mm) (gray line), dissolved oxygen (DO) concentration (mg·L‒1) (blue line), and water temperature (°C) (red line) for: (a) piezometer 1; and (b) piezometer 3 for 25 February to 2 April 2014. The numbers above and below the temperature time series are the water temperatures for that particular storm event.
Water 08 00435 g007
Figure 8. Dissolved oxygen (DO) depletion curves for: (a) piezometer 1; and (b) piezometer 3 for three precipitation events in March 2014. The slope of the linear fit for each DO depletion curve (mg·L‒1·min‒1) is used to calculate the average slope of DO depletion curve for the LID infiltration trench.
Water 08 00435 g008
Table 1. Durations of saturation of gravel and dissolved oxygen (DO) concentrations for piezometers 1 and 3 during precipitation events February to April 2014. The standard error (SE) of the average is shown in parentheses. Note that MiniDOT reporting level for DI is 0.3 mg/L (10 μmol/L).
Precipitation EventTotal Rainfall (mm)Duration of Saturation of Gravel (Days)Dissolved Oxygen (DO) (mg·L−1)Average Temp. (°C)
Min.Avg. (SE)Max.
26 February–3 March 2014
piezometer 1545.240.132.78 (0.05)9.913.6
piezometer 35.160.103.12 (0.05)10.4112.9
3–4 March 2014
piezometer 15.31.991.775.06 (0.06)8.2213.4
piezometer 31.931.514.92 (0.07)10.1513.0
5–6 March 2014
piezometer 15.81.811.124.71 (0.06)8.8614.3
piezometer 31.633.095.76 (0.05)9.7914.2
25–26 March 2014
piezometer 1131.172.856.3 (0.07)9.2614.3
piezometer 31.115.688.04 (0.05)10.3913.2
29 March 2014
piezometer 1121.692.475.57 (0.06)8.8715.2
piezometer 31.640.103.1 (0.1)9.9914.8
4 April 2014
piezometer 16.42.141.235.16 (0.06)8.9613.8
piezometer 320.102.44 (0.08)10.212.8
Table 2. Zero-order rates of oxygen reduction, LIDODT, and LIDOD20 for piezometers 1 and 3 during precipitation events February to April 2014.
Precipitation EventTotal Rainfall (mm)Average Temp. (°C)Zero-Order Reaction Rates (−K0)LIDODTLIDOD20
(mg·L−1·min−1)(mg·L−1·h−1)(mg·m−3·min−1)(mg·m−3·min−1)
26 February 26–3 March 2014
piezometer 154--0.0030.15----
piezometer 30.0030.18----
3–4 March 2014
piezometer 15.313.00.0030.191.482.23
piezometer 30.0030.161.802.80
5–6 March 2014
piezometer 15.814.20.0040.251.842.63
piezometer 30.0030.181.522.20
25–26 March 2014
piezometer 11312.60.0030.172.493.59
piezometer 30.0050.271.832.81
29 March 2014
piezometer 112--0.0020.10----
piezometer 30.0020.12----
4 April 2014
piezometer 16.4--0.0030.16----
piezometer 30.0030.20----

