
Impact Analysis of Lakefront Land Use Changes on Lake Area in Wuhan, China

School of Hydropower and Information Engineering, Huazhong University of Science and Technology, Wuhan 430074, China
*
Author to whom correspondence should be addressed.
Water 2015, 7(9), 4869-4886; https://doi.org/10.3390/w7094869
Submission received: 22 June 2015
/
Revised: 26 August 2015
/
Accepted: 26 August 2015
/
Published: 8 September 2015
Abstract
:Wuhan, the central city in the middle reach of the Yangtze River of China, is famous for its lake resources. However, the city’s lake area decreased by 37.4% from 1991 to 2005. This study aims to analyze the relationships between lake area reduction and lakefront land use changes in Wuhan. In this paper, the connections between the spatial changes of lake areal extent and land use changes in the lakefront were established with mathematical models such as Moran’s I and spatial analysis models such as transition matrix. Regarding the impacts of lakefront land use changes on lake area in the urban and suburban districts of Wuhan City, it can be concluded that: (1) the loss rate of lake area would be increased if the proportions of lakefront land use changes transformed into developed or agricultural land from other land use categories became higher; (2) the higher spatial autocorrelation of lakefront land use classifications (Moran’s I > 0.25) could be an indicator for the loss rate of lake area in urban district of the city; and (3) the vector sum of lakefront land use changes was related to the displacement of lake center.

1. Introduction
Lakes are very precious freshwater resources. Urban lakes, especially, are quite different from others: they can supply domestic water to residents, provide habitat for fish and waterfowls, and regulate the urban environment (e.g., humidity, temperature, and O2-CO2 exchange) [1,2,3,4,5]. Moreover, urban lakes can enhance a city’s flood storage capability [6]. Lake water environment would lead to the spatial differentiation of the urban system [7]. On the other hand, urban lakes are more vulnerable to urbanization and human activities than other natural lakes. These impacts on urban lakes are mainly reflected in problems such as lake area decreasing and water pollution [8,9,10]. In recent years, most studies of urban lakes have focused on the water environment of lakes [11,12,13,14]. In addition, a few studies monitored the changes in lake area due to urban expansion [15,16,17]. In recent studies, remotely sensed images have been widely used to extract the lake surface [18] so that changes in lake area could be acquired from the images in different periods. For instance, in Wuhan, the total lake area in 2005 was 37.4% less than it was in 1991. Although some investigations have discovered that the main reason of lake area reduction is lake infill [19,20,21], there is still a lack of quantitative relationships between lake area changes and human activities. In terms of land resources, human activities or urban development could be represented by land use and land cover change (LUCC). In particular, the proportion of developed land (e.g., residential, commercial, and industrial land use) would be increased, and agricultural land (e.g., farmland) would be reduced in urban districts. Land use change has been studied extensively. Most of the previous studies have paid attention to the fringes of cities to simulate and predict urban expansion through remote sensing (RS) and geographical information systems (GIS) [22,23,24]. Some researchers have assessed the influences of land use changes on climate and analyzed the environmental problems caused by human activities, and then optimized the spatial allocation of resources [25,26,27].
In recent years, a number of studies have proved that there are significant effects of land use changes on urban lakes and other urban water bodies [28,29,30,31]. Some of these effects, such as lake infill, could even be unrecoverable and irreversible [32,33].
In spite of the above achievements, there are still some shortages in the research about urban lake area changes with LUCC. Firstly, the relationships between lake area and land use changes were qualitatively described, without quantitative analysis. Secondly, the studied area in previous studies was usually a watershed instead of a city [34,35]. Finally, the land uses in the studied area were often considered as a uniform category and therefore their spatial differentiations with location were usually ignored [36].
In order to solve these problems, by integrating the spatial information technology such as RS and GIS, this paper tries to quantitatively analyze the impacts of lakefront land use changes on lake area in Wuhan, China. The aims of this paper are to: (1) detect lake areal extents and extract land use classifications from Landsat TM/ETM+ remotely sensed images, (2) model the spatial correlation of lake area and land use changes with GIS, and (3) show the major relationships between lake area reductions and land use changes in the lakefront zones. Xiang [37] has proved that the desirable buffer widths range from a minimum of 7.9 m to a maximum of as much as 176 m. Du [20] has compared the land use conversions resulting from urban expansion within the buffer zones of 10 m, 30 m, and 100 m. In this paper, lakefront zones of 100 m from the lake shorelines were delineated.
2. Materials and Methods
2.1. Study Area
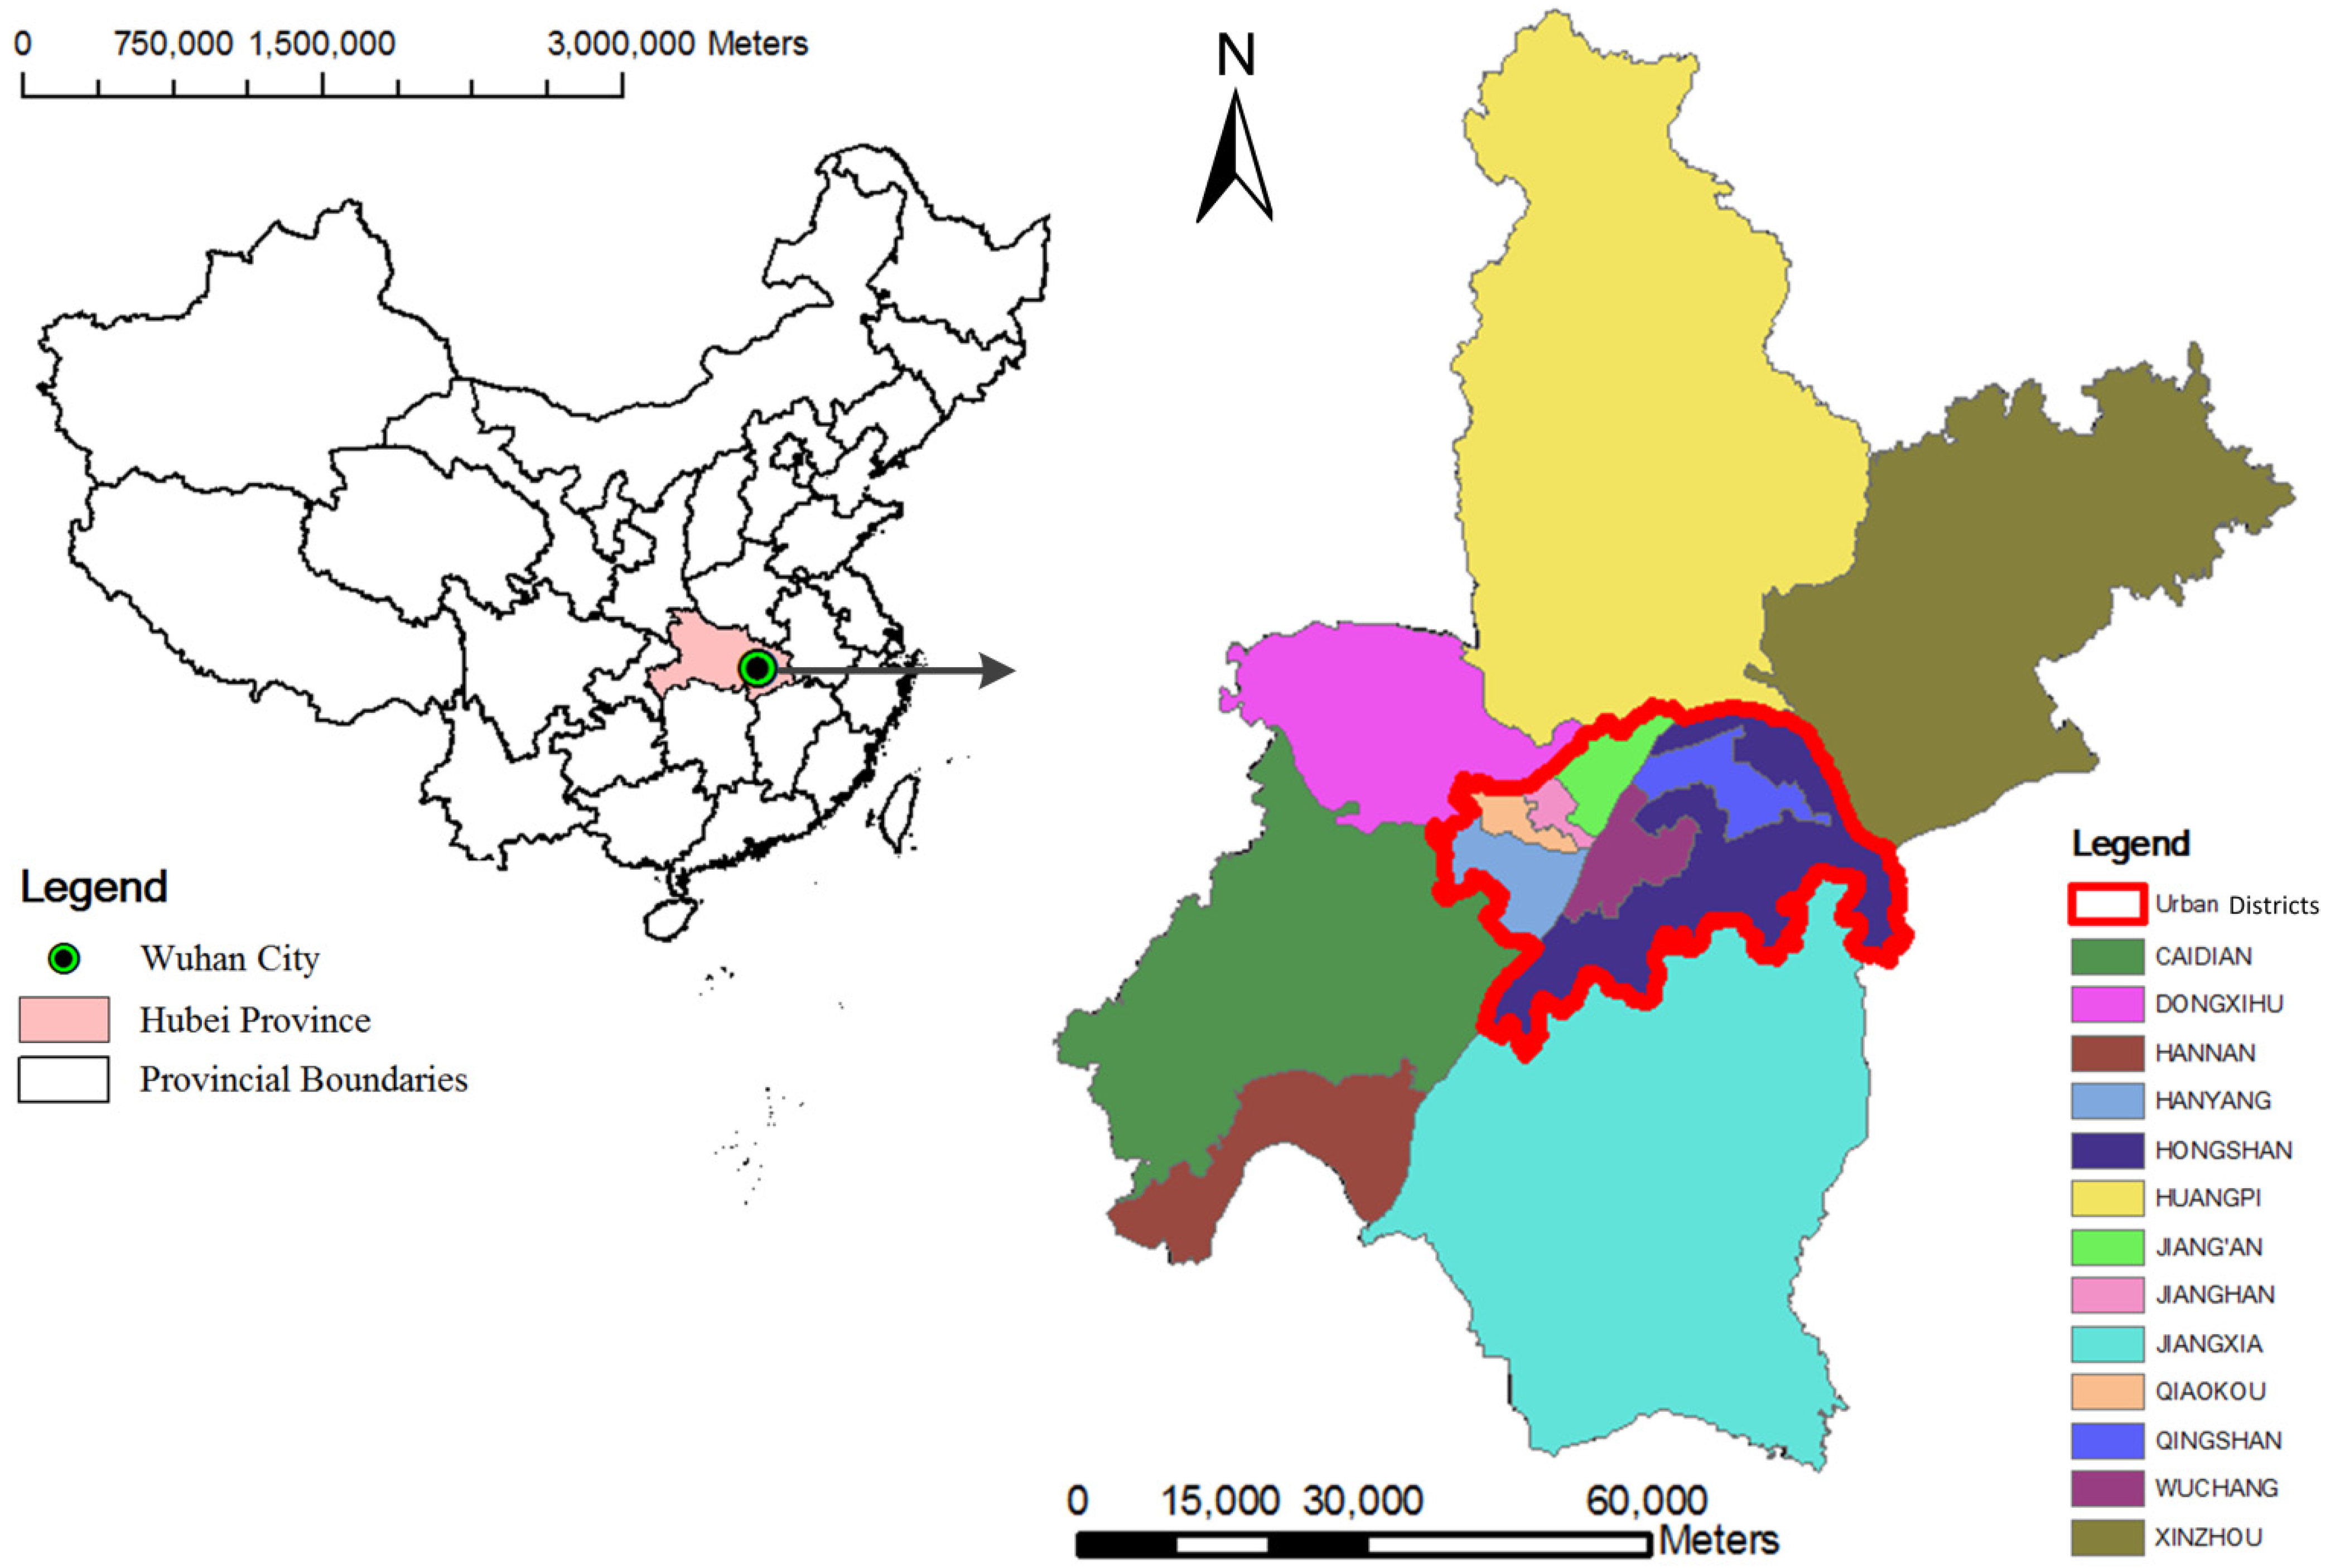
Wuhan, the capital city of Hubei Province, is located in the eastern Jianghan Plain of central China. The Yangtze River, the longest river in China, intersects its longest tributary, the Han River, at Wuhan. Wuhan has a subtropical monsoon climate with abundant rainfall and four distinctive seasons. There are plentiful freshwater resources, with over 166 lakes. For this reason, Wuhan is well known as the City of Hundreds of Lakes.
Wuhan has always been one of the largest cites in China and also the central city in the middle reach of the Yangtze River. The jurisdiction area is 8494.14 km2. As of 2005, the total population was over 8,580,000 [38]. There are 13 districts in the city, among which seven (Jiang’an, Jianghan, Qiaokou, Hanyang, Wuchang, Qingshan, and Hongshan) are known as urban districts; the remaining six are classified as suburban districts (Figure 1). Urban districts form 10% of the total jurisdiction area and have 62% of total population (as of 2005). Accordingly, the average population density in urban districts is 5984 persons/m2, much more than the figure of 429 persons/m2 in suburban districts.
Figure 1.
Location and administrative division of Wuhan City.
Since the 1990s, the proportion of urban population in Wuhan has been growing rapidly, with a level high (62%) above the national average (43%). Urbanization has compressed the space of urban lakes. Unrestrained human activities such as filling in the lake have resulted in lake area reduction or even lake disappearance. A statistical report on the lakes in Wuhan suggests that 89 lakes have vanished completely since the 1950s [39].
In this paper, the lake area and land use classifications of Wuhan City are extracted from Landsat TM/ETM+ remotely sensed images both in 1991 and 2005 (Table 1). During this period, the development of Wuhan was extremely rapid; however, the legislation for protection of the lake was not perfect yet. Meanwhile, these two years of images were both acquired in summer, which is the flood season of the city. According to the data from the National Climate Center of China, the accumulated precipitation before the image acquisition in 1991 and 2005 was 872 mm and 816 mm, respectively [40], which showed that there was a similar rainfall condition in these two years, and therefore the impacts resulting from climate change, such as flood and drought, on the lake area could be largely ignored. In addition, during this period, hydroelectric dams had not been constructed and potable-water requirements from lakes had not greatly changed in Wuhan. So it could be thought that the lake area reductions during this period were mostly caused by human activities like land use changes.

| Date | Sensor | Spatial Resolution |
|---|---|---|
| 19 July 1991 | TM | Bands 1–5 and 7: 30 m |
| Band 6: 120 m | ||
| 11 September 2005 | ETM+ | Bands 1–5 and 7: 30 m |
| Band 6: 120 m | ||
| Band 8: 15 m |
2.2. Extraction of Lake Areal Extent and Land Use Classification
Normalized Difference Water Index (NDWI) is usually used to detect water bodies. However, practices have indicated that NDWI could confuse water bodies with constructions in urban districts because both of them have similar spectral characteristics on Band 2 and Band 4 of Landsat TM/ETM+ remotely sensed image. Thus a modified NDWI (MNDWI) method has been introduced to replace the NDWI method [41]. MNDWI is formed as:
where B2 and B5 are the pixel values of the second and fifth bands in the Landsat images, respectively.
As shown in Equation (1), Band 4 in NDWI is replaced by Band 5 because the water body has lower reflectivity in the mid-infrared band than construction. Therefore, MNDWI could effectively suppress the noise.
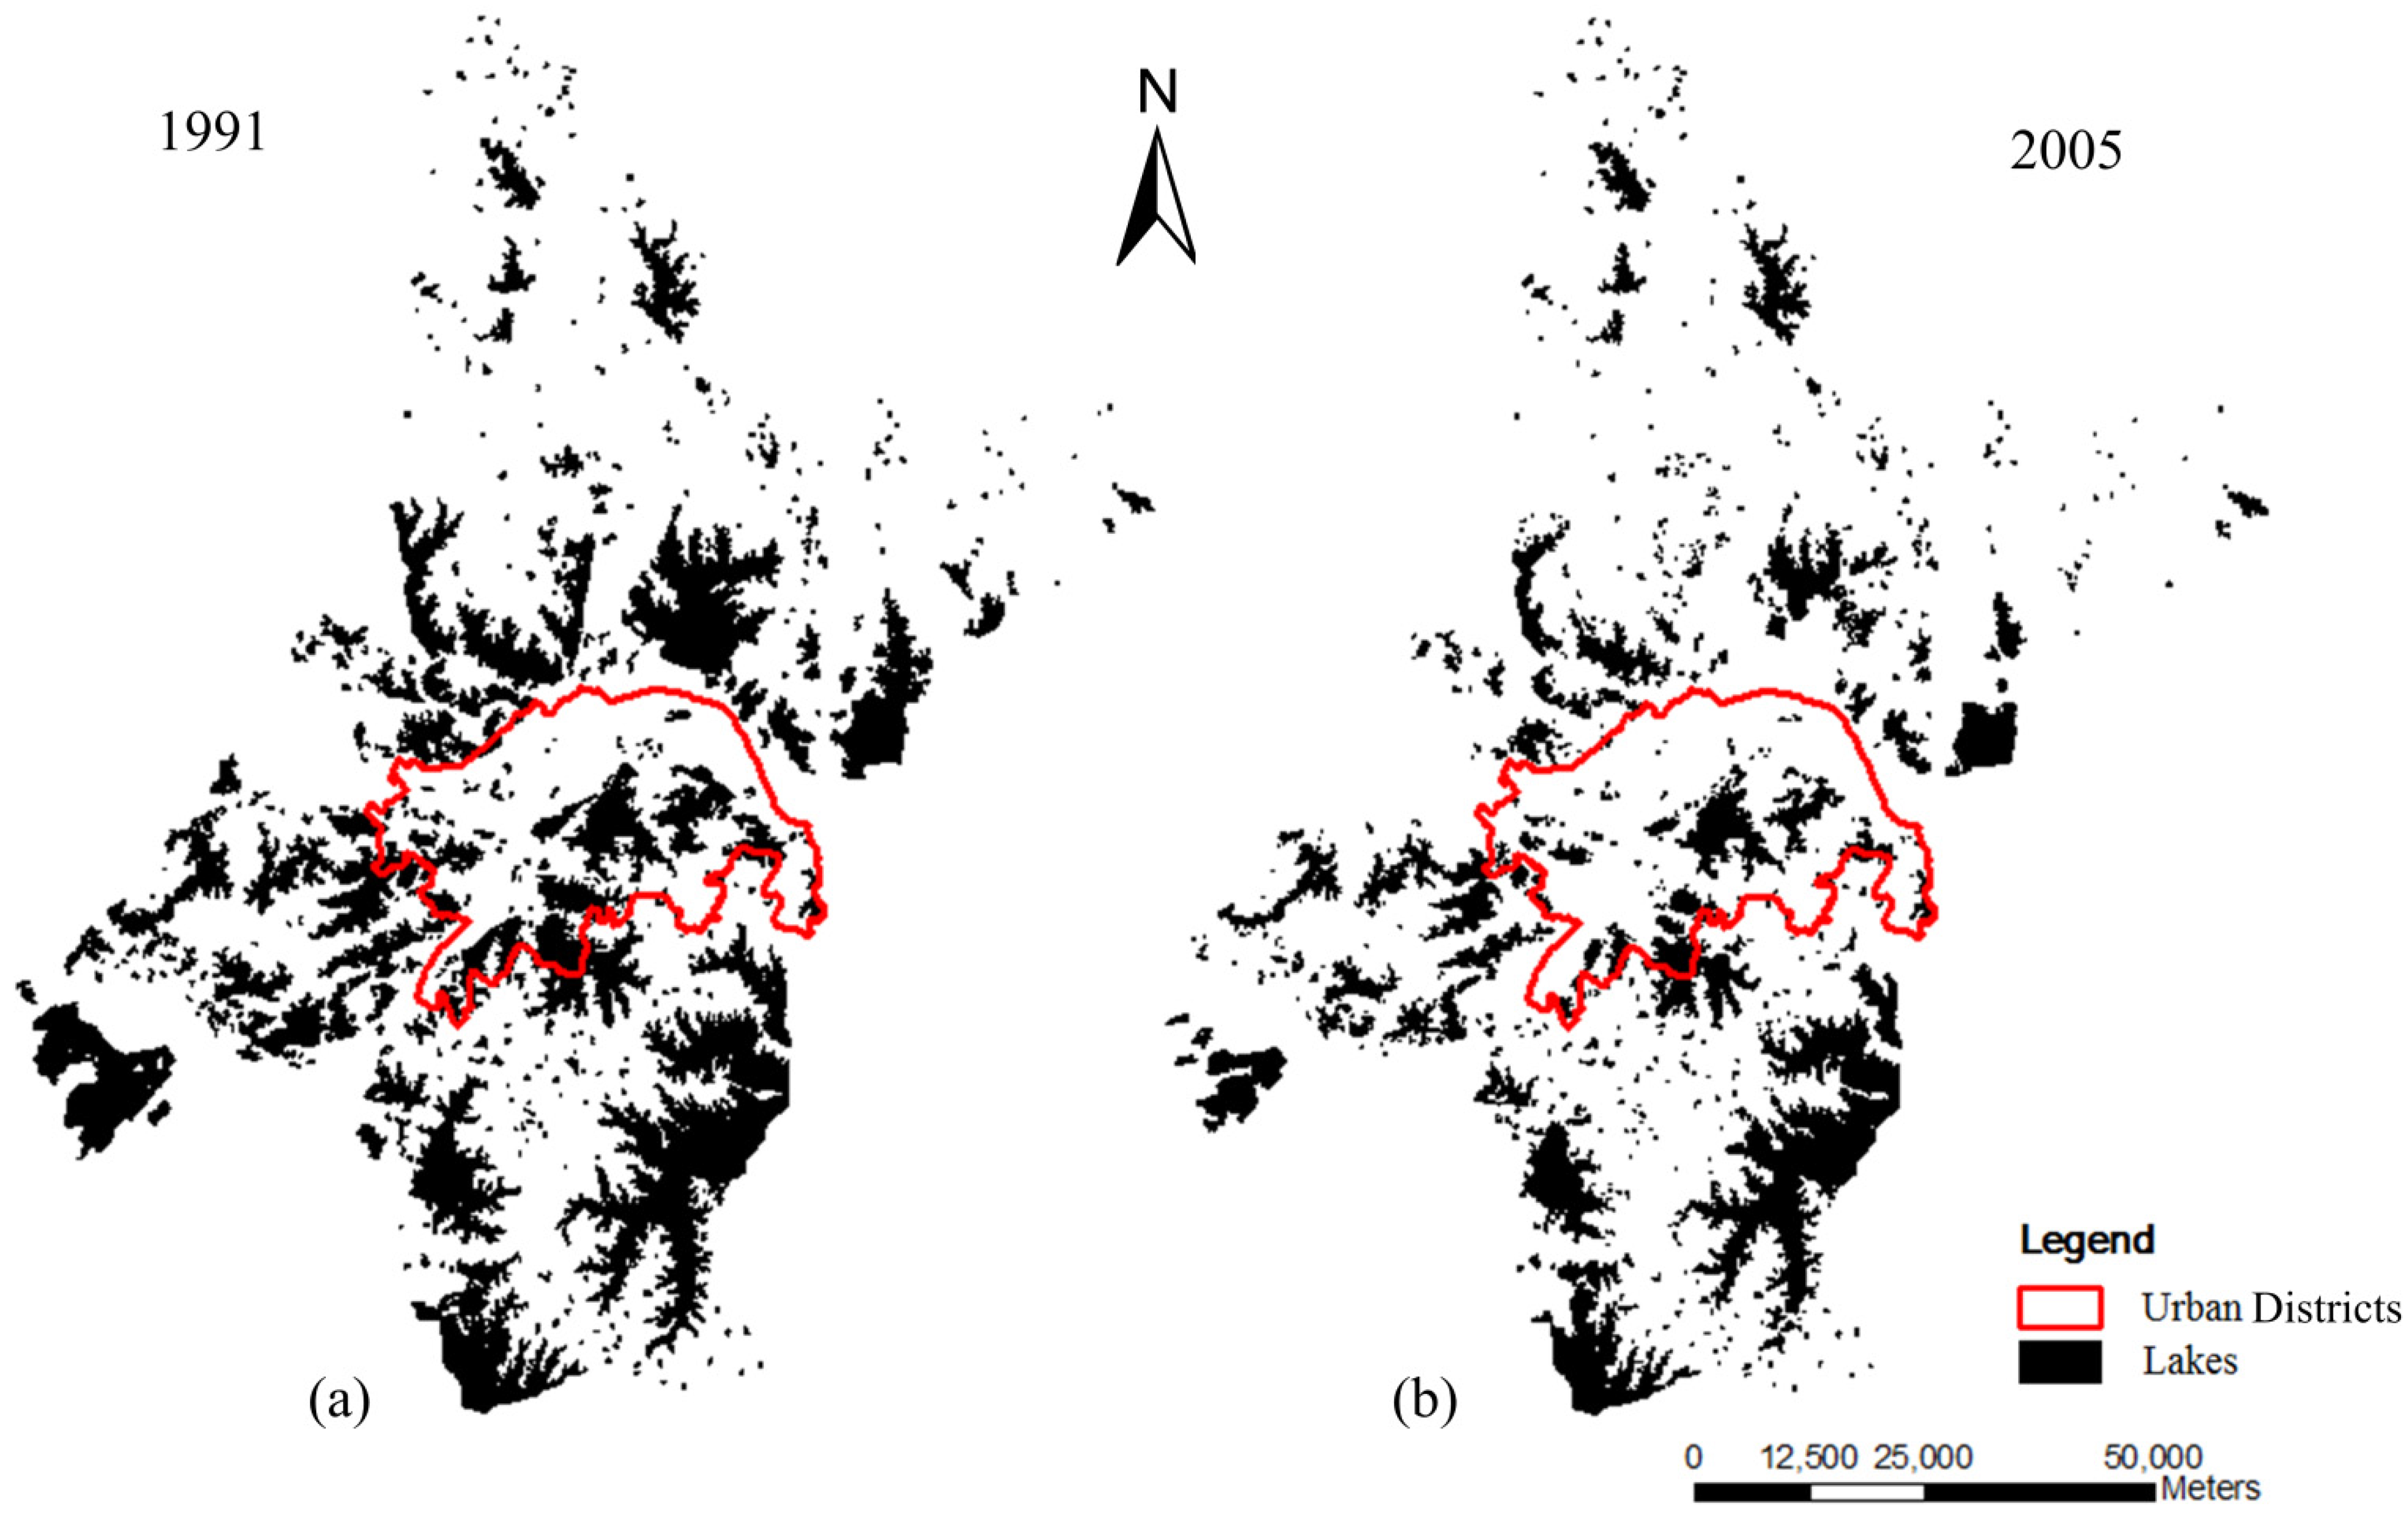
Lake water bodies of Wuhan City in 1991 and 2005 are extracted by adopting MNDWI (Figure 2). It is shown that the lake areas decreased significantly both in urban and suburban districts, and have been reduced by 37.4% in the whole city. It also seems that the losses of lake area tend to cluster in the central and southern parts of the city, where lake resources abound.
Figure 2.
Extracted lake water bodies of Wuhan in 1991 (a) and 2005 (b). The lake areas are reduced significantly both in urban (36.1%) and suburban (37.7%) districts.
Figure 2.
Extracted lake water bodies of Wuhan in 1991 (a) and 2005 (b). The lake areas are reduced significantly both in urban (36.1%) and suburban (37.7%) districts.

On the other hand, by adopting ISODATA, which is an unsupervised classification algorithm, the land uses are categorized into six types in this study (Table 2).
| ID | Category | Remarks |
|---|---|---|
| 1 | Water body | Surface water bodies: rivers, lakes, and ponds |
| 2 | Shallow water | Edge of water bodies: wetlands |
| 3 | Agricultural | Dry land and paddy fields |
| 4 | Vegetated | Nature forests and grasslands |
| 5 | Developed | Artificial areas: residential, commercial, and industrial areas |
| 6 | Bare | Bare surfaces: bare lands and construction sites |
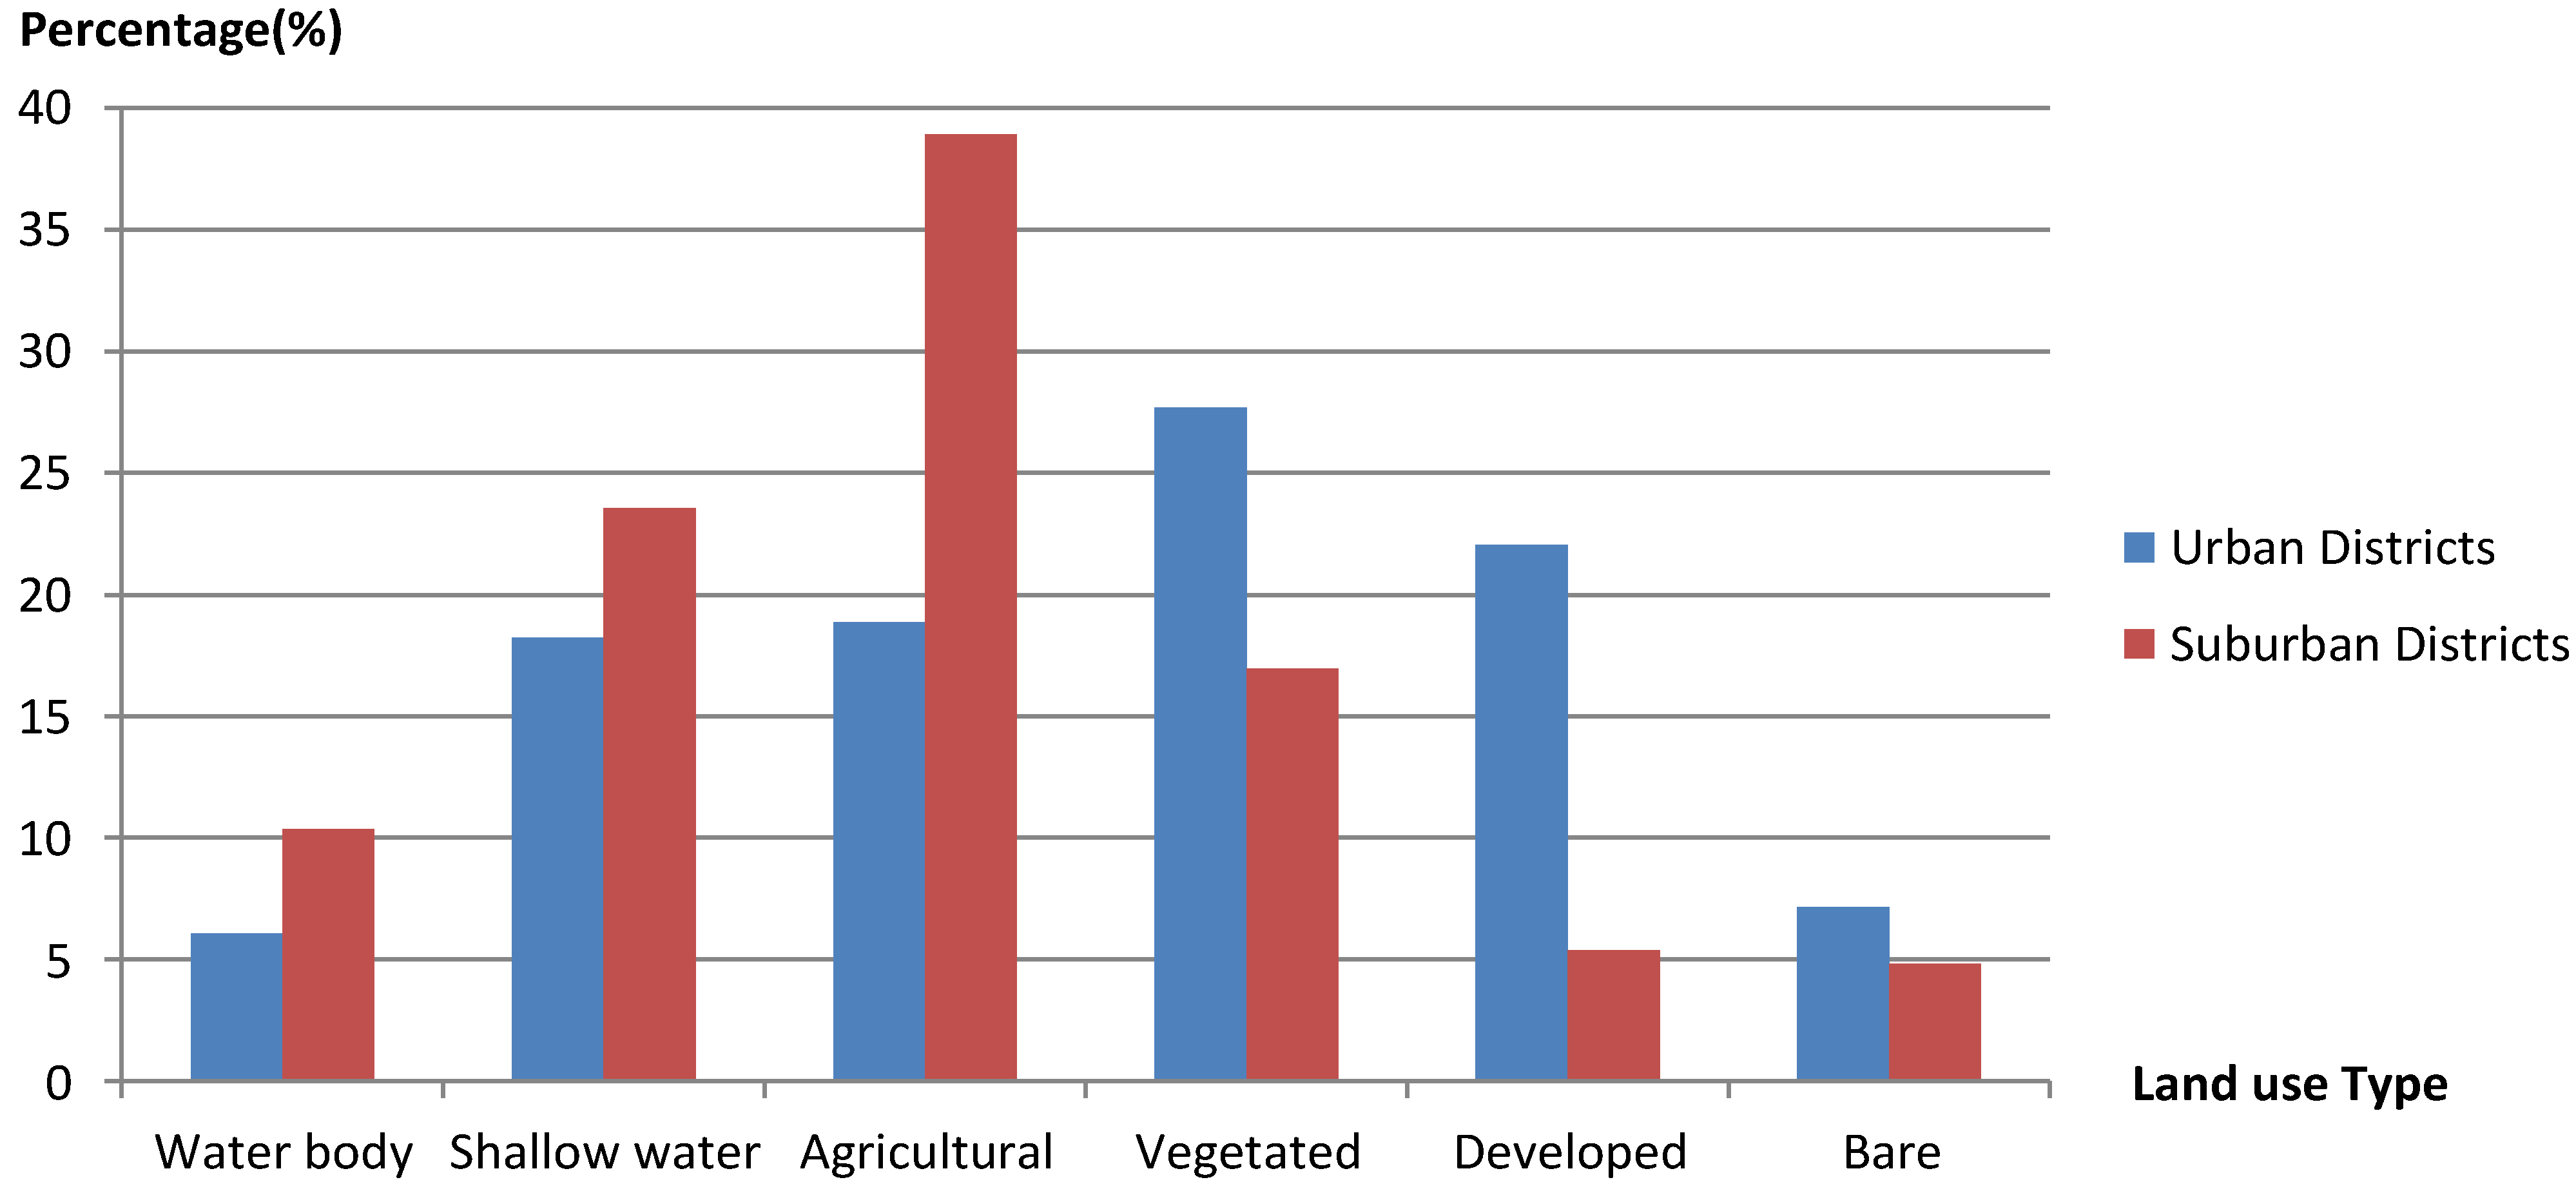
The percentages of each type of land use that have been transformed from the lost lake areas during the period of 1991 and 2005 of Wuhan are shown in Figure 3. In suburban districts, the proportions of agricultural land are considerably larger than those of other land use types. In urban districts, besides developed land, shallow water and vegetated land also have a greater proportion because some wetland parks are constructed to restore lake infill (e.g., Shahu Lake). Furthermore, the agricultural land in urban districts is distributed mainly over the transition zones of urban and suburban districts. Meanwhile, bare land is tiny, with no more than 10% both in urban and suburban districts. The lower proportions of bare land further suggest that the effect of climate factors (e.g., drought and flood) on lake area change is almost negligible.
Figure 3.
The percentages of each land use type transformed from the lost lake areas between 1991 and 2005 in urban and suburban districts of Wuhan.
Figure 3.
The percentages of each land use type transformed from the lost lake areas between 1991 and 2005 in urban and suburban districts of Wuhan.

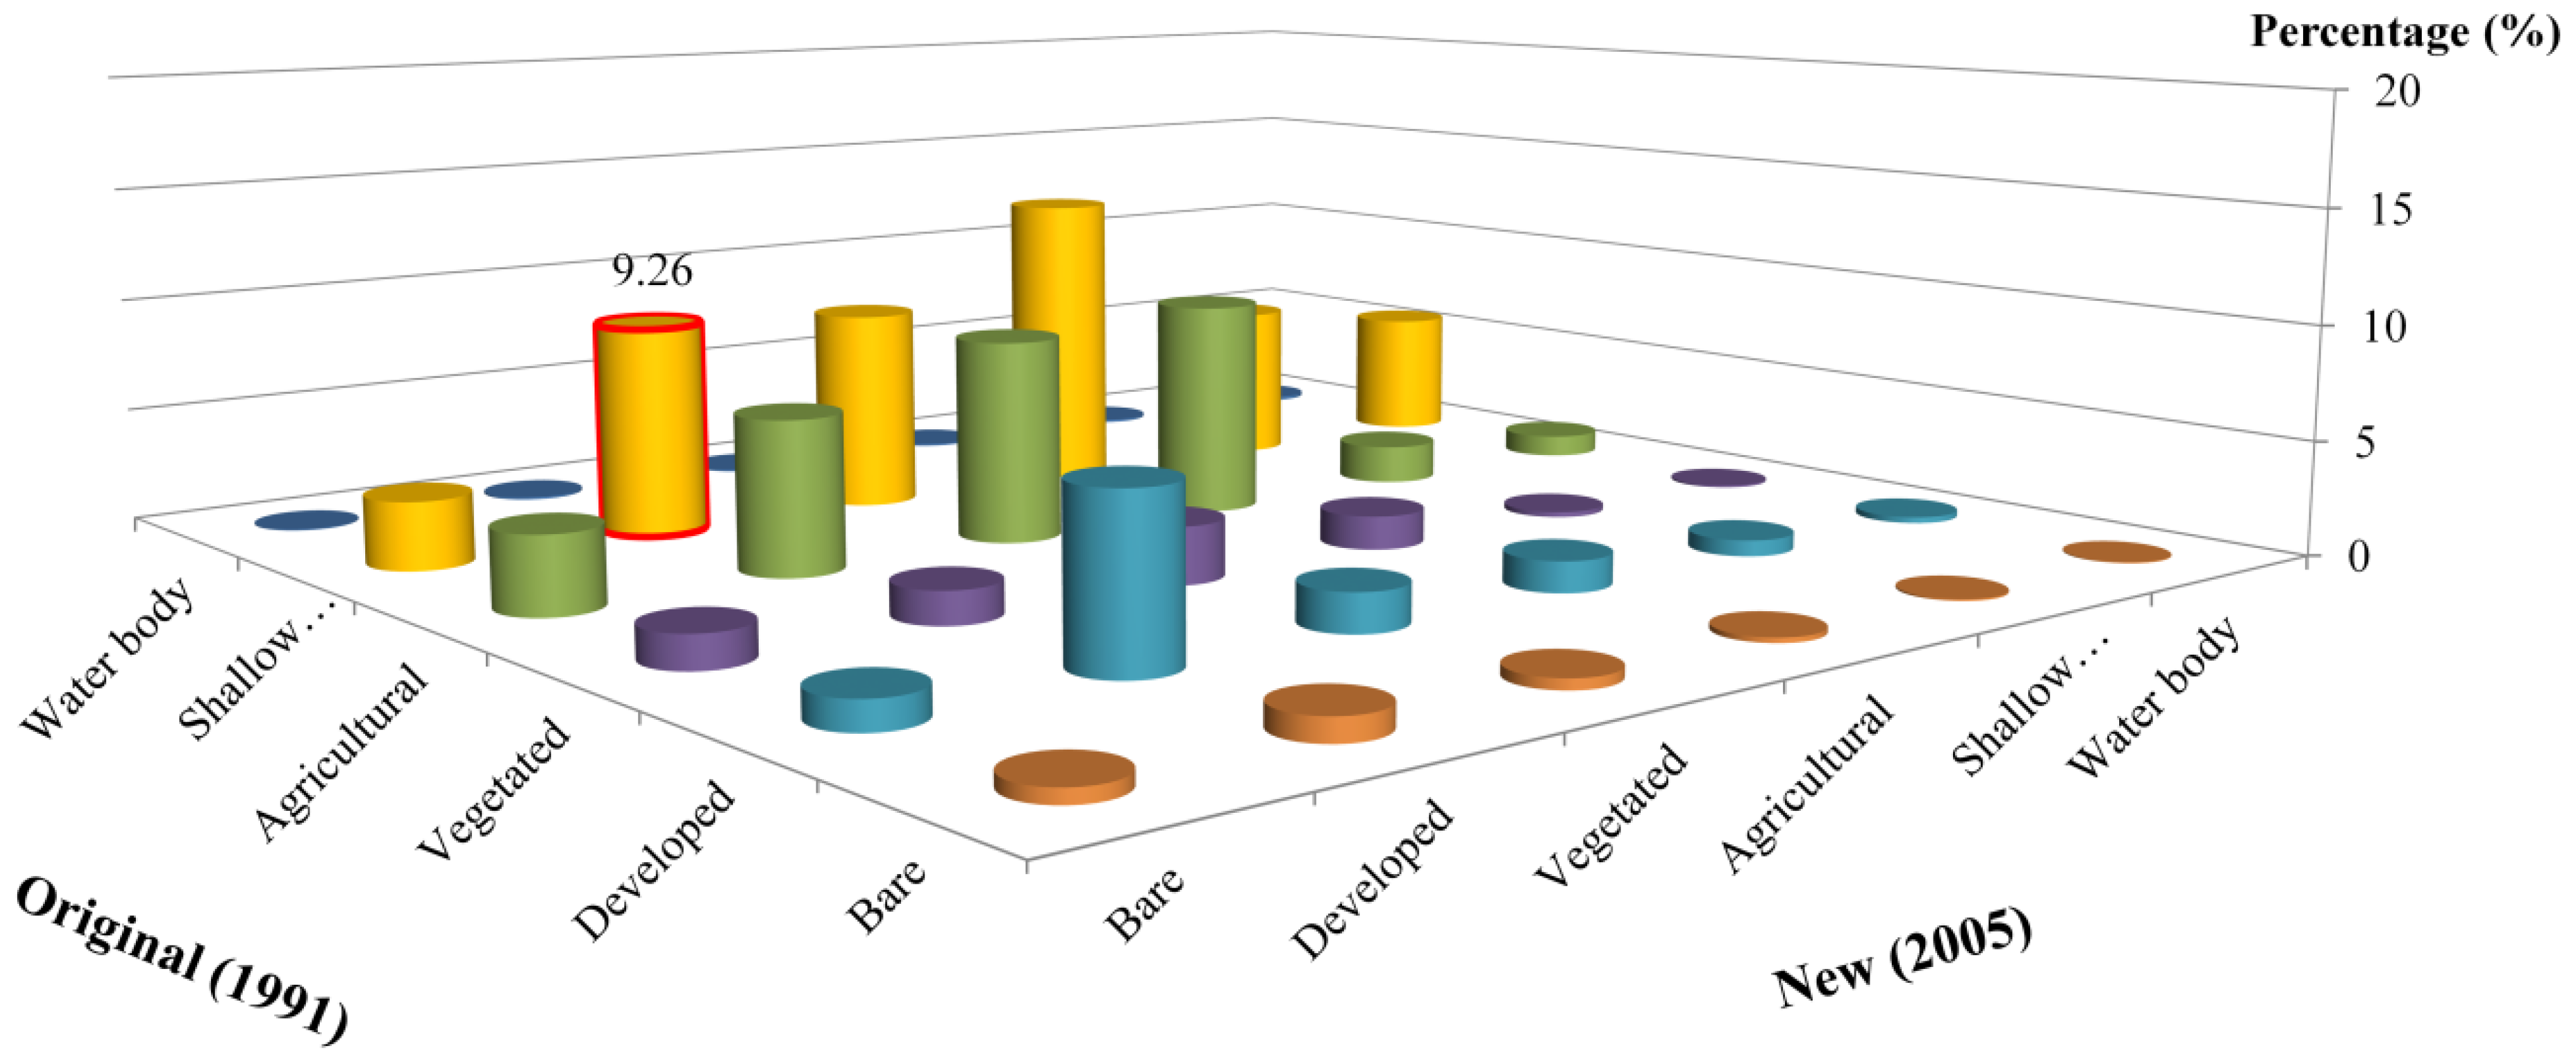
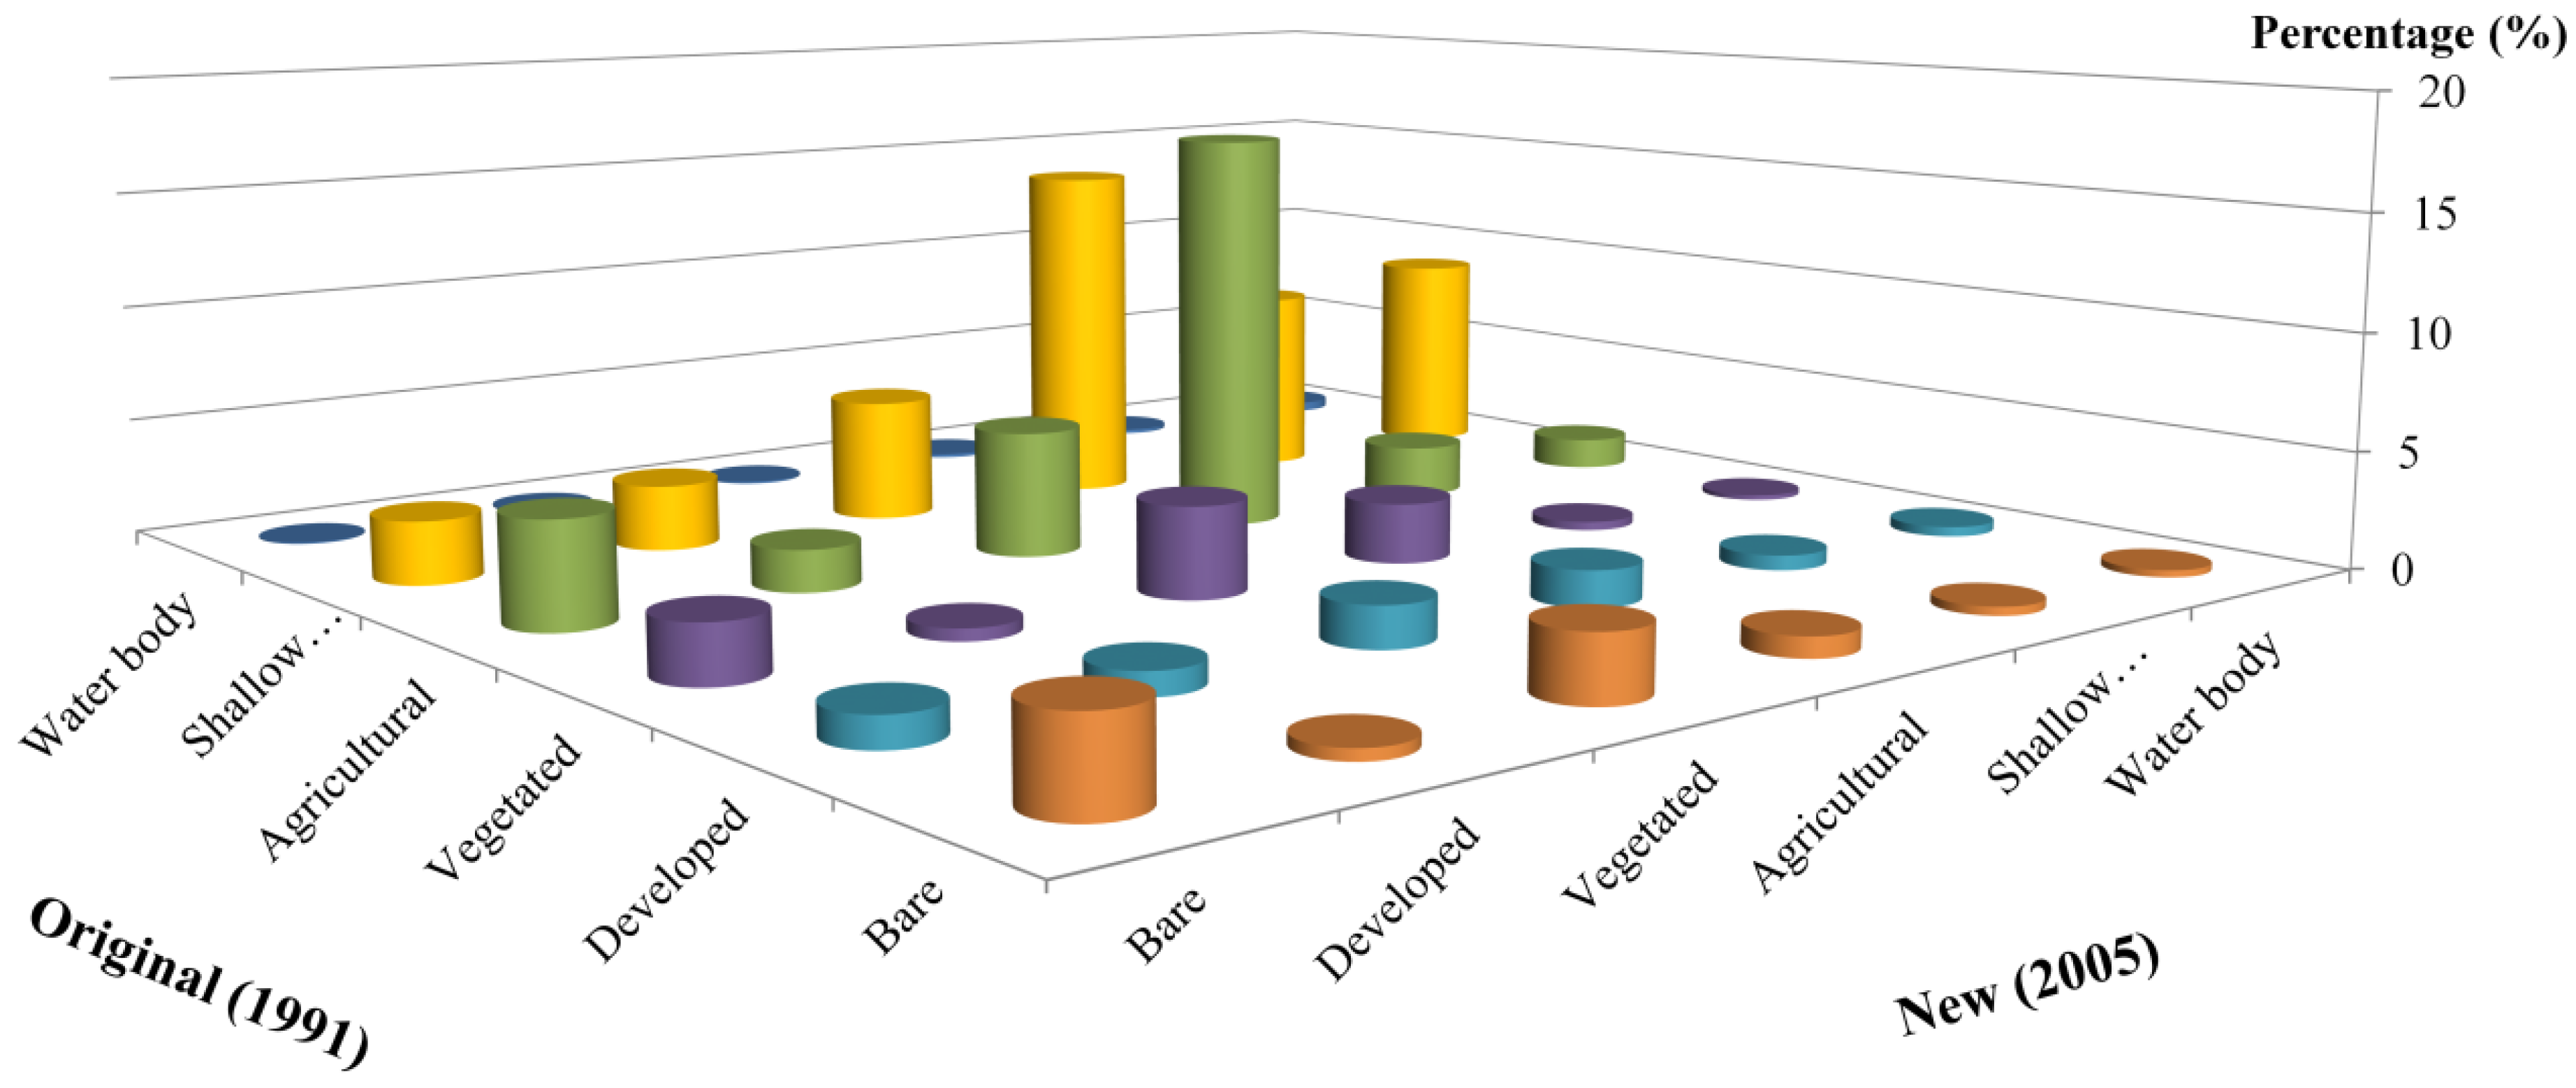
Figure 4 and Figure 5 quantitatively and visually show the transition matrixes of lakefront land use in urban and suburban districts, respectively, with cylinder graph. Between 1991 and 2005, shallow water was most likely to transform into other land types, both in urban and suburban districts. On the other hand, the land use changes transformed into developed and vegetated land in urban districts were clearly greater than those in suburban districts, where the primary outputs in transition matrix were agricultural land.
Figure 4.
The transition matrix of lakefront land use in urban districts of Wuhan between 1991 and 2005. The cylinder with the red border means that 9.26% (on percentage axis) of the shallow water in 1991 (on the original axis) has been transformed into developed land in 2005 (on the new axis) in the 100-m lakefront zones.
Figure 5.
The transition matrix of lakefront land use in suburban districts of Wuhan between 1991 and 2005.
Figure 5.
The transition matrix of lakefront land use in suburban districts of Wuhan between 1991 and 2005.

2.3. Expression of Lake Area and Land Use Changes
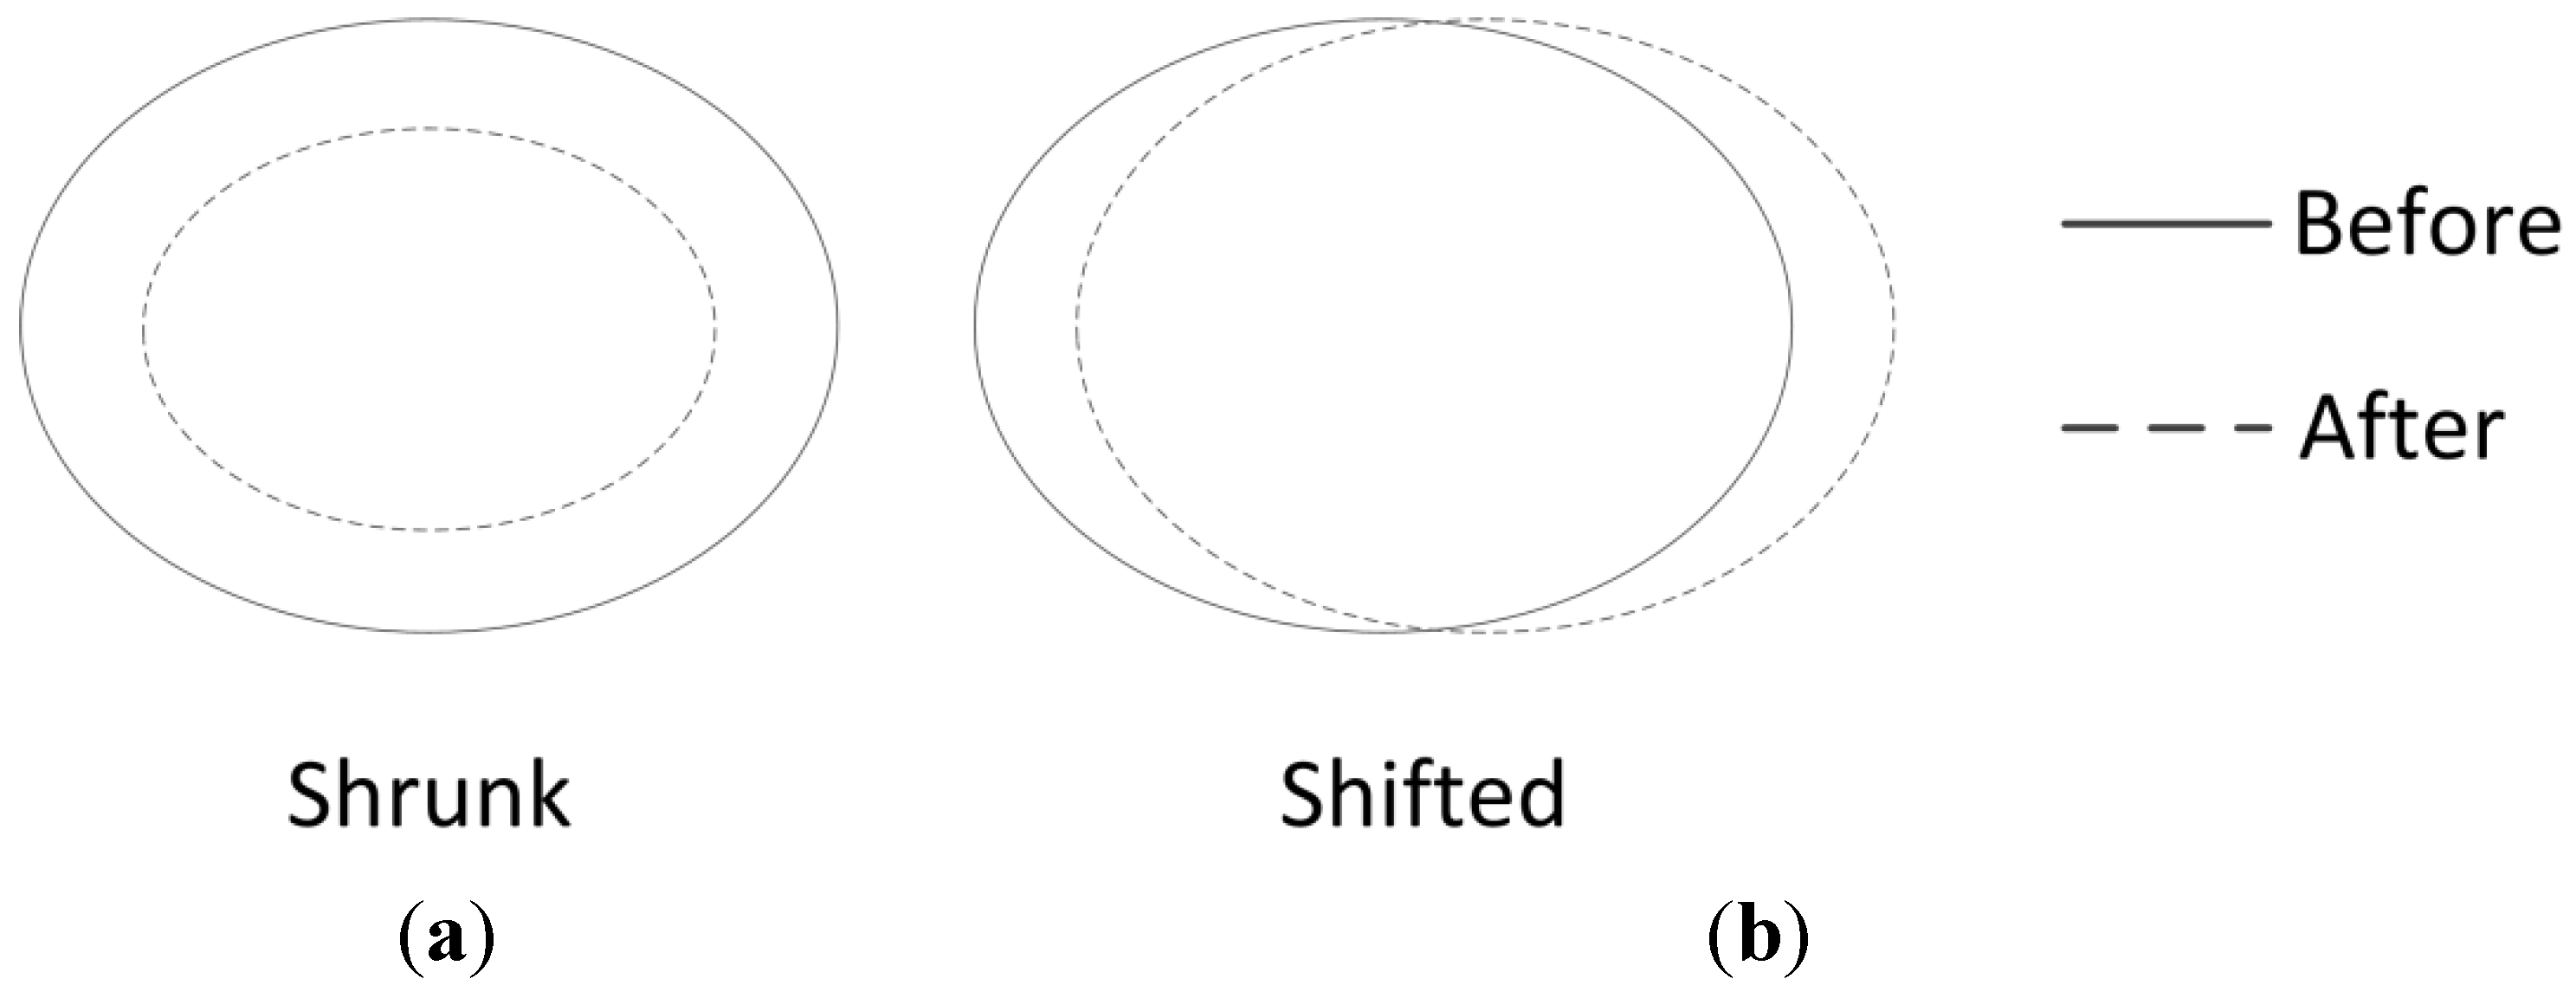
Although the area changes of lakes could be different from each other, they can be abstracted as some basic modes. Figure 6 shows two kinds of basic changes that could be used to combine more complex changes. The two fundamental elements include size (area) and center of the lake extent.
Figure 6.
Two basic changes of lake area. (a) shrunk—lake area is reduced, and the lake center has not been moved; (b) shifted—lake area is not changed, but its position has shifted.
Figure 6.
Two basic changes of lake area. (a) shrunk—lake area is reduced, and the lake center has not been moved; (b) shifted—lake area is not changed, but its position has shifted.

These two basic changes could be used to represent the loss rate and center displacement of lake area, respectively, in reality.
As shown in Table 1, land uses in Wuhan are categorized into six types. If each of them is represented by its corresponding number (1 to 6), land use changes between 1991 and 2005 could be expressed by a double-digit number, in which the first digit represents land use type in 1991, and the second digit represents land use type at the same location in 2005. As an example, the double-digit number 45 in a grid means that the land use type of this grid in 1991 was category 4 (vegetated land), and in 2005, the land use type of the same grid was category 5 (developed land). So, a set Tcan be used to express the land use changes Tas Equation (2):
where tij is the kind of land use change in set T, and i and j are the land use classifications in 1991 and 2005, respectively.
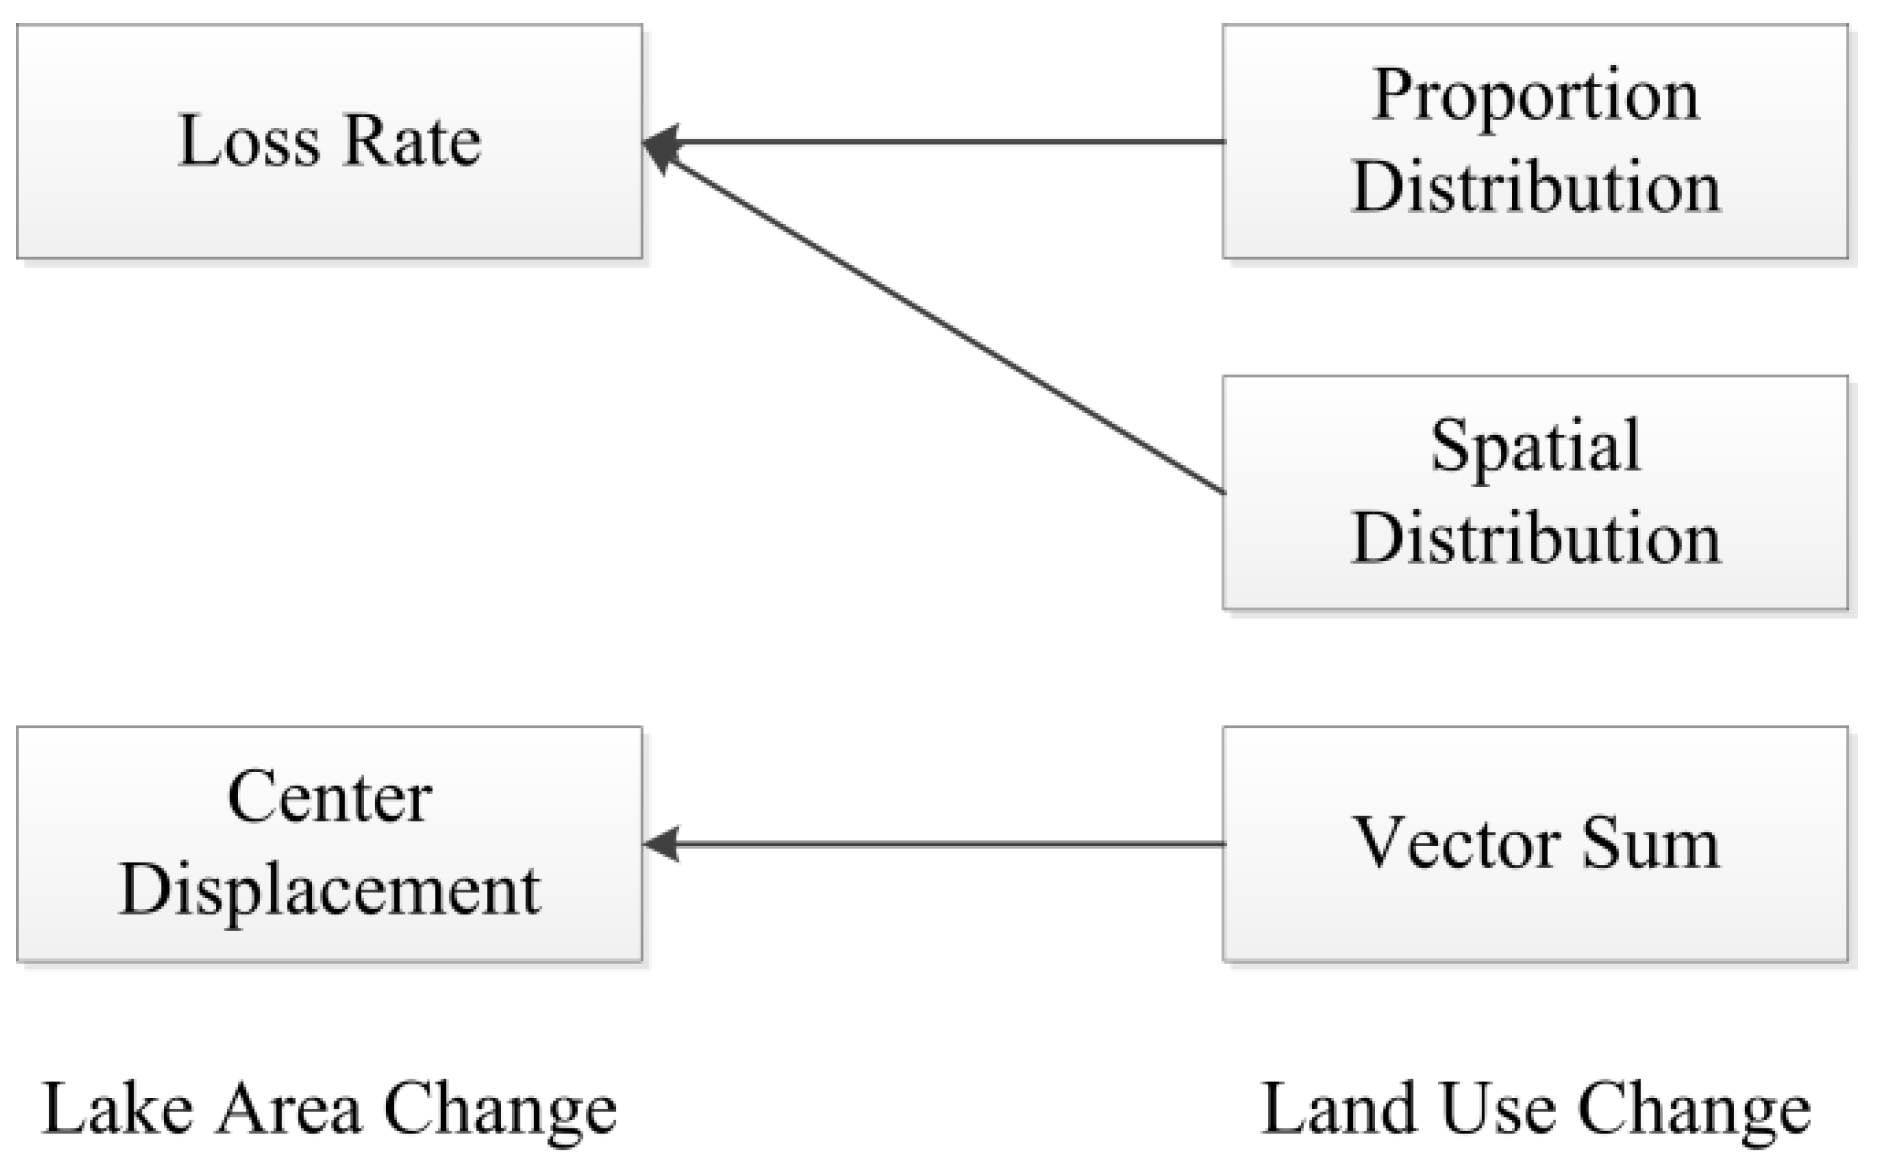
In order to describe the spatial distribution of land use changes in a certain buffer around the lakefront, three characteristics, the proportion, spatial distribution, and vector sum of each type of land use change in the buffer, were chosen in this paper. Accordingly, a series of relationships between lake area and lakefront land use changes can be established (Figure 7).
Figure 7.
Description of relationships between lake area and lakefront land use changes.
2.4. Relationships between Lake Area and Lakefront Land Use Change
2.4.1. Measuring Loss Rate with Proportion of Lakefront Land Use Change
According to Equation (2), there are 36 kinds of land use changes tij for the lakefront. Each value of tij has different proportions in different buffers. Thus, for all lakes and their buffers, the proportion of land use change tij has a correlation coefficient with loss rate of lake area. The correlation coefficient is defined as Equation (3):
where Rk is the loss rate of the kth lake area, , , and R is the mean of Rk; Pijk is the proportion of land use change tij in the kth lakefront buffer, , , is the mean of Pijk; ρij is the correlation coefficient between R and Pij, ; and n is the number of lake areas.
The magnitude of ρij could reflect how the loss rate of lake area has changed with the proportion of land use change tij. In other words, will the loss rate increase or decrease if Pij is growing?
- (1)
- If 0 < ρij ≤ 1 there is a positive correlation between R and Pij, which shows that an increasing Pij is most likely to lead to the lake being filled in.
- (2)
- If ρij = 0, tij cannot be correlated with the loss rate, this shows that the loss rate has nothing to do with the lakefront land use change.
- (3)
- If −1 ≤ ρij < 0, there is a negative correlation between R and Pij, which indicates that the higher the proportion of tij, the lower the loss rate.
2.4.2. Measuring Spatial Autocorrelation of Lakefront Land Use
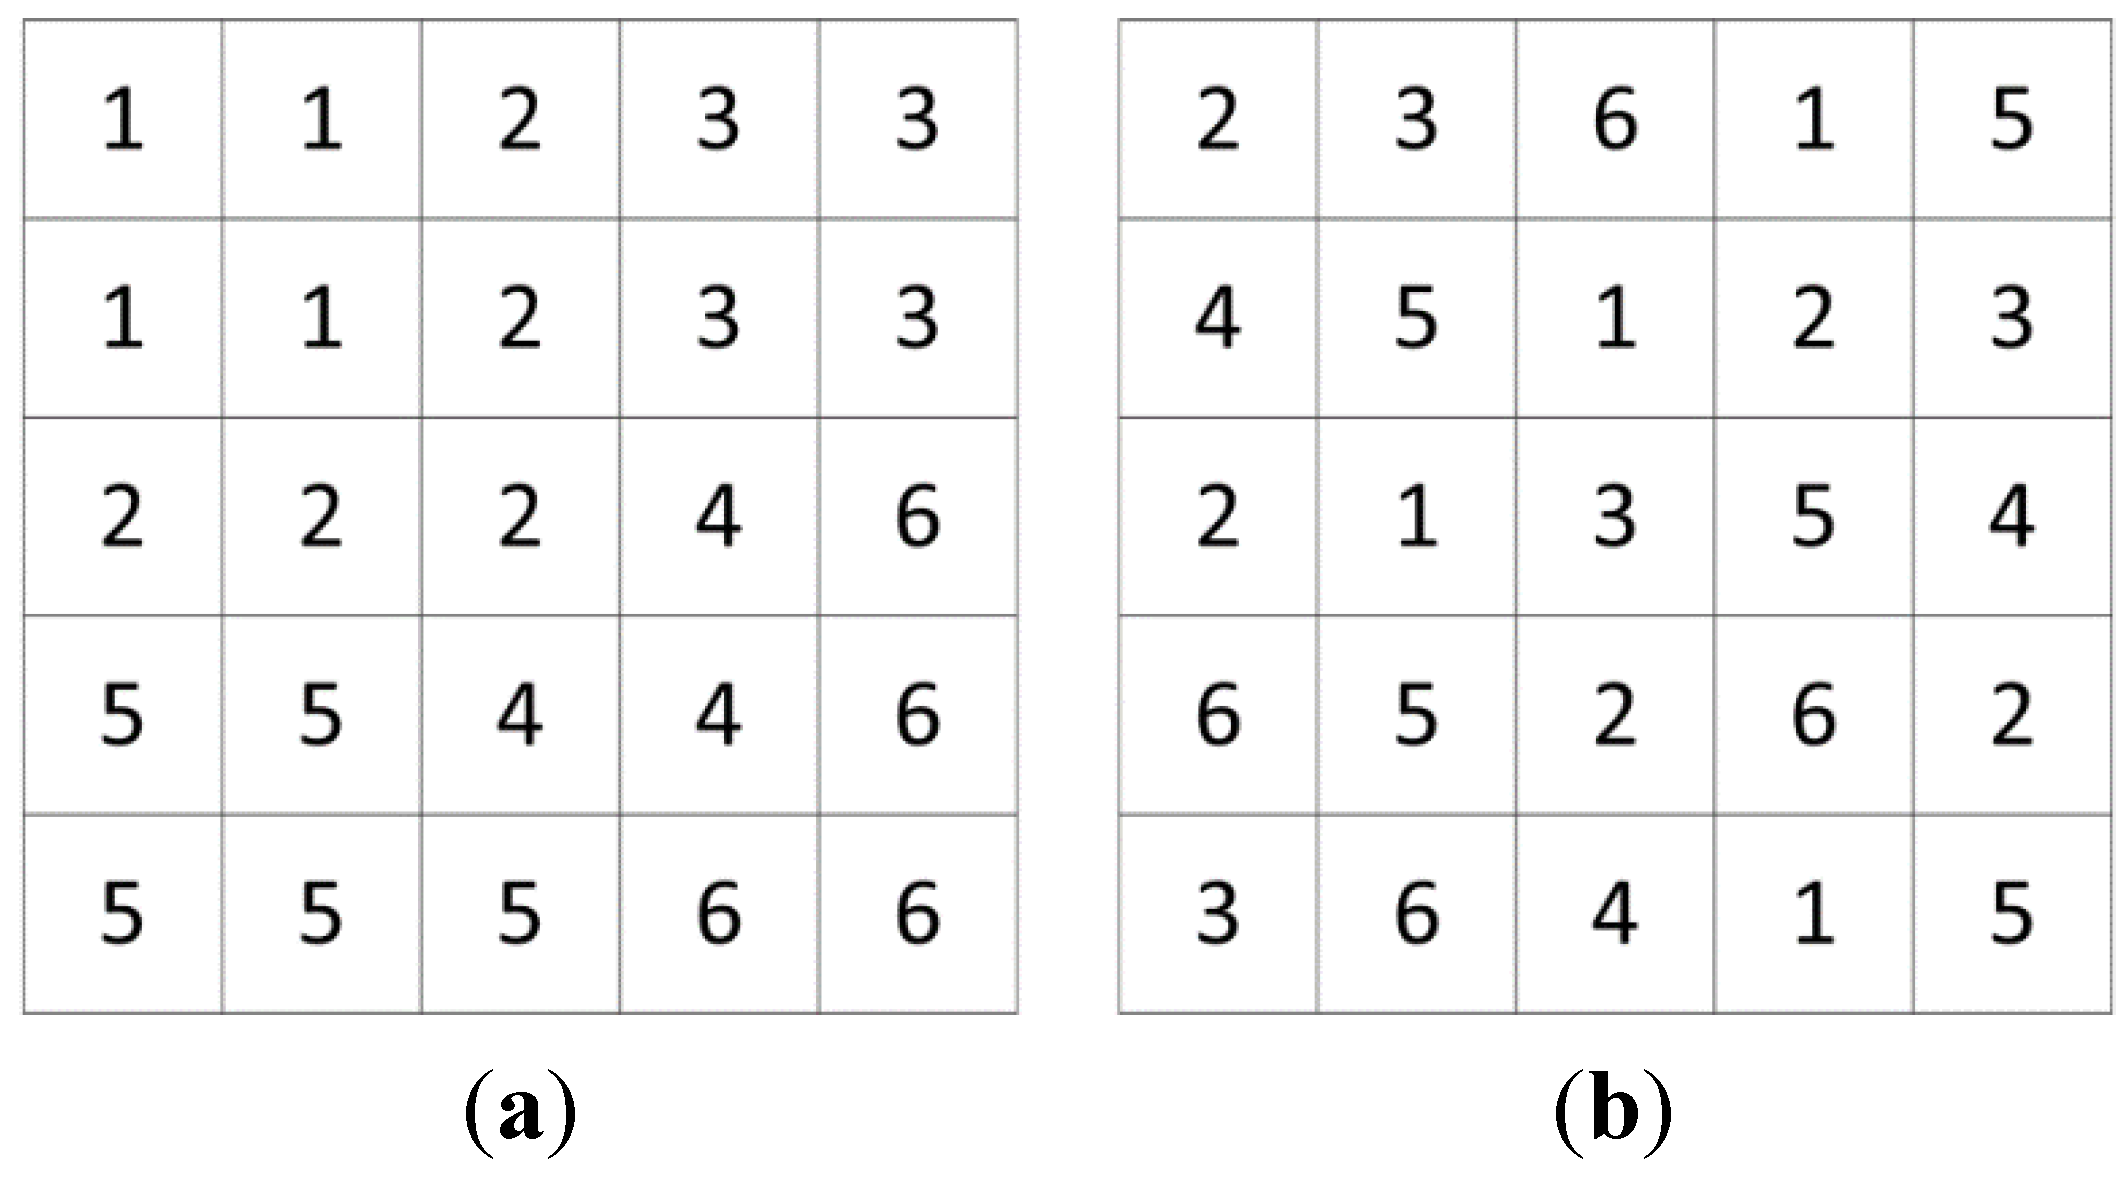
It is obvious that lakefront zones with the same proportion for each type of land use may have different spatial distributions depending on the clustering of land uses (Figure 8). So it is very significant to analyze the relationships between the spatial distribution of lakefront land use and loss rate of lake area.
Figure 8.
Two maps with identical land use components but entirely different spatial distributions. The sums of the grid for each type of land use (1–6) in map (a) and map (b) are identical, but their distributed shapes in space are completely different.
Figure 8.
Two maps with identical land use components but entirely different spatial distributions. The sums of the grid for each type of land use (1–6) in map (a) and map (b) are identical, but their distributed shapes in space are completely different.
Spatial autocorrelation indicator is one of the most important statistical characteristics used to describe the dependence and aggregation of features in space. In this paper, an indicator of Moran’s I was adopted to represent the pattern of spatial distribution of lakefront land use. It is defined as Equation (4) [42]:
where N is the number of grid in lakefront, x is the land use type in the grid, x ∈ [1,6], x is the mean of x, xj is the land use type of the neighbor, and ωij is a spatial weight of xi with xj.
Moran’s I is a measure of global spatial autocorrelation, which indicates whether there is an autocorrelation among all spatial features. The domain of Moran’s I is from −1 (perfect dispersion) to 1 (perfect correlation). A random spatial distribution is indicated when Moran’s I is 0. In other words, the larger Moran’s I is, the more clustered land uses distribute in lakefront zone. In this paper, all Moran’s I values for each buffer were measured separately in 1991 and 2005. Then the loss rate of lake area with Moran’s I could be calculated.
2.4.3. Measuring Center Displacement with Lakefront Land Use Change
In general, if human activities at a lakefront cause reductions of the lake area, the decrease should start from the lake surface, near the human activities. In addition, a single side of reductions could lead the center of the lake surface to move towards the other side. So the center of the lake surface can also indicate whether land use changes have an effect on the lake area.
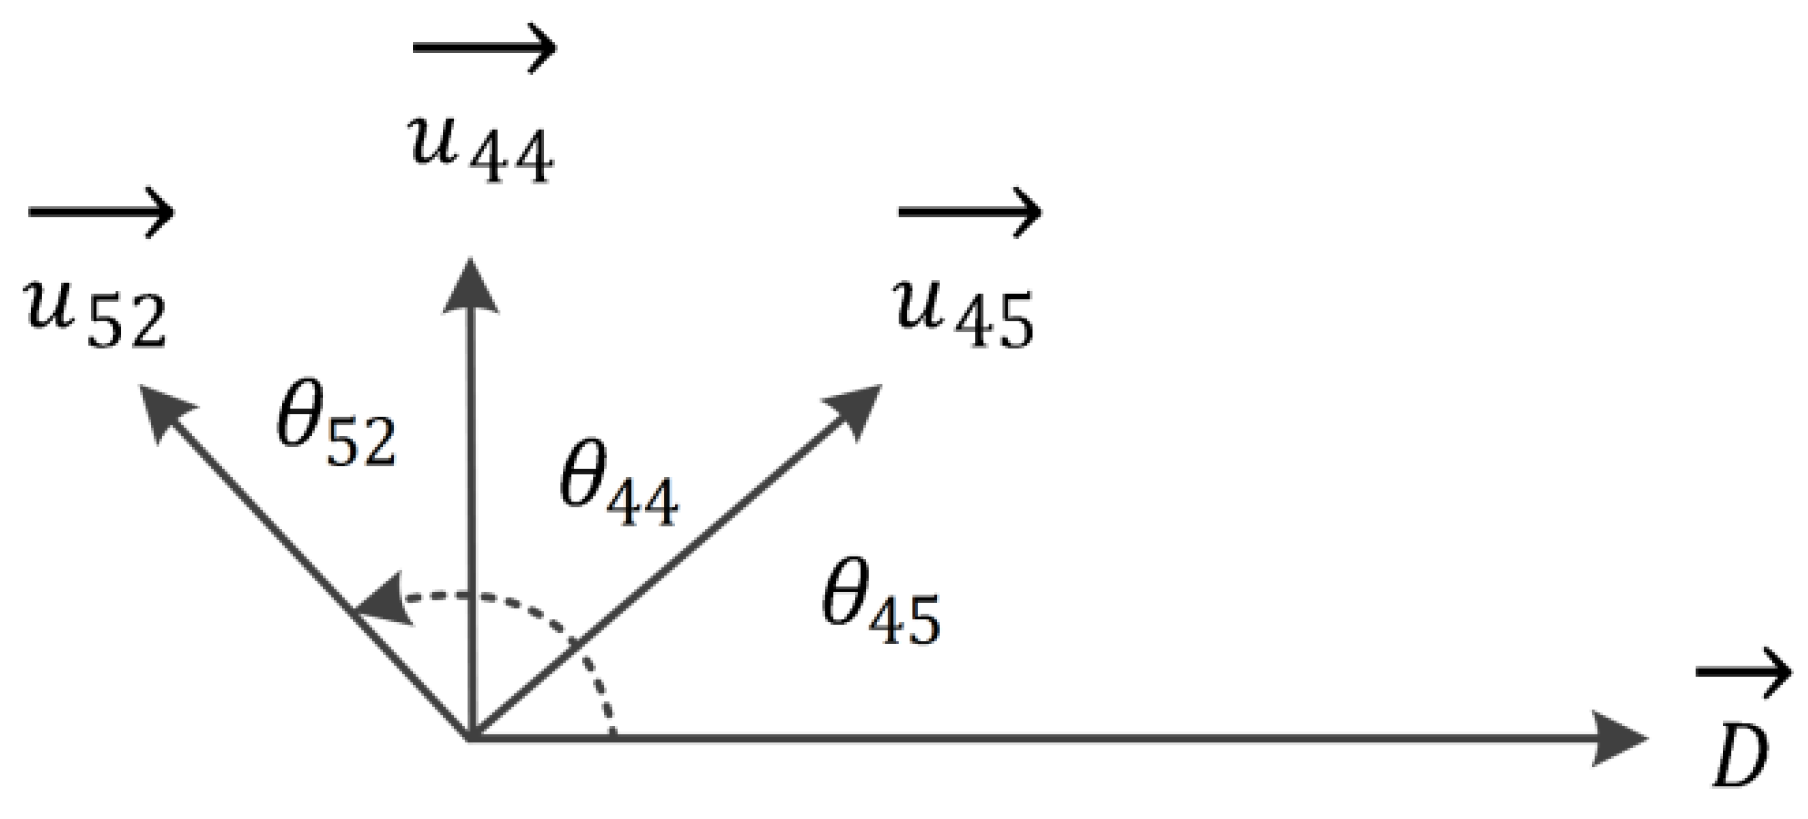
In this paper, land use changes were represented by many discrete grids corresponding with their pixels in remotely sensed images. Each of these grids probably has its effect on the lake area. Since the spatial relations between the grid and lake could be different from each other, we use a vector with size and direction to describe their effects on lake area. The direction is from the grid center to the corresponding lake center. Thus, in a certain lakefront zone, the effect of all tij values on the buffer can form a vector sum that points to the lake center. If the size of the vector sum is 1, unit vector uij can represent the total effect of land use change tij in this lakefront zone on the lake center. If the center displacement between 1991 and 2005 is represented by vector uij, and the angle between uij and D is represented by θij, cos θij can be a measure of the contribution from land use change tij to the displacement of center D (Figure 9).
Figure 9.
Measuring the effect of lakefront land use change on center displacement. Effect of land use change tij was represented by unit vector uij, the center displacement is represented by vector D, and θij represents the angle between uij and D. The magnitude of cos θij would be a measure of contribution tij to D.
- (1)
- If cos θij > 0, such as θ45, uij has a correlation with D, there is a pushing effect of land use change tij on the lake area. In other words, there are some reductions in lake area due to land use change tij.
- (2)
- If cos θij ≤ 0, such as θ52 and θ44, uij has no correlation with D, there is no reduction in lake area due to land use change tij.
3. Results and Discussions
3.1. Loss Rate of Lake Area with Proportion of Lakefront Land Use Change
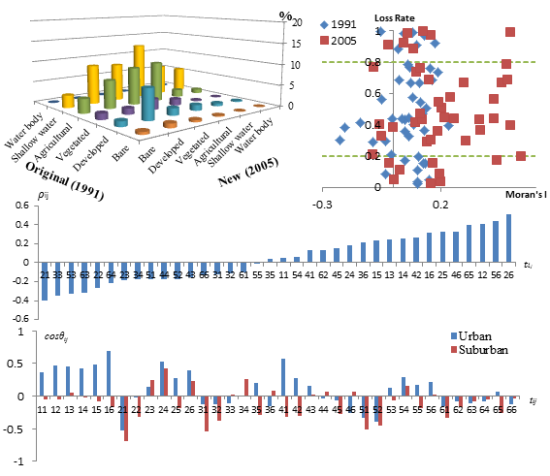
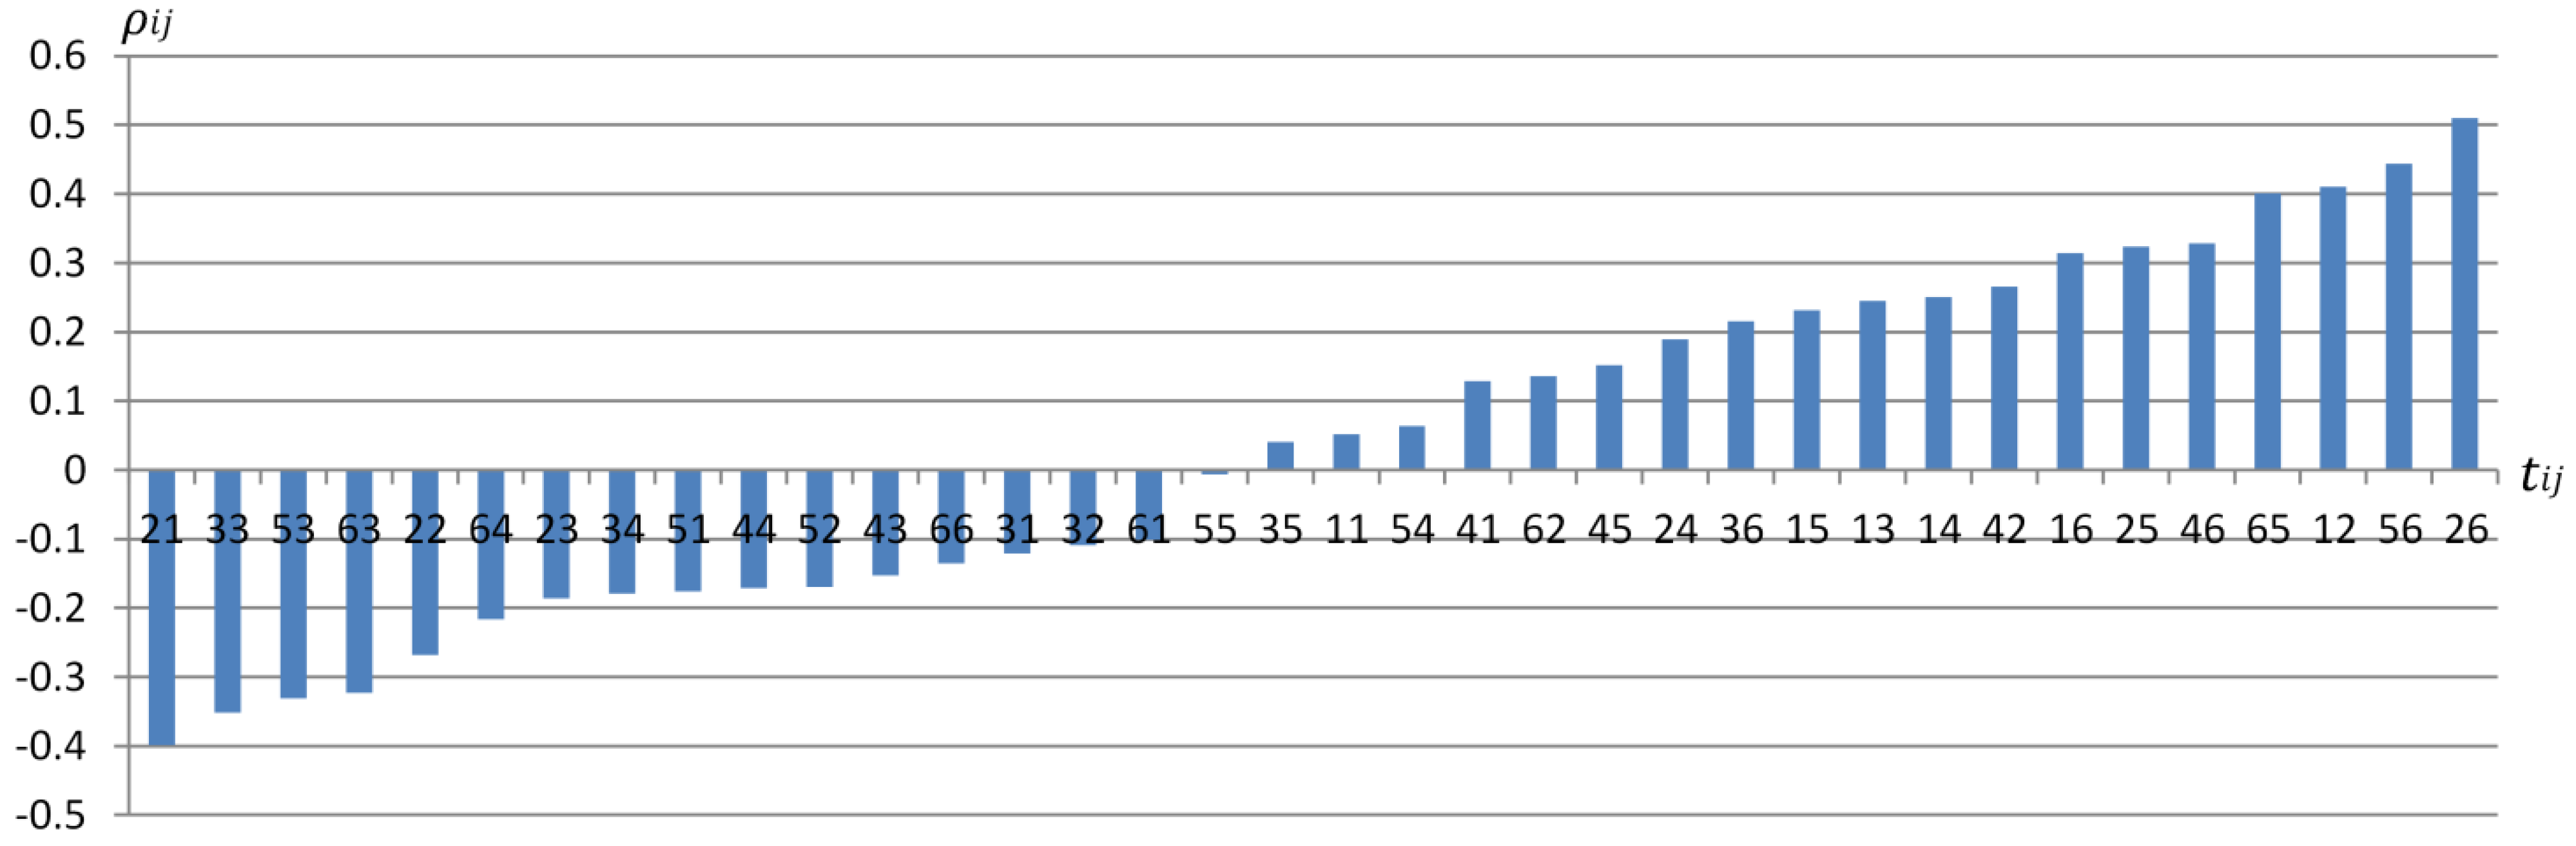
The histograms in Figure 10 and Figure 11 represent the ρij in Equation (3) in urban and suburban districts of Wuhan, respectively. The ρij can reflect how the loss rate of lake area is related to the increase of the land use change tij. For instance, in Figure 10, ρ26 has a value of 0.51 (positive correlation), which means that the loss rate could rise with an increasing P26. Accordingly, the loss rate could be reduced with an increasing P21. Thus, the greater the ρij, the more significant the effect of tij on the loss rate of lake area.
In urban districts, land use changes transformed from vegetation (e.g., t46, t42, t45) or into developed and bare land (e.g., t65, t26) had greater positive correlation with the loss rate of lake area. In addition, land use changes transformed from developed land (e.g., t51, t53) or into wetland and ponds (e.g., t31, t52) had a larger negative correlation with the loss rate of lake area. In other words, when building structures and roads beside lakes or cutting down the greenbelts on a lakefront, there would be a significant possibility that the lake area has been filled in.
Figure 10.
The ρij between the loss rate of lake area and the proportion of land use change tij in urban districts of Wuhan. For instance, ρ26 has a value of 0.51 when tij equals 26. That means the proportion of t26 (P26) has a positive correlation with the loss rate of lake area. The larger the P26 value, the greater the loss rate.

Figure 11.
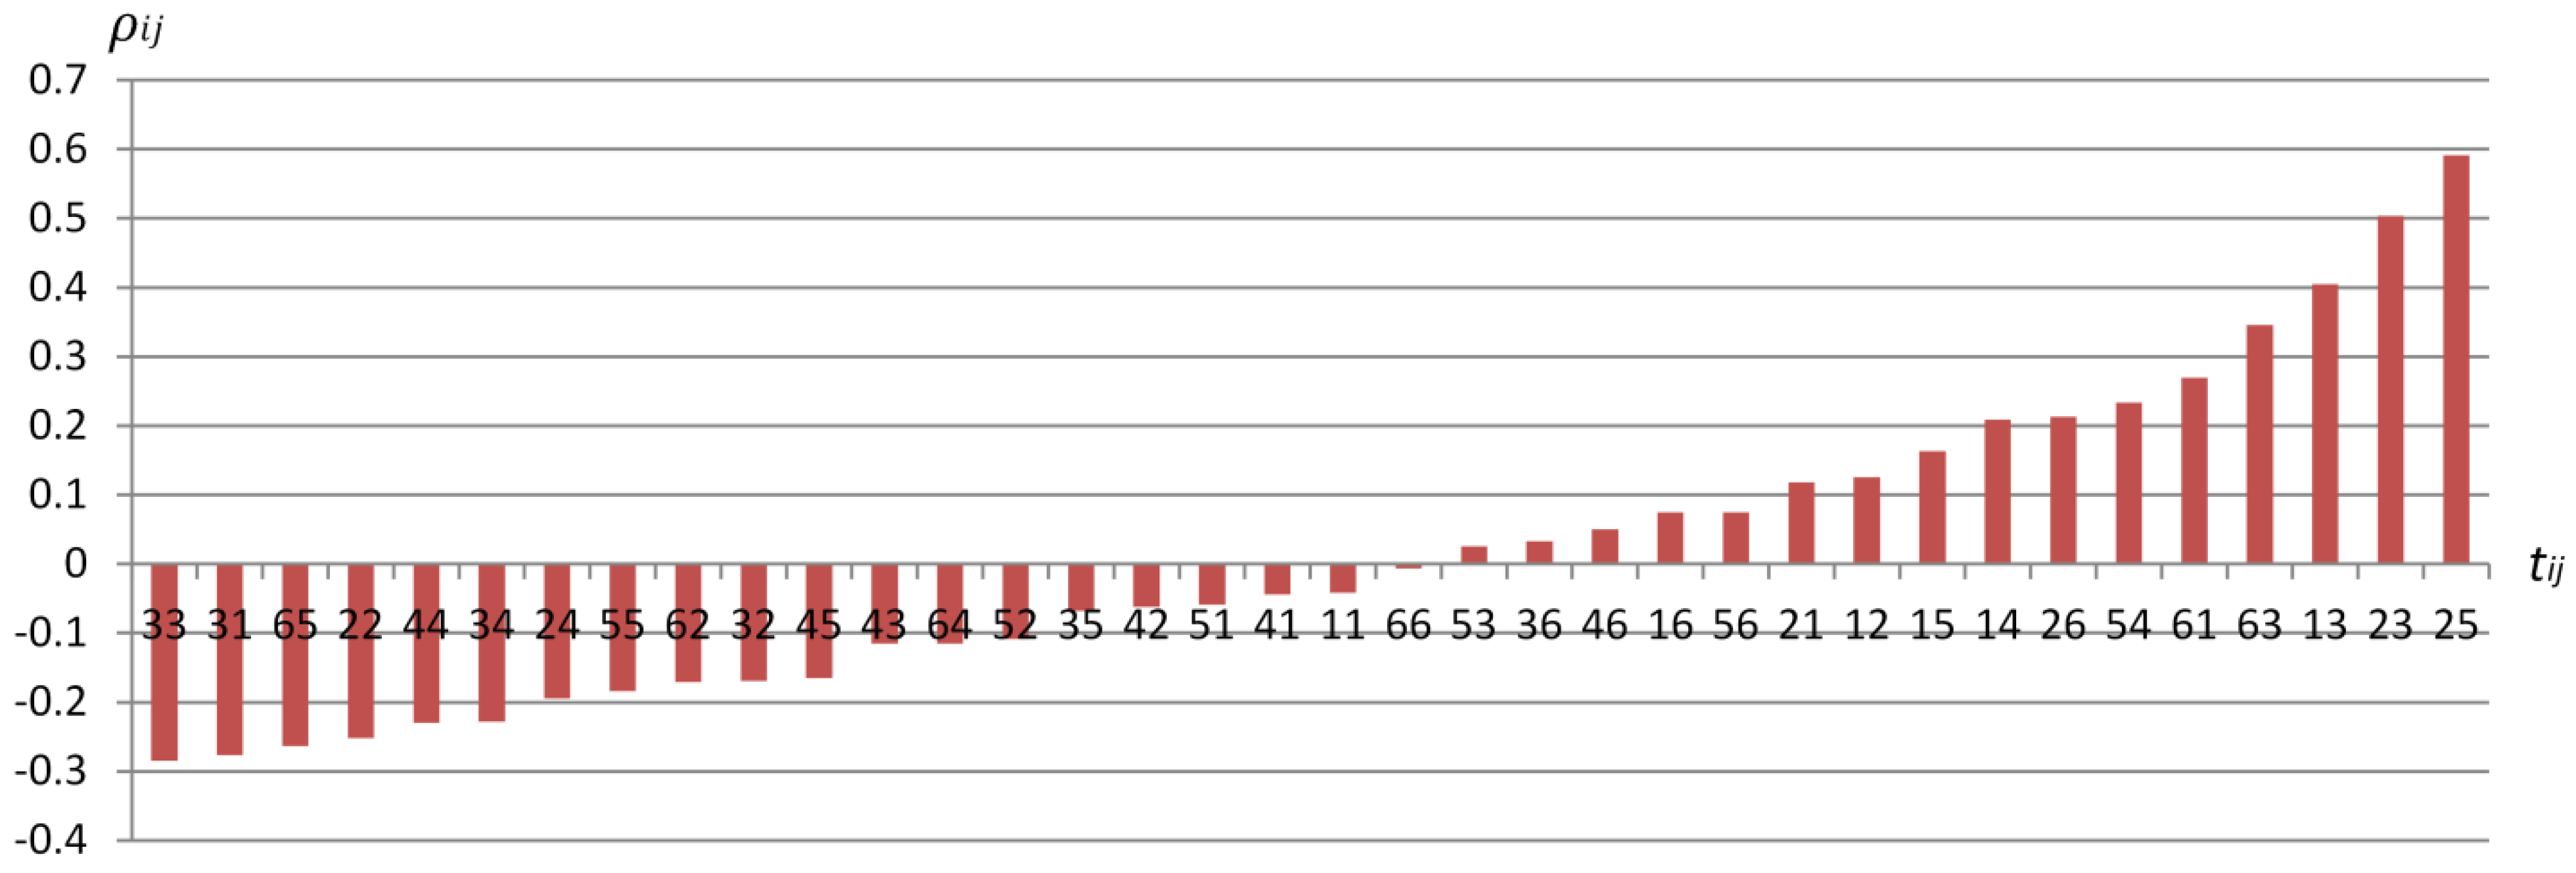
The ρij between the loss rate of lake area and the proportion of land use change tij in suburban districts of Wuhan. For instance, ρ31 is −0.28 when tij equals 31. That means the proportion of t31 (P31) has a negative correlation with the loss rate of lake area. The larger the P31 value, the lower the loss rate.
Figure 11.
The ρij between the loss rate of lake area and the proportion of land use change tij in suburban districts of Wuhan. For instance, ρ31 is −0.28 when tij equals 31. That means the proportion of t31 (P31) has a negative correlation with the loss rate of lake area. The larger the P31 value, the lower the loss rate.

On the other hand, in suburban districts, land transformed from wetlands (e.g., t23, t25, t26) or into agricultural land (e.g., t13) had a positive correlation with the loss rate of lake area, and land transformed from agricultural land (e.g., t31, t32) had a negative correlation. Thus agricultural land was the dominant factor for the loss rate of lake area in suburban districts of Wuhan. The larger proportion of agricultural land in lakefront buffers was likely to result in filling in the lakes.
In Figure 10 and Figure 11, the relationship between loss rate of lake area and every type of land use change from i to j could be quantitatively estimated from its correlation coefficient. The results suggested that: (1) both in urban and suburban districts of Wuhan, human activities such as building and farming could cause reduction of lake area and would be a threat to the lake ecosystem of the city; (2) if land use type did not change (e.g., t33), they would hardly contribute to the loss rate of lake area in the city.
3.2. Loss Rate of Lake Area with Spatial Autocorrelation of Lakefront Land Use
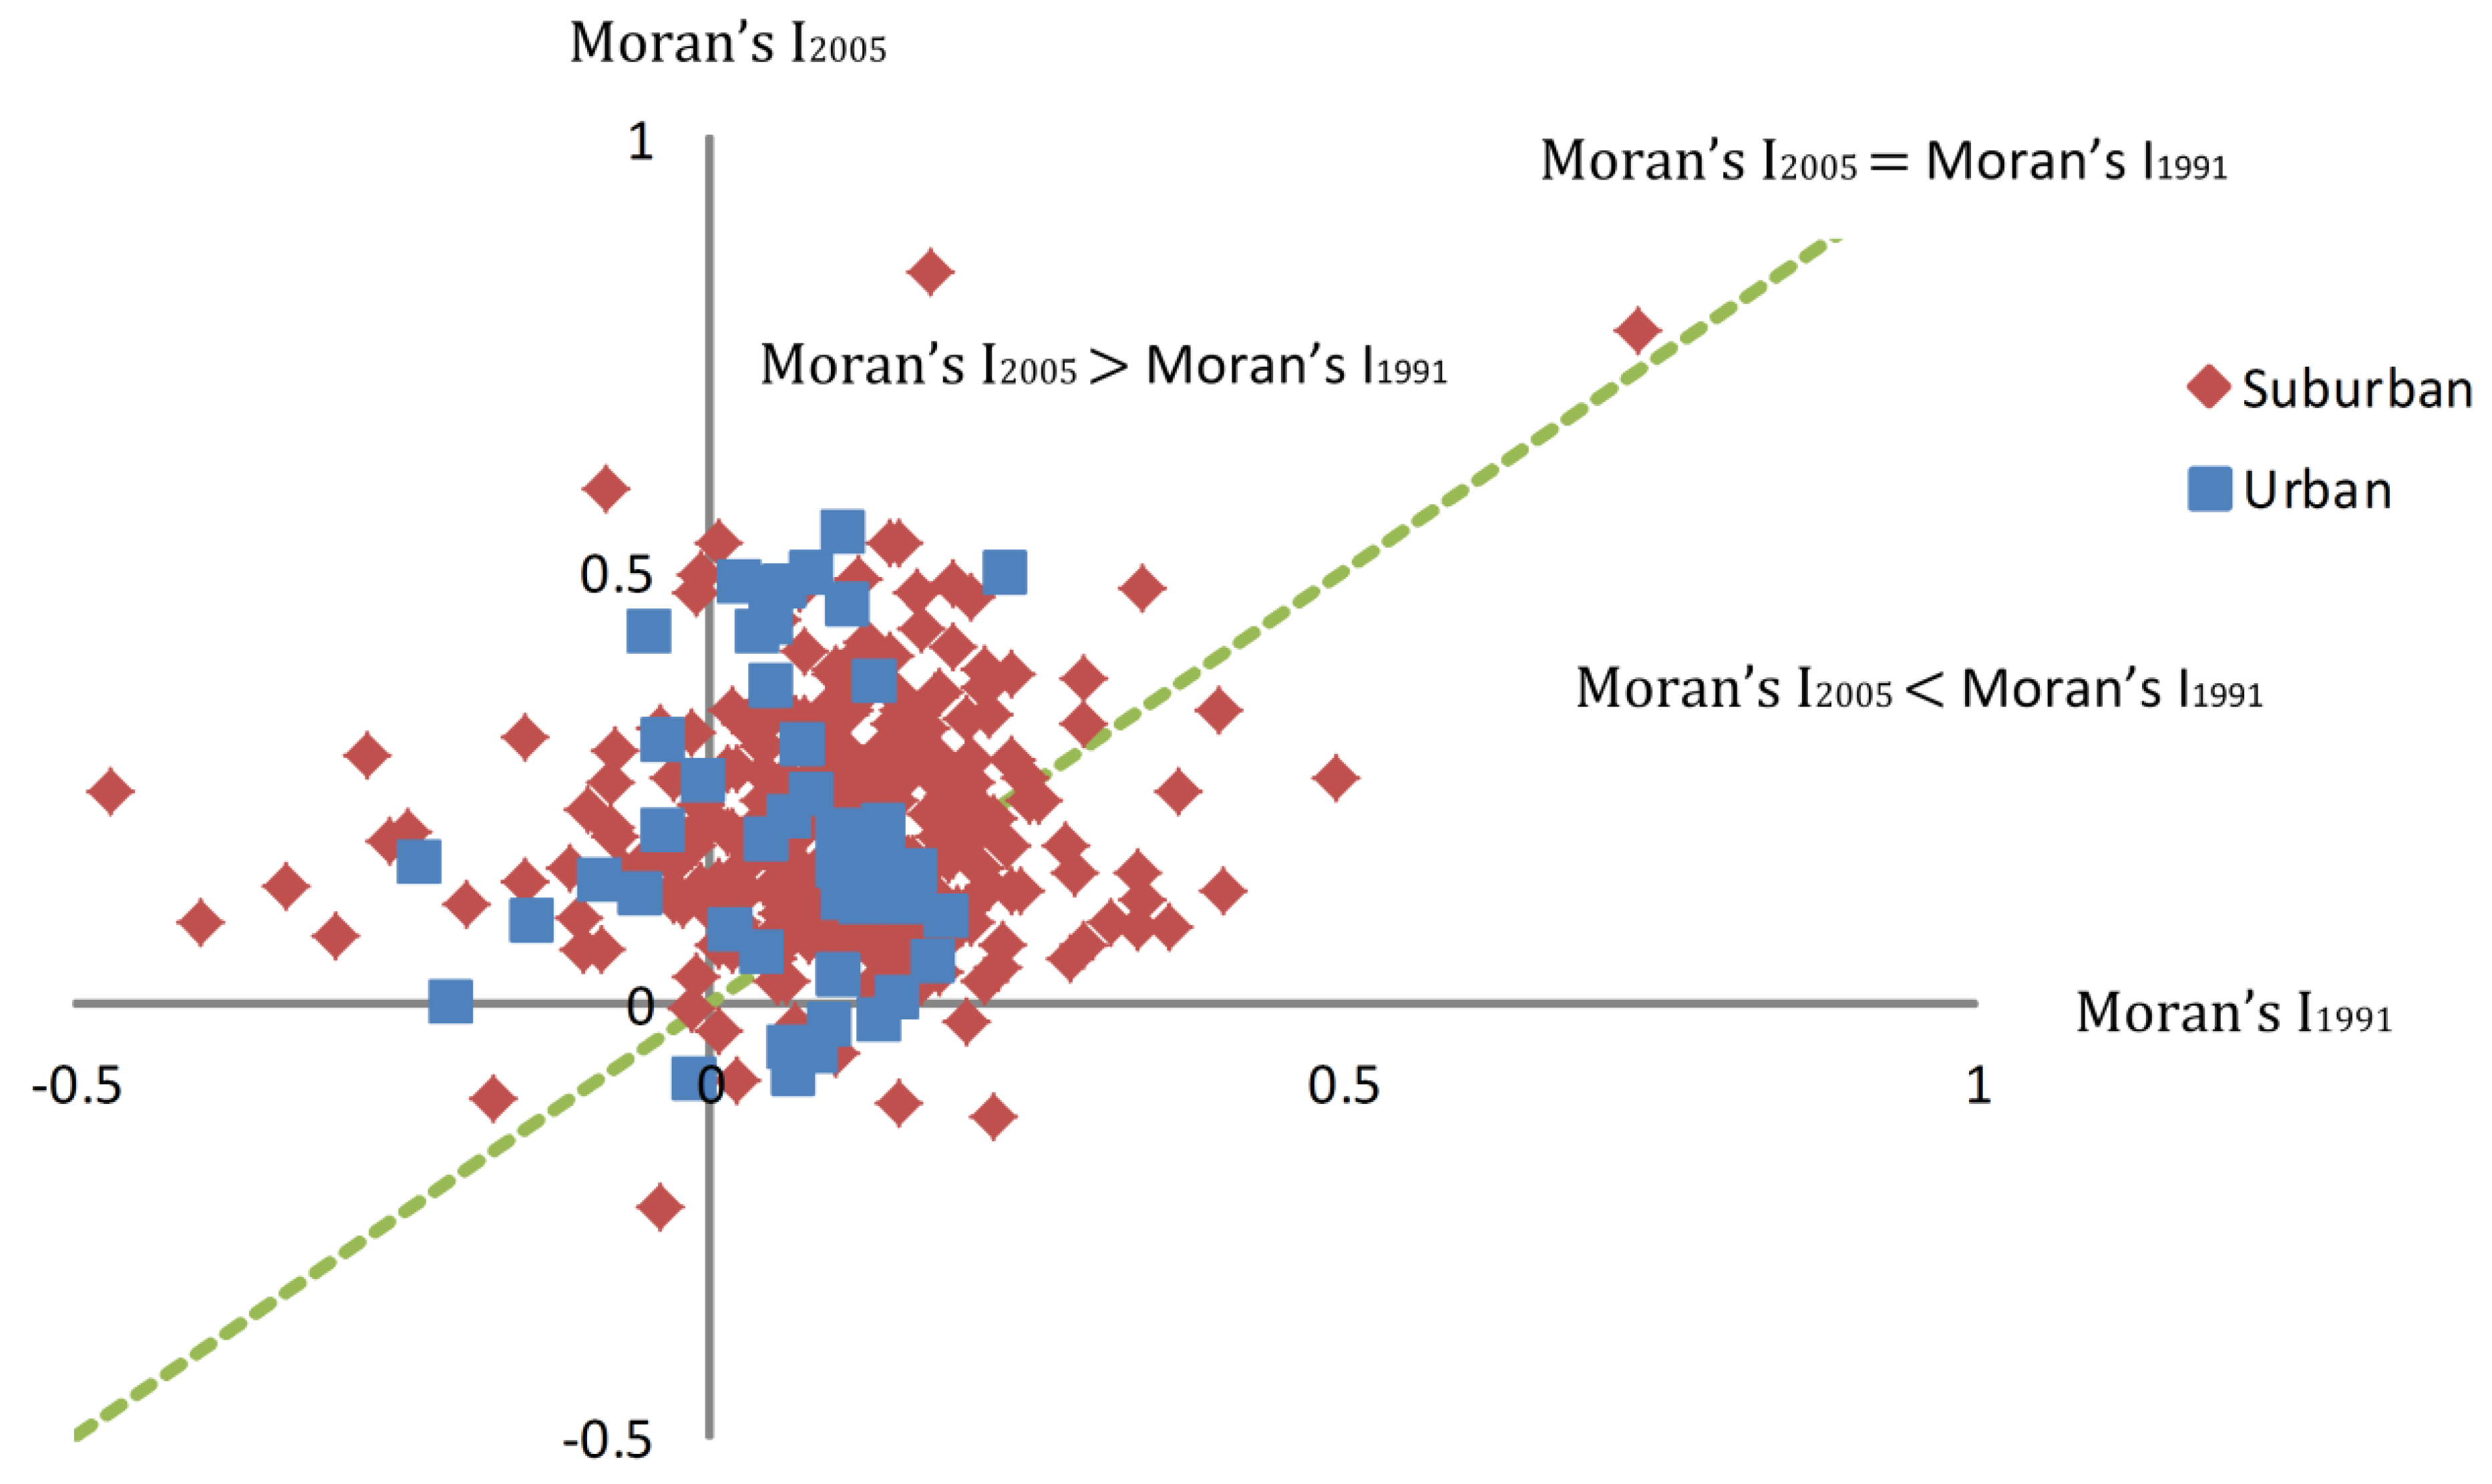
Figure 12 shows the relationships between Moran’s Is of the lakefront land uses of Wuhan in 1991 (horizontal axis) and 2005 (vertical axis). There is a green dotted line that divides the coordinate plane in half. Points above the dotted line indicate that the Moran’s Is of lakefront land uses in 2005 are larger than those in 1991. It could be found that both in urban and suburban districts, almost all of the lakefront land uses had a weak spatial autocorrelation in 1991, and most of them had a larger one in 2005. Thus it could be thought that the spatial distributions of lakefront land uses were approximately random, and have been clustered slightly with urban development and human activities.
Figure 12.
The Moran’s Is of lakefront land uses of Wuhan in 1991 and 2005. For most lakefront zones, Moran’s I in 2005 is larger than that in 1991.
Figure 12.
The Moran’s Is of lakefront land uses of Wuhan in 1991 and 2005. For most lakefront zones, Moran’s I in 2005 is larger than that in 1991.

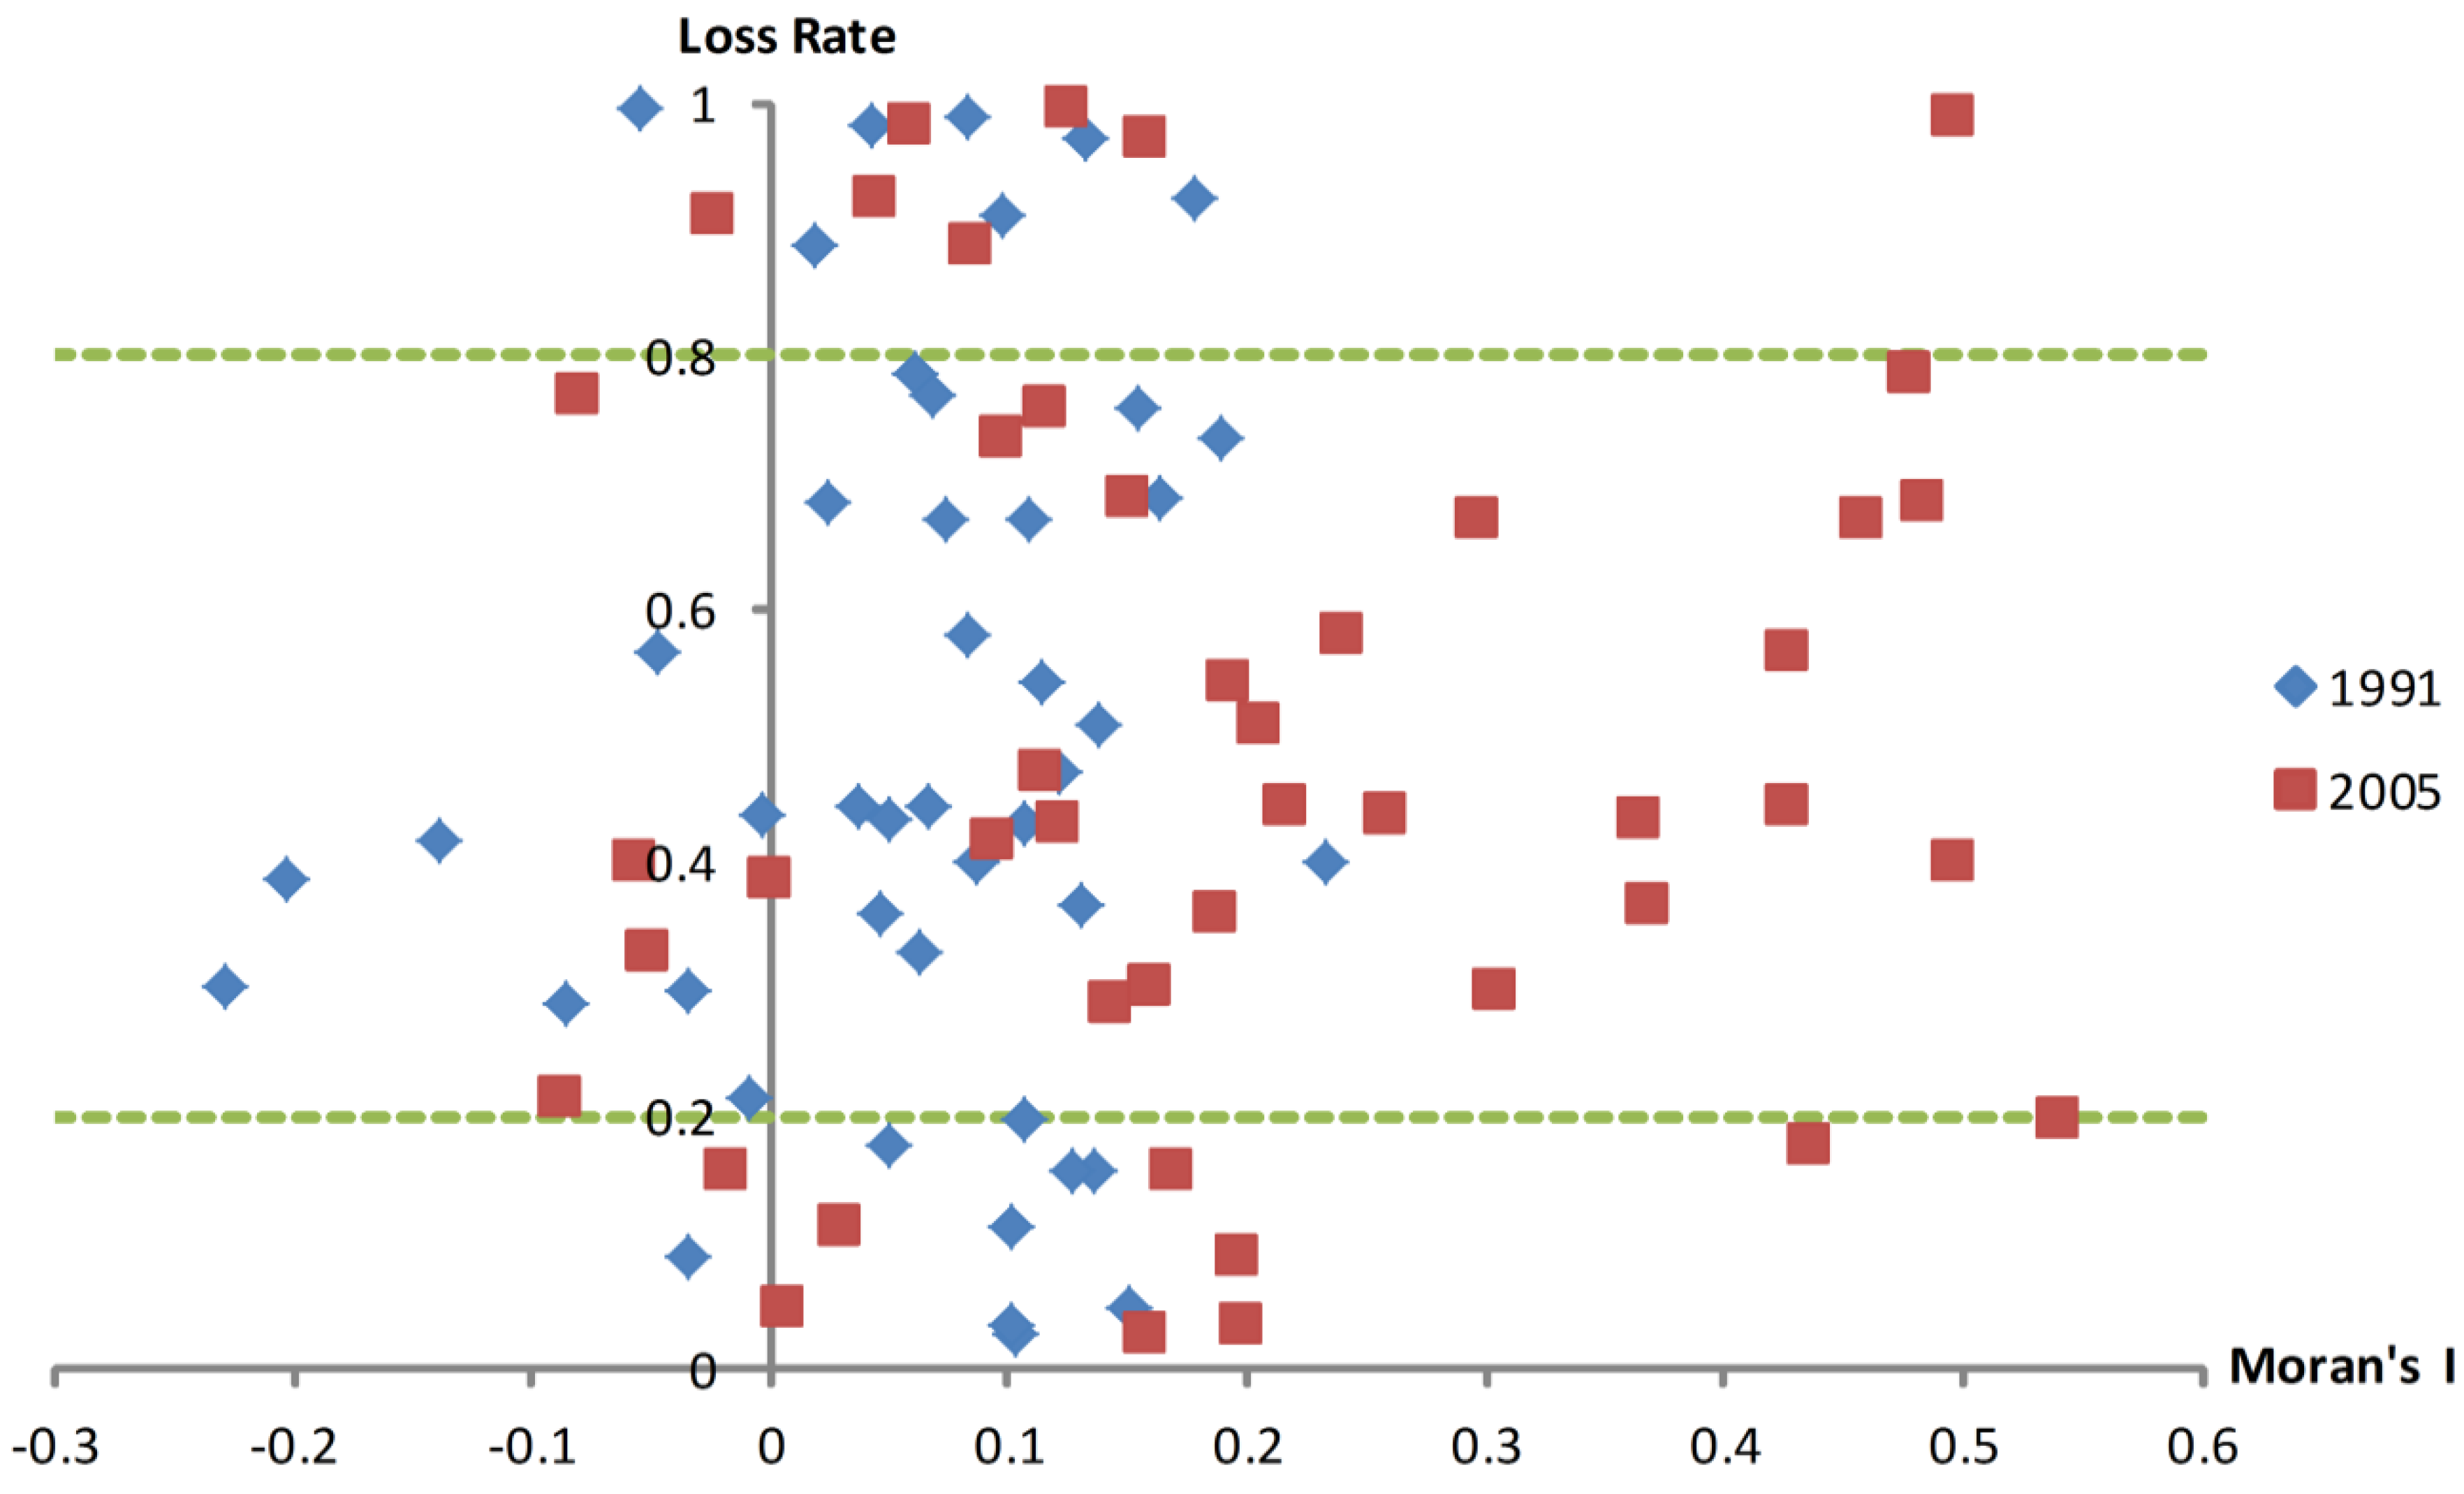
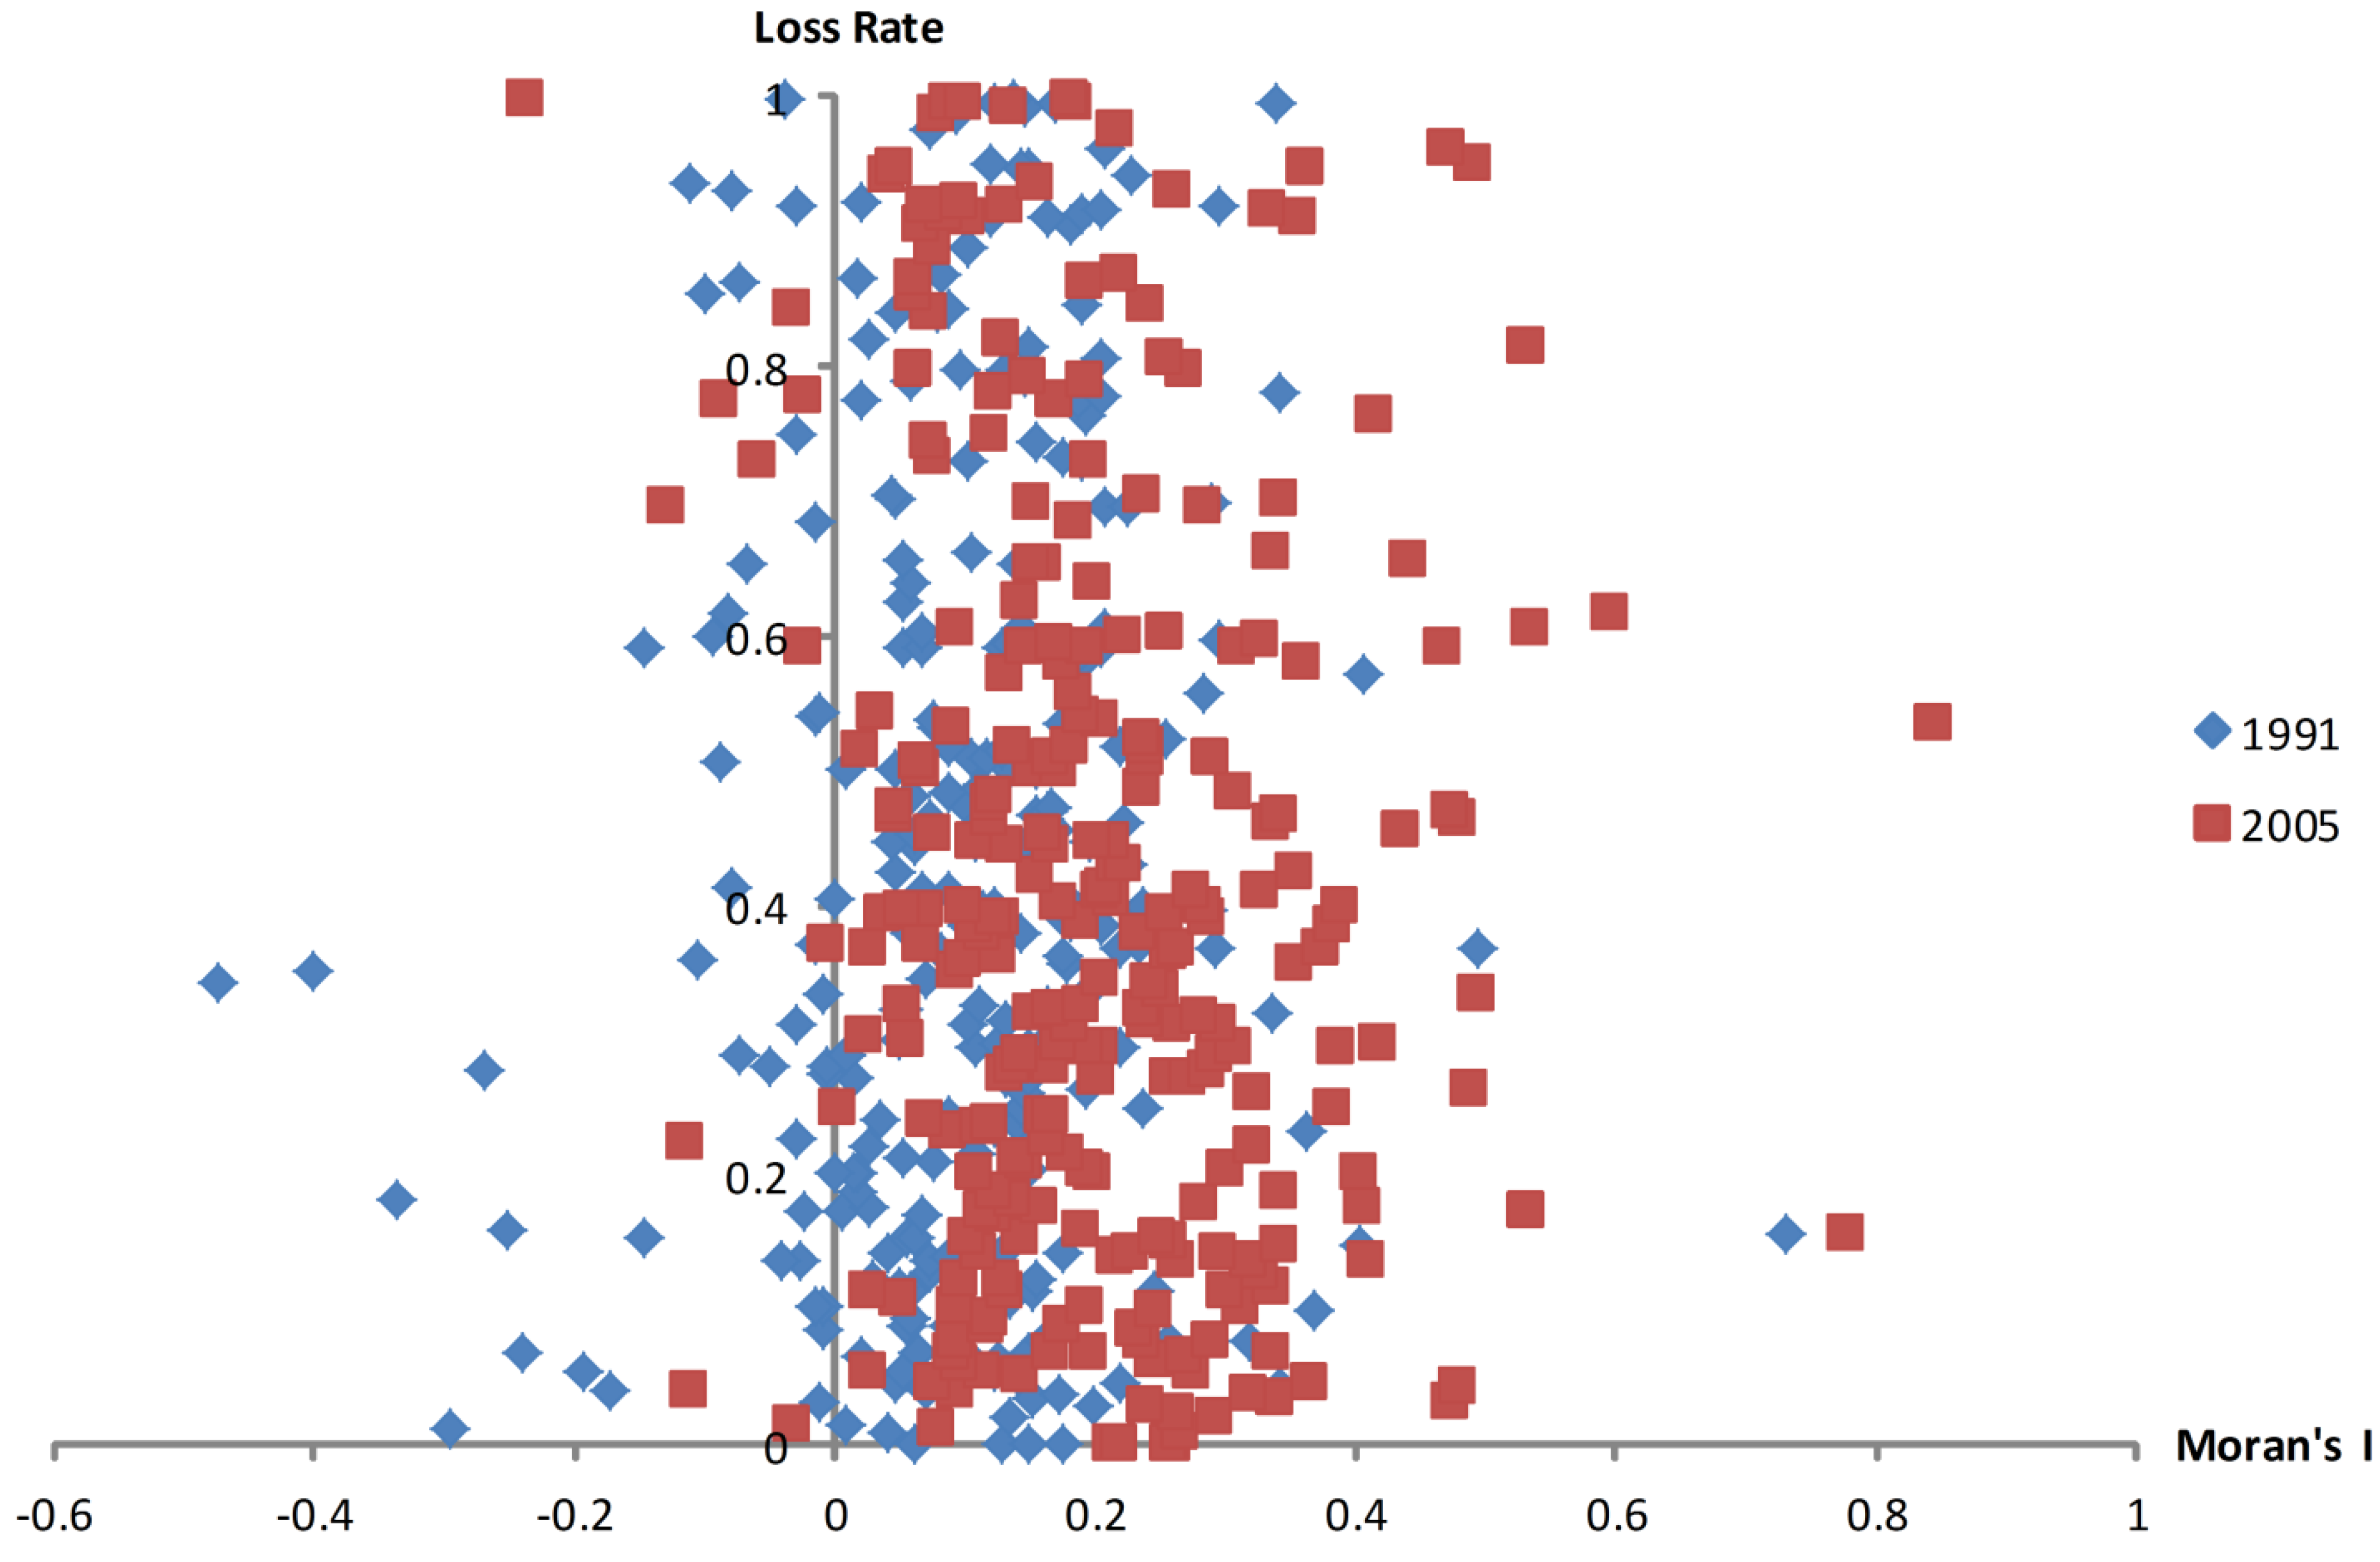
Figure 13 and Figure 14, respectively, show the loss rate of lake area with Moran’s I in urban and suburban districts of Wuhan. In urban districts, Moran’s I is raised significantly when the loss rate of lake area is between 0.2 and 0.8. However, there is no obvious variation of Moran’s I if the loss rate is less than 0.2 or greater than 0.8. It is suggested that the spatial autocorrelation of lakefront land uses could be an indicator of the loss rate of lake area in urban districts of Wuhan. A higher spatial autocorrelation could indicate that the lake area has probably been reduced, and the loss rate was approximately 20% to 80%. On the other hand, there was no strong relation between Moran’s I with the loss rate of lake area in suburban districts.
In addition, according to Figure 12, the spatial autocorrelation of lakefront land use in Wuhan has been increasing between 1991 and 2005 because of urban development. Moreover, the higher spatial autocorrelation could indicate the level of the loss rate of lake area. Thus, we could infer that urban expansion has indeed compressed the space of lakes, and caused reductions in the lake area in Wuhan.
Figure 13.
Loss rate of lake area with Moran’s I in urban districts of Wuhan. Moran’s I is raised significantly when the loss rate of lake area is between 0.2 and 0.8. There is no obvious variation of Moran’s I if the loss rate is less than 0.2 or greater than 0.8.
Figure 13.
Loss rate of lake area with Moran’s I in urban districts of Wuhan. Moran’s I is raised significantly when the loss rate of lake area is between 0.2 and 0.8. There is no obvious variation of Moran’s I if the loss rate is less than 0.2 or greater than 0.8.

Figure 14.
Loss rate of lake area with Moran’s I in suburban districts of Wuhan. There is no strong relation between Moran’s I and loss rate of lake area.
Figure 14.
Loss rate of lake area with Moran’s I in suburban districts of Wuhan. There is no strong relation between Moran’s I and loss rate of lake area.
3.3. Center Displacement of Lake Area with Lakefront Land Use Change
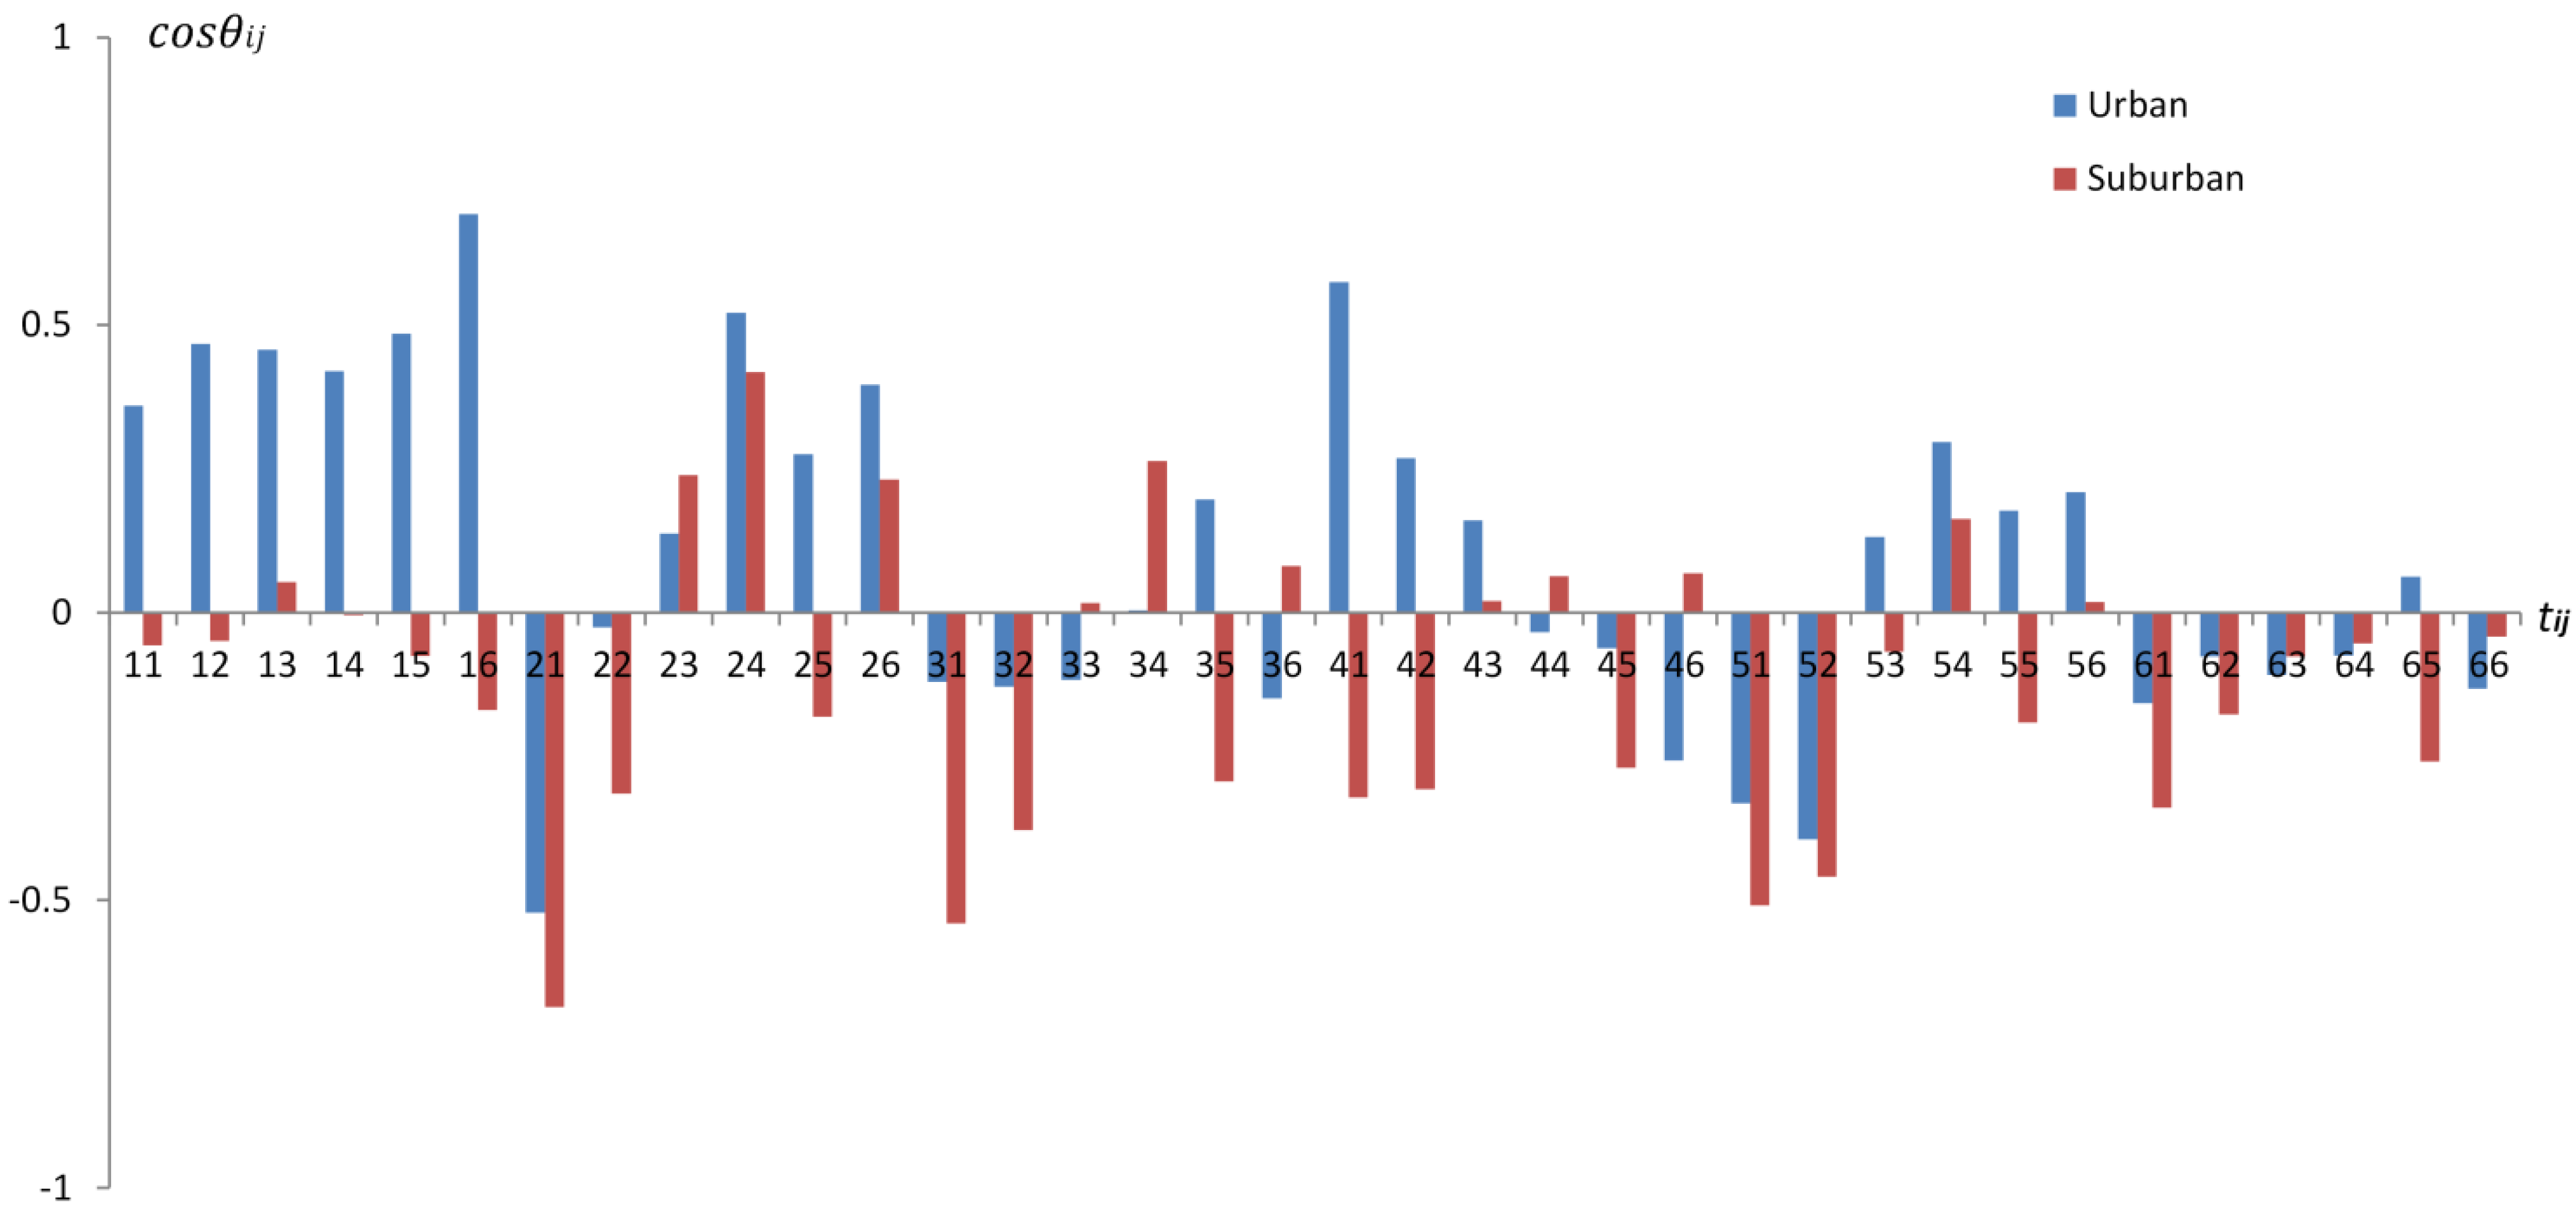
All cos θij values were drawn as shown in Figure 15. These indicate that in urban districts, land transformed from ponds, wetlands, and greenbelts (e.g., t16, t24, t41), as well as land transformed into developed land (e.g., t56) have components along with the center displacement t56. In addition, there were some reductions in lake area caused by them. Land transformed into ponds and wetlands had no effect on the lake area because their vector sums’ directions were opposite to the center displacement. In the same way, land transformed from wetlands or into agricultural land (e.g., t23, t24) had an equivalent effect to the center displacement in suburban districts, and land transformed into ponds and wetlands (e.g., t51, t52) had a contrary effect.
Figure 15.
The cos θij and tij in urban and suburban districts of Wuhan. For instance, when tij equals 35, cos θ35 has a value of 0.20 and −0.29 in urban and suburban districts, respectively. In other word, t35 has a pushing effect on the lake center, i.e., there are reductions in the lake area due to t35 in urban districts. On the contrary, there is no reduction due to t35 in suburban districts.

The cos θij verified again that human activities like building and farming would lead to lake areas being filled in. Moreover, it should be noted that land use changes from ponds (t11~t16) had significant relationship with cos θij in urban districts. In addition, according to Figure 10, their proportions had a positive correlation with the loss rate of lake area in urban districts. Thus, ponds near urban lakes must be monitored and supervised strictly.
4. Conclusions
This paper quantitatively analyzed the impacts of lakefront land use changes on lake area in Wuhan, China. Land uses in urban and suburban districts were divided into six different categories, and were extracted from LandSat TM/ETM+ remotely sensed images taken in 1991 and 2005. The spatial changes of lakefront land uses during this period were located and compared by using GIS. The variation in the lake area was represented by loss rate and center displacement. The loss rate of lake area was connected with the proportion of each lakefront land use change and the spatial autocorrelation of lakefront land uses. The displacement of the lake center is measured with the vector sum of lakefront land use changes.
Relationships between the loss rate of lake area and the proportion of each type of lakefront land use in Wuhan were quantitatively represented by their corresponding correlation coefficients. It was shown that the proportion of land transformed into developed and agricultural land from other types of land use had a positive correlation with the loss rate. Thus the lake area would be reduced if people built structures and engaged in agricultural production in lakefront zones.
The spatial autocorrelation analysis of lakefront land use revealed that the clustering of lakefront land use was weak in Wuhan, and rose slightly with urban development. The spatial autocorrelation could be an indicator of the loss rate of lake area. Especially in urban districts, a higher Moran’s I value indicated that the lake area had shrunk by approximately 20% to 80%. In suburban districts, the relationship between spatial autocorrelation and the loss rate of lake area was not clear, and needs to be studied in the future.
The contrast of directions between the displacement of the lake center and the vector sum of each land use change could indicate whether the land use change has led to its surrounding lake area being filled in. The results in Wuhan revealed that when ponds and wetlands were transformed into other land use types, the surrounding lake surface would be transformed into other terrestrial land use simultaneously. So, it is necessary to pay more and strict attention to the monitoring and supervision of ponds for the protection of lake areas in Wuhan.
Acknowledgments
This study was supported by the Natural Science Foundation of Hubei Province, China (2015CFA134) and the National Natural Science Foundation of China (41072199). The authors also greatly appreciate the anonymous reviewers and academic editor for their careful comments and valuable suggestions to improve the manuscript.
Author Contributions
Qiuwen Zhang and Jianfeng Zhu conceived the study. Jianfeng Zhu performed the experiments. Jianfeng Zhu, Qiuwen Zhang, Zhong Tong wrote the paper.
Conflicts of Interest
The authors declare no conflict of interest.
References
- Birch, S.; McCaskie, J. Shallow urban lakes: A challenge for lake management. Hydrobiologia 1999, 395, 365–378. [Google Scholar] [CrossRef]
- Martínez-Arroyo, A.; Jáuregui, E. On the environmental role of urban lakes in Mexico City. Urban Ecosyst. 2000, 4, 145–166. [Google Scholar] [CrossRef]
- Naselli-Flores, L. Urban lakes: Ecosystems at risk, worthy of the best care. In Proceedings of Taal2007: The 12th World Lake Conference, Jaipur, India, 28 October–2 November 2007; pp. 1333–1337.
- Schuler, T.; Simpson, J. Introduction: Why urban lakes are different. Urban Lake Manag. Watershed Prot. Tech. 2001, 3, 747–750. [Google Scholar]
- Snehal, P.; Unnati, P. Challenges faced and solutions towards conservation of ecology of urban lakes. Inter. J. Sci. Eng. Res. 2012, 3, 170–183. [Google Scholar]
- Nakayama, T.; Watanabe, M. Role of flood storage ability of lakes in the Changjiang River catchment. Glob. Planet. Chang. 2008, 63, 9–22. [Google Scholar] [CrossRef]
- Liu, Y. Modelling the lake water environment impact on urban system expansion. Inf. Int. Insterdiscip. J. 2012, 15, 2351–2356. [Google Scholar]
- Henny, C.; Meutia, A.A. Urban lakes in megacity Jakarta: Risk and management plan for future sustainability. In Proceedings of 4th International Conference on Sustainable Future for Human Security Sustain, Kyoto, Japan, 18–21 October 2013; pp. 737–746.
- Lemoalle, J.; Bader, J.C.; Leblanc, M.; Sedick, A. Recent changes in Lake Chad: Observations, simulations and management options (1973–2011). Glob. Planet. Chang. 2012, 80–81, 247–254. [Google Scholar] [CrossRef]
- Noges, T. Relationships between morphometry, geographic location and water quality parameters of European lakes. Hydrobiologia 2009, 633, 33–43. [Google Scholar] [CrossRef]
- Morais, J.; Martins, A.; Vale, M.; Vasconcelos, V. Assessment of cyanobacterial toxinogenic genotypes and estimation of toxin content in urban lakes. Fresenius Environ. Bull. 2014, 23, 1867–1873. [Google Scholar]
- Stahl, L.L.; Snyder, B.D.; Olsen, A.R.; Kincaid, T.M.; Wathen, J.B.; McCarty, H.B. Perfluorinated compounds in fish from US urban rivers and the Great Lakes. Sci. Total Environ. 2014, 499, 185–195. [Google Scholar] [CrossRef]
- Leavitt, P.R.; Brock, C.S.; Ebel, C.; Patoine, A. Landscape-scale effects of urban nitrogen on a chain of freshwater lakes in central North America. Limnol. Oceanogr. 2006, 51, 2262–2277. [Google Scholar] [CrossRef]
- Bogard, M.J.; Donald, D.B.; Finlay, K.; Leavitt, P.R. Distribution and regulation of urea in lakes of central North America. Freshw. Biol. 2012, 57, 1277–1292. [Google Scholar] [CrossRef]
- Wu, J.; Xie, H. Research on characteristics of changes of lakes in Wuhan’s main urban area. In Proceedings of International Conference on Green Buildings and Sustainable Cities, Bologna, Italy, 15–16 September 2011; pp. 395–404.
- Xu, K.; Kong, C.; Liu, G.; Wu, C.; Deng, H.; Zhang, Y.; Zhuang, Q. Changes of urban wetlands in Wuhan, China, from 1987 to 2005. Prog. Phys. Geogr. 2010, 34, 207–220. [Google Scholar]
- Huang, P.; Liu, Y.; Liu, C.; Jiang, Q. Study on evolution of urban lakes in Wuhan based on RS/GIS. Ecol. Environ. Sci. 2012, 21, 1588–1593. [Google Scholar]
- Cao, B.; Kang, L.; Yang, S.; Tan, D.; Wen, X. Monitoring the Dynamic Changes in Urban Lakes Based on Multi-source Remote Sensing Images. In Geo-Informatics in Resource Management and Sustainable Ecosystem; Springer: Berlin, Germany, 2015; pp. 68–78. [Google Scholar]
- Si, H.; Liwei, C. Influence of the development in Wuhan city on lake resource. In Proceedings of International Conference on Environmental Science and Information Application Technology (ESIAT) 2009, Wuhan, China, 4–5 July 2009; IEEE; pp. 221–224.
- Du, N.; Ottens, H.; Sliuzas, R. Spatial impact of urban expansion on surface water bodies—A case study of Wuhan, China. Landsc. Urban Plan. 2010, 94, 175–185. [Google Scholar] [CrossRef]
- Zhongping, Z.; Xinhai, L. Spatial-temporal evolution of urban lakes in Wuhan City based on remote sensing images. J. Lake Sci. 2008, 20, 648–654. [Google Scholar] [CrossRef]
- Sanchez, A.; Medina, N.; Vojinovic, Z.; Price, R. An integrated cellular automata evolutionary-based approach for evaluating future scenarios and the expansion of urban drainage networks. J. Hydroinformatics 2014, 16, 319–340. [Google Scholar] [CrossRef]
- Razavi, B.S. Predicting the trend of land use changes using artificial neural network and markov chain model (case study: Kermanshah City). Res. J. Environ. Earth Sci. 2014, 6, 215–226. [Google Scholar]
- Fichera, C.R.; Modica, G.; Pollino, M. Land cover classification and change-detection analysis using multi-temporal remote sensed imagery and landscape metrics. Eur. J. Remote Sens. 2012, 45, 1–18. [Google Scholar] [CrossRef]
- Jat, M.K.; Khare, D.; Garg, P.K.; Shankar, V. Remote sensing and GIS-based assessment of urbanisation and degradation of watershed health. Urban Water J. 2009, 6, 251–263. [Google Scholar] [CrossRef]
- Radhi, H.; Fikry, F.; Sharples, S. Impacts of urbanisation on the thermal behaviour of new built up environments: A scoping study of the urban heat island in Bahrain. Landsc. Urban Plan. 2013, 113, 47–61. [Google Scholar] [CrossRef]
- Zhang, C.; Zhu, X.; Fu, G.; Zhou, H.; Wang, H. The impacts of climate change on water diversion strategies for a water deficit reservoir. J. Hydroinformatics 2014, 16, 872–889. [Google Scholar] [CrossRef]
- Shi, P.J.; Yuan, Y.; Zheng, J.; Wang, J.A.; Ge, Y.; Qiu, G.Y. The effect of land use/cover change on surface runoff in Shenzhen region, China. Catena 2007, 69, 31–35. [Google Scholar] [CrossRef]
- Peterson, H.M.; Nieber, J.L.; Kanivetsky, R.; Shmagin, B. Regionalization of landscape characteristics to map hydrologic variables. J. Hydroinformatics 2014, 16, 971–972. [Google Scholar] [CrossRef]
- Suriya, S.; Mudgal, B. Impact of urbanization on flooding: The Thirusoolam sub watershed—A case study. J. Hydrol. 2012, 412, 210–219. [Google Scholar] [CrossRef]
- Wang, J.; Da, L.; Song, K.; Li, B.L. Temporal variations of surface water quality in urban, suburban and rural areas during rapid urbanization in Shanghai, China. Environ. Pollut. 2008, 152, 387–393. [Google Scholar] [CrossRef]
- Carpenter, S.R.; Ludwig, D.; Brock, W.A. Management of eutrophication for lakes subject to potentially irreversible change. Ecol. Appl. 1999, 9, 751–771. [Google Scholar] [CrossRef]
- Choiński, A.; Ptak, M. Lake infill as the main factor leading to lake’s disappearance. Pol. J. Environ. Stud. 2009, 18, 347–352. [Google Scholar]
- Wasige, J.E.; Groen, T.A.; Smaling, E.; Jetten, V. Monitoring basin-scale land cover changes in Kagera Basin of Lake Victoria using ancillary data and remote sensing. Int. J. Appl. Earth Obs. Geoinf. 2013, 21, 32–42. [Google Scholar] [CrossRef]
- Li, Y.; Zhao, S.; Zhao, K.; Xie, P.; Fang, J. Land-cover changes in an urban lake watershed in a mega-city, Central China. Environ. Monit. Assess. 2006, 115, 349–359. [Google Scholar] [CrossRef]
- Liu, Y.; Lv, X.; Qin, X.; Guo, H.; Yu, Y.; Wang, J.; Mao, G. An integrated GIS-based analysis system for land-use management of lake areas in urban fringe. Landsc. Urban Plan. 2007, 82, 233–246. [Google Scholar] [CrossRef]
- Xiang, W.N. GIS-based riparian buffer analysis: Injecting geographic information into landscape planning. Landsc. Urban Plan. 1996, 34, 1–10. [Google Scholar] [CrossRef]
- Wuhan Bureau of Statistics. Wuhan Statistical Yearbook 2006; China Statistics Press: Beijing, China, 2006.
- Wang, Z. Study on protection and utilization of Wuhan City lake since 1990s. Environ. Sci. Manag. 2013, 38, 38–45. [Google Scholar]
- National Climate Center. Available online: http://ncc.cma.gov.cn/Website/index.php?ChannelID=43&WCHID=5 (accessed on 26 July 2015).
- Xu, H.Q. Modification of normalised difference water index (NDWI) to enhance open water features in remotely sensed imagery. Int. J. Remote Sens. 2006, 27, 3025–3033. [Google Scholar] [CrossRef]
- Waldhör, T. The spatial autocorrelation coefficient Moran’s I under heteroscedasticity. Stat. Med. 1996, 15, 887–892. [Google Scholar] [CrossRef]
© 2015 by the authors; licensee MDPI, Basel, Switzerland. This article is an open access article distributed under the terms and conditions of the Creative Commons Attribution license (http://creativecommons.org/licenses/by/4.0/).
Share and Cite
MDPI and ACS Style
Zhu, J.; Zhang, Q.; Tong, Z. Impact Analysis of Lakefront Land Use Changes on Lake Area in Wuhan, China. Water 2015, 7, 4869-4886. https://doi.org/10.3390/w7094869
AMA Style
Zhu J, Zhang Q, Tong Z. Impact Analysis of Lakefront Land Use Changes on Lake Area in Wuhan, China. Water. 2015; 7(9):4869-4886. https://doi.org/10.3390/w7094869
Chicago/Turabian StyleZhu, Jianfeng, Qiuwen Zhang, and Zhong Tong. 2015. "Impact Analysis of Lakefront Land Use Changes on Lake Area in Wuhan, China" Water 7, no. 9: 4869-4886. https://doi.org/10.3390/w7094869