
Areal Distribution of Ammonium Contamination of Soil-Water Environment in the Vicinity of Old Municipal Landfill Site with Vertical Barrier


Abstract
:
1. Introduction


2. Materials and Methods
2.1. Study Area
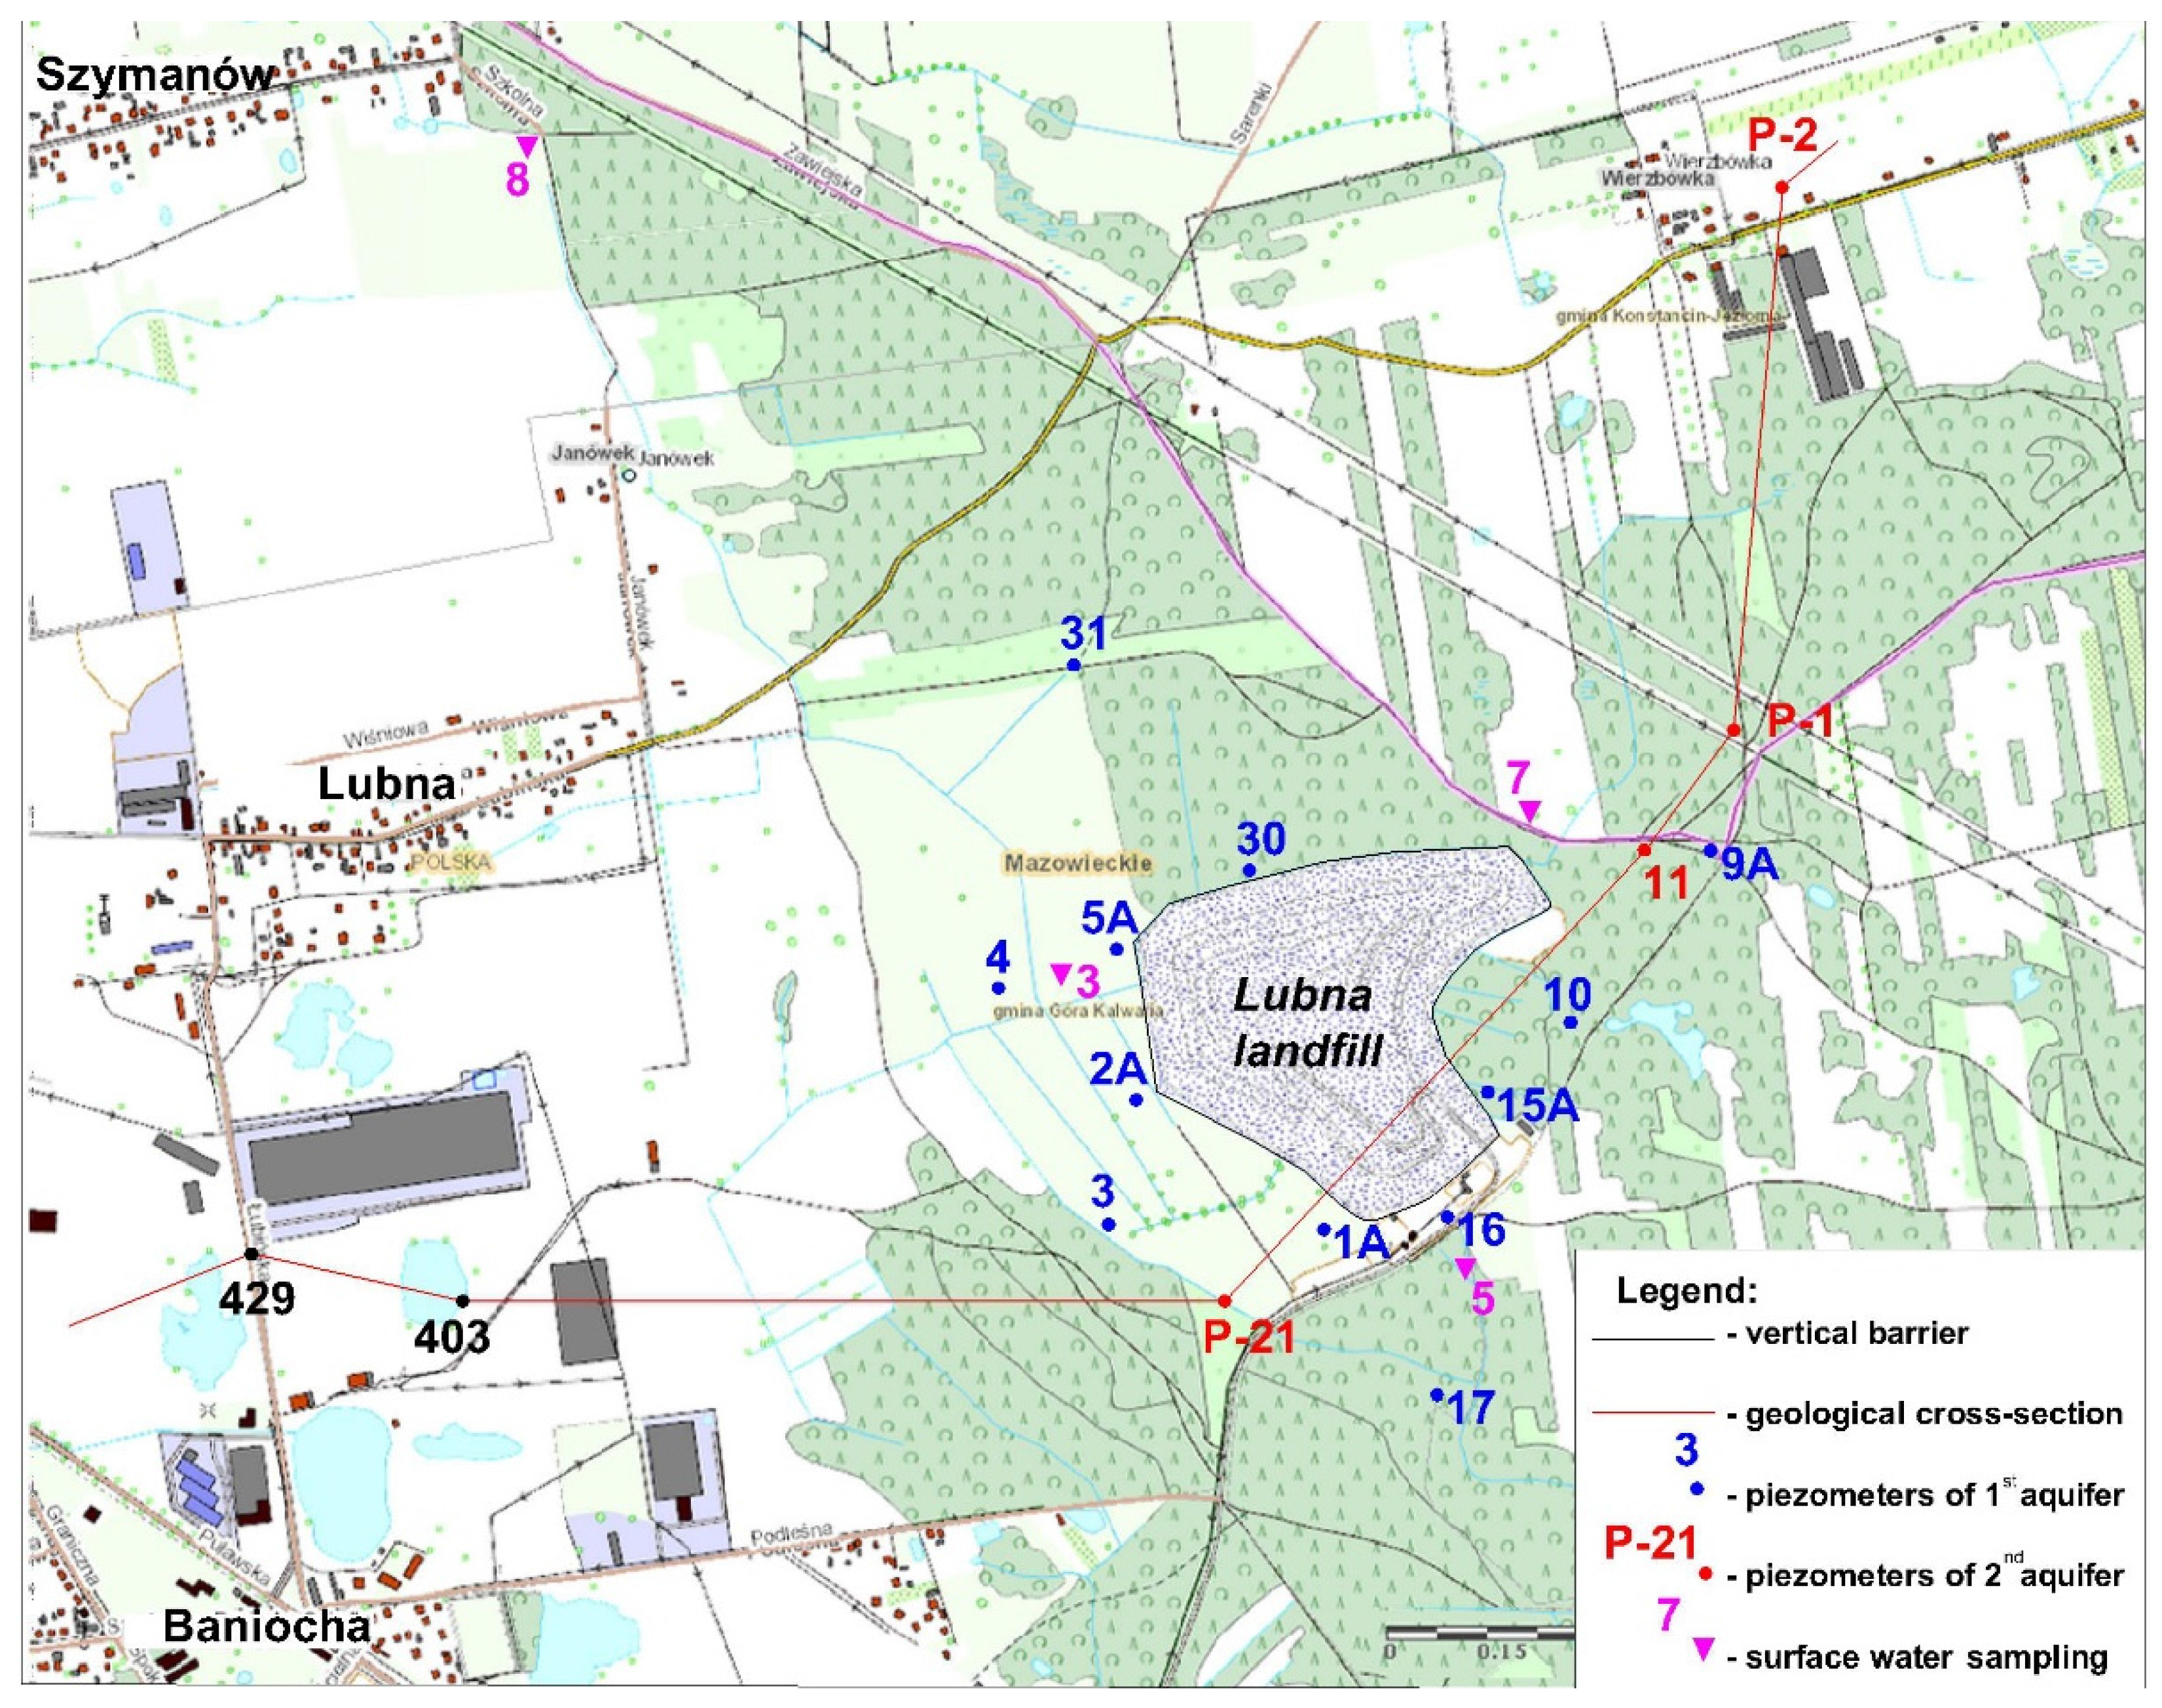

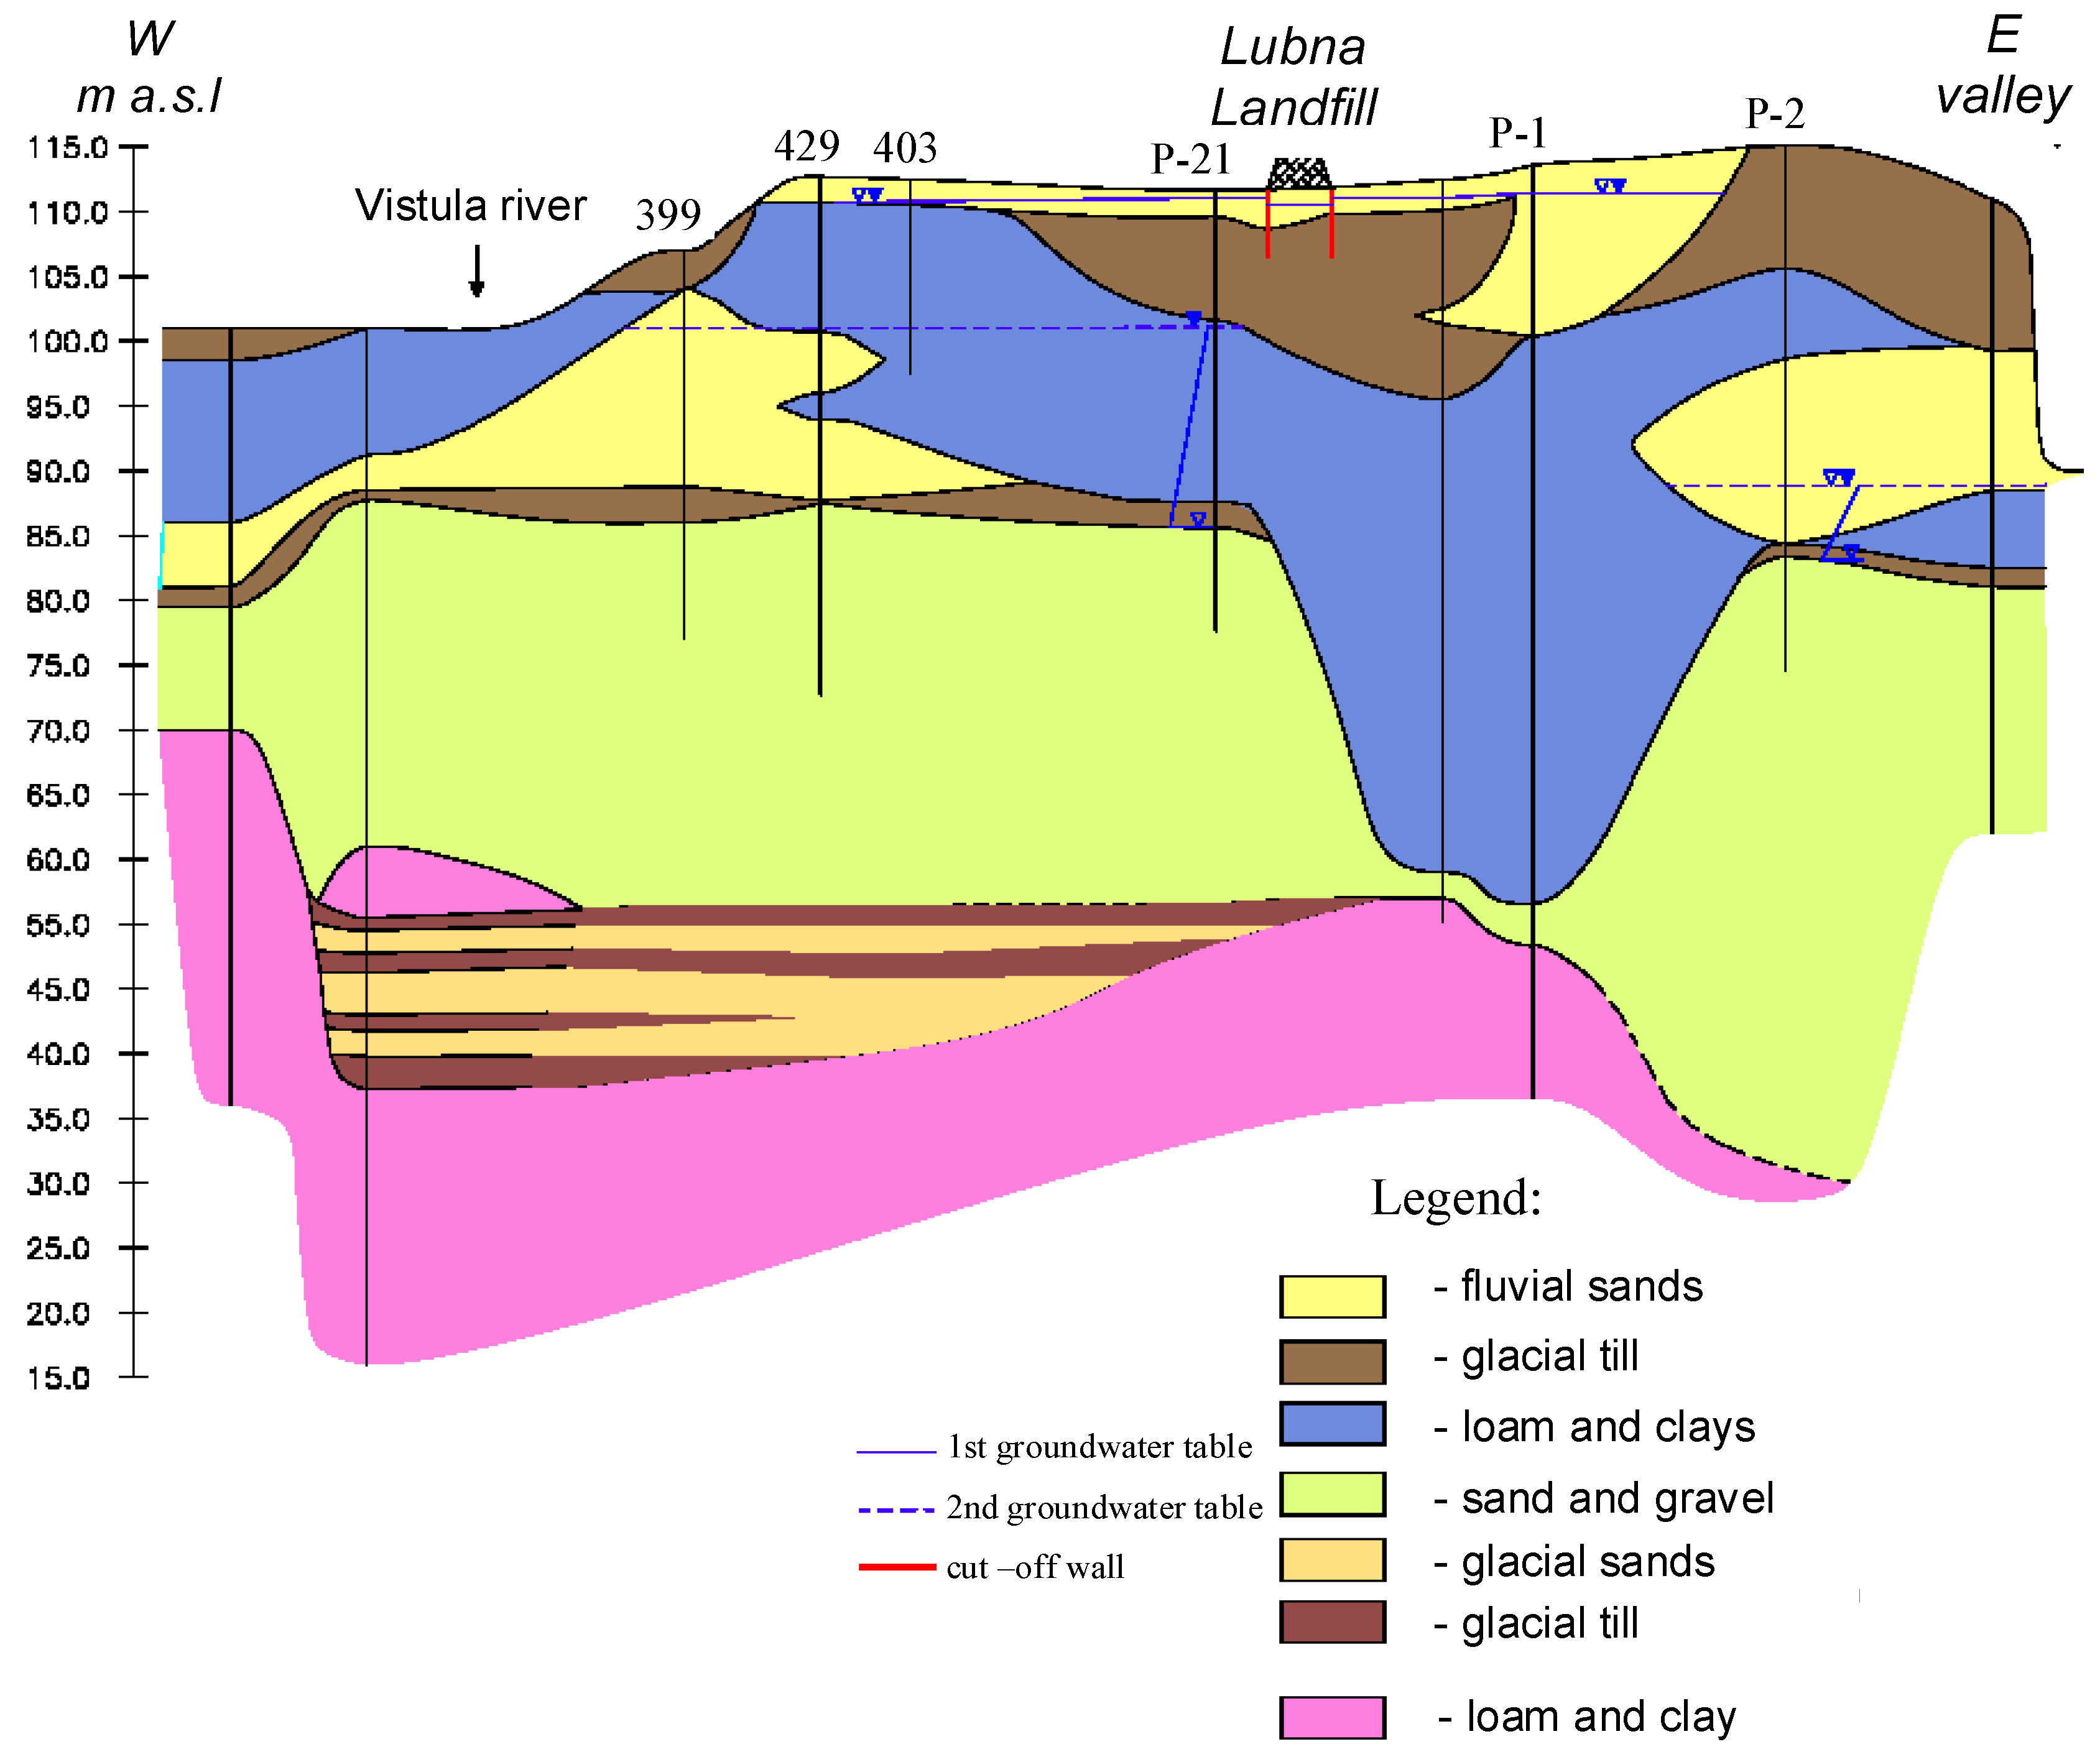
2.2. Morphology and Geological Structure
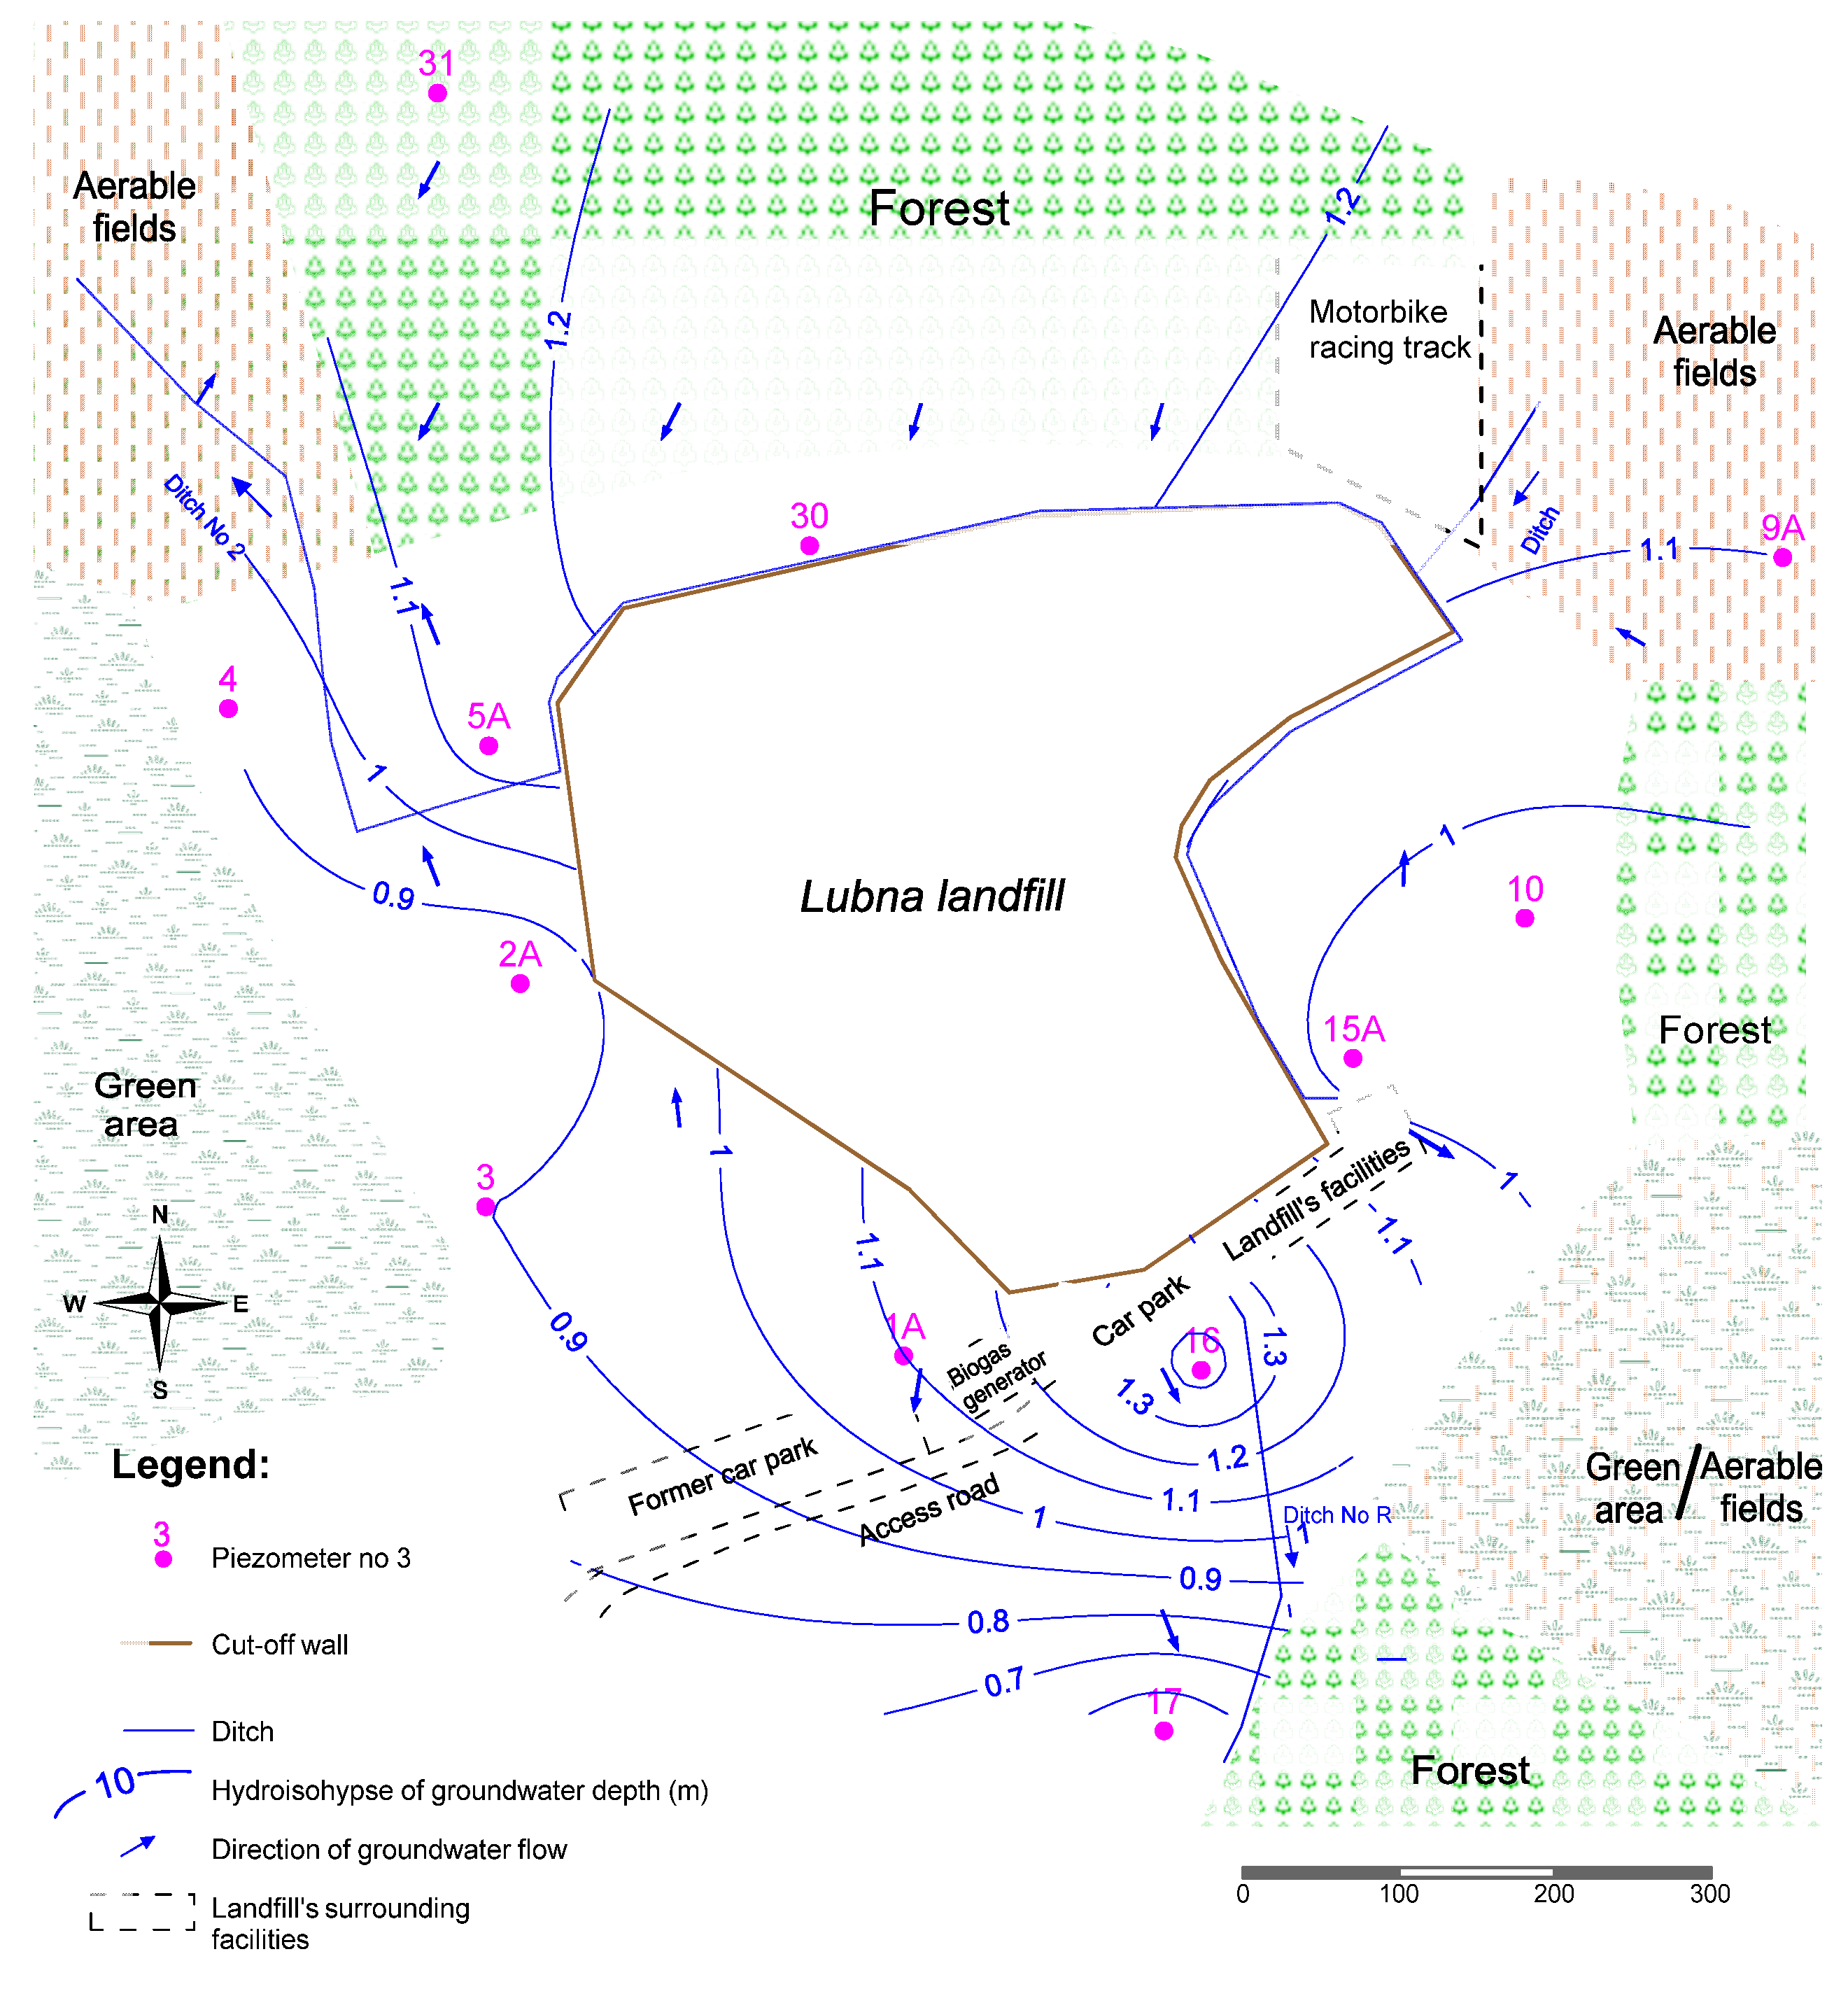
2.3. Hydrography and Hydrogeological Conditions
- fine sands and silty sands—k = 3 × 10⁻⁵ m/s; and
- medium and coarse sands—k = 2 × 10⁻⁴ m/s.
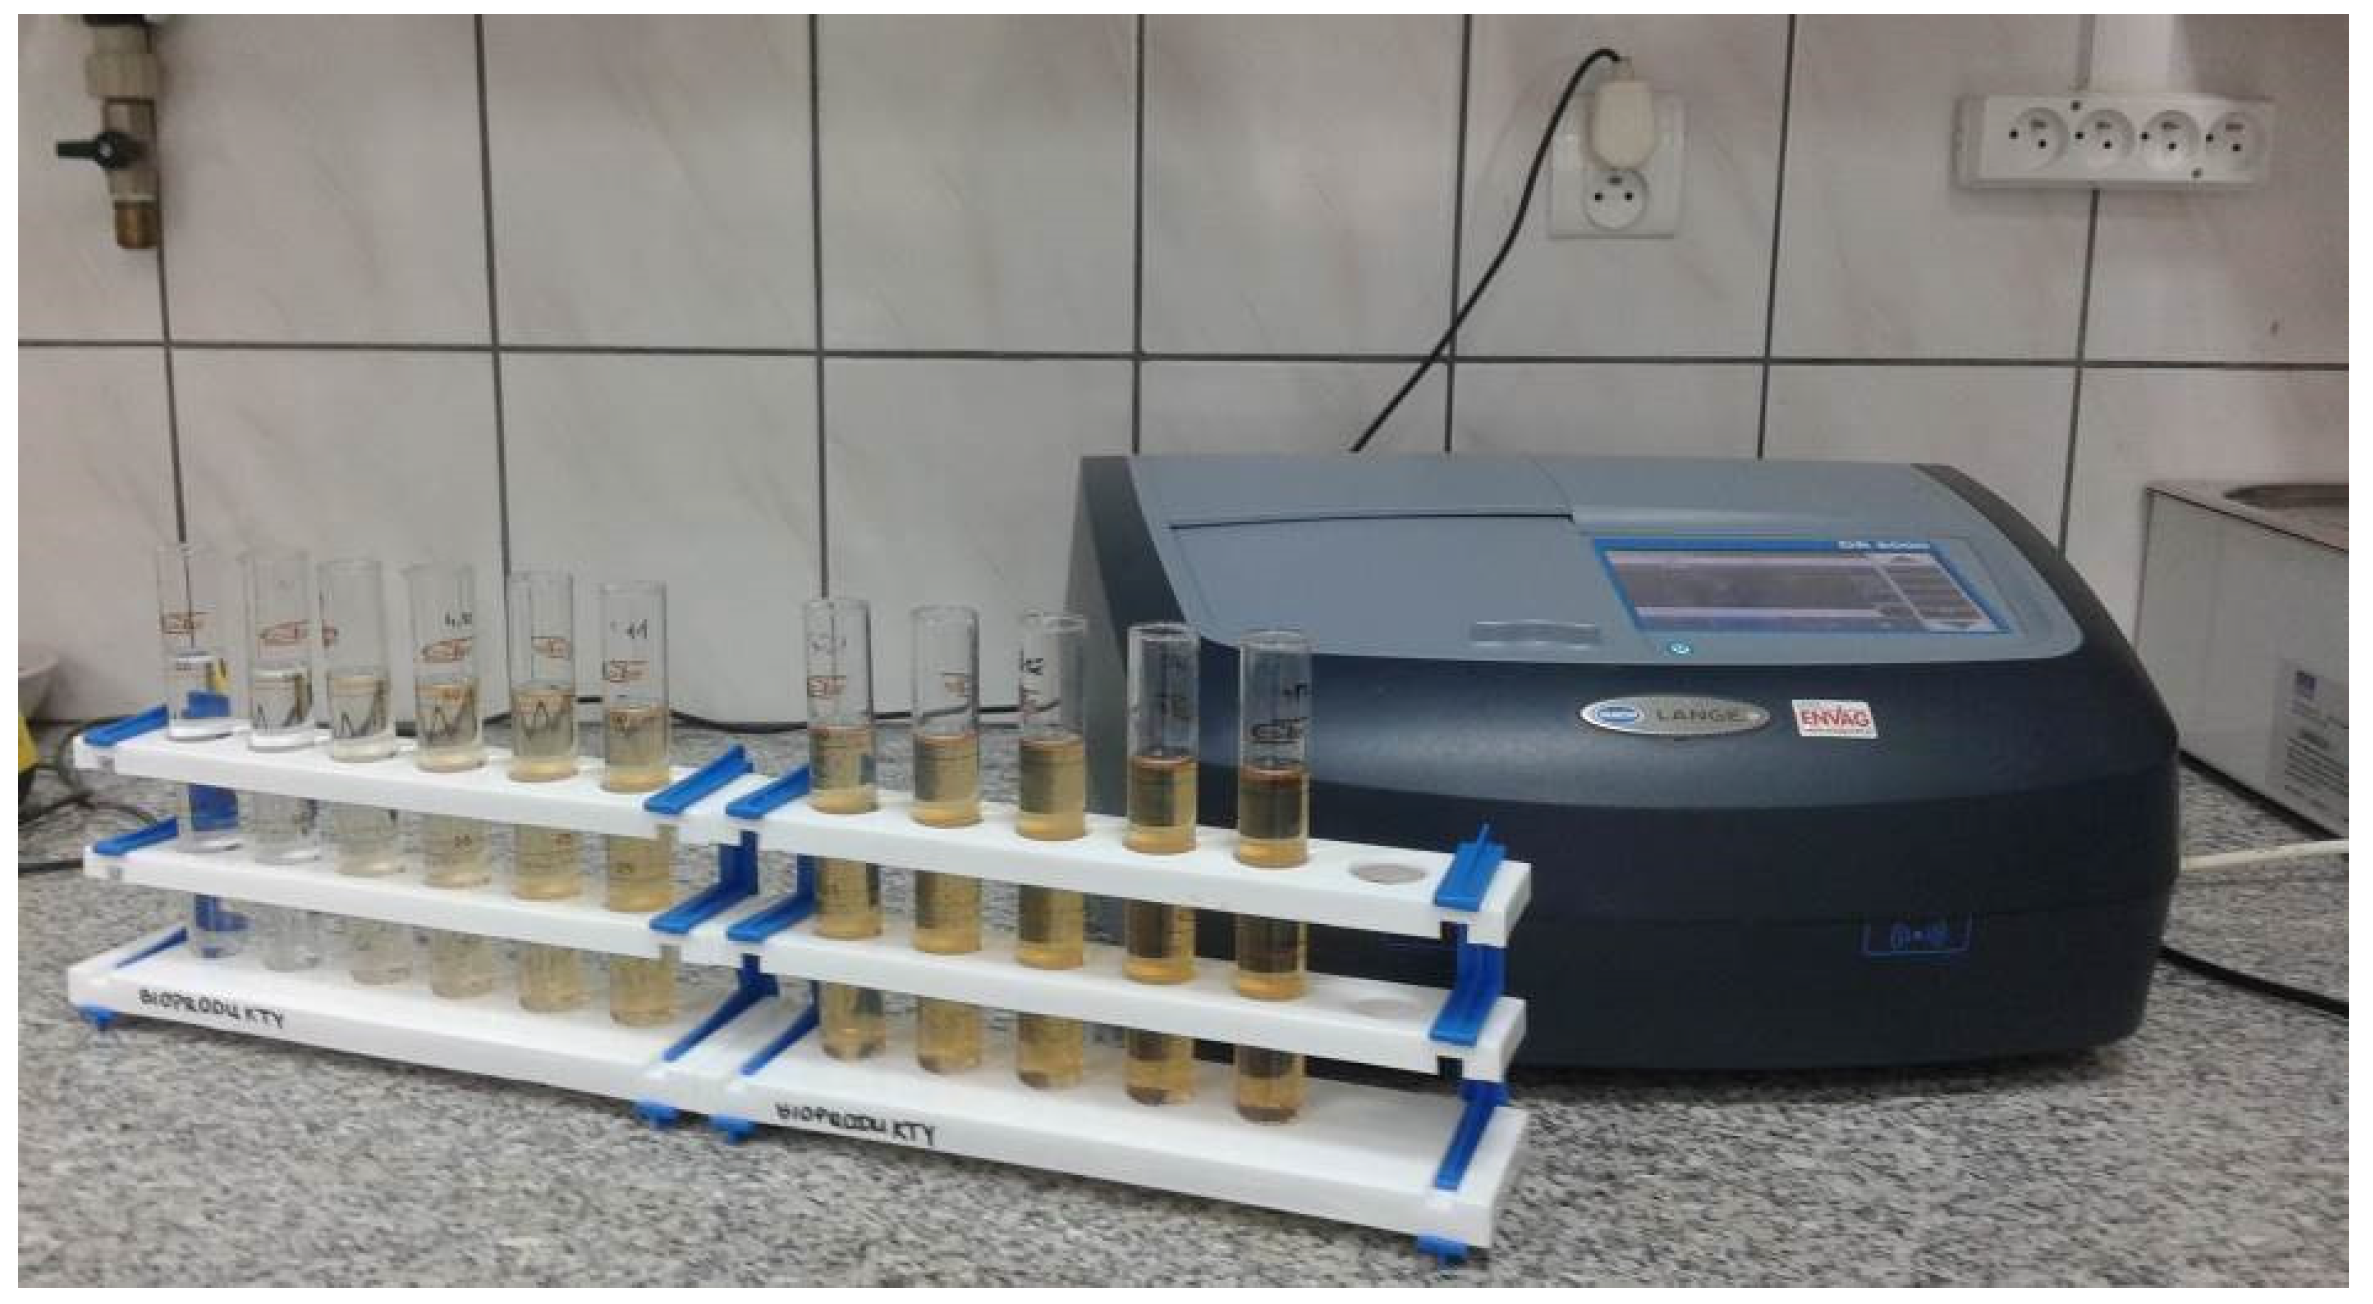
2.4. Sampling Methodology
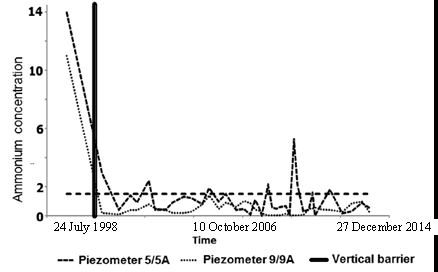
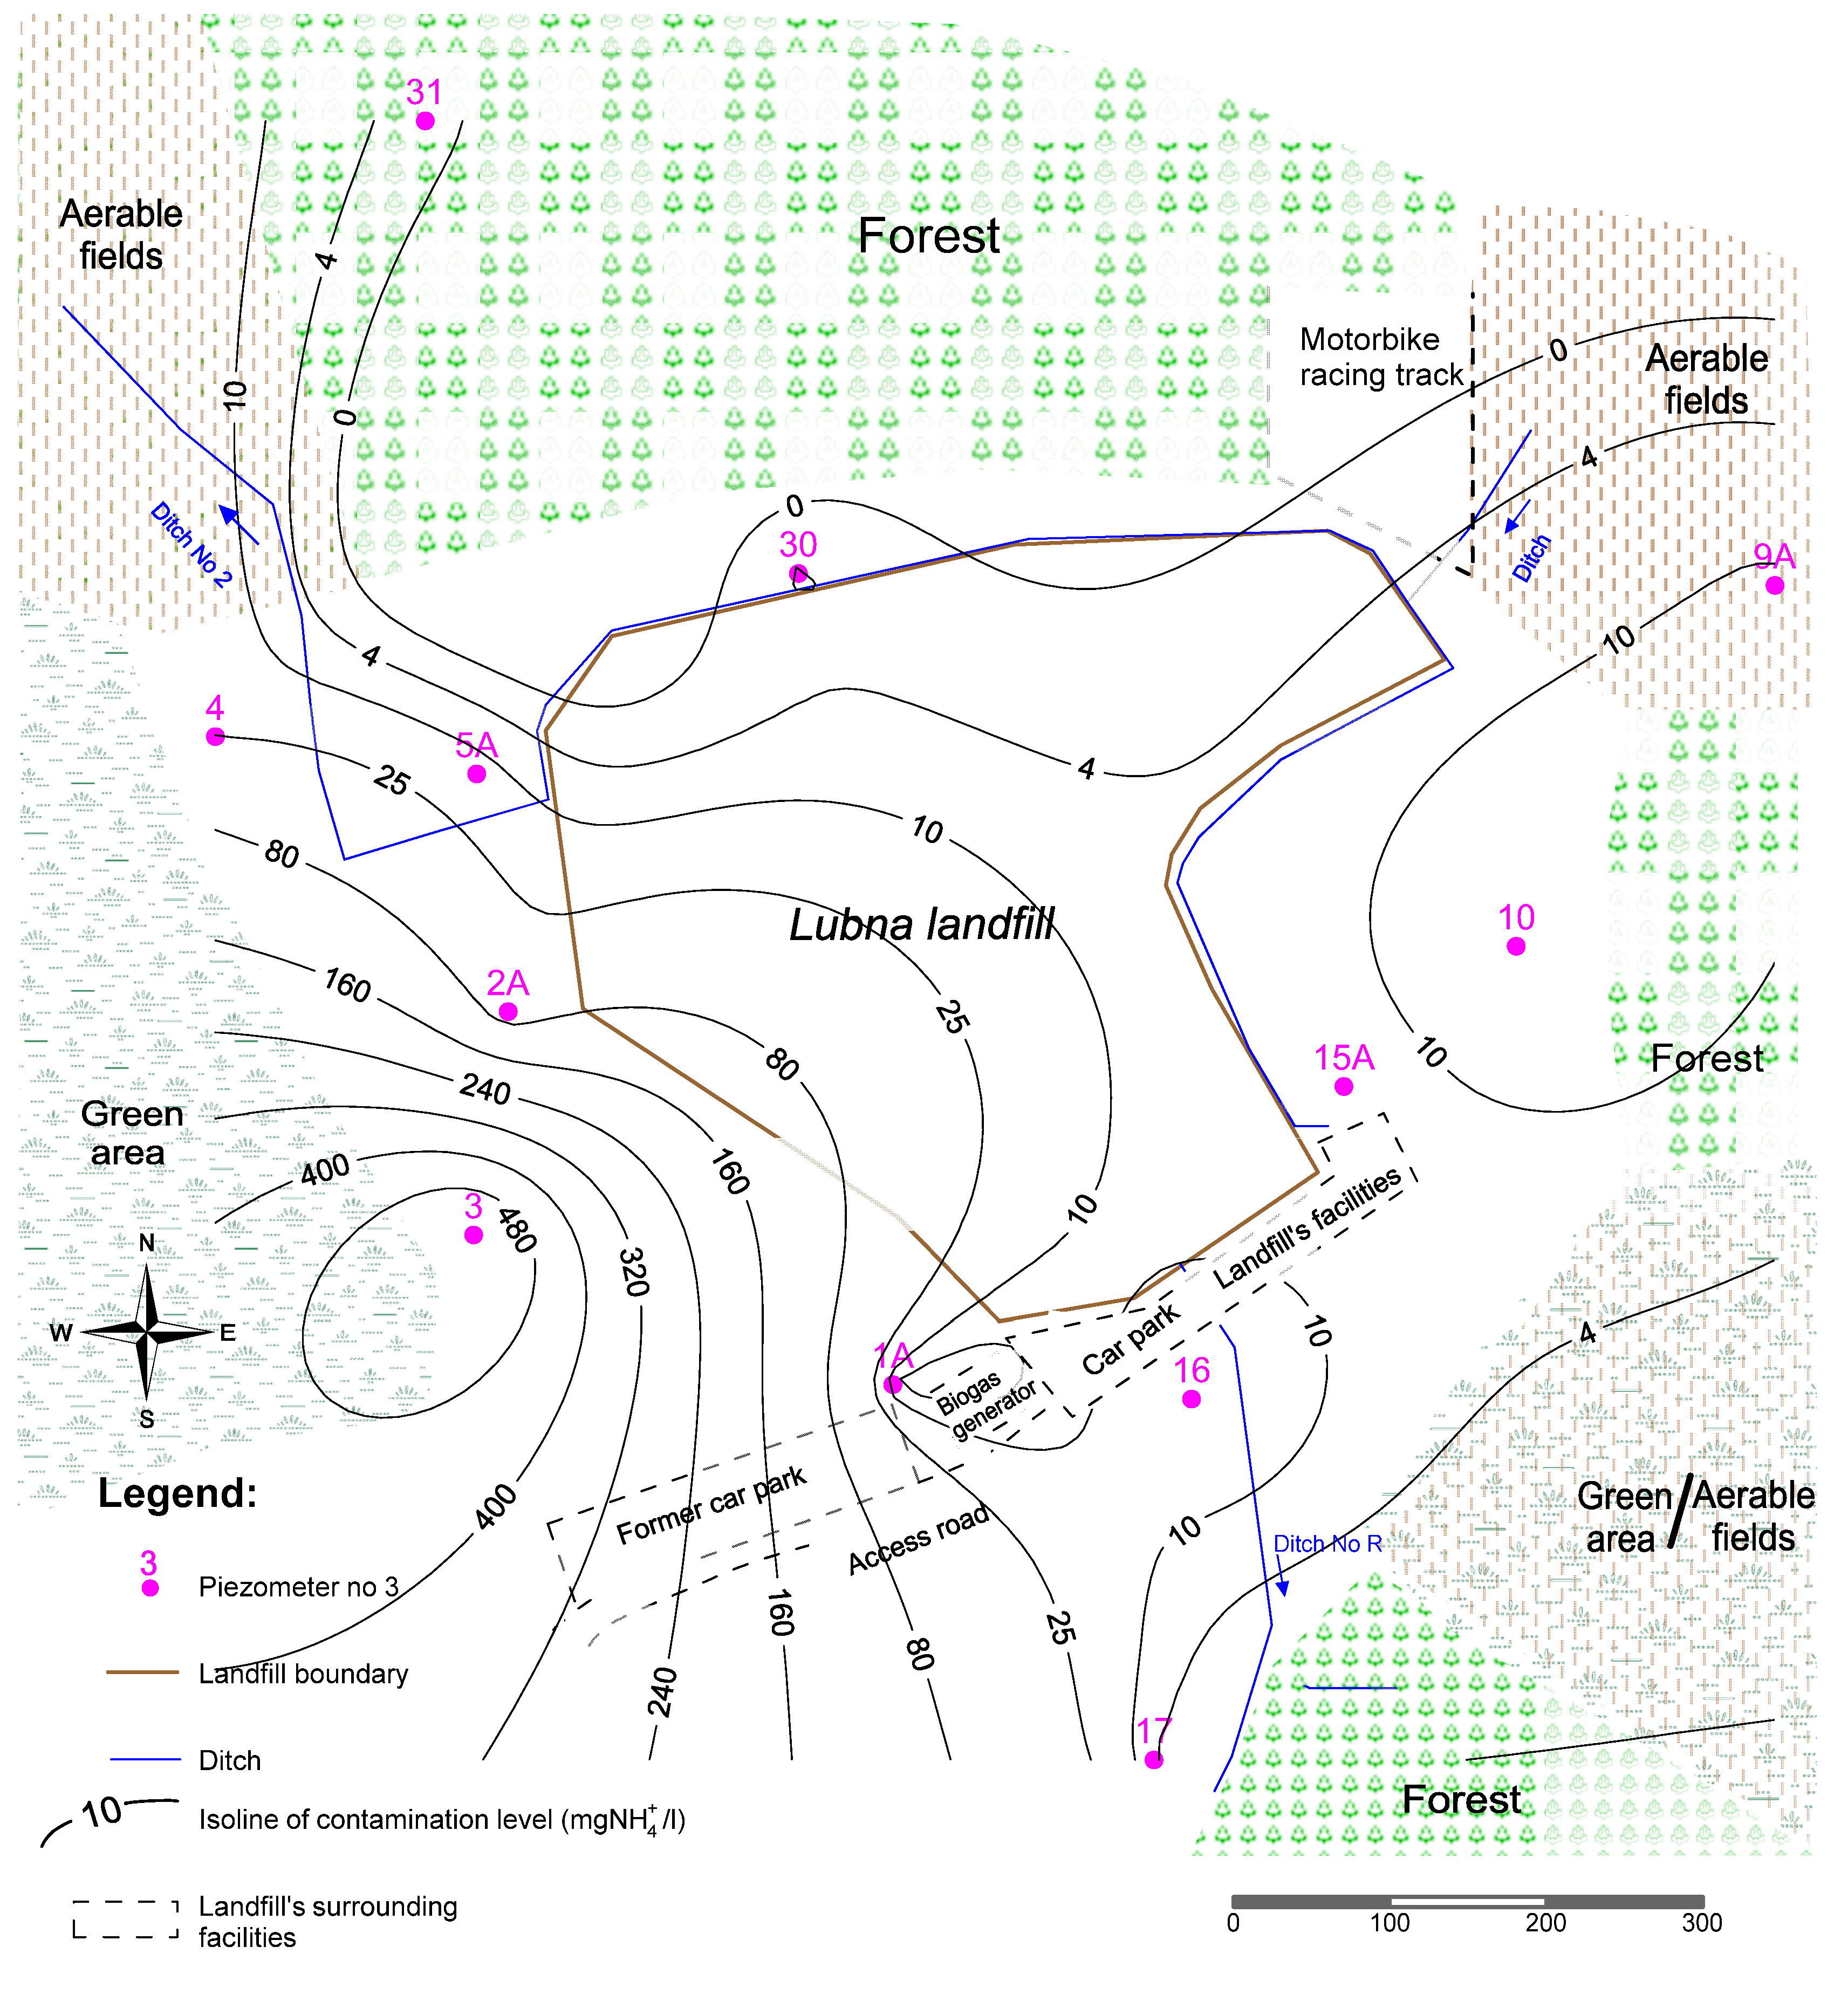
3. Results and Discussion

| No. Piezometer | Concentration of Ammonium [mg NH4-N/L] | |||||
|---|---|---|---|---|---|---|
| Date of Sampling | ||||||
| 25 November 1996 | 02 November 1998 | 03 December 2003 | 12 November 2008 | 30 May 2014 | ||
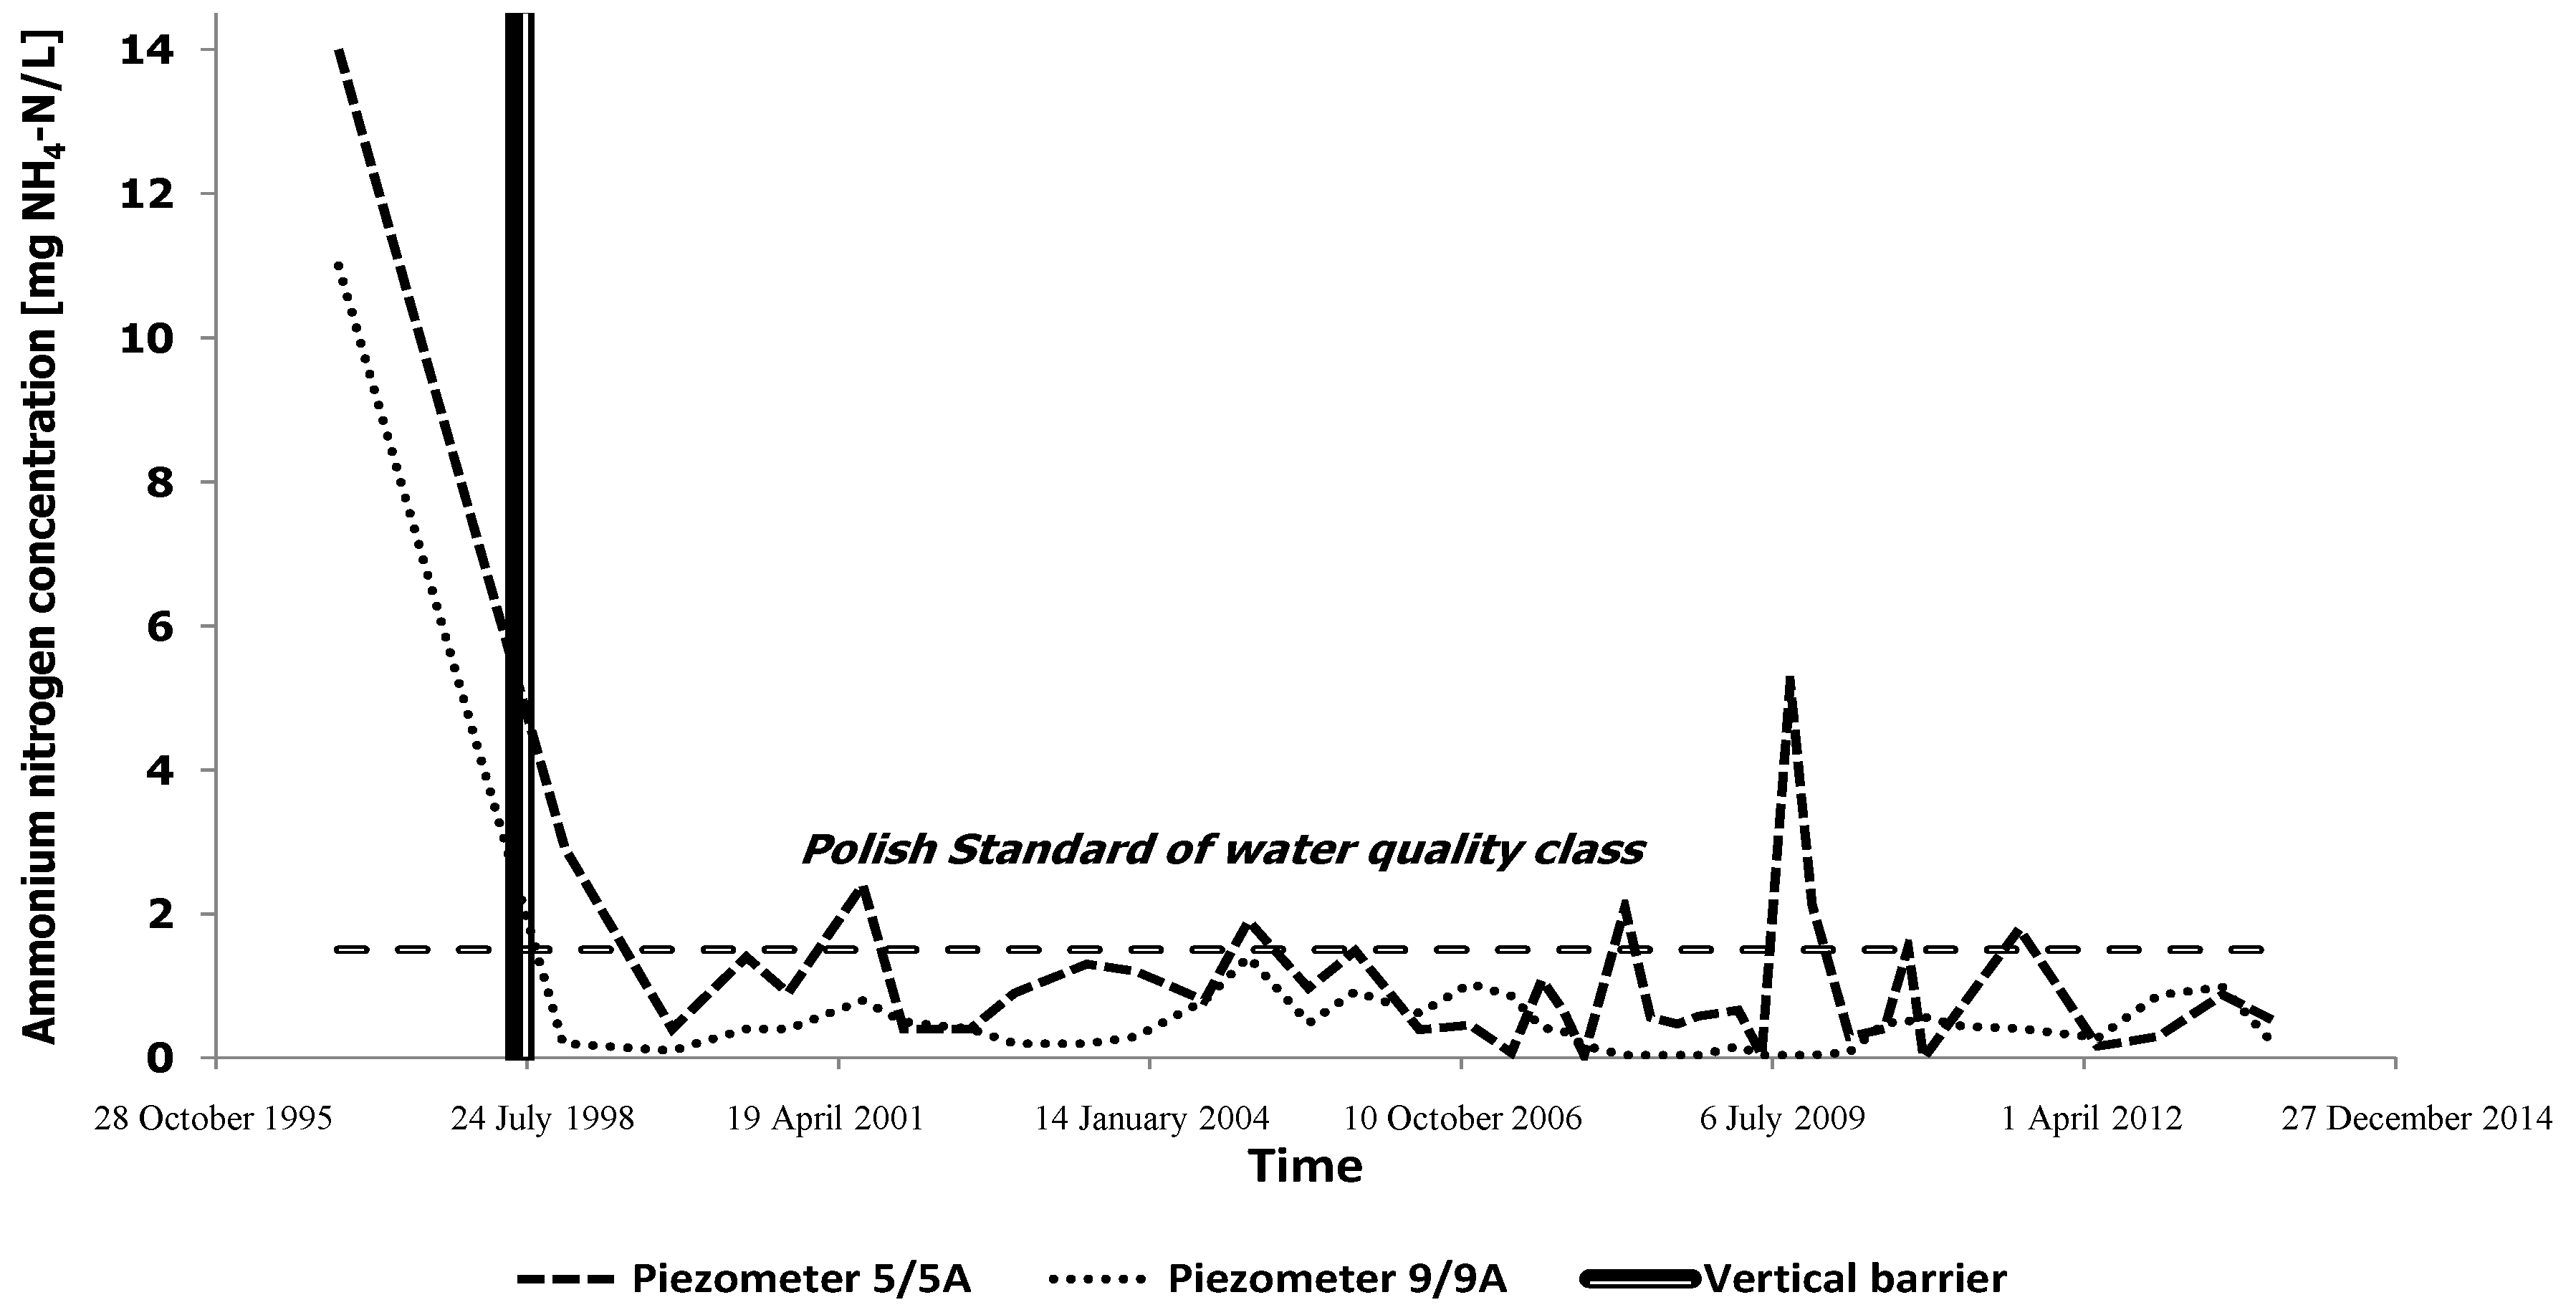
| 1A | 3.0 | Closure of vertical barrier (9 June 1998) | 0.8 | 1.2 | 0.16 | 0.05 |
| 3 | 589 | 588 | 175 | 79.2 | 4.21 | |
| 4 | 24.3 | 3.9 | 2.3 | 3.9 | 3.96 | |
| 5A | 14 | 2.9 | 1.2 | 0.66 | 0.60 | |
| 9A | 11 | 0.2 | 0.3 | 0.16 | 0.14 | |
| 10 | 18 | 0.2 | 0.2 | 0.4 | 0.08 | |
| 11/16 | 22 | 1.6 | 1.4 | 0.85 | 2.42 | |


| No. of Piezometer | Amount of Samples | Min. Value | Max. Value | Mean | Median | Skewness | Std. Dev. | % above Directive Limit |
|---|---|---|---|---|---|---|---|---|
| 1A | 38 | 0.04 | 2.46 | 0.56 | 0.30 | 1.51 | 0.60 | 7.89 |
| 3 | 36 | 27.30 | 589 | 150.54 | 78.70 | 2.02 | 147.76 | 100.00 |
| 4 | 38 | 0.07 | 57.30 | 6.39 | 2.22 | 3.19 | 12.73 | 63.16 |
| 5A | 39 | 0.04 | 5.20 | 1.06 | 0.66 | 2.11 | 1.03 | 23.08 |
| 9A | 39 | 0.04 | 1.40 | 0.41 | 0.40 | 0.97 | 0.34 | 0.00 |
| 10 | 39 | 0.04 | 3.72 | 0.91 | 0.56 | 1.85 | 0.97 | 17.95 |
| 11/16 | 38 | 0.10 | 5.59 | 1.51 | 1.22 | 1.35 | 1.29 | 42.11 |


4. Conclusions
Acknowledgments
Author Contributions
Conflicts of Interest
References
- Gąbka, D.; Wolski, K. Use of Turfgrasses in Landfill Leachate Treatment. Pol. J. Environ. Stud. 2011, 20, 1161–1165. [Google Scholar]
- Koda, E.; Osinski, P.; Kolanka, T. Flow numerical modeling for efficiency assessment of vertical barriers in landfills. In Coupled Phenomena in Environmental Geotechnics: From Theoretical and Experimental Research to Practical Applications, Proceedings of International Symposium TC215 ISSMGE, Torino, Italy, 1–3 July 2013; Manassero, M., Dominijanni, A., Foti, S., Musso, G., Eds.; CRC Press: London, UK, 2013; pp. 693–698. [Google Scholar]
- Wu, L.; Peng, C.; Zhang, S.; Peng, Y. Nitrogen removal via nitrite from municipal landfill leachate. J. Environ. Sci. China 2009, 21, 1480–1485. [Google Scholar] [CrossRef]
- Melendez-Pastor, I.; Almendro-Candel, M.B.; Navarro-Pedreño, J.; Gómez, I.; Hernández, E.I.; Lilo, M.G. Monitoring Urban Wastewaters’ Characteristics by Visible and Short Wave Near-Infrared Spectroscopy. Water 2013, 5, 2026–2036. [Google Scholar] [CrossRef]
- Guo, H.D.; He, P.J.; Shao, L.M.; Li, G.J. Removal of high concentrated ammonia nitrogen from landfill leachate by landfilled waste layer. J. Environ. Sci. China 2004, 16, 802–807. [Google Scholar] [PubMed]
- Christensen, T.H.; Cossu, R.; Stegmann, R. Landfilling of Waste: Leachate; Taylor & Francis: Abingdon, UK, 1992. [Google Scholar]
- Koda, E. Anthropogenic waste products utilization for old landfills rehabilitation. Ann. Wars. Univ. Life Sci. Land Reclam. 2012, 44, 75–88. [Google Scholar] [CrossRef]
- Sobik-Szołtysek, J.; Bień, J.B.; Milczarek, M. Analysis of Filtration Coefficient in the Aspect of Possibilities for Application of Alternative Materials in Building Separation Screens in Landfills. Ann. Set Environ. Prot. 2013, 15, 1393–1410. (In Polish) [Google Scholar]
- Sobik, K. Badanie Wpływu Składowisk Odpadów na środowisko Gruntowo—Wodne na Przykładzie Wybranych Obiektów Zlokalizowanych w Obrębie Zlewni Dunajca. Ph.D. Thesis, AGH University of Science and Technology, Kraków, Polish, 2007. [Google Scholar]
- Mohamed, A.J.; Rahman, I.A.; Lim, L.H. Groundwater quality assessment in the urban-west region of Zanzibar Island. Environ. Monit. Assess. 2014, 186, 6287–6300. [Google Scholar] [CrossRef] [PubMed]
- Wu, G.; Zheng, D.; Xing, L. Nitritation and N2O Emission in a Denitrification and Nitrification Two-Sludge System Treating High Ammonium Containing Wastewater. Water 2014, 6, 2978–2992. [Google Scholar] [CrossRef]
- Piotrowska-Długosz, A.; Wilczewski, E. Assessment of soil nitrogen and related enzymes as influencedby the incorporation time of field pea cultivated as a catch crop in Alfisol. Environ. Monit. Assess. 2014, 186, 8425–8441. [Google Scholar] [CrossRef] [PubMed]
- Gu, D.; Zhu, X.; Vongsay, T.; Huang, M.; Song, L.; He, Y. Phosphorus and Nitrogen Removal Using Novel Porous Bricks Incorporated with Wastes and Minerals. Pol. J. Environ. Stud. 2013, 22, 1349–1356. [Google Scholar]
- Lindenbaum, J. Identification of Sources of Ammonium in Groundwater Using Stable Nitrogen and Boron Isotopes in Dam Du. Hanoi. Master Thesis, Lund University, Lund, Sweden, 2012. [Google Scholar]
- Sri Shalini, S.; Joseph, K. Nitrogen management in landfill leachate: Application of SHARON.ANAMMOX and combined SHARON–ANAMMOX process. Waste Manag. 2012, 32, 2385–2400. [Google Scholar] [CrossRef] [PubMed]
- Kotovicová, J.; Toman, F.; Vaverková, M.; Stejskal, B. Evaluation of Waste Landfills’ Impact on the Environment Using Bioindicators. Pol. J. Environ. Stud. 2011, 20, 371–377. [Google Scholar]
- Lou, Z.; Dong, B.; Chai, X.; Song, Y.; Zhao, Y.; Zhu, N. Characterization of refuse landfill leachates of three different stages in landfill stabilization process. J. Environ. Sci. China 2009, 21, 1309–1314. [Google Scholar] [CrossRef]
- Fronczyk, J.; Garbulewski, K. Evaluation of zeolite-sand mixtures as reactive materials protecting groundwater at waste disposal sites. J. Environ. Sci. China 2013, 25, 1764–1772. [Google Scholar]
- Othman, E.; Yusoff, M.S.; Aziz, H.A.; Adlan, M.N.; Bashir, M.J.K.; Hung, Y.T. The Effectiveness of Silica Sand in Semi-Aerobic StabilizedLandfill Leachate Treatment. Water 2010, 2, 904–915. [Google Scholar] [CrossRef]
- McBean, E.A.; Rovers, F.A.; Farquhar, G.J. Solid Waste Landfill Engineering and Design; Prentice Hall: Upper Saddle River, NJ, USA, 1995. [Google Scholar]
- Lind, S.; Nordh, M. Ammonium Removal from Landfill Leachate by Use of Ashes. TRITA-LWR M.Sc. Thesis, University of Stockholm, Stockholm, Sweden, 2004. [Google Scholar]
- Gworek, B.; Hajduk, A.; Koda, E.; Grochowalski, A.; Jeske, A. Influence of a municipal waste landfill on the spatial distribution of polychlorinated dibenzo-p-dioxins and dibenzofurans (PCDDs/Fs) in the natural environment. Chemosphere 2013, 92, 753–759. [Google Scholar] [CrossRef] [PubMed]
- Evanylo, G.; Ervin, E.; Zhang, X. Reclaimed Water for Turfgrass Irrigation. Water 2010, 2, 685–701. [Google Scholar] [CrossRef]
- Golimowski, J.; Koda, E. Assessment of remedial works effectiveness on water quality in the vicinity of Łubna landfill based on monitoring research. Ann. Wars. Agric. Univ. SGGW Land Reclam. 2001, 32, 17–30. [Google Scholar]
- Mayzelle, M.M.; Viers, J.H.; Medellín-Azuara, J.; Harter, T. Economic Feasibility of Irrigated Agricultural Land Use Buffers to Reduce Groundwater Nitrate in Rural Drinking Water Sources. Water 2015, 7, 12–37. [Google Scholar] [CrossRef]
- Wychowaniak, D. Pollutant transport in vicinity of old landfill with vertical barrier. Sci. Rev. Eng. Environ. Sci. 2013, 59, 45–55. (In Polish) [Google Scholar]
- Nielsen, D.M. Practical Handbook of Environmental Site Characterization and Ground-Water Monitoring, 2nd ed.; CRC Press: Boca Raton, FL, USA, 2005. [Google Scholar]
- ISO 5667-3 Water Quality. Sampling. Part 3: Preservation and Handling of Water Samples. Available online: http://www.iso.org/iso/catalogue_detail.htm?csnumber=53569 (accessed on 25 May 2015).
- ISO 5667-11 Water Quality. Sampling. Part 11: Guidance on Sampling of Groundwaters. Available online: http://www.iso.org/iso/catalogue_detail.htm?csnumber=42990 (accessed on 25 May 2015).
- EN ISO 11732 Water Quality. Determination of Ammonium Nitrogen. Method by Flow Analysis (CFA and FIA) and Spectrometric Detection. Available online: http://www.iso.org/iso/iso_catalogue/catalogue_tc/catalogue_detail.htm?csnumber=38924 (accessed on 25 May 2015).
- Directive 2000/60/EC of the European Parliament and of the Council of 23 October 2000 Establishing a Framework for Community Action in the Field of Water Policy. Available online: http://faolex.fao.org/cgi-bin/faolex.exe?rec_id=017501&database=faolex&search_type=link&table=result&lang=eng&format_name=@ERALL (accessed on 25 May 2015).
- Directive 2006/118/EC of the European Parliament and of the Council of 12 December 2006 on the Protection of Groundwater Against Pollution and Deterioration. Available online: http://faolex.fao.org/cgi-bin/faolex.exe?rec_id=052708&database=faolex&search_type=link&table=result&lang=eng&format_name=@ERALL (accessed on 25 May 2015).
© 2015 by the authors; licensee MDPI, Basel, Switzerland. This article is an open access article distributed under the terms and conditions of the Creative Commons Attribution license (http://creativecommons.org/licenses/by/4.0/).
Share and Cite
Koda, E.; Osinski, P.; Sieczka, A.; Wychowaniak, D. Areal Distribution of Ammonium Contamination of Soil-Water Environment in the Vicinity of Old Municipal Landfill Site with Vertical Barrier. Water 2015, 7, 2656-2672. https://doi.org/10.3390/w7062656
Koda E, Osinski P, Sieczka A, Wychowaniak D. Areal Distribution of Ammonium Contamination of Soil-Water Environment in the Vicinity of Old Municipal Landfill Site with Vertical Barrier. Water. 2015; 7(6):2656-2672. https://doi.org/10.3390/w7062656
Chicago/Turabian StyleKoda, Eugeniusz, Piotr Osinski, Anna Sieczka, and Dorota Wychowaniak. 2015. "Areal Distribution of Ammonium Contamination of Soil-Water Environment in the Vicinity of Old Municipal Landfill Site with Vertical Barrier" Water 7, no. 6: 2656-2672. https://doi.org/10.3390/w7062656