Article

Effect of Incident Rainfall Redistribution by Maize Canopy on Soil Moisture at the Crop Row Scale

1
Department of Agronomy, Food, Natural resources, Animals and Environment, Agripolis, University of Padova, Viale Dell'Università 16, Legnaro (Padova) 35020, Italy
2
Department of Land, Environment, Agriculture and Forestry, Agripolis, University of Padova, Viale Dell'Università 16, Legnaro (Padova) 35020, Italy
*
Author to whom correspondence should be addressed.
Water 2015, 7(5), 2254-2271; https://doi.org/10.3390/w7052254
Submission received: 24 March 2015 / Revised: 8 May 2015 / Accepted: 11 May 2015 / Published: 15 May 2015

Abstract

:
The optimization of irrigation use in agriculture is a key challenge to increase farm profitability and reduce its ecological footprint. To this context, an understanding of more efficient irrigation systems includes the assessment of water redistribution at the microscale. This study aimed to investigate rainfall interception by maize canopy and to model the soil water dynamics at row scale as a result of rain and sprinkler irrigation with HYDRUS 2D/3D. On average, 78% of rainfall below the maize canopy was intercepted by the leaves and transferred along the stem (stemflow), while only 22% reached the ground directly (throughfall). In addition, redistribution of the water with respect to the amount (both rain and irrigation) showed that the stemflow/throughfall ratio decreased logarithmically at increasing values of incident rainfall, suggesting the plant capacity to confine the water close to the roots and diminish water stress conditions. This was also underlined by higher soil moisture values observed in the row than in the inter-row at decreasing rainfall events. Modelled data highlighted different behavior in terms of soil water dynamics between simulated irrigation water distributions, although they did not show significant changes in terms of crop water use efficiency. These results were most likely affected by the soil type (silty-loam) where the experiment was conducted, as it had unfavorable physical conditions for the rapid vertical water movement that would have increased infiltration and drainage.

1. Introduction

The competition for freshwater between agricultural, industrial and civil uses has intensified over the last few years, worsened by the negative effects of climate change and pollution. The sustainable use of water in agriculture is therefore a priority in order to minimize potential future inter-sectorial conflicts and meanwhile increase benefits in terms of farm profitability and ecological footprint.
Innovations are mainly required in the irrigation sector [1], which accounts for ca. 85% of the global freshwater consumption [2]. Advances in irrigation have focused on the assessment of water interception by the crop canopy [3,4] and its effect on water redistribution [5]. Indeed, incident rainfall is partly intercepted by the leaves and then flows down the stem (i.e., stemflow) and partly falls directly to the ground without leaf interception (i.e., throughfall). This results in microscale variability in infiltration, distribution and root water uptake [6]. Van Weesenbeck and Kachanoski [7] studied the soil moisture dynamics in maize, observing that in-row soil water infiltration was greater than in the inter-row, as a consequence of stemflow interception. These results were confirmed by Hupet and Vanclooster [6], who measured a wide variability of rainfall beneath the maize canopy, ranging from 78% to 189%, with some areas receiving up to 4.5-times more water than incident rainfall. Paltineanu and Starr [8] found an inverse third-order relationship between the stemflow/throughfall ratio and rainfall that highlighted a sharp increase of water interception localized on the stem at decreasing values of incident rainfall.
So far, traditional simulation models have assumed that in the “soil-plant-atmosphere” system, the incident rain that reaches the ground is uniform and evenly distributed on the soil surface [6]. However, representing the canopy interception effects in hydraulic models could be useful for simulating irrigation water dynamics at the microscale. This would be helpful for selecting the most appropriate irrigation systems and, in some cases, justifying the adoption of down canopy application systems, such as low-energy precision application (LEPA) irrigation [9,10].
Although several studies have measured the redistribution of rainfall by maize vegetation, only a few have conceptualized the dynamics of the plant interception at various rainfall intensities and its effects on water distribution in the soil [6,8]. Therefore, a key question is whether the maize canopy interception is a major factor for an optimal prediction of water use efficiency in irrigation systems. In order to investigate the role of canopy interception on water balance at the microscale, we aimed to measure and conceptualize the rainfall canopy redistribution below a fully-developed maize canopy. Its effects on water dynamics were then simulated by a numerical model with the final goal of comparing sprinkler irrigation with an alternative down canopy method.

2. Materials and Methods

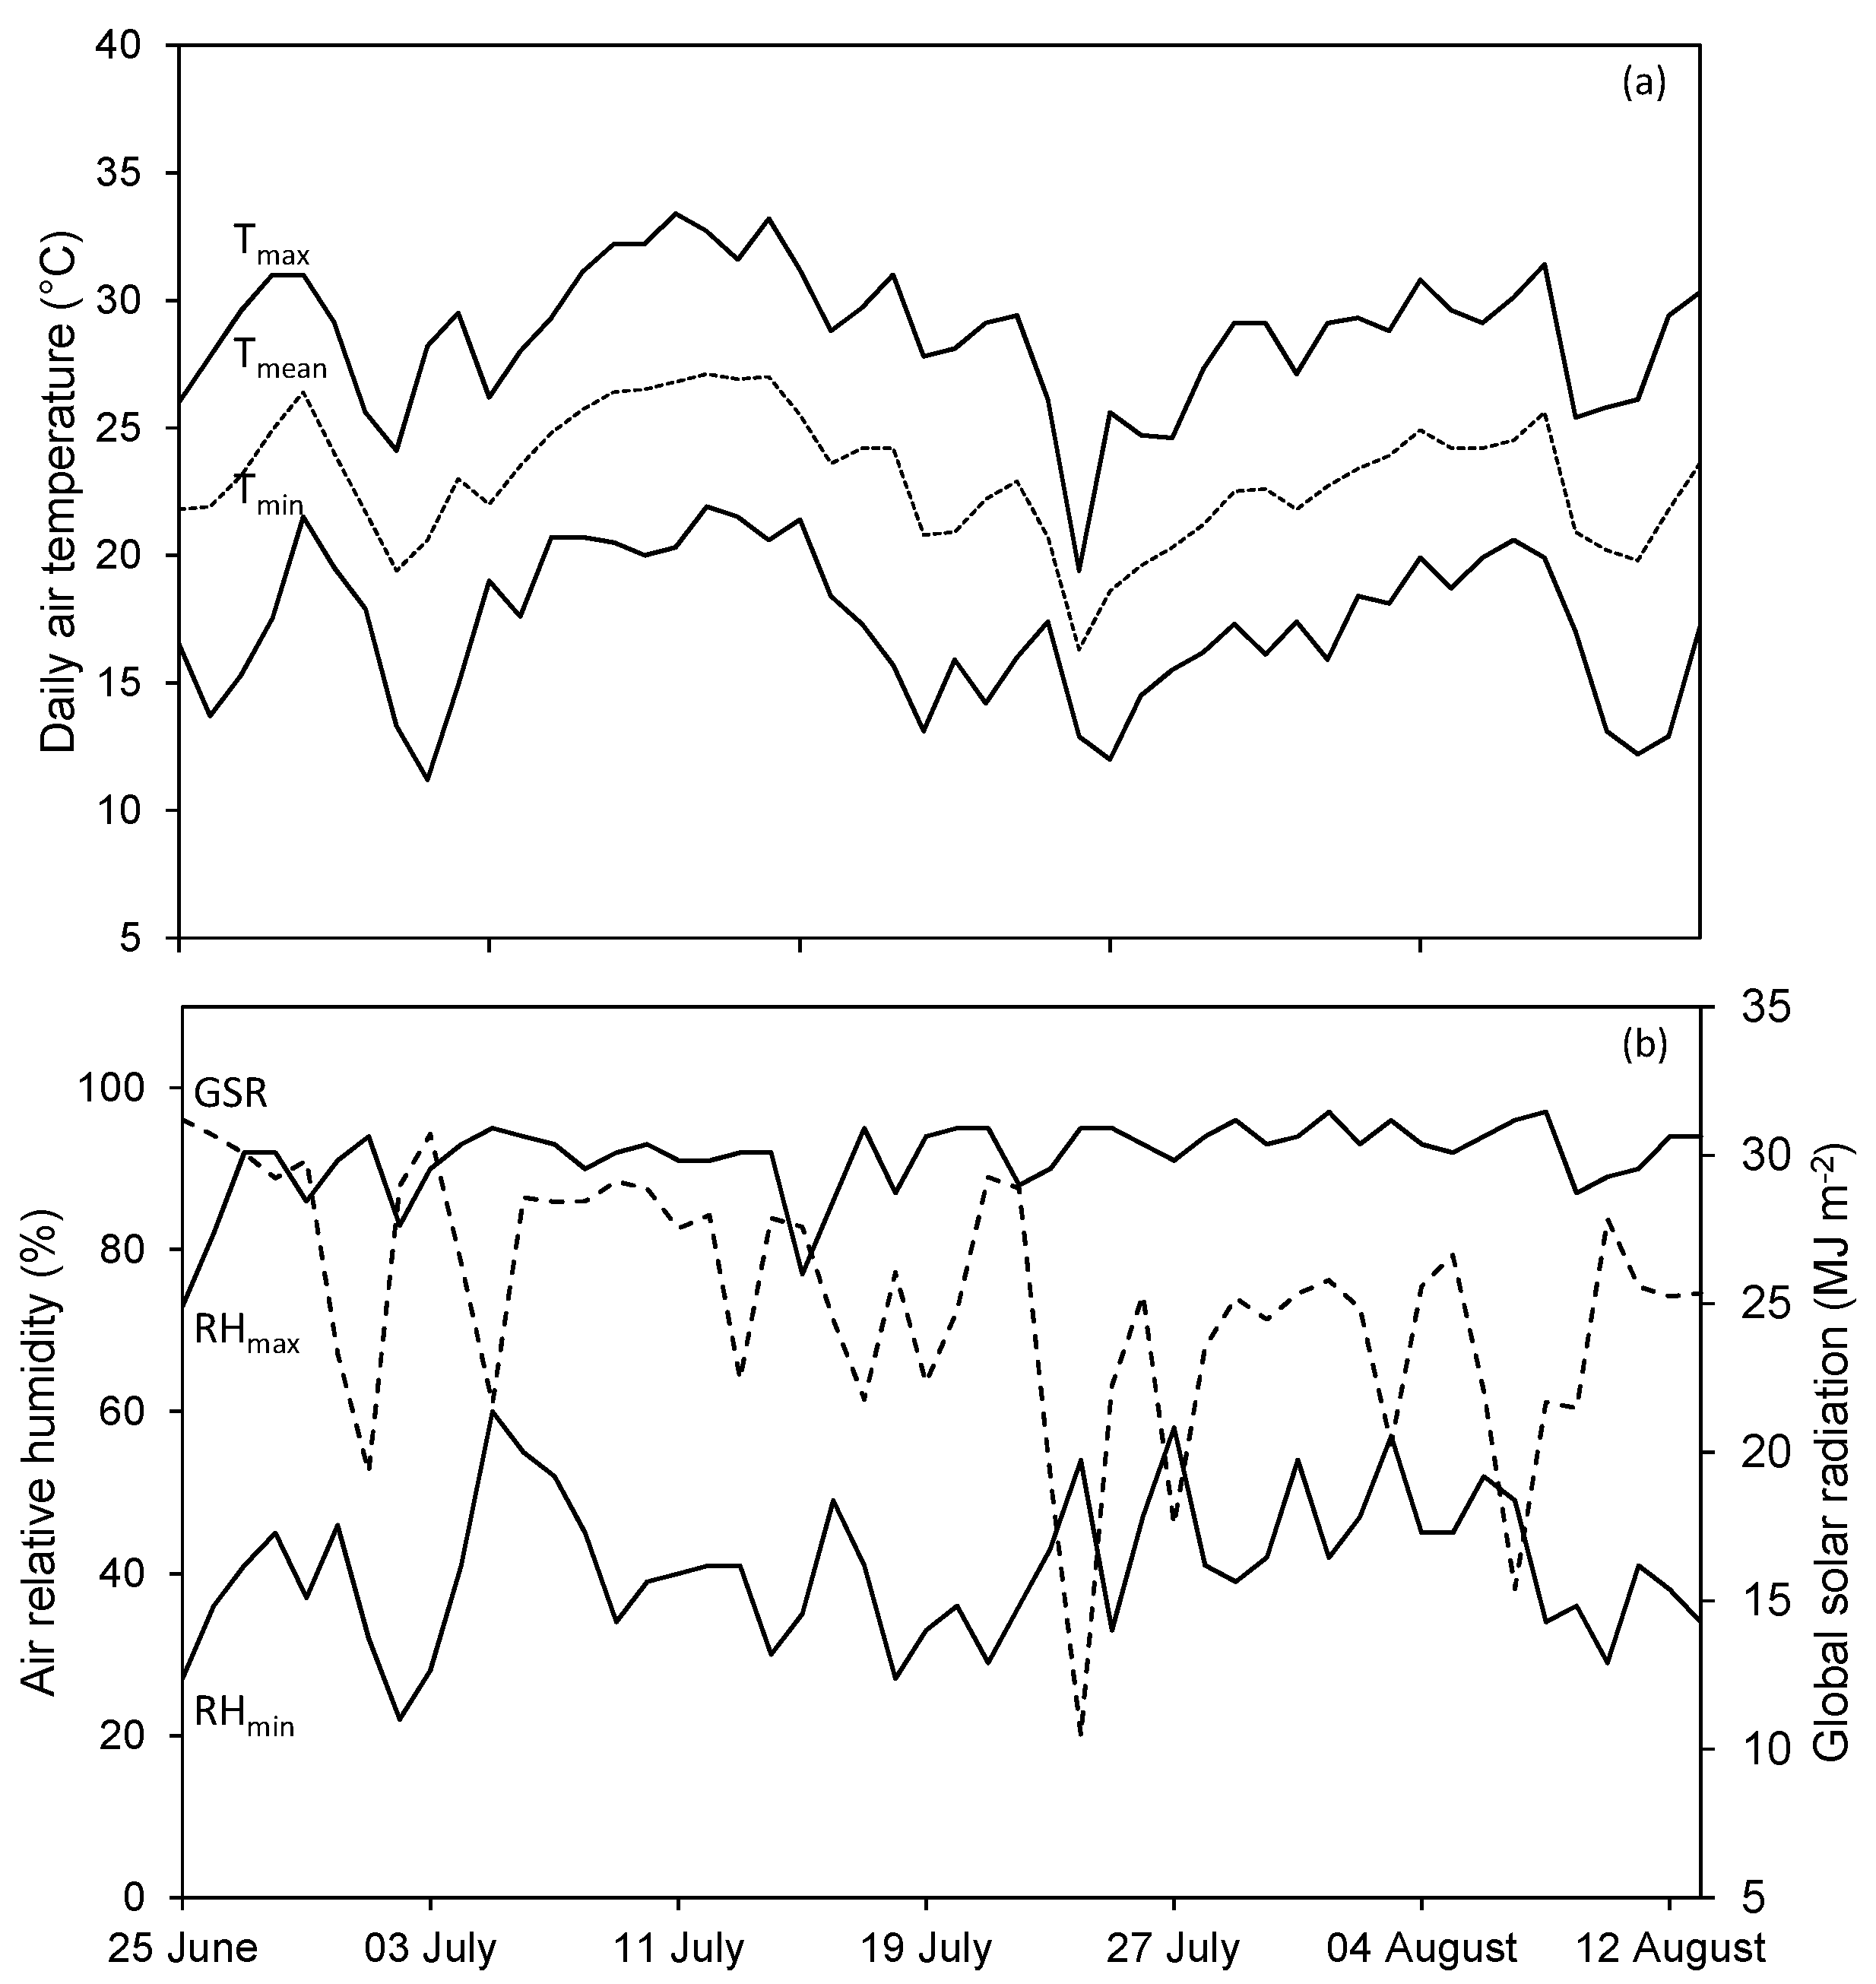
2.1. Description of Experimental Site and Agronomic Management

The study was conducted at the Experimental Farm of the University of Padova, Legnaro, Italy (45°20′26″ N; 11°58′0″ E). The local climate is sub-humid, with mean annual rainfall of about 850 mm distributed fairly uniformly throughout the year. From December to February, the temperature rarely falls below zero, while maximum temperatures in summer vary from 25 to 30 °C during the day and 18 to 20 °C during the night. The summer period (from June to August) is generally characterized by a mean rainfall of ca. 210 mm, with a maximum of 100 mm observed in June (95%) and a minimum of 50 mm in August (95%). Rainfall intensity can reach up to 30 mm·h−1 with a recurrence interval of 10 years, while more frequently (recurrence interval of 1 year), rain falls with an intensity of 20 mm·h−1. Finally, the average duration of rain events is 2.5 h (standard error = 0.26).
The soil is a silt loam (sand, 16.7%; silt, 78.5%; clay, 4.8%) Fluvi-Calcaric Cambisol [11], whose infiltration rates vary from 0.1 to 10 cm·h−1 [12], with 6.8 g·kg−1 of organic carbon.
The experiment was conducted in 2011 from 25 June to 13 August on a field (9880 m2) cultivated with maize (Zea mays L. cultivar “Pioneer PR31N25”-FAO 600) when the canopy was fully developed and uniformly distributed with a leaf area index (LAI) of 4. During experimentation, the mean daily temperature varied between 16.3 °C on 24 July and 27.1 °C on 12 July, while the daily air relative humidity was 66% (Figure 1), and the wind speed was always below 1.3 m·s−1 during irrigation events, following the standard provided by ISO 7749-2 (1990) [13].
Figure 1. Weather conditions during the experimental season: (a) daily air temperature and (b) air relative humidity (RH) and global solar radiation (GSR).
Water 07 02254 g001
The seedbed had been prepared in autumn with a 30-cm ploughing depth. The sowing was in April at a depth of 3 cm and a distance of 75 cm between the rows, 20 cm in the row. The nitrogen (N) fertilization consisted of three split-applications, 200 kg·N·ha−1 as cattle slurry in autumn, 24 kg·N·ha−1 and 138 kg·N·ha−1 as mineral fertilizer at sowing and inter-row hoeing, respectively. A single travelling big gun sprinkler was used for irrigation twice at doses of 43 mm depth on 4 July and 28 mm depth on 2 August, with an average intensity of 15 mm·h−1.

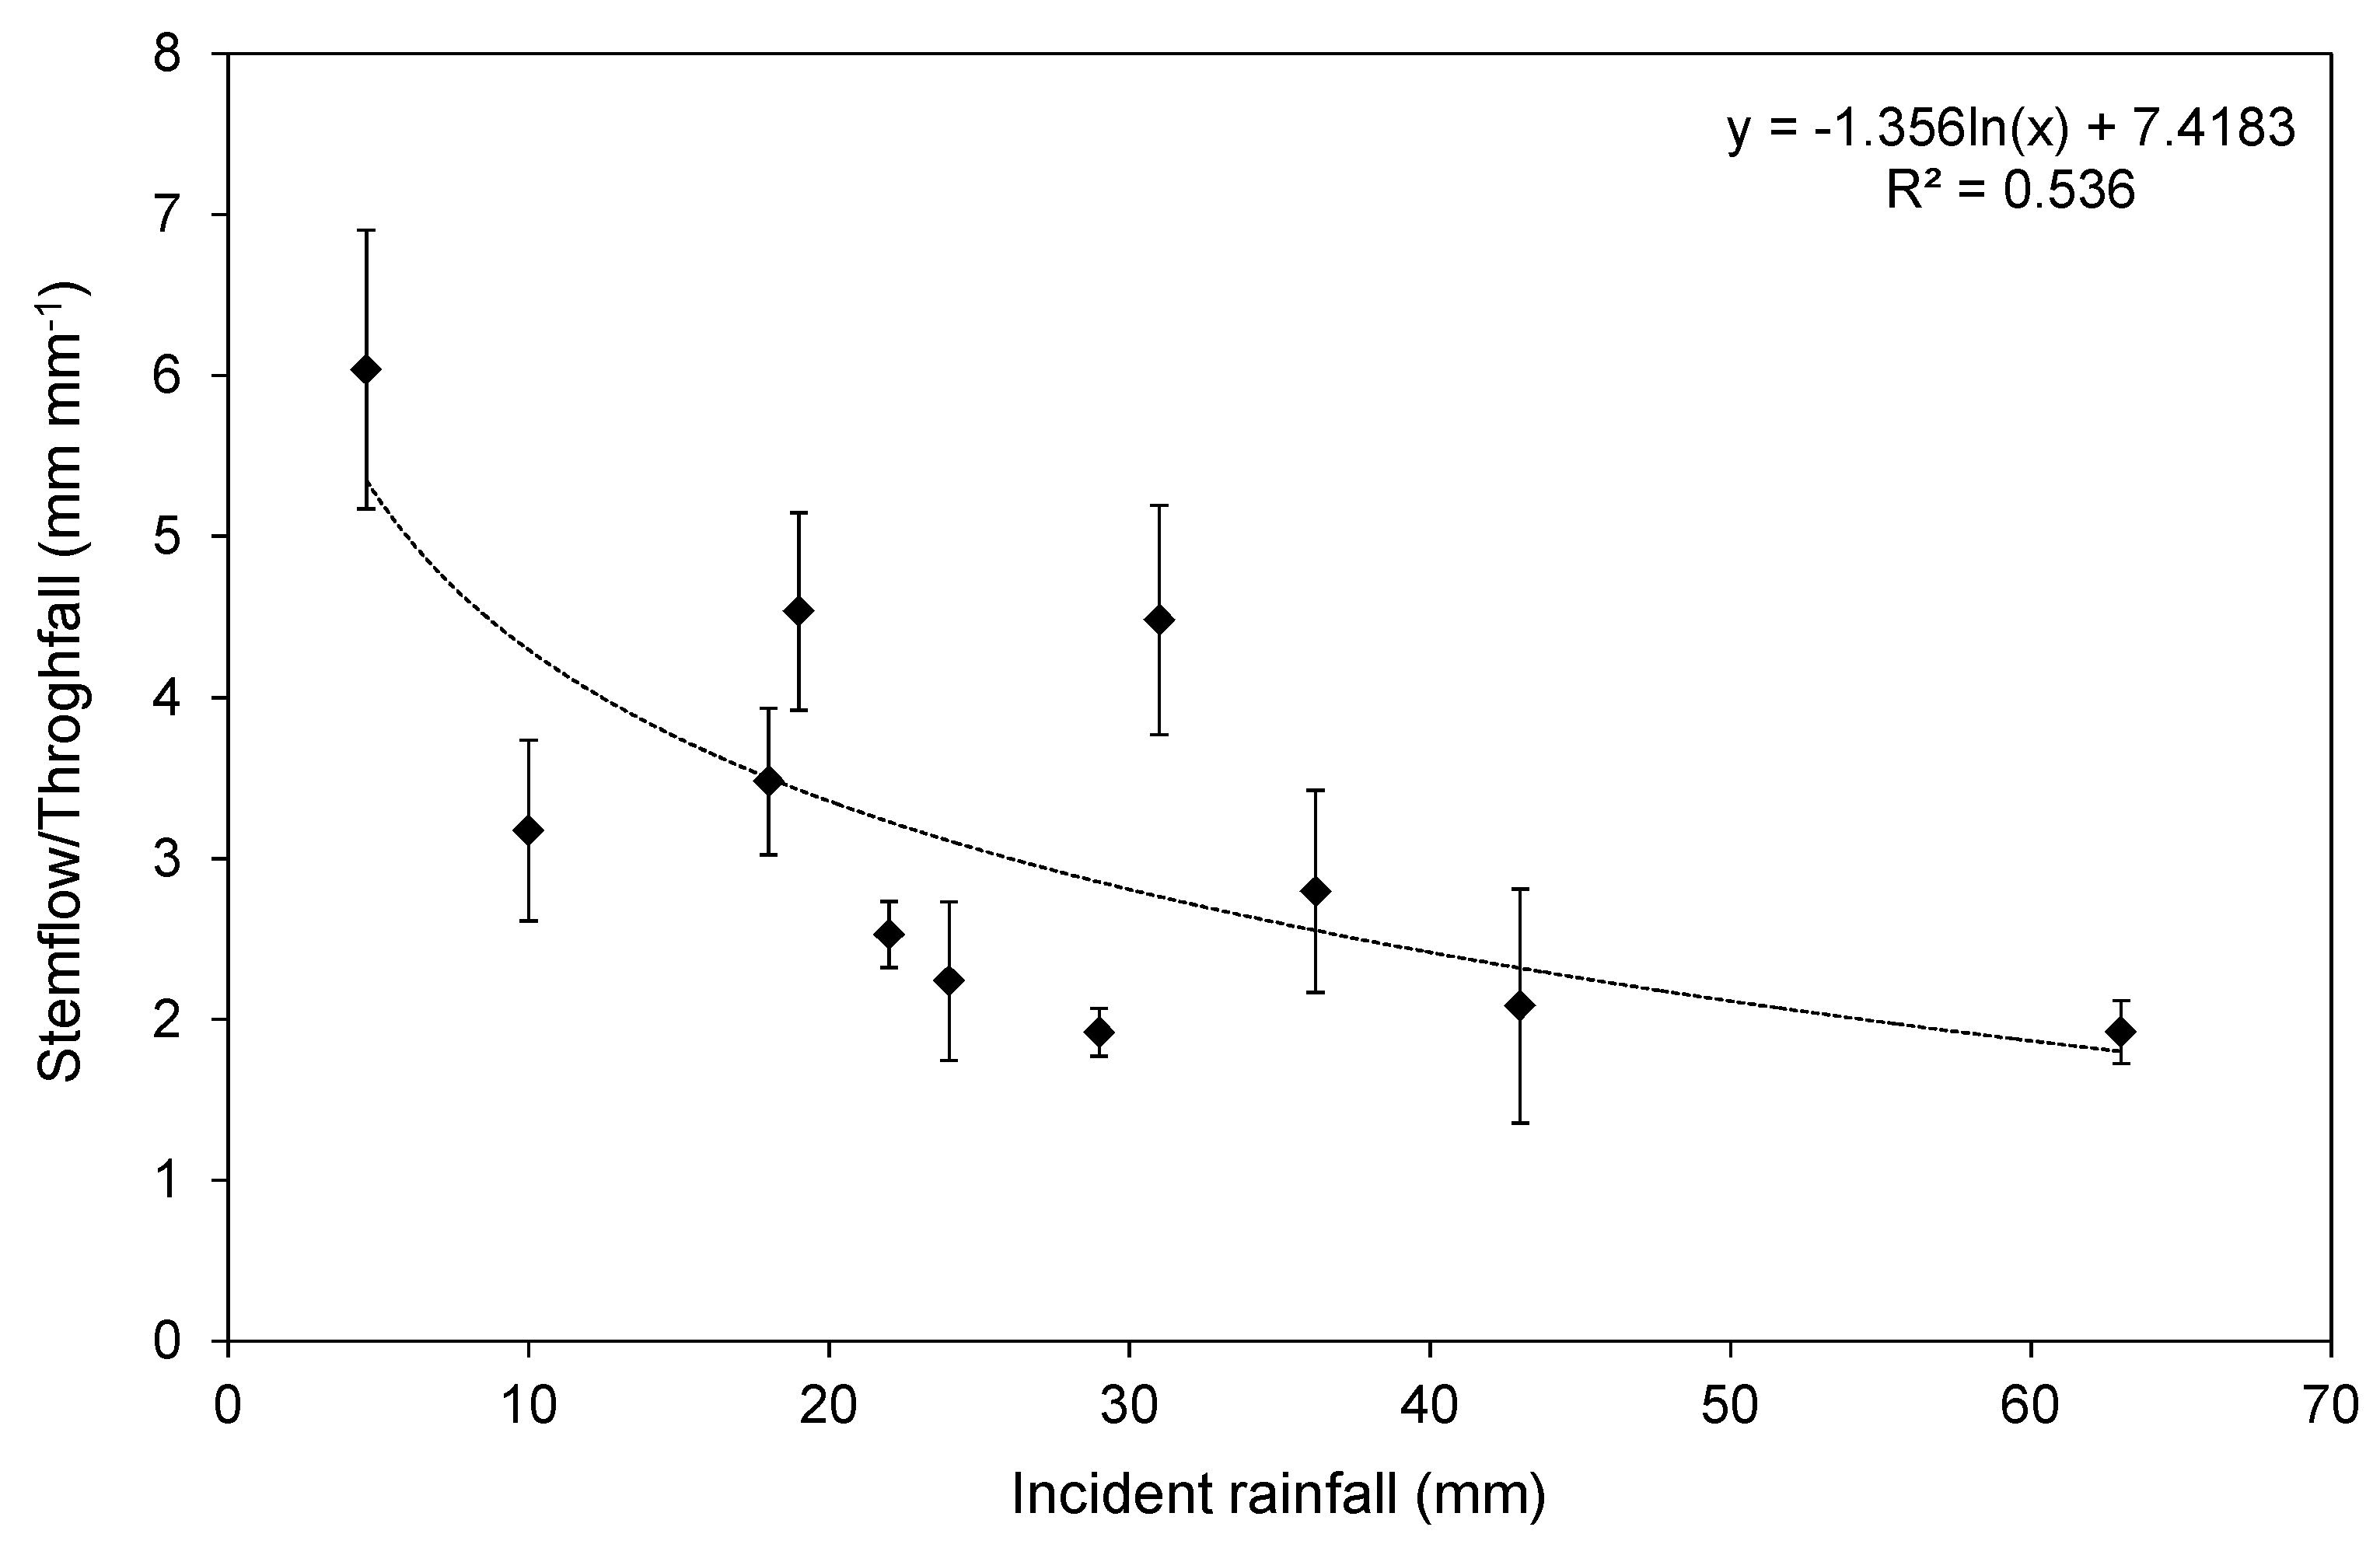
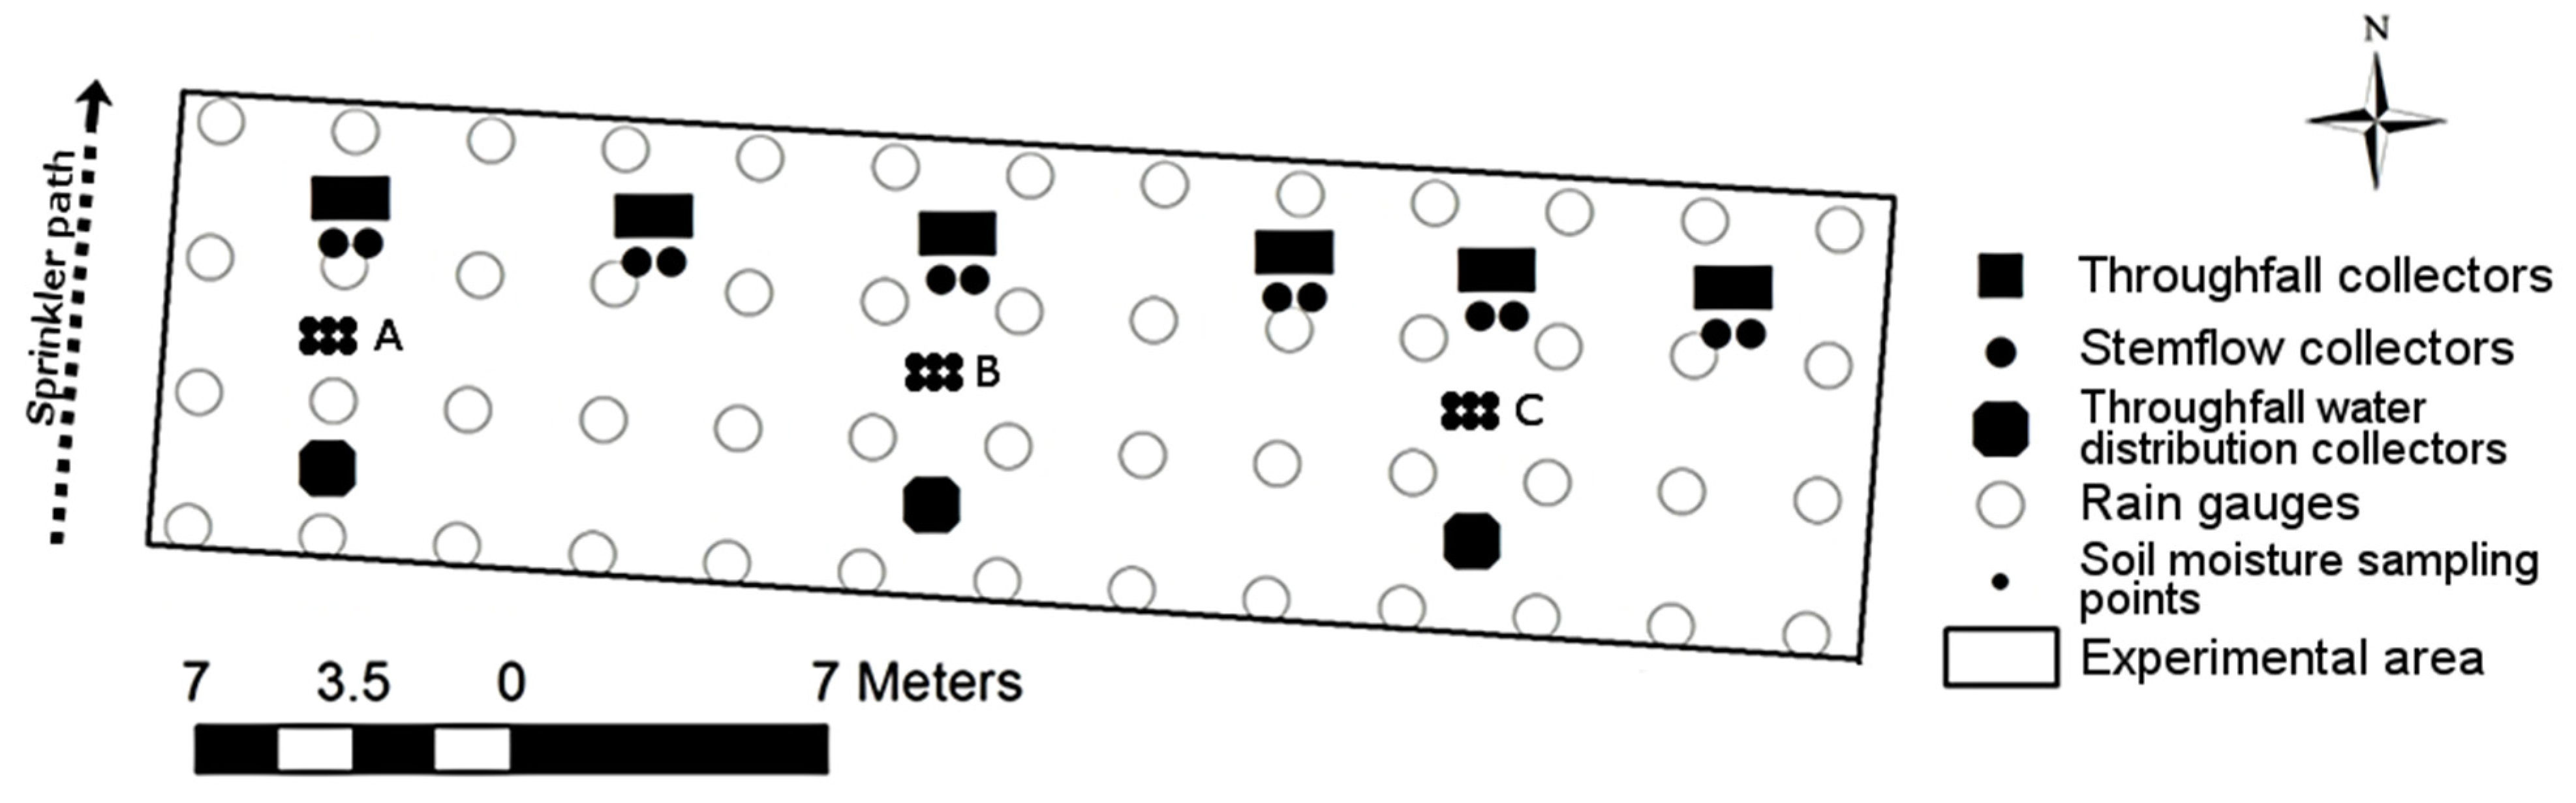
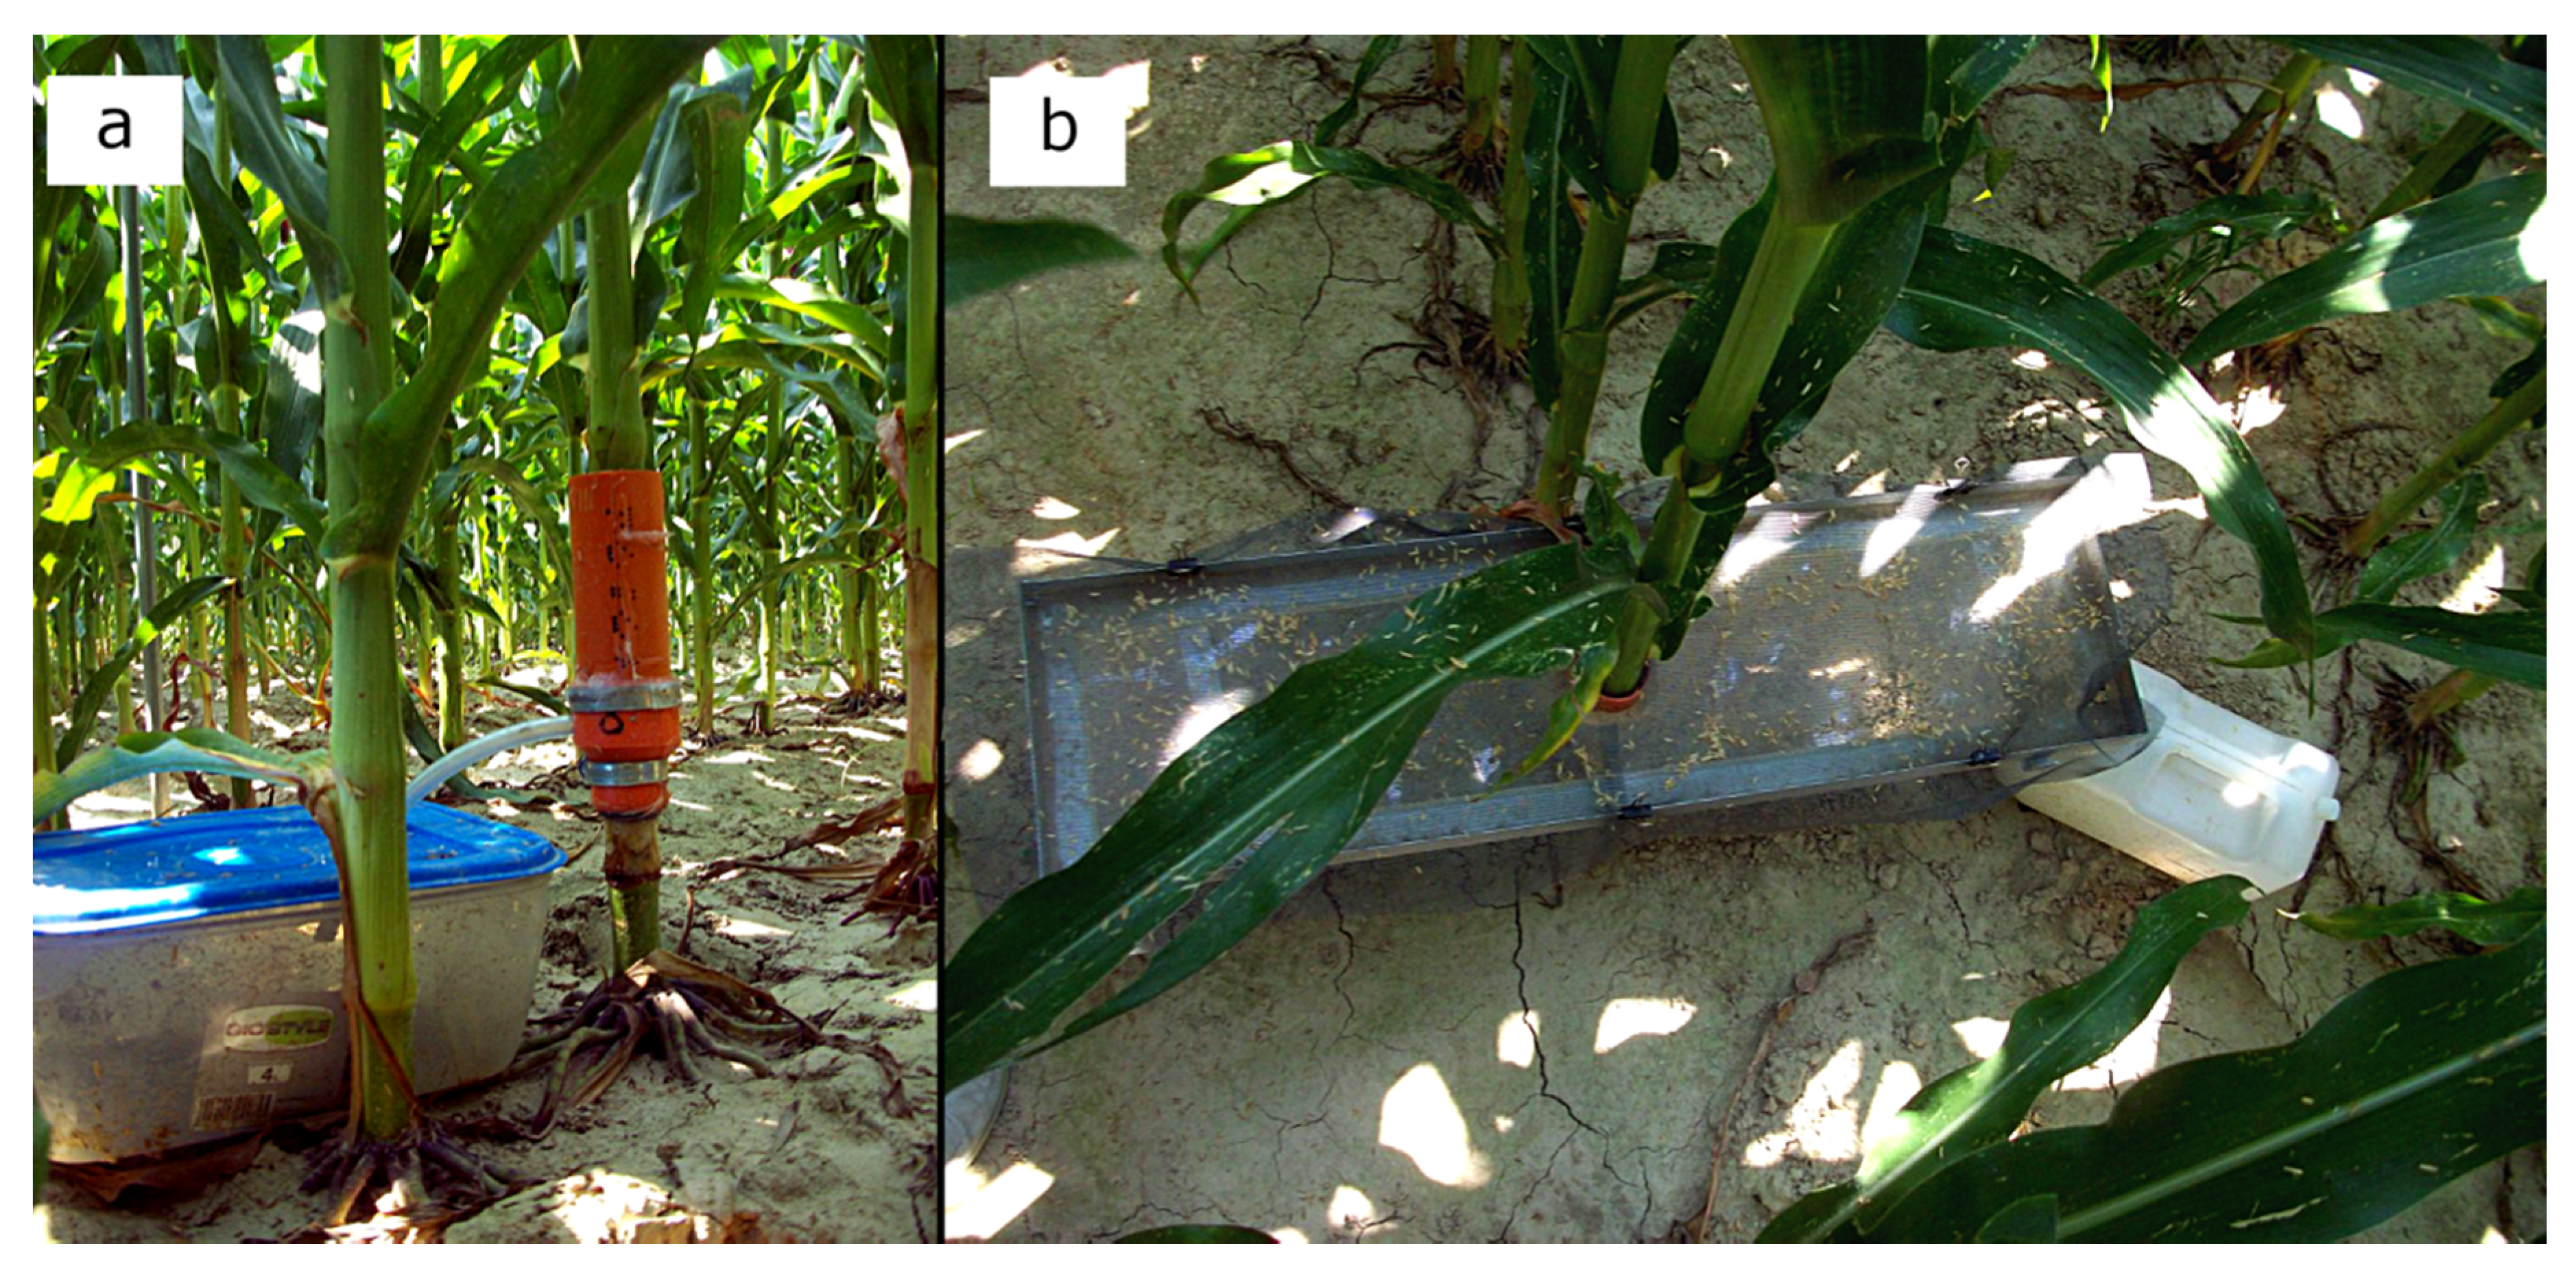
2.2. Stemflow and Throughfall Water Collection

In order to quantify the rainfall redistribution within the field and its allocation between stemflow and throughfall, an experimental plot of 324 m2 was equipped with a set of water collectors. Standard rain gauges were laid out in a grid of 3 m × 3 m to quantify the total water amount and distribution above the canopy from sprinkler irrigation and rainfall events (Figure 2). Rainfall redistribution between stemflow and throughfall was measured on 12 individual plants positioned in pairs across the plot, while soil water content (SWC) and the uniformity of water interception on the furrow (i.e., of throughfall) were measured in three different areas of the plot labeled as A, B and C (Figure 2).
Figure 2. Plot setup with the relative position of throughfall and stemflow collectors, rain gauges and soil moisture sampling points.
Water 07 02254 g002
The collectors for stemflow determination (Figure 3a), similar to those used by Lamm and Manges [3], were built at the Laboratory of Agricultural Mechanics of the University of Padova. They were designed as conical funnel-shaped polyvinyl chloride (PVC) cylinders, 18 cm tall with a 5-cm upper diameter; below this, a slot with a plastic pipe was connected to a can for draining the stemflow water. Each stemflow collector was fitted on a maize plant stem at about 20 cm above the ground. Throughfall collectors (Figure 3b) were 75 cm × 20 cm trays, with a central hole of 5 cm in diameter to avoid stemflow interception. A small plastic hose, glued into a hole at the corner of the base, drained the water into a tank in order to collect throughfall water. Each tray was positioned approximately 20 cm above the ground. Stemflow and throughfall collectors were placed on adjacent plants to avoid maize stress. All collected volumetric data were converted into depth (mm) considering the sowing density (0.15 m2·seed−1).
Figure 3. Stemflow (a) and throughfall (b) collectors at the study site.
Water 07 02254 g003
Throughfall water distribution was collected for each area (A, B and C) by a polystyrene board with 27 plastic glasses (7.5 cm upper diameter) laid out in an array of 3 × 9, placed side-by-side. Stemflow and throughfall amounts were measured a few hours after rainfall events.

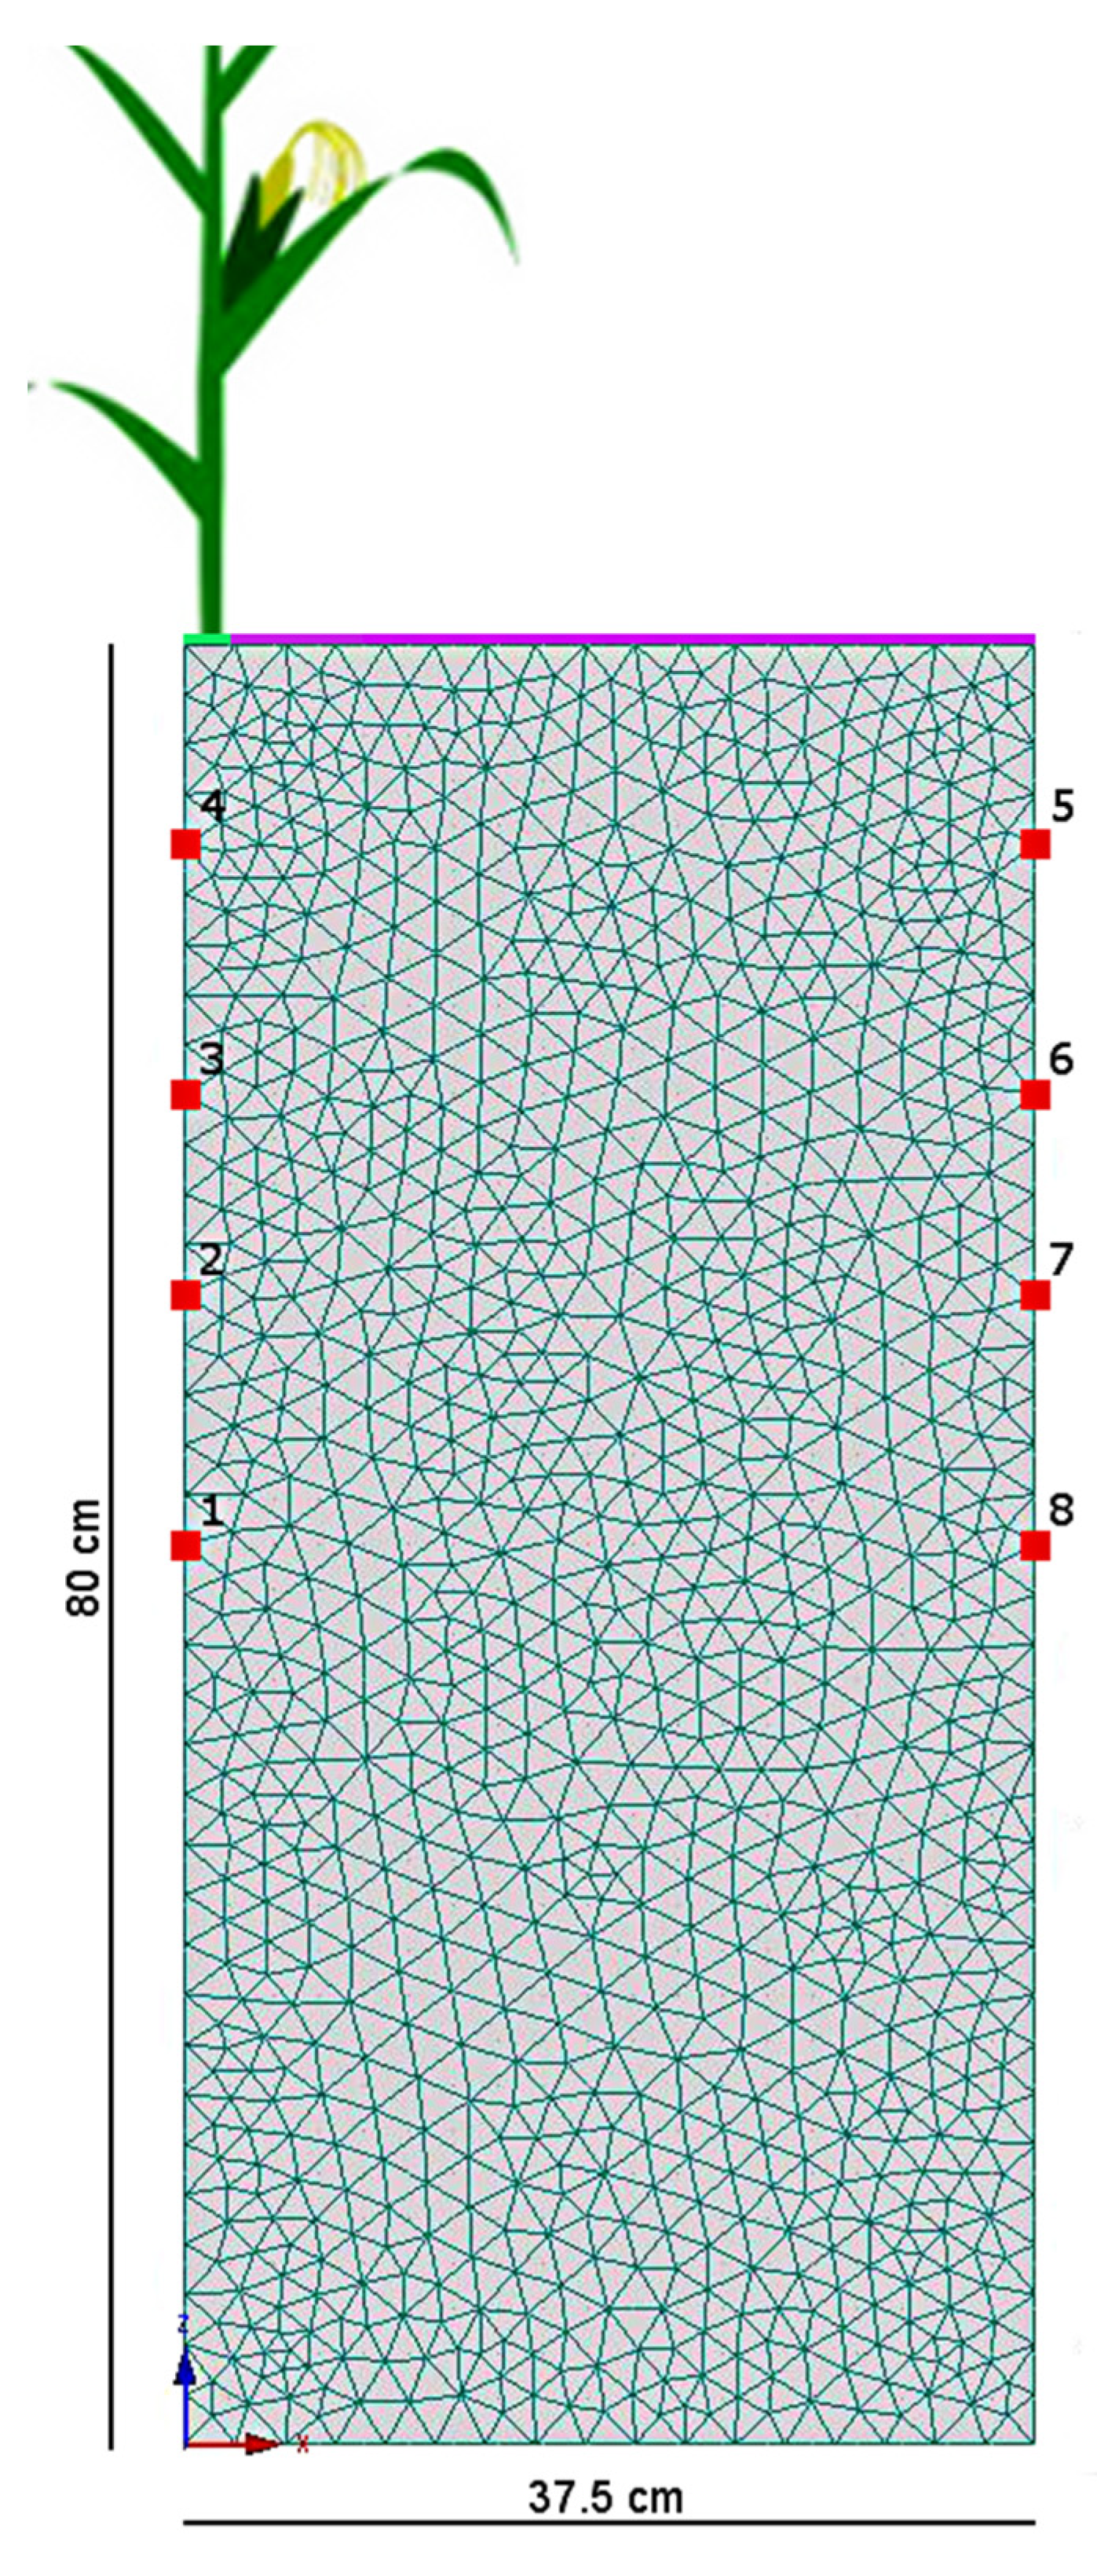
2.3. Soil Moisture Monitoring

Soil moisture was monitored in order to quantify the effect of canopy interception on soil water distribution. Measurements were performed manually in the field following the rainfall events and gradually decreasing the sampling frequency from 4 times·day−1 after rainfall to once·day−1 during the following 8 days. A frequency domain reflectometry (FDR) probe (PR2, Delta-T Devices Ltd., Cambridge, UK) was used to measure the soil moisture profile at four different depths (10, 20, 30 and 40 cm). In each area (A, B and C), 6 probes were installed in an array of 2 × 3 at a distance of 40 cm × 37.5 cm, respectively, to monitor SWC in both the row and inter-row (Figure 2). FDR probes, calibrated in the laboratory, had an accuracy of ±4%.

2.4. Modelling Canopy Interception Effects with HYDRUS 2D/3D Model

Effects of canopy interception on water dynamics were simulated with the numerical model HYDRUS 2D/3D Version 1.11 [14]. The model was first calibrated and validated in the experimental conditions and then used to predict the performances of sprinkler and alternative irrigation method.

2.4.1. Calibration/Validation of HYDRUS 2D/3D

SWC data, monitored by the 24 sensors in each Site (A, B and C) at the four depths, were used to calibrate the soil hydraulic properties using the inverse solution approach [14]. Hydraulic properties were defined according to Van Genuchten and Mualem functions [15]. Inversion was applied to the first 22 days of experimental data, while the remaining 20 days were used for the validation.
The 2D domain (width 37.5 cm and depth 80 cm) encompasses the area between the row and the inter-row where the moisture probes were inserted (Figure 4), assuming the isotropy of the soil profile. Variable flux conditions were assigned at the upper boundary for describing the spatial redistribution of the stemflow and throughfall. The stemflow flux was assigned to the top left corner in correspondence to the stem position (Figure 4, in green), while the throughfall flux was assigned to the upper boundary line (Figure 4, in pink).
Figure 4. 2D domain geometry, mesh composition and node positions in HYDRUS 2D/3D for the inverse solution.
Water 07 02254 g004
Potential evapotranspiration rates, calculated according to Allen et al. [16], were used as atmospheric boundary conditions. Root distribution was set according to Dal Ferro et al. [17], while the root water uptake followed the models proposed by Feddes et al. [18]. Initial water content conditions were specified using data measured by FDR, while free drainage was set as the lower boundary condition.
The goodness of validation was tested according to the linear regression between observed and simulated SWC and the residual deviation index (RPD) [19] as follows:
R P D = S D R M S E
where SD is the standard deviation of observed data and RMSE is the root mean square error of fitted versus observed data.

2.4.2. Numerical Simulation of Irrigation Systems with HYDRUS 2D/3D

In order to compare sprinkler irrigation with an alternative down canopy method, 3D numerical simulations were performed at each field site (A, B and C). Three different upper boundary conditions distributions were considered: (1) rainfall application with an optimal uniform distribution down canopy (uniform rainfall, RU); (2) stemflow and throughfall fluxes, where the former was redistributed on the row and the latter on the inter-row according to the experimental data (ST); and (3) water application beneath the canopy as a low-energy precision application (LEPA) system into every other inter-row.
The lower boundary condition was free drainage, while the initial conditions of soil water content had a linear distribution between the top (0.25 m3·m−3) and the bottom (0.18 m3·m−3) of the soil domain. The 3D domain was 0.8-m depth, 0.75-m width and 1-m length; the root distribution was set according to Dal Ferro et al. [17], while the root water uptake followed the model proposed by Feddes et al. [18].
Simulations were performed during the 47-day experimental period. Two different water managements were simulated: the first one was according to the crop evapotranspiration (ETc) compensation method, considering seven irrigation treatments as typical for sprinkler irrigation in Northeastern Italy. The second scenario was a deficit irrigation with 60% of ETc adopting the same irrigation frequency. Rainfall intensity was 5 mm·h−1 for both simulations. The system performance was evaluated in terms of ET, i.e., actual crop evapotranspiration (mm), and ET/ETc, i.e., the ratio between ET and the crop evapotranspiration under standard conditions [16] and drainage (mm).

3. Results

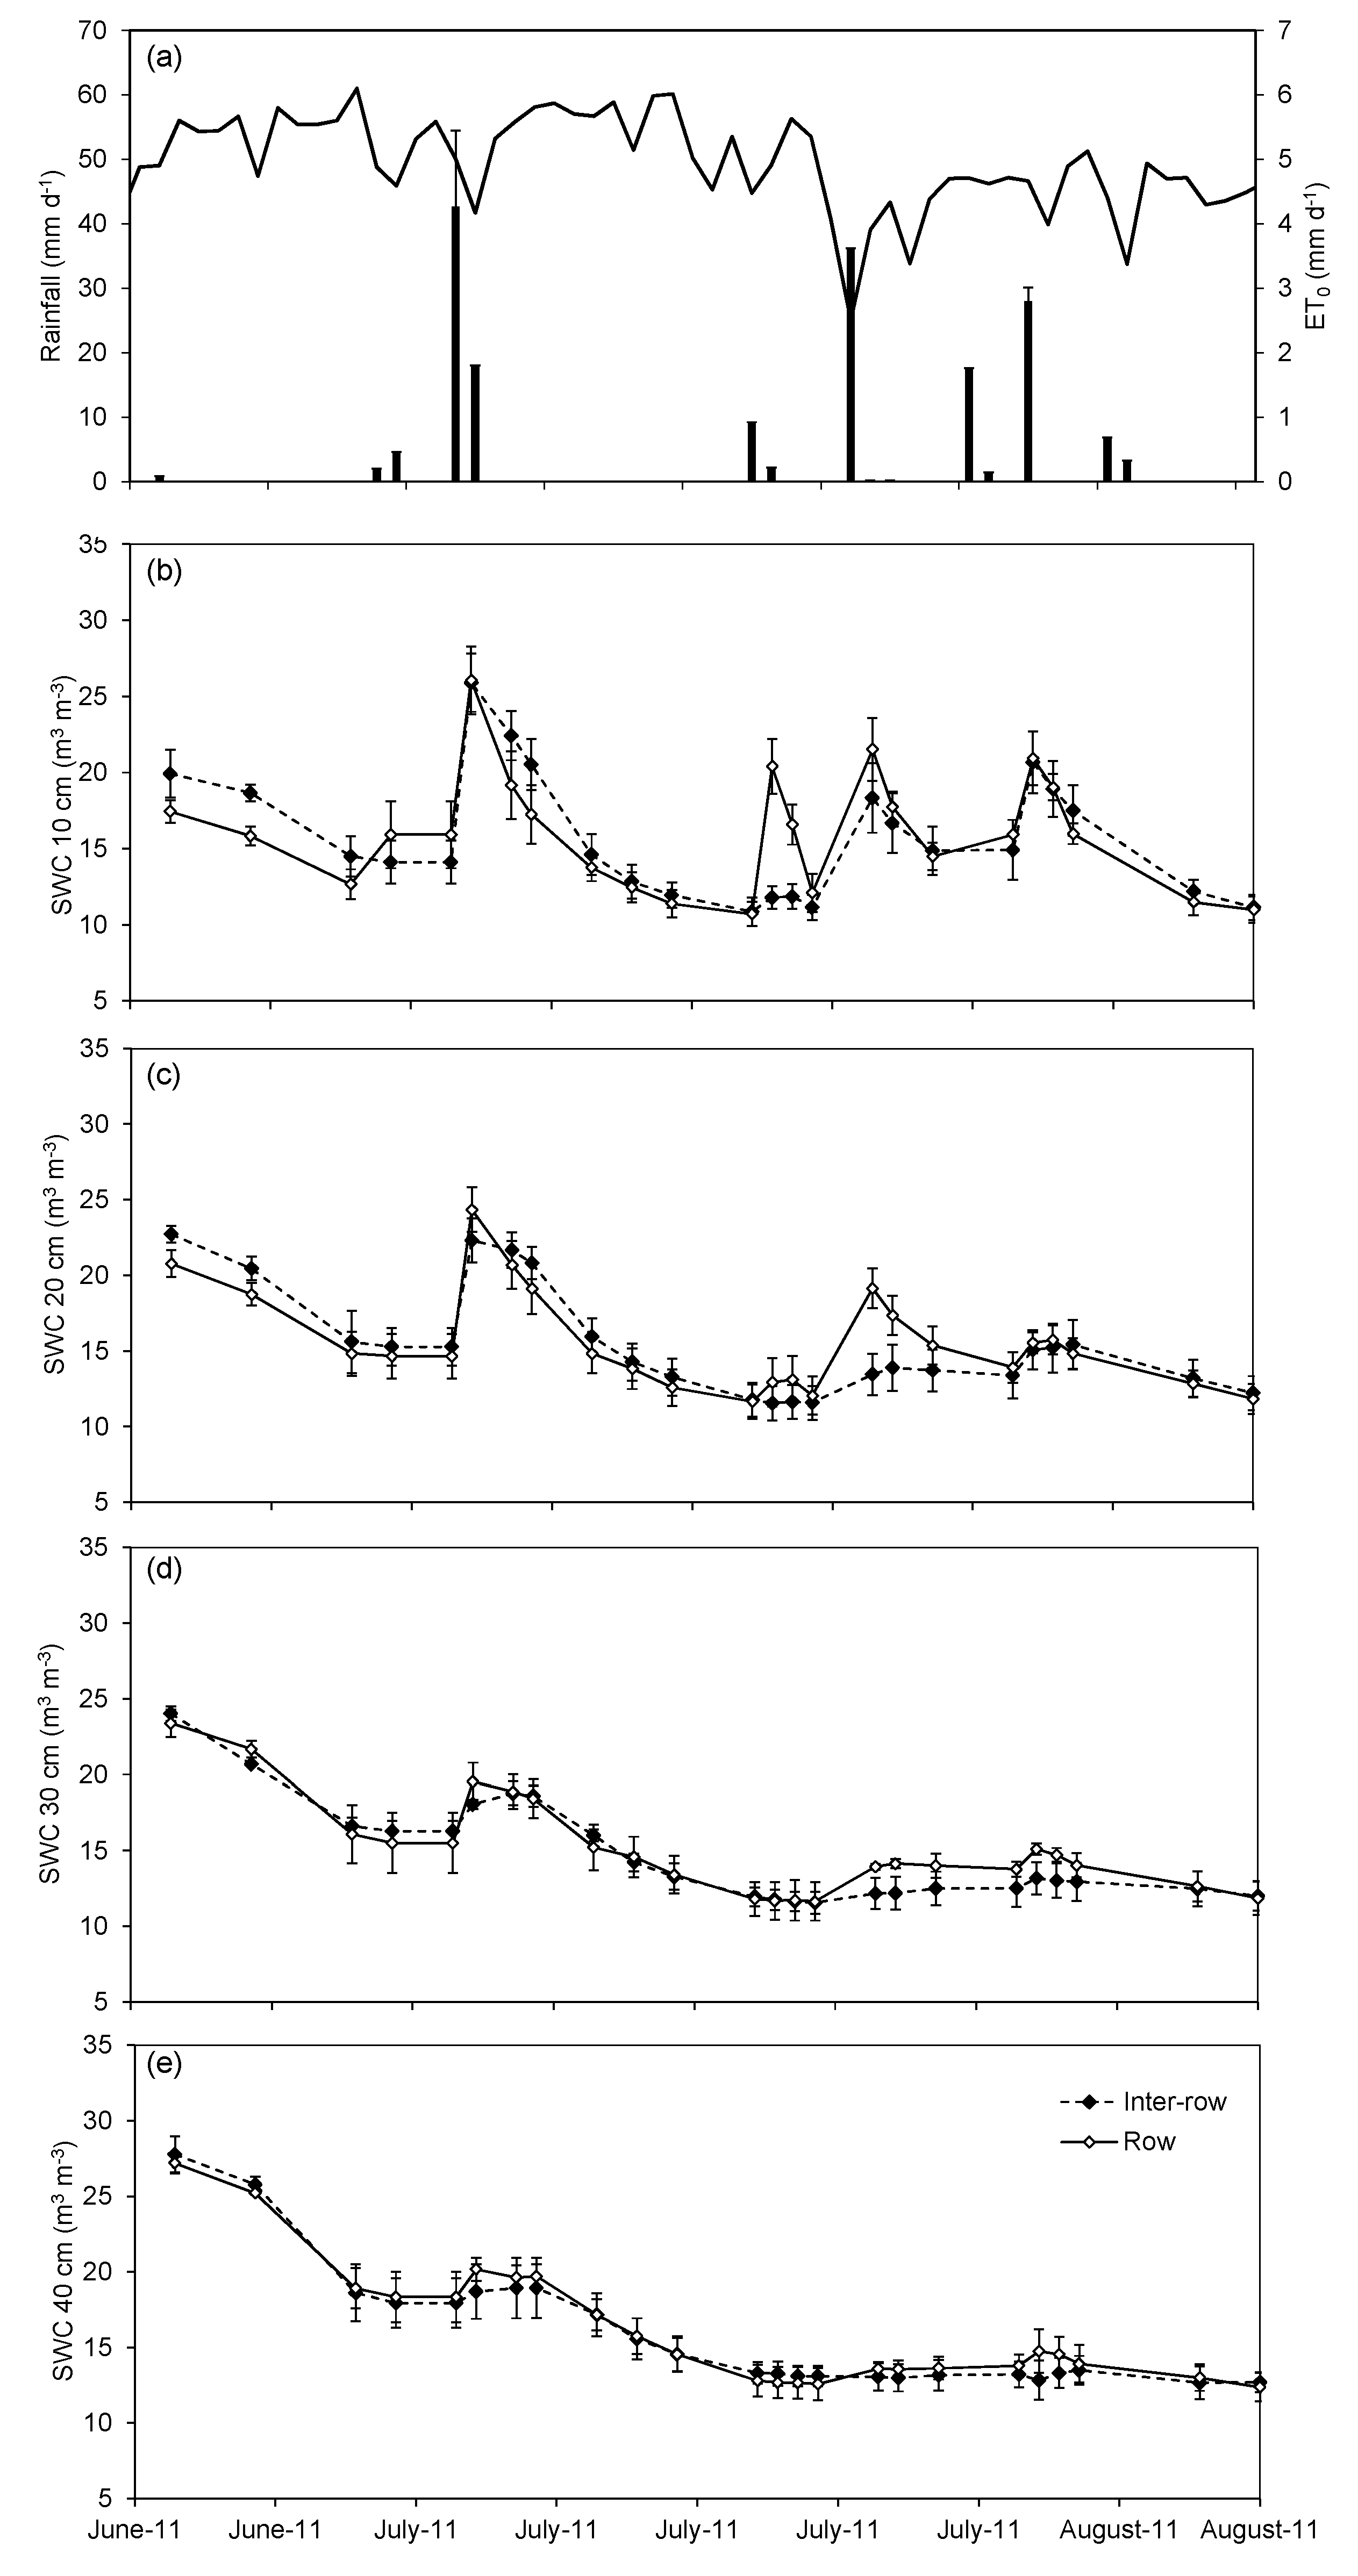
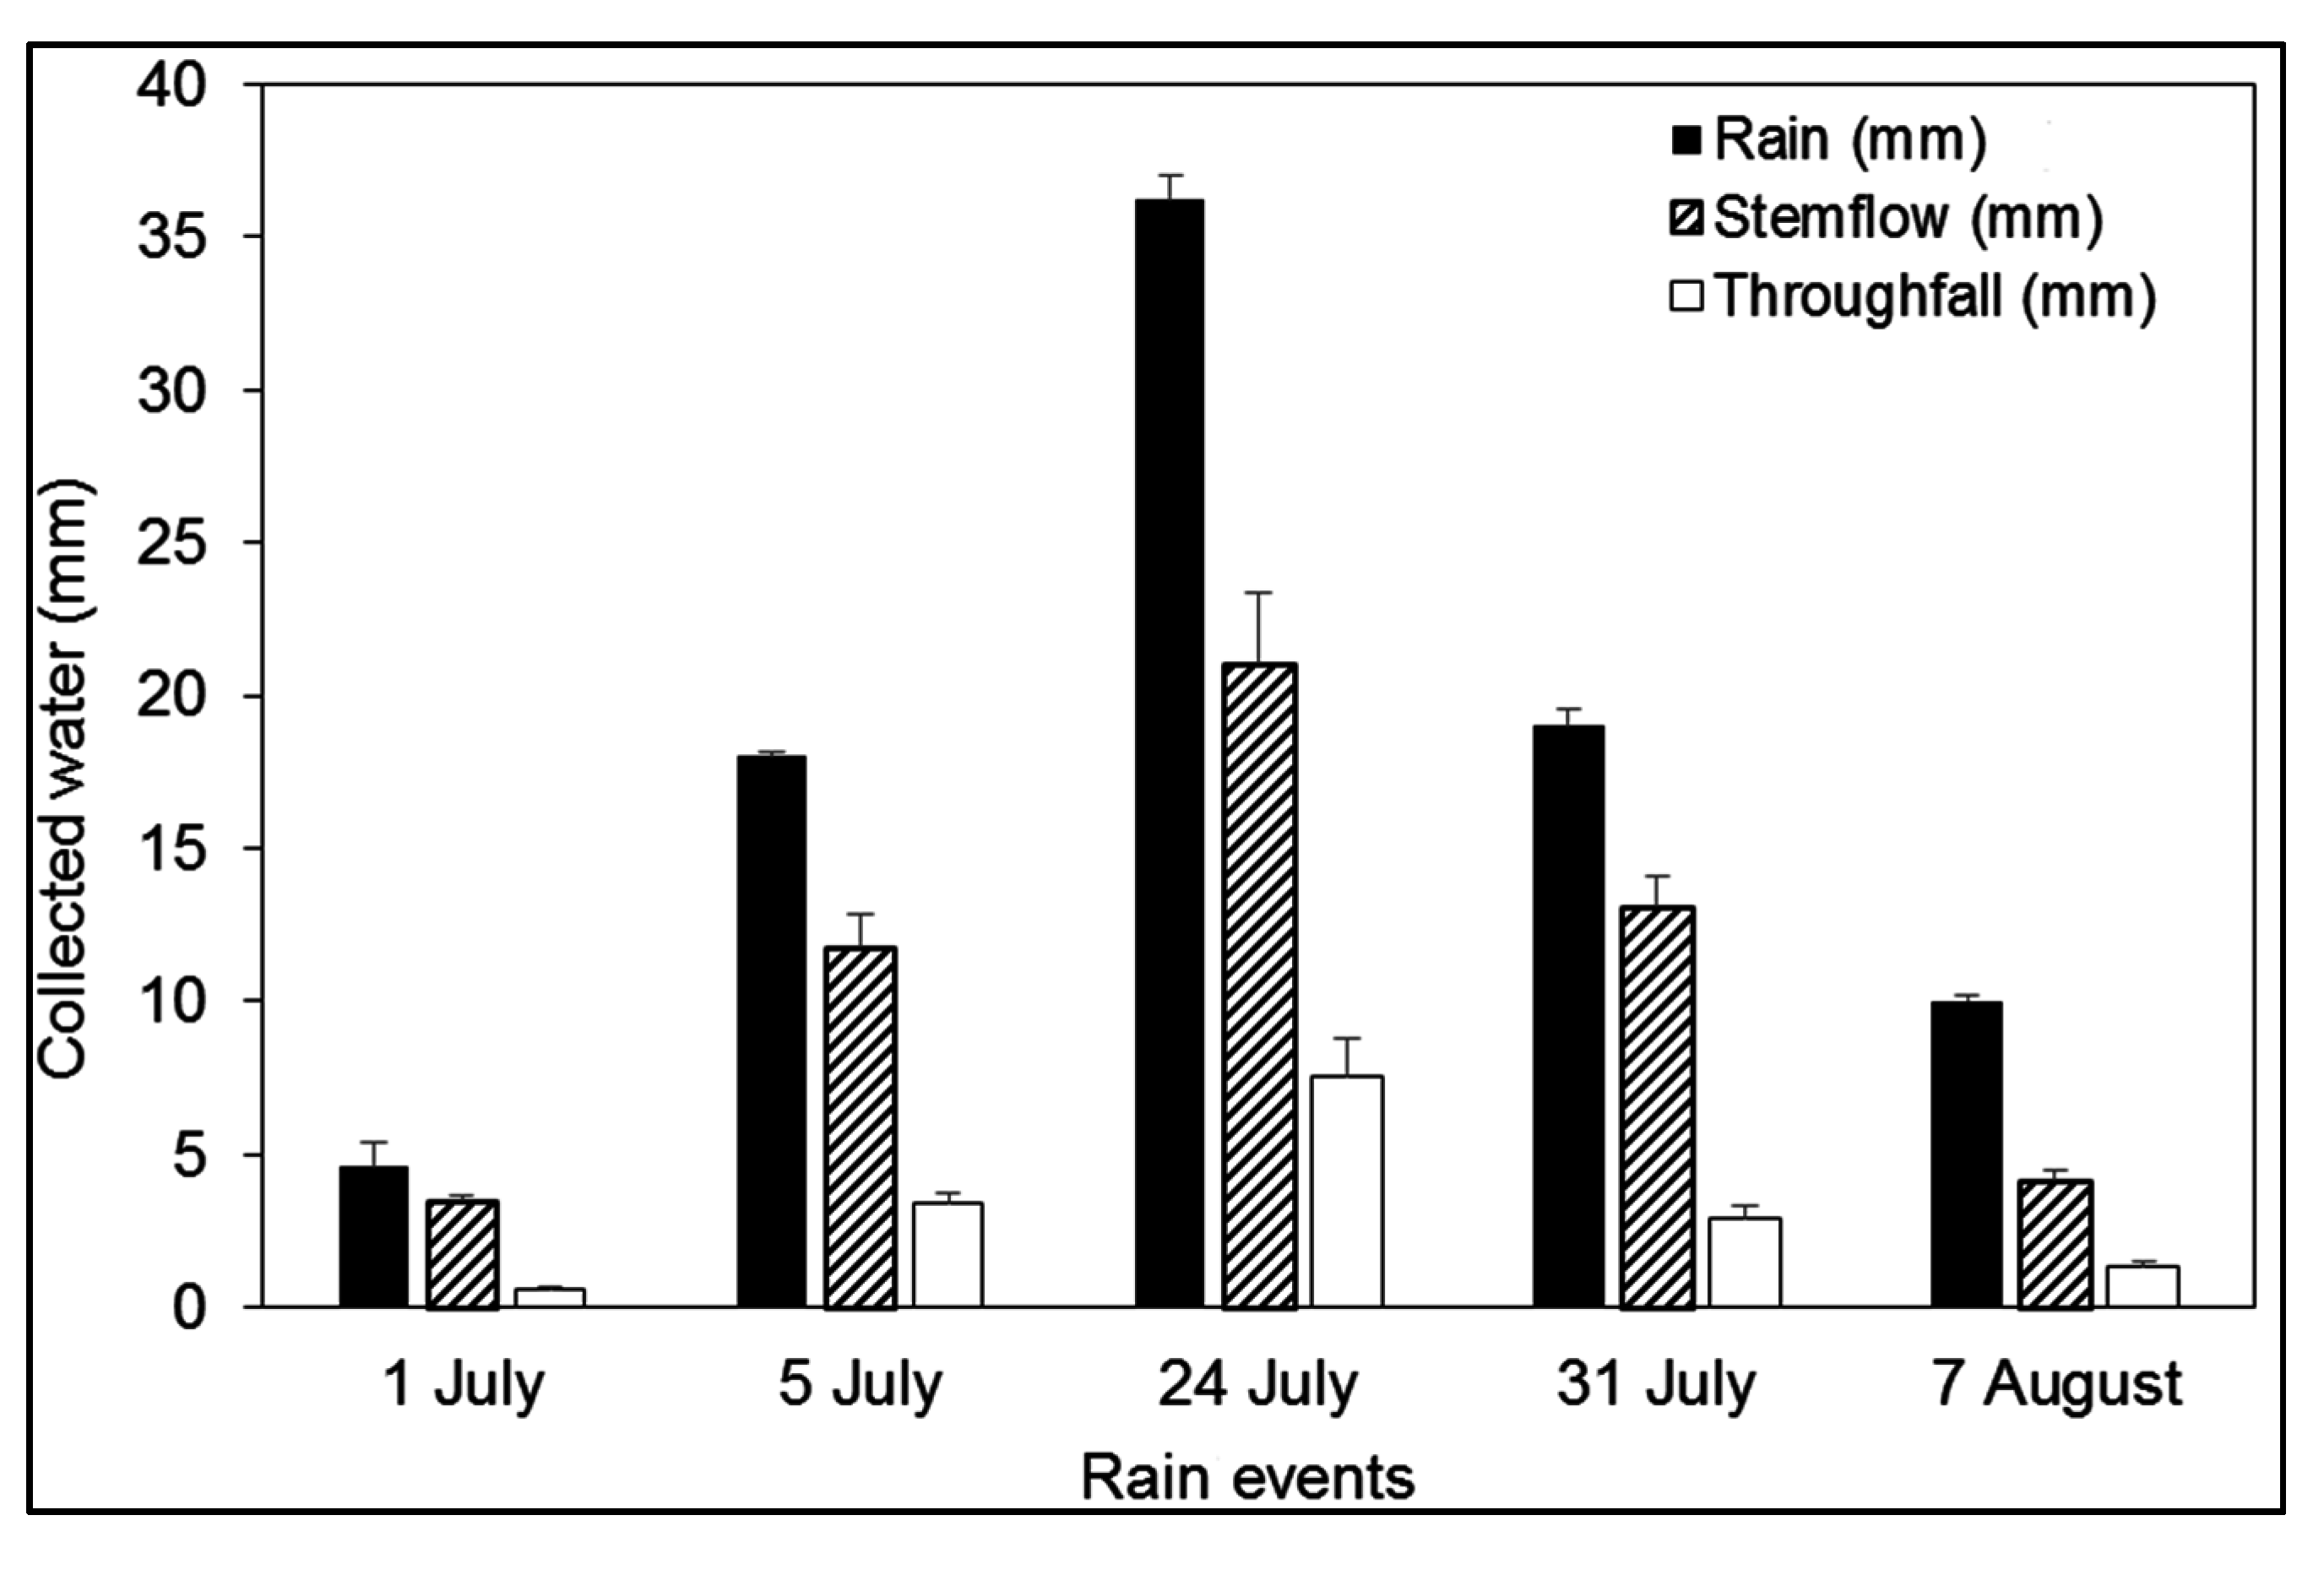
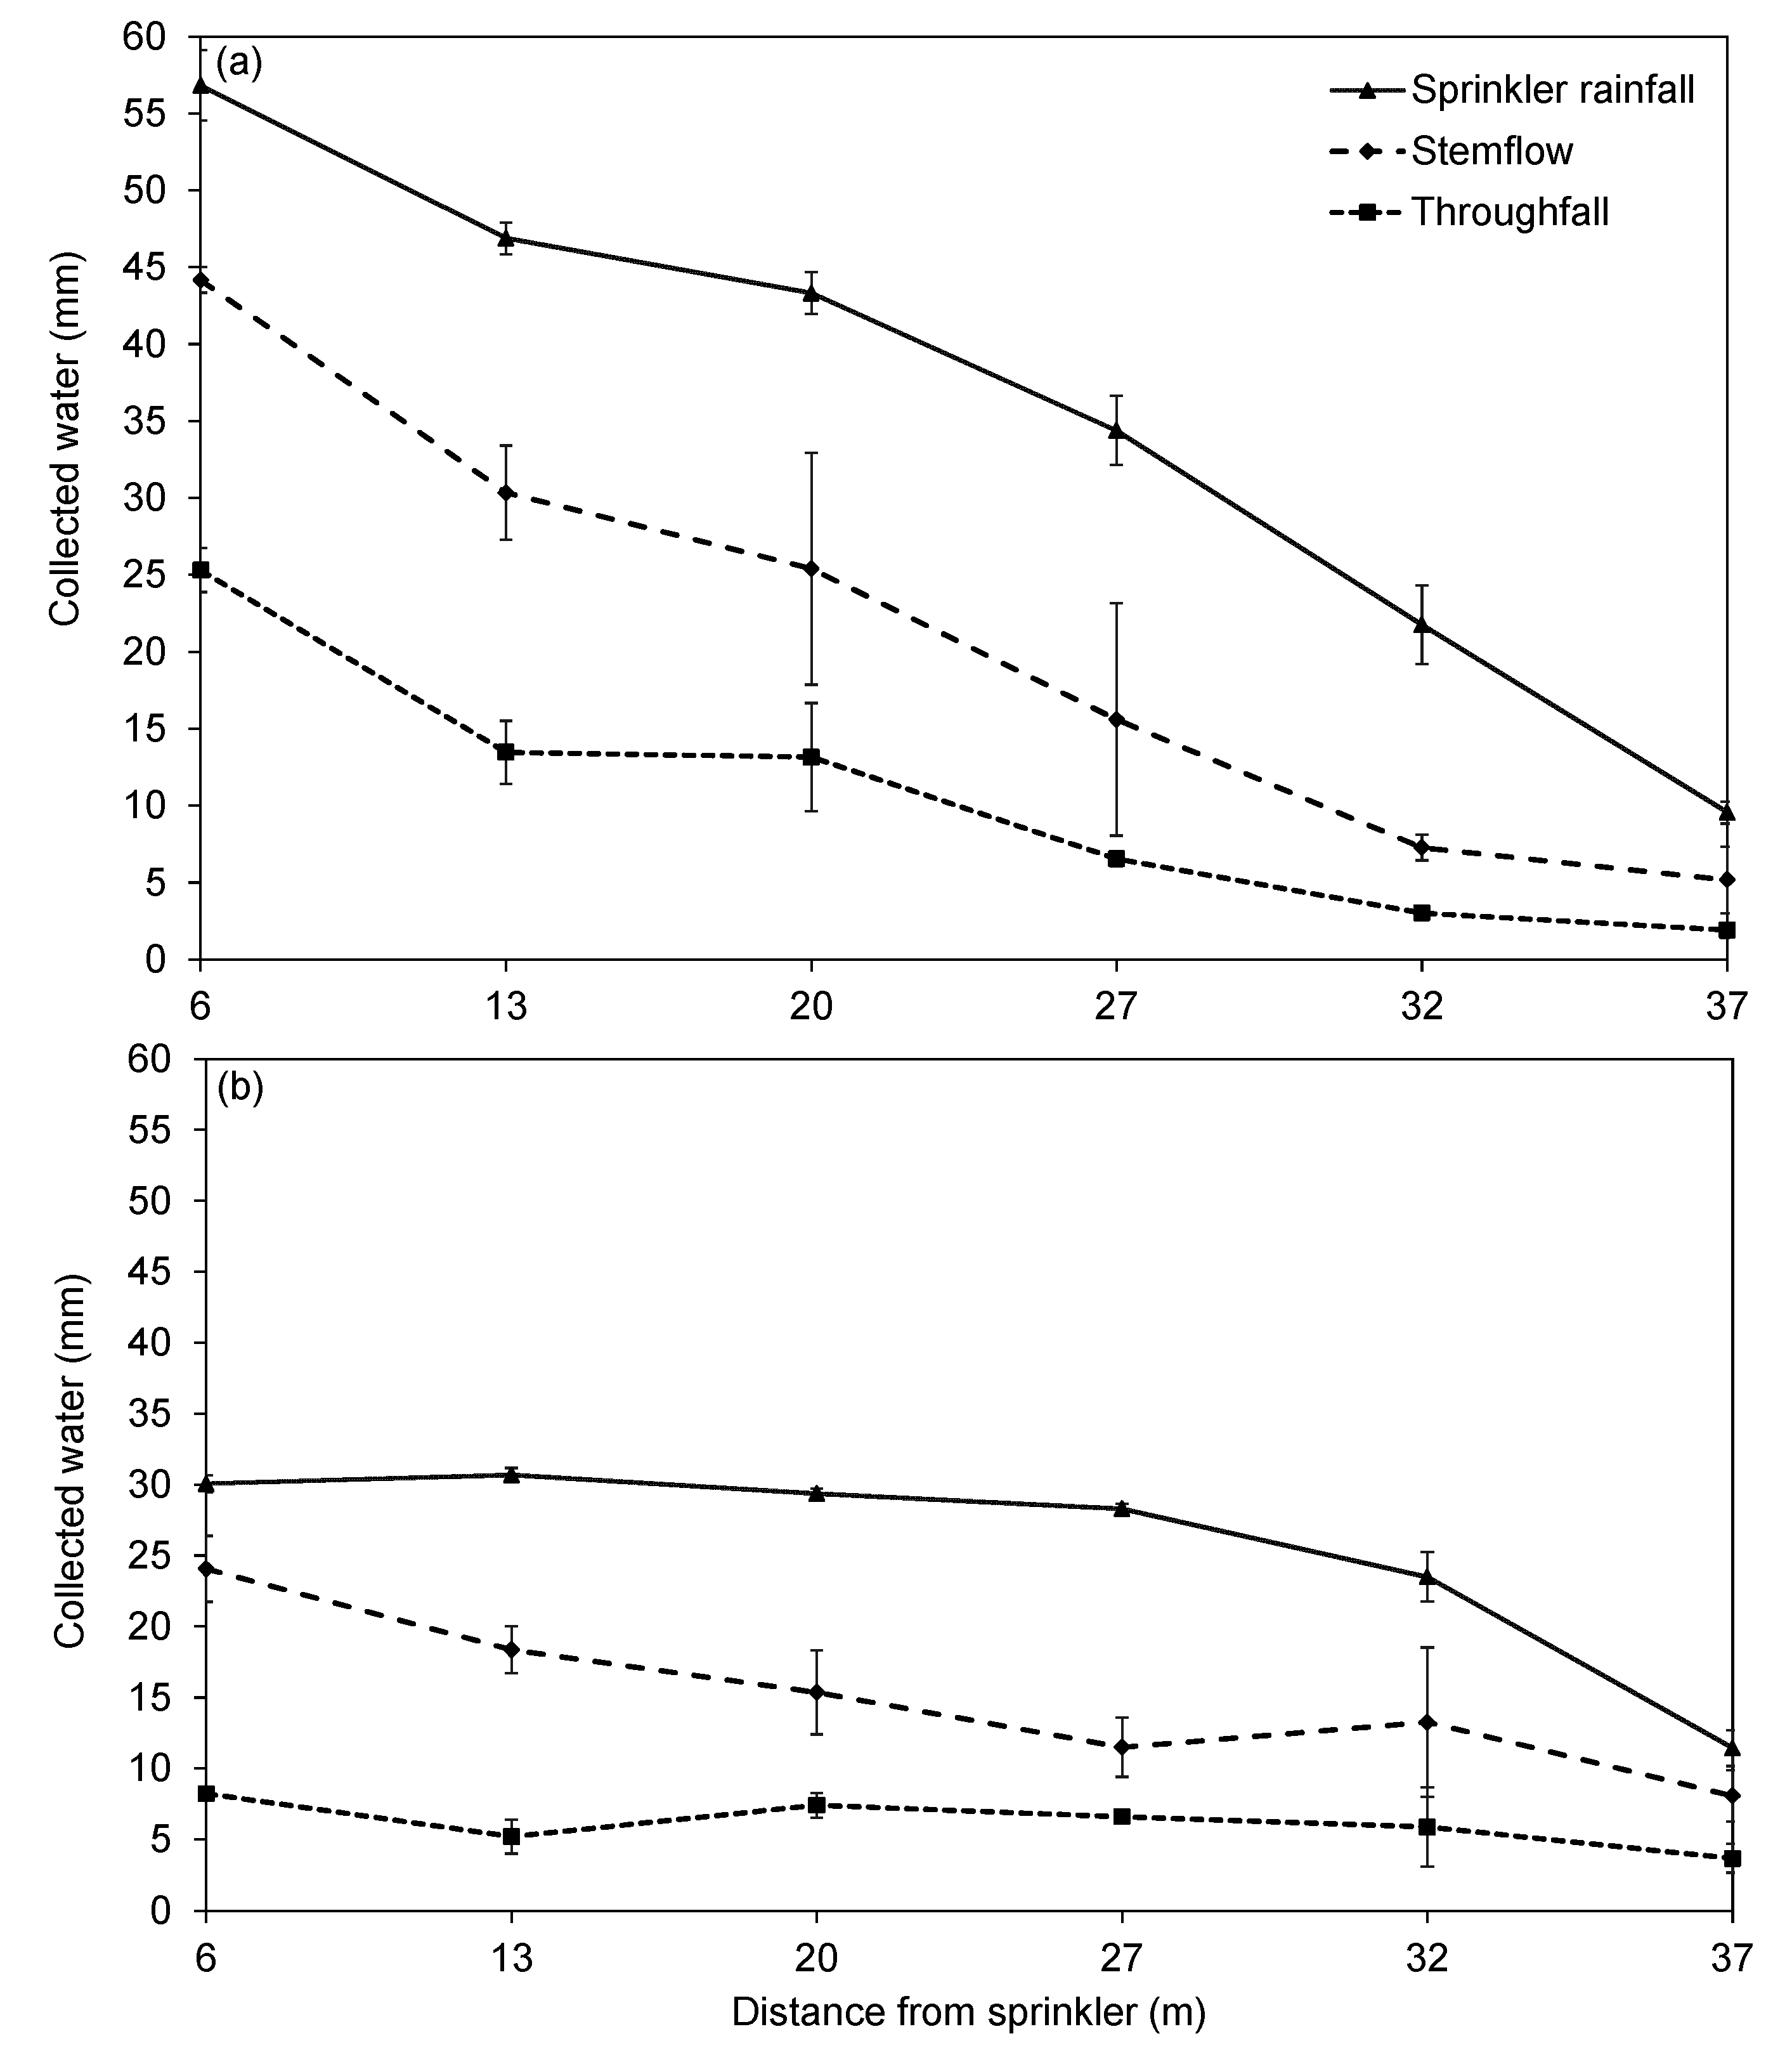
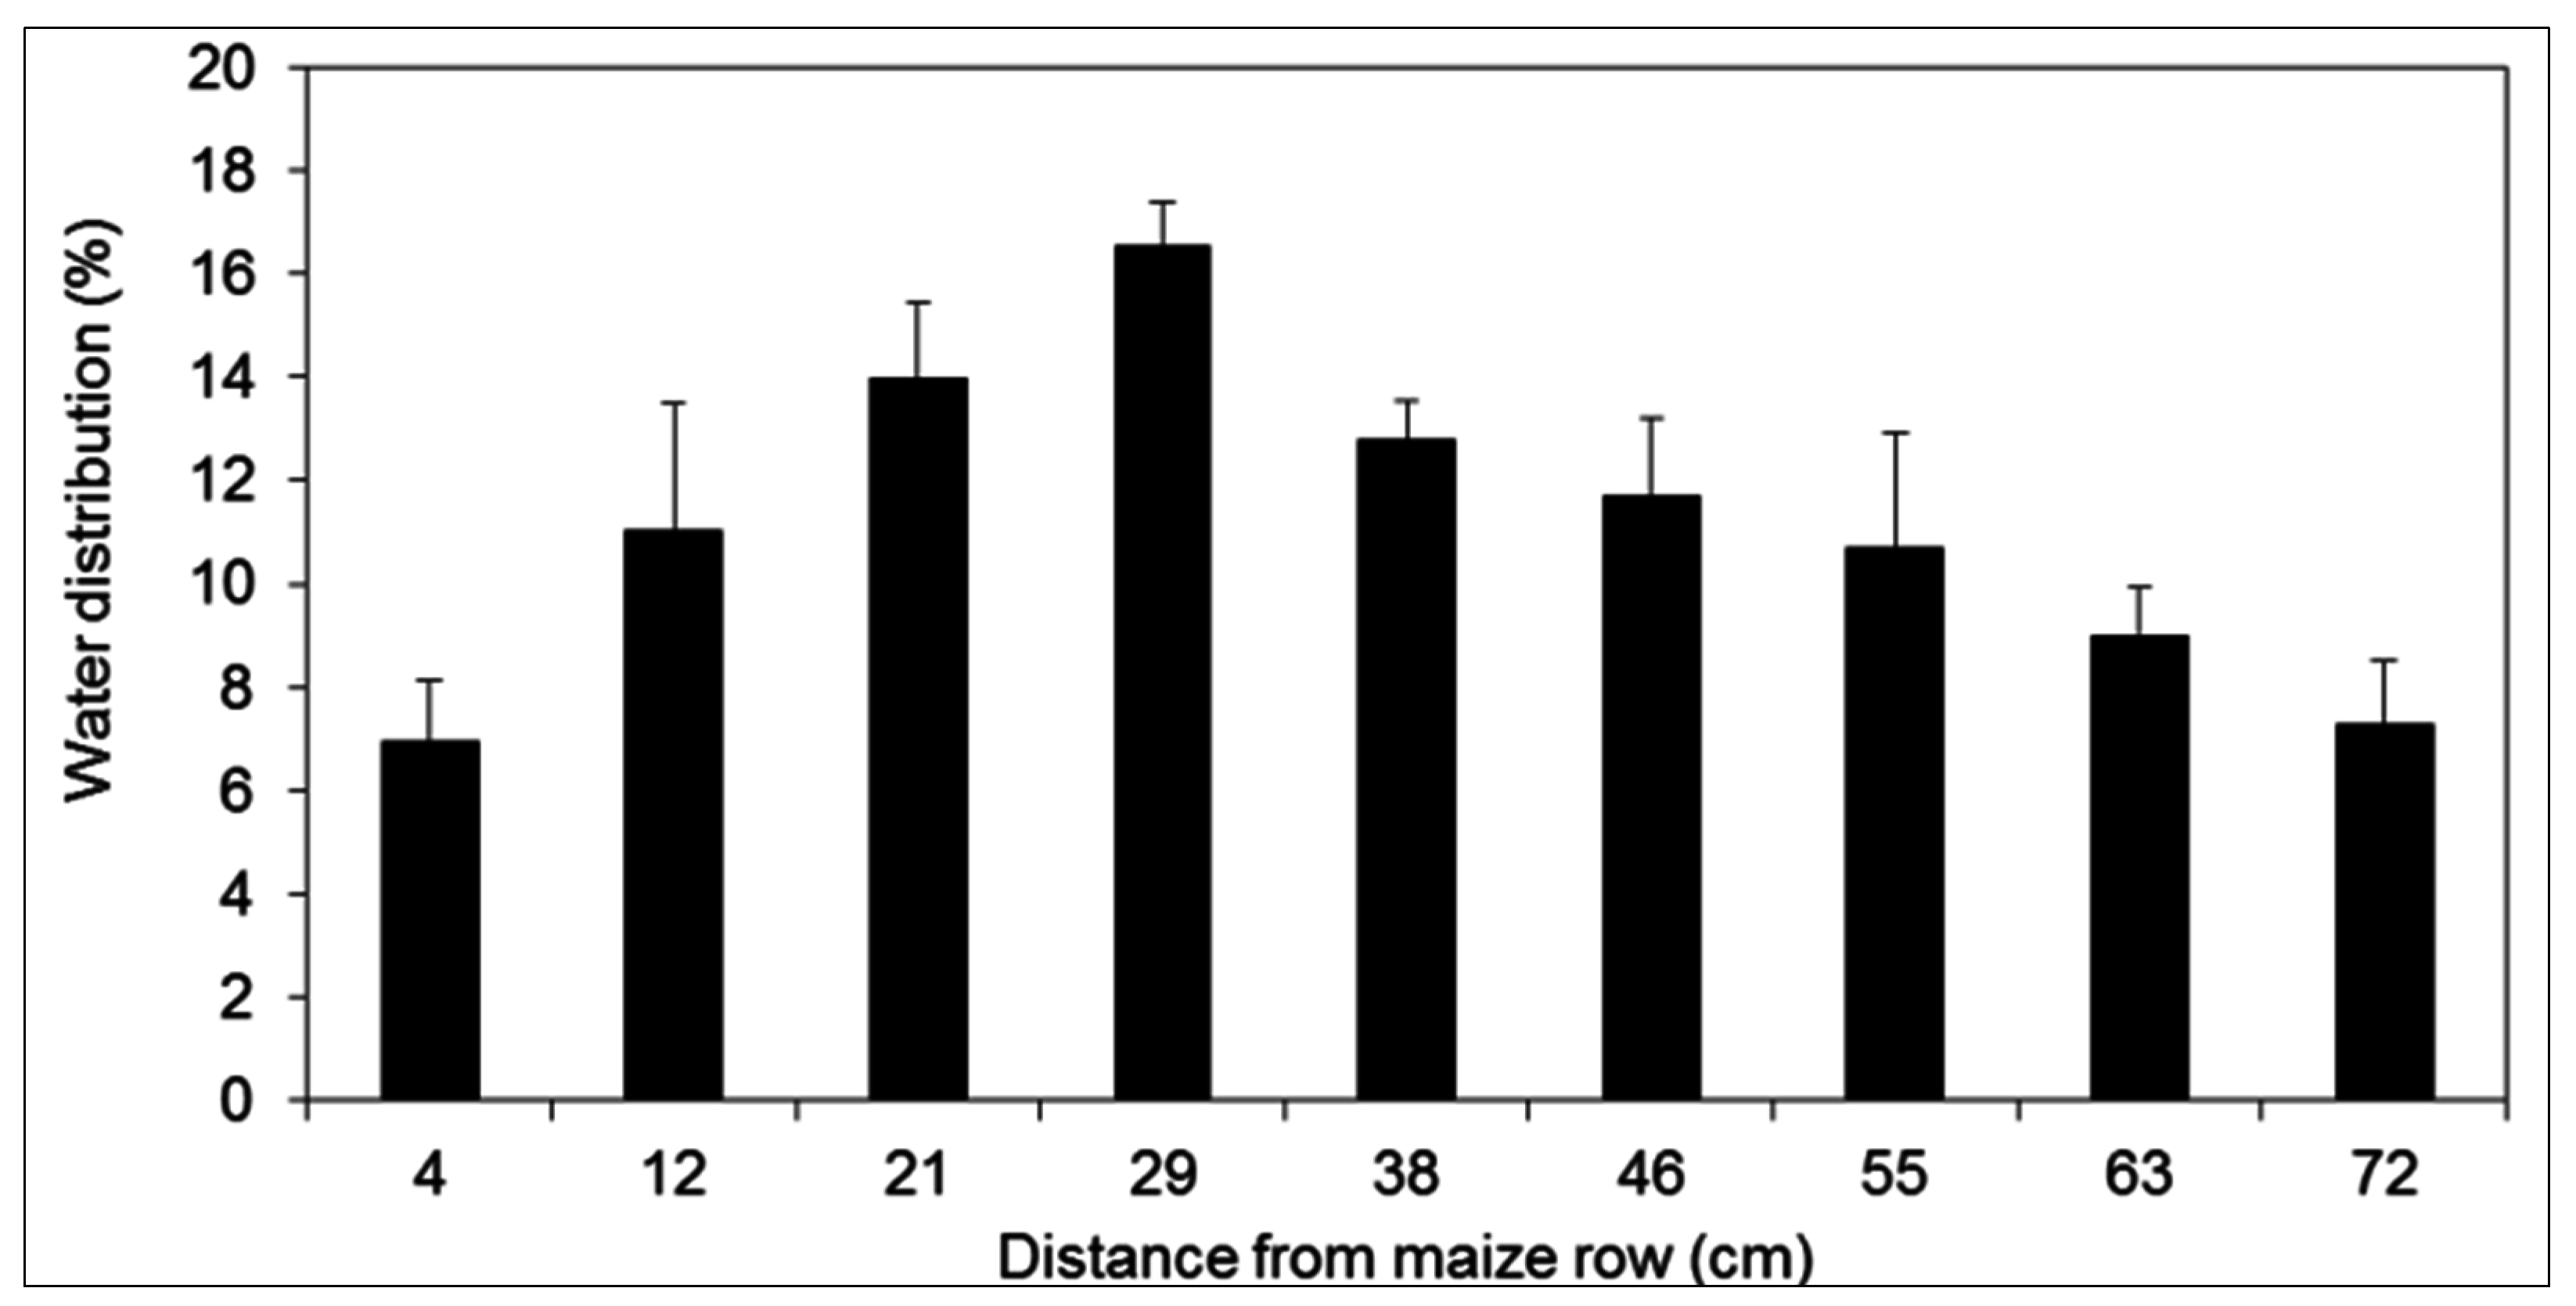
3.1. Rainfall Redistribution by Canopy Interception and Soil Water Dynamics

Total rainfall during the experimental period was 159 mm on average (±2 mm), as partly provided by rainfall events, which were homogeneous throughout the study area, and partly by sprinkler irrigation, which changed depending on the distance from the sprinkler. Rainfall events provided 87.5 mm (55%) of total incoming water, which is in line with the typical climatic conditions of the area [20], while 45% was provided by sprinkler irrigation. A total of five rain events (Figure 5) were used for the evaluation of water redistribution below the fully-developed maize canopy. On average, rainfall intensity was 3.7 mm·h−1, ranging from a minimum of 4.6 mm that fell intermittently during 1 July (maximum rainfall intensity = 2.2 mm·h−1) to a maximum observed on 24 July, when 36 mm fell in 19 h. This last rainfall event also showed the highest intensity during the experimentation (maximum rainfall intensity = 19.4 mm·h−1). Finally, during the night between 30 and 31 July, 17 mm fell in just 3 h, while between 6 and 7 August, 10 mm fell uniformly in 10 h.
Rainwater below the maize canopy was 78% intercepted by the leaves and transferred along the stem (i.e., stemflow), while only 22% reached the ground directly (i.e., throughfall). The maximum difference between stemflow and throughfall occurred during the most abundant event (13.5 mm, 24 July), while the minimum was observed on 1 July (2.9 mm). It is worth noting that in all cases, stemflow was greater than throughfall (Figure 5).
Figure 5. Rain redistribution as affected by stemflow and throughfall interception. Error bars indicate standard errors.
Water 07 02254 g005
Sprinkler irrigation was applied on 4 July and 2 August, amounting to 43 mm (standard error, ±11 mm) and 28 mm (standard error, ±2 mm) throughout the study area, on average. Irrigation was not uniformly distributed in the study area, as it depended on the proximity to the sprinkler. Generally, a lower uniformity was observed during the first irrigation than the second one. In fact, the radius adjustment screw of the sprinkler was differently regulated to search an optimal setting, leading to a different spatial distribution between irrigations.
During the first irrigation event (Figure 6a), a linear decrease of water applied was observed, with a maximum of 57 mm, 6 m from the sprinkler, which reduced to a minimum of 10 mm at 37 m. As a result, water exceeded the mean value of 20 mm close to the sprinkler; vice versa, a difference of −21 mm between the amount applied and the mean value was found in the farthest sampling position. Water was mostly intercepted by the canopy as a stemflow (69.6%, on average), the distribution gradually increasing from 64% (6 m from the sprinkler) to 73% (37 m from the sprinkler).
During the second irrigation event (Figure 6b), the variability of the distribution (from 30 to 11 mm) was lower than that observed in the first one. Less variability was also observed when water interception by the canopy (i.e., stemflow) was compared with throughfall. In fact, the major difference was observed at 13 m from the sprinkler, where stemflow reached 78% of water interception, while it was slightly reduced at 27 m, reaching values of 64%.
Throughfall was mainly concentrated in the middle of the inter-row (Figure 7), reaching a peak of 17% at 29 cm from the row and decreasing to ca. 7% in proximity to both sides. Nevertheless, a slight asymmetry in water distribution was found between the right and left side of the inter-row that may be affected by the directional impact of water drops due to atmospheric conditions (e.g., wind direction).
Figure 6. Spatial variability of sprinkler rainfall and its partitioning between stemflow and throughfall (a) during the first event (4 July) and (b) the second event (2 August). Error bars indicate standard errors.
Water 07 02254 g006
Figure 7. Spatial variability of the throughfall measurements collected with throughfall collectors. Mean values of the three trays are reported. Error bars indicate standard errors.
Water 07 02254 g007
A general overview of water redistribution with respect to the amount (both rainfall and irrigation) showed that the stemflow/throughfall ratio decreased logarithmically (Figure 8) at increasing values of incident rainfall, underlining the plant maize capacity to intercept water during low rainfall events. Indeed, for incident rainfalls, <10 mm stemflow was four-times higher than throughfall, while for more abundant events (e.g., 35 mm), stemflow/throughfall was reduced to 2.6. By contrast, both the maximum and mean rainfall intensity data did not show a significant correlation with the stemflow/throughfall ratio.
Figure 8. Relationship between total rainfall amounts and stemflow/throughfall ratio. Error bars indicate standard errors.
Water 07 02254 g008

3.2. Inter-Row and Intra-Row Soil Water Dynamics

At the beginning of the experiment, soil water content (SWC) was similar in the three sampling areas, between the row and inter-row (Figure 9), with larger variations observed in the 0 to 20 cm soil profile (−0.02 m3·m−3) than in the 20 to 40 cm on (−0.03 m3·m−3). An increase in soil water content was generally observed from the top soil layer (10 cm depth) to a 40-cm depth, ranging from 0.18 to 0.27 m3·m−3, respectively.
Large variations were observed during the experiment in the top layer as affected by rainfall events, while they were gradually reduced in the deepest soil layers. Four different peaks in soil moisture were clearly visible at 10 cm (Figure 9), corresponding to the higher rainfall events. At 10 cm, the maximum soil water content was observed after the most abundant event (4 July, corresponding to sprinkler irrigation), reaching a peak of 0.26 m3·m−3. At greater depths (from 20 to 40 cm), all sampling sites showed reduced soil moisture variations as a result of soil water distribution after the rainfall events. Differences in terms of water storage between inter-row and row were negligible for all three study sites, as these were less than 1%, on average. However, higher soil moisture values were observed in the topsoil row position than in the inter-row as a consequence of low rainfall events (Figure 9), particularly after 19 and 20 July, when total rainfall was only 11 mm. In this case, SWC in the row exceeded 0.08 m3·m−3 of that in the inter-row.
Figure 9. Daily evolution of (a) meteorology and profile soil water content (SWC) for: (b) 0 to 10 cm; (c) 10 to 20 cm; (d) 20 to 30 cm; (e) 30 to 40 cm. Error bars indicate standard errors.
Water 07 02254 g009

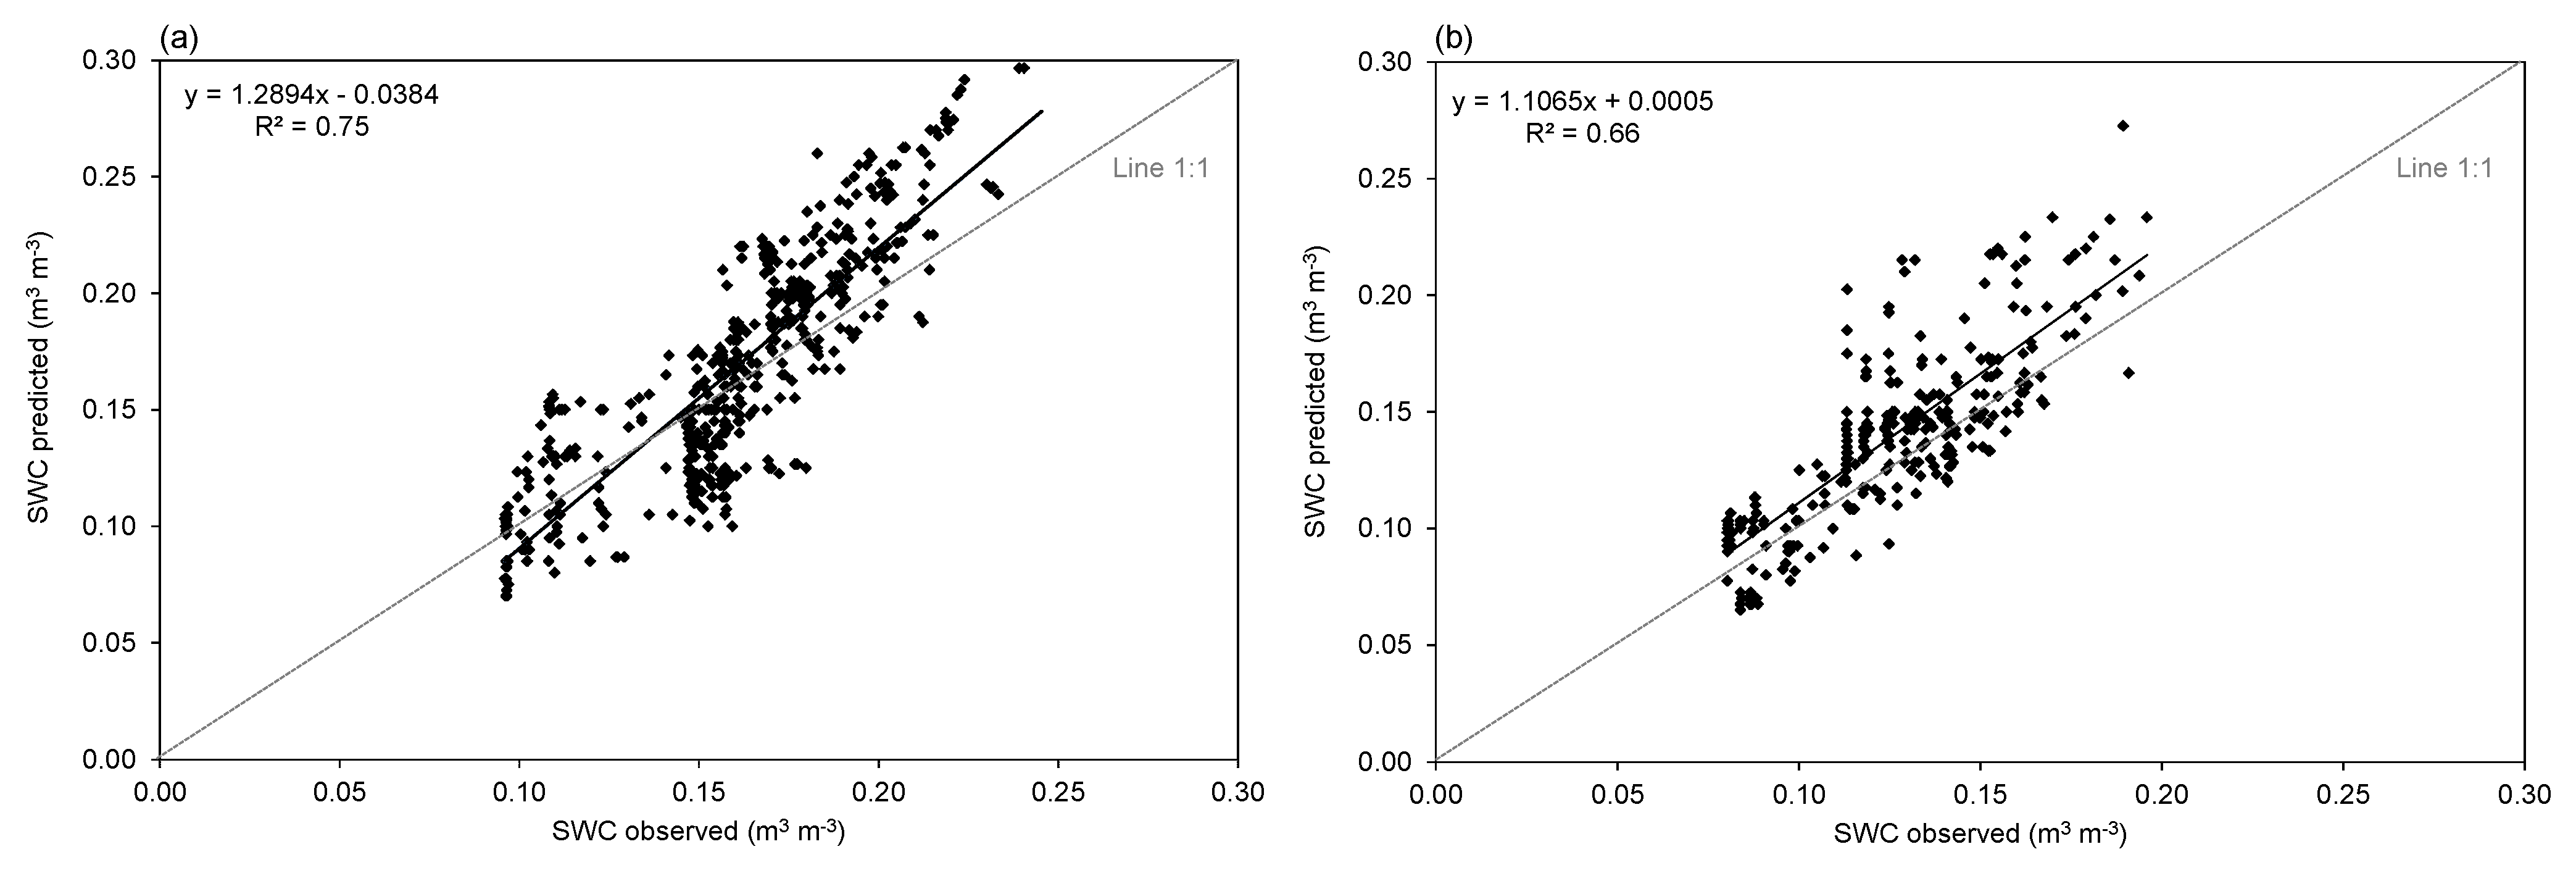
3.3. Calibration/Validation of HYDRUS 2D/3D

Experimental SWC values matched the predicted ones well, indicating that HYDRUS 2D/3D was able to predict the effects of canopy interception on water dynamics. This was confirmed by the linear regression between observed and predicted data, both for the inversion solution (Figure 10a; R2 = 0.75) and validation (Figure 10b; R2 = 0.66), as well as by the model accuracy estimated by means of RPD (1.45) [21].
Figure 10. Linear regression between observed and predicted data as a result of (a) model inversion and (b) validation.
Water 07 02254 g010
The Van Genuchten and Mualem models indicated that Sites A, B and C had similar soil structure characteristics (Table 1). Furthermore, the inversion process showed that the profiles were homogenous and properly described by a single soil material.
Table 1. Soil hydraulic parameters estimated by means of model inversion using HYDRUS 2D/3D for experimental Sites A, B and C.
SiteSWCr a (m3·m−3)SWCs (m3·m−3)α b (cm−1)n cKs d (cm·h−1)SWC (m3·m−3) −330 cmSWC (m3·m−3) −15,000 cm
A0.0310.4610.0051.510.710.3190.078
B0.0000.4600.0021.390.260.3950.115
C0.0710.4600.0061.520.480.3240.109
Notes: a SWC = residual (r) soil water content, at saturation (s) and at suctions of −330 and −15,000 cm; b α = parameter linked to the air entry suction; c n = parameter linked to pore size distribution; d Ks = saturated hydraulic conductivity.

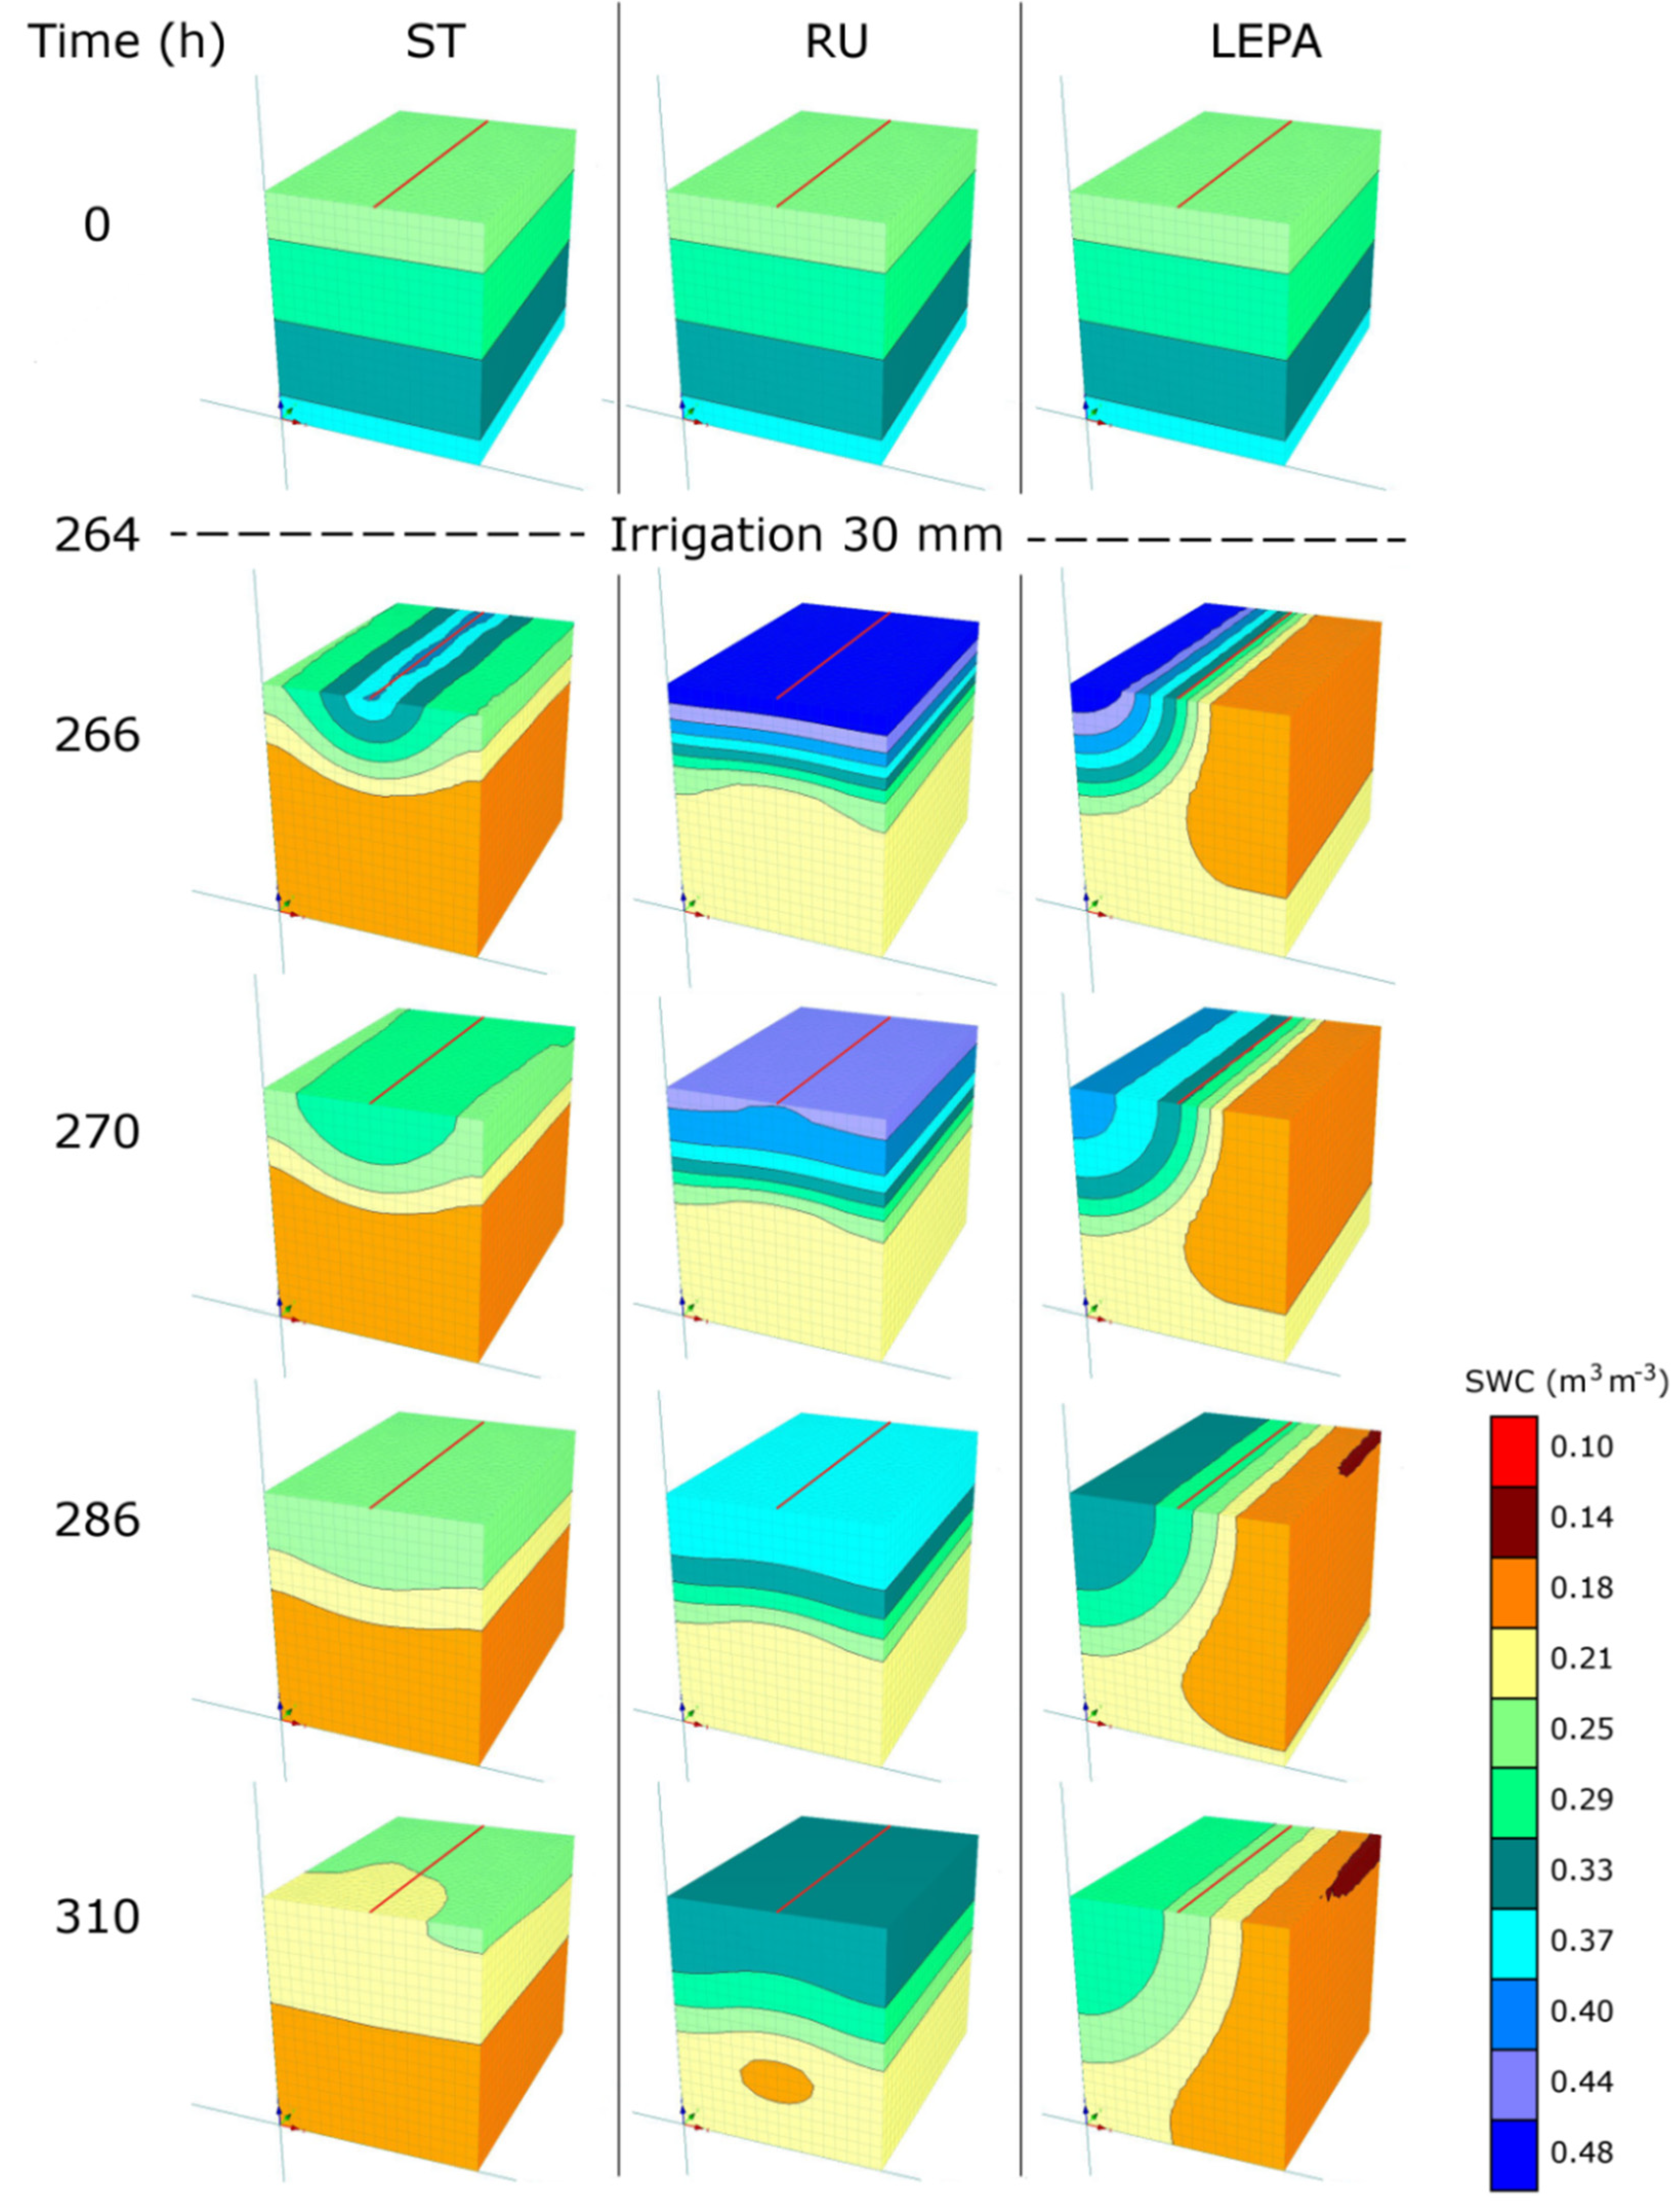
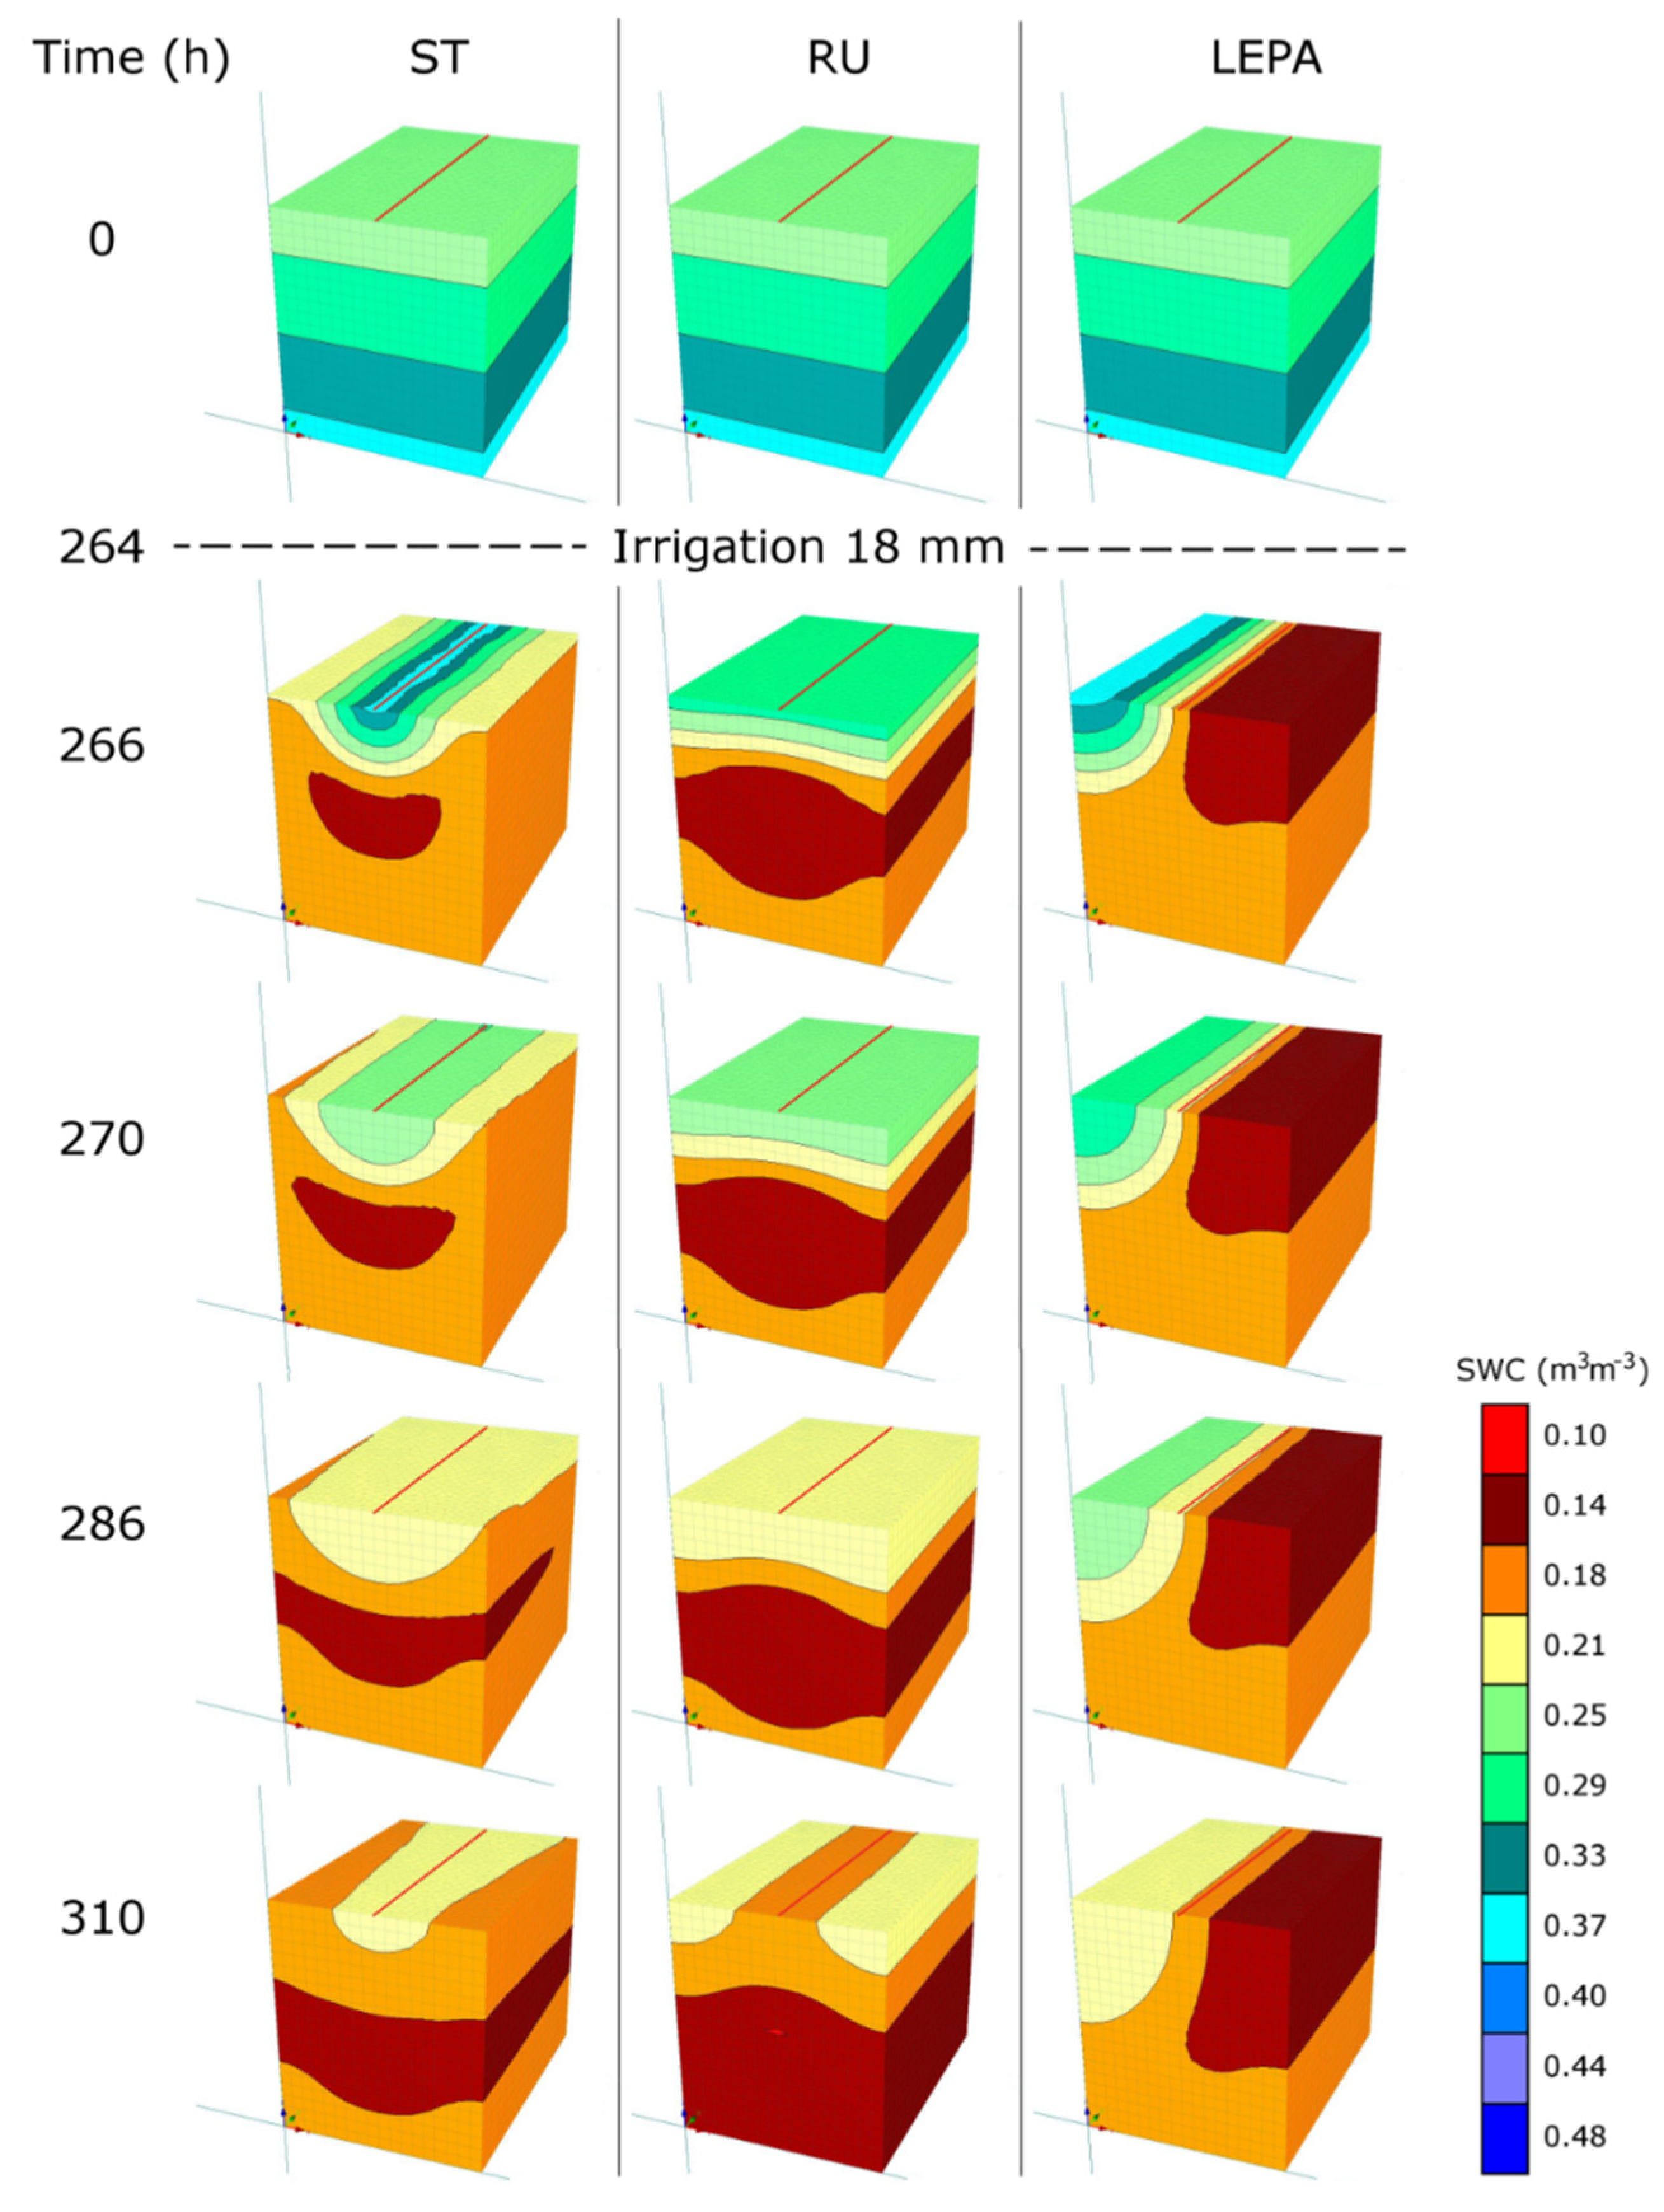
3.4. Numerical Simulations

The first simulated water management (here called full irrigation) was based on crop evapotranspiration compensation with non-limiting water conditions for maize during ripening. Therefore, during simulations, total rainfall was 210 mm, corresponding to the crop evapotranspiration requirement (Table 2). Full irrigation management did not show water stress conditions for maize growth, since the ratio between actual evapotranspiration (ET) and crop ETc (unstressed crop ET) was 0.92, on average. Generally, ET/ETc was higher in A than in B and C (0.97, 0.89 and 0.89, respectively) as a result of more favorable soil conditions for the crop. For example, plant growth was fostered in Site A compared to B and C at low moisture values, since it was characterized by a low water content at the wilting point (−15,000 cm; Table 1).
Table 2. Water mass balance estimated for two different irrigation management scenarios.
SiteIrrigationSimulations aRF (mm)ET (mm)ETc (mm)ET/ETcDrainage (mm)WCin b (mm)WCfin c (mm)
AFullRU2102612700.970.90172122
ST2102612700.970.91172122
LEPA2102612700.971.00172120
Deficit 60%RU1262172700.800.9017282
ST1262202700.810.9017281
LEPA1262132700.790.9017286
BFullRU2102412700.890.19172142
ST2102412700.890.19172142
LEPA2102432700.900.19172138
Deficit 60%RU1261902700.700.19172108
ST1261932700.710.19172107
LEPA1261862700.690.19172113
CFullRU2102402700.890.34172144
ST2102412700.890.34172144
LEPA2102412700.890.35172143
Deficit 60%RU1261932700.710.34172108
ST1261962700.720.34172106
LEPA1261892700.700.34172112
Notes: a RU (uniform rainfall) = rainfall application with an optimal uniform distribution down canopy; ST = stemflow/throughfall water redistribution; LEPA = low-energy pressure application; b WCin = initial soil water content; c WCfin = final soil water content.
By comparing the water distributions, it was observed that the different irrigation simulations did not show any difference in terms of ET/ETc, since it was always 0.97 in Site A and largely 0.89 in Sites B and C. Water losses due to drainage were negligible in all simulations and always less than 1 mm in Site A, 0.19 mm and 0.35 mm in B and C, respectively. The visual representation of soil water dynamics at increasing time steps (Figure 11) highlighted the effect of different water distributions. For example, after an irrigation event (at Hour 264), the ST model tended to increase the soil moisture below the maize row (central position of the soil domain) and gradually reduced it towards the inter-row (right and left areas of the domain). Irrigation only affected the first 40-cm depth of the soil profile, while the soil water content (0.15 to 0.19 m3·m−3) did not change in the layer below (40 to 80 cm). By contrast, with the LEPA irrigation system, water was mainly concentrated in ca. 40 cm around the area of application, influencing the soil water content both in the row and in the furrow of application (left side, inter-row). For example, SWC, at 266-h time step, ranged between 0.46 and 0.19 m3·m−3 within the soil profile.
Figure 11. Visual 3D representation of soil water content (SWC, m3·m−3) in the 3D HYDRUS domain under full irrigation and characterized by: ST, stemflow/throughfall redistribution; RU, uniform rainfall application; LEPA, low-energy precision application system. The maize row is placed in the middle position of the soil domain (red line).
Water 07 02254 g011
Generally, ET/ETc with deficit irrigation (Figure 12) was lower than under full irrigation, as it was −20% on average, with a maximum observed in ST, Site A (ET/ETc = 0.81), and a minimum in LEPA, Site B (ET/ETc = 0.69), highlighting critical conditions for maize growth. In such cases, the higher root density below the row contributed to a reduction in soil water content as a result of increased water uptake.
Figure 12. Visual 3D representation of soil water content (SWC, m3·m−3) in the 3D HYDRUS domain under deficit irrigation and characterized by: ST, stemflow/throughfall redistribution; RU, uniform rainfall application; LEPA, low-energy precision application system. The maize row is placed in the middle position of the soil domain (red line).
Water 07 02254 g012

4. Discussion

Water partitioning between stemflow and throughfall was affected by the rainfall amount and described by a negative logarithmic equation (Figure 8). Nevertheless, the source of uncertainty could be due to the water evaporation from the maize canopy, although being estimated at less than 10% [22]. A similar stemflow/throughfall partitioning had already been observed in other studies [8], where the water redistribution between the row and the inter-row was measured in the field with conditions similar to ours (i.e., closed maize canopy with LAI = 3.6 ± 0.2): the authors showed that the lowest rainfall events were associated with the highest stemflow/throughfall ratio, while with higher rainfall (ca. ≥20 mm), the ratio stabilized at values <10. Most likely, high rainfall events increase the probability of dripping in the inter-row, as raindrops overload and bend the leaves and accordingly decrease stemflow volumes. Conversely, Hupet and Vanclooster [6] reported that the stemflow/throughfall ratio increased with increasing rainfall, although their results were obtained with a low maize leaf coverage (2.5 < LAI < 3.6) and were not representative of a wide range of data, since the rainfall amounts were low (i.e., <20 mm). Rainfall redistribution below the maize canopy was crucial to allocate the water in the soil, particularly after medium and low events, while during intense rainfall, the soil water was fairly uniform between stemflow and throughfall. As a result, the variation was large when rainfall was <40 mm (20 July), while a negligible effect was found after significant events (e.g., 4 July), as also observed by other authors [8]. According to Logsdon et al. [5], the high stemflow/throughfall ratio led to an abrupt increase of the row soil moisture that was followed by its decrease a few days after the rainfall event. This was probably due to the activity of maize roots that were mostly concentrated below the stem, leading to site-specific evapotranspiration rates and consequently decreasing the soil water content. Extensive literature has already reported that root water uptake within the maize rows is spatially variable, both laterally and vertically [6,7], and can be influenced by incident rainfall [23]. As a result, the soil moisture differences observed between stemflow and throughfall in a silty-loam soil were rapidly smoothed by root activity. Nevertheless, local soil conditions and moisture characteristics could have partly affected the heterogeneity in the root distribution and, as a consequence, the variation of water partitioning. Moreover, capillary forces increased the horizontal infiltration and consequently reduced the SWC difference induced by stemflow and throughfall. This was also supported by the simulations performed with diversified fluxes (stemflow and throughfall): in spite of the soil receiving higher amounts of water along the row according to ST redistribution (i.e., in the middle of the soil domain; Figure 11 and Figure 12), it was also the fastest to dry out due to a greater root water uptake.
Simulations under different water distributions provided significant indications of the effectiveness of irrigation management during maize ripening. In general, optimal crop growth conditions were observed with irrigation scheduling based on maize evapotranspiration compensation, responding to the ETc demand and limiting the water loss by drainage (always less than 1% total rainfall). This emphasized that maize root water uptake, in our silty-loam soil, was weakly sensitive to irrigation systems. Similar results were also supported by Schneider and Howell [24], who measured maize growth under full irrigation with LEPA and a spray sprinkler (i.e., irrigation below and above the canopy), reporting no significant yield differences between the systems.
Water use efficiency, estimated by means of the ratio ET/ETc, did not change with RU and ST when compared with LEPA under full irrigation management as a consequence of soil water content variations between row and inter-row. Conversely, with deficit irrigation, SWC was a limiting factor for crop evapotranspiration, and ET/ETc was slightly lower in LEPA than ST and RU. In particular, a sharp distinction in SWC was observed between alternate furrows under LEPA. In fact, the left side of the soil domain received rainfall that was gradually distributed in the row, while the right side of the furrow was only marginally affected by water input, limiting the optimal water uptake in proximity to a higher root density (i.e., close to the soil surface).

5. Conclusions

Experimental data suggested the importance of considering rainfall canopy interception to improve water use efficiency and dynamics in the vadose zone, because the natural crop architecture was able to intercept water and direct it along the stem. This effect was particularly significant at low rainfall amounts, emphasizing maize’s ability to mitigate water stress conditions as it localized water close to the roots. This was confirmed by soil moisture data, since the only differences observed between row and inter-row were found at rainfall amounts <15 mm.
Modelled data highlighted different behavior in terms of soil water dynamics between water distributions with both full and deficit irrigation management, although it did not affect the actual root water uptake and, consequently, the water use efficiency (ET/ETc). Most likely, these results were affected by the soil type (silty-loam) where the experiment was conducted, as it showed unfavorable physical conditions for a rapid vertical water movement that would increase infiltration through the profile and, finally, drainage (e.g., low hydraulic conductivity). This suggests a need to test rainfall redistributions in further experiments considering a wider soil variability, in order to provide insights into water use efficiency under different irrigation managements.

Author Contributions

Lucia Bortolini and Francesco Morari conceived and designed the field experiments and modelling activities; Marco Martello and Lucia Bortolini performed the experiments; Marco Martello and Nicola Dal Ferro analyzed the data; all the authors equally contributed to write the paper.

Conflicts of Interest

The authors declare no conflict of interest.

References

  1. Pereira, L.S.; Cai, L.G.; Hann, M.J. Farm water and soil management for improved water use in the North China Plain. Irrig. Drain. 2003, 52, 299–317. [Google Scholar]
  2. Siebert, S.; Döll, P. Quantifying blue and green virtual water contents in global crop production as well as potential production losses without irrigation. J. Hydrol. 2010, 384, 198–217. [Google Scholar] [CrossRef]
  3. Lamm, F.R.; Manges, H.L. Partitioning of sprinkler irrigation water by a corn canopy. Trans. ASAE 2000, 43, 909–918. [Google Scholar] [CrossRef]
  4. Frasson, R.P.M.; Krajewski, W.F. Rainfall interception by maize canopy: Development and application of a processed-based model. J. Hydrol. 2013, 489, 246–255. [Google Scholar] [CrossRef]
  5. Logsdon, S.D.; Sauer, T.J.; Hernandez-Ramirez, G.; Hatfield, J.L.; Kaleita-Forbes, A.L. Effect of corn or soybean row position on soil water. Soil Sci. 2010, 175, 530–534. [Google Scholar] [CrossRef]
  6. Hupet, F.; Vanclooster, M. Micro-variability of hydrological processes at the maize row scale: Implications for soil water content measurements and evapotranspiration estimates. J. Hydrol. 2005, 303, 247–270. [Google Scholar] [CrossRef]
  7. Van Weesenbeck, I.; Kachanoski, R. Spatial and temporal distribution of soil water in the tilled layer under a corn crop. Soil Sci. Soc. Am. J. 1988, 52, 363–368. [Google Scholar]
  8. Paltineanu, I.; Starr, J. Preferential water flow through corn canopy and soil water dynamics across rows. Soil Sci. Soc. Am. J. 2000, 64, 44–54. [Google Scholar] [CrossRef]
  9. Lyle, W.M.; Bordowsky, J.P. Low energy precision application (LEPA) irrigation system. Trans. ASAE 1981, 24, 1241–1245. [Google Scholar] [CrossRef]
  10. Schneider, A.D.; Buchleiter, G.W.; Kincaid, D.C. LEPA irrigation developments. In Proceedings of the 4th Decennial Symposium, National Irrigation Symposium, Phoenix, AZ, USA, 14–16 November 2000; pp. 89–96.
  11. Food and Agriculture Organization (FAO); United Nations Educational, Scientific and Cultural Organization. Soil Map of the World, Revised Legend; FAO: Rome, Italy, 1990. [Google Scholar]
  12. Borin, M.; Morari, F.; Bonaiti, G.; Paasch, M.; Skaggs, W. Analysis of DRAINMOD performances with different detaiul of soil input data inb the Veneto region of Italy. Agric. Water Manag. 2000, 42, 259–272. [Google Scholar] [CrossRef]
  13. Norme Internationale (ISO). Matériel D’irrigation Asperseurs Rotatifs Partie 2: Uniformité de la Distribution et Méthodes D’essai. ISO 7749-2; ISO: Lethbridge, AL, Canada, 1990. (In French) [Google Scholar]
  14. Simunek, J.; Sejna, M.; van Genuchten, M.T. The HYDRUS-2D Software Package for Simulating Two-Dimensional Movement of Water, Heat, and Multiple Solutes in Variably Saturated Media. Version 2.0, IGWMC-TPS-53; International Ground Water Modeling Center, Colorado School of Mines: Golden, CO, USA, 1999. [Google Scholar]
  15. Van Genuchten, M.T. A closed-form equation for predicting the hydraulic conductivity of unsaturated soils. Soil Sci. Soc. Am. J. 1980, 44, 892–898. [Google Scholar] [CrossRef]
  16. Allen, R.; Pereira, L.; Raes, D.; Smith, M. Crop Evapotranspiration—Guidelines for Computing Crop Water Requirements; Food Agriculture Organization Of the UN: Rome, Italy, 1998. [Google Scholar]
  17. Dal Ferro, N.; Sartori, L.; Simonetti, G.; Berti, A.; Morari, F. Soil macro and microstructure as affected by different tillage systems and their effects on maize root growth. Soil Till. Res. 2014, 140, 55–65. [Google Scholar] [CrossRef]
  18. Feddes, R.A.; Kowalik, P.J.; Zaradny, H. Simulation of Field Water Use and Crop Yield; John Wiley and Sons: New York, NY, USA, 1978. [Google Scholar]
  19. Chang, C.; Laird, D.A.; Mausbachc, M.J.; Hurburghd, C.R. Near-infrared reflectance spectroscopy–principal components regression analyses of soil properties. Soil Sci. Soc. Am. J. 2001, 65, 480–490. [Google Scholar] [CrossRef]
  20. Giardini, L. Productivity and Sustainability of Different Cropping Systems; Patron Editore: Bologna, Italy, 2004. [Google Scholar]
  21. Viscarra Rossel, R.A.; Walvoort, D.J.J.; McBratney, A.B.; Janik, L.J.; Skjemstad, J.O. Visible, near infrared, mid infrared or combined diffuse reflectance spectroscopy for simultaneous assessment of various soil properties. Geoderma 2006, 131, 59–75. [Google Scholar] [CrossRef]
  22. Keller, J.; Bliesner, R.D. Sprinkle and Trickle Irrigation; Blackburn Press: Caldwell, NJ, USA, 2000. [Google Scholar]
  23. Michot, D.; Benderitter, Y.; Dorigny, A.; Nicollaud, B.; King, D.; Tabbagh, A. Spatial and temporal monitoring of soil water content with irrigated corn crop cover using surface electrical resistivity tomography. Water Resour. Res. 2003, 39. [Google Scholar] [CrossRef]
  24. Schneider, A.D.; Howell, T.A. LEPA and spray irrigation for grain crops. J. Irrig. Drain. Eng. 1999, 125, 167–172. [Google Scholar] [CrossRef]

