Article

Impacts of Urbanization on River Systems in the Taihu Region, China

1
School of Geographic and Oceanographic Science, Nanjing University, Nanjing 210023, China
2
School of Environmental and Resource Science, Guangxi Normal University, Guilin 541004, China
*
Author to whom correspondence should be addressed.
Water 2015, 7(4), 1340-1358; https://doi.org/10.3390/w7041340
Submission received: 9 October 2014 / Revised: 4 December 2014 / Accepted: 17 March 2015 / Published: 26 March 2015

Abstract

:
River systems are valuable to human beings; meanwhile, they are intensively influenced by human activities, especially urbanization. In this study, based on the data derived from topographic maps and remote sensing images, the temporal and spatial change of river system geomorphology in the Taihu Region over the past 50 years was investigated in conjunction with urbanization. Results demonstrated that the number of river systems decreased drastically, that the morphology of river channels changed into wider and straighter and that the structure of river network tended to simplify in the Taihu Region in recent 50 years. Meanwhile, the changes in river density, the water surface ratio, the river development coefficient, the main river area length ratio and the box dimension in the rapid urbanization period were much greater than those in the slow urbanization period, but the decrease of river sinuosity in the slow urbanization period was more intense. Moreover, the spatial differences of the changes in the river development coefficient were the largest, and the changes in the river indicators in the low-urbanized regions were the most intense. In addition, the changes in the water surface ratio had the closest correlation with urbanization, and the relational degrees between population urbanization and the changes in river systems were the largest. The results can provide a reliable basis to determine reasonable management and conservation strategies of river systems in the Taihu Region.

1. Introduction

Over the past several millenniums, river systems have always been extensively altered to meet various human demands, which led to them becoming the most intensively influenced ecosystems by human activities on the Earth [1]. Among these human activities, the influence of urbanization on river systems was the most significant, and 60% of river systems were changed profoundly because of urbanization in the world [2]. The ecological integrity of river systems and river ecosystem function were seriously threatened because of these great changes over the past few decades [3,4]. An increasing number of studies have manifested that the degradation of river structure and function would bring about severe river health issues, such as “urban stream syndrome”, but it was particular disadvantageous for the survival and development of human beings [5,6,7]. Therefore, investigating the impacts of urbanization on river systems is crucial to the sustainable management and conservation of river basins.
Although humans carried out various activities to change river systems over the last 4000 years, the impacts of human activities on river systems were not introduced and studied as a broad and specific question until the middle of the 20th century [8]. The studies of the impacts of urbanization on river systems have made significant progress over the past 60 years, and these advances have been focusing mainly on rapidly urbanized regions around the world [9]. Overall, the impacts of urbanization on river systems were mainly embodied in the fluvial geomorphology, hydrology and ecology, but the impacts were inconsistent for river systems of different stream orders and human needs [10,11,12]. Generally, main rivers of a high stream order were widened because of the increase of the runoff volume caused by river channel dredging and impervious surface increases, and tributaries of a low stream order were narrowed gradually or even disappeared because of river channel sedimentation and urban occupation [13,14,15]. However, there were different impacts in different urbanized regions, and the impacts of urbanization on river systems usually reduced from the city proper to suburbs [16]. Therefore, regional responses of river systems to urbanization are essential to understanding how the river systems are impacted by human activities.
Taihu Basin is one of the regions with the fastest urbanization speed and the highest urbanization level in China. The rapid urbanization caused a series of changes to the river systems and brought about water degradation, flood disasters and other ecological and environmental issues. In recent years, these serious issues have received increasing attention from both local and central governments in China. Moreover, some great events have become headline news around the world, such as the cyanobacteria event in 2007 and the flood event in 1999. In this context, new pollution abatement and flood control work have been planned and implemented in Taihu Basin. Similarly, some basic research concerning the causes of the increasing pollution and flood has been reevaluated and redirected [17,18,19]. So far, studies on the characteristics of river system changes and the qualitative relationship with urbanization on a small scale have been conducted [16,20,21]. However, previous studies generally focused on describing the changes of river systems in highly urbanized regions, and there were very few studies that paid attention to the quantitative relationship between the changes of river systems and urbanization. Therefore, investigating the impacts of varying degrees of urbanization on river systems on a larger region is indispensable for the sustainable management of Taihu Basin.
In this paper, the major characteristic indicators of river systems and urbanization were identified and derived, and the changes and corresponding relations of these two types of indicators were then used to discuss the impacts of urbanization on river systems in the Taihu Region (the central plain regions of Taihu Basin). The results of our study can provide insight into the characteristic of river system changes under varying degrees of urbanization and provide a reliable basis to determine reasonable management and conservation strategies of river systems in the Taihu Region.

2. Material and Methods
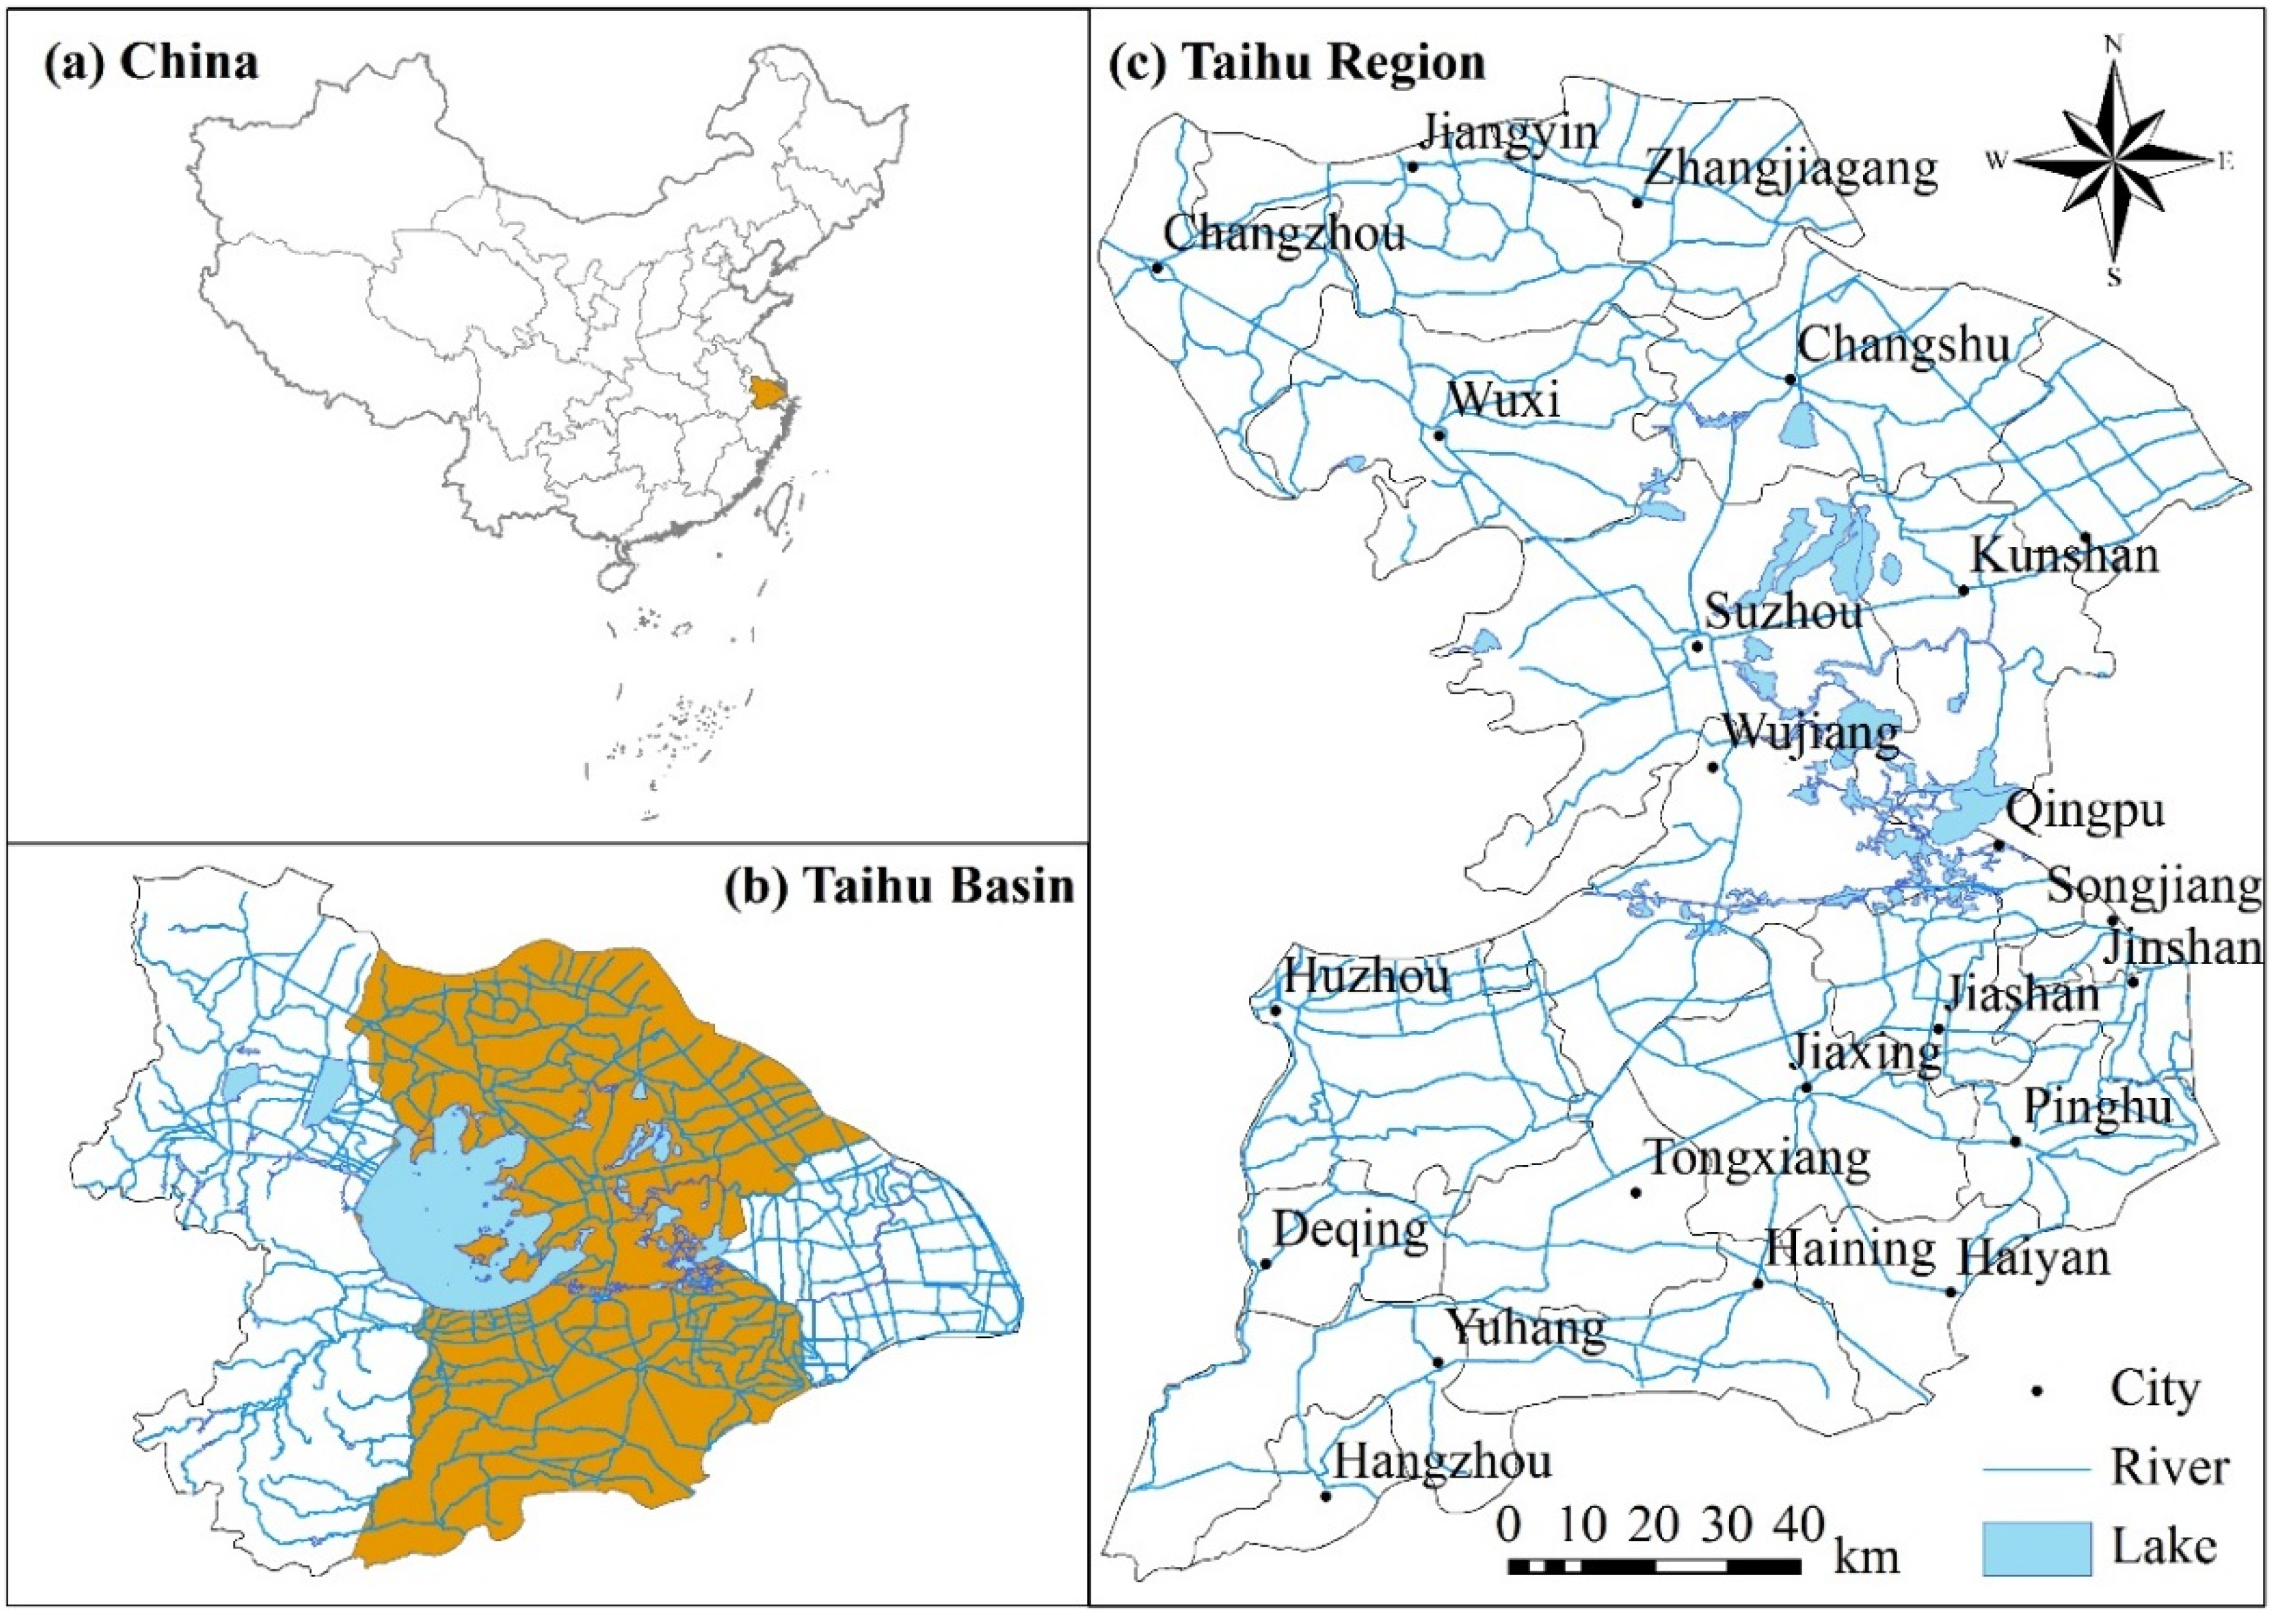
2.1. Study Area

Taihu Basin is located in the center of the Yangtze River delta in eastern China (Figure 1). The topography of Taihu Basin is characterized primarily by a large dish-like depression with a lower center (about 2 m above mean sea level) and a higher relief along the coastal margin (about 4–5 m above mean sea level) [22]. The total basin area is about 36,895 km2, the western part of which is hilly regions with an area of 7338 km2; the central part is a lake region with an area of 2338 km2, and the other 27,219 km2 are wide plain regions.
Figure 1. The map of Taihu Region.
Water 07 01340 g001
Taihu Basin is the most renowned river network region in China. There is water surface area of 5551 km2, occupying about 15% of the whole basin, a river total length of 120,000 km and a river density of 3.3 km/km2. Meanwhile, the central basin distributes to many lakes due to the lower topography, such as Taihu Lake, Yangcheng Lake, Dianshan Lake and Cheng Lake. Moreover, river systems of this basin are divided into the upstream and downstream. Some independent river systems in the western hilly regions, including Tiaoxi stream (contributing 50% to runoff sources), Nanhe stream (contributing 25% to runoff sources) and Taoge River streams (contributing 20% to runoff sources), are the upstream. The wide plain river systems are the downstream, including Huangpu River in the eastern part, some rivers flowing into the Yangtze River in the northern part and other rivers flowing into Hangzhou Bay in the southern part.
Unlike other large freshwater lakes in China, a more complex natural and anthropogenic environment exists in Taihu Basin. Due to its lower elevation, Taihu Lake is closely associated with the East China Sea via a dense river network, which leads to it being invariably impacted by typhoon rainstorm in the summer season and the rising tide during winter [23]. Meanwhile, a large number of water conservancy projects have been constructed around the urban and rural areas, such as protective embankments in lakeside areas, water gates, pump stations and dams. These constructions not only met the irrigation, discharge, and navigation needs, but also destroyed the connectivity of rivers and lakes and threaten their natural regulation and purification functions. Moreover, with the rapid development of urbanization (as an example, the proportion of urban land increased from 7.08% in 1991 to 27.16% in 2010), increasing non-point pollution and sewage wastewater via river network inflow to Taihu Lake results in poor water quality [24,25], and increasing water use for production and living bring groundwater overdrafts and result in severer land subsidence (about 1–2 cm annually). Thus, serious pollution and flood disasters are the key challenges that Taihu Basin faces in the future [26,27].
Generally, the flooding of Taihu Basin is caused by the rainfall runoff of the western hilly regions and the rainfall of the central and eastern plain regions. The flooding is discharged to the East China Sea via the regulation and storage of Taihu Lake. Obviously, the plain regions are the key regions for controlling flooding. Therefore, the central plain regions (Taihu Region) were selected as the study area in this paper (Shanghai is excluded due to the presence of some studies). The total area of the Taihu Region is about 15,757 km2, covering 22 large and medium- and small-sized cities, such as Hangzhou, Suzhou, Wuxi, Changzhou, Jiaxing, Huzhou and Jiangyin. The Taihu Region has been a major economic and cultural center of China since ancient times. Nonetheless, the frequent flood disasters cause enormous economic losses and have hindered the sustainable development of society and the economy in recent decades.

2.2. Data

River systems data were derived from 200 military topographic maps with a scale of 1:50,000 in the 1960s (1960–1963) and 1980s (1983–1985) and a digital line graphic with a scale of 1:50,000 in the 2010s (generated by a local bureau of surveying and mapping in 2009, but verified by us in 2014). The basic elements of river systems are composed of polygons and polylines. The lakes, reservoirs, ponds and main rivers are represented as polygons, and other tributaries are represented as polylines. Meanwhile, the center lines of the main rivers are extracted by ArcGIS for calculating river density, the river development coefficient, river sinuosity, the main river area length ratio and the box dimension. Moreover, in order to calculate the water surface ratio, the widths of tributaries are estimated based on their order.
A common method of designating river orders was established by Strahler in 1952 [28], and its basic idea is as follows: the smallest river connecting directly to the headwater is designated the first-order river; two first-order rivers are joined in the second-order river; the third-order river is joined by two second-order rivers; and so forth. The river systems were divided into four stream orders in the Taihu Region, according to the aforementioned method and the natural features (the length and width of rivers), as well as the social attributes (the main functions and competent authorities of rivers) of the river systems. Among them, the width of the first-order river was less than 10 m, and the width of the second-order river was between 10 and 20 m. Meanwhile, the width of the third-order river was between 20 and 30 m, and the width of the fourth-order river was wider than 40 m. Moreover, the rivers of the first-order and second-order are regarded as the tributaries, and the rivers of the third-order and fourth-order are viewed as the main rivers.
Population, economic and land use data were used to analyze the urbanization process of every administrative region in the Taihu Region. Eight Landsat TM images (spatial resolution of 30 m) in 1984 and 2010 were used to extract the land use data. With the support of ENVI, the Landsat TM images were interpreted and analyzed, and the land use types were divided into urban land, water area, dry land, forest land and paddy field. Moreover, population and economic data were derived from the statistical yearbook of every administrative region in the Taihu Region during that same period.

2.3. River and Urbanization Indicators

In order to analyze quantitatively the changes of river systems and the urbanization process in the Taihu Region, six river indicators and three urbanization indicators were identified and derived based on fluvial geomorphology and urban geography, as follows.

2.3.1. River Density

River density is the total length of river per unit area in a basin, and it is an important characteristic of river development. Moreover, the storage and discharge capacity of a basin are usually influenced by the river density, especially in the Taihu Region [16]. The expression of river density is:
Dr = L/A
where Dr is the river density (km/km2); L is the total river length (km); A is the basin area (km2).

2.3.2. Water Surface Ratio

The water surface ratio is the ratio of the total area of rivers and lakes under the mean water level to the basin area. It is important to maintain an adequate water surface ratio for urban flood control and the ecosystem service function of water purification, climatic regulation and biodiversity conservation [20,29]. Its computational formula is:
Wp = Aw/A
where Wp is the water surface ratio (also known as water percentage); Aw is the total area of rivers and lakes under the mean water level (km2).

2.3.3. River Development Coefficient

Generally, the tributaries constitute more than half of the total river length, and these small rivers dominate the riverine landscape and provide essential functions for the main rivers [30,31,32]. However, in the process of urbanization, the tributaries are usually filled or diverted through pipes to accommodate the construction of building, roads and bridges [14,33]. Therefore, it is necessary to survey the changes of the tributary length under urbanization. The river development coefficient is the ratio of the total tributary length to the total main river length. It is calculated as:
Kω = Lt/Lm
where Kω is the river development coefficient; Lt is the total tributary length (km); Lm is the total main river length (km).

2.3.4. River Sinuosity

Natural sinuosity is an important characteristic of river morphology, and it also forms a rich variety of river habitat [34]. Therefore, river sinuosity has been widely used in river health assessment since the 1980s [35,36,37,38,39]. It can be calculated by the following formula:
S r = i m L a i L × L a i L s i
where Sr is the river sinuosity; Lai is the actual length of the i-th river (km); Lsi is the straight-line distance from the i-th river starting point to its terminal point (km).

2.3.5. Main River Area Length Ratio

The main river is not only the main waterway of navigation, but also the important channel of discharge. Therefore, the size of the main river is closely related to human demands. The main river area length ratio is the characteristic indicator of the asynchronous development of the main river area and length. Its computational formula is:
Rm = Am/Lm
where Rm is the main river area length ratio (km2/km); Am is the total area of main rivers (km2).

2.3.6. Box Dimension

The geometric pattern of the river network of a basin can be described with a fractional dimension [40]. The box dimension is the simplest and most widely-used characterization indicator of the fractal dimension [41], and it can be used to investigate the scaling properties of the complex structure describing the river basin form and process [42]. Meanwhile, the box dimension of river systems can reflect the developmental stage of stream erosion [43], as follows: (1) river systems are in the young stage when the values of the box dimension are less than 1.6; (2) the value of the box dimension of the mature stage is between 1.6 and 1.89; (3) when the value of the box dimension is between 1.89 and 2.0, it is regarded as in the old stage. The calculation method of the box dimension is:
D 0 = lim r 0 l g N ( r ) l g r
where D0 is the box dimension; N(r) is the number of boxes with some rivers; r is the side length of the box, and r = 1000, 950, 900, 850, 800, ..., 50 m are used in this paper according to the mean length and density of rivers.

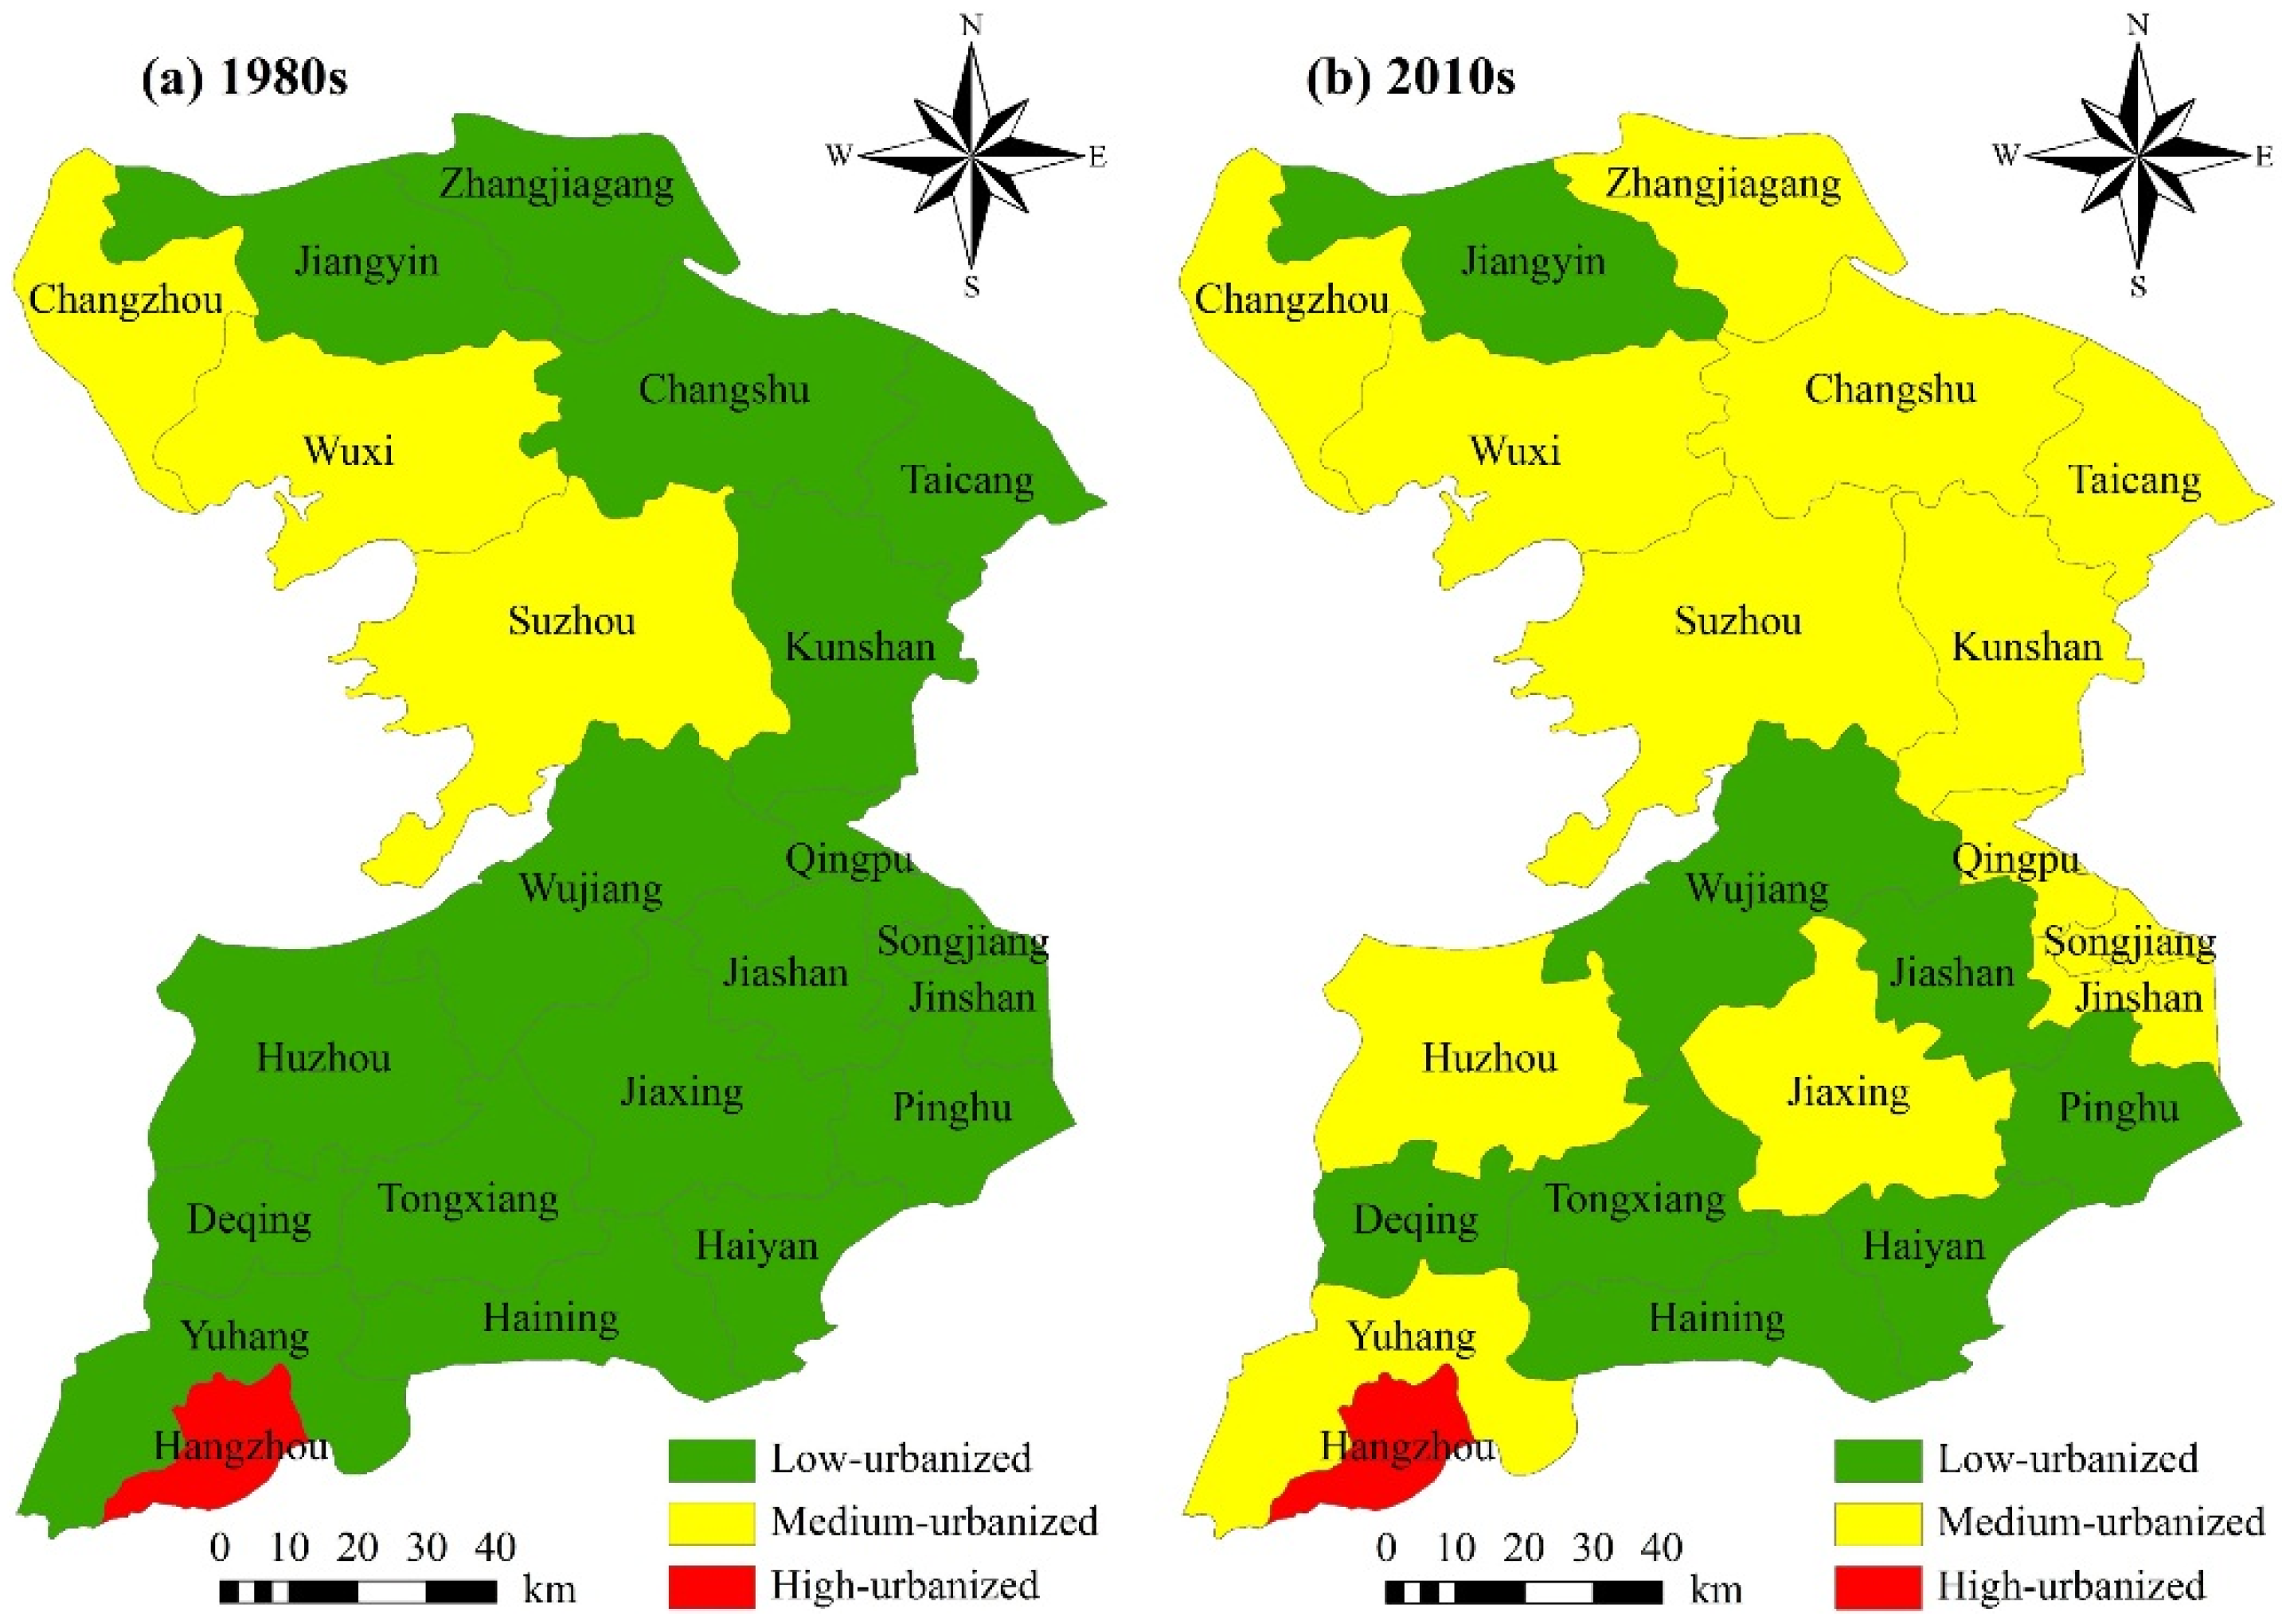
2.3.7. Urbanization Indicators

In urban geography, urbanization is a complex process of the transformation from a rural lifestyle to an urban one. Today, urbanization not only is the growth of cities and towns, but also includes its impacts on the rural countryside. Generally, the main characteristics of urbanization are the increase of urban population, the development of a non-agriculture economy and the expansion of urban land [44]. Consequently, in this paper, the population urbanization level (Up), economic urbanization level (Ue) and spatial urbanization level (Us) were used to characterize the urbanization (Table 1). The urban population of every city is the total non-agriculture population in the whole administrative region. Urban land includes the residential, administration and public services, commercial and business facilities, industrial, logistics and warehouse, street and transportation and municipal utilities land, according to the reference of the Code for Classification of Urban Land Use and Planning Standards of Development Land (GB 50137-2011), which was published by the Ministry of Housing and Urban-Rural Development of the People’s Republic of China (MOHURD) in 2011 [45].
Table 1. Characteristic indicators and the computational methods of urbanization.
ClassificationCharacteristic IndicatorsComputational Methods
Population urbanizationPopulation urbanization level (Up)The ratio of urban population to total population
Economic urbanizationEconomic urbanization level (Ue)The ratio of non-agricultural GDP to total GDP
Spatial urbanizationSpatial urbanization level (Us)The ratio of urban land area to total area

2.4. Grey Relational Analysis

Currently, empirical model and statistical model are usually used to quantitatively analyze the mutual relation between two variables, such as correlation analysis and regression analysis. However, large samples, typical probability distributions and other demands limit the application of these methods to some extent. Grey relational analysis (GRA) is usually used to analyze the mutual relation of different variables, according to the similarities of geometric proximity between different discrete sequences [46]. In practice, the geometric proximity is described by the grey relational degree, which can be arranged in sequential order [47]. An advantage is that the sample and distribution of data are unrestricted in the application of GRA. Further information regarding GRA is available in the literature [48]. However, the changes of river systems and urbanization are continuous, but long time series relevant data acquisition is very difficult. In this paper, GRA is used to analyze the impacts of urbanization on river systems, and the basic steps are as follows:
(1)
Setting of the sequences.
The reference sequence is set as:
yi(t) = {yi(1), yi(2), ..., yi(k)}, i = 1, 2, ..., m; t = 1, 2,..., k
where y is the changes in river indicators; i represents the i-th river indicator; t represents the t-th city of the study area.
The comparability sequence is set as:
xj(t) = {xj(1), xj(2), ..., xj(k)}, j = 1, 2, ..., n; t = 1, 2, ..., k
where x is the urbanization indicators; j represents the j-th urbanization indicator.
(2)
Normalization of the variables.
y i ( t ) * = y i ( t ) t = 1 k y i ( t ) ,   t = 1, 2, 3, ...,   k
x j ( t ) * = x j ( t ) t = 1 k x j ( t ) ,   t = 1, 2, 3, ...,   k
where yi(t)* and xj(t)* are the normalized value of the reference and the comparability sequence, respectively.
(3)
Determine the relational coefficients.
ξ i j ( t ) = m i n + ρ m a x i j ( t ) + ρ m a x
where ξ ij(t) is the grey correlation coefficient of yi(t) and xj(t); m a x and m i n are the largest and smallest value of the difference in absolute value between yi(t)* and xj(t)*, respectively; ρ is the distinguishing coefficient, which differentiates the degree of proximity of yi(t) and xj(t), such that ξ ij(t) [ 0 , 1 ] . Generally, the difference of ξ ij(t) is greater when ρ is a smaller value, and ρ = 0.5 is widely accepted [46].
(4)
Calculation of the relational degrees.
γ i j =   1 k t = 1 k ξ i j ( t )
where γ i j is the grey relational degree of yi(t) and xj(t).
(5)
Sorting the relational degrees.
The grey relational degrees can be sorted in descending order. The impact of xj(t) with the larger grey relational degrees on yi(t) is larger.

3. Results

3.1. Total Change of River Systems
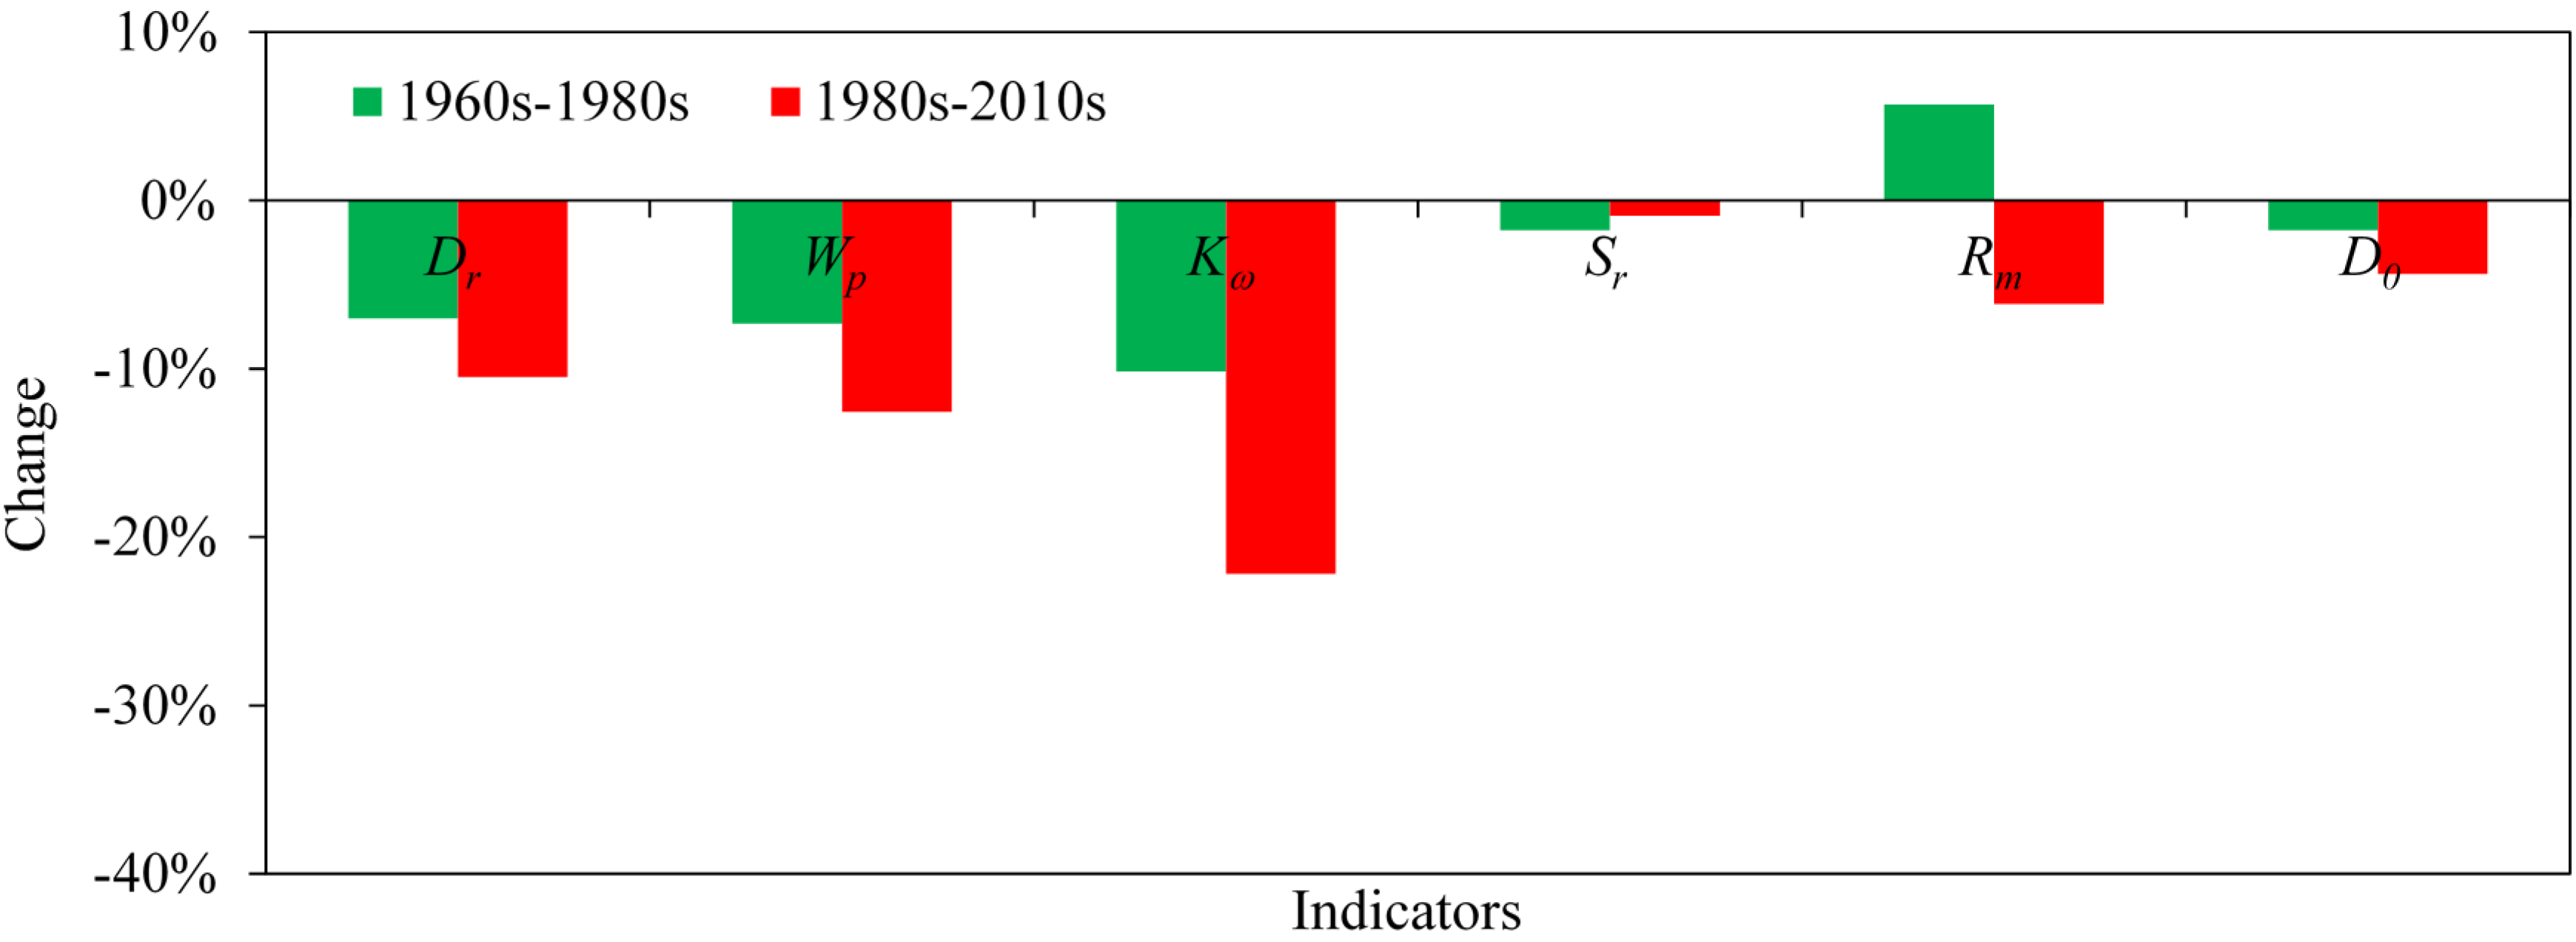
As shown in Table 2, river systems of the Taihu Region were changed visibly during the 1960s to 2010s. Dr and Wp showed a declining trend due to the decrease of rivers and the shrinking of lakes. The total length of rivers gradually decreased from 60,366.81 to 50,245.15 km, and the total area of lakes also decreased from 869.71 to 610.21 km2 during the 1960s to 2010s. Even so, now, the Taihu Region is still a quintessential plain river network region, because of the over 3 km/km2 Dr and nearly 10% Wp. Similarly, Kω and Sr also tended to reduce over the past 50 years. An important reason for this change was the incredible decrease of the natural winding tributaries of the low stream order. The total length of tributaries reduced 11,281.91 km during the 1960s to 2010s. However, a visible difference is detected in the changes in Rm and D0. Rm first increased and then decreased, but it decreased from a general view. The main reason was that the increase of the total length of the main rivers in the second stage was eight-times the first stage, i.e., the total length increased 128.73 km during the 1960s to 1980s, but it increased 1031.53 km during the 1980s to 2010s. However, the increase of the total area of the main rivers in the second stage was only nearly double the first stage. The change of D0 continued to decline due to the same reason for Dr. The Taihu Region is a plain river network region; thus, its D0 should be between 1.89 and 2.00, according to the aforementioned study [43]. However, the actual D0’s in three periods were all less than 1.89, which illustrated that the complexity of the river network was reduced and that the natural development of the river systems was intensely interfered by human beings.
Table 2. Changes of river indicators in the Taihu Region during the 1960s to 2010s.
YearsDr (km/km2)Wp (%)KωSrRm (km2/km)D0
1960s3.6912.003.481.1243.911.70
1980s3.4311.123.131.1046.411.67
2010s3.079.722.441.0943.561.59
Overall, due to the decrease of the natural winding tributaries and the shrinking of lakes, as well as the increase of the straighter main rivers, the number of river systems decreased drastically, the morphology of river channels changed into wider and straighter and the structure of the river network tended to simplify in the Taihu Region in the recent 50 years.

3.2. Temporal Change of River Systems

Population urbanization level (the non-agriculture population percentage of the total population in the whole region) was invariably used to describe the urbanization process [49]. Based on the demarcation points of 30% and 70%, the urbanization process was usually divided into the initial stage, the acceleration stage and the terminal stage [50,51]. The population urbanization level of the Taihu Region was calculated as 29.22% and 40.18%, respectively, according to the statistical population data of the study area in the 1980s and 2010s. Therefore, in order to better analyze the changes of river systems in different urbanization periods, the total urbanization process of the Taihu Region was divided into two periods, 1960s–1980s and 1980s–2010s. The first one was regarded as the slow urbanization period, while the second one was a rapid urbanization period.
The direction and magnitude of the change in each river indicator in different periods are not exactly the same (Figure 2). Among them, Dr, Wp, Kω and D0 all show a decreasing trend, but the magnitudes of the changes in four indicators during the rapid urbanization period are about twice those in the slow urbanization period. This demonstrates that the decrement of Dr, Wp, Kω and D0 is quickened in the rapid urbanization period. Unlike the changes in the four indicators above, although the change in Sr has been decreasing in the recent 50 years, the decrement of Sr in the slow urbanization period is higher than the rapid urbanization period. Rm increased in the slow urbanization period. However, it decreased in the rapid urbanization period and shows an overall decreasing trend in the recent 50 years.
In conclusion, the changes in Dr, Wp, Kω, Rm and D0 in the rapid urbanization period were much greater than those in the slow urbanization period, but the decrease in Sr in the slow urbanization period was more intense than that in the rapid urbanization period.
Figure 2. The direction and magnitude of river system changes in the Taihu Region in different periods.
Water 07 01340 g002

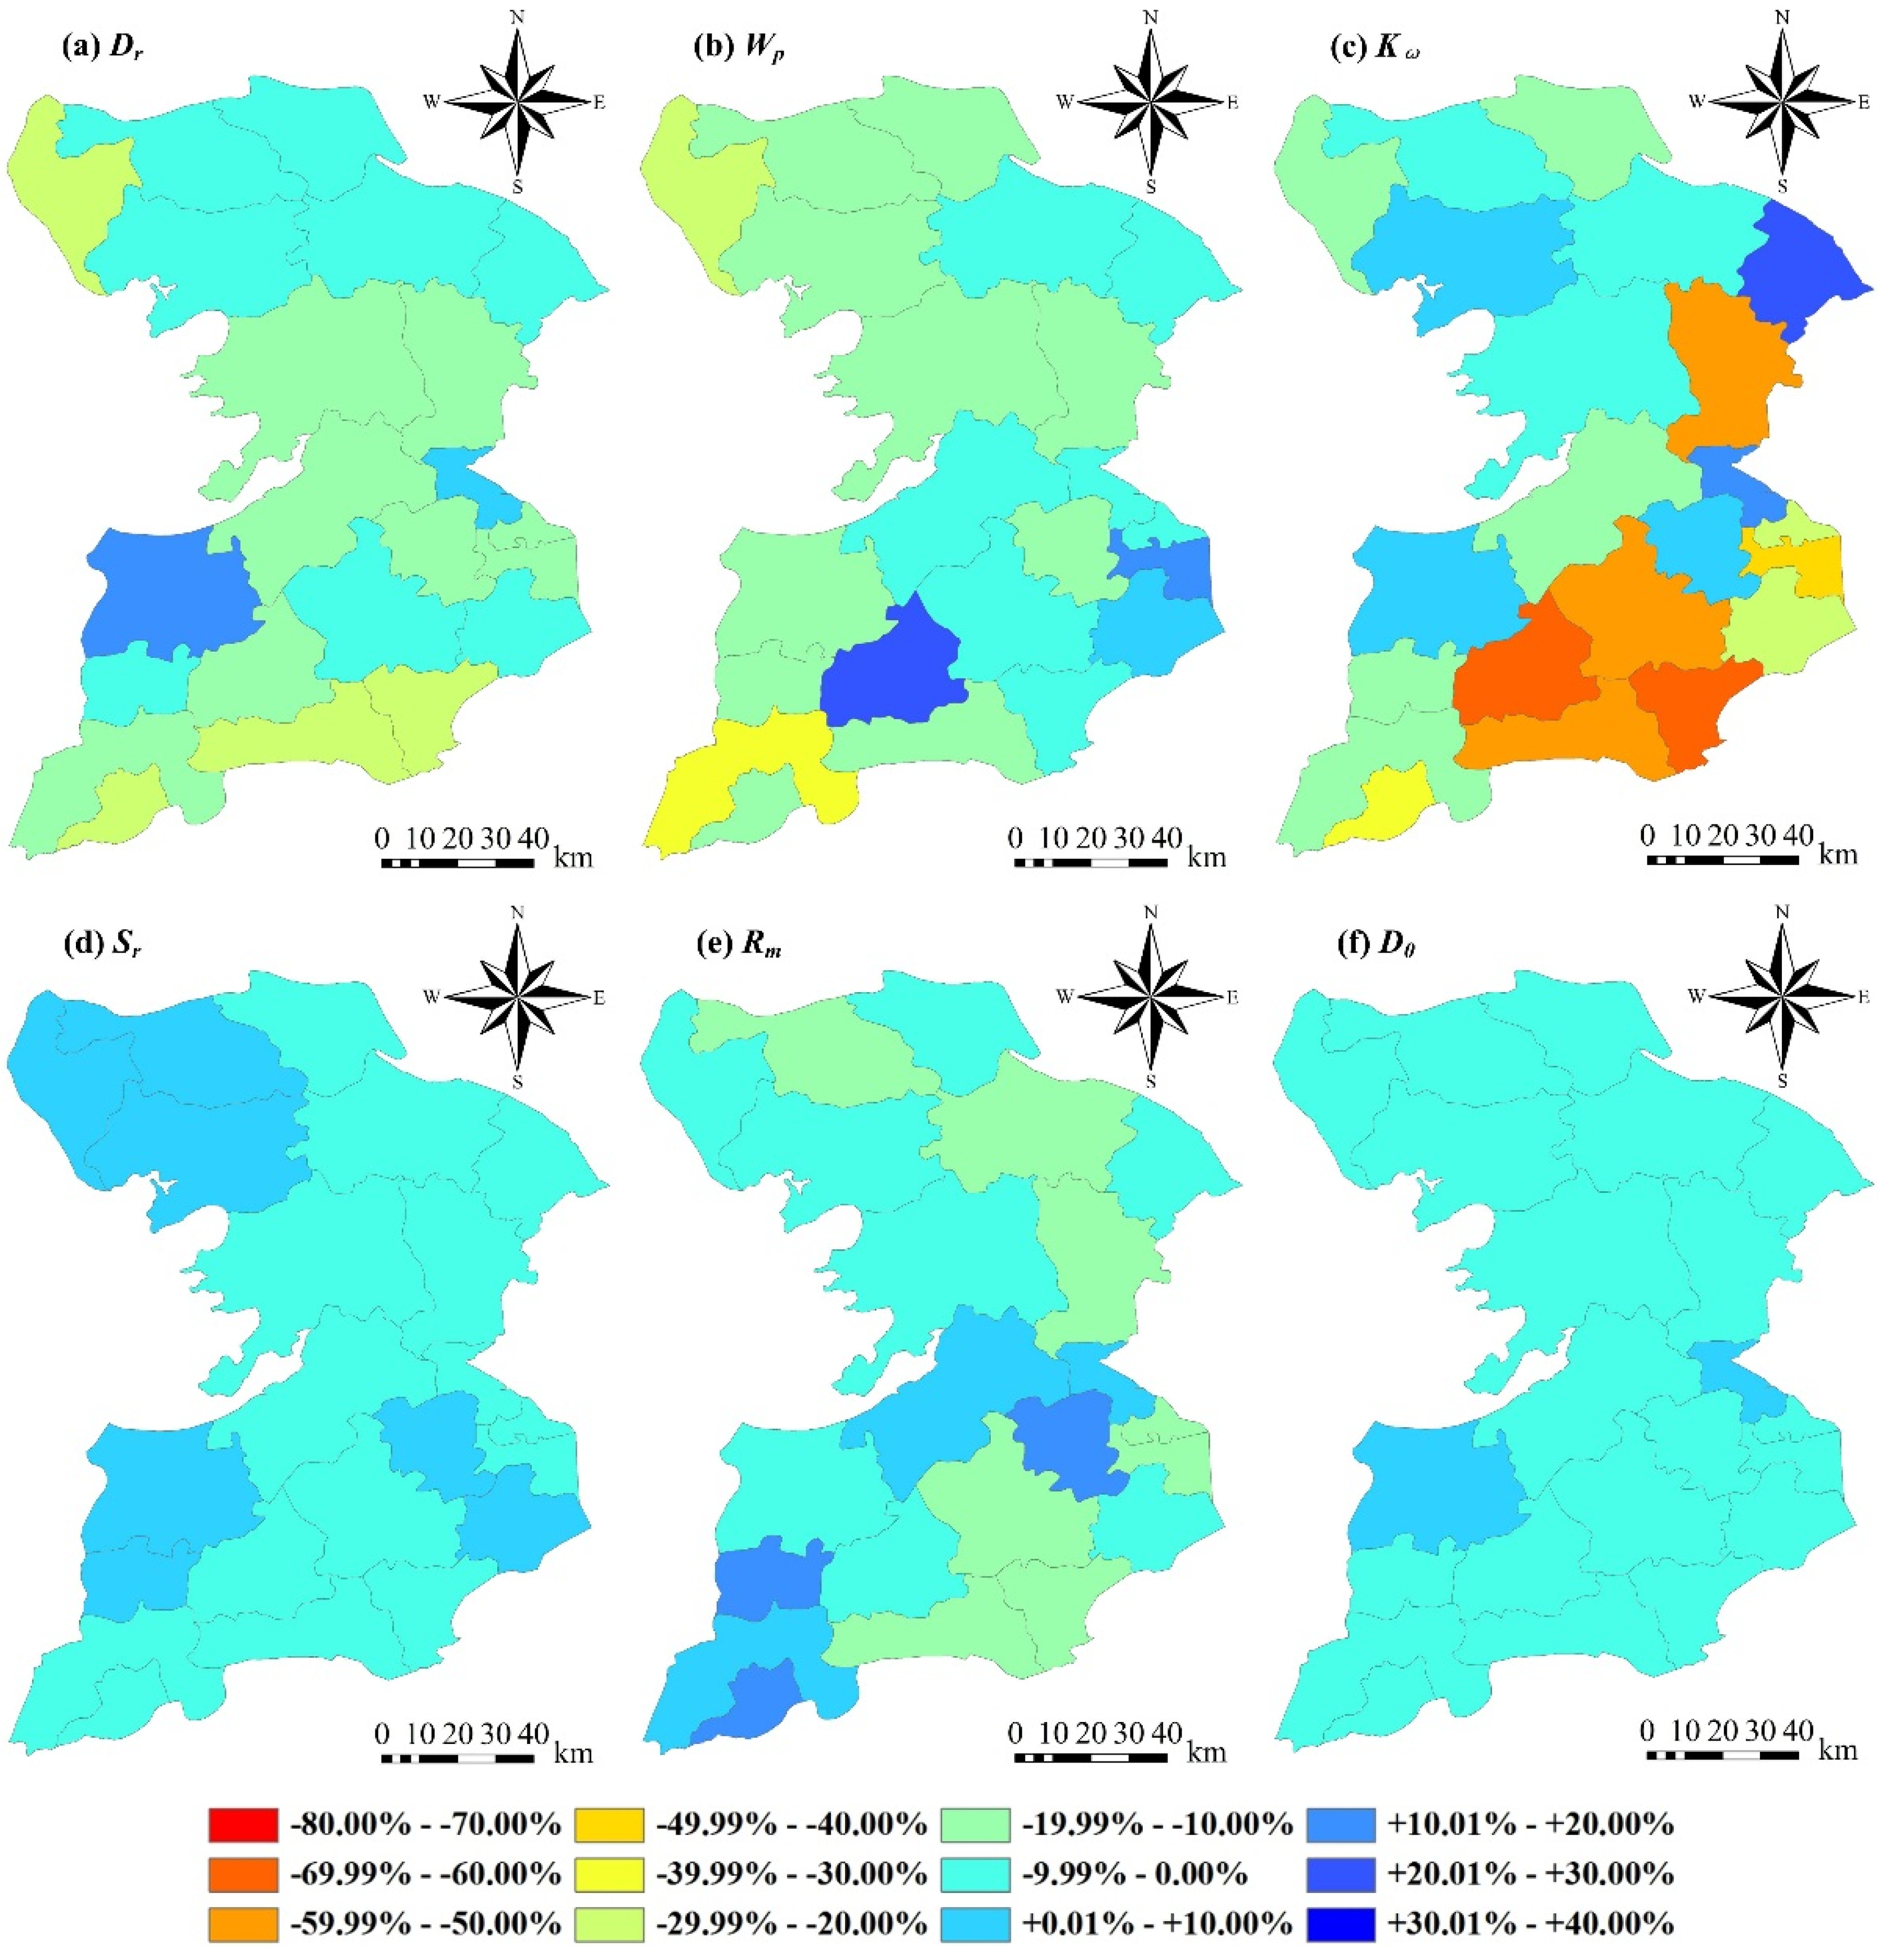
3.3. Spatial Change of River Systems

According to the aforementioned classification method of the urbanization process and the relevant population statistical data of the Taihu Region in the 1980s and 2010s, 22 cities (including the urban center and the urban fringe area in the administrative region of every city) were divided into three categories, respectively. As shown in Figure 3a, Hangzhou is considered the high-urbanized region due to the Up being greater than 70% in the 1980s. Meanwhile, many medium cities, including Suzhou, Wuxi and Changzhou, are viewed as medium-urbanized regions, because the Up is between 30% and 70%. Moreover, other small cities are viewed as low-urbanized regions, because the Up is below 30%, such as Haining and Haiyan. As shown in Figure 3b, Hangzhou is still the high-urbanized region, and Suzhou, Wuxi and Changzhou are also medium-urbanized regions. However, the urbanization levels of 10 small cities increased rapidly, so that they were divided into medium-urbanized regions in the 2010s, such as Huzhou, Songjiang, Zhangjiagang, Changshu and Kunshan.
The changes in river indicators during the 1960s to 1980s have visible differences in different regions (Figure 4). The changes in Dr in the low-urbanized regions are larger than those in the medium-urbanized regions, but they are much larger than those in the high-urbanized region, such as the decrement in Dr being 30.24% and 29.23%, respectively, in Haiyan and Haining, but 5.47% in Hangzhou. Similarly, the changes in Kω, Sr, Rm and D0 in the low-urbanized regions are all the largest, but the changes in the high-urbanized regions are much larger than those in the medium-urbanized regions. As an example, the changes in Kω are about 10.00% in Suzhou, Wuxi and Changzhou, but the decrements in Kω in Haiyan and Haining are all over 30.00%. However, the changes in Wp in the high-urbanized regions are larger than those in the low-urbanized regions, but they are much larger than the medium-urbanized regions, such as the decrement in Wp being about 5.00% in Suzhou, Wuxi and Changzhou, but Hangzhou increases 17.52%. Compared with other river indicators, the changes in Sr and D0 are relatively small, and the maximum decrement is only about 10.00%.
Figure 3. Different urbanization levels of 22 cities of the Taihu Region in the 1980s and 2010s.
Water 07 01340 g003
Figure 4. Spatial difference of river system changes in the Taihu Region during the 1960s to 1980s.
Water 07 01340 g004
As shown in Figure 5, the changes in the river indicators during the 1980s to 2010s also have visible differences in different regions. However, the change in the same indicator in the rapid urbanization period is clearly different from that in the slow urbanization period. The changes in Dr, Rm and D0 in the high-urbanized region are all the largest, and the changes of the three indicators in the medium-urbanized regions are much larger than the low-urbanized regions. For instance, the decrement in Dr is 20.28% in Hangzhou, but the change in Deqing is almost zero. Meanwhile, the increase in Rm is 15.23% in Hangzhou, but the decrement is only 1.04% in Pinghu. Despite the changes in D0 being unequal in different regions, the maximum decrement is less than 10.00%. The changes in Wp in the rapid urbanization period are quite different from than those in the slow urbanization period. Those in the medium-urbanized regions are larger than the high-urbanized region, but those in the low-urbanized regions are the smallest, such as the decrement in Wp being 31.23% in Yuhang, but only 2.07% in Haiyan. On the contrary, the changes in Kω are almost entirely the same in the two periods. As an example, the decrements in Kω in Haiyan and Tongxiang are both over 60.00%, but 0.55% in Suzhou. Moreover, the difference of the changes in Sr is extremely small, and it is less than 5.00% in general.
Figure 5. Spatial difference of river systems changes in the Taihu Region during the 1980s to 2010s.
Water 07 01340 g005
In conclusion, there were wide spatial differences in river system changes in the Taihu Region over the past 50 years. Compared with other river indicators, the spatial differences of the changes in Sr and D0 are relatively small. However, the spatial differences of the changes in Kω were the largest. Meanwhile, the changes in river indicators in the low-urbanized regions were the most intense as a whole.

3.4. Impacts of Urbanization on River Systems

The aforementioned analysis demonstrated that the changes in river indicators were distinguishing in temporal and spatial scales. In order to further analyze the impacts of urbanization on river systems in different periods and regions, the changes in six river indicators of river systems in 22 cities of the Taihu Region were set as the reference sequence, and three urbanization indicators were set as the comparability sequence. According to the basic steps of GRA, the grey relational degrees can be calculated and sorted, as displayed in Table 3.
Table 3. The grey relational degrees between the changes in river indicators and urbanization indicators.
1960s–1980sDrWpKωSrRmD0Average
Up0.61380.75340.69230.72900.74930.69450.7054
Ue0.60760.69620.66990.75210.76470.60050.6818
Us0.60850.76050.76150.66090.71330.59640.6835
Average0.61000.73670.70790.71400.74240.6305--
1980s–2010sDrWpKωSrRmD0Average
Up0.67930.69000.63490.67360.67530.70110.6757
Ue0.68300.69940.63230.67010.63580.67280.6656
Us0.64940.70520.62640.71130.61080.70640.6683
Average0.67060.69820.63120.68500.64060.6934--
As shown in Table 3, the changes in river indicators and urbanization indicators are highly correlated with each other. Meanwhile, all of the grey relational degrees are greater than the distinguishing coefficient of GRA (ρ = 0.5). This indicates that the urbanization indicators are significantly positively correlated with the changes in river indicators. However, different urbanization indicators have different correlations with the changes in river indicators in different urbanization periods. Only Us has the maximum correlation with the change in Wp in two urbanization periods, and the order of the grey relational degrees of three urbanization indicators is as before. This indicates that the expansion of the urban land shows the most significant correlation with the decrease of Wp in the Taihu Region.
During the slow urbanization period, the average grey relational degrees of the changes in river indicators can be sorted in descending order as Rm > Wp > Sr > Kω > D0 > Dr, and the average grey relational degrees of urbanization indicators can be sorted in descending order as Up > Us > Ue. Similarly, during the rapid urbanization period, the descending order of the average grey relational degrees of the changes in river indicators is as follows: Wp > D0 > Sr > Dr > Rm > Kω; while the average grey relational degrees of urbanization indicators can be sorted in descending order as Up > Us > Ue. This indicates that the urbanization indicators are significantly correlated with the changes in Rm in the slow urbanization period, and they are significantly correlated with the changes in Wp in the rapid urbanization period; however, Up always shows the most significant correlation with the changes of river systems in the two periods.
Overall, the changes in river systems were closely correlated with urbanization; however, the changes in Wp had the closest correlation with urbanization, and the relational degrees between Up and the changes in the river systems were the largest in the Taihu Region.

4 Discussions

4.1. River Systems Changes

The aforementioned analysis presented that changes in the quantitative, morphological and structural features of river systems were detected in the Taihu Region over the past 50 years, and these changes were distinguished in different periods and regions. These results are almost consistent with the results of similar plain river network regions, such as Shanghai, Ningbo and Shenzhen [16,52,53], which indicates that the results in this study are reliable.
Overall, river systems in the Taihu Region tended to decrease, and these changes were much greater in the rapid urbanization period than the slow urbanization period due to the following reasons. On the one hand, in order to improve the capacities of storage and discharge, the main rivers were usually dredged and reconstructed in the Taihu Region during the slow urbanization period. Meanwhile, the tributaries were also straightened, widened and changed into the main rivers [54]. These artificial changes led to the higher rate of decrease of Kω and Sr and the increase of Rm. In addition, for the sake of flood control and irrigation in suburbs and country areas, numerous protective dam, water gates, lakeside embankments and comprehensive farmland improvement facilities were constructed. Unfortunately, many of the low-order tributaries were buried, and the connectivity between the main rivers and the tributaries was cut off and gradually disappeared in this process. For the purpose of gaining more farmland, the fringe areas around the lakes were also reclaimed [55]. Thus, Dr, Wp and D0 were showed a declining trend in the slow urbanization period. On the other hand, since the reform and opening up in 1979, the Taihu Region became one of the main districts of the rapid urbanization process in China, especially in the wide suburbs. In order to develop industry and improve public facilities, a multitude of low-order tributaries and small water bodies were occupied by impervious surfaces [4,15]. These changes led to the more intense decrease of Dr, Wp, Kω and D0 in the rapid urbanization period than the slow urbanization period. In addition, the decrease of the tributaries and water bodies and the increase of impervious surfaces also resulted in the increase of flood risk [56]. In order to release flooding, a multitude of low-order tributaries were widened and changed into main rivers. In this context, the total length of the main rivers was rapidly increased, but the increase of the total area was limited due to land requirements, especially in urbanized regions. Therefore, Rm was decreased intensely in the rapid urbanization period. In contrast, the decrease of Sr in the slow urbanization period was more intense, which might be related to a host of winding rivers that had been straightened during the extensive water conservancy constructions [21,39].
In addition, there are several possible reasons for the spatial differences of river systems changes. Firstly, the administrator in different regions changed the river systems for different purposes. As an example, the low-urbanized regions, generally dominated by agriculture, resulted in the needs of irrigation and flood control. Headwater streams were buried to increase the amount of arable land available in these areas [57,58]. However, the high-urbanized region was mainly metropolitan area, and their river systems were changed to meet the needs of urban development. Secondly, the original values of river indicators were different in different regions. As an example, Dr in Haiyan in the 1960s was 5.31 km/km2, but it was 1.75 km/km2 in Hangzhou. Therefore, it was feasible that Dr in Haiyan decreased to 1.75 km/km2 (the real Dr in the 2010s was 2.85 km/km2), but it was forbidden that Dr in Hangzhou decrease to zero (the real Dr in 2010s is 1.32 km/km2). Last but not the least, there were wide spatial differences in the distribution of the tributaries. Generally speaking, the total length of tributaries in the high-urbanized region was overwhelmingly limited due to the continuous urban development for several hundreds or thousands of years, but it was larger in the low-urbanized regions due to relatively little interference by human beings. For example, the total length of tributaries in Haiyan in the 1960s was 2324.75 km, but in Hangzhou only 395.12 km.

4.2. Urbanization Impacts

Most of the research has indicated that river systems are changed by various urbanization factors [9,14]. However, few researchers have paid attention to the distinction of the impacts of different urbanization factors on river systems. Based on the results of GRA, we believe that the changes in river systems and urbanization are closely correlated with each other in the Taihu Region, but the relational degrees between different river and urbanization indicators are distinguished in different urbanization periods.
From 1950 to 2014, the population residing in urban areas in the world increased form 30% to 54% [49]. Population growth in urban areas brought about the development of real estate, business, industry and transportation and resulted in the changes of land use ultimately [44]. In this process, a multitude of low-order tributaries and small water bodies were occupied and buried, weakening the storage capacities and discharge of river systems [4,15]. Wide construction of buildings, roads and bridges all over the cities led to the geometric increase of impervious surfaces [9,14,56]. The rapid expansion of impervious surfaces reduced the infiltration rate and roughness condition, but increased the flood risk [7]. One possible solution to lower the flood risk is to improve the catchment storage and drainage capacities by straightening and merging the winding streams, dredging and channelizing the main rivers, etc. [2,14,54]. Meanwhile, floodwalls, dams and gates were constructed in urban areas, and protective lakeside embankments were strengthened and extended in suburban areas for better control of flooding. These artificial hydraulic constructions cut off the natural connectivity between rivers and lakes and formed independent small rivers and lakes, which were buried and disappeared ultimately [31,32]. Therefore, it can be seen that population urbanization might be the primary influence factor of river system changes, and Wp might be the most sensitive factor to the effects of urbanization.

5 Conclusions

In this paper, the temporal and spatial change of river systems geomorphology in the Taihu Region over the past 50 years was analyzed in conjunction with urbanization. Through comprehensive analysis, the following conclusions have been gained:
(1)
The number of river systems decreased drastically, the morphology of river channels changed into wider and straighter and the structure of the river network tended to simplify in the Taihu Region in the recent 50 years; due to the decrease of the natural winding tributaries and the shrinking of lakes, as well as the increase of the straighter main rivers.
(2)
Under the influence of drastic land use change and increasing flood risk, the changes in Dr, Wp, Kω, Rm and D0 in the rapid urbanization period were much greater than those in the slow urbanization period. However, the decrease of Sr in the slow urbanization period was more intense, which might be related to a host of winding rivers having been straightened during the extensive water conservancy constructions.
(3)
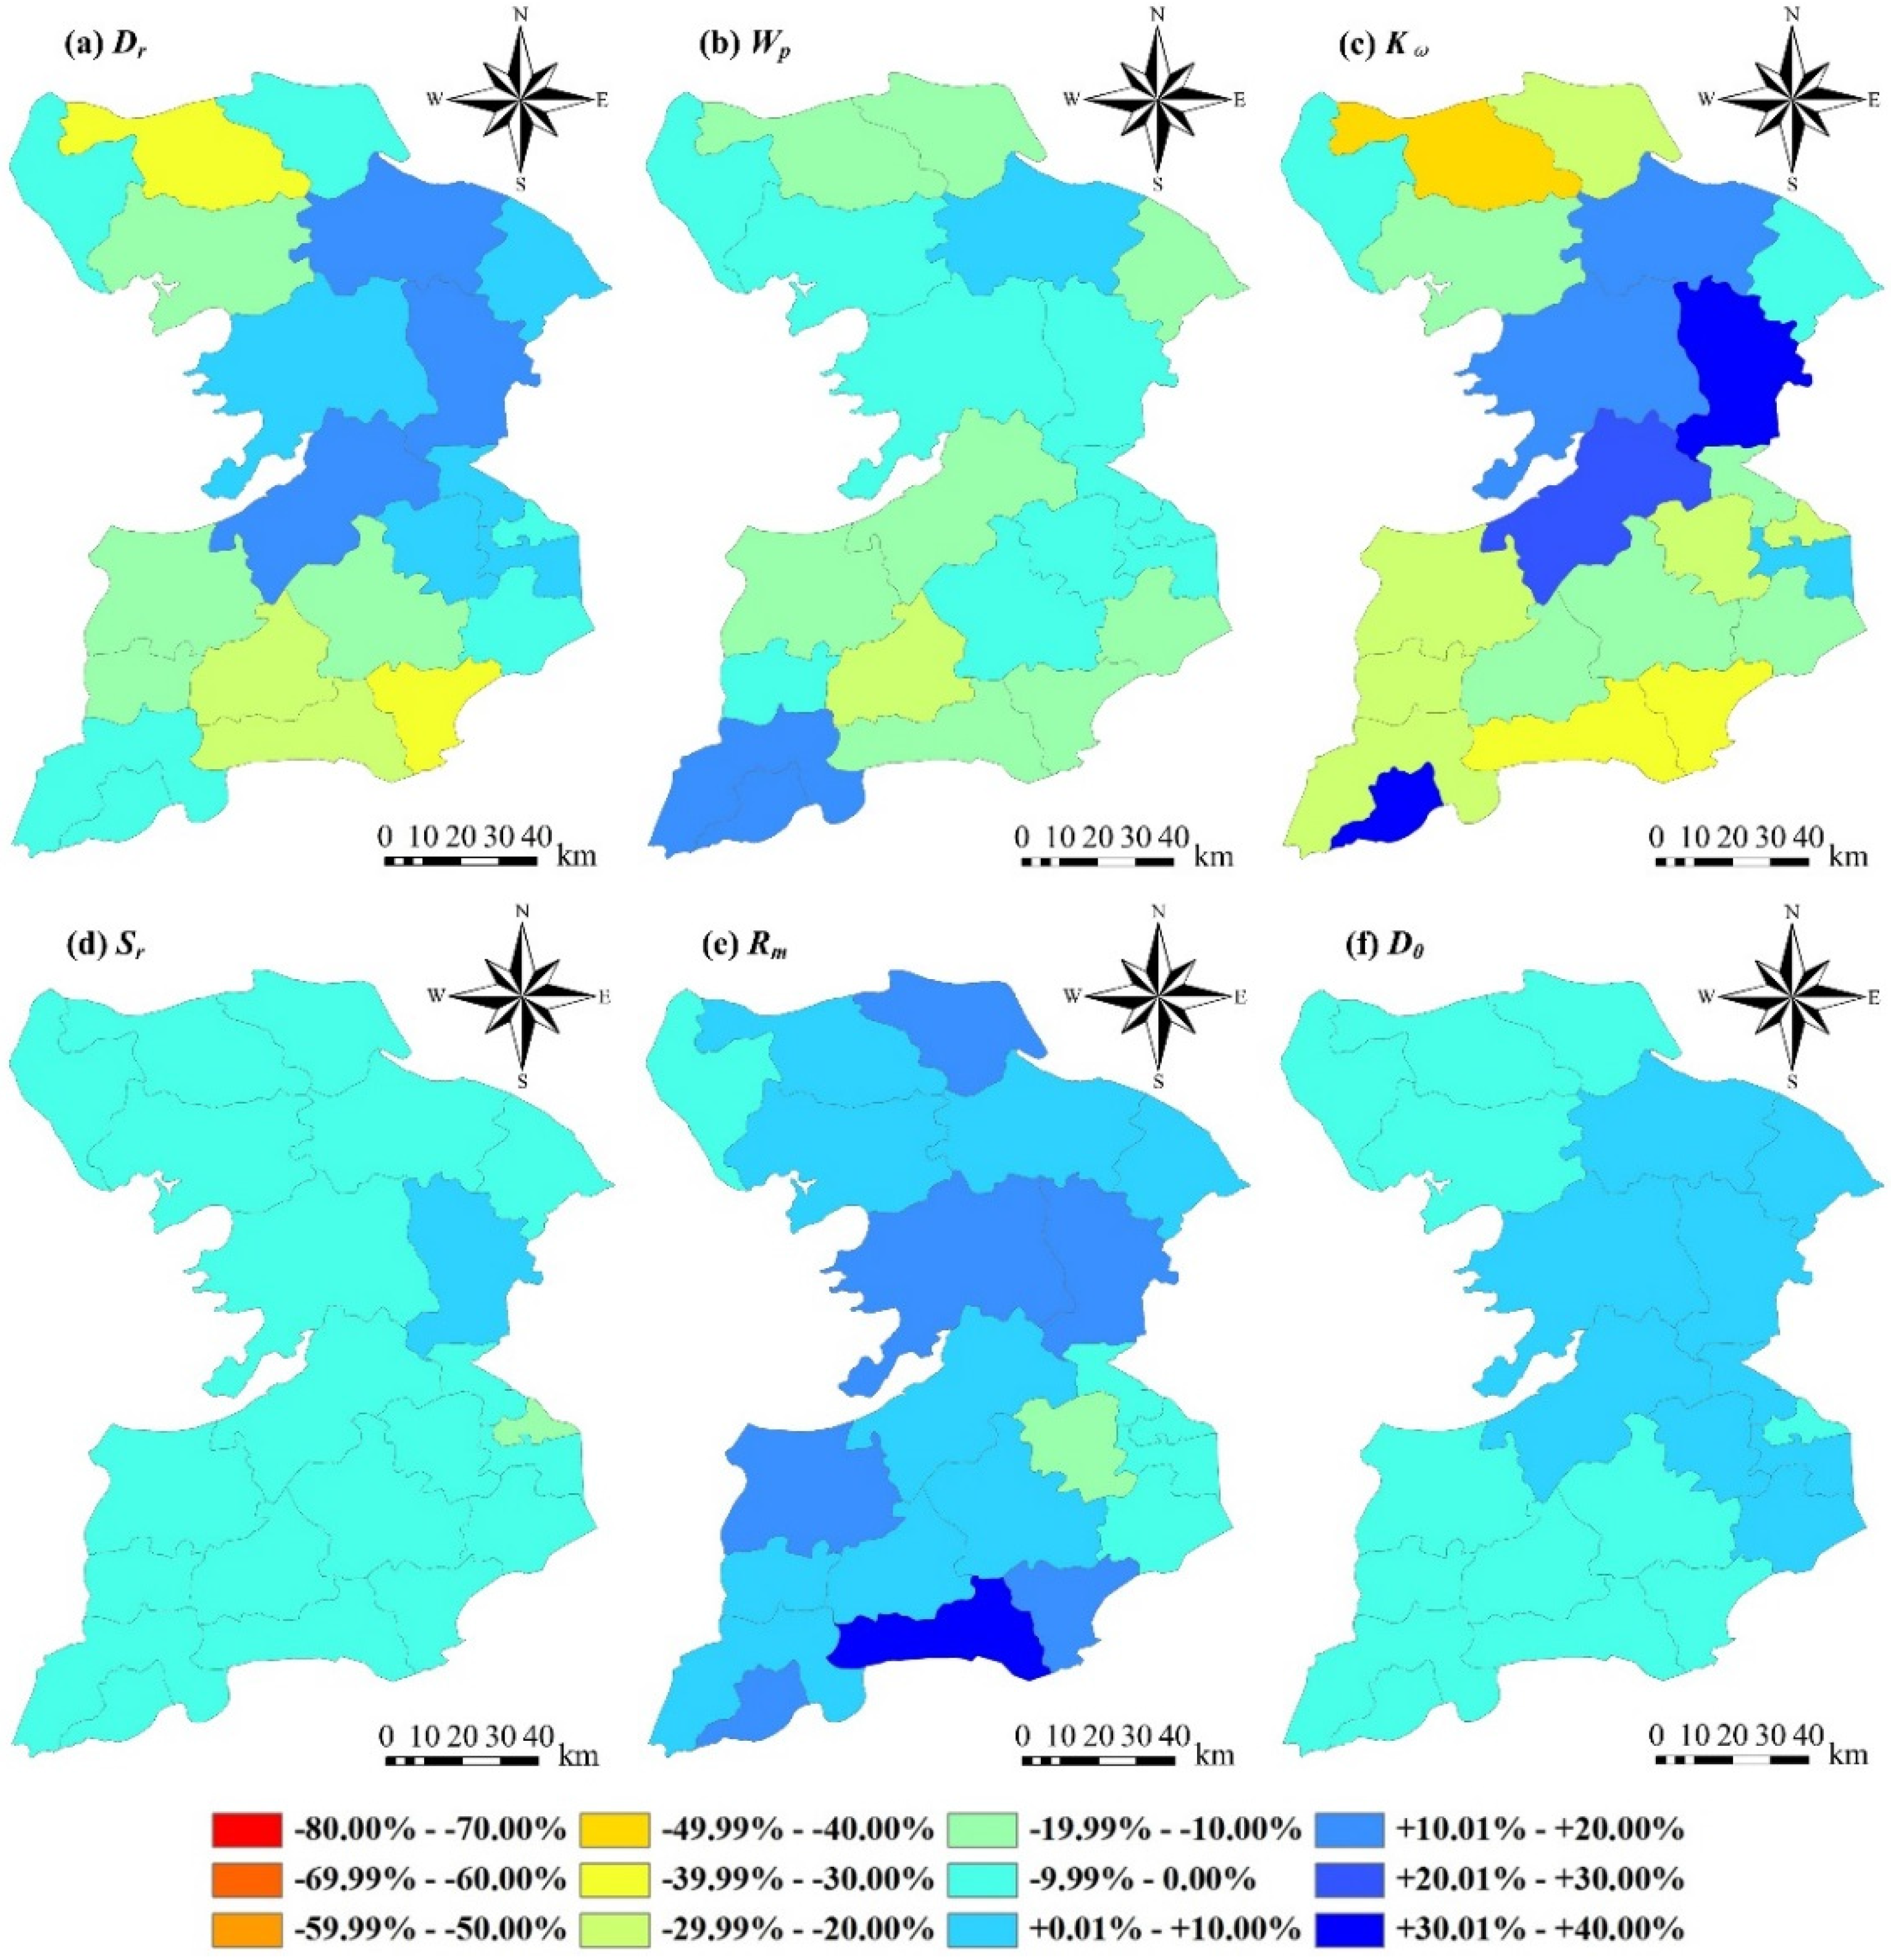
There were wide spatial differences in river system changes in the Taihu Region over the past 50 years. In contrast, the spatial differences of the changes in Sr and D0 are small, but the spatial differences of the changes in Kω were the largest. Furthermore, the changes in river indicators in the low-urbanized regions were the most intense.
(4)
The changes in river systems were closely correlated with urbanization; however, the changes in Wp had the closest correlation with urbanization, and the relational degrees between Up and the changes in river systems were the largest in the Taihu Region.
In conclusion, it is discernible that the changes of river systems are influenced primarily by urbanization in the short term. Nevertheless, the respective contributions of population urbanization, economic urbanization and spatial urbanization to river system change in the Taihu Region should be further quantified. Moreover, further studies using more river and urbanization indicators from other regions are required to strengthen the conclusions concerning the impacts of urbanization on river systems. In addition, more studies should be conducted on the impacts of river system changes and urbanization on the change of hydrologic connectivity and water level in the Taihu Region, mainly for providing a better scientific basis and decision-making reference for the planning, management and conservation of river systems in the Taihu Region.

Acknowledgments

This work was supported by the National Natural Science Foundation of China under Grants 41371046 and 41371044, the Commonweal and Specialized Program for Scientific Research, Ministry of Water Resources of China, under Grants 201201072 and 201301075 and the Natural Science Foundation of Jiangsu Province under Grant BK20131276.

Author Contribution

Youpeng Xu conceived the manuscript; Xiaojun Deng performed data analysis and wrote the manuscript; Longfei Han and Song Song contributed to revise and proofreading; Liu Yang, Guang Li and Yuefeng Wang collected and processed data.

Conflicts of Interest

The authors declare no conflict of interest.

References

  1. Nilsson, C.; Reidy, C.A.; Dynesius, M.; Revenga, C. Fragmentation and flow regulation of the world’s large river systems. Science 2005, 308, 405–408. [Google Scholar] [CrossRef] [PubMed]
  2. Sear, D.A.; Newson, M.D. Environmental change in river channels: A neglected element. Towards geomorphological typologies, standards and monitoring. Sci. Total Environ. 2003, 310, 17–23. [Google Scholar] [CrossRef] [PubMed]
  3. Karr, J.R. Defining and measuring river health. Freshw. Biol. 1999, 41, 221–234. [Google Scholar] [CrossRef]
  4. Steele, M.K.; Heffernan, J.B. Morphological characteristics of urban water bodies: Mechanisms of change and implications for ecosystem function. Ecol. Appl. 2014, 24, 1070–1084. [Google Scholar] [CrossRef] [PubMed]
  5. Pinto, U.; Maheshwari, B.L. River health assessment in peri-urban landscapes: An application of multivariate analysis to identify the key variables. Water Res. 2011, 45, 3915–3924. [Google Scholar] [CrossRef] [PubMed]
  6. Walsh, C.J.; Roy, A.H.; Feminella, J.W.; Cottingham, P.D.; Groffman, P.M.; Morgan, R.P. The urban stream syndrome: Current knowledge and the search for a cure. J. N. Am. Benthol. Soc. 2005, 24, 706–723. [Google Scholar] [CrossRef]
  7. Xu, Y.P.; Xu, J.T.; Ding, J.J.; Chen, Y.; Yin, Y.X.; Zhang, X.Q. Impacts of urbanization on hydrology in the Yangtze River Delta, China. Water Sci. Technol. 2010, 62, 1221–1229. [Google Scholar] [CrossRef] [PubMed]
  8. Lane, E.W. The importance of fluvial morphology in hydraulic engineering. Proc. Am. Soc. Civ. Eng. 1955, 81, 1–17. [Google Scholar]
  9. Chin, A. Urban transformation of river landscapes in a global context. Geomorphology 2006, 79, 460–487. [Google Scholar] [CrossRef]
  10. Hooke, J.M. Human impacts on fluvial systems in the Mediterranean region. Geomorphology 2006, 79, 311–335. [Google Scholar] [CrossRef]
  11. Wang, C.P.; Wang, D.Y.; Wang, H.W.; Dong, R.C. Impacts of urbanisation on river systems and their functions in Yanggong River watershed of Lijiang City. Int. J. Sust. Dev. World 2011, 18, 498–502. [Google Scholar] [CrossRef]
  12. Junior, O.C.; Guimaraes, R.; Freitas, L.; Gomes-Loebmann, D.; Gomes, R.A.; Martins, E.; Montgomery, D.R. Urbanization impacts upon catchment hydrology and gully development using mutli-temporal digital elevation data analysis. Earth Surf. Proc. Land. 2010, 35, 611–617. [Google Scholar]
  13. Vanacker, V.; Molina, A.; Govers, G.; Poesen, J.; Dercon, G.; Deckers, S. River channel response to short-term human-induced change in landscape connectivity in Andean ecosystems. Geomorphology 2005, 72, 340–353. [Google Scholar] [CrossRef]
  14. Gregory, K.J. The human role in changing river channels. Geomorphology 2006, 79, 172–191. [Google Scholar] [CrossRef]
  15. Elmore, A.J.; Kaushal, S.S. Disappearing headwaters: Patterns of stream burial due to urbanization. Front. Ecol. Environ. 2008, 6, 308–312. [Google Scholar] [CrossRef]
  16. Yuan, W.; Philip, J.; Yang, K. Impact of urbanization on structure and function of river system. Chin. Geogr. Sci. 2006, 16, 102–108. [Google Scholar] [CrossRef]
  17. Duan, H.; Ma, R.H.; Xu, X.F.; Kong, F.K.; Zhang, S.X.; Kong, W.J.; Hao, J.Y.; Shang, L.L. Two-decade reconstruction of algal blooms in China’s Lake Taihu. Environ. Sci. Technol. 2009, 43, 3522–3528. [Google Scholar] [CrossRef] [PubMed]
  18. Guan, B.; An, S.; Gu, B. Assessment of ecosystem health during the past 40 years for Lake Taihu in the Yangtze River Delta, China. Limnology 2011, 12, 47–53. [Google Scholar] [CrossRef]
  19. Wang, L.; Cai, Y.L.; Chen, H.Q.; Daler, D.; Zhao, J.M.; Yang, J. Flood disaster in Taihu Basin, China: Causal chain and policy option analyses. Environ. Earth Sci. 2011, 63, 1119–1124. [Google Scholar] [CrossRef]
  20. Yang, K.; Yuan, W.; Zhao, J.; Xu, S.Y. Stream structure characteristics and its urbanization responses to tidal river system. Acta Geogr. Sin. 2004, 59, 557–564. (In Chinese) [Google Scholar]
  21. Zhao, J.; Shan, F.Z.; Yang, K.; Wu, E.N. River sinuosity in tidal plain and its response to rapid urbanization. Adv. Water Sci. 2011, 22, 632–637. (In Chinese) [Google Scholar]
  22. Wang, J.; Chen, X.; Zhu, X.H.; Liu, J.L.; Chang, W.Y.B. Taihu Lake, lower Yangtze drainage basin: Evolution, sedimentation rate and the sea level. Geomorphology 2001, 41, 183–193. [Google Scholar] [CrossRef]
  23. Chen, Z.; Wang, Z.H. Yangtze Delta, China: Taihu lake level variation since 1950s, response to sea-level and human impact. Environ. Geol. 1999, 37, 333–339. [Google Scholar] [CrossRef]
  24. Qin, B.Q.; Xu, P.Z.; Wu, Q.L.; Luo, L.C.; Zhang, Y.L. Environmental issues of lake Taihu, China. Hydrobiologia 2007, 581, 3–14. [Google Scholar] [CrossRef]
  25. Zhao, H.X.; Duan, X.J.; Stewart, B.; You, B.S.; Jiang, X.W. Spatial correlations between urbanization and river water pollution in the heavily polluted area of Taihu Lake Basin, China. J. Geogr. Sci. 2013, 23, 735–752. [Google Scholar] [CrossRef]
  26. Liu, L.; Xu, Z.X.; Reynard, N.S.; Hu, C.W.; Jones, R.G. Hydrological analysis for water level projections in Taihu Lake, China. J. Flood Risk Manag. 2013, 6, 14–22. [Google Scholar] [CrossRef]
  27. Stone, R. China aims to turn tide against toxic lake pollution. Science 2011, 333, 1210–1211. [Google Scholar] [CrossRef] [PubMed]
  28. Strahler, A.N. Hypsometric (area-altitude) analysis of erosional topography. Geol. Soc. Am. Bull. 1952, 63, 1117–1142. [Google Scholar] [CrossRef]
  29. Costanza, R.; d’Arge, R.; de Groot, R.; Farber, S.; Grasso, M.; Hannon, B.; Limburg, K.; Naeem, S.; Oneill, R.V.; Paruelo, J.; et al. The value of the world’s ecosystem services and natural capital. Nature 1997, 387, 253–260. [Google Scholar] [CrossRef]
  30. Leopold, L.B. A View of the River; Harvard University Press: Cambridge, MA, USA, 1994. [Google Scholar]
  31. Freeman, M.C.; Pringle, C.M.; Jackson, C.R. Hydrologic connectivity and the contribution of stream headwaters to ecological integrity at regional scales. J. Am. Water Resour. Assoc. 2007, 43, 5–14. [Google Scholar] [CrossRef]
  32. Nadeau, T.L.; Rains, M.C. Hydrological connectivity between headwater streams and downstream waters: How science can inform policy. J. Am. Water Resour. Assoc. 2007, 43, 118–133. [Google Scholar] [CrossRef]
  33. Roy, A.H.; Dybas, A.L.; Fritz, K.M.; Lubbers, H.R. Urbanization affects the extent and hydrologic permanence of headwater streams in a midwestern US metropolitan area. J. N. Am. Benthol. Soc. 2009, 28, 911–928. [Google Scholar] [CrossRef]
  34. Ward, J.V. Riverine landscapes: Biodiversity patterns, disturbance regimes, and aquatic conservation. Biol. Conserv. 1998, 83, 269–278. [Google Scholar] [CrossRef]
  35. Suren, A.M.; Snelder, T.; Scarsbrook, M. Urban Stream Habitat Assessment Method (USHA); National Institute of Water and Atmospheric Research (NIWA): Christchurch, New Zealand, 1998. [Google Scholar]
  36. Barbour, M.T.; Gerritsen, J.; Snyder, B.D.; Stribling, J.B. Rapid Bioassessment Protocols for Use in Streams and Wadeable Rivers; United States Environmental Protection Agency (USEPA): Washington, DC, USA, 1999.
  37. Ladson, A.R.; White, L.J.; Doolan, J.A.; Finlayson, B.L.; Hart, B.T.; Lake, P.S.; Tilleard, J.W. Development and testing of an Index of Stream Condition for waterway management in Australia. Freshw. Biol. 1999, 41, 453–468. [Google Scholar] [CrossRef]
  38. Booth, D.B.; Karr, J.R.; Schauman, S.; Konrad, C.P.; Morley, S.A.; Larson, M.G.; Burges, S.J. Reviving urban streams: Land use, hydrology, biology, and human behavior. J. Am. Water Resour. Assoc. 2004, 40, 1351–1364. [Google Scholar] [CrossRef]
  39. Aswathy, M.V.; Vijith, H.; Satheesh, R. Factors influencing the sinuosity of Pannagon River, Kottayam, Kerala, India: An assessment using remote sensing and GIS. Environ. Monit. Assess. 2008, 138, 173–180. [Google Scholar] [CrossRef] [PubMed]
  40. Mandelbrot, B.B. The Fractal Geometry of Nature; W.H. Freeman: New York, NY, USA, 1982. [Google Scholar]
  41. Dubuc, B.; Quiniou, J.F.; Roques-Carmes, C.; Tricot, C.; Zucker, S.W. Evaluating the fractal dimension of profiles. Phys. Rev. A 1989, 39, 1500–1512. [Google Scholar] [CrossRef] [PubMed]
  42. La Barbera, P.; Rosso, R. On the fractal dimension of stream networks. Water Resour. Res. 1989, 25, 735–741. [Google Scholar] [CrossRef]
  43. He, L.H.; Zhao, H. The fractal dimension of river network and its interpretation. Sci. Geogr. Sin. 1996, 16, 124–128. (In Chinese) [Google Scholar]
  44. Antrop, M. Landscape change and the urbanization process in Europe. Land Urban Plan. 2004, 67, 9–26. [Google Scholar] [CrossRef]
  45. Ministry of Housing and Urban-Rural Development of the People’s Republic of China (MOHURD). Code for Classification of Urban Land Use and Planning Standards of Development Land (GB 50137–2011); China Building Industry Press: Beijing, China, 2011.
  46. Liu, S.; Dang, Y.; Fang, Z. Grey System Theory and Its Application; Science Press: Beijing, China, 2004. [Google Scholar]
  47. Wong, H.; Hu, B.Q.; Ip, W.C.; Xia, J. Change-point analysis of hydrological time series using grey relational method. J. Hydrol. 2006, 324, 323–338. [Google Scholar] [CrossRef]
  48. Li, X.; Li, G.M.; Zhang, Y. Identifying Major Factors Affecting Groundwater Change in the North China Plain with Grey Relational Analysis. Water 2014, 6, 1581–1600. [Google Scholar] [CrossRef]
  49. United Nations. Department of Economic and Social Affairs. In World Urbanization Prospects: The 2014 Revision; United Nations: New York, NY, USA, 2014. [Google Scholar]
  50. Northam, R.M. Urban Geography, 2rd ed.; John Wiley: New York, NY, USA, 1979. [Google Scholar]
  51. Karmeshu. Demographic models of urbanization. Environ. Plan. B 1988, 15, 47–54. [Google Scholar]
  52. Chen, Y.X.; Xu, Y.P.; Fu, W.J. Influences of urbanization on river network in the coastal areas of East Zhejiang province. Adv. Water Sci. 2007, 18, 68–73. (In Chinese) [Google Scholar]
  53. Huang, Y.L.; Wang, Y.L.; Liu, Z.H.; Zeng, X.K.; Chen, L. Stream construction characteristics in rapid urbanization area: Shenzhen city as a case. Geogr. Res. 2008, 27, 1212–1220. (In Chinese) [Google Scholar]
  54. Xu, G.L.; Xu, Y.P.; Wang, L.Y. Temporal and spatial changes of river systems in Hangzhou-Jiaxing-Huzhou Plain during 1960s-2000s. Acta Geogr. Sin. 2013, 68, 966–974. (In Chinese) [Google Scholar]
  55. Xu, Y.P. Impacts of Urbanization of the Yangtze River Delta Region on River System in Basins and Hydrological Processes; Science Press: Beijing, China, 2012. (In Chinese) [Google Scholar]
  56. Ji, X.M.; Xu, Y.P.; Han, L.F.; Yang, L. Impacts of urbanization on river system structure-A case study on Qinhuai River Basin, Yangtze River Delta. Water Sci. Technol. 2014, 70, 671–677. [Google Scholar] [CrossRef] [PubMed]
  57. Sadler, R.J. A Review of the Enclosure of Watercourses in Agricultural Landscapes and River Headwater Functions; Fisheries and Oceans Canada: Sarnia, ON, Canada, 2004. [Google Scholar]
  58. Stammler, K.L.; Yates, A.G.; Bailey, R.C. Buried streams: Uncovering a potential threat to aquatic ecosystems. Landsc. Urban Plan. 2013, 114, 37–41. [Google Scholar] [CrossRef]

