Article

Assessment of Long-Term Evolution of Groundwater Hydrochemical Characteristics Using Multiple Approaches: A Case Study in Cangzhou, Northern China

1
College of Resources and Environment, University of Chinese Academy of Sciences, No. 19A Yuquan Road, Shijingshan District, Beijing 100049, China
2
China Ordnance Industry Survey and Geotechnical Institute, Beijing 100053, China
3
College of Environmental Science and Engineering, Liaoning Technical University, Fuxin 123000, China
*
Author to whom correspondence should be addressed.
Water 2015, 7(3), 1109-1128; https://doi.org/10.3390/w7031109
Submission received: 27 November 2014 / Revised: 9 December 2014 / Accepted: 27 February 2015 / Published: 13 March 2015

Abstract

:
Water shortage is severe in the North China Plain (NCP). In addition to a deficiency of water resources, deterioration of groundwater quality should be of great concern. In this study, hydrogeological analysis was conducted in combination with principal component analysis, correlation analysis and the co-kriging method to identify factors controlling the content of major ions and total dissolved solids (TDS) in areal shallow and deep groundwater and to assess groundwater evolution in Cangzhou, China. The results suggested that groundwater quality degradation occurred and developed in the study area, as indicated by increasing concentrations of major ions, TDS and hardness in both shallow and deep groundwater. In shallow groundwater, whose hydrochemical water types changed from HCO3–Ca.Na.Mg and HCO3.Cl–Na in the west (Zone II) to Cl.SO4–Na and Cl–Na in the east (Zone III). Areas with TDS concentrations between 1500 and 2000 mg/L occupied 79.76% of the total in the 1980s, while areas with a TDS concentration ranging from 2500 to 3000 mg/L comprised 59.11% of the total in the 2010s. In deep groundwater, the area with TDS over 1000 mg/L expanded from 5366.39 km2 in the 1960s to 7183.52 km2 in the 2010s. Natural processes (water-rock interactions) and anthropogenic activities (groundwater exploitation) were the dominant factors controlling the major ions’ content in local groundwater. Dissolution of dolomite, calcite, feldspar and gypsum were the primary sources of major ions in groundwater, and the ion exchange reaction had a strong effect on the cation content, especially for deep groundwater.

Graphical Abstract

1. Introduction

The scarcity of freshwater resources has become an important issue worldwide [1,2,3]. Groundwater is of particular importance for public drinking water supply, especially for the residents of arid and semi-arid regions [1,4,5]. However, rapid urbanization and increasing populations have accelerated the consumption of groundwater resources and caused serious environmental problems in the last few decades [6,7], and numerous studies have shown serve groundwater pollution, as well as adverse effects caused by exploitation, such as land subsidence, water ecosystem degradation, land desertification, drinking water pollution and associated human health risk, etc. [8,9,10]. Groundwater availability and quality has become the source of concern for researchers worldwide. Most studies of these issues focused on the saltwater intrusion [5,11], groundwater salinization [12,13,14,15], arsenic and other heavy metals in groundwater [16,17,18,19], the sustainability of aquifer exploitation [20] and groundwater quality evaluation [21]. The stability and safety of water supply associated with long-term groundwater exploitation are essential to sustainable development. Ravenscroft [4] conducted an investigation of deep groundwater quality in a system subjected to abstraction for more than 20 years in Southern Bangladesh and found no evidence of deteriorating water quality. However, the results of studies of the Ogallala aquifer in Texas [15,22] indicated that remarkable groundwater quality deterioration associated with persistent groundwater exploitation was ongoing since the 1960s. The North China Plain (NCP) is one of global hotspots of groundwater depletion [23,24,25]; in addition of a shortage of groundwater resource, deterioration of groundwater quality should be of great concern, too.
Cangzhou, which is located in the northeastern part of the NCP, is a typical water-starved region with an average of 180 m3/yr of water per capita [26], which is only 2.4% of the global average [27]. Severe water shortages have led to massive exploitation of groundwater to maintain stable development of the local society and economy, which has caused serious environmental problems in local areas. From 1971 to 2002, the largest water table depth in Cangzhou decreased from 22.4 to 108 m [28], and the area of the groundwater depression cone in which the groundwater level was −50 m was about 6528.5 km2 [29], comprising 46.4% of the total area of Cangzhou. Additionally, land subsidence in the central region of Cangzhou reached about 2236 mm by 2001 [29,30]. Although there have been studies of groundwater consumption and sustainability, as well as the adverse geological effects caused by over-exploitation of groundwater in the region, concerns about groundwater quality change in Cangzhou seem to not have attracted enough attention from researchers, and available research results on this subject are rare. Therefore, the present study was conducted to investigate: (1) the spatial-temporal patterns of shallow and deep groundwater quality in Cangzhou; (2) whether the sources of changes in local groundwater quality are natural or anthropogenic; (3) whether there are any discernible relationships between aquifers; and (4) the types of hydrochemical components (major chemical groundwater types) that lead to groundwater salinization in the study area.
To accomplish this, collection and analysis of historical research results and available monitoring data in local areas and groundwater sampling tests were applied to evaluate long-term changes in groundwater quality in Cangzhou. Additionally, GIS (Geographic Information System) in conjunction with statistical and geostatistical methods was used to identify the cause and current status of groundwater quality degradation in Cangzhou.

2. Materials and Methods

2.1. Study Area Description

Cangzhou is in the eastern region of the NCP, about 240 km from Beijing, between 37°29' N to 38°57' N latitude and 115°42' E to 117°50' E longitude (Figure 1). The area of Cangzhou is about 14,056 km2, and it has a population of 7.134 million. The average annual precipitation from 1956 to 2005 was 555.1 mm, ranging from 490 to 590 mm, and approximately 79.1% of the precipitation occurs during June and September [31]. The average annual water surface evaporation was 1264 mm from 1971 to 2005 [32]. Several rivers flow through Cangzhou, all of which are seasonal. Most of these rivers are subject to drying out year round, with the exception of some river sections in the rainy season [28]. Owing to a lack of surface water resources, the water supply in Cangzhou is nearly entirely dependent on groundwater exploitation. Geological monitoring results [31] revealed that the total water consumption of Cangzhou was about 13.8386 × 10⁸ m3 in 2005, of which groundwater consumption accounted for 11.3171 × 10⁸ m3 (81.78%); while the surface water and reclaimed wastewater consumption accounted for about 2.5215 × 10⁸ m3 (18.22%).
Figure 1. Map of the geographical location and distribution of hydrogeochemical zones and transects (A–A' and B–B') in Cangzhou.
Water 07 01109 g001

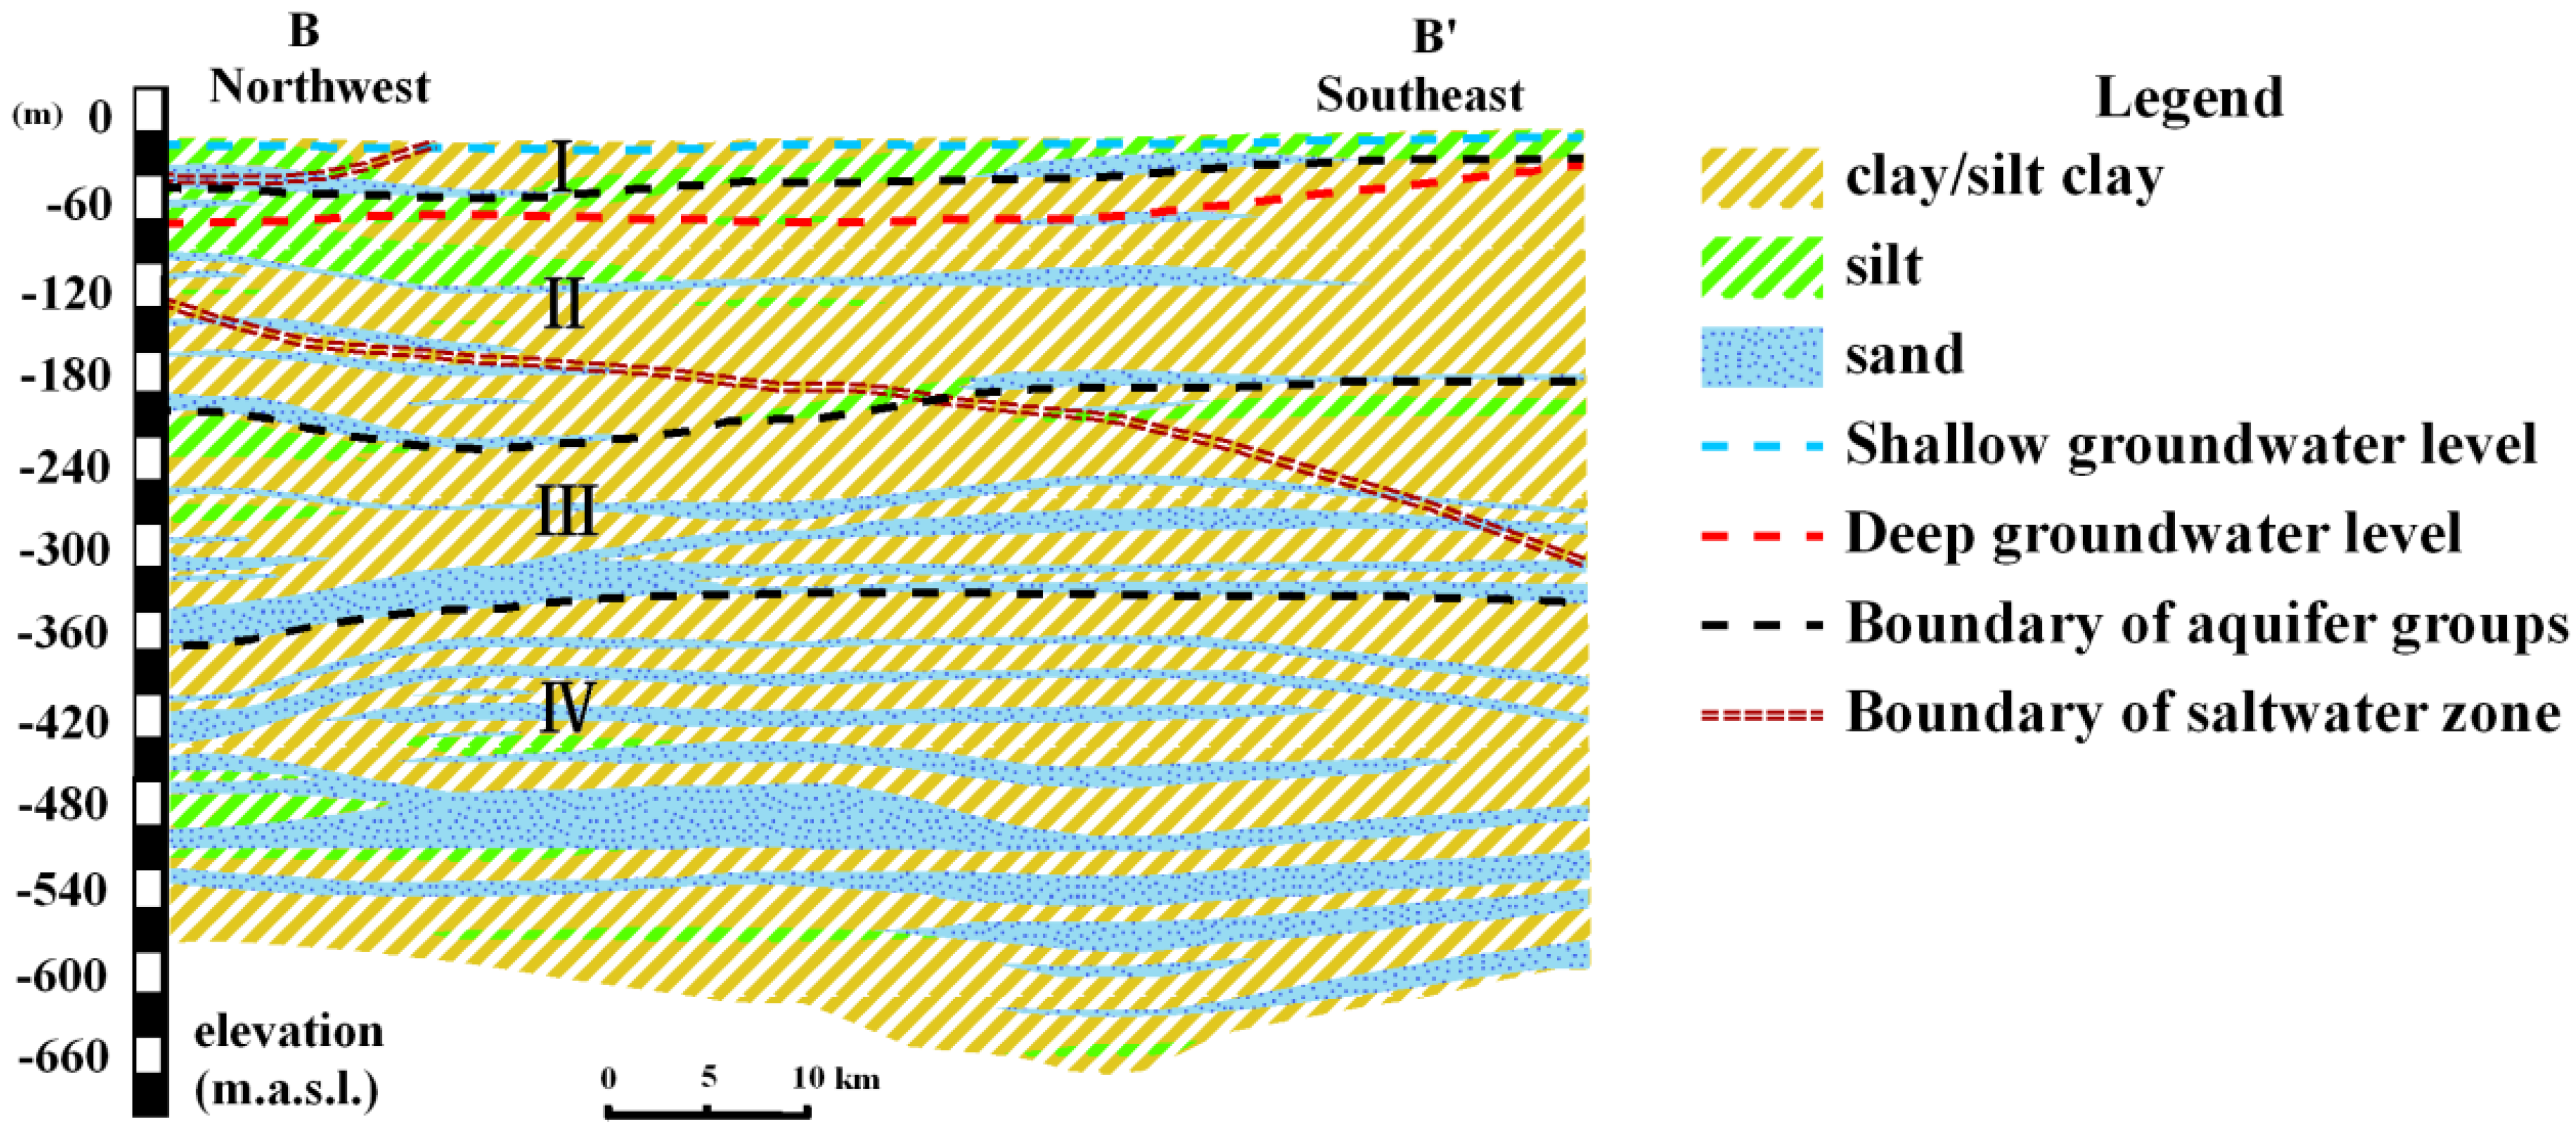
2.2. Geological and Hydrogeological Setting

Cangzhou is relatively flat and slopes regionally from the southwest to northeast, with elevations varying between 2 and 17 m. The NCP consists of three parts, the western piedmont alluvial plain (Zone I), the central alluvial and lacustrine plain (Zone II) and the eastern littoral plain (Zone III). Cangzhou falls in the western portion of Zone II and the eastern part of Zone III (Figure 1).
The geological structure and aquifer division have been discussed in several studies. Han et al. [28] and Fu [30] reported that the quaternary aquifer was the primary exploitation aquifer subjected to abstraction in Cangzhou. This aquifer can be divided into four sub-aquifers (I–IV) from the land surface downwards, all of which are composed of clay, silt and fine sand (Table 1; Figure 2 and Figure 3). Zhang et al. [33] indicated that the sea level fall persisted in the Upper Pleistocene, and the NCP expanded east, while salt accumulation continued in the Upper Pleistocene stratum under arid conditions and was aggravated by the seawater intrusion in the Holocene. The subsequent leaching and water-rock interaction resulted in the development of salt water in the Upper Pleistocene stratum (Aquifer II), with increasing thickness and salinity occurring from west to east (Figure 2 and Figure 3). In Cangzhou, Aquifer I (shallow groundwater) and Aquifer III (deep groundwater) were the primary aquifers subjected to exploitation, accounting for 26.02% and 52.76% of the total water consumption in 2005, respectively [31]. The shallow groundwater (abstracted from Aquifer I), which had a TDS of approximately 1 g/L, was mainly used for irrigation, while potable and domestic water supply were primarily dependent on the deep groundwater (Aquifer III). In the early period of the 1950s, shallow and deep groundwater in Cangzhou generally flowed from west to northeast into the Bohai Sea. From the 1960s, decreased precipitation and increasing exploitation of groundwater resulted in the development and expansion of groundwater depression cones in the urban area and the northeast part of Cangzhou, which caused the natural flow to shift toward the centers of the groundwater depression cones [33,34].
Table 1. Aquifer division and lithology characteristics in Cangzhou.
Aquifer DivisionGeological TimeDepth of Aquifer Bottom (m)Aquifer Thickness (m)Stratum LithologyAquifer LithologyGroundwater TypeGroundwater Hydrochemical Types [33]
IHolocene10–405–20lacustrine sediments/marine sediment (clay, silt clay)fine sandfresh water/saltwaterHCO3.Cl.SO4-cation, HCO3.Cl-cation/Cl.HCO3-cation, Cl-cation
IIUpper Pleistocene12–2505–70alluvium/lacustrine sediments (clay, loam, sandy loam)silt, fine sandsaltwater/fresh waterSO4.Cl–Na.Mg, Cl–Na.Mg, Cl.SO4–Na.Mg/Cl–Na.Mg
IIIMiddle Pleistocene25–3503–70alluvium/lacustrine sediments (clay, loam, sandy loam)/pyroclasticmedium sand, fine sandfresh waterCl.HCO3–Na, Cl.HCO3.SO4–Na, Cl.SO4–Na (Na.Ca, Na.Mg)/Cl–Na
IVLower Pleistocene Series35–5502–45alluvium/lacustrine sediments (clay, silty fine sand)medium sand, fine sandsaltwater/fresh water
Figure 2. Lithology and aquifer division of transect A–A' in Cangzhou (modified from Zhang et al. [35]).
Water 07 01109 g002
Figure 3. Lithology and aquifer division of transect B–B' in Cangzhou (modified from Zhang et al. [35]).
Water 07 01109 g003

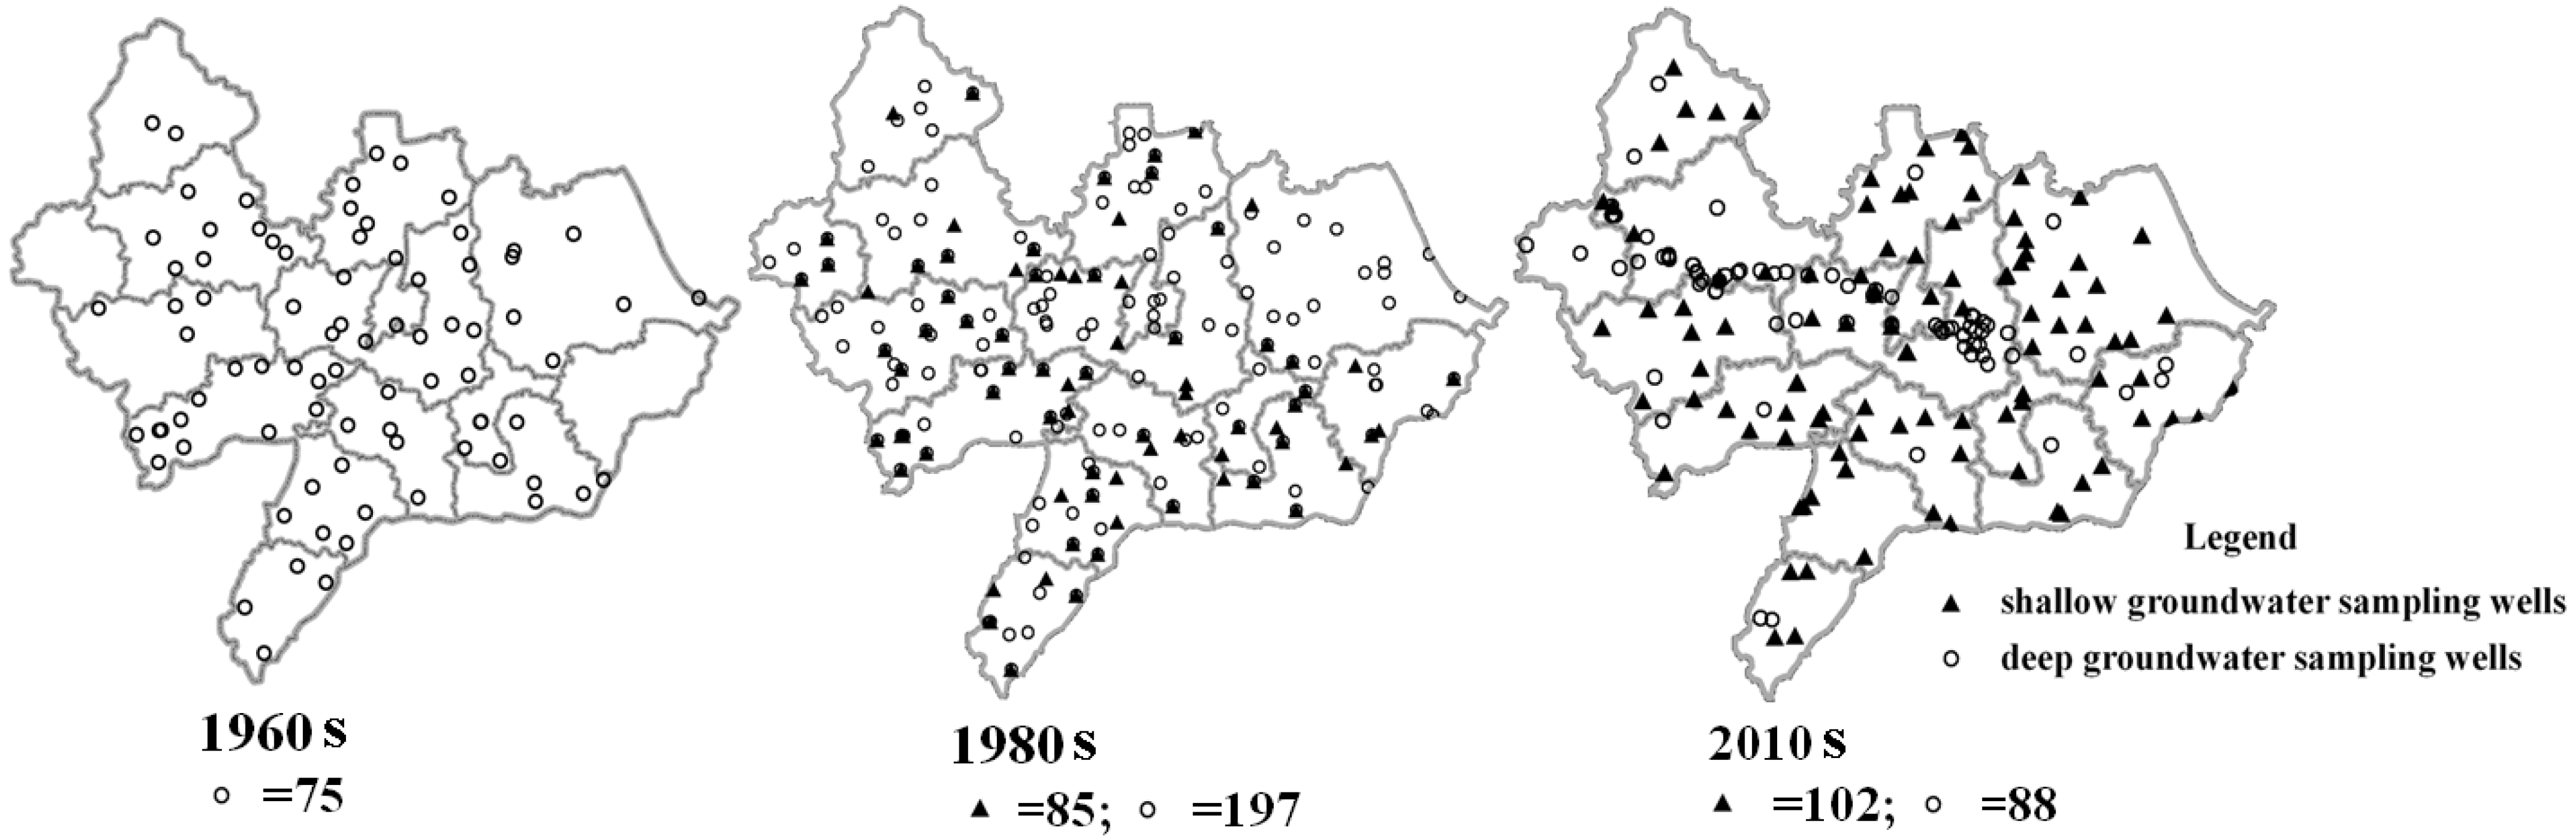
2.3. Data Collection and Groundwater Sampling Test

Groundwater quality data for Cangzhou from 1966 to 1980 were obtained from the National Geological Library of China [36], the Hebei Hydrology and Water Resources Survey Bureau (HBHWRSB, Hebei Province, China) and the 4th Team of Hydrogeology and Engineering Geology of Hebei Province (4th HBHEGT, Hebei Province, China). Owing to a lack of sequential annual observation of groundwater quality and the variable distribution of groundwater sampling wells, the data were aggregated over the decadal scale (1966 to 1969 for the 1960s and 1980 for the 1980s) for subsequent analysis. For wells with multiple observations in one decade, the average values were used. The parameters included the geographic position and coordinates of groundwater sampling wells, the depth of wells and the abstracted aquifer, concentration (mg/L) of TDS and sodium (Na+), potassium (K+), calcium (Ca2+), magnesium (Mg2+), chlorine (Cl), sulfate (SO42−) and bicarbonate (HCO3). The data were further divided into two groups according to the depth of abstracted aquifer: shallow groundwater (<50 m, Aquifer I) and deep groundwater (>50 m, Aquifer III).
To determine the groundwater quality of Cangzhou in the 2010s, groundwater sampling and testing were conducted from 2010 to 2014 using samples collected from domestic and drinking water supply wells and irrigation wells throughout Cangzhou (102 shallow groundwater samples and 88 deep groundwater samples). TDS, electrical conductivity (EC) and dissolve oxygen (DO) were tested on-site using a portable instrument (YSI Proplus, Yellow Springs, OH, USA). The groundwater samples were collected by high-density polyethylene containers and transported to the lab in Beijing. Na+, K+, Ca2+ and Mg2+ were tested by inductively-coupled plasma atomic emission spectrometry (Integra XL, GBC, Melbourne, Australia). Ion chromatography (IC-90, Dinoex, Sunnyvale, CA, USA) was used to measure Cl and SO42−, while HCO3 was evaluated by acid-base titration. All analyses were conducted according to the Drinking Water Standard Testing Method (GB/T5750-2006, China) [37]. The location of the groundwater sampling wells is shown in Figure 4.
Figure 4. Location of groundwater sampling wells from 1966 to 2014 (divided into three decades: 1960s, 1980s and 2010s).
Water 07 01109 g004

2.4. Data Analysis Methods

Piper plots are used to reveal the groundwater hydrochemical facies types and natural processes (evaporation, water-rock interaction and precipitation) in different decades [38]. In addition, different geochemical ratios are used to identify the potential mechanisms that influence the overall geochemical composition of groundwater [12,13,15,39,40]. For example, the (Ca2+ + Mg2+)/(Na+ + K+) ratio is used to indicate ion-exchange processes [22,41]; ratios of Na/Cl and Ca2+/SO42− are used to indicate halite (NaCl) and gypsum (CaSO4) dissolution, respectively [22,40]; and the HCO3/Cl ratio is used as an indicator of groundwater recharge type [22,42].
Principal component analysis (PCA) and correlation test (CT) have been conducted by researchers worldwide to make groundwater management decisions [43,44,45,46]. For instance, Guo [44] used PCA to identify the relationship among heavy metals of flood slack water deposits and their possible sources; and Zhang [46] used PCA to determine factors that influence the composition of groundwater. In this study, PCA and CT are used to identify the possible sources of major ions in groundwater and hydrogeological reactions that may occur in the study area. The calculated results of PCA and CT can be useful to predict the possible source of groundwater major components and dominant factors that control groundwater quality. To reveal the spatiotemporal distribution and evolution characteristics of groundwater salinization, geostatistical methods prove to be of great power to predict and display the distribution, variation and relevancy of different variants by interpolation from points data, especially for ordinary kriging (OK) [47,48]. However, recent studies have shown that the interpolation results by OK were not accurate with relatively few data, and co-kriging (COK) could improve the predict results notably, while the independent variable was highly-correlated with the coordination variables [49,50,51]. Based on the CT results of major ions and TDS and comparing the results of the mean error (ME), mean-squared error (MSE) and mean-square standard error (MSSE) of interpolation results in cross-validation by OK and COK, COK is finally used to display the spatial distribution of groundwater TDS among decades to reflect the variation tendency of groundwater quality in the study area. The calculation equations of ME, MSE and MSSE are as follows [11,52]:
ME = 1 n i = 1 n ( Z i * Z i ) 0
MSE = 1 n i = 1 n ( Z i * Z i ) 2 min
MSSE = 1 n i = 1 n { ( Z i * Z i ) 2 σ i 2 } 1

3. Results and Discussion

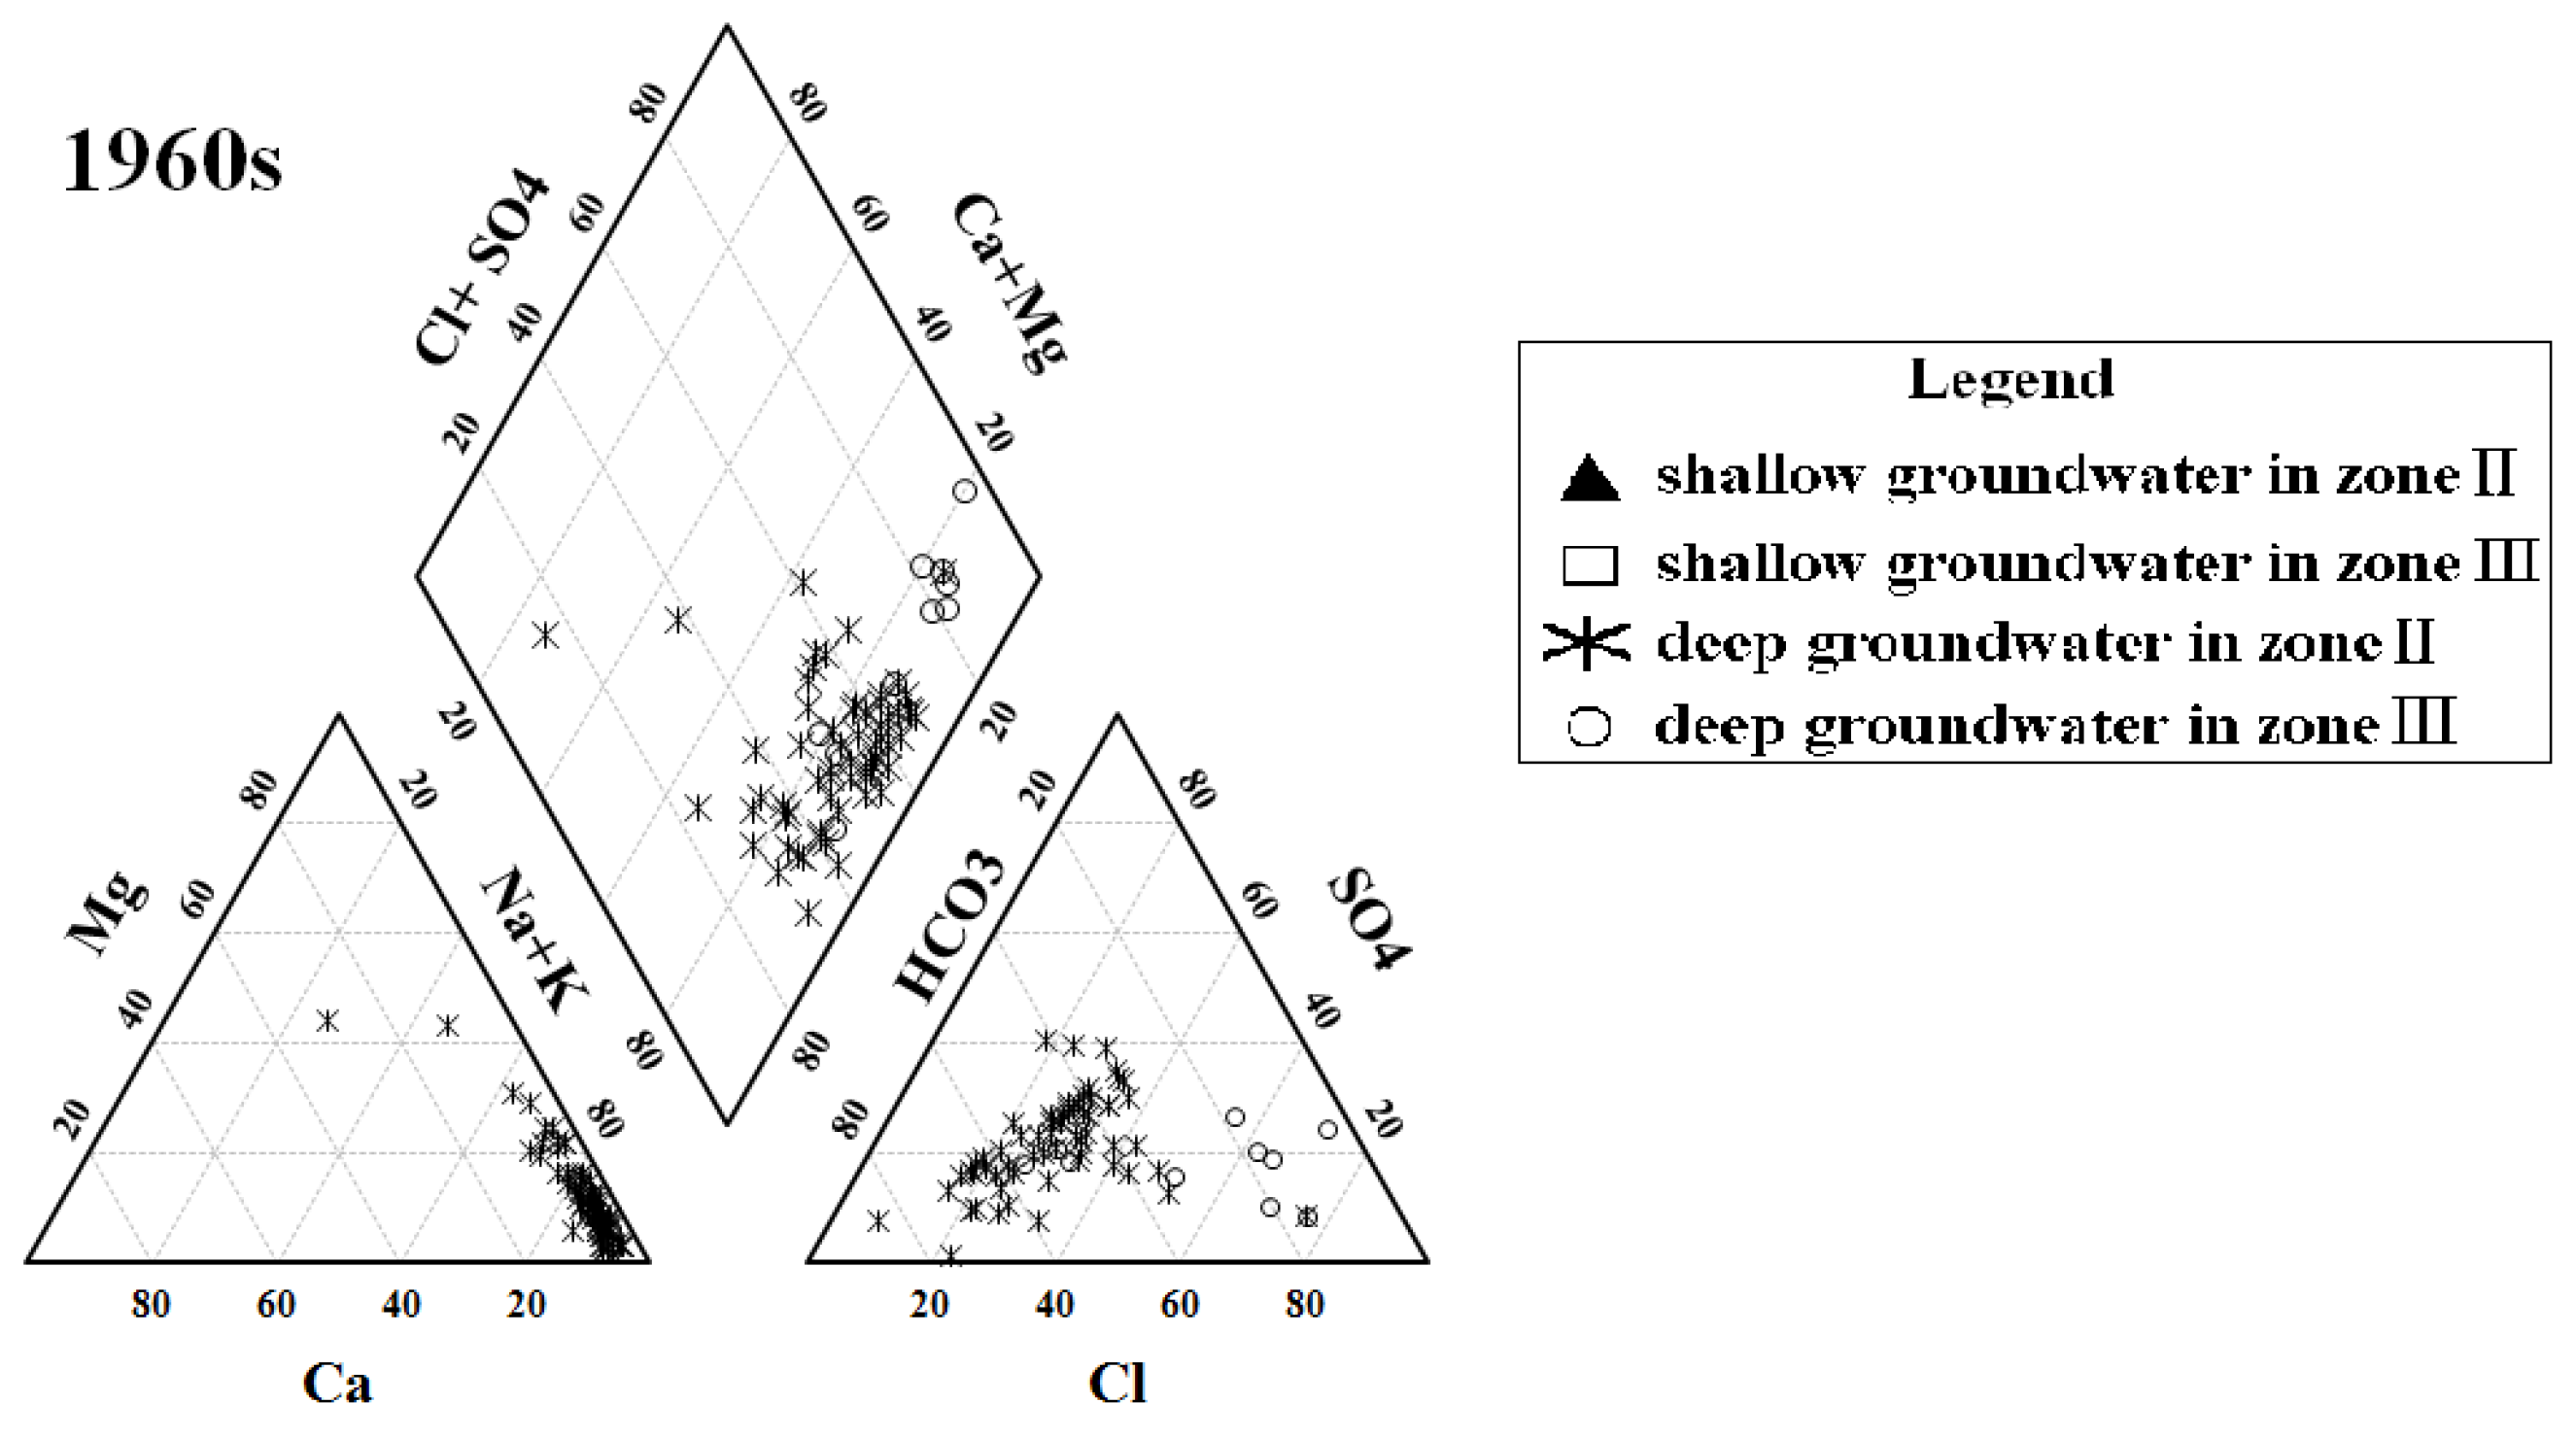
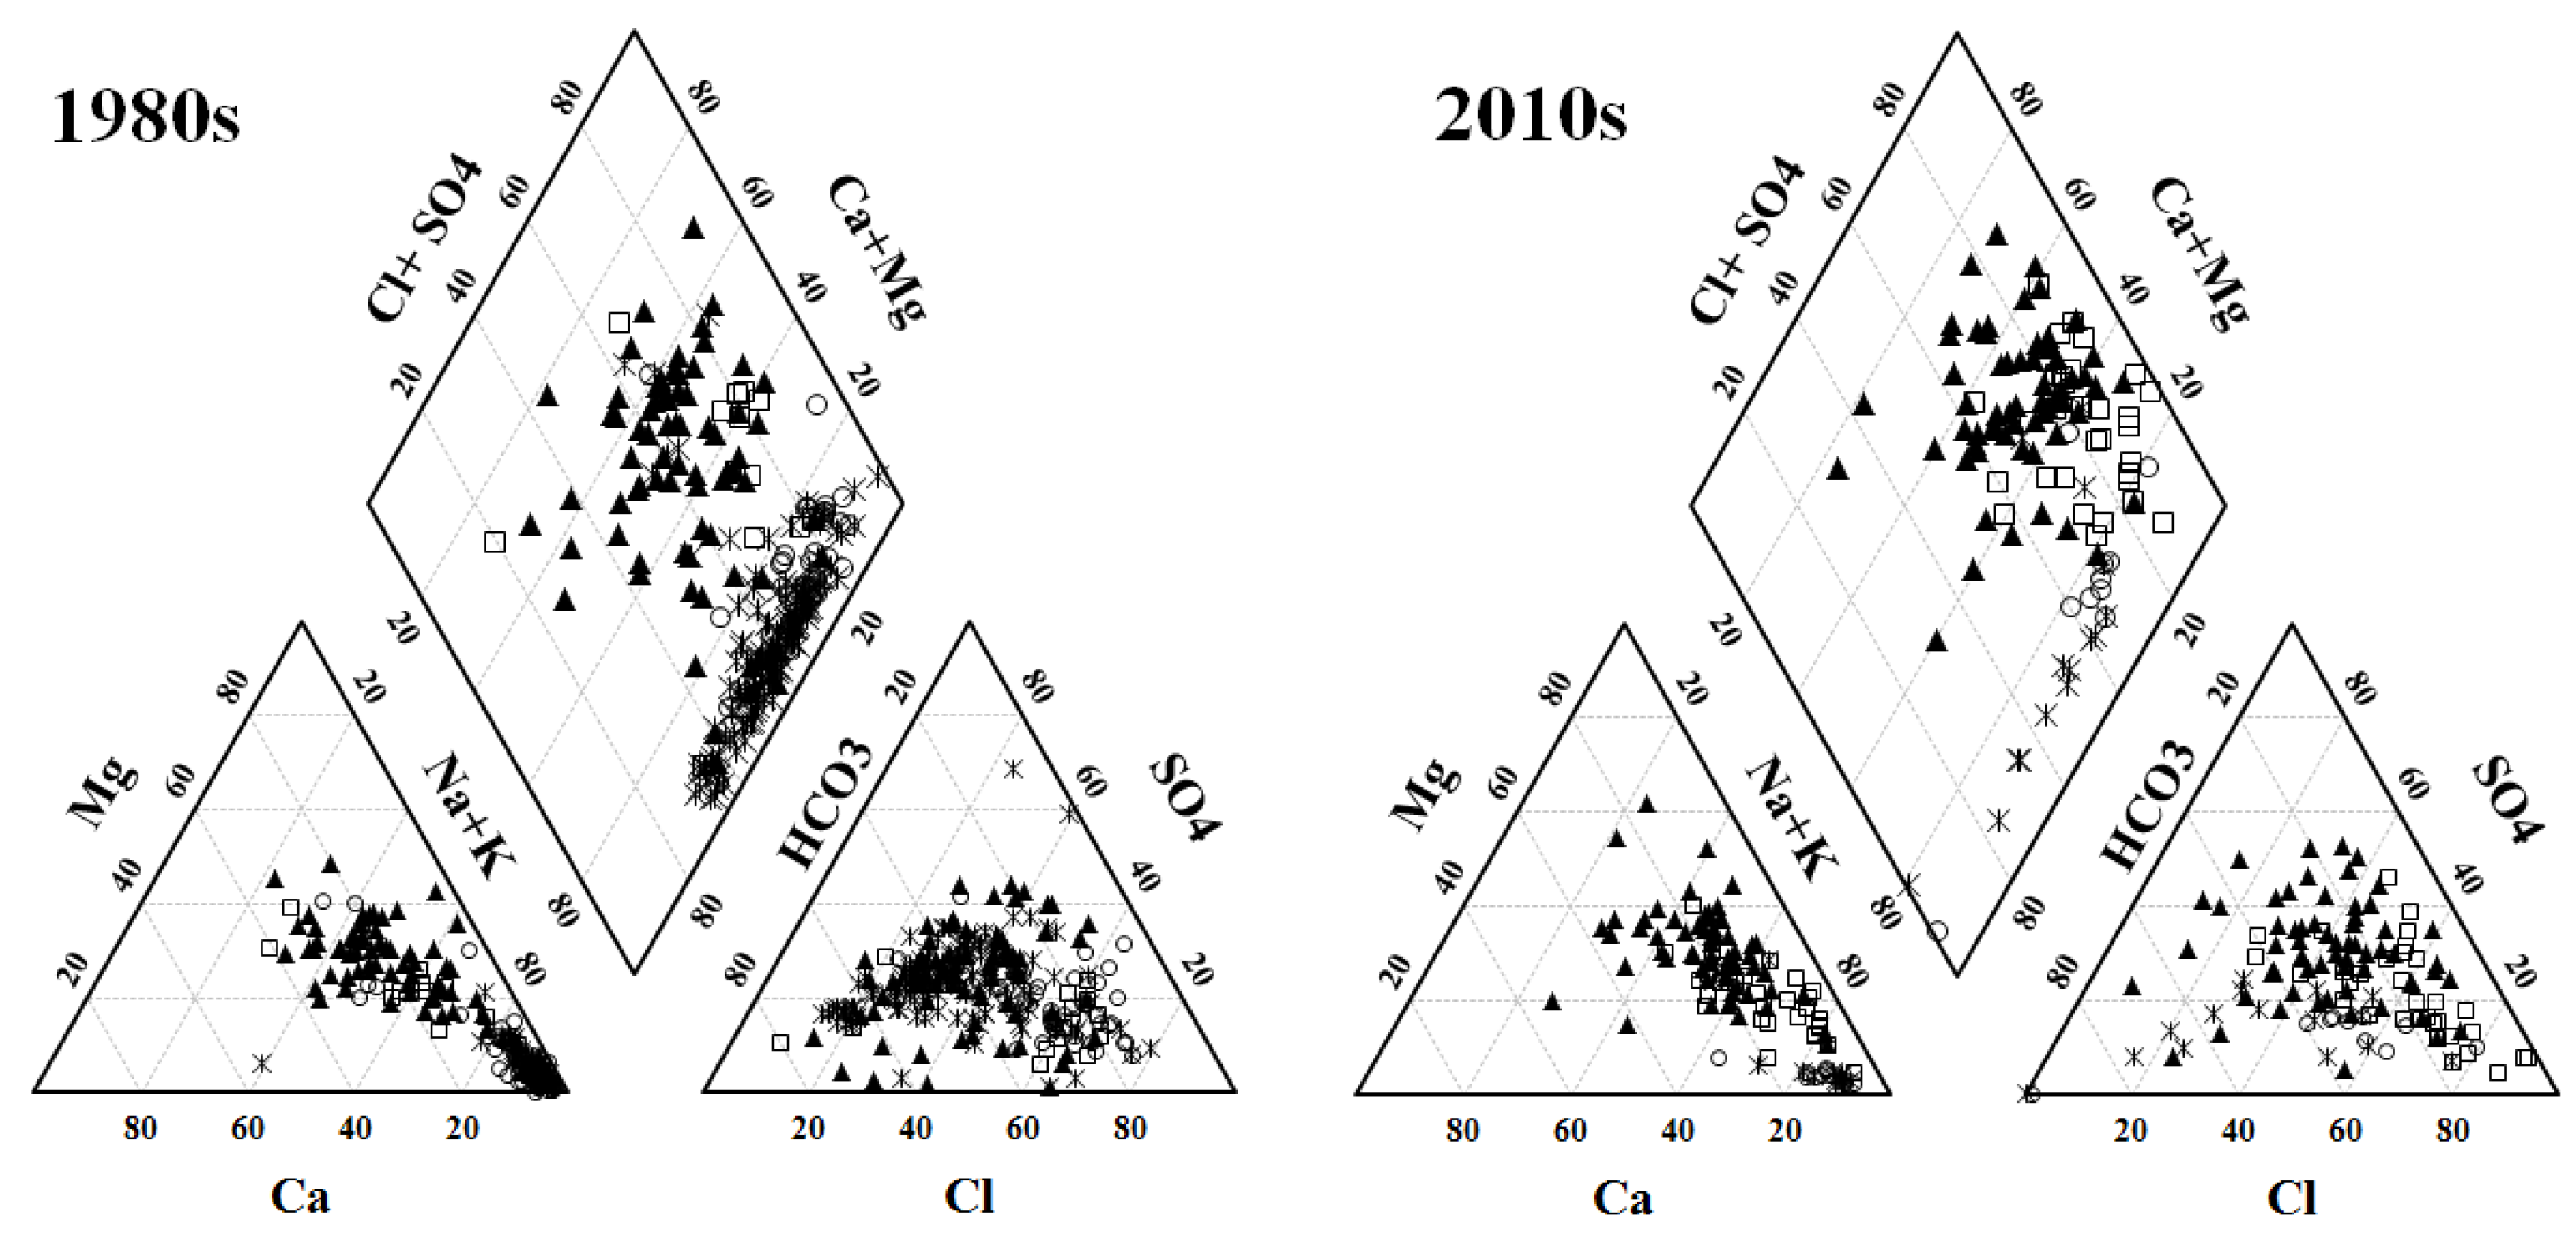
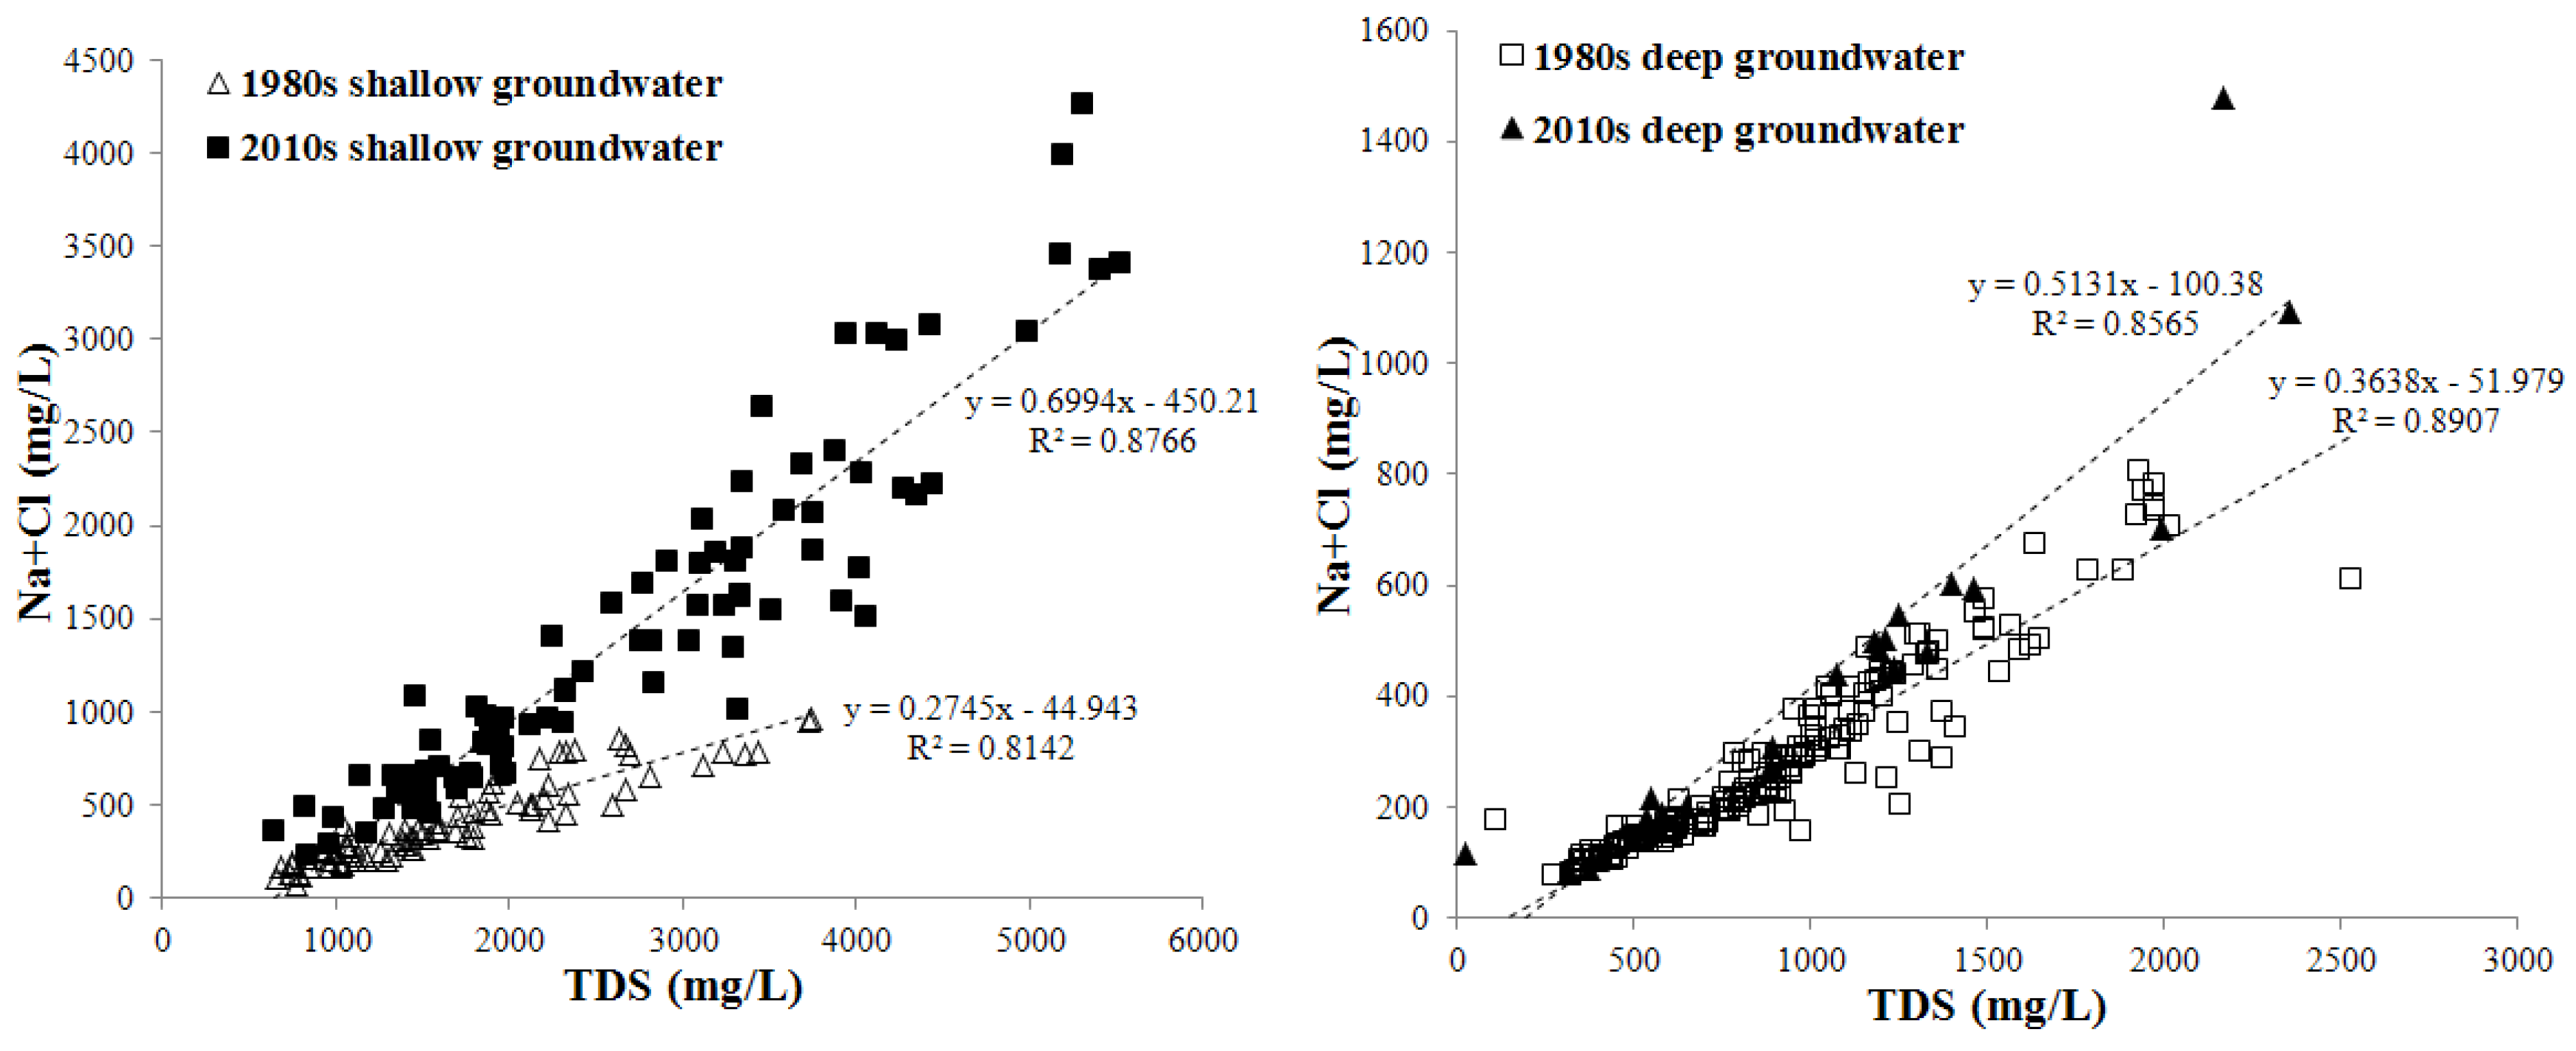
3.1. Groundwater Hydrochemical Types and Hydrochemical Evolution of Major Ions among Decades

Groundwater hydrochemical characteristics are of great importance to determine water quality and the evolution tendency for domestic, agricultural and industrial purposes [40]. Based on the groundwater sampling test results (Figure 5), the evolution tendency of major ions in groundwater of the study area for both shallow and deep groundwater is similar across decades. All of the concentrations of major ions in groundwater increase from the 1960s to the 2010s. When compared to other ions, the concentrations of Ca2+ and Mg2+ increase slightly across decades, and notably increased patterns are revealed for Na+ + K+ and Cl. Specifically, the mean concentrations of these ions in deep groundwater increase from 120.07 and 78.85 mg/L in the 1960s to 173.46 and 263.81 mg/L in the 2010s, respectively, while they increase from 193.30 and 255.37 mg/L in the 1980s to 624.67 and 856.26 mg/L in the 2010s in shallow groundwater. Overall, these findings indicate that groundwater salinization has tended to increase in the study area since the 1960s. SO42− increases by about 275% in shallow groundwater (from 168.63 mg/L in the 1980s to 632.29 mg/L in the 2010s) and by 50% in deep groundwater (from 62.85 mg/L in the 1960s to 94.31 mg/L in the 2010s). HCO3 increases by about 105% in shallow groundwater (from 293.34 mg/L in the 1980s to 600.17 mg/L in the 2010s) and by 58% in deep groundwater (from 164.66 mg/L in the 1960s to 259.86 mg/L in the 2010s). The hardness in shallow groundwater increases from 322.80 in the 1980s to 1007.02 in the 2010s, while it increases from 55.05 in the 1960s to 98.68 in the 2010s in deep groundwater (mg/L, CaCO3).
Figure 5. Concentration distribution of major ions across decades.
Water 07 01109 g005
Groundwater hydrochemical types are determined by Piper plots, which reveal variations in aquifer zones across decades (Figure 6). From Zone II to Zone III, the hydrochemical types of deep groundwater change from Cl.HCO3.SO4–Na, Cl.HCO3–Na and HCO3.Cl–Na.Mg to HCO3.Cl–Na, Cl.SO4–Na and Cl–Na. The hydrochemical types of shallow groundwater are more complicated, changing from HCO3–Ca.Na.Mg, HCO3.Cl–Na, HCO3–Na.Mg.Ca and Cl.SO4–Na.Mg to HCO3.Cl–Na, Cl.SO4–Na and Cl–Na. In general, the plots of Zone III are mainly distributed in the right district of the diamond area for both shallow and deep groundwater, indicating the Cl–Na type. Accordingly, the water in this region may derive from salt water (leakage from the salt water aquifer overlying the deep groundwater aquifer, Figure 2 and Figure 3) or seawater intrusion [13,53]. Most of the shallow groundwater plots in Zone II are spread over the middle part of the diamond area, suggesting that mixing of fresh water and salt water occurs [5]. The majority of deep groundwater plots are located in the bottom right portion of the diamond area, indicating that the dominant ions of deep groundwater are Na+ and HCO3 and relatively fresh compared to shallow groundwater. The relative amount (percentage of the total amounts of major ions) of Na+, SO42− and Cl increase, while Ca2+, Mg2+ and HCO3 decrease over time in both shallow and deep groundwater, suggesting the deterioration of groundwater quality in the study area with time, and these findings are in agreement with those of former studies conducted in the NCP [53,54].
Figure 6. Piper plots of shallow and deep groundwater samples among decades.
Water 07 01109 g006aWater 07 01109 g006b
In both shallow and deep aquifers, sediments are mainly composed of quartz, calcite, dolomite, albite, fluorite, halite, gypsum and sylvite [53,55]; therefore, the dissolution of these minerals can be a possible source of major groundwater ions. Moreover, Ca2+, Mg2+ and Na+ in shallow and deep groundwater likely originate from the dissolution of calcite, dolomite and albite via the reactions summarized in Equations (4)–(6). Wang [39] stated that a relatively high ratio of Ca2+ + Mg2+ vs. HCO3 could not be due to HCO3 depletion, because of the existing alkaline conditions [56], and that there may be additional sources of Ca2+ + Mg2+ in groundwater, such as gypsum in the study area. Additionally, a low ratio of Ca2+ + Mg2+ vs. HCO3 (Figure 7a) indicates enrichment of HCO3 or other reactions that deplete Ca2+ and Mg2+ in groundwater (especially for deep groundwater in this study), such as the cation exchange reaction between Ca2+, Mg2+ and Na+ in groundwater.
CaCO 3 = Ca 2 + + CO 3 2 -
CaMg ( CO 3 ) 2 = Ca 2 + + Mg 2 + + 2 CO 3 2 -
2 NaAlSi 3 O 8 + 9 H 2 O + 2 H 2 CO 3 = Al 2 Si 2 O 5 ( OH ) 4 + 4 H 4 SiO 4 + 2 Na + + 2 HCO 3 -
Figure 7. Scatter plots of Ca2+ + Mg2+ vs. HCO3 (a) and Ca2+ + Mg2+ vs. Na+ + K+ (b) of groundwater samples in Cangzhou.
Water 07 01109 g007
Cation exchange, which is one of the most important hydrogeological process occurring in aquifers, affects the content of cations in groundwater and modifies the groundwater quality [5,13,22]. According to the stratum structure and lithology characteristics revealed by drilling holes in the NCP [34], sediments in the study area mainly consist of silt, silt clay and clay (Figure 2 and Figure 3), and Ca2+ and Mg2+ in groundwater may exchange Na+ absorbed on the clay materials in aquifers. A significant low ratio of Ca2+ + Mg2+/Na+ + K+ is illustrated in Figure 7b (especially for deep groundwater ), indicating that cation exchange processes occur and lead to enrichment of alkali metals (Na+ and K+) in shallow and deep groundwater and entail groundwater salinization in the study area. Additionally, ratios of milligram equivalents of Na+ vs. Cl are a useful factor to estimate the degree of cation exchange in groundwater. As shown in Table 2, the ratio of Na+ vs. Cl is higher than one (Table 2), suggesting that cation exchange between Ca2+, Mg2+ and Na+ occur in shallow and deep groundwater and contribute to groundwater quality evolution [53,57,58].
Table 2. Average ratio of milligram equivalents of Na+ vs. Cl and HCO3 vs. Cl.
DecadesShallow GroundwaterDeep Groundwater
Na+/Cl (meq/meq)HCO3/Cl (meq/meq)Na+/Cl (meq/meq)HCO3/Cl (meq/meq)
1960s--2.6914531.833077985
1980s1.5181611.2183000332.5201371.252170605
2010s1.2441090.7201235421.3507621.163695914
The ratio of Na+ + Cl/TDS for both shallow and deep groundwater increased from the 1980s to the 2010s (Figure 8), indicating that Na+ and Cl gradually become the dominant components and result in groundwater salinization. However, the ratios of both Na+/Cl and HCO3/Cl in shallow and deep groundwater decrease with time, suggesting a weakening tendency of cation exchange for both shallow and deep groundwater [53].
Figure 8. Scatter diagram of Na+ + Cl vs. total dissolved solids (TDS) of groundwater samples in shallow and deep groundwater in the 1980s and the 2010s.
Water 07 01109 g008
Sources of Ca2+ and SO42− can be estimated based on the ratio of their milligram equivalents, with 1:1 indicating that they originate from dissolution of gypsum [40]. The scatter diagrams (Figure 9) of Ca2+ vs. SO42− show that both plots of shallow and deep groundwater samples deviate from the equi-line and approach the SO42− axis, and the ratio of Ca2+/SO42− in shallow groundwater is greater than that in deep groundwater, indicating that dissolution of gypsum is a secondary process and other reactions take place that affect the content of Ca2+ and SO42− in shallow and deep aquifers. Purushothaman [40] stated that the absence or negligible amounts of gypsum may lead to a higher ratio of Ca2+/SO42−, while Xing [53] pointed out that sulfate reduction occurred in shallow aquifers of the NCP, which decreased the content of SO42−. Moreover, relatively lower equivalent concentration of the Ca2+, SO42− and Ca2+/SO42− ratios of deep groundwater samples suggest the deficiency of Ca2+ in deep groundwater of the study area. Furthermore, the distribution of scatter plots is similar in the 1980s and the 2010s (Figure 9). One possible reason for this is that the cation exchange reaction occurs, which depletes Ca2+ and increases Na+ in groundwater, and the degree of cation exchange of deep groundwater is higher than that of shallow groundwater (based on the ratio of milligram equivalents of Na+ vs. Cl, Table 2), resulting in relatively deficient Ca2+ in deep groundwater. These findings are consistent with the results of previous studies of the Ca2+ + Mg2+ vs. HCO3 ratio and indicate that cation exchange takes place in the study area.
Figure 9. Scatter diagram of Ca2+ vs. SO42− of groundwater samples in Cangzhou.
Water 07 01109 g009

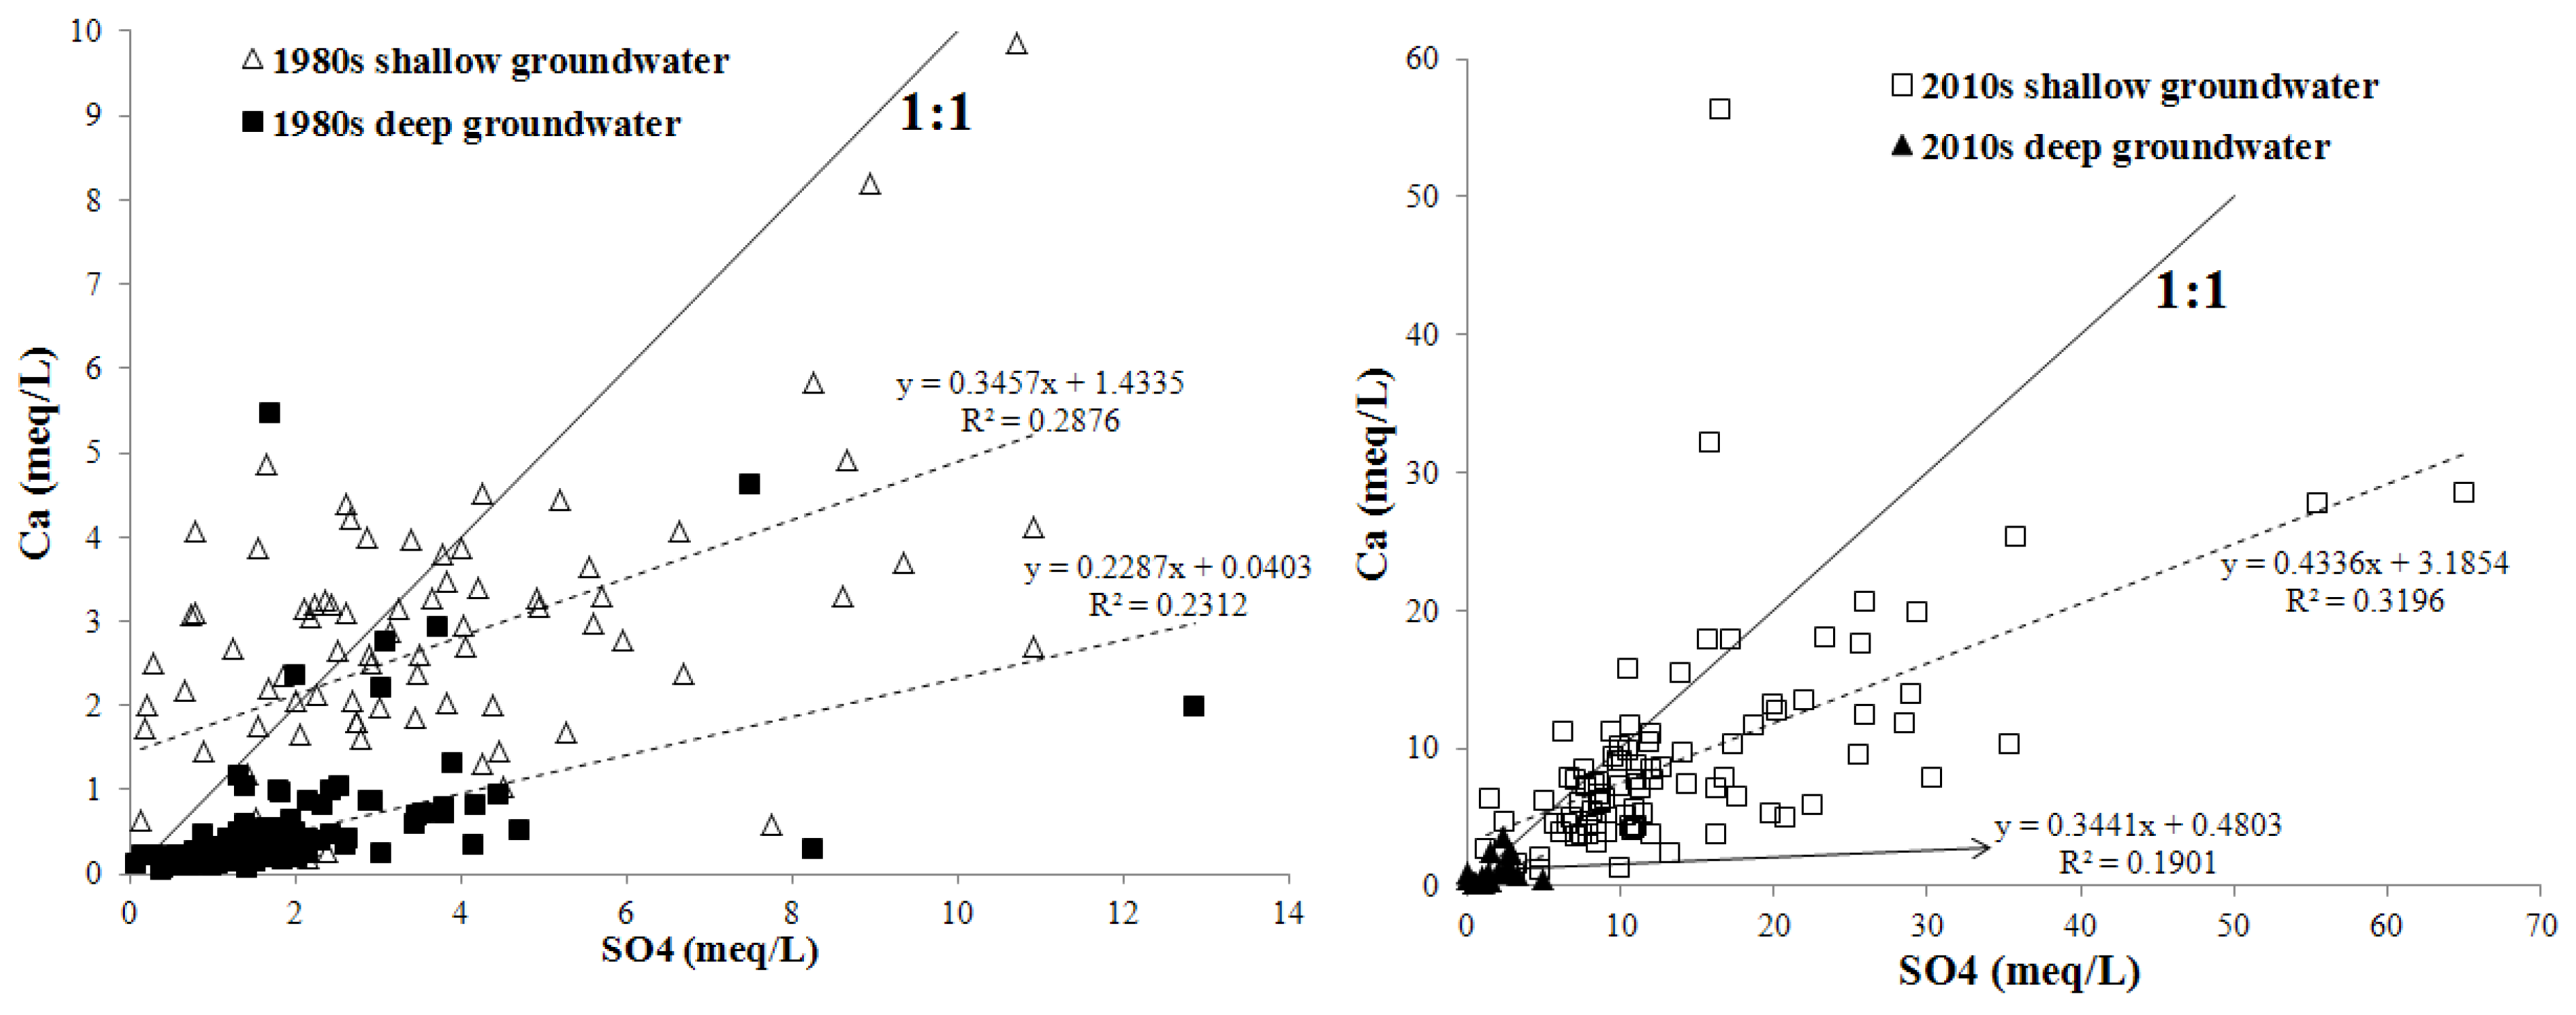
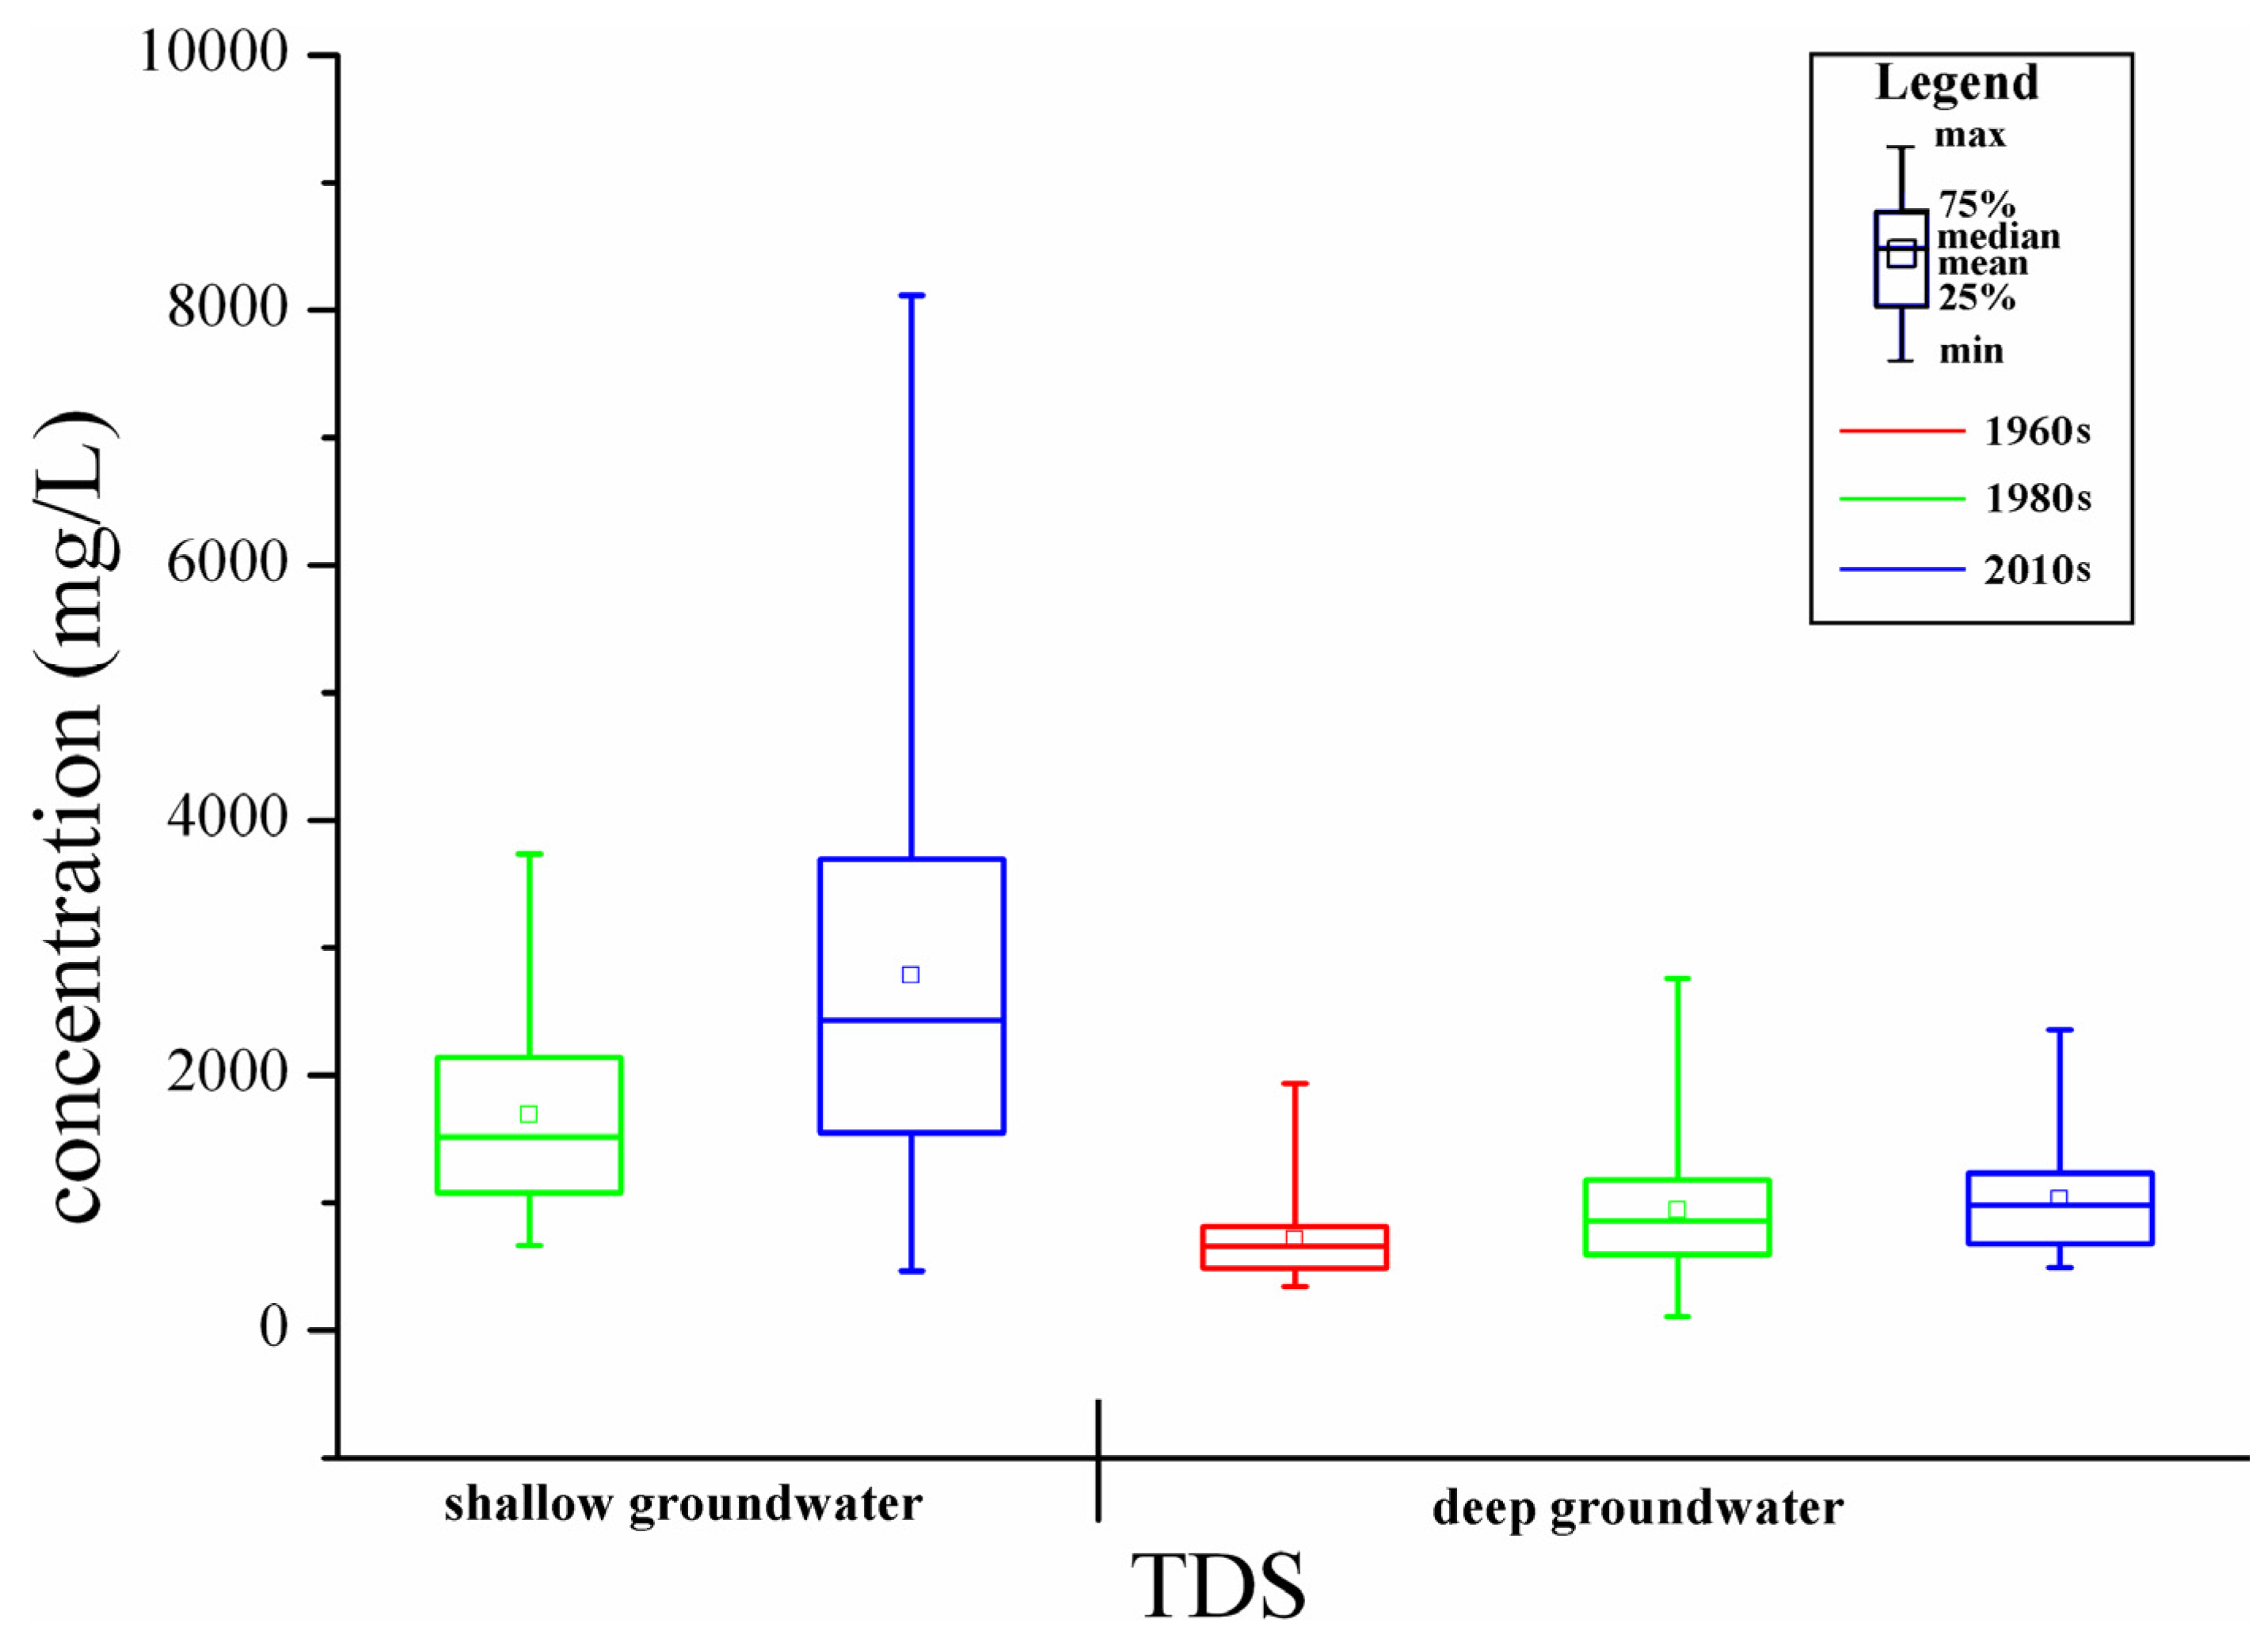
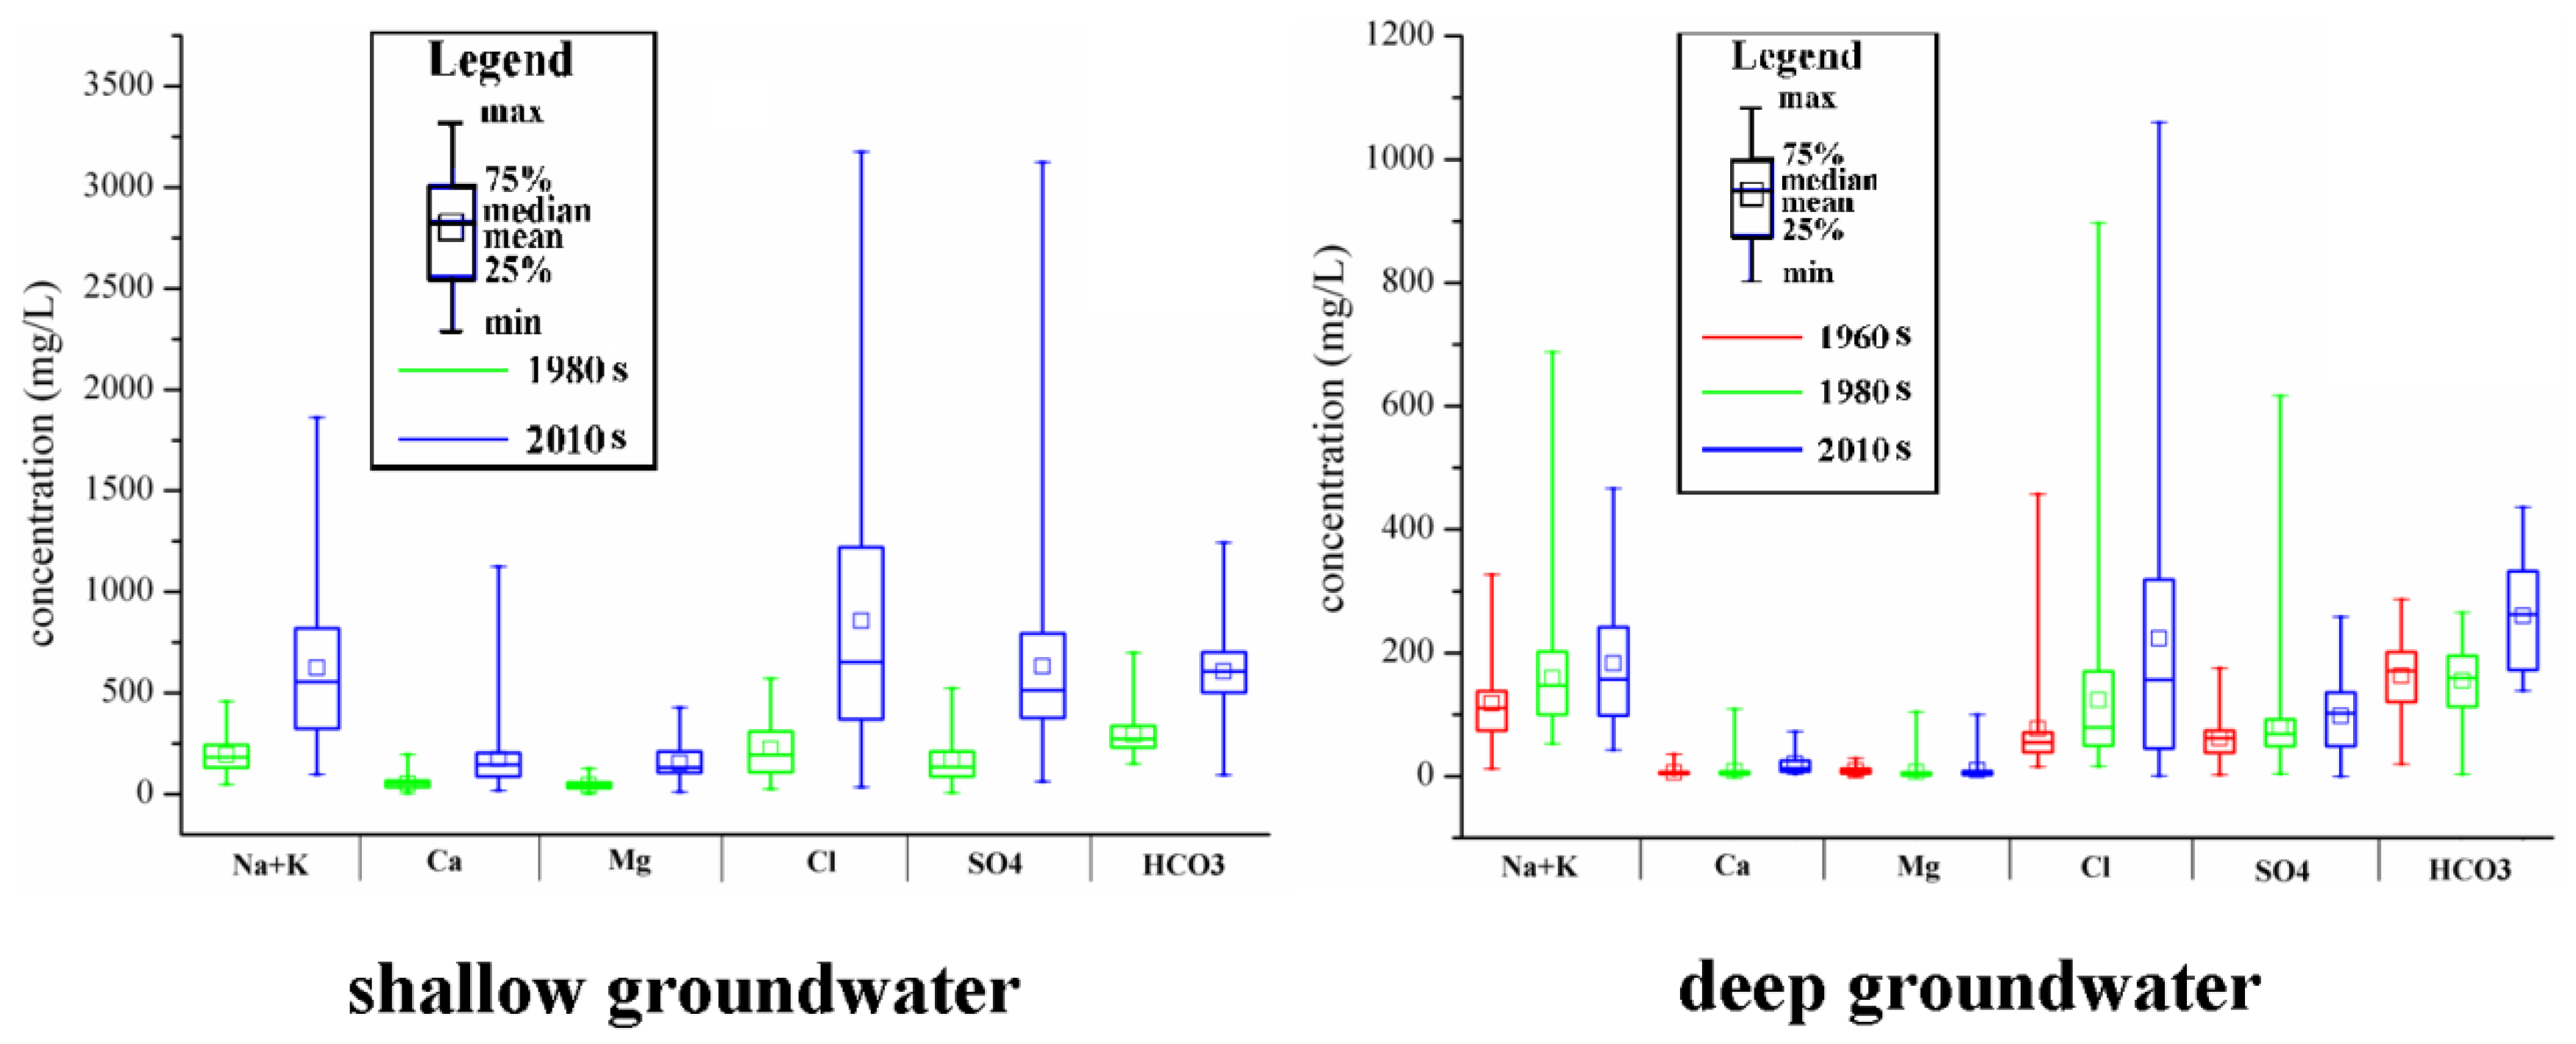
3.2. Statistical Analysis of Groundwater Major Ions and TDS

Pearson’s correlation analyses of TDS and major ions are mainly the same for shallow groundwater across decades. All ions are significantly positively correlated with TDS, especially Na+ + K+ and Cl, indicating that they are the dominant components of shallow groundwater and make a significant contribution to groundwater quality (salinization). These findings are consistent with the results of the Piper plots mentioned above. The correlation factors of TDS-Na+ + K+ and TDS-Cl are 0.834 and 0.868 for the 1980s, while they are 0.900 and 0.926 for the 2010s (significant at the 0.01 level, two-tailed, similarly hereinafter). Positive correlations are also found among ions, indicating that they have the same potential sources or similar interactions. The correlation factors between Na+ + K+ and Cl are 0.785 in the 1980s and 0.897 in the 2010s, indicating that the dissolution of halite may occur in the shallow aquifer. Ca2+ shows relatively high positive correlations with Mg2+ (0.666 in the 1980s and 0.612 in the 2010s), which may have been due to the dissolution of dolomite. Similar results are also demonstrated by former researchers [53,54]. The correlation factors of HCO3 and other ions are relatively low (non-significant) in shallow groundwater, indicating multiple sources of HCO3 or complex reactions that it would experience. For deep groundwater, in addition to high correlation factors for TDS–Na+ + K+, TDS–Cl and Na+ + K+–Cl similar to those observed in shallow groundwater, correlation factors for Na+ + K+–Ca2+ and Na+ + K+–HCO3 increase over time from 0.250 and 0.329 in the 1980s to 0.664 and 0.598 in the 2010s, indicating that the same source or interactions occur among them, which control their content in deep groundwater, such as the dissolution of feldspar and the cation exchange reaction.
Groundwater major ions and TDS are set as variables in PCA to identify the significant factors that contribute to hydrogeological processes in shallow and deep groundwater. With an eigen value larger than one, two factors are detected in shallow and deep groundwater in the 1960s and the 1980s and one factor in the 2010s (Table 3). Factor 1 accounts for more than 50% of the variance, with Na+ + K+, Cl and TDS showing strong loading in both shallow and deep groundwater, indicating that Na+ + K+ and Cl are the dominant ions in local groundwater. Ca2+, Mg2+ and HCO3 show strong absolute loading in Factor 2 for both shallow and deep groundwater across decades, suggesting that these ions have the same source (e.g., dissolution of dolomite). These findings are in agreement with the results of Piper plots.
Table 3. Component matrix of groundwater major ions and TDS among decades by PCA.
Variable1960s1980s2010s
Deep GroundwaterShallow GroundwaterDeep GroundwaterShallow GroundwaterDeep Groundwater
F1F2F1F2F1F2F1F1
Na + K0.907−0.3510.7360.6350.875−0.3420.8720.96
Ca0.4530.7160.613−0.6670.6160.5620.660.778
Mg0.5970.6590.826−0.3490.8480.2450.830.699
Cl0.856−0.2780.860.2040.888−0.3710.8630.928
SO40.706−0.2560.786−0.2820.8290.0170.7280.812
HCO30.3660.5090.2810.3850.3580.6180.3450.627
TDS0.974−0.1720.9650.1750.977−0.1640.9830.953
Eigen value3.6971.5023.9671.2714.4241.044.2464.835
% of variance52.80921.45956.67018.15863.20314.85260.65869.067

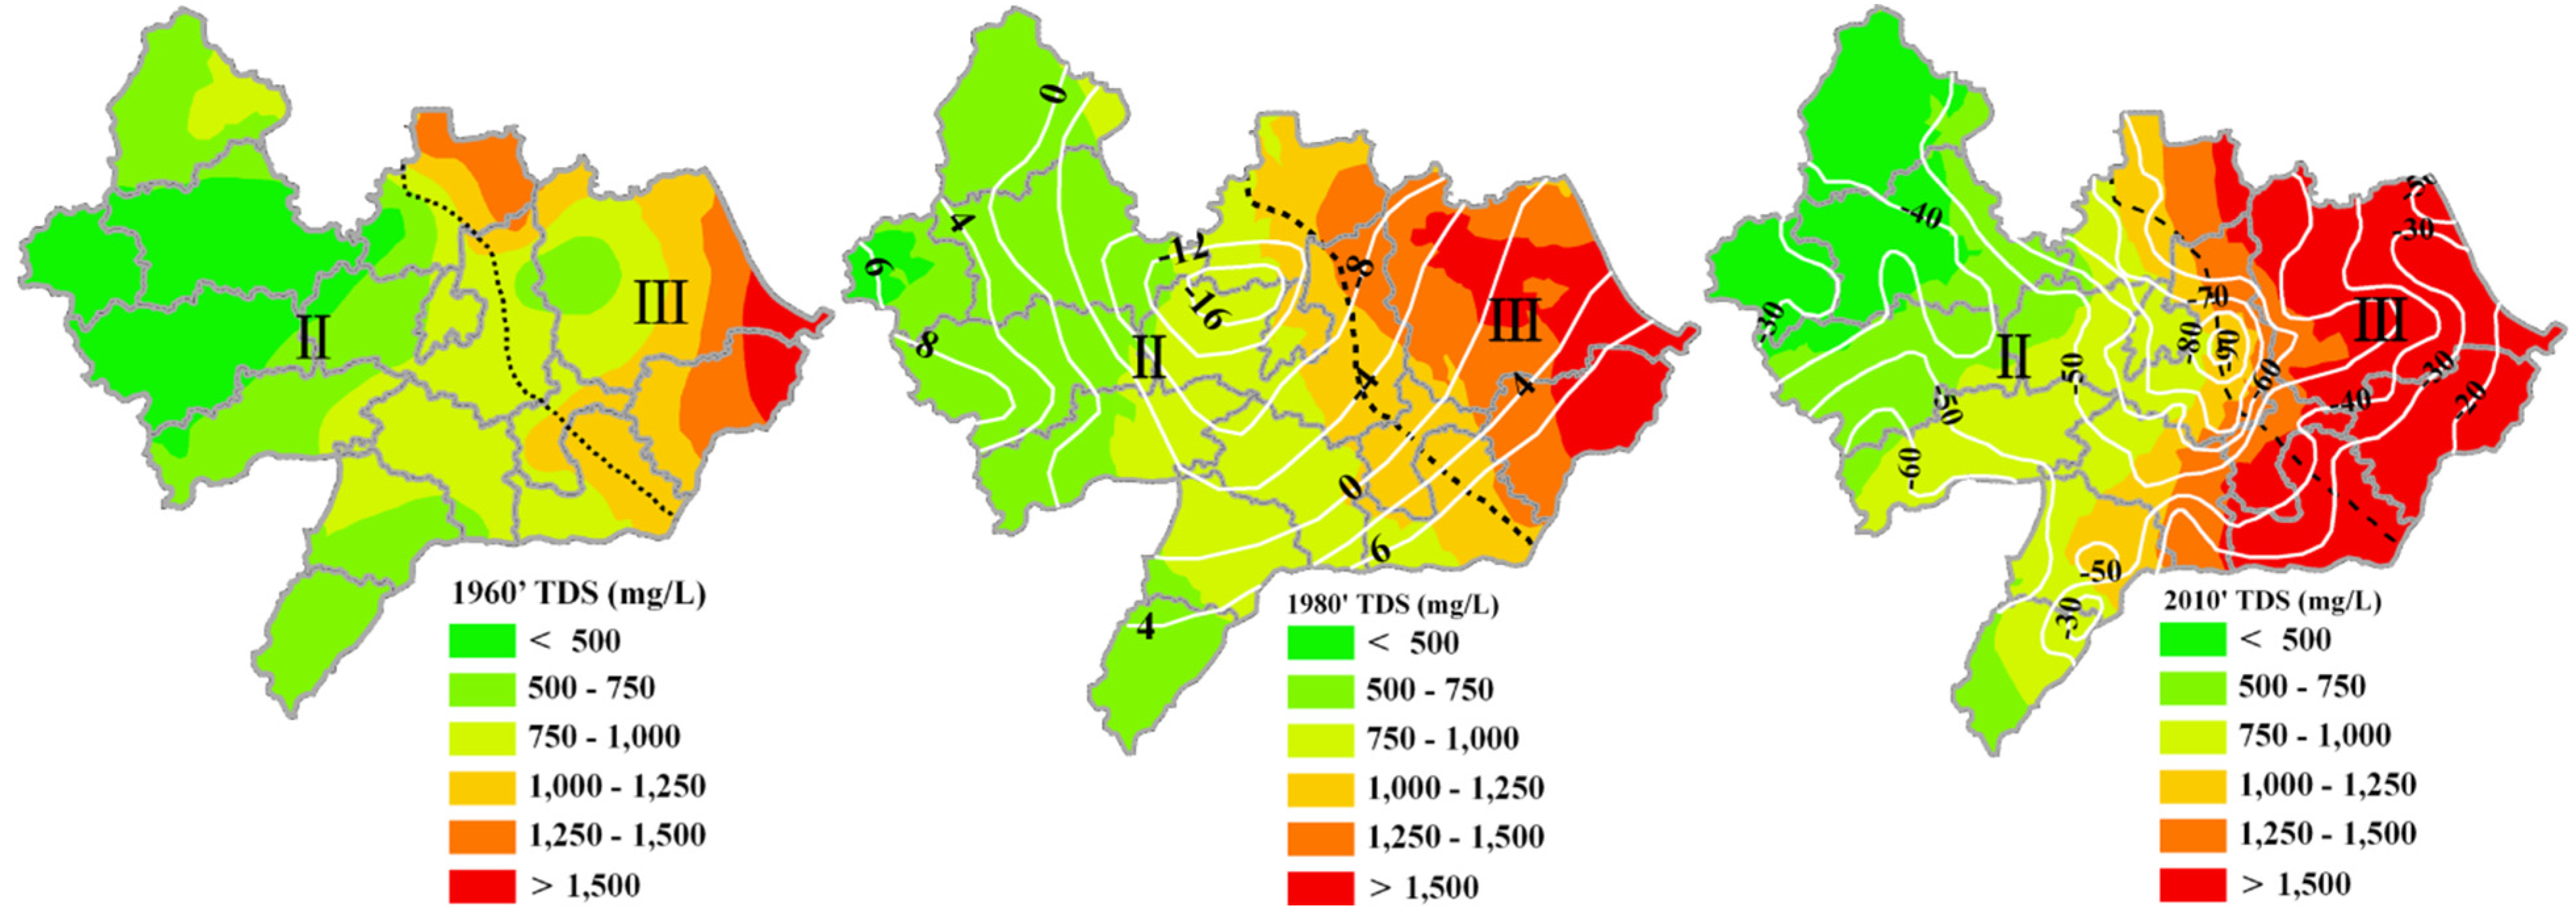
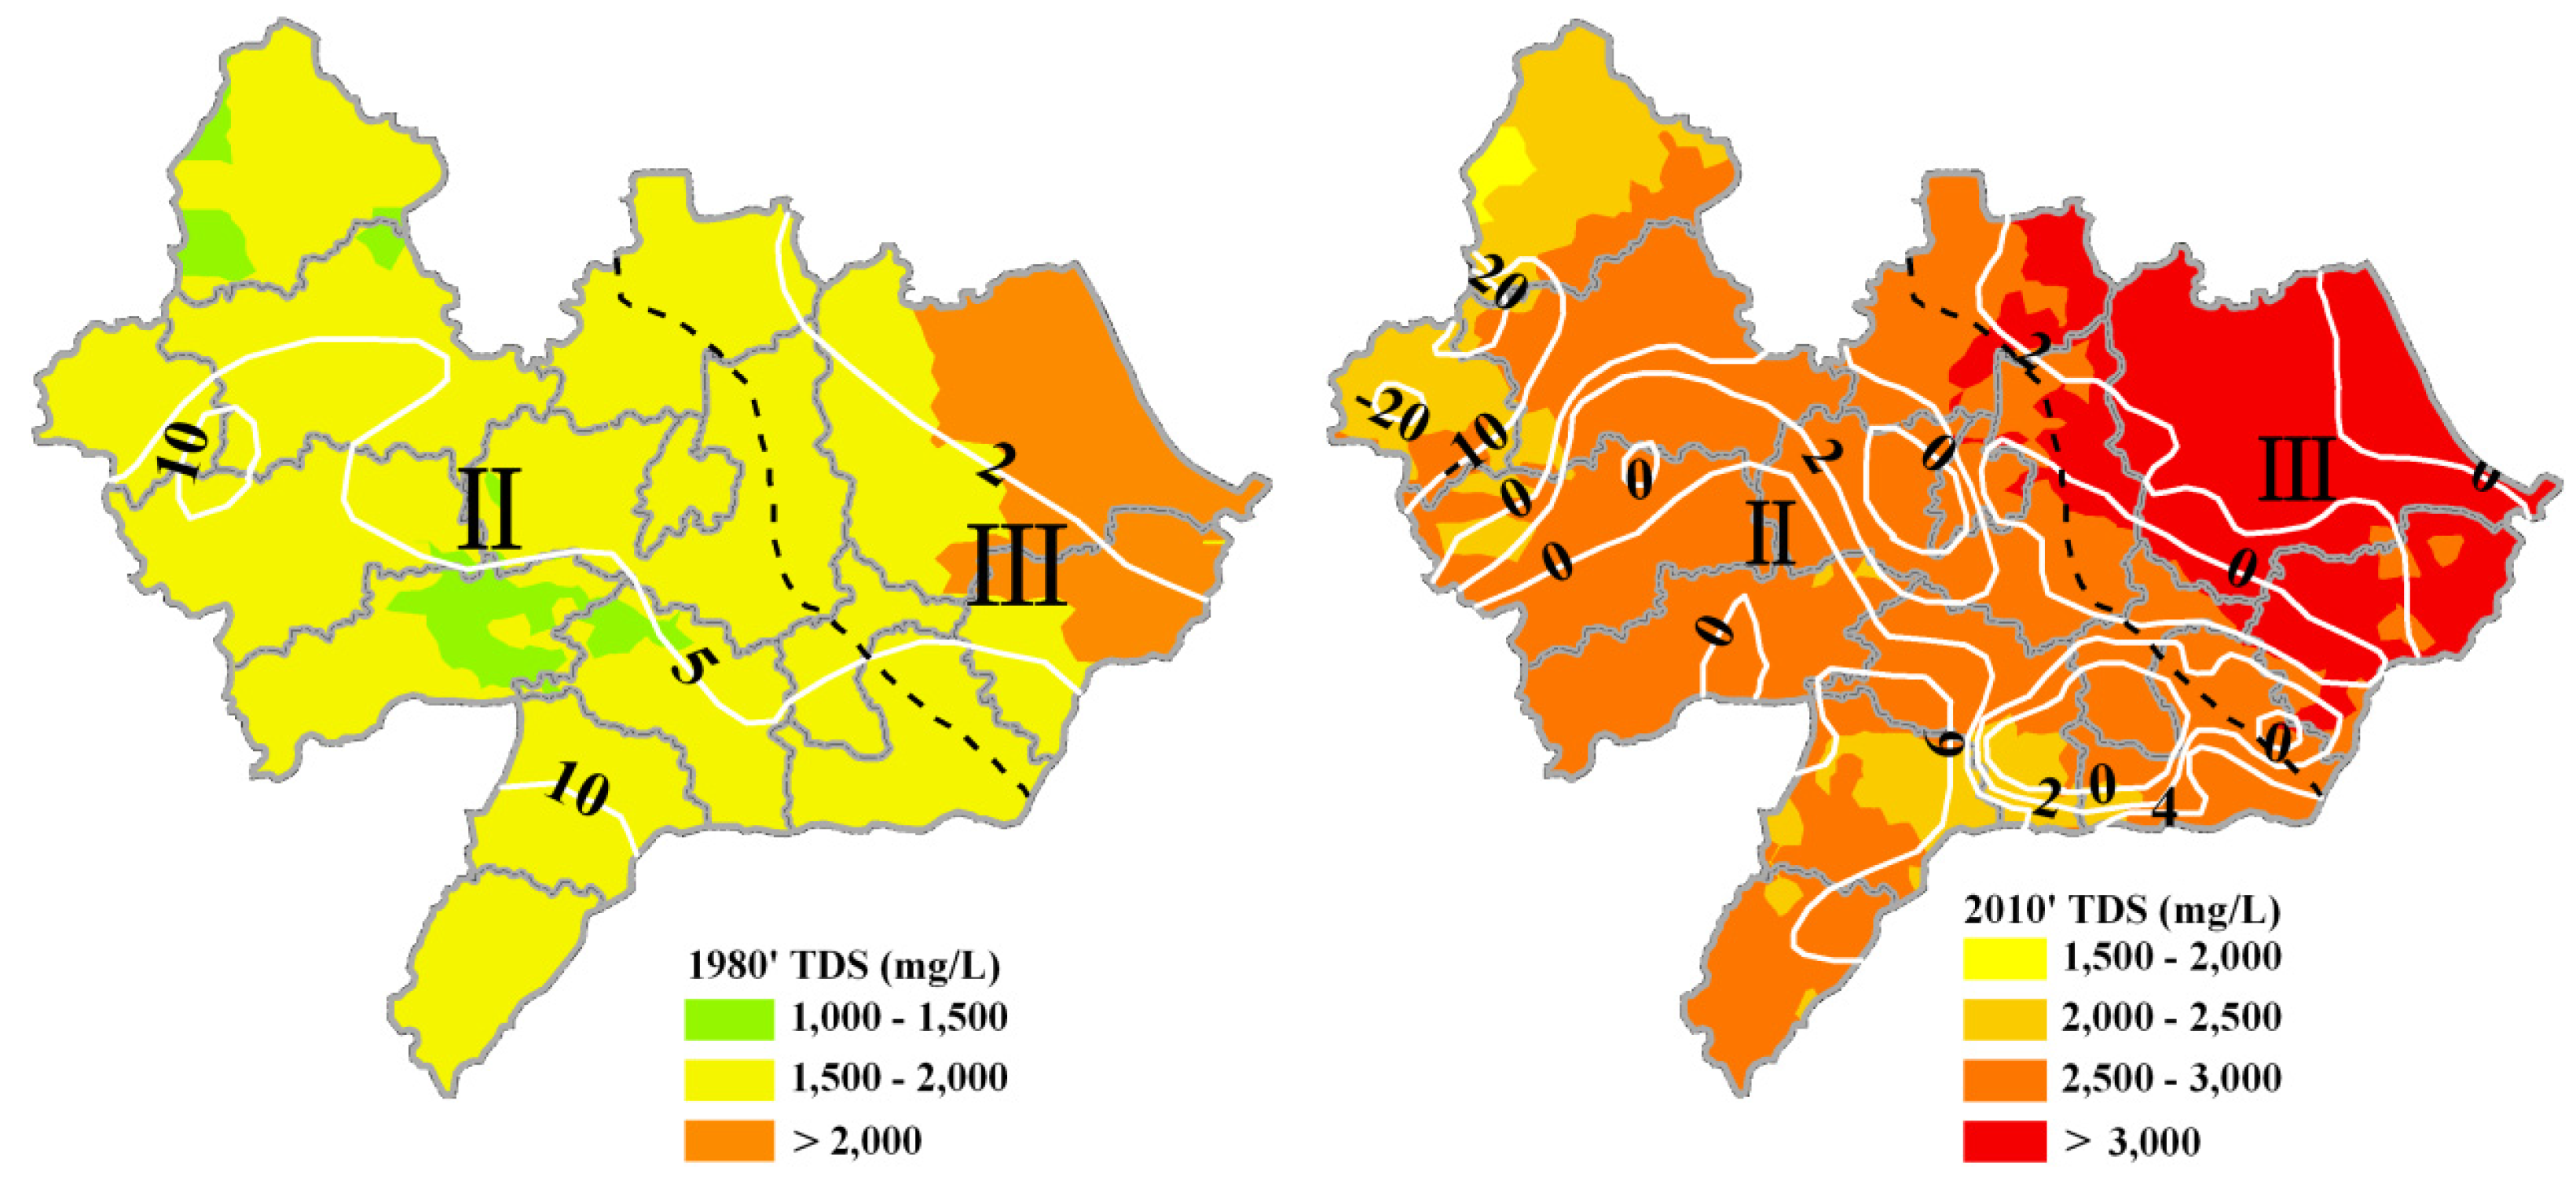
3.3. Spatial-Temporal Distribution of TDS in Shallow and Deep Groundwater

TDS is a manifestation of several dissolved constituents and considered a measure of salinity and an overall indicator of water quality, relating to taste and palatability [15,22]. In shallow groundwater, the concentration of TDS increases notably from 1689.37 mg/L in the 1980s to 2780.69 mg/L in the 2010s. Conversely, a relatively low increase of TDS is found in deep groundwater, with mean concentrations of 712.58, 943.19 and 1028.20 mg/L being observed in the 1960s, 1980s and 2010s, respectively (Figure 10). The increases of TDS in both shallow and deep groundwater indicate groundwater salinization tendency with time. To better understand the spatial-temporal distribution and evolution tendency of TDS in shallow and deep groundwater quality in the study area, spatial interpolation by both OK and COK are conducted. In this study, Na+ + K+ and Cl, which have the strongest correlation with TDS according to the correlation analyses results in Section 3.2, are considered as auxiliary variables.
Figure 10. TDS concentration distribution in shallow and deep groundwater among decades.
Water 07 01109 g010
Based on the cross-validation results shown in Table 4, the results of the COK are more accurate because of its smaller ME and MSE. Additionally, the MSSE of the COK is closer to one relative to the OK, indicating more optimal spatial interpolation. The spatial distributions of TDS in shallow and deep groundwater among decades are illustrated in Figure 11 and Figure 12. Different colors represent the variable ranges of the TDS concentration.
Table 4. Cross-validation results of TDS determined by ordinary kriging (OK) and co-kriging (COK). MSSE, mean-square standard error.
DecadesGroundwater TypeOKCOK
MEMSEMSSEOptimal ModelMEMSEMSSEOptimal Model
1960sdeep groundwater−0.0197220.31.13Spherical model−0.01756188.21.005Stable model
1980sshallow groundwater0.00283736.21.011Spherical model−0.001413734.11.003Spherical model
deep groundwater0.004293460.81.018Exponential model0.001011445.60.9958J-Bessel model
2010sshallow groundwater0.00413748621.181Spherical model−0.00190814850.9939K-Bessel model
deep groundwater0.04642358.11.011K-Bessel model0.03716316.60.9915J-Bessel model
Figure 11. Spatial distribution of TDS concentration in shallow groundwater in the 1980s and 2010s as determined by the COK (white lines in the figures are groundwater levels in 1984 and 2005. Modified from Zhang et al. [35]).
Water 07 01109 g011
Figure 12. Spatial distribution of TDS concentrations in deep groundwater in the 1960s, 1980s and 2010s as determined by the COK (white lines in the figures are groundwater levels in 1980 and 2005. Modified from Zhang et al. [35]).
Water 07 01109 g012
TDS increases remarkably with time in both shallow and deep groundwater, and the area with a high TDS concentration significantly expands from the 1960s to the 2010s, especially in the eastern part of the study area, which is contiguous with the Bohai Sea. These findings indicate groundwater salinization tendency in the study area. For shallow groundwater, TDS raises notably in the last few decades, as indicated by an area with TDS concentration ranges from 1500 to 2000 mg/L of about 11,553.5 km2 (79.76% of the total of study area) in the 1980s and an area of TDS concentration between 2500 and 3000 mg/L of about 8563.395 km2 observed in the 2010s (59.11% of the total area). For deep groundwater, the TDS increases from west to east, which is roughly in accordance with the groundwater flow direction in the last few decades (Figure 11 and Figure 12). The area with higher TDS concentrations in Zone III continually increases, while the area of relatively fresh water in Zone II decreases. The area of deep groundwater districts exceeding the TDS limit of 1000 mg/L specified in the Quality Standard for Groundwater of China (Level III) [59] increase from about 5366.39 km2 (37.05% of the total) in the 1960s to about 7183.52 km2 (49.59% of the total) in the 2010s, indicating continually increasing groundwater salinization in the study area in the last few decades.

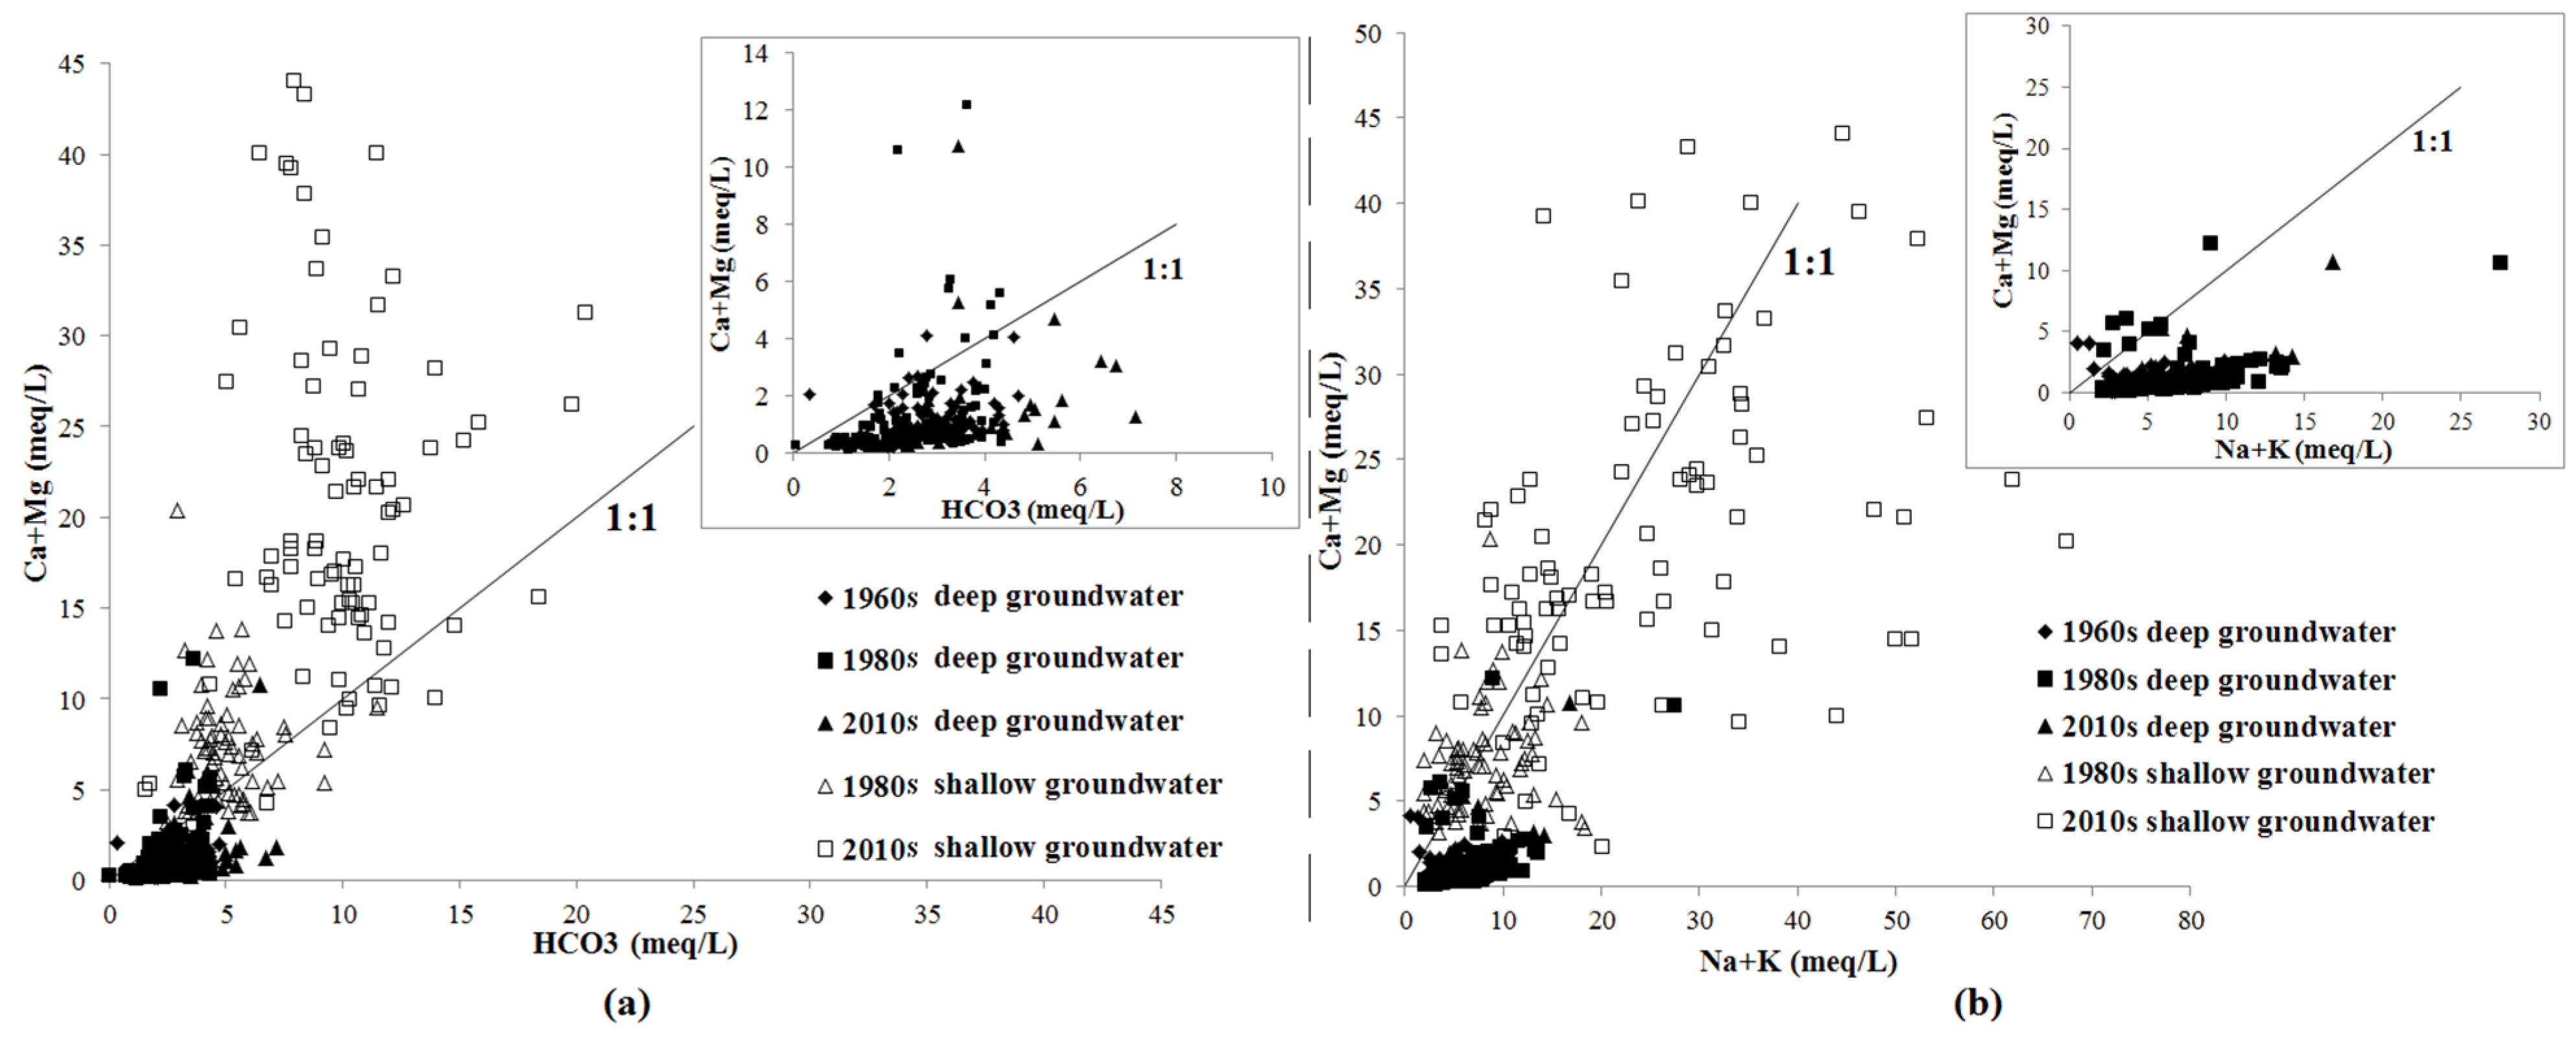
3.4. Discussion on the Major Factors Affecting Areal Groundwater Quality

Precipitation is the dominant source of groundwater in Cangzhou [31]. Based on the precipitation monitoring data [36] and simulation results of the water budget and storage depletion of groundwater in the NCP [25,60], precipitation and groundwater recharge in the NCP appear to fluctuate and decrease since the 1960s. Indeed, the mean annual precipitation decreased from 589 mm in 1960–1975 to 489 mm in 1997–2008, resulting in depletion of groundwater recoverable storage. Dissolution of soluble rocks can be considered to be in dynamic balance with groundwater flow and precipitation for a given time period, and decreased groundwater recharge leads to a decrease of relatively fresh water entering the groundwater, which may cause enrichment of groundwater components.
Water-rock and water-soil interactions significantly influence the content of groundwater major ions [40], and dissolution of soluble rocks by groundwater flow and long-term leaching of precipitation and irrigation may result in large amounts of soluble ions migrating into groundwater. Such dissolution has been attributed to increase groundwater TDS [61,62]. As discussed in Section 3.1, dissolution of calcite, dolomite, gypsum and halite affect notably the concentration distribution of Na+, Ca2+, Mg2+, Cl and SO42− in areal shallow and deep groundwater.
Owing to the rapid development of Cangzhou since the 1960s, demand for water sources has increased remarkably [29,31], and massive abstraction of groundwater changes the natural groundwater flow directions (Figure 11 and Figure 12) and leads to groundwater depression cone development in the central area of Cangzhou (southeast to the urban city area). Moreover, massive exploitation of deep groundwater has increased the water head differences between deep aquifers (Aquifer III, Figure 2 and Figure 3) and overlying aquifers (Aquifers I and II), strengthening the leakage from the upper aquifers to the deep aquifer and the migration of the saltwater contained in Aquifer II [34,63]. Zhang [34] stated that leakage recharge for deep groundwater was about 2.52 × 10⁸ m3/yr in Cangzhou, which accounted for about 46.67% of the total recharge of deep groundwater in 1991–2003. Mixing of deep groundwater (relatively fresh) with overlying leakage water (saltwater) may result in increased salt content and TDS in deep groundwater. Moreover, over-exploitation of deep groundwater may cause compression release of saltwater from aquitards between Aquifer II and III, contributing to deep groundwater salinization to some extent. In addition, water head differences between aquifers may cause not only downward migration of salt water from Aquifer II to Aquifer III, but also upward intrusion of salt water from Aquifer II to Aquifer I, although further evidence is needed to confirm this. To better understand the dominant factors that control areal groundwater quality evolution, long-term monitoring of groundwater hydrochemical changes and investigation of water head differences between aquifers should be conducted in the future.

4. Conclusions

Since the 1960s, major ions and TDS in both shallow and deep groundwater have increased continuously, resulting in a marked increase of the concentration of Na+ and Cl, indicating the salinization tendency of areal groundwater over the last few decades. From west to east, the groundwater hydrogeological types of deep groundwater shift from Cl.HCO3.SO4–Na, Cl.HCO3–Na and HCO3.Cl–Na.Mg to HCO3.Cl–Na, Cl.SO4–Na and Cl–Na, while the shallow groundwater types change from HCO3–Ca.Na.Mg, HCO3.Cl–Na, HCO3–Na.Mg.Ca and Cl.SO4–Na.Mg to HCO3.Cl–Na, Cl.SO4–Na and Cl–Na, which are roughly stable with time. Water-rock interactions are dominant factors that control the content of major ions in local groundwater. Dissolution of dolomite, calcite, feldspar and gypsum are the primary origins of major ions in groundwater, and the cation exchange reactions have significant effects on the levels of Ca2+, Mg2+ and Na+, especially in deep groundwater. Increasing TDS in groundwater and expansion of the high TDS area are observed over time, indicating that groundwater salinization is occurring. Decreased precipitation, water-rock interactions and over-exploitation of groundwater may be the primary reasons for groundwater salinization in the study area. Additionally, massive abstraction of groundwater from the deep aquifer (Aquifer III in Cangzhou) may cause salt water in Aquifer II to migrate downward or upward to adjacent aquifers, which likely leads to the deterioration of areal groundwater quality. The results present herein will facilitate the development of plans to sustainably use and protect local groundwater. Moreover, further studies to identify the factors dominating groundwater quality are warranted.

Acknowledgments

This work was supported by the Major State Basic Research Development Program of China (973 Program NO. 2010CB428801, 2010CB428804-2) and the National Environmental Protection Public Welfare Industry Targeted Research Fund, People’s Republic of China (NO. 201309003). We gratefully acknowledged the Hebei Hydrology and Water Resources Survey Bureau and 4th Team of Hydrogeology and Engineering Geology of Hebei Province for providing the historical data, and we would like to thank Zhiyu Li, Jianhui Zhao, Min Zhang, Xiaohui Qiao, Yang Wang, Hongtao Mao and Liu Bo for their significant contributions to groundwater sampling and testing.

Author Contributions

Both authors contributed to the conception and development of this manuscript.

Conflicts of Interest

The authors declare no conflict of interest.

References

  1. United Nations Educational, Scientific and Cultural Organization (UNESCO). Groundwater Resources of the World and Their Use; UNESCO: Paris, France, 2004. [Google Scholar]
  2. World Health Orgnization (WHO). UN-Water Global Analysis and Assessment of Sanitation and Drinking-Water; The Challenge of Extending and Sustaining Services; WHO: Geneva, Switzerland, 2012. [Google Scholar]
  3. United Nations Educational, Scientific and Cultural Organization (UNESCO). Water, Cultural Diversity and Global Environmental Change; UNESCO: Paris, France, 2012. [Google Scholar]
  4. Ravenscroft, P.; McArthur, J.M.; Hoque, M.A. Stable groundwater quality in deep aquifers of Southern Bangladesh: The case against sustainable abstraction. Sci. Total Environ. 2013, 454–455, 627–638. [Google Scholar] [CrossRef] [PubMed]
  5. Mtoni, Y.; Mjemah, I.C.; Bakundukize, C.; van Camp, M.; Martens, K.; Walraevens, K. Saltwater intrusion and nitrate pollution in the coastal aquifer of Dares Salaam, Tanzania. Environ. Earth Sci. 2013, 70, 1091–1111. [Google Scholar] [CrossRef]
  6. Yakirevich, A.; Weisbrod, N.; Kuznetsov, M.; Rivera Villarreyes, C.A.; Benavent, I.; Chavez, A.M.; Ferrando, D. Modeling the impact of solute recycling on groundwater salinization under irrigated lands: A study of the Alto Piura aquifer, Peru. J. Hydrol. 2013, 482, 25–39. [Google Scholar] [CrossRef]
  7. Onodera, S.-I.; Saito, M.; Sawano, M.; Hosono, T.; Taniguchi, M.; Shimada, J.; Umezawa, Y.; Lubis, R.F.; Buapeng, S.; Delinom, R.; et al. Erratum to “effects of intensive urbanization on the intrusion of shallow groundwater into deep groundwater: Examples from Bangkok and Jakarta”. Sci. Total Environ. 2009, 407, 3209–3217. [Google Scholar] [CrossRef] [PubMed]
  8. Khan, S.; Shahnaz, M.; Jehan, N.; Rehman, S.; Shah, M.T.; Din, I. Drinking water quality and human health risk in Charsadda district, Pakistan. J. Clean. Prod. 2013, 60, 93–101. [Google Scholar] [CrossRef]
  9. Parameswari, K.; Mudgal, B.V. Geochemical investigation of groundwater contamination in Perungudi dumpsite, South India. Arab. J. Geosci. 2013, 7, 1363–1371. [Google Scholar] [CrossRef]
  10. Ma, L.; Qin, X.; Sun, N.; Yang, G. Human health risk of metals in drinking-water source areas from a forest zone after long-term excessive deforestation. Hum. Ecol. Risk Assess. 2014, 20, 1200–1212. [Google Scholar] [CrossRef]
  11. Triki, I.; Trabelsi, N.; Zairi, M.; Dhia, H.B. Multivariate statistical and geostatistical techniques for assessing groundwater salinization in Sfax, a coastal region of eastern Tunisia. Desalin. Water Treat. 2014, 52, 1980–1989. [Google Scholar] [CrossRef]
  12. Trabelsi, R.; Zairi, M.; Dhia, H.B. Groundwater salinization of the Sfax superficial aquifer, Tunisia. Hydrogeol. J. 2007, 15, 1341–1355. [Google Scholar] [CrossRef]
  13. Cruz, J.V.; Coutinho, R.; Pacheco, D.; Cymbron, R.; Antunes, P.; Freire, P.; Mendes, S. Groundwater salinization in the Azores archipelago (Portugal). Environ. Earth Sci. 2010, 62, 1273–1285. [Google Scholar] [CrossRef]
  14. Ahmed, M.A.; Abdel Samie, S.G.; Badawy, H.A. Factors controlling mechanisms of groundwater salinization and hydrogeochemical processes in the Quaternary aquifer of the Eastern Nile Delta, Egypt. Environ. Earth Sci. 2012, 68, 369–394. [Google Scholar] [CrossRef]
  15. Chaudhuri, S.; Ale, S. Long term (1960–2010) trends in groundwater contamination and salinization in the Ogallala aquifer in Texas. J. Hydrol. 2014, 513, 376–390. [Google Scholar] [CrossRef]
  16. Guo, H.; Yang, S.; Tang, X.; Li, Y.; Shen, Z. Groundwater geochemistry and its implications for arsenic mobilization in shallow aquifers of the Hetao Basin, Inner Mongolia. Sci. Total Environ. 2008, 393, 131–144. [Google Scholar] [CrossRef] [PubMed]
  17. Nouri, J.; Mahvi, A.H.; Jahed, G.R.; Babaei, A.A. Regional distribution pattern of groundwater heavy metals resulting from agricultural activities. Environ. Geol. 2007, 55, 1337–1343. [Google Scholar] [CrossRef]
  18. Shah, B.A. Arsenic in groundwater, Quaternary sediments, and suspended river sediments from the Middle Gangetic Plain, India: Distribution, field relations, and geomorphological setting. Arab. J. Geosci. 2013, 7, 3525–3536. [Google Scholar] [CrossRef]
  19. Pradhan, J.K.; Kumar, S. Informal e-waste recycling: Environmental risk assessment of heavy metal contamination in Mandoli industrial area, Delhi, India. Environ. Sci. Pollut. Res. Int. 2014, 21, 7913–7928. [Google Scholar] [CrossRef] [PubMed]
  20. Su, A.; Chen, Z.; Liu, J.; Wei, W. Sustainability of intensively exploited aquifer systems in the North China Plain: Insights from multiple environmental tracers. J. Earth Sci. 2014, 25, 605–611. [Google Scholar] [CrossRef]
  21. Mudiam, M.K.; Pathak, S.P.; Gopal, K.; Murthy, R.C. Studies on urban drinking water quality in a tropical zone. Environ. Monit. Assess. 2012, 184, 461–469. [Google Scholar] [CrossRef] [PubMed]
  22. Chaudhuri, S.; Ale, S. Temporal evolution of depth-stratified groundwater salinity in municipal wells in the major aquifers in Texas, USA. Sci. Total Environ. 2014, 472, 370–380. [Google Scholar] [CrossRef] [PubMed]
  23. Alley, W.M.; Healy, R.W.; LaBaugh, J.W.; Reilly, T.E. Flow and storage in groundwater systems. Science 2002, 296, 1985–1990. [Google Scholar] [CrossRef] [PubMed]
  24. Zheng, C.; Liu, J.; Cao, G.; Kendy, E.; Wang, H.; Jia, Y. Can China cope with its water crisis? Perspectives from the North China Plain. Ground Water 2010, 48, 350–354. [Google Scholar] [CrossRef] [PubMed]
  25. Cao, G.; Zheng, C.; Scanlon, B.R.; Liu, J.; Li, W. Use of flow modeling to assess sustainability of groundwater resources in the North China Plain. Water Resour. Res. 2013, 49, 159–175. [Google Scholar] [CrossRef]
  26. Hydrogeological Information of Hebei Province, China. Available online: http://www.hbsw.net/news/wenxuezuopin/2008711/0871110JDAH43I81JG12K8689AJ.html (accessed on 25 September 2014).
  27. United Nations Educational, Scientific and Cultural Organization (UNESCO). World Water Resources, a New Appraisal and Assessment for the 21st Century; UNESCO: Paris, France, 1998. [Google Scholar]
  28. Han, Z.T.; Wang, P.; Zhang, W.; Xia, W.Z.; Ma, L.S.; Li, Y.S.; Zhang, F.W. Analysis of the evolvement of deep confined groundwater depression cone and water supply strategy for Cangzhou area. Hydrol. Eng. Geo. 2013, 40, 29–33. (In Chinese) [Google Scholar]
  29. Li, Y.S.; Fei, Y.H.; Qian, Y.; Jian, M.; Han, Z.T.; Wang, P.; Zhang, Z.J. Discussion on evolution characteristics and formation mechanism of deep groundwater depression cone in Cangzhou region. J. Arid Land Resour. Environ. 2013, 27, 181–184. (In Chinese) [Google Scholar]
  30. Fu, X.G.; Lei, D.L.; Liu, W.C. Relationship and control countermeasures between land subsidence and groundwater depression cones in Cangzhou. In Proceedings of the Chinese Hydraulic Engineering Society Academic Annual Conference in 2003, Beijing, China, 11–13 November 2003; pp. 110–115. (In Chinese)
  31. Lv, Q.Y. Analysis of annual characteristics and utilization status of water resources in Cangzhou. Groundwater 2014, 36, 157–160. (In Chinese) [Google Scholar]
  32. Zhang, K.Y.; Zhang, C.H.; Zhamg, L. Hydraulic characteristics of Cangzhou. Water Conserv. Sci. Technol. Econ. 2010, 16, 1211–1212. (In Chinese) [Google Scholar]
  33. Zhang, Z.H.; Shen, Z.L.; Xue, Y.Q.; Ren, H.F.; Shi, D.H. Evolution of Groundwater Environment in North China Plain; Geology Press: Beijing, China, 2000; pp. 6–7, 35–57, 75–77. (In Chinese) [Google Scholar]
  34. Zhang, Z.J.; Fei, Y.H.; Chen, Z.Y.; Zhao, Z.Z.; Xie, Z.H. Investigation and Assessment of the Sustainable Utilization of Groundwater Resources in North China Plain; Geology Press: Beijing, China, 2009; pp. 59–81. (In Chinese) [Google Scholar]
  35. Zhang, Z.J.; Fei, Y.H. Atlas of Sustainable Utilization of Groundwater in North China Plain; China Map Press: Beijing, China, 2009; pp. 50–51. (In Chinese) [Google Scholar]
  36. National Geological Archives of China. Available online: http://www.ngac.cn/Zlml.aspx?KeyType=1&Key=%u6CA7%u5DDE (accessed on 25 September 2014).
  37. Ministry of Health, China (MHO). Standard Examination Methods for Drinking Water-General Principles; MHO: Beijing, China, 2006.
  38. Piper, M. A graphical procedure in the geochemical interpretation of water analysis. Am. Geophys. Union 1944, 25, 914–928. [Google Scholar] [CrossRef]
  39. Wang, S. Groundwater quality and its suitability for drinking and agricultural use in the Yanqi Basin of Xinjiang Province, Northwest China. Environ. Monit. Assess. 2013, 185, 7469–7484. [Google Scholar] [CrossRef] [PubMed]
  40. Purushothaman, P.; Someshwar Rao, M.; Rawat, Y.S.; Kumar, C.P.; Krishan, G.; Parveen, T. Evaluation of hydrogeochemistry and water quality in Bist-Doab region, Punjab, India. Environ. Earth Sci. 2013, 72, 693–706. [Google Scholar] [CrossRef]
  41. Alderman, J.H.; Hudak, P.F.; Acevedo, M. Chemical ratios and groundwater contamination in East Texas. Bull. Environ. Contam. Toxicol. 2002, 69, 793–799. [Google Scholar] [CrossRef] [PubMed]
  42. Lee, J.Y.; Song, S.H. Evaluation of groundwater quality in coastal areas: Implications for sustainable agriculture. Environ. Geol. 2007, 52, 1231–1242. [Google Scholar] [CrossRef]
  43. Kharroubi, A.; Tlahigue, F.; Agoubi, B.; Azri, C.; Bouri, S. Hydrochemical and statistical studies of the groundwater salinization in Mediterranean arid zones: Case of the Jerba coastal aquifer in southeast Tunisia. Environ. Earth Sci. 2012, 67, 2089–2100. [Google Scholar] [CrossRef]
  44. Guo, Y.; Huang, C.; Pang, J.; Zha, X.; Li, X.; Zhang, Y. Concentration of heavy metals in the modern flood slackwater deposits along the upper Hanjiang River valley, China. Catena 2014, 116, 123–131. [Google Scholar] [CrossRef]
  45. Yuan, X.; Zhang, L.; Li, J.; Wang, C.; Ji, J. Sediment properties and heavy metal pollution assessment in the river, estuary and lake environments of a fluvial plain, China. Catena 2014, 119, 52–60. [Google Scholar] [CrossRef]
  46. Zhang, X.; Qian, H.; Chen, J.; Qiao, L. Assessment of groundwater chemistry and status in a heavily used semi-arid region with multivariate statistical analysis. Water 2014, 6, 2212–2232. [Google Scholar] [CrossRef]
  47. Sadat Noori, S.M.; Ebrahimi, K.; Liaghat, A.-M.; Hoorfar, A.-H. Comparison of different geostatistical methods to estimate groundwater level at different climatic periods. Water Environ. J. 2013, 27, 10–19. [Google Scholar] [CrossRef]
  48. Arslan, H. Estimation of spatial distrubition of groundwater level and risky areas of seawater intrusion on the coastal region in Carsamba Plain, Turkey, using different interpolation methods. Environ. Monit. Assess. 2014, 186, 5123–5134. [Google Scholar] [CrossRef] [PubMed]
  49. Babak, O.; Deutsch, C.V. Improved spatial modeling by merging multiple secondary data for intrinsic collocated cokriging. J. Petrol. Sci. Eng. 2009, 69, 93–99. [Google Scholar] [CrossRef]
  50. Wu, C.; Wu, J.; Luo, Y. Spatial prediction of soil organic matter content using cokriging with remotely sensed data. Soil Sci. Soc. Am. J. 2009, 73, 1202–1208. [Google Scholar] [CrossRef]
  51. Ghadermaz, I.J.; Sayyad, G.; Mohammadi, J. Spatial prediction of nitrate concentration in drinking water using pH as auxiliary cokriging variable. Procedia Environ. Sci. 2013, 3, 130–135. [Google Scholar] [CrossRef]
  52. Ahmed, S.; de Marsily, G.; Talbot, A. Combined use of hydraulic and electrical properties of an aquifer in a geostatistical estimation of transmissivity. Groundwater 1988, 26, 78–86. [Google Scholar] [CrossRef]
  53. Xing, L.; Guo, H.; Zhan, Y. Groundwater hydrochemical characteristics and processes along flow paths in the North China Plain. J. Asian Earth Sci. 2013, 70–71, 250–264. [Google Scholar]
  54. Zhan, Y.; Guo, H.; Wang, Y.; Li, R.; Hou, C.; Shao, J.; Cui, Y. Evolution of groundwater major components in the Hebei Plain: Evidences from 30-year monitoring data. J. Earth Sci. 2014, 25, 563–574. [Google Scholar] [CrossRef]
  55. Chen, W.H.; Nie, M.Y. Quaternary Geology in Hebei; Geological Publish House: Beijing, China, 1987. (In Chinese) [Google Scholar]
  56. Spears, D.A. Mineralogical control of the chemical evolution of groundwater. In Solute Processes; Wiley: Chichester, UK, 1986; p. 512. [Google Scholar]
  57. El Mejri, H.; Ben Moussa, A.; Zouari, K. The use of hydrochemical and environmental isotopic tracers to understand the functioning of the aquifer system in the Bou Hafna and Haffouz regions, Central Tunisia. Quat. Int. 2014, 338, 88–98. [Google Scholar]
  58. Sajil Kumar, P.J.; Jegathambal, P.; James, E.J. Factors influencing the high fluoride concentration in groundwater of Vellore District, South India. Environ. Earth Sci. 2014, 72, 2437–2446. [Google Scholar]
  59. Ministry of Environmental Protection, China (MEP). Quality Standard for Ground Water; MEP: Beijing, China, 1993.
  60. Cao, G.; Han, D.; Song, X. Evaluating actual evapotranspiration and impacts of groundwater storage change in the North China Plain. Hydrol. Process. 2014, 28, 1797–1808. [Google Scholar] [CrossRef]
  61. Al-Harbi, M.; AL-Ruwaih, F.M.; Alsulaili, A. Statistical and analytical evaluation of groundwater quality in Al-Rawdhatain field. Environ. Prog. Sustain. 2014, 33, 895–904. [Google Scholar] [CrossRef]
  62. Umar, M.; Waseem, A.; Sabir, M.A.; Kassi, A.M.; Khan, A.S. The impact of geology of recharge areas on groundwater quality: A case study of Zhob River Basin, Pakistan. Clean Soil Air Water 2013, 41, 119–127. [Google Scholar] [CrossRef]
  63. Fei, Y.H.; Zhang, Z.J.; Song, H.B.; Qian, Y.; Chen, J.S.; Meng, S.H. Discussion of vertical variations of saline groundwater and mechanism in North China Plain. Water Resour. Prot. 2009, 26, 21–23. (In Chinese) [Google Scholar]

