
Experiments and Numerical Simulations of Dike Erosion due to a Wave Impact


Dipartimento di Ingegneria Civile e Meccanica, Università di Cassino e del Lazio Meridionale, via G. Di Biasio, 43, Cassino (FR) 03043, Italy
Water 2015, 7(10), 5831-5848; https://doi.org/10.3390/w7105831
Submission received: 4 August 2015
/
Revised: 16 October 2015
/
Accepted: 19 October 2015
/
Published: 23 October 2015
Abstract
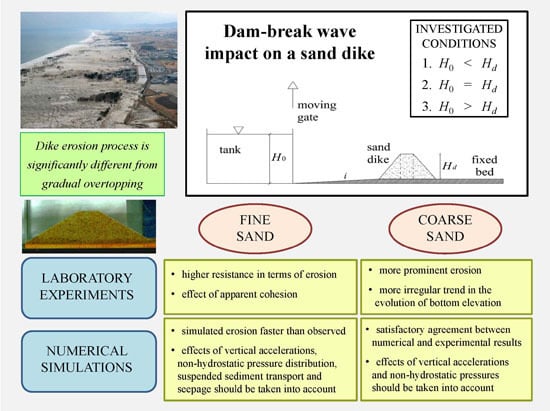
:Dike erosion is a crucial issue in coastal and fluvial flood risk management. These defense structures appear vulnerable to extreme hydrological events, whose potential occurrence risk seems to be recently increased due to climate change. Their design and reinforcement is, however, a complex task, and although numerical models are very powerful nowadays, real processes cannot be accurately predicted; therefore, physical models constitute a useful tool to investigate different features under controlled conditions. This paper presents some laboratory experimental results of erosion of a sand dike produced by the impact of a dam break wave. Experiments have been conducted in the Water Engineering Laboratory at the University of Cassino and Southern Lazio, Italy, in a rectangular channel: here, the sudden opening of a gate forming the reservoir generates the wave impacting the dike, made in turn of two different, almost uniform sands. The physical evidence proves that the erosion process is strongly unsteady and significantly different from a gradual overtopping and highlights the importance of apparent cohesion for the fine sand dike. The experimental results have also been compared against the ones obtained through the numerical integration of a two-phase model, which shows the reasonable predictive capability of the temporal free surface and dike profile evolution.
1. Introduction
Dikes (embankments or levees) are widely used along rivers and coasts as defense structures against flooding, tides and direct waves. Their correct design and reinforcement is, therefore, crucial in risk management and damage prevention [1] on the occasion of extreme hydrological events, whose occurrence risk has recently been increased due to climate change [2]. From this perspective, it is very important to understand the mechanisms of internal and overtopping erosion and consequent failure of dikes. This is, however, still a complex task, and despite the potential power of numerical models, some physical processes cannot yet be accurately predicted due to the complexity of real phenomena. Physical models, therefore, constitute a useful tool to investigate different features under controlled conditions and help in validating numerical models or assisting the design processes.
The results of several experimental studies on embankment failures, especially due to overtopping flows, which are statistically their main cause, have been presented in the literature. One of the first attempts to investigate the damage of a dike by overtopping through field and laboratory experiments was due to Tinney and Hsu [3], who showed how the washout rate is a function of the grain size. Simmler and Sametz [4] highlighted, instead, the dependence of the erosion process on the dam geometry and the volume of water in the reservoir. A significant contribution to research on embankment erosion due to overflow was given by Powledge et al. [5], who identified three main hydraulic and erosion zones. Chinnarasri et al. [6] discussed flow patterns and progressive damage of a dike by overtopping, highlighting also the sliding effect that may accompany erosion. These and other works [7,8,9] prove that a significant laboratory effort is required, and often, available experimental results may only be applied to specific scenarios. Scaling problems related to material type and breach formation have been discussed by Schmocker and Hager [10] in a systematic campaign of laboratory tests (see also [11]). Further experiments have been performed also by Cao et al. [12], with different inflow discharges, dam compositions and geometry and initial breach dimensions. Pickert et al. [13] pointed out that the apparent cohesion due to pore-water pressure influences the stability of side slopes. More recently, large-scale experiments of overtopping breach were performed by Kakinuma and Shimizu [14] on an experimental flume located on the floodway of an actual river channel. Feliciano et al. [15] studied the effects of soil properties on levee breach by overtopping with the aim of increasing the resistance to levee failure, whereas Schmocker et al. [16] also experimentally investigated the effect of the grain size distribution.
On the other side, several numerical simulations of embankment failure due to overtopping have also been performed, in the attempt to reproduce the evolution of the process. A large study on the mechanics of embankment overflow erosion was conducted by Powledge et al. [5]. Tingsanchali and Chinnarasri [17] developed a one-dimensional (1D) numerical model involving slope stability analyses, whereas a three-dimensional (3D) slope stability model was developed by Wang and Bowles [18], who also considered cohesion effects. Gotoh et al. [19,20] introduced the moving-particle semi-implicit method to predict the erosion rate. Balmforth [21] investigated the breaches of natural moraine dams due to wave-induced erosion. Pontillo et al. [22] applied a two-phase model to simulate laboratory tests and tested the effectiveness of the corrections [23] necessary to take into account the streamline curvature effect. A dual-mesh approach was utilized by Voltz et al. [24], who also accounted for suspended-load transport. Van Emelen [25] investigated the ability of numerical models to simulate dike failure by overtopping, comparing the results obtained by making use of different models and sediment transport formulations. An interesting model has been proposed by Mizutani et al. [1], who also took into account the effects of saturation and sediment size of embankment materials on the erosion process and, specifically, the effects of infiltration and resisting shear stresses due to the suction of unsaturated grains. Two-dimensional (2D) full shallow-water models for embankment breach have also been recently developed by Guan et al. [26] and by Kakinuma and Shimizu [27].
Despite the several efforts in numerically reproducing the main features of the process, dike failure due to overtopping is still poorly understood: most of the adopted numerical models cannot accurately reproduce the time evolution of the dike, and problems with the predictions highlighted the need for further investigation. The real process is, in fact, very complex to model, since it requires taking into account the interactions between hydrologic elements, hydrodynamics, sediment transport processes and geotechnical aspects, such as infiltration and embankment stability on a steep bed slope. Numerical models are usually 1D and depth averaged and assume a steady flow, a hydrostatic distribution of pressures, a non-cohesive material constituting the dike and sediment transport as bed load, whereas the real process is 3D, with significant effects of vertical velocities and streamline curvature, unsteady flow, not always neglectable cohesion and considerable suspended load sediment transport. The coupling between the unsteady flow and the erodible bottom evolution makes the modeling of real phenomena very difficult.
A common feature of the above-cited studies is the consideration of a constant inflow during the overtopping process. The aim of the present work is, instead, to investigate a significantly different condition, in which the impact of a sudden wave provokes the dike overtopping. The consequent erosion process, in fact, is certainly affected by the fact that the overtopping does not occur in steady conditions, but rather, in strongly unsteady ones [28]. The pursued objective is to provide a contribution to understanding the evolution of the wave overtopping and consequent dike erosion processes, with a new view toward dynamic waves.
To this aim, an experimental study has been conducted in the Water Engineering Laboratory (LIA Lab) at the University of Cassino and Southern Lazio, Cassino (FR), Italy. Small-scale laboratory experiments have been performed in a horizontal rectangular channel [29,30].
The specific scenario combines a dam break (simulated through the sudden opening of a gate in an upstream reservoir) and the consequent overtopping of a downstream trapezoidal sand dike, built upon a wooden ramp. Tests have been performed starting from different initial water levels in the reservoir and using two different almost uniform, non-cohesive sands [31] for the dike structure. The evolution of the dam break wave and the closely-connected evolution of the dike profile are investigated through image analysis measuring techniques.
Experimental data have been also used to test the predictive capability of a numerical code based on a morphodynamic depth-integrated two-phase approach [28] and here adopted for the simulations. The model neglects cohesion, suspended load sediment transport and seepage effects, but it is still capable of catching some features of the physical evidence and, thus, offering some indications for prediction and practical use.
2. Methodology
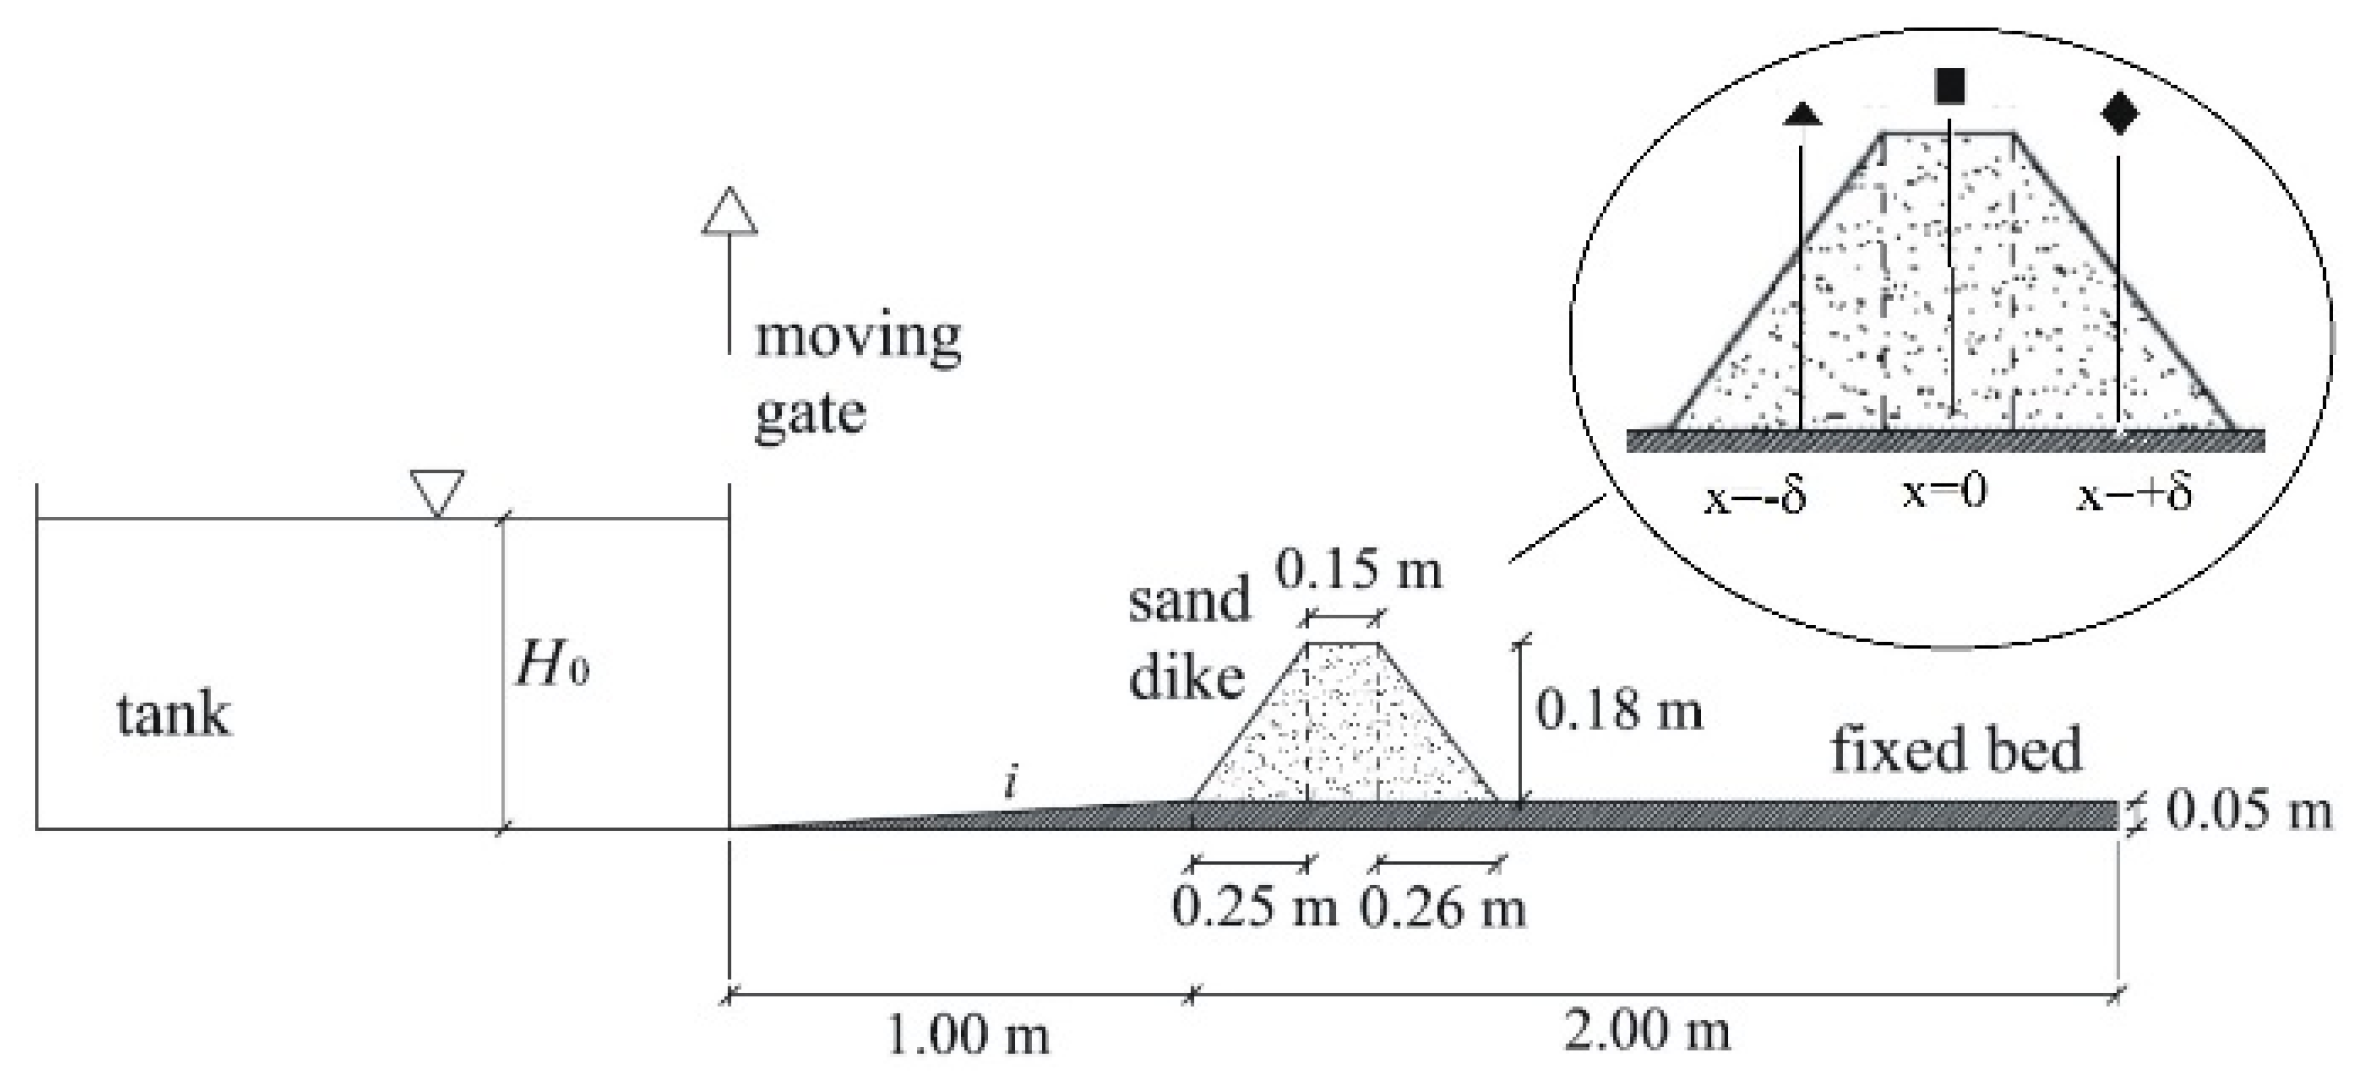
A set of small-scale laboratory experiments on dike erosion due to the impact of a dam-break wave have been carried out in the LIA Lab in a Perspex horizontal channel, with transparent walls and a 0.40 m-wide rectangular cross-section. A sketch of the experimental facility is illustrated in Figure 1 and Figure 2, in which H0 represents the water level in the upstream tank and Hd is the height of the dike.
Figure 1.
Sketch of the laboratory physical model (lateral view).

Figure 2.
Sketch of the laboratory setup (overtop view).
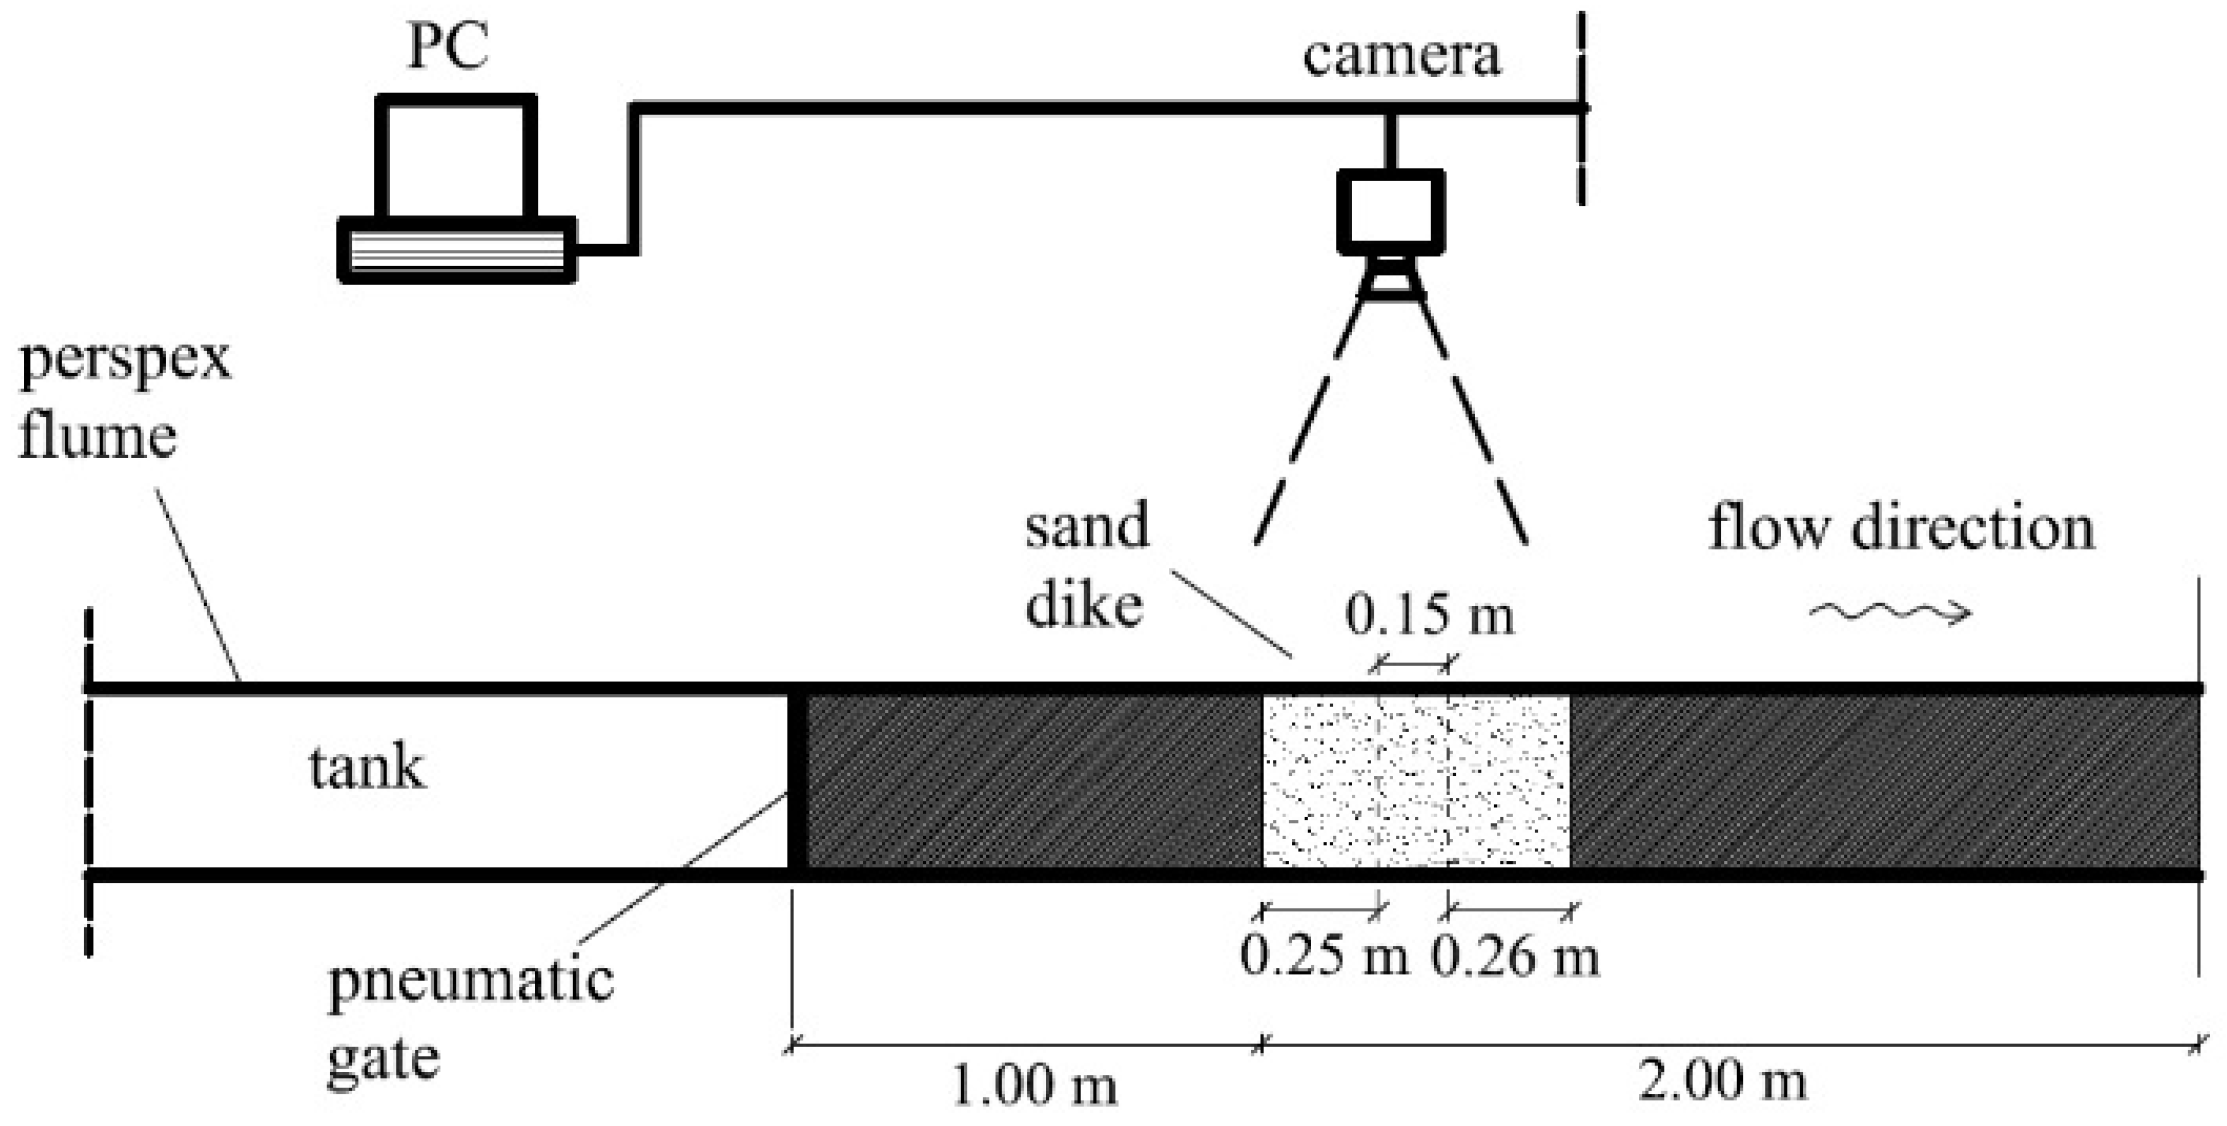
Water is stored in a 3.00 m-long reservoir, closed downstream with a moving gate. The sudden vertical removal of the gate produces the dam break flow, which propagates over the downstream channel bottom. According to the criterion provided by Lauber and Hager [32], the gate opening can be considered instantaneous. The rigid bed is composed of a first segment, characterized by a mild slope (5%) for a length of 1.00 m and a subsequent 2.00 m-long, 0.05 m-thick horizontal segment, upon which the sand dike is built.
The dike is made, in turn, of two different sands. The granulometric curve is very sharp for both materials, and therefore, the d50 is assumed as the characteristic diameter for each sand. The first sand, which is denoted in the following as “fine sand” or “Sand A”, is characterized by a mean diameter of 0.20 mm, a density ρs = 2680 kg/m3 and an internal friction angle (measured through laboratory tests) of 36°. The second one, referred to in the following as “coarse sand” or “Sand B”, has a particle mean diameter of 1.60 mm, a density ρs = 2560 kg/m3 and an internal friction angle of 41°.
Three different tests have been conducted for each sand with initial water levels in the reservoir equal to, respectively, 0.20, 0.25 and 0.395 m (Table 1). The initial geometry of the dike, instead, has been kept fixed for all tests, and in particular, the dike height Hd is equal to 0.179 m.
In each test, for both sands, the dike has been built with subsequent layers, each about 0.05 m high, over which a minimal compaction has been operated. The water content of the sand has been previously slightly increased in order to improve the stability of the material and shape of the dike, as intended. The repeatability of tests has been also verified by reiterating each experiment at least twice.

| H0 (cm) | Test | |
|---|---|---|
| Fine Sand | Coarse Sand | |
| 0.20 | A1 | B1 |
| 0.25 | A2 | B2 |
| 0.395 | A3 | B3 |
A computer-controlled camera is positioned laterally with respect to the channel with transparent walls, in order to record the evolution of the water wave produced by the gate opening and of the dike erosion process. The acquisition frame rate is 14.5 Hz.
Preliminary tests demonstrated that the process may be considered approximately 1D. In fact, friction at the lateral interface of the channel is limited, with no significant wall effects observed. The flow overtops the entire dike width, so that the dike undergoes an almost plane process. To this aim, it is essential also that the dike crest is perfectly horizontal. The longitudinal section detected from the images on the sidewall can be, thus, assumed as representative of any other longitudinal section in the flow. A regular grid is also attached to the channel walls in order to permit proper rectification and scaling of the recorded images and, consequently, the correct measurement operation.
For each frame, the water surface and the dike profiles along the channel are, therefore, evaluated through a specifically-developed image analysis technique, which makes use of pre-processing and edge-detection tool software, also useful for the fast and objective processing of a great number of images [33,34]. The adopted reference frame axes coincide with the channel bottom and the gate position in the longitudinal and vertical directions, respectively.
In this way, the evolution of the time- and space-dependent processes can be properly evaluated.
The results of the laboratory experimental campaign have been utilized to validate the capability of a numerical model by Greco et al. [28] (see also [34,35]) of predicting the physical evidence. The above-described experiments have been reproduced numerically, in order to check if the model could be hereafter reliable for analyzing a greater number of scenarios.
The model, here used for the simulation of the process, is based on a depth-integrated two-phase approach, under the assumptions of the hydrostatic distribution of pressures, bed load sediment transport and a uniform and non-cohesive sediment, and includes a geo-failure operator [35,36]. Conservation equations of mass and momentum are written for the water and solid phases separately, with a closure relation for the bed deformation rate.
The numerical integration of the model is performed using a mixed cell-centered and node-centered finite-volume discretization over unstructured triangular meshes and the first-order Harten-Lax-Van Leer (HLL) solver for the flux calculation [37], evolved to a second-order one for the water surface elevation [32], with a specific wet-dry treatment [38]. This model includes also a geo-failure operator that permits reproducing the failure mechanisms induced by the water rising over the steep slopes of river beds and banks, which significantly affect geomorphic flows. The operator is based on a limiting slope stability criterion: when in the cell the bed slope exceeds a critical angle, depending on the saturation degree of the sand, the bottom collapse occurs and the corresponding bed material and pore water become available to flow, thus following the two-phase flow dynamics. The algorithm also permits the failure to propagate from the single cell to the entire domain, preserving both the continuity of the bottom surface and the mass conservation [36,39].
3. Results
Before presenting the results, it is useful to underline that the three initial configurations, illustrated for both sands in Table 1 and corresponding to the three initial water levels H0, refer to three different situations. The dike height Hd, in fact, is the same (equal to 0.179 m) for all tests.
In the first scenario (H0 = 0.20 m, Tests A1 and B1), the initial water level in the upstream reservoir is almost equal to the dike top elevation. As a consequence, the dam break wave, which originates from the gate opening, does not possess enough energy to overtop the dike, and therefore, it induces erosion only on the upstream slope of the dike.
In the second case (H0 = 0.25 m, Tests A2 and B2), the initial upstream level is such that the water wave overtops the dike and erodes it along its entire profile.
In the third situation (H0 = 0.395 m, Tests A3 and B3), the potential energy of the impact wave is almost double that in the previous case, thus causing a more evident erosion of the dike.
As for the wave-induced dike erosion, in the first scenario (Tests A1 and B1), the wave does not overtop the dike, but it tends to rise upon its upstream slope. This slope is, therefore, eroded, especially at its base. Erosion is progressive, due to the subsequent swings of the wave front, driven by the continuously changing hydraulic head gradients. Wave front advance and dike erosion (with eventual sediment transport) influence each other during the process.
In the second scenario (Tests A2 and B2), erosion of the upstream slope is more prominent due to the higher potential energy of the water wave. This wave reaches also the dike crest this time, progressively eroding it as it passes. In the first stage, the degradation of the upstream portion of the crest is observed.In the second stage, the water surface profile tends to displace itself parallel to the eroded surface of the downstream dike slope; erosion of this slope and of the dike crest is limited, whereas the upstream slope undergoes the repeated swings (with consequent erosion and sediment transport) described before for the first scenario. At the third stage, the overtopping discharge and erosion rate decrease. The head difference between the upstream water level and dike crest is lower than in the second stage, and therefore, the rate of degradation, depending (apart from the dike material) on the amount of flow over the dike crest, decreases. At the last stage, the upstream water level equals the dike crest elevation; there is no overtopping flow, and the progressive damage stops. Successive wave reflections follow similar steps and eventually produce sediment deposition at the dike foot of the embankment.
In the third scenario (Tests A3 and B3), the impacting wave possesses a much higher energy than in the previous case. The wave runs up the slope more decidedly, engaging the dike crest first and then the downstream slope in an almost uniform way, so that erosion is quite homogeneous along the entire profile, and the dike profile shape is rounded during the process. After the initial stage, the water surface profile tends to displace itself parallel to the dike profile in the downstream part; however, water thickness progressively reduces, until engaging only the upstream dike slope, where erosion occurs with the usual modalities.
It is worth noting that during the process, steep portions of the dike slopes undergo a combination of surface erosion and sliding failures due to the loss of supporting material.
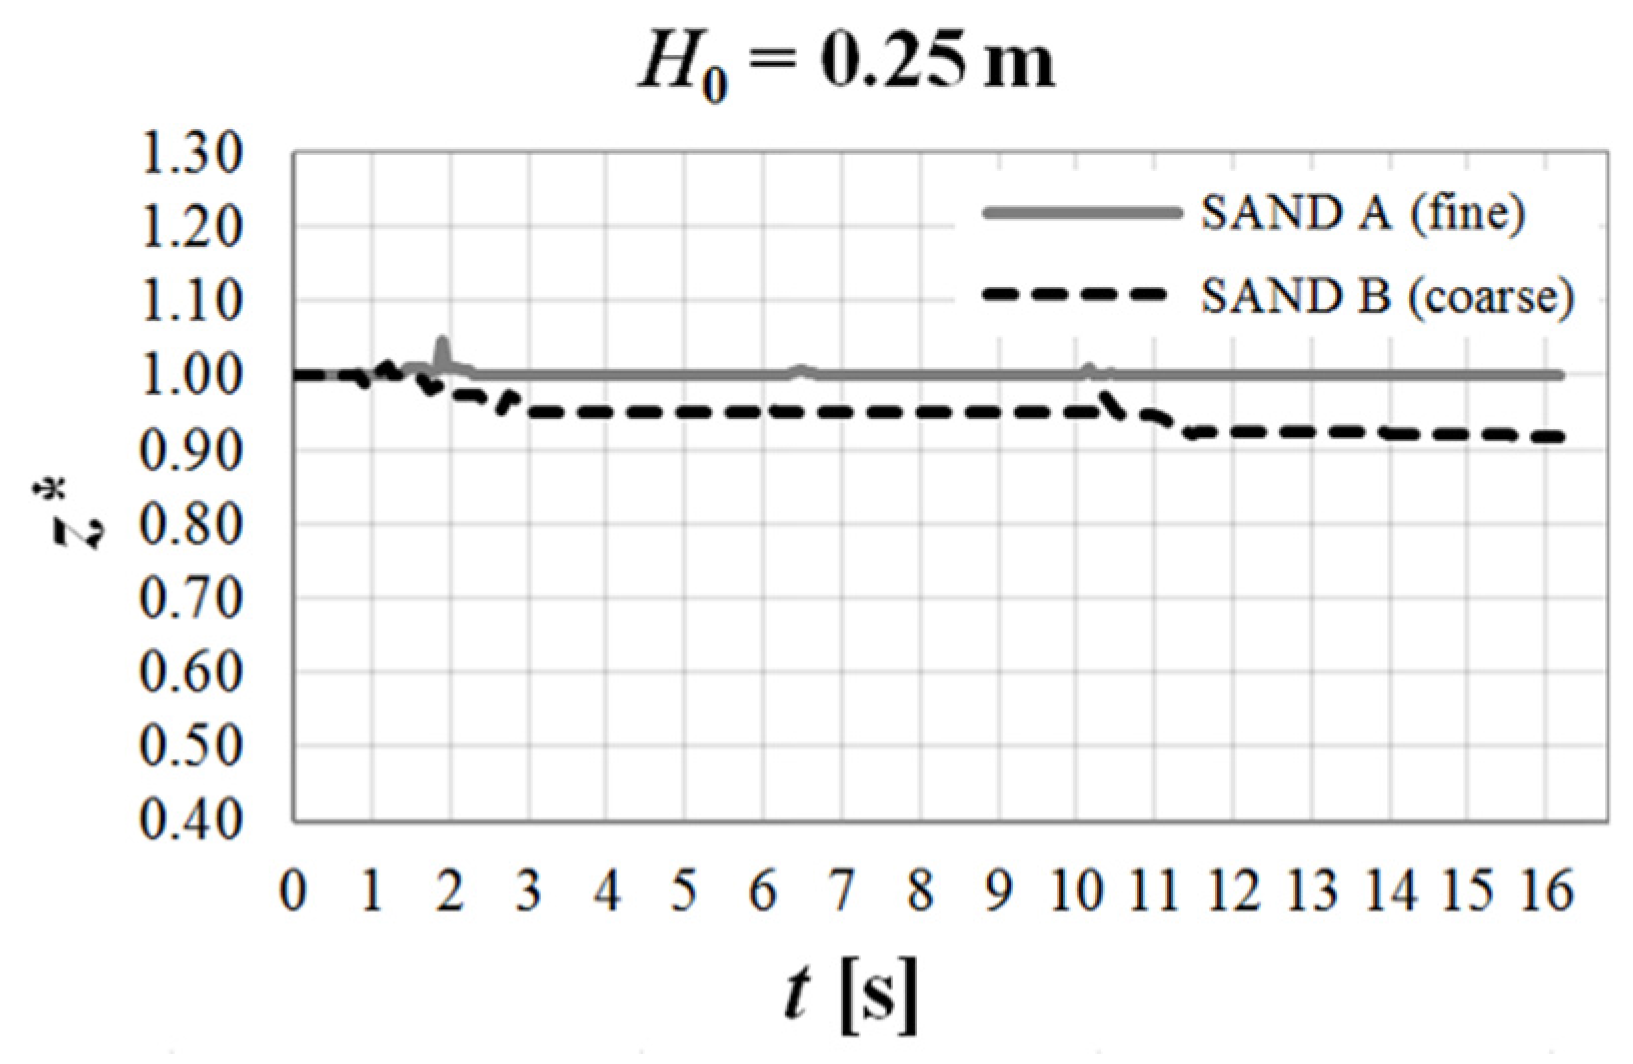
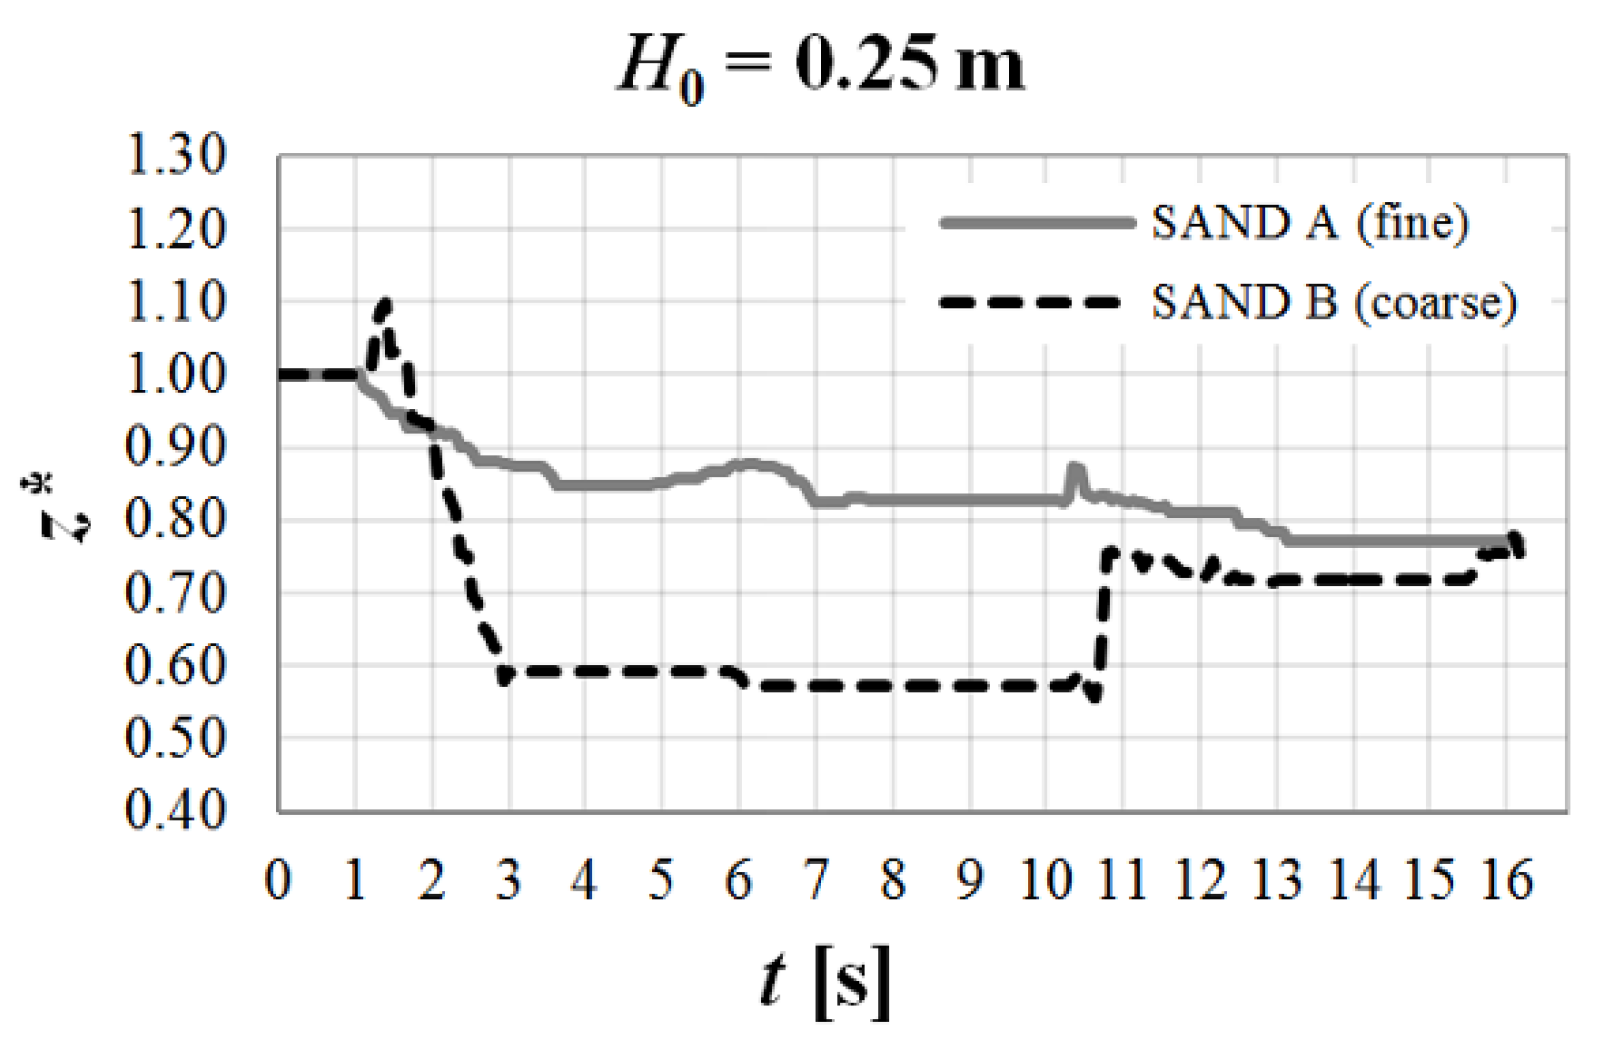
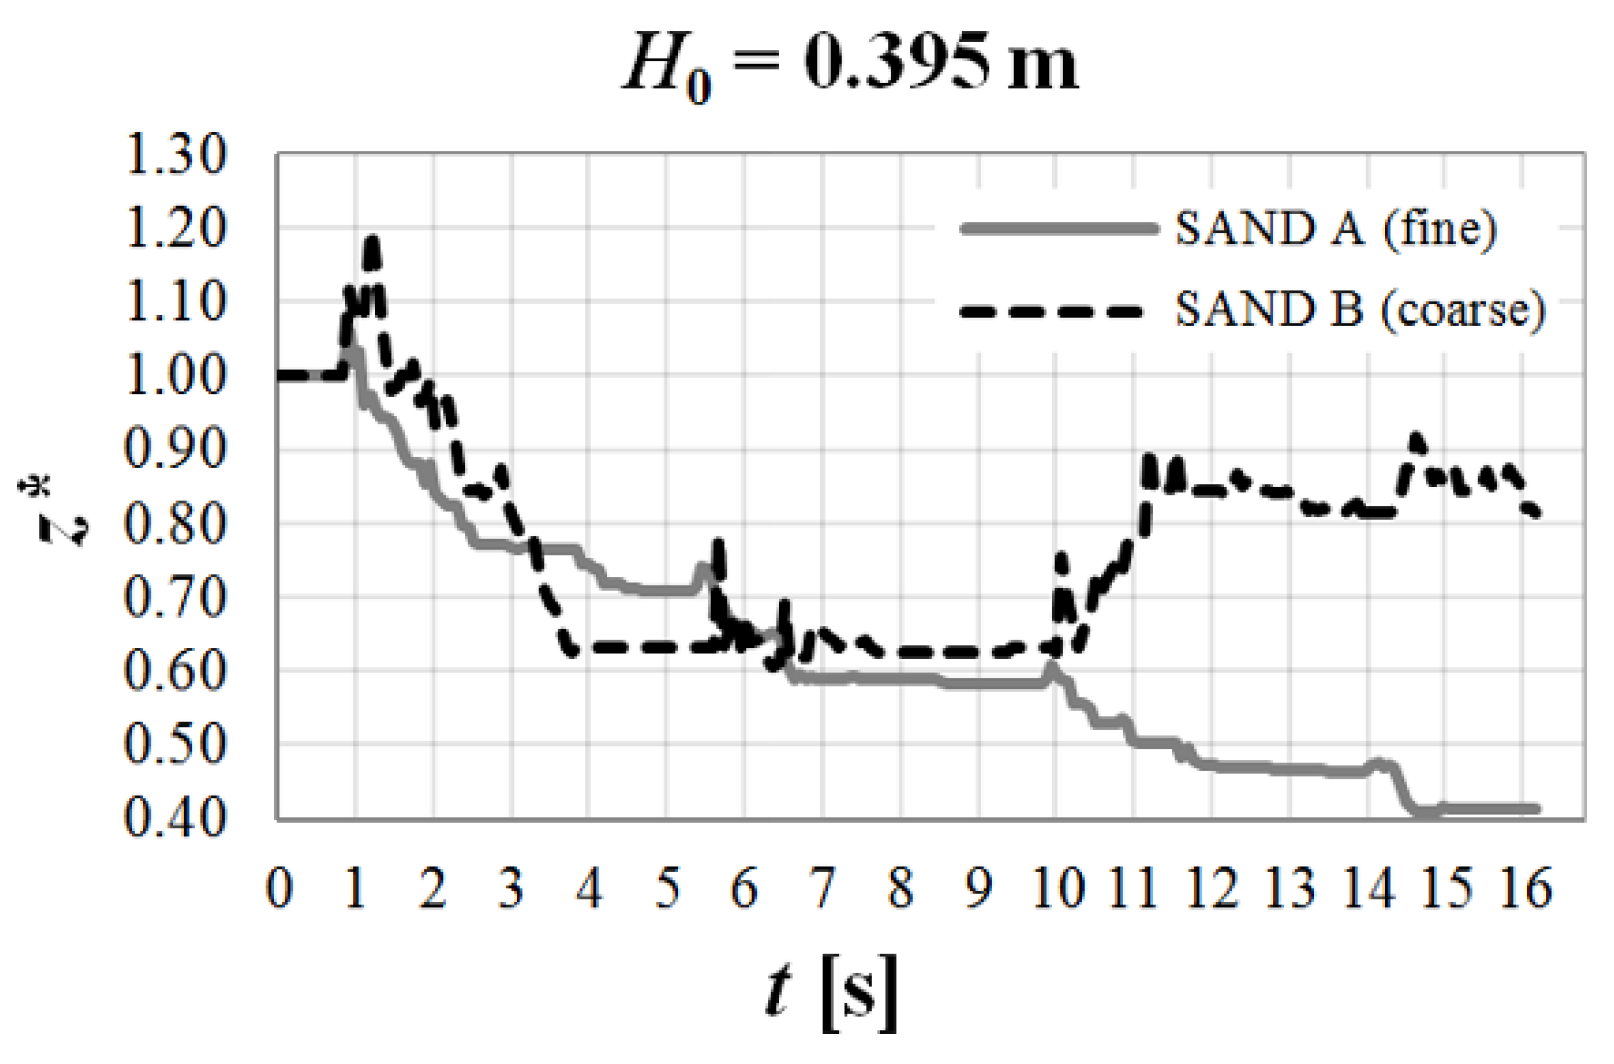
Quantitative results of the laboratory experiments are presented for each test as time histories of the bottom elevation zb above the previously-mentioned datum in specific sections, such as, for example, at the centerline of the dike and in two further sections, about 0.23 m upstream (−δ) and downstream (+δ) from the centerline, respectively. Specifically, they are illustrated in Figure 3, Figure 4, Figure 5, Figure 6, Figure 7, Figure 8 and Figure 9 in terms of non-dimensional bottom elevation z* against time t, where z* = zb/z0, in which zb is the bottom elevation at a fixed reference abscissa and z0 is the initial bottom elevation at the same abscissa.
Figure 3.
Experimental time evolution of z* at the dike centerline for Tests A2 and B2.

Figure 4.
Experimental time evolution of z* at the dike centerline for Tests A3 and B3.

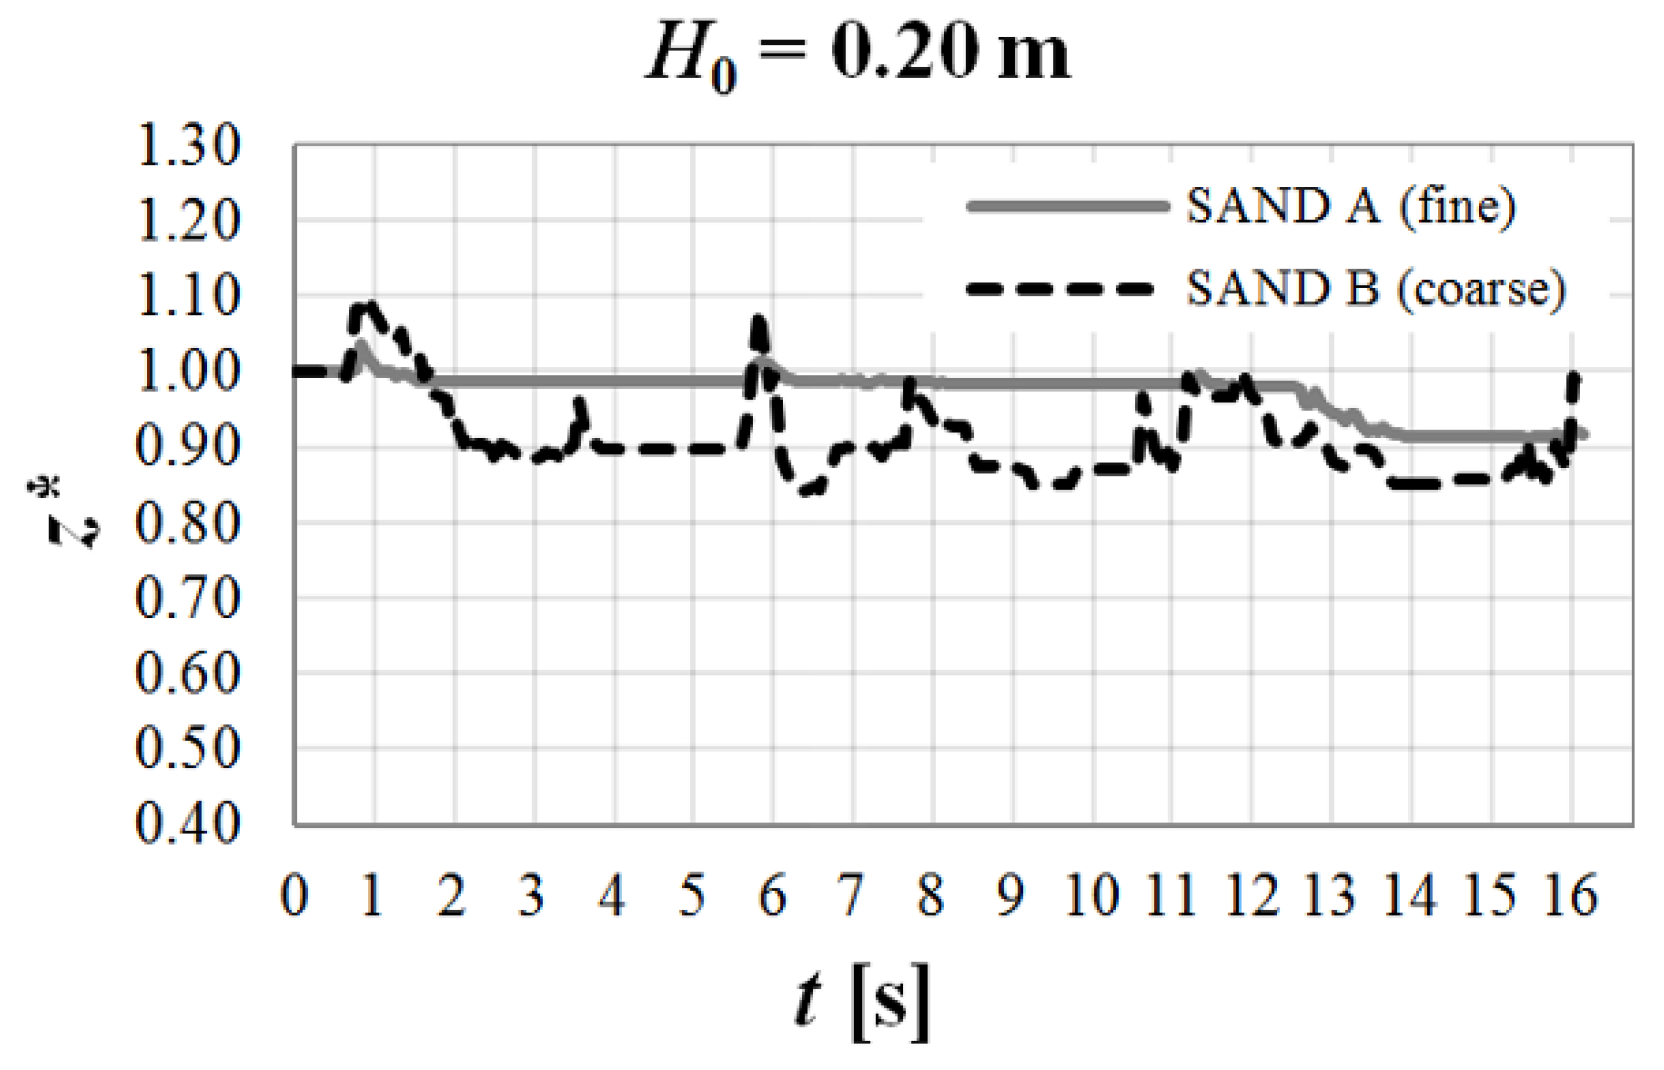
Figure 5.
Experimental time evolution of z* at the dike upstream reference abscissa (−δ) for Tests A1 and B1.
Figure 5.
Experimental time evolution of z* at the dike upstream reference abscissa (−δ) for Tests A1 and B1.

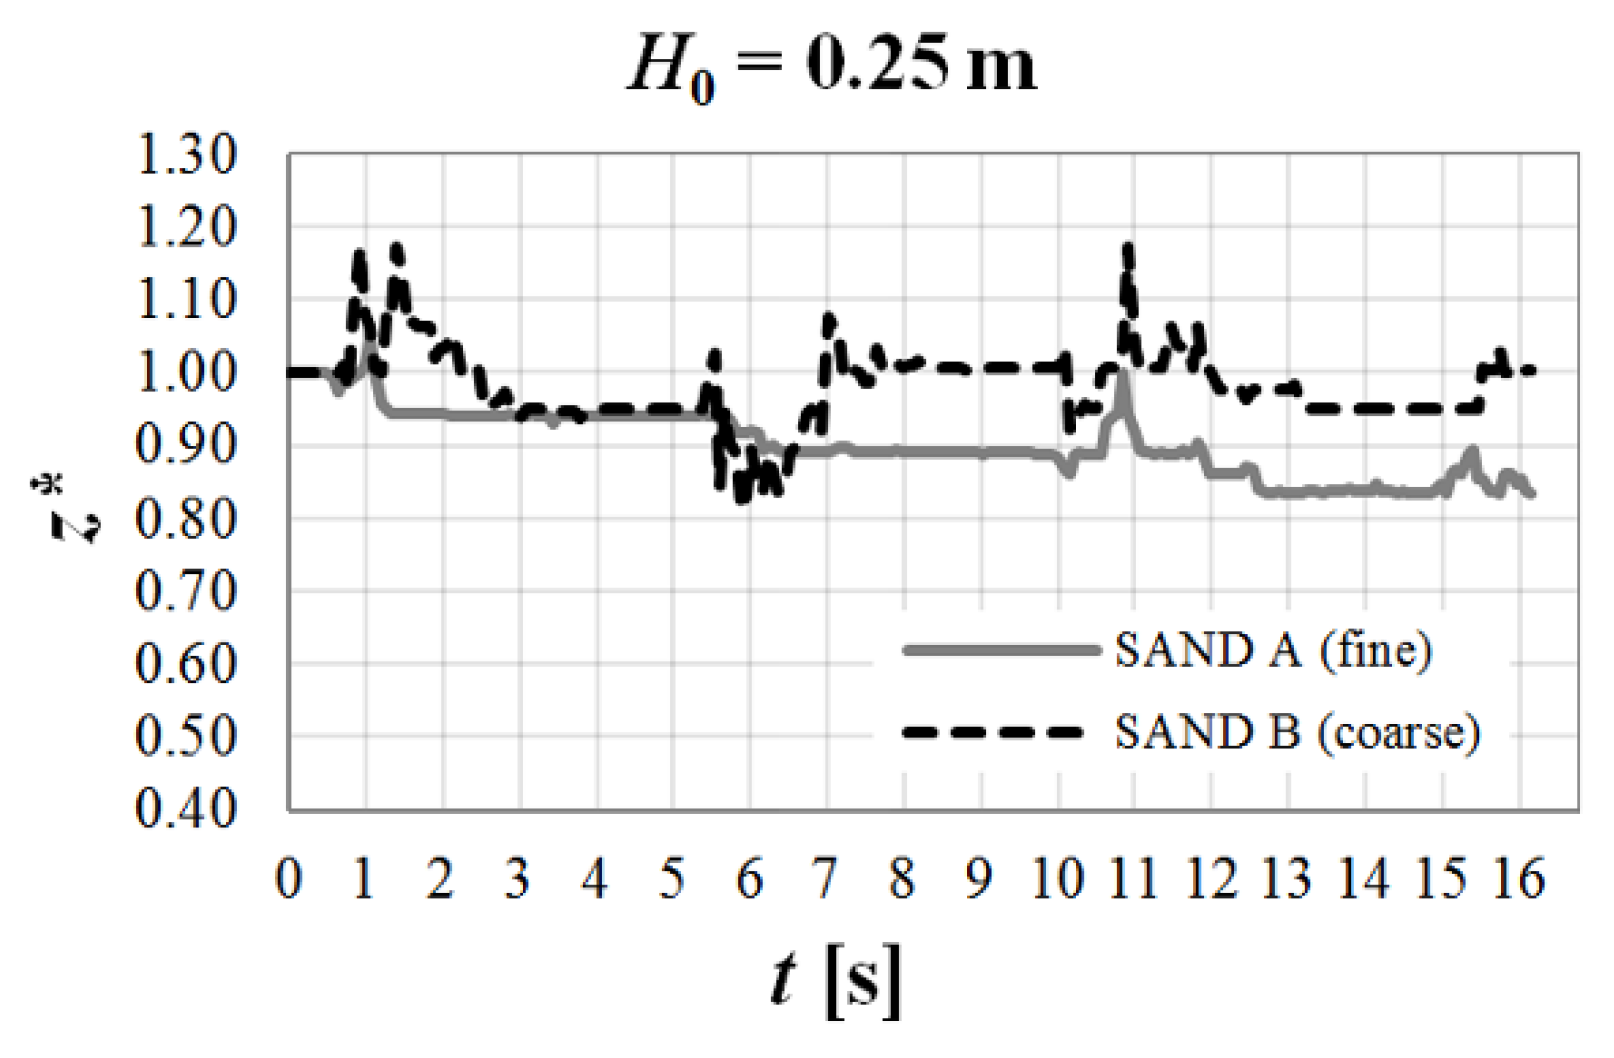
Figure 6.
Experimental time evolution of z* at the dike upstream reference abscissa (−δ) for Tests A2 and B2.
Figure 6.
Experimental time evolution of z* at the dike upstream reference abscissa (−δ) for Tests A2 and B2.

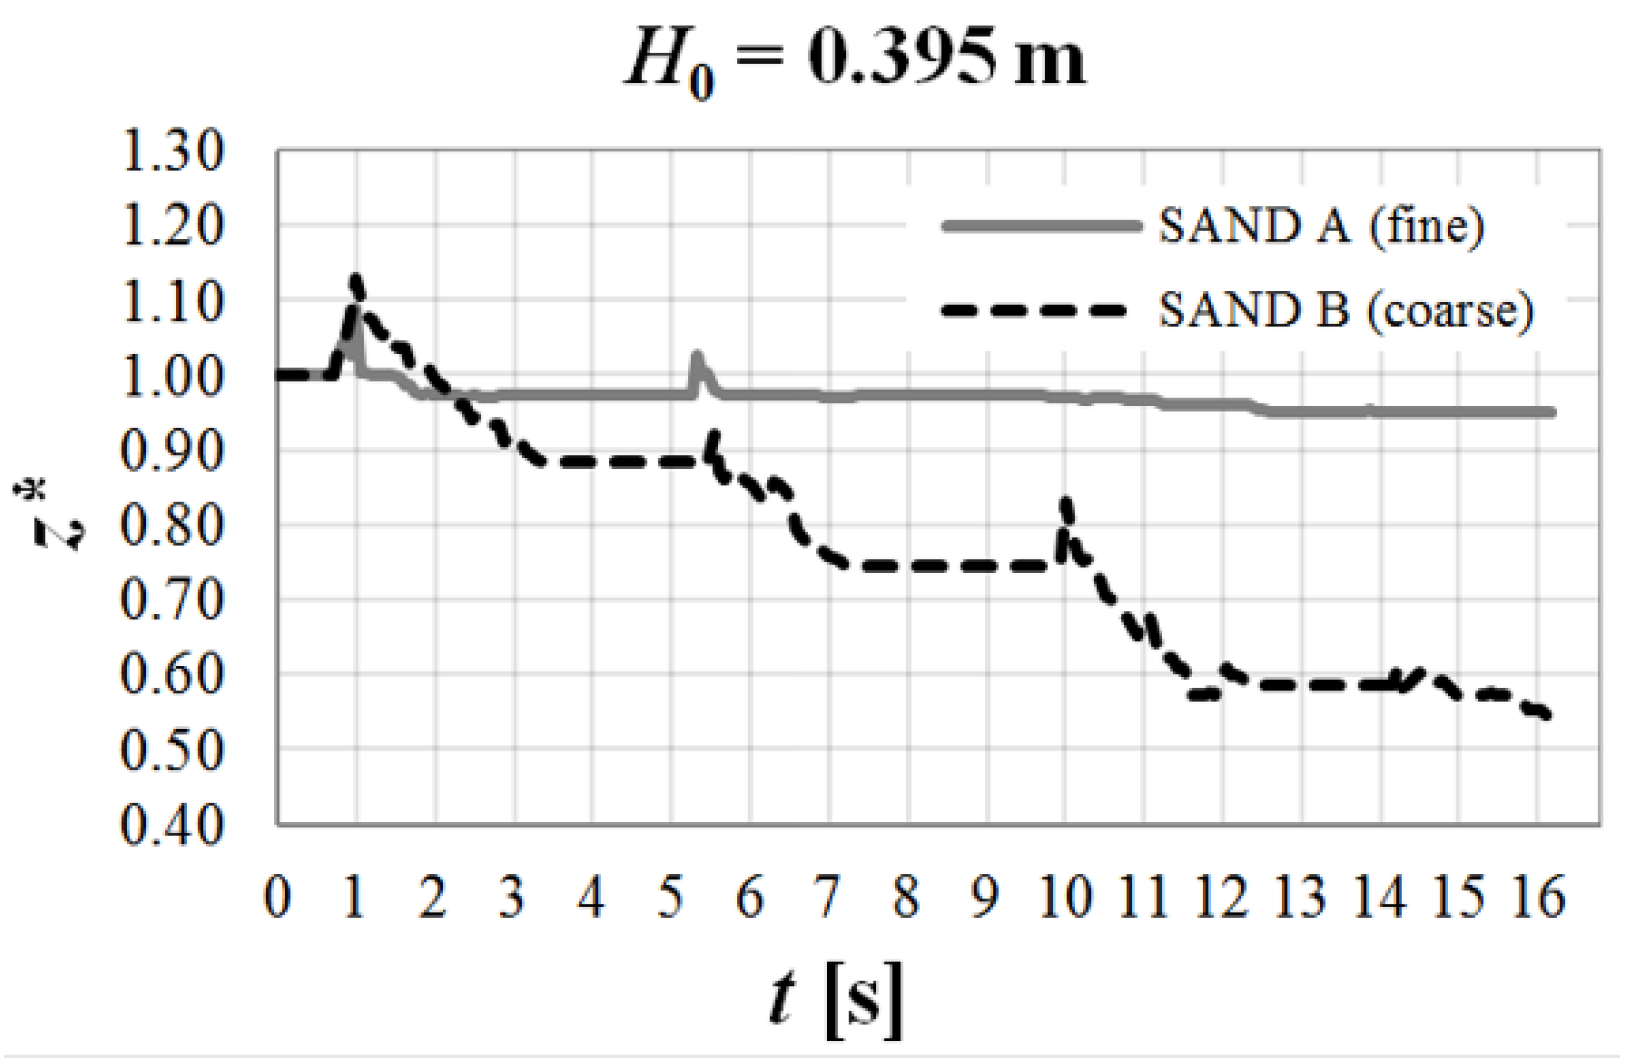
Figure 7.
Experimental time evolution of z* at the dike upstream reference abscissa (−δ) for Tests A3 and B3.
Figure 7.
Experimental time evolution of z* at the dike upstream reference abscissa (−δ) for Tests A3 and B3.

Figure 8.
Experimental time evolution of z* at the dike downstream reference abscissa (+δ) for Tests A2 and B2.
Figure 8.
Experimental time evolution of z* at the dike downstream reference abscissa (+δ) for Tests A2 and B2.

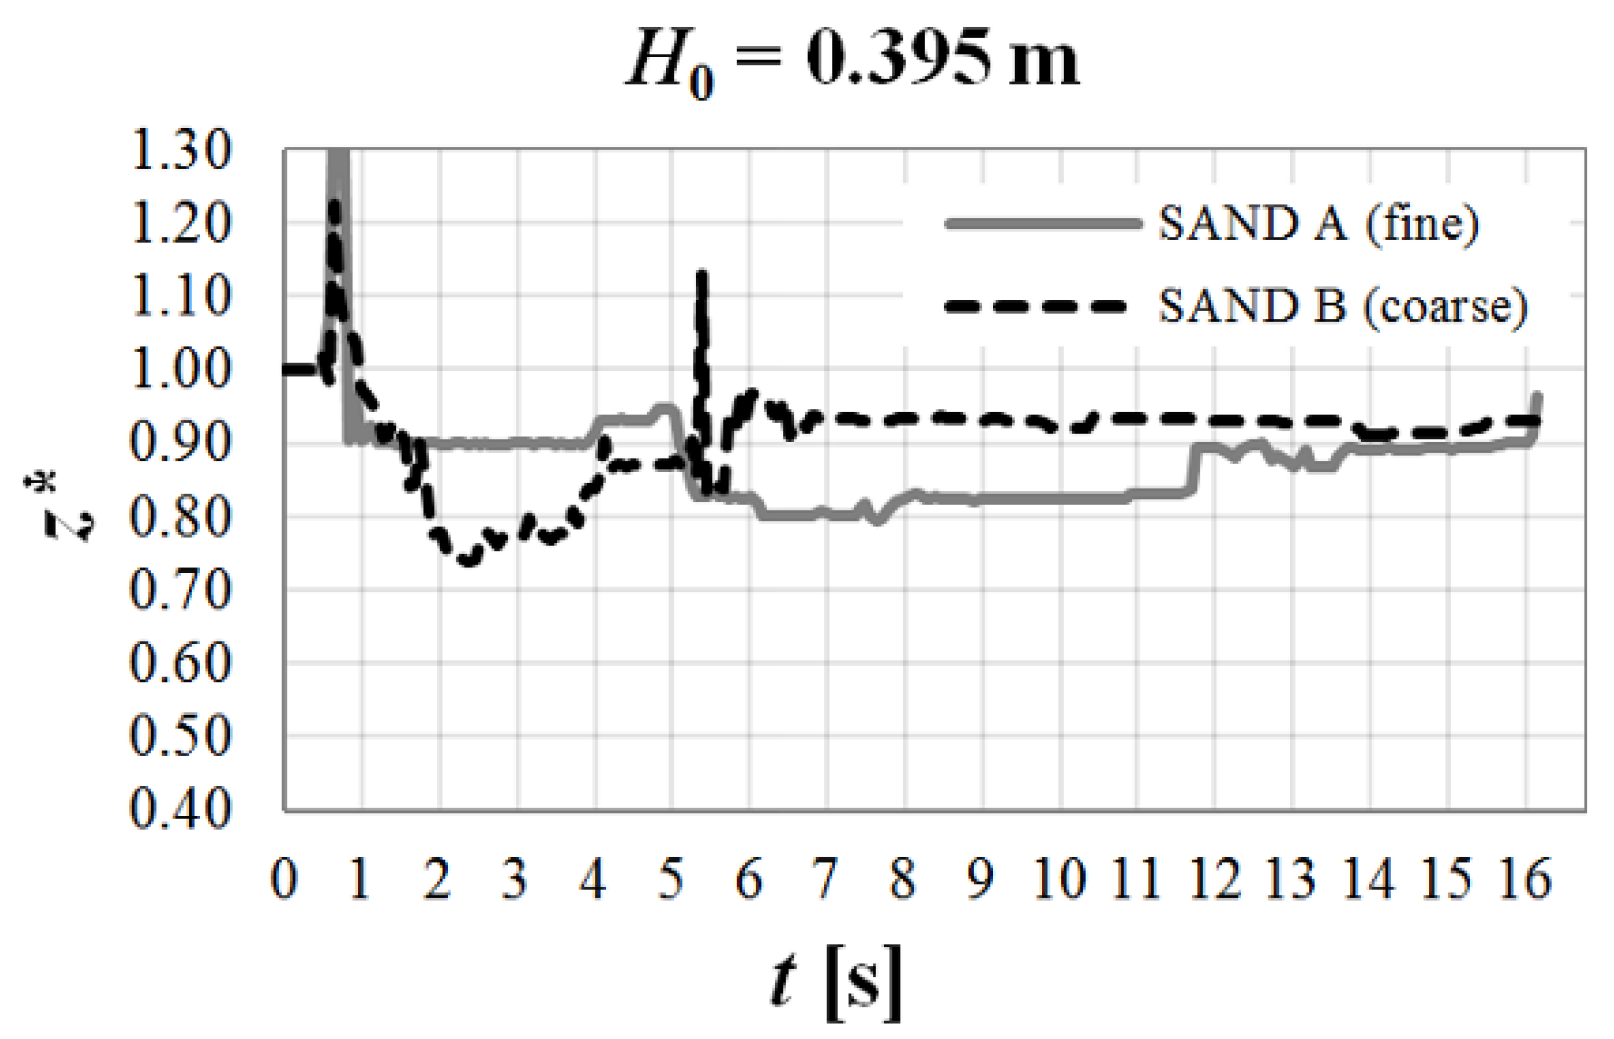
Figure 9.
Experimental time evolution of z* at the dike downstream reference abscissa (+δ) for Tests A3 and B3.
Figure 9.
Experimental time evolution of z* at the dike downstream reference abscissa (+δ) for Tests A3 and B3.

In Figure 3 and Figure 4, the time evolution of the dike top elevations at the axis of symmetry of the dike are illustrated for both sands.
Results related to the first scenario (Tests A1 and B1) are not shown here: the dam break wave, in fact, does not overtop the dike in this case: the absence of flow at the centerline of the dike makes erosion in the considered section practically negligible. This outcome is observed for both sands.
In Figure 3, referring to the second case (Tests A2 and B2), instead, erosion effects appearing on the dike can be noticed. The wave overtopping the dike produces erosion at the dike centerline. As for the “fine sand”, however, the erosion at the centerline is still limited; only a slight transport of solid particles caused by the flow overtopping the dike can be observed, but the values of zb maintain very close to the initial elevation of the dike top. The “coarse sand” reveals a more significant erosion: the initial values of zb decrease considerably, showing a progressive erosion of the dike top as time passes. Moreover, the trend is irregular, and in particular, it presents discontinuities with the arrival of subsequent waves due to reflections in the process evolution. Each time a new wave impacts the dike, the bottom elevation reduces significantly, while in the interval between two subsequent waves, the zb values oscillate around a constant one, showing just some peaks corresponding to the deposition of solid particles.
Similar, but more prominent, results are obtained for the third configuration (A3 and B3), illustrated in Figure 4. It can be noticed that the first splash induces a significant rise of the bottom elevation zb at the dike centerline. This is due to the fact that this time, the wave impacting the dike possesses enough energy to erode the upstream dike slope and transport a certain amount of sand up to the dike crest, thus increasing its elevation. Again, the erosion is more prominent for Sand B, “coarse”.
In Figure 5, Figure 6 and Figure 7, results in terms of the time evolution of z* at the two further reference sections here considered, on the two slopes of the dike, at a distance of about 0.23 m, respectively, upstream (−δ) and downstream (+δ) from the dike centerline abscissa (see Figure 1), are presented for all tests.
During Tests A1 and B1, the water flow, although not possessing enough energy to reach the top of the dike, engages the upstream slope and here produces erosion, which again is limited for Sand A, “fine”, but more prominent for Sand B, “coarse”, as can be observed in Figure 5. Furthermore, for the “coarse sand”, the trend is different from the one observed for the “fine sand” at the same section, being very irregular: when the first wave impacts the dike, in fact, at about 0.5 s after the gate opening, this induces a transport of sand downstream, with a consequent chaotic movement of the particles, which causes a rise of the profile. Other waves impact on the dike slope during the process after successive reflections, each of them causing erosion and a consequent transport of sand with the above-described process. The swing of the wave front, therefore, produces an initial rise of the profile at the impact and then a lowering. Erosion is more prominent when the initial water level increases, as shown in Figure 6 for Tests A2 and B2, but again is more limited for Sand A, “fine”, for which only some peaks can be observed resulting from the pass of the impacting waves and the consequent transport of solid material. As for Sand B, “coarse”, an irregular trend of zb values can be observed, with relevant peaks caused by reflection waves and fluctuations around the initial value. The water flow shows a greater erosive power with a higher initial water level in the reservoir (Tests A3 and B3, Figure 7). However, the increased power of the wave in terms of erosion is felt especially at the centerline. In the reference upstream section, instead, besides the peaks at the wave impacts, the zb values settle to about the initial value; again, the “fine sand” is more resistant, while the “coarse sand” is more subject to solid transport and deposition of material with consequent level rise.
Figure 8 and Figure 9 report the time evolution of z* at the dike downstream reference abscissa (+δ) for Tests A2–B2 and A3–B3, respectively. Results are not reported for Tests A1 and B1, because the water flow does not possess energy sufficient to overcome the obstacle; thus, the overtopping does not occur, and no erosion of the dike is observed on the downstream slope for both sands.
For Tests A2 and B2 (Figure 8), the energy of the impacting wave is higher and overtopping occurs, causing erosion not only at the centerline, but also downstream. The erosion is progressive and enhancing with passing flow for the “fine sand”. The “coarse sand” shows, instead, an important erosion, with the first flow passing, which transports the solid particles downstream, while as the second reflected flow passes, the transported solid particles deposit, thus raising the zb level in the considered section.
In Tests A3 and B3 (Figure 9), the erosion is quite important, with consistent lowering of the bottom level at the reference section. While in the experiments with the “fine sand”, the dike is mainly subject to erosion and level reduction, when it is built with the “coarse sand”, it is also subject to a progressive level rise, related to a consistent solid transport of particles.
The overall result is that the two materials present a different response to the impact wave: the “fine” sand is more resistant than the “coarse” one to the overtopping flow in terms of erosion. Erosion is more prominent for Sand B, “coarse”, which also shows a different trend of the time evolution of the bottom elevation at the reference sections, with a bigger amount of solid material transported and deposited, due to a greater mobility of the particles observed in the performed tests.
This evidence may appear inconsistent with the solid transport laws, according to which the transport capacity of the flow depends on the particle size and, specifically, is greater for smaller particles. It can be justified by the effect of the so-called apparent cohesion. The resistance of the sand dike, according to the Mohr–Coulomb criterion, should be due only to the friction angle, while the cohesion should be negligible. However, the sand may show some apparent cohesive capacity, due to the partial saturation of pores, which generates negative pressures, thus increasing its resistance. This apparent cohesion effect is more noticeable for the “fine sand”. It depends, in fact, on the times of seepage: in the presence of “coarse sand”, this effect is rapidly annulled by the pores’ saturation, which is almost instantaneous. For the “fine sand”, instead, the seepage times are longer, and the pores are saturated more slowly.
Experiments also prove that at the end of the process, when the waves are dissipated, while in the case of “coarse” sand, the dike is almost completely eroded and just a small deposit remains in the channel, when the dike is made of “fine” sand, the observed final configuration is different. The dike geometry remains more or less the same; a water tie settles behind the dike, whereas the channel downstream is almost empty. This fact causes a different failure modality: in the coarse sand, the infiltration rate is higher, then the water infiltrating through the dike progressively removes solid material, thus creating a breaching front, which moves from downstream to upstream. A series of collapses occurs until the breach leads to the failure of the dike with the release of the water stored behind it. It is, therefore, true that the dike made of “fine sand” offers a higher resistance to erosion due to impact waves, but not regarding the piping. The dike fails anyway due to breaching and piping. This evidence has to be taken into account in practical plans of such structures, for example providing external protection in order to limit as much as possible the infiltration rate.
The most relevant feature from a technical viewpoint, in fact, besides the time evolution of the dike elevation, is in both cases the final configuration of the dike, responsible for eventual damages and losses.
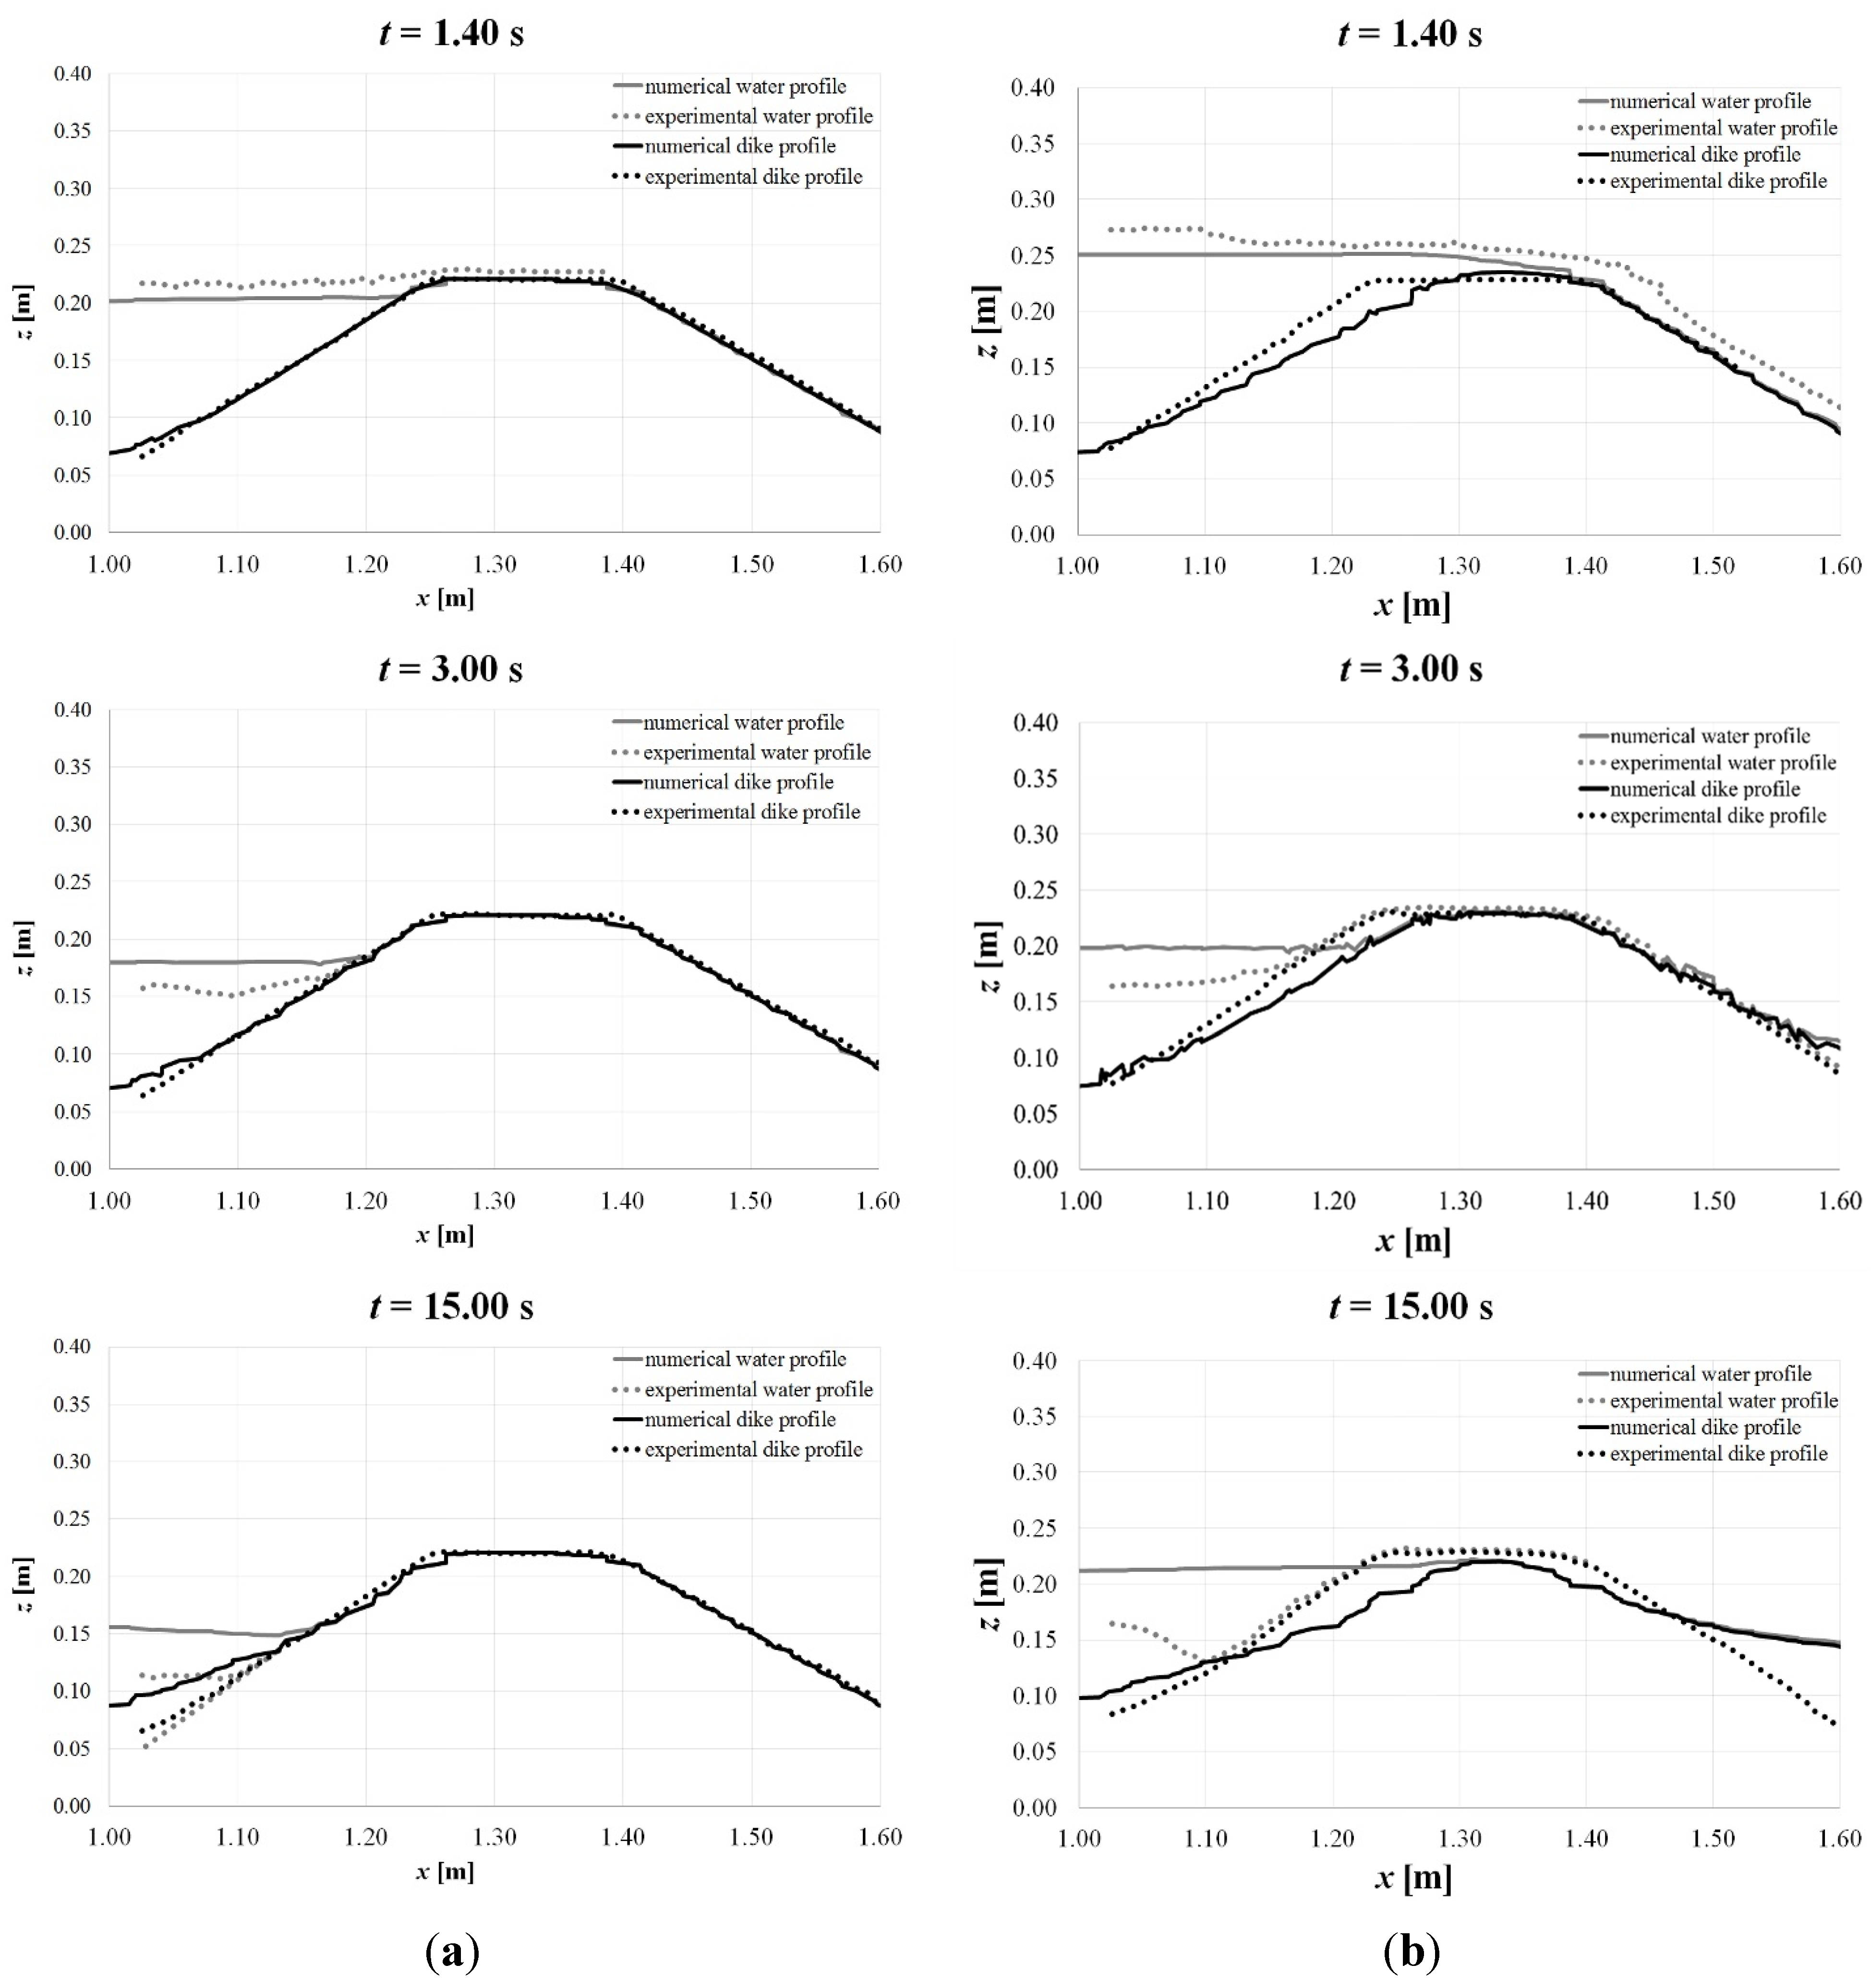
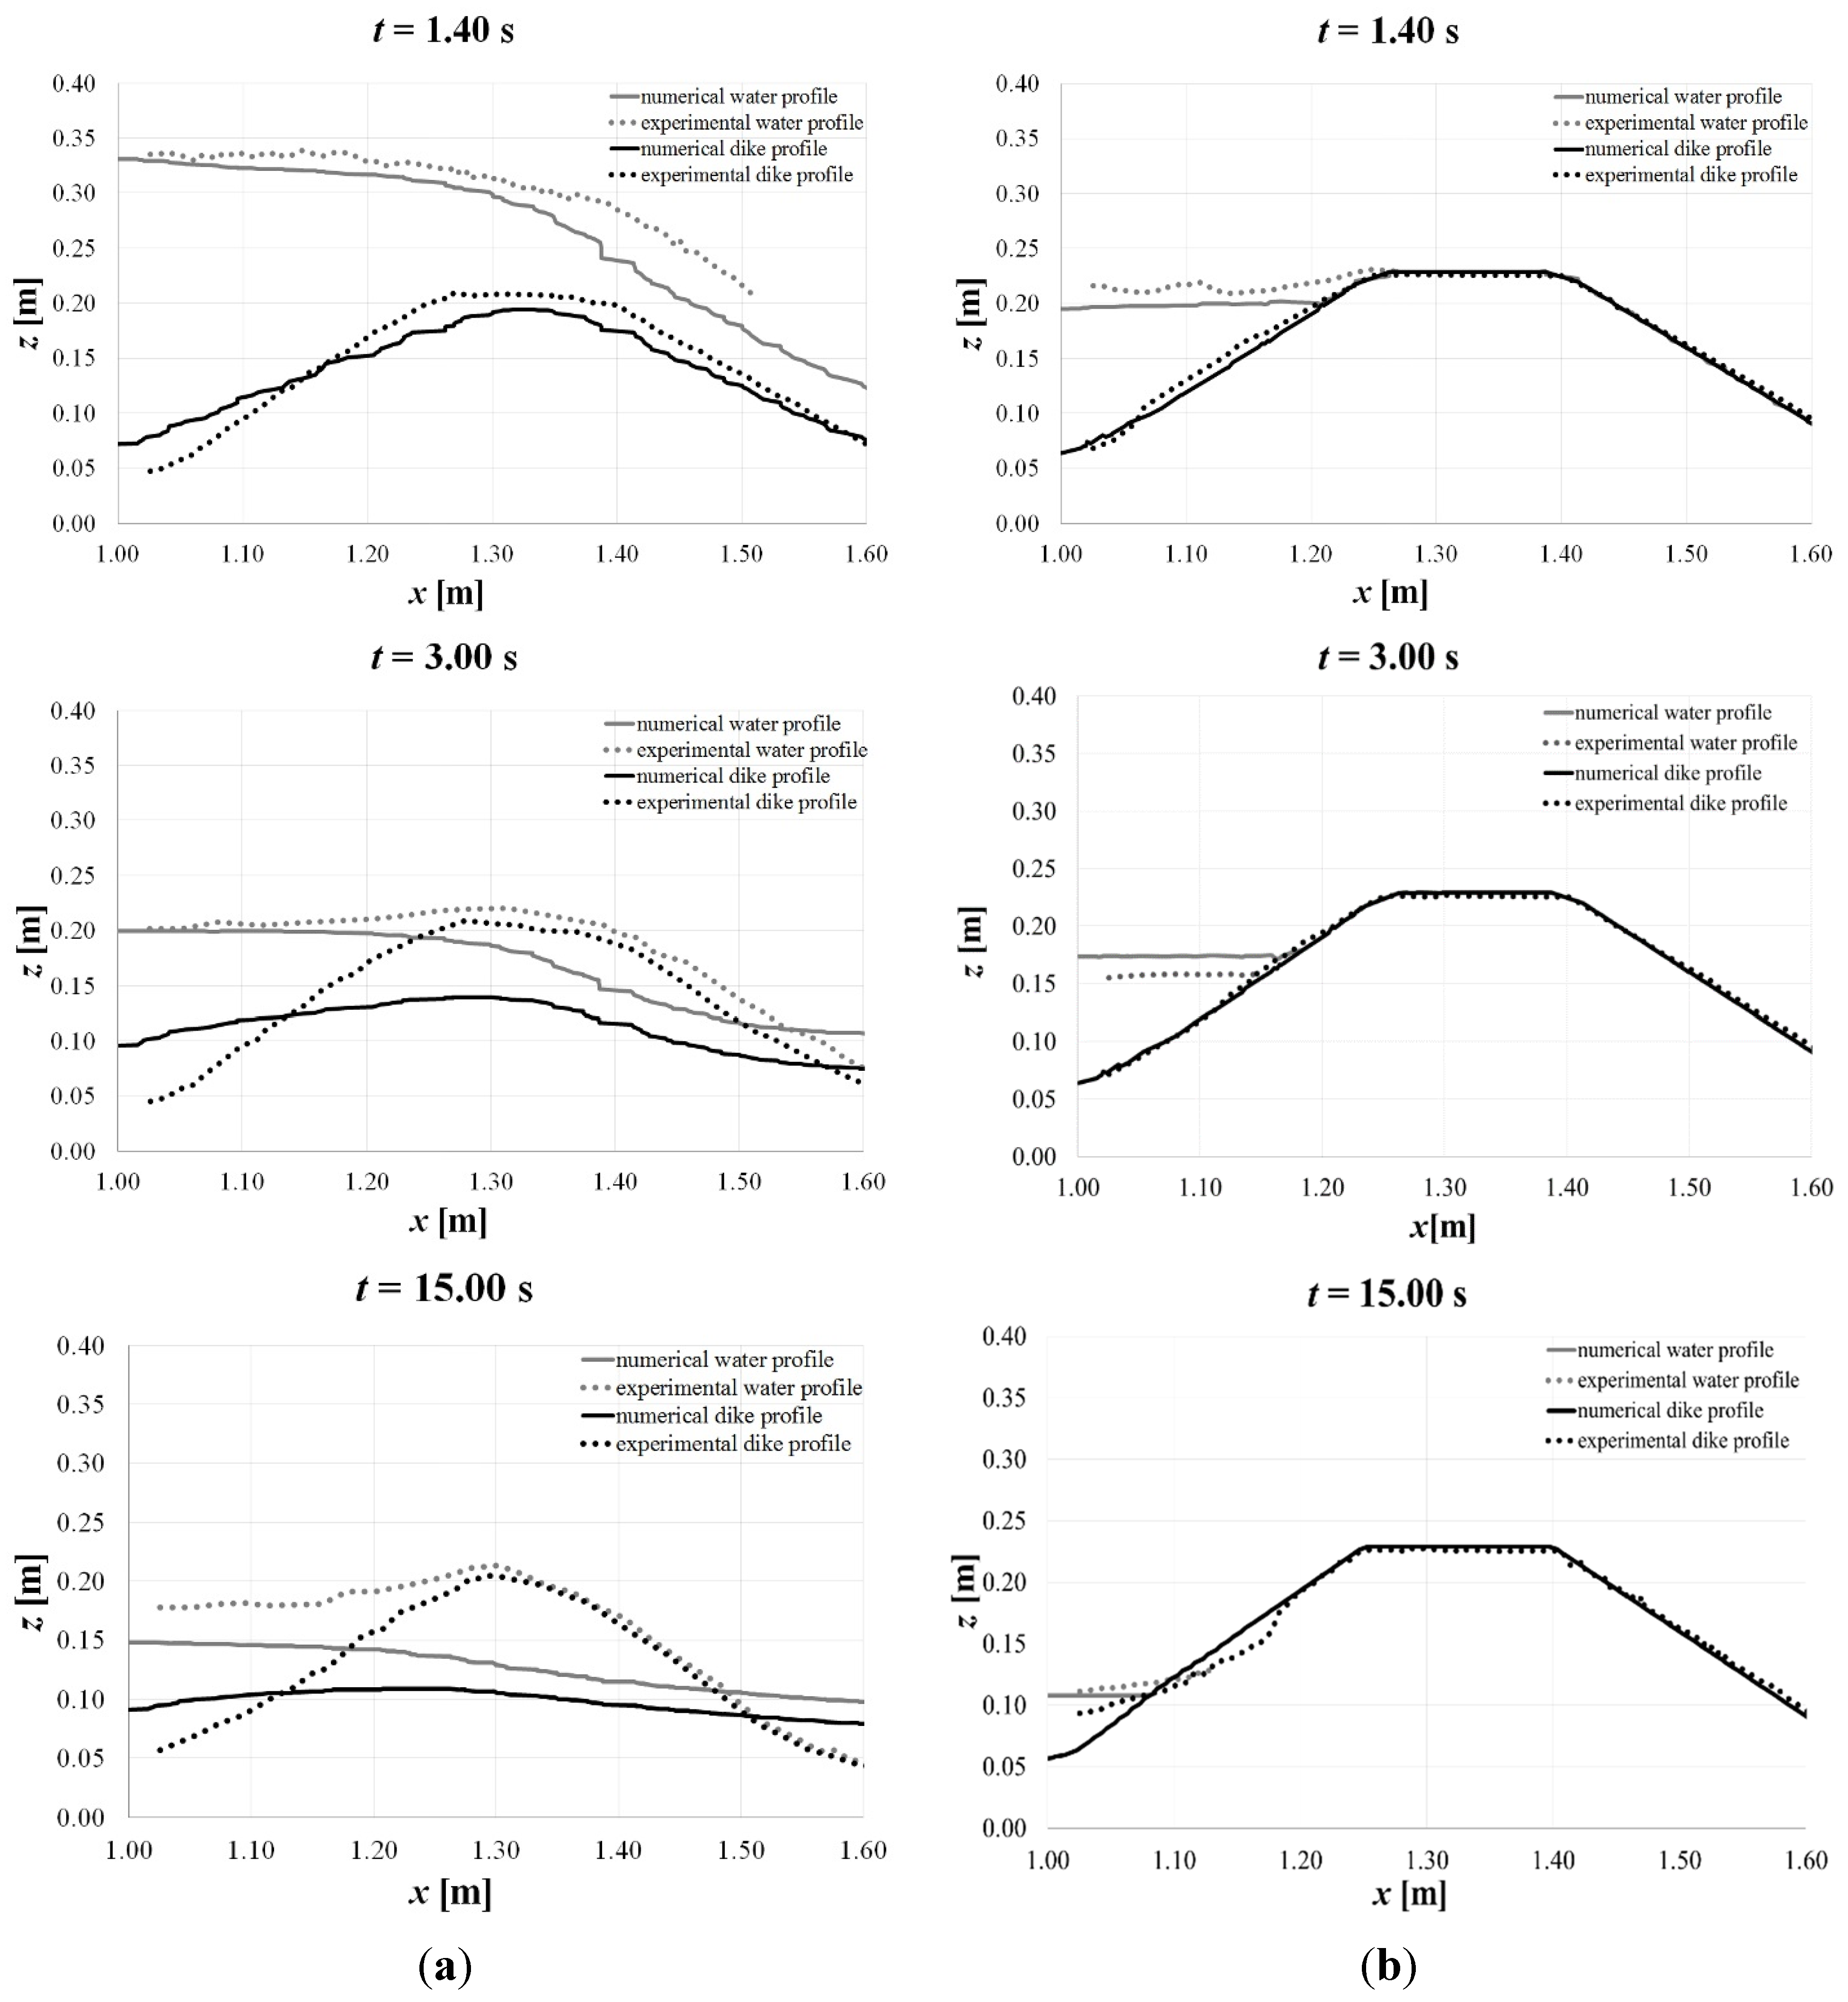
Some comparisons of the experimental results against the numerical simulated ones are illustrated in Figure 10, Figure 11 and Figure 12. Specifically, the water-surface (grey) and dike (black) profiles at specific times (1.40, 3.00 and 15.00 s, respectively) after the gate removal are plotted for all tests: dotted lines indicate the experimental results and solid lines the numerical ones.
Figure 10.
Comparison of the experimental results (dotted lines) against the numerical ones (solid lines) for Test A1 (a) and Test A2 (b), respectively: water (grey) and dike (black) profiles at times t = 1.40, 3.00 and 15.00 s, respectively.
Figure 10.
Comparison of the experimental results (dotted lines) against the numerical ones (solid lines) for Test A1 (a) and Test A2 (b), respectively: water (grey) and dike (black) profiles at times t = 1.40, 3.00 and 15.00 s, respectively.

Figure 11.
Comparison of the experimental results (dotted lines) against the numerical ones (solid lines) for Test A3 (a) and Test B1 (b): water (grey) and dike (black) profiles at times t = 1.40, 3.00 and 15.00 s, respectively.
Figure 11.
Comparison of the experimental results (dotted lines) against the numerical ones (solid lines) for Test A3 (a) and Test B1 (b): water (grey) and dike (black) profiles at times t = 1.40, 3.00 and 15.00 s, respectively.

Simulations are run with a time step Δt = 0.005/512 and a grid size Δx = 0.01 m. Besides the sand physical parameters (density, mean diameter, porosity and friction angle), it is necessary to assign as model parameters the Chezy and the drag coefficients, respectively chosen equal to 15 and 0.2 (see [34,36]) after a sensitivity analysis and a manual trial-and-error calibration procedure.
Figure 12.
Comparison of the experimental results (dotted lines) against the numerical ones (solid lines) for Test B2 (a) and Test B3 (b): water (grey) and dike (black) profiles at times t = 1.40, 3.00 and 15.00 s, respectively.
Figure 12.
Comparison of the experimental results (dotted lines) against the numerical ones (solid lines) for Test B2 (a) and Test B3 (b): water (grey) and dike (black) profiles at times t = 1.40, 3.00 and 15.00 s, respectively.
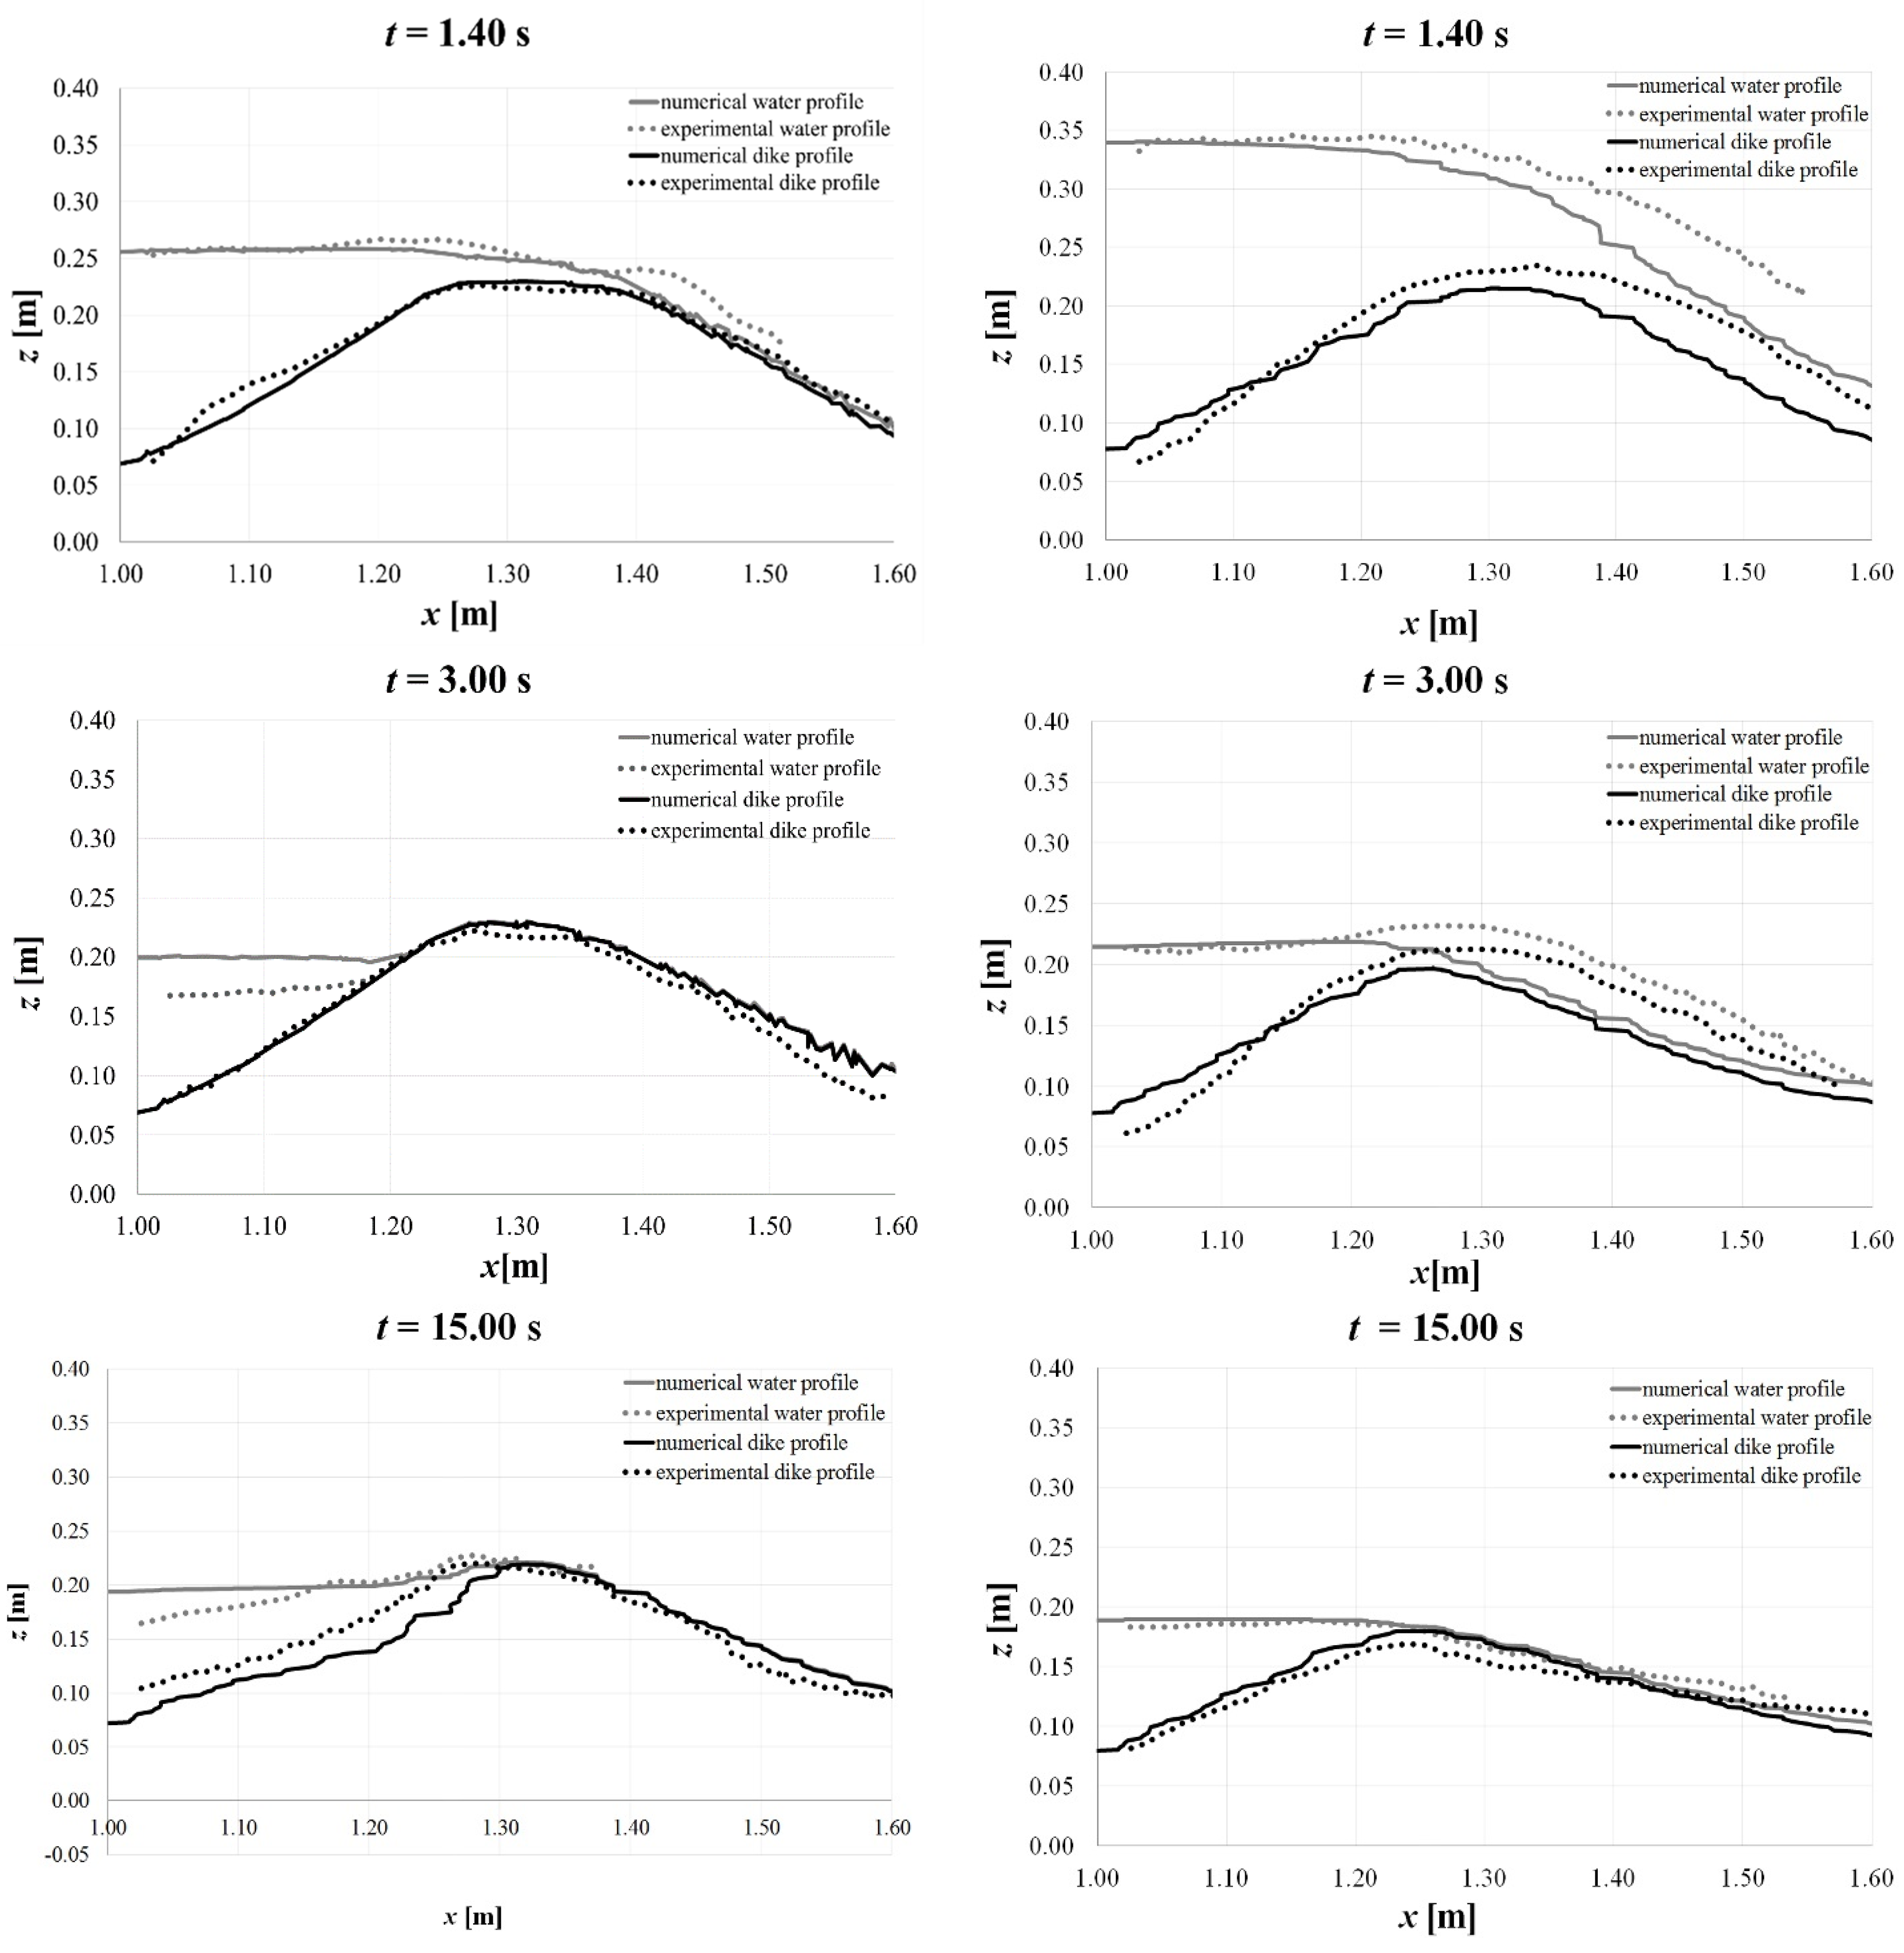
Figure 10a,b and Figure 11a report the comparison for the “fine sand” or Sand A, respectively for the three initial water levels in the reservoir (Tests A1, A2, A3), whereas Figure 11b and Figure 12a,b report the comparison for the “coarse sand” or Sand B (Tests B1, B2, B3). In the first scenario (Figure 10a and Figure 11b), the numerical process is slightly slower than the experimental one, but no significant deviations are observed. A quite good prediction is obtained also in the second scenario (Figure 10b and Figure 12a), especially for Sand B. In the third scenario (Figure 11a and Figure 12b), instead, while for the “coarse sand”, a good agreement is reached between predicted and observed results, for the “fine sand”, the simulated process of erosion is much faster than the experimental one.
Overall, a satisfactory correspondence can be observed between the physical evidence and the results expected from the numerical simulations, especially for the coarse sand and with respect to the water wave front. As for the dike erosion, the prediction is slightly worse, as expected. The adopted depth-averaged model, in fact, is not able to take properly into account the vertical accelerations, not neglectable in the presence of such steep slopes. The hypothesis of the hydrostatic distribution of pressures also fails in this situation. Moreover, suspended sediment transport and seepage are not accounted for.
The comparison shows in general a better numerical prediction of the process evolution for the “coarse sand”. Another assumption of the mathematical model here adopted, in fact, is the one of non-cohesive sediment. This hypothesis is practically acceptable for the “coarse sand”, while the “fine sand” shows a non-neglectable apparent cohesion. The implicit assumption that the dike material is immediately saturated as soon as the water level surmounts the dike elevation is invalid in this case. The actual filtration process of water through the sediment pore interstices should be taken into account for the “fine sand”, since in this case, it takes place at times that are not, as for the “coarse sand”, neglectable compared to the time of the process evolution, especially when considering, as done here, instantaneous phenomena, like the ones of a dam break. The numerical simulation, therefore, is not capable of taking into account the increased resistance to erosion of the “fine sand”.
These results offer a contribution to understanding the evolution of the erosion process of embankments in dynamic conditions and to support their design and reinforcement [40], as well as the development and validation of numerical models capable of simulating more complex technical problems.
4. Conclusions
In this work, experimental results on dike erosion due to a sudden wave overtopping, conducted in the Water Engineering Lab at the University of Cassino and Southern Lazio, Italy, are presented. Differently from previous studies on this topic, dike overtopping occurs here in unsteady conditions. Two different kinds of sand constituting the dike are considered, as well as different initial water levels in the upstream reservoir, with consequent different modalities of the evolution of the process.
Some interesting features appear from the observation of the experimental results. Wave front advance and dike erosion (with eventual sediment transport) deeply influence each other during the process, as expected. When the water wave does not possess enough energy to overtop the dike, the upstream slope is still eroded due to the subsequent swings of the wave front, driven by the continuously-changing hydraulic head gradients. When the initial water level in the upstream reservoir is higher, the increased power of the waves produces more erosion effects, on the entire profile of the dike this time, especially with the coarse sand. The dike built using the fine sand shows a greater resistance than the one realized with the coarse one in terms of erosion. This evidence, in contrast with what was expected from the classical sediment transport theory, may be justified by the effect of apparent cohesion, i.e., the increase in the inter-particle force due to the suction of unsaturated sediment.
Although the laboratory campaigns are conducted on specific configurations that are often far from reality, for example on small-scales homogeneous embankments and operating in a “protected and controlled environment”, results can help with understanding the real processes and may be useful both from a scientific viewpoint, for the validation of simulation numerical models capable of simulating the evolution of the dike erosion process, also in large-scale scenarios for real-time defense systems, and from a technical standpoint to suggest design and reinforcement solutions for risk prevention.
Some numerical simulations of these experimental results have also been performed, to test the capacity of a numerical code, based on a depth-integrated two-phase model, for analyzing hereafter a greater number of scenarios. The prediction in terms of wave front position and dike erosion is sufficiently accurate. Improvements can be possibly obtained taking into account more influence factors (such as, for instance, suspension load transport and seepage) and removing some hypotheses (e.g., the hydrostatic distribution of pressures) in the model.
Further experiments are also planned in order to consider more laboratory scenarios, with different dike configurations and materials and different distances of the dike from the reservoir.
Acknowledgments
The laboratory activities have been conducted in the Water Engineering Laboratory at the University of Cassino and Southern Lazio, Italy, in collaboration with Giovanni de Marinis, Cristiana Di Cristo and Angelo Leopardi.
Conflicts of Interest
The authors declare no conflict of interest.
Appendix
List of Symbols
| Symbols | Meaning |
|---|---|
| H0 | water level in the upstream tank |
| Hd | dike height |
| d50 | characteristic diameter of the sand particles |
| ρs | solid density |
| t | time |
| zb | bottom elevation |
| z0 | initial bottom elevation |
| z* = zb/z0 | dimensionless bottom elevation |
| Δt | time step |
| Δx | grid size |
| δ | reference abscissa distance from the dike crest centerline |
References
- Mizutani, H.; Nakagawa, H.; Yoden, T.; Kawaike, K.; Zhang, H. Numerical modelling of river embankment failure due to overtopping flow considering infiltration effects. J. Hydraul. Res. 2013, 51, 681–695. [Google Scholar] [CrossRef] [Green Version]
- Parry, M.L.; Canziani, O.F.; Palutikof, J.P.; van der Linden, P.J.; Hanson, C.E. Climate Change 2007: Impacts, Adaptation and Vulnerability; Contribution of Working Group II to the Fourth Assessment Report of the Intergovernmental Panel on Climate Change; Cambridge University Press: Cambridge, UK, 2007. [Google Scholar]
- Tinney, E.R.; Hsu, H.Y. Mechanics of wash-out of an erodible fuse plug. J. Hydraul. Eng. ASCE 1961, 97, 1–30. [Google Scholar]
- Simmler, H.; Sametz, L. Dam failure from overtopping studied on a hydraulic model. In Proceedings of the ICOLD, Fourteenth Congress, Rio de Janeiro, Brazil, 3–7 May 1982; pp. 427–445.
- Powledge, G.R.; Ralston, D.C.; Miller, P.; Chen, Y.H.; Clopper, P.E.; Temple, D.M. Mechanics of overflow erosion on embankments. II: Hydraulic and design considerations. J. Hydraul. Eng. ASCE 1989, 115, 1056–1075. [Google Scholar] [CrossRef]
- Chinnarasri, C.; Tingsanchali, T.; Weesakul, S.; Wongwises, S. Flow patterns and damage of dike overtopping. Int. J. Sediment Res. 2003, 18, 301–309. [Google Scholar]
- Coleman, S.E.; Andrews, D.P.; Webby, M.G. Overtopping breaching of noncohesive homogenous embankments. J. Hydraul. Eng. ASCE 2002, 128, 829–838. [Google Scholar] [CrossRef]
- Rozov, A.L. Modeling of washout of dams. J. Hydraul. Res. 2003, 41, 565–577. [Google Scholar] [CrossRef]
- Visser, P.J.; Zhu, Y.; Vrijling, J.K. Breaching of dikes. In Proceedings of the 30th International Conference Coastal Engineering, San Diego, CA, USA, 3–8 September 2006.
- Schmocker, L.; Hager, W.H. Modelling dike breaching due to overtopping. J. Hydraul. Res. 2009, 47, 585–597. [Google Scholar] [CrossRef]
- Schmocker, L.; Hager, W.H. Plane dike-breach due to overtopping: Effects of sediment, dike height and discharge. J. Hydraul. Res. 2012, 50, 576–586. [Google Scholar] [CrossRef]
- Cao, Z.; Yue, Z.; Pender, G. Landslide dam failure and flood hydraulics. Part I: Experimental investigation. Nat. Hazards 2011, 59, 1003–1019. [Google Scholar] [CrossRef]
- Pickert, G.; Weitbrecht, V.; Bieberstein, A. Breaching of overtopped river embankments controlled by apparent cohesion. J. Hydraul. Res. 2011, 49, 143–156. [Google Scholar] [CrossRef]
- Kakinuma, T.; Shimizu, Y. Large-scale experiment and numerical modeling of a riverine levee breach. J. Hydraul. Eng. ASCE 2014, 140, 1–9. [Google Scholar] [CrossRef]
- Feliciano Cestero, J.; Imran, J.; Chaudhry, M. Experimental Investigation of the Effects of Soil Properties on Levee Breach by Overtopping. J. Hydraul. Eng. ASCE 2015, 141. [Google Scholar] [CrossRef]
- Schmocker, L.; Frank, P.-J.; Hager, W. Overtopping dike-breach: Effect of grain size distribution. J. Hydraul. Res. 2014, 52, 559–564. [Google Scholar] [CrossRef]
- Tingsanchali, T.; Chinnarasri, C. Numerical modeling of dam failure due to overtopping. Hydrol. Sci. J. 2001, 46, 113–130. [Google Scholar] [CrossRef]
- Wang, Z.; Bowles, D.S. A numerical method for simulating one-dimensional headcut migration and overtopping breaching in cohesive and zoned embankments. Water Resour. Res. 2007, 43, W05411. [Google Scholar] [CrossRef]
- Gotoh, H.; Hyashi, M.; Oda, K.; Sakai, T. Gridless analysis of slope failure of embankment by overflow. Ann. J. Hydraul. Eng. ASCE 2002, 46, 439–444. [Google Scholar] [CrossRef]
- Gotoh, H.; Ikari, H.; Tanioka, H.; Yamamoto, K. Numerical simulation of river-embankment erosion due to overflow by particle method. Ann. J. Hydraul. Eng. ASCE 2008, 52, 979–984. [Google Scholar] [CrossRef]
- Balmforth, N.J.; von Hardenberg, J.; Provenzale, A.; Zammett, R. Dam breaking by wave-induced erosional incision. J. Geophys. Res. 2008, 113, 1–27. [Google Scholar] [CrossRef]
- Pontillo, M.; Schmocker, L.; Greco, M.; Hager, W.H. 1D numerical evaluation of dike erosion due to overtopping. J. Hydraul. Res. 2010, 48, 573–582. [Google Scholar] [CrossRef]
- Castro-Orgaz, O. Curvilinear flow over round-crested weirs. J. Hydraul. Res. 2008, 46, 543–547. [Google Scholar] [CrossRef]
- Volz, C.; Rousselot, P.; Vetsch, D.; Faeh, R. Numerical modelling of non-cohesive embankment breach with the dual-mesh approach. J. Hydraul. Res. 2012, 50, 587–598. [Google Scholar] [CrossRef]
- Van Emelen, S. Erosion modeling over a steep slope: Application to a dike overtopping test case. In Proceedings of the XXXV IAHR Biennial Congress, Chengdu, China, 8–13 September 2013.
- Guan, M.; Wright, N.; Sleigh, P. 2D Process-Based Morphodynamic Model for Flooding by Noncohesive Dyke Breach. J. Hydraul. Eng. 2014, 140, 04014022. [Google Scholar] [CrossRef]
- Kakinuma, T.; Shimizu, Y. Large-Scale Experiment and Numerical Modeling of a Riverine Levee Breach. J. Hydraul. Eng. 2014, 140, 04014039. [Google Scholar] [CrossRef]
- Greco, M.; Iervolino, M.; Leopardi, A.; Vacca, A. A two-phase model for fast geomorphic shallow flows. Int. J. Sediment Res. 2012, 27, 409–425. [Google Scholar] [CrossRef]
- Evangelista, S.; Leopardi, A.; Mingarelli, M. Dike erosion due to a sudden-wave overtopping: Preliminary results. In Proceedings of the International Conference River Flow 2014, Lausanne, Switzerland, 3–5 September 2014; pp. 1661–1667.
- Evangelista, S.; di Cristo, C.; Leopardi, A.; de Marinis, G. Experiments of dike erosion due to a wave impact. In Proceedings of the 8th WSEAS International Conference on Environmental and Geological Science and Engineering (EG ’15), Salerno, Italy, 27–29 June 2015.
- Evangelista, S.; de Marinis, G.; di Cristo, C.; Leopardi, A. Dam-break dry granular flows: Experimental and numerical analysis. WSEAS Trans. Environ. Dev. 2014, 10, 382–392. [Google Scholar]
- Lauber, G.; Hager, W.H. Experiments to dambreak wave: Horizontal channel. J. Hydraul. Res. 1998, 36, 291–307. [Google Scholar] [CrossRef]
- Evangelista, S. Esperimenti e simulazioni numeriche di dam break su letto fisso e mobile. L’Acqua 2014, 3, 9–22. (In Italian) [Google Scholar]
- Evangelista, S.; Altinakar, M.; di Cristo, C.; Leopardi, A. Simulation of dam-break waves on movable beds using a multi-stage centered scheme. Int. J. Sediment Res. 2013, 28, 269–284. [Google Scholar] [CrossRef]
- Evangelista, S.; Greco, M.; Iervolino, M.; Leopardi, A.; Vacca, A. A new Algorithm for unstructured grids and bank-failure mechanisms in morphodynamic models. In Proceedings of the XXXV IAHR International Biennial Congress, Chengdu, China, 8–13 September 2013.
- Evangelista, S.; Greco, M.; Iervolino, M.; Leopardi, A.; Vacca, A. A new Algorithm for Bank-Failure Mechanisms in 2D Morphodynamic Models with Unstructured Grids. Int. J. Sediment Res. 2015, in press. [Google Scholar]
- Harten, A.; Lax, P.D.; van Leer, B. On upstream differencing and Godunov-type schemes for hyperbolic conservation laws. SIAM Rev. 1983, 25, 35–61. [Google Scholar] [CrossRef]
- Greco, M.; Iervolino, M.; Leopardi, A. Discussion on Divergence Form for Bed Slope Source Term in Shallow Water Equations. J. Hydraul. Eng. ASCE 2008, 134, 676–678. [Google Scholar] [CrossRef]
- Evangelista, S.; Greco, M.; Leopardi, A. Numerical modeling of geomorphic processes in the presence of slope failures. In Proceedings of the XXXVI IAHR International Biennial Congress, Delft-Le Hague, The Netherlands, 28 June–3 July 2015.
- Gjetvaj, G. Dam breaks investigation in Croatia. In Proceedings of the 7th WSEAS International Conference on Engineering Mechanics, Structures, Engineering, Geology (EMESEG ’14), Salerno, Italy, 3–5 June 2014.
© 2015 by the authors; licensee MDPI, Basel, Switzerland. This article is an open access article distributed under the terms and conditions of the Creative Commons Attribution license (http://creativecommons.org/licenses/by/4.0/).
Share and Cite
MDPI and ACS Style
Evangelista, S. Experiments and Numerical Simulations of Dike Erosion due to a Wave Impact. Water 2015, 7, 5831-5848. https://doi.org/10.3390/w7105831
AMA Style
Evangelista S. Experiments and Numerical Simulations of Dike Erosion due to a Wave Impact. Water. 2015; 7(10):5831-5848. https://doi.org/10.3390/w7105831
Chicago/Turabian StyleEvangelista, Stefania. 2015. "Experiments and Numerical Simulations of Dike Erosion due to a Wave Impact" Water 7, no. 10: 5831-5848. https://doi.org/10.3390/w7105831