1. Introduction
The Yarlung Zangbo River (YZR) is the largest in Tibet and located at the highest altitude in the world with an average elevation of greater than 4600 m above sea level. It originates from the Chamyungdung glacier at an elevation of 5200 m in the south-central Tibet. The basin is long in the east-west direction and narrow in the south-north direction. Its south and north are the Himalayas and Gangdis-Nyainqentanglha Ranges, respectively. Located at the Yarlung Zangbo Suture Zone, the YZR acts as the precipitation generation source over the Tibetan Plateau because of its enormous transportation channels carrying moisture from the Indian Ocean to the inner region of the plateau [
1]. Therefore, climate of the YZR Basin plays a significant role in the formation and development of atmosphere circulation, climate change, and inclement weather in the Tibetan Plateau [
1,
2,
3].
Obvious warming has been observed in the late decades over the Tibetan Plateau and the YZR Basin, as in other parts of the world [
4,
5,
6,
7,
8,
9]. For example, Liu and Chen [
10] found that the main portion of the Tibetan Plateau has experienced statistically significant warming since mid-1950s, and suggested that the plateau is one of the most sensitive areas to respond to global climate change. In the YZR Basin, a relatively larger temperature increase could also be found compared to the mean temperature of China [
11,
12]. You
et al. [
11] used the linear regression method to analyze the trends of precipitation, air temperature, and potential evapotranspiraton (PET) at 10 climate stations within the basin. Results suggested that both precipitation and air temperature increased from 1961 to 2005 over the YZR Basin with the rates of 6.75 mm/decade and 0.28 °C/decade, respectively, but PET had a decreasing trend, especially after the 1980s. Liu
et al. [
12] also analyzed the climate trends of the YZR Basin from 1974–2000, and results showed that precipitation increased insignificantly and air temperature increased significantly.
Climate station network is sparse in this large Tibetan basin due to its high elevation, complex terrain, and harsh environment, especially in the central and western regions. Previous studies of climate change in the YZR Basin were largely affected by lack of climate station data. In order to overcome uncertainties in climate change analysis due to limited station data, we revisited climate change based on the gridded forcing climate data, which can reduce input uncertainties to a large extent. Therefore, the objectives of this study are to: (1) revisit climate change of the YZR Basin with a more detailed and reliable precipitation and temperature dataset (1961–2014) than used in previous studies; and (2) evaluate the dryness and wetness evolutions with the Standardized Precipitation Evapotranspiration Index (SPEI) in the YZR Basin. In this study, monotonic trends of annual and seasonal precipitation, maximum/mean/minimum air temperature within different regions of the basin were investigated. In addition, spatial and temporal evolutions of meteorological drought index (SPEI) were calculated and analyzed.
2. Materials and Methods
2.1. YZR Basin
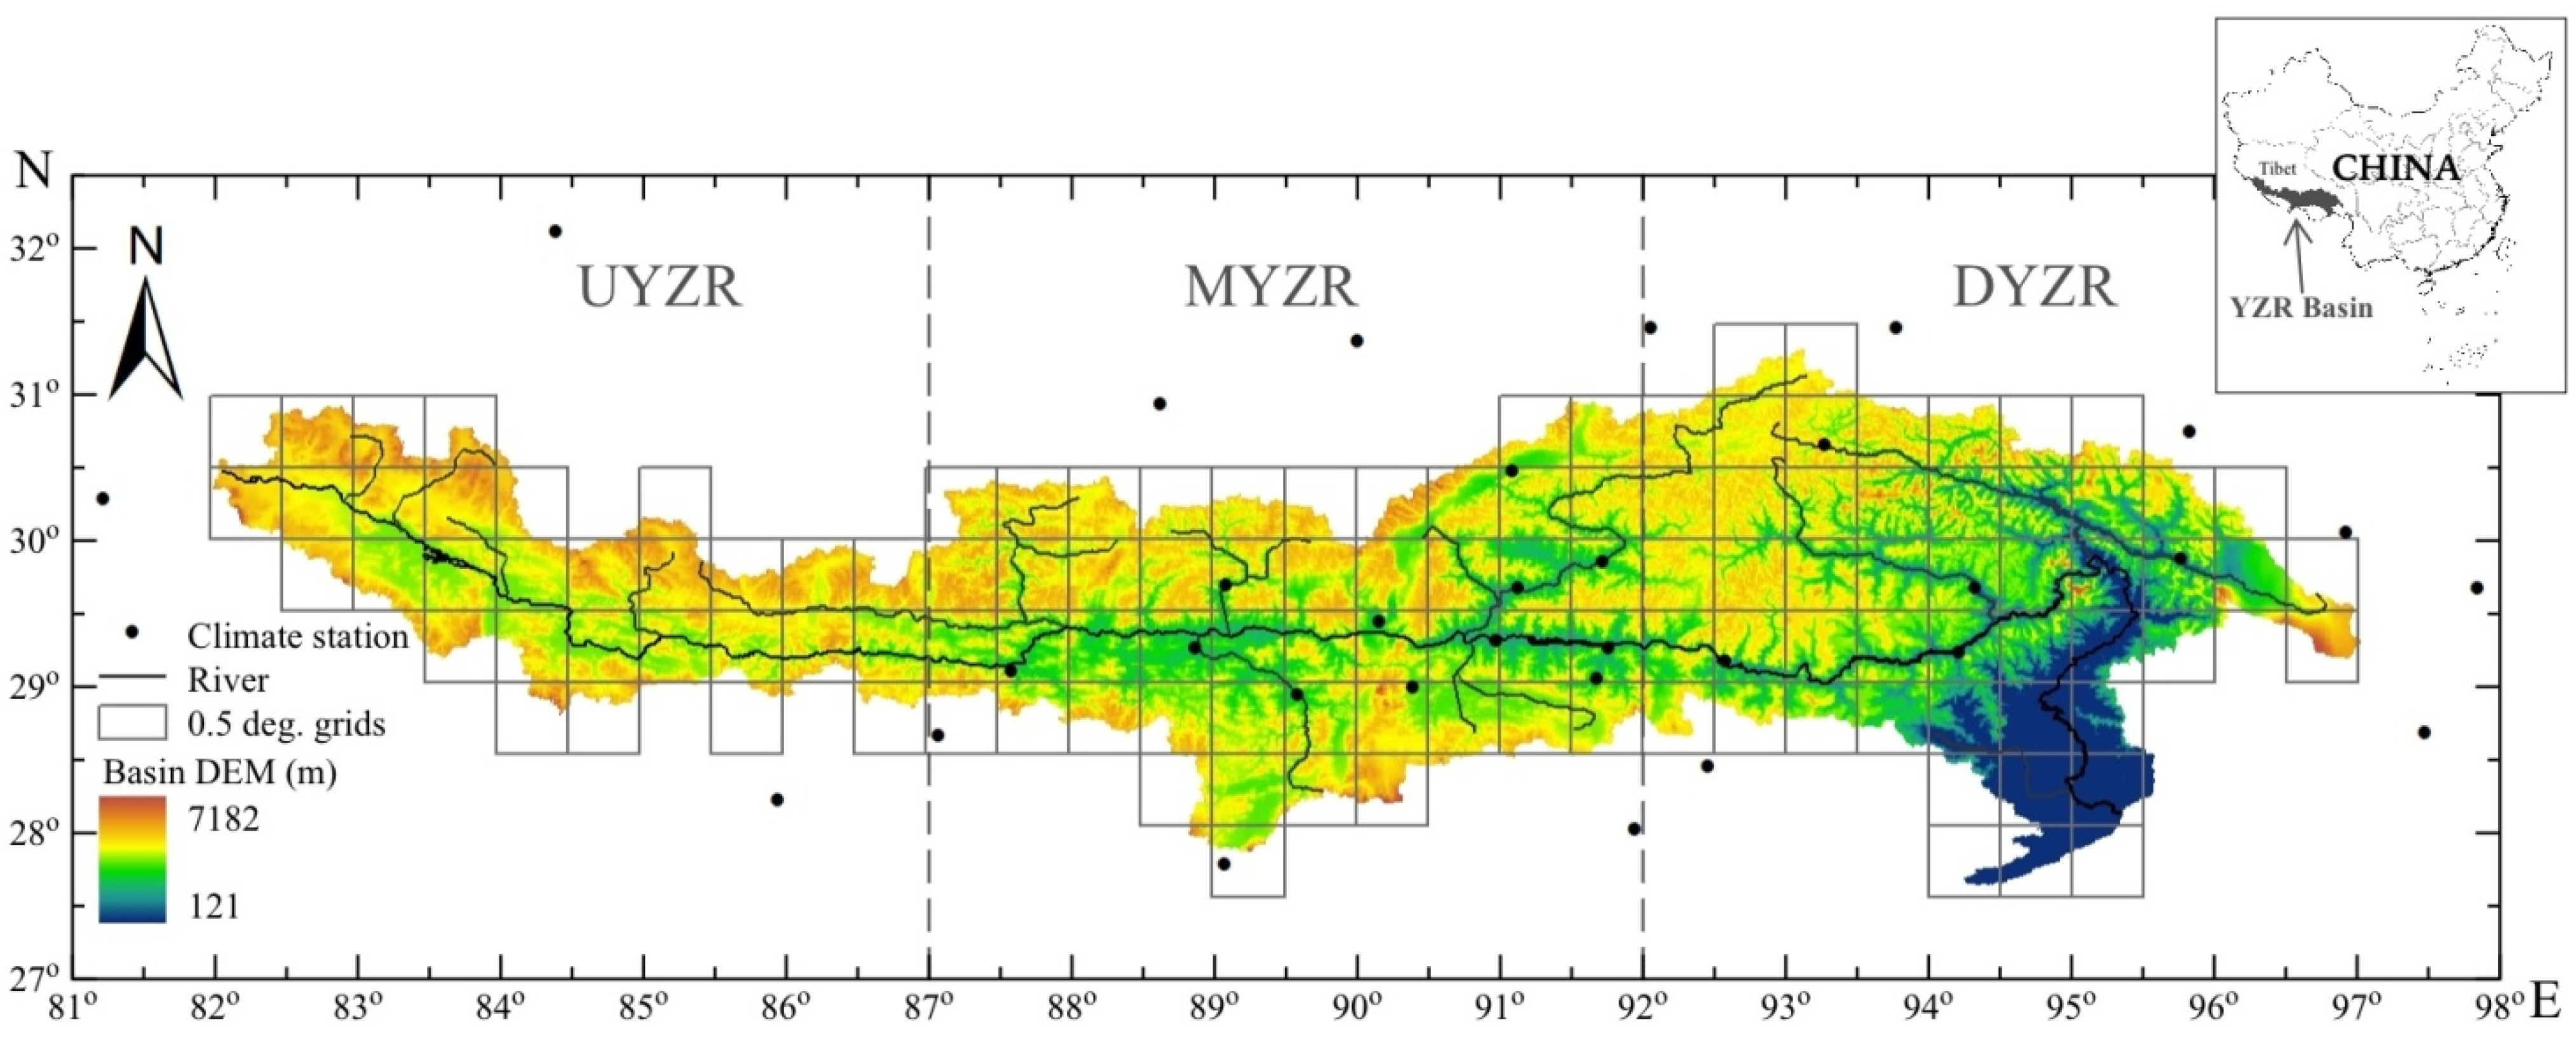
The YZR Basin (upstream of Brahmaputra River), located at 27°80'–31°02' N and 81°09'–97°10' E, is the largest river system in the Tibetan Plateau (
Figure 1). It originates at the Chamyungdung glacier (5200 m) in south-central Tibet, and is located at the highest altitude in the world with an average elevation of over 4000 m above sea level. The river length in China is about 2000 km, and the basin covers the area of about 2.4 × 10
5 km
2, with maximum width less than 300 km [
13]. The YZR Basin is part of the Indian Ocean water system. It exhibits obvious variation in its climate from the upstream to downstream regions of the basin, while wetter and warmer conditions are found downstream than upstream. Most precipitation falls during June and September [
11].
Figure 1 shows the national climate station network released by the Climate Data Center, China Meteorological Administration (CDC-CMA) within and besides the YZR Basin, among which 16 out of 32 are located within the basin. Obviously, only the data from these surface stations could not provide an accurate analysis of climate change for the YZR Basin, especially for the upstream area of the basin. Therefore, we divided the whole basin into three subareas: upstream, midstream, and downstream (denoted as UYZR, MYZR, and DYZR, respectively) according to the basin length in longitudinal direction. The longitudes of 87° E and 92° E are two boundaries of these three subareas.
Figure 1.
The YZR Basin, surface climate stations, and the 0.5 degree grids.
Figure 1.
The YZR Basin, surface climate stations, and the 0.5 degree grids.
2.2. Forcing Data
In this study, data used for trend analysis and drought index calculation, including monthly series of precipitation and maximum/mean/minimum air temperature, were obtained from the 0.5 Degree Gridded Monthly China Surface Precipitation and Air Temperature Dataset (Version 2) which was developed by CDC-CMA. This dataset is generated based on the data collected at 2472 climate stations and the Thin Plate Spline interpolation technique. This helps in evaluating climate change of the YZR Basin in both time and space more accurately as opposed to just using point climate station data. In total, only 824 climate station data for the entire country of China are released by CDC-CMA, showing a relatively sparse station networks in the YZR Basin, especially in its upstream area.
2.3. SPEI Calculation and Trend Test Method
Several meteorological drought indices are developed to describe the characteristics of climate change in multi-temporal scales, e.g., the Standardized Precipitation Index (SPI) [
14] and SPEI [
15]. SPEI was developed combining the sensitivity of the Palmer Drought Severity Index (PDSI) [
16] to changes in evaporation demand and robustness of the multi-temporal nature of the SPI. It is defined as an index of water balance (precipitation minus PET). The Penman-Monteith equation [
17] and the Thornthwaite equation [
18] are two representative parameterizations using the underlying physical principles (changes in available energy, humidity, and wind speed) and air temperature, respectively, for PET calculation. Considering available climatic data in the YZR Basin, we employed the Thornthwaite equation based SPEI in this study. A time-series of the difference between precipitation and PET was fitted to a three parameter log-logistic probability distribution to take into account common negative values [
19]. This is done because the log-logistic distribution shows a very close fit to the data series. SPEI employs the dry and wet categories as used by SPI in
Table 1 [
20].
Table 1.
SPEI drought index categories.
Table 1.
SPEI drought index categories.
| Mositure Cateory | SPEI |
|---|
| Extremely wet (EW) | 2.00 and above |
| Very wet (VW) | 1.50 to 1.99 |
| Moderately wet (MW) | 1.00 to 1.49 |
| Near normal (NN) | −0.99 to 0.99 |
| Moderately dry (MD) | −1.00 to −1.49 |
| Severely dry (SD) | −1.50 to −1.99 |
| Extremely dry (ED) | −2.00 and less |
The nonparametric Mann-Kendall (MK) test [
21,
22] was used to detect trends in time series of meteorology and drought index. Positive (or negative) Z values of the MK test signify an increasing (or decreasing) trend. In order to eliminate the effect of significant serial correlation in time-series on trend analysis, a trend-free pre-whitening procedure [
23] was used before applying the MK test. For a time-series, its increasing or decreasing slope (change per unit time) can be estimated by using the Sen’s slope method [
24]. A positive (or negative) slope value indicates the increasing (or decreasing) trend in a time-series.
3. Results and Discussion
3.1. Precipitation Trends
In the YZR Basin, average precipitation increases considerably from upstream to downstream with the mean of 512.40 mm for the period of 1961–2014 (
Table 2). This is determined by the Indian Ocean water system as moisture is carried from the Indian Ocean to the inner region [
12]. In addition, about 60% of the precipitation falls in summer while only less than 5% occurs in winter during the period of 1961–2014 (
Table 2).
Table 2.
MK tests of annual and seasonal precipitation in the YZR Basin during 1961–2014.
Table 2.
MK tests of annual and seasonal precipitation in the YZR Basin during 1961–2014.
| Periods | Areas | Average (mm) | Slope (mm/10a) | MK-Z | Significance |
|---|
| Year | UYZR | 266.52 | 10.26 | 1.25 | <90% |
| MYZR | 380.38 | 5.15 | 0.93 | <90% |
| DYZR | 784.02 | 6.44 | 0.79 | <90% |
| YZR | 512.40 | 6.32 | 0.88 | <90% |
| Spring | YZR | 96.14 | 3.42 | 2.65 | 99% |
| Summer | YZR | 298.92 | 1.21 | 0.01 | <90% |
| Fall | YZR | 95.87 | 1.22 | 0.53 | <90% |
| Winter | YZR | 21.54 | −0.08 | −0.24 | <90% |
Annual and seasonal precipitation series was analyzed in
Table 2 which shows that, during the period of 1961–2014, precipitation experienced a statistically insignificant increasing trend with the slope rate of 6.32 mm per decade (mm/10 years) in the YZR Basin. Three seasons contributed this increasing trend, except for winter, which showed a slightly decreasing trend at the rate of −0.08 mm per year (mm/year). Only the spring’s precipitation trend was statistically significant with the confidence level of 99%.
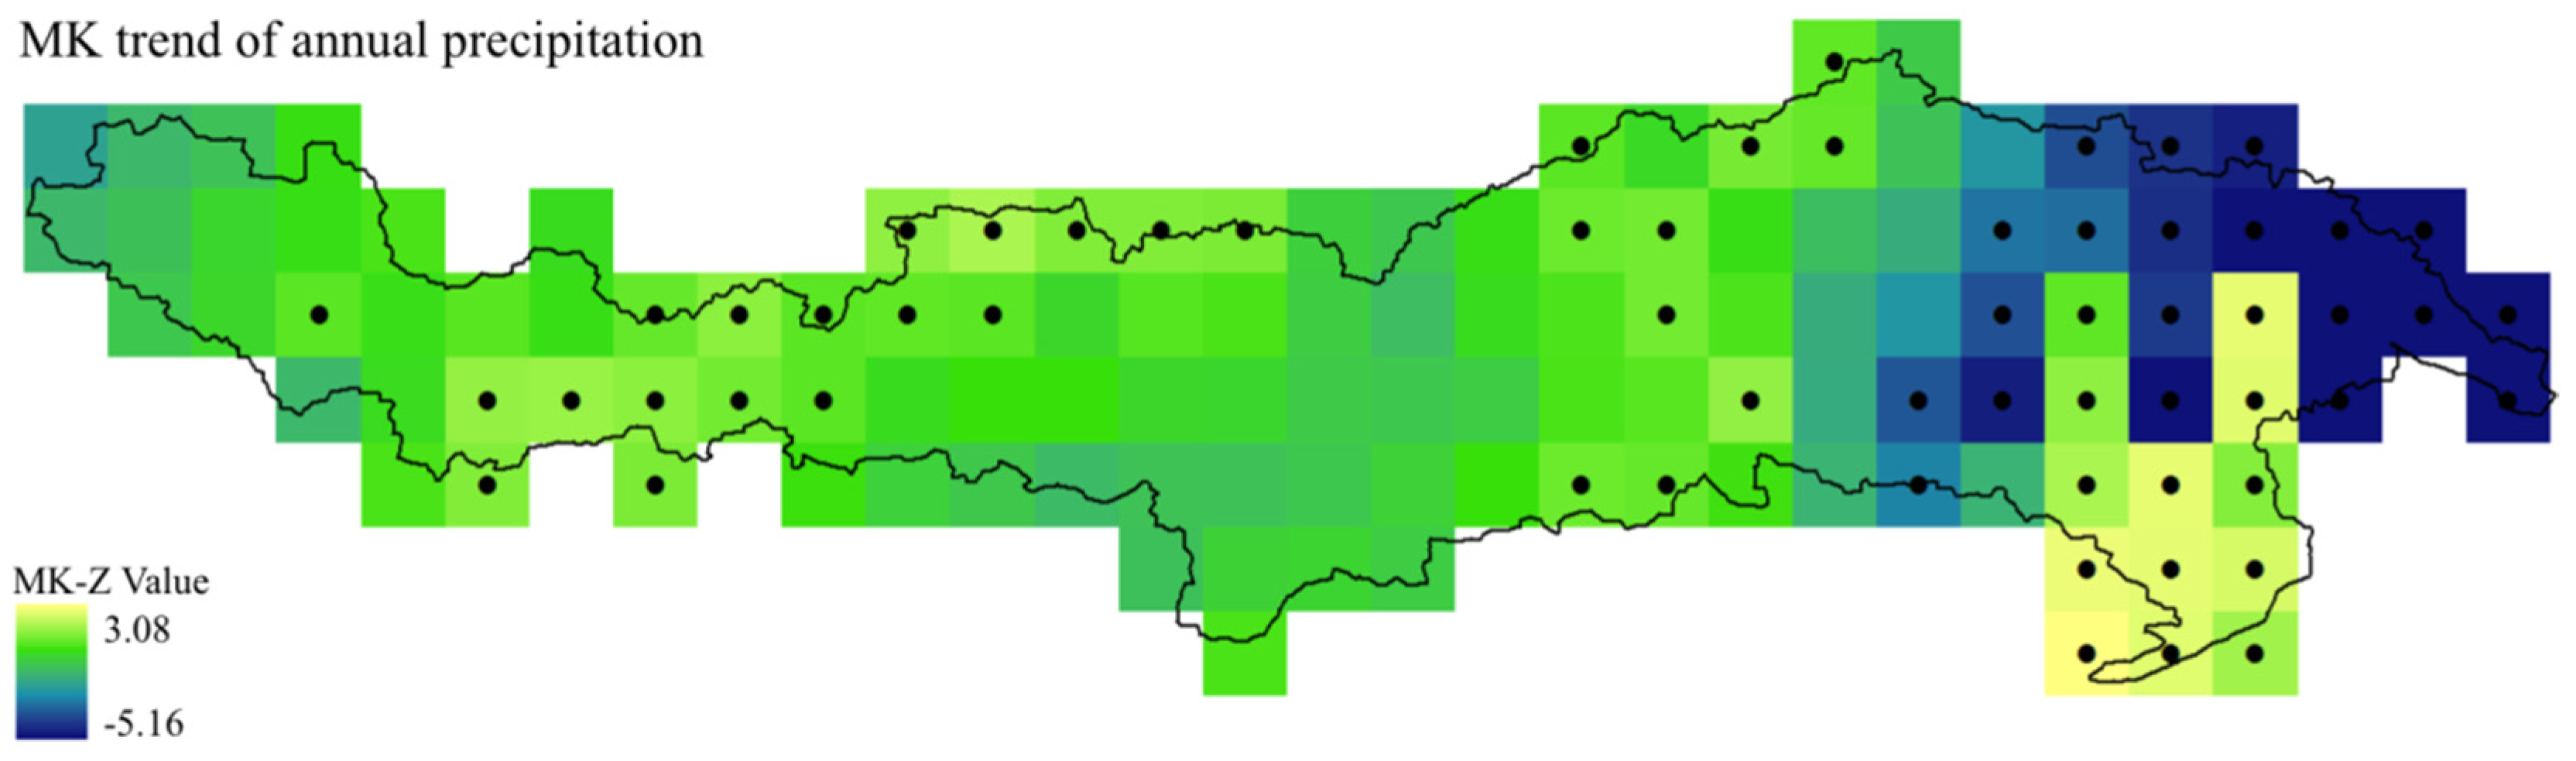
Figure 2 shows spatial patterns of MK-Z values of annual precipitation trend test. Results indicated that most of the grids in the YZR Basin (75%) experienced the upward trend except for few grids in the downstream area for the period of 1961–2014. Most of the grids with statistically significant decreasing trends of precipitation located at the eastern part of the basin. Despite of these downward trending grids, the DYZR area also experienced increasing trend of annual precipitation as a whole like UYZR and MYZR.
Figure 2.
Spatial variation of MK-Z value of annual precipitation trend test during 1961–2014. Grids are in size of 0.5 degree × 0.5 degree. Grids with black dots in the center represent the statistically significant trends with the confidence level of 90%.
Figure 2.
Spatial variation of MK-Z value of annual precipitation trend test during 1961–2014. Grids are in size of 0.5 degree × 0.5 degree. Grids with black dots in the center represent the statistically significant trends with the confidence level of 90%.
3.2. Air Temperature Trends
Table 3 shows the MK tests of annual and seasonal air temperature in the YZR Basin during 1961–2014. Averaging on the entire YZR Basin, annual mean temperature (TMEAN) is 0.31 °C, while the annual maximum and minimum values (TMAX and TMIN) are 7.58 °C and −2.52 °C, respectively. Spatial nature of air temperature is in accordance to the basin elevation,
i.e., it becomes warmer from upstream to downstream. For the seasonal temperature, air temperatures of 8.14 °C and −7.71 °C for TMEAN could be found for summer and winter, respectively.
Table 3.
MK tests of annual and seasonal air temperature in the YZR Basin during 1961–2014.
Table 3.
MK tests of annual and seasonal air temperature in the YZR Basin during 1961–2014.
| Periods | Areas | TMAX | TMEAN | TMIN |
|---|
| Average (°C) | Slope (°C/10a) | Average (°C) | Slope (°C/10a) | Average (°C) | Slope (°C/10a) |
|---|
| Year | UYZR | 4.06 | 0.25 | −3.02 | 0.37 | −9.50 | 0.52 |
| MYZR | 6.84 | 0.25 | −0.44 | 0.35 | −6.92 | 0.45 |
| DYZR | 10.39 | 0.19 | 3.01 | 0.28 | −2.52 | 0.32 |
| YZR | 7.58 | 0.21 | 0.31 | 0.32 | −5.80 | 0.43 |
| Spring | YZR | 6.85 | 0.16 | −0.22 | 0.27 | −6.37 | 0.40 |
| Summer | YZR | 14.30 | 0.18 | 8.14 | 0.29 | 3.43 | 0.33 |
| Fall | YZR | 8.35 | 0.25 | 1.01 | 0.33 | −4.86 | 0.38 |
| Winter | YZR | 0.82 | 0.26 | −7.71 | 0.42 | −15.38 | 0.56 |
The MK trend tests suggested that all temperature series had statistically significant (99% confidence level) warmer trends during 1961–2014. As a whole, TMEAN of the YZR Basin experienced a warming trend at the rate of 0.32 °C/10 years, while the slope rate for TMIN can be even as large as 0.43 °C/10 years. These warming rates are obviously larger than the rates in many other regions of the world as global mean surface temperature over the past 20 years (1993–2012) rose at the rate of 0.14 ± 0.06 °C/10 years (95% confidence interval) [
25]. For the seasonal trends, winter was the most statistically significant warming season with the rates of 0.26 °C/10 years, 0.42 °C/10 years and 0.56 °C/10 years for TMAX, TMEAN and TMIN, respectively. It was found that both annual and seasonal series of TMIN had the largest warming slope rate in all parts of the basin.
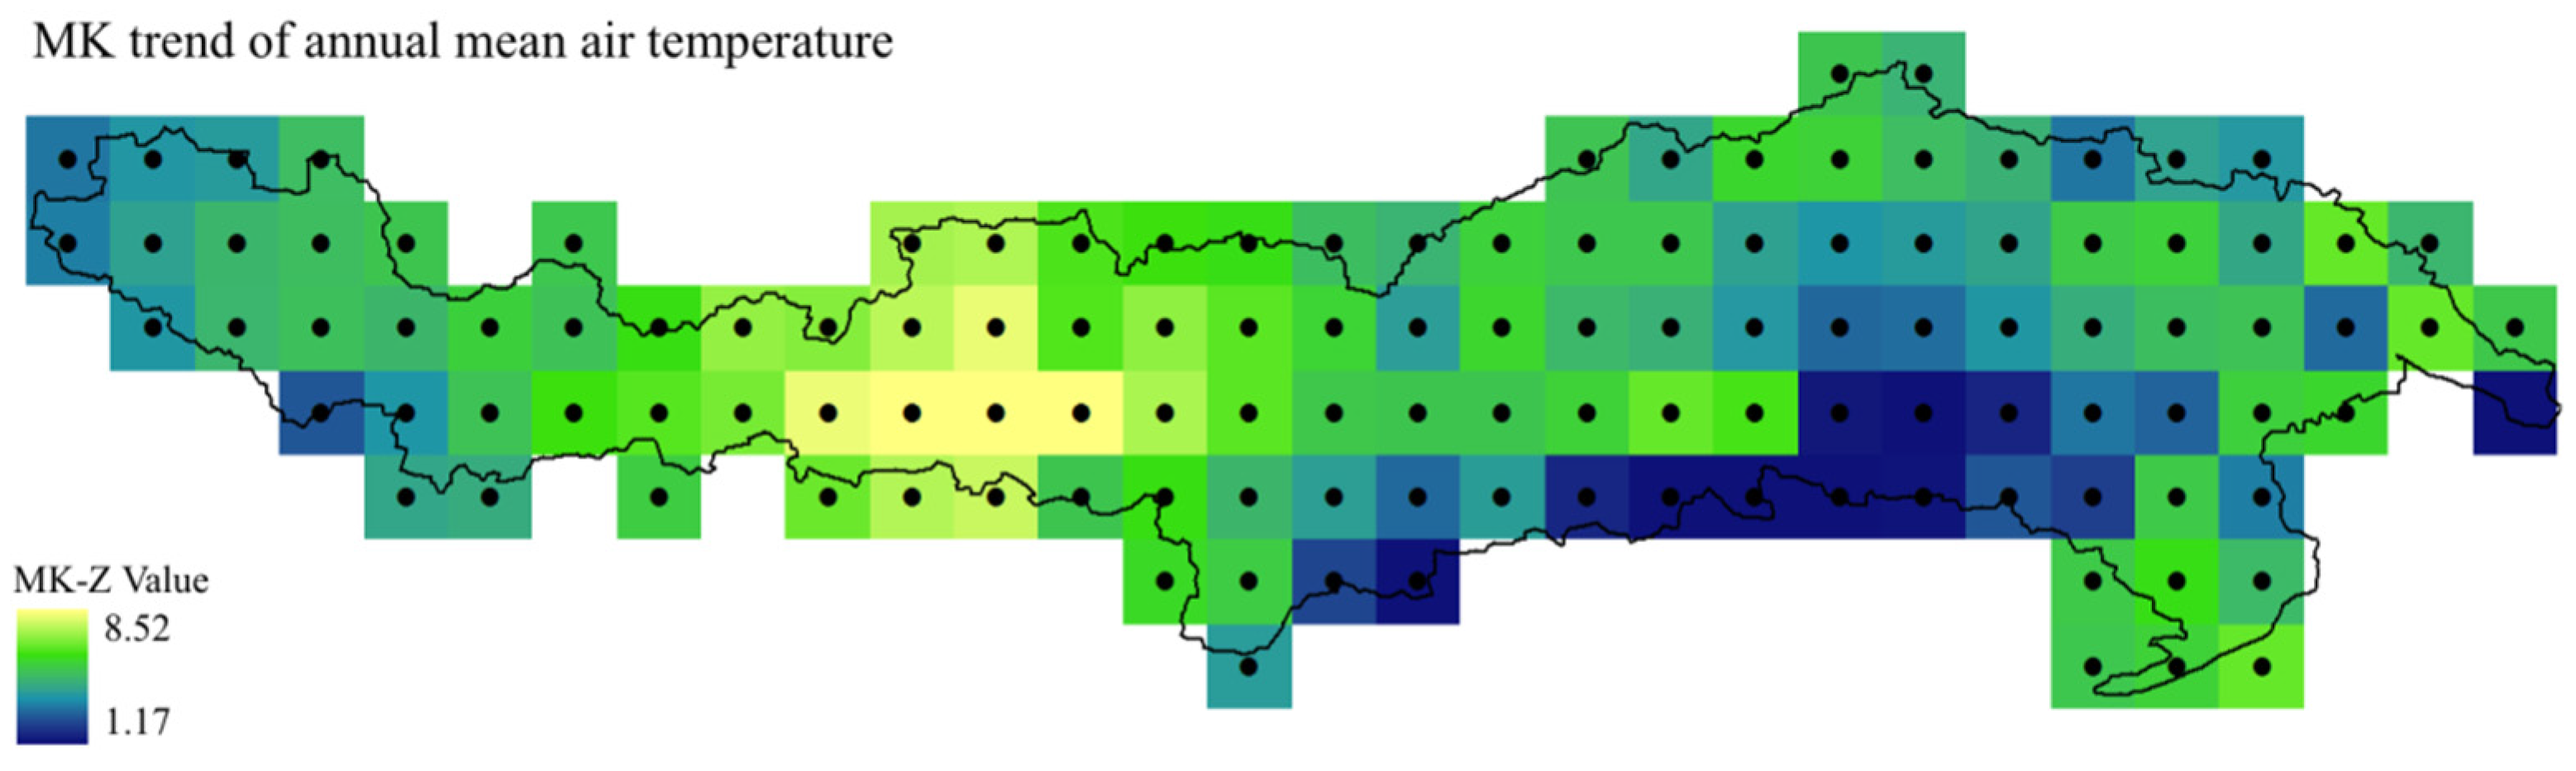
Figure 3 shows a spatial variation of MK trend test results of annual TMEAN series during 1961–2014. Obviously, all grids had statistically significant upward trend (
Z value > 1.28) except for one location at the southeastern edge of the basin (
Z value = 1.17). The largest warming trend could be found in the left half part of the MYZR area, while the corresponding largest slope rate and MK-Z value were 0.80 °C/10 years and 8.52, respectively. All these results suggest that the YZR Basin is very sensitive to climate change in temperature because warming rate is much larger than most other regions and global mean in the past decades [
8,
20,
25].
Figure 3.
Same as
Figure 2, but for annual mean air temperature.
Figure 3.
Same as
Figure 2, but for annual mean air temperature.
3.3. Evolution of SPEI
3.3.1. Temporal Variations
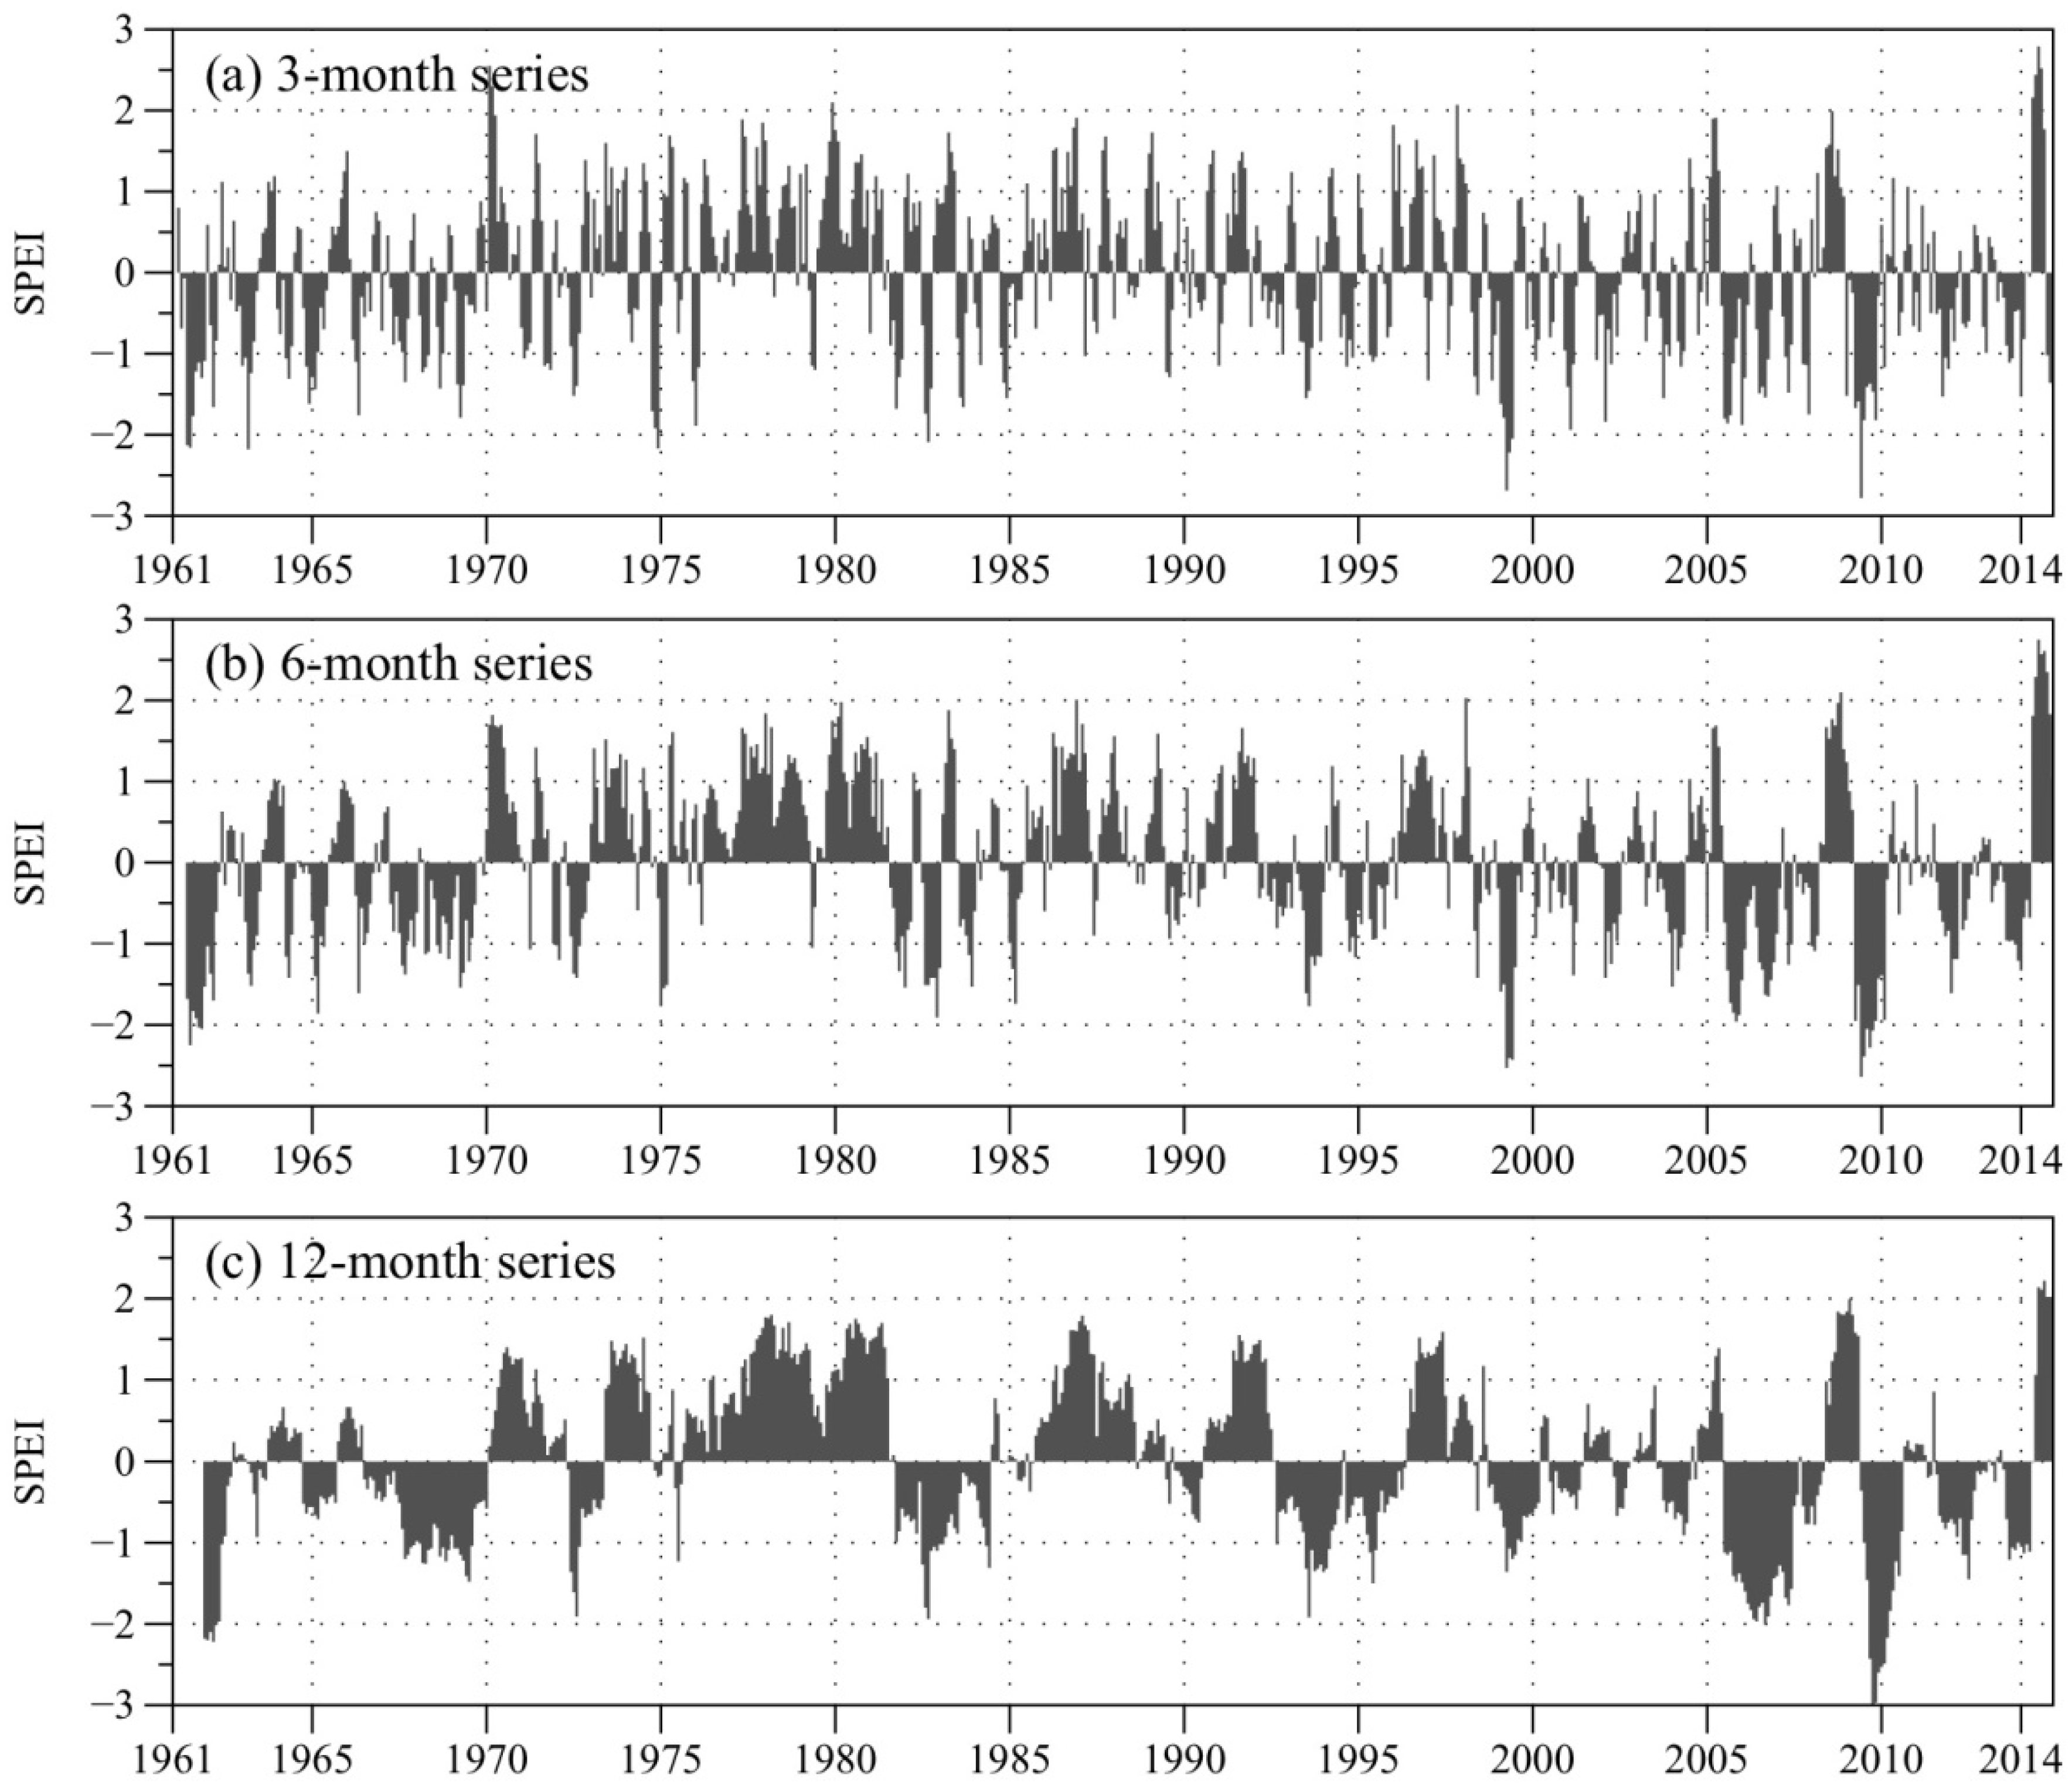
Figure 4 shows an evolution of SPEI over three, six, and 12 months intervals in the period of 1961–2014. For the entire YZR Basin, short timescale (three-month) showed a higher temporal frequency of dry and wet periods of SPEI. Alternate dry and wet periods occurred during the study period, whereas the wet episodes were mainly in the 1970s and late 1980s for the 12-month SPEI series. A serious 12-month scale drought event was found in the October 2009 with SPEI of 3.0. As a whole, the YZR Basin stands approximately an even chance of dry/wet condition during the period of 1961–2014.
Figure 4.
Evolutions of three-, six-, and 12-month SPEI for the entire YZR Basin from 1961–2014.
Figure 4.
Evolutions of three-, six-, and 12-month SPEI for the entire YZR Basin from 1961–2014.
We evaluated statistics of decadal differences of dry and wet episodes in the YZR Basin in terms of the occurrence number, average duration (months) and magnitude in
Table 4. Firstly, the dry or wet episode was identified with the threshold values of −1 and 1, respectively. Then, the above three statistical indicators can be calculated for each dry or wet episode based on their definitions [
14]: the duration is the number of consecutive months with values <−1 (>1) for dry (wet) and the sum of 12-month SPEI values is the dry (wet) magnitude. For the period of 1961–2014, the numbers of dry and wet episodes were almost the same (18
vs. 19). In the decadal statistics, there was also no obvious trend of occurrence number for both dry and wet episodes. For the dry episodes, average duration and magnitude (with values of 18 months and −31.8) for a single episode during 2001–2010 were the most severe. This suggests that, despite no evident trend of occurrence number, severity of dry episode aggravated in terms of duration and magnitude. For the wet episodes, no obvious difference from other decadal results could be found during 2001–2010.
Table 4.
Occurrence number (ON), average duration (months) and magnitude of 12-month SPEI based dry and wet episodes.
Table 4.
Occurrence number (ON), average duration (months) and magnitude of 12-month SPEI based dry and wet episodes.
| Periods | Dry Episodes | Wet Episodes |
|---|
| ON | Duration | Magnitude | ON | Duration | Magnitude |
|---|
| 1961–1970 | 5 | 5.4 | −7.4 | 1 | 8.0 | 10.1 |
| 1971–1980 | 2 | 2.5 | −3.6 | 8 | 6.9 | 9.7 |
| 1981–1990 | 2 | 5.0 | −6.3 | 4 | 3.8 | 5.3 |
| 1991–2000 | 4 | 4.3 | −5.4 | 3 | 7.7 | 10.4 |
| 2001–2010 | 2 | 18.0 | −31.8 | 2 | 6.0 | 9.7 |
| 2011–2014 | 3 | 3.3 | −3.8 | 1 | 7.0 | 13.6 |
| 1961–2014 | 18 | 5.8 | −8.5 | 19 | 6.3 | 9.1 |
3.3.2. Spatial Variations
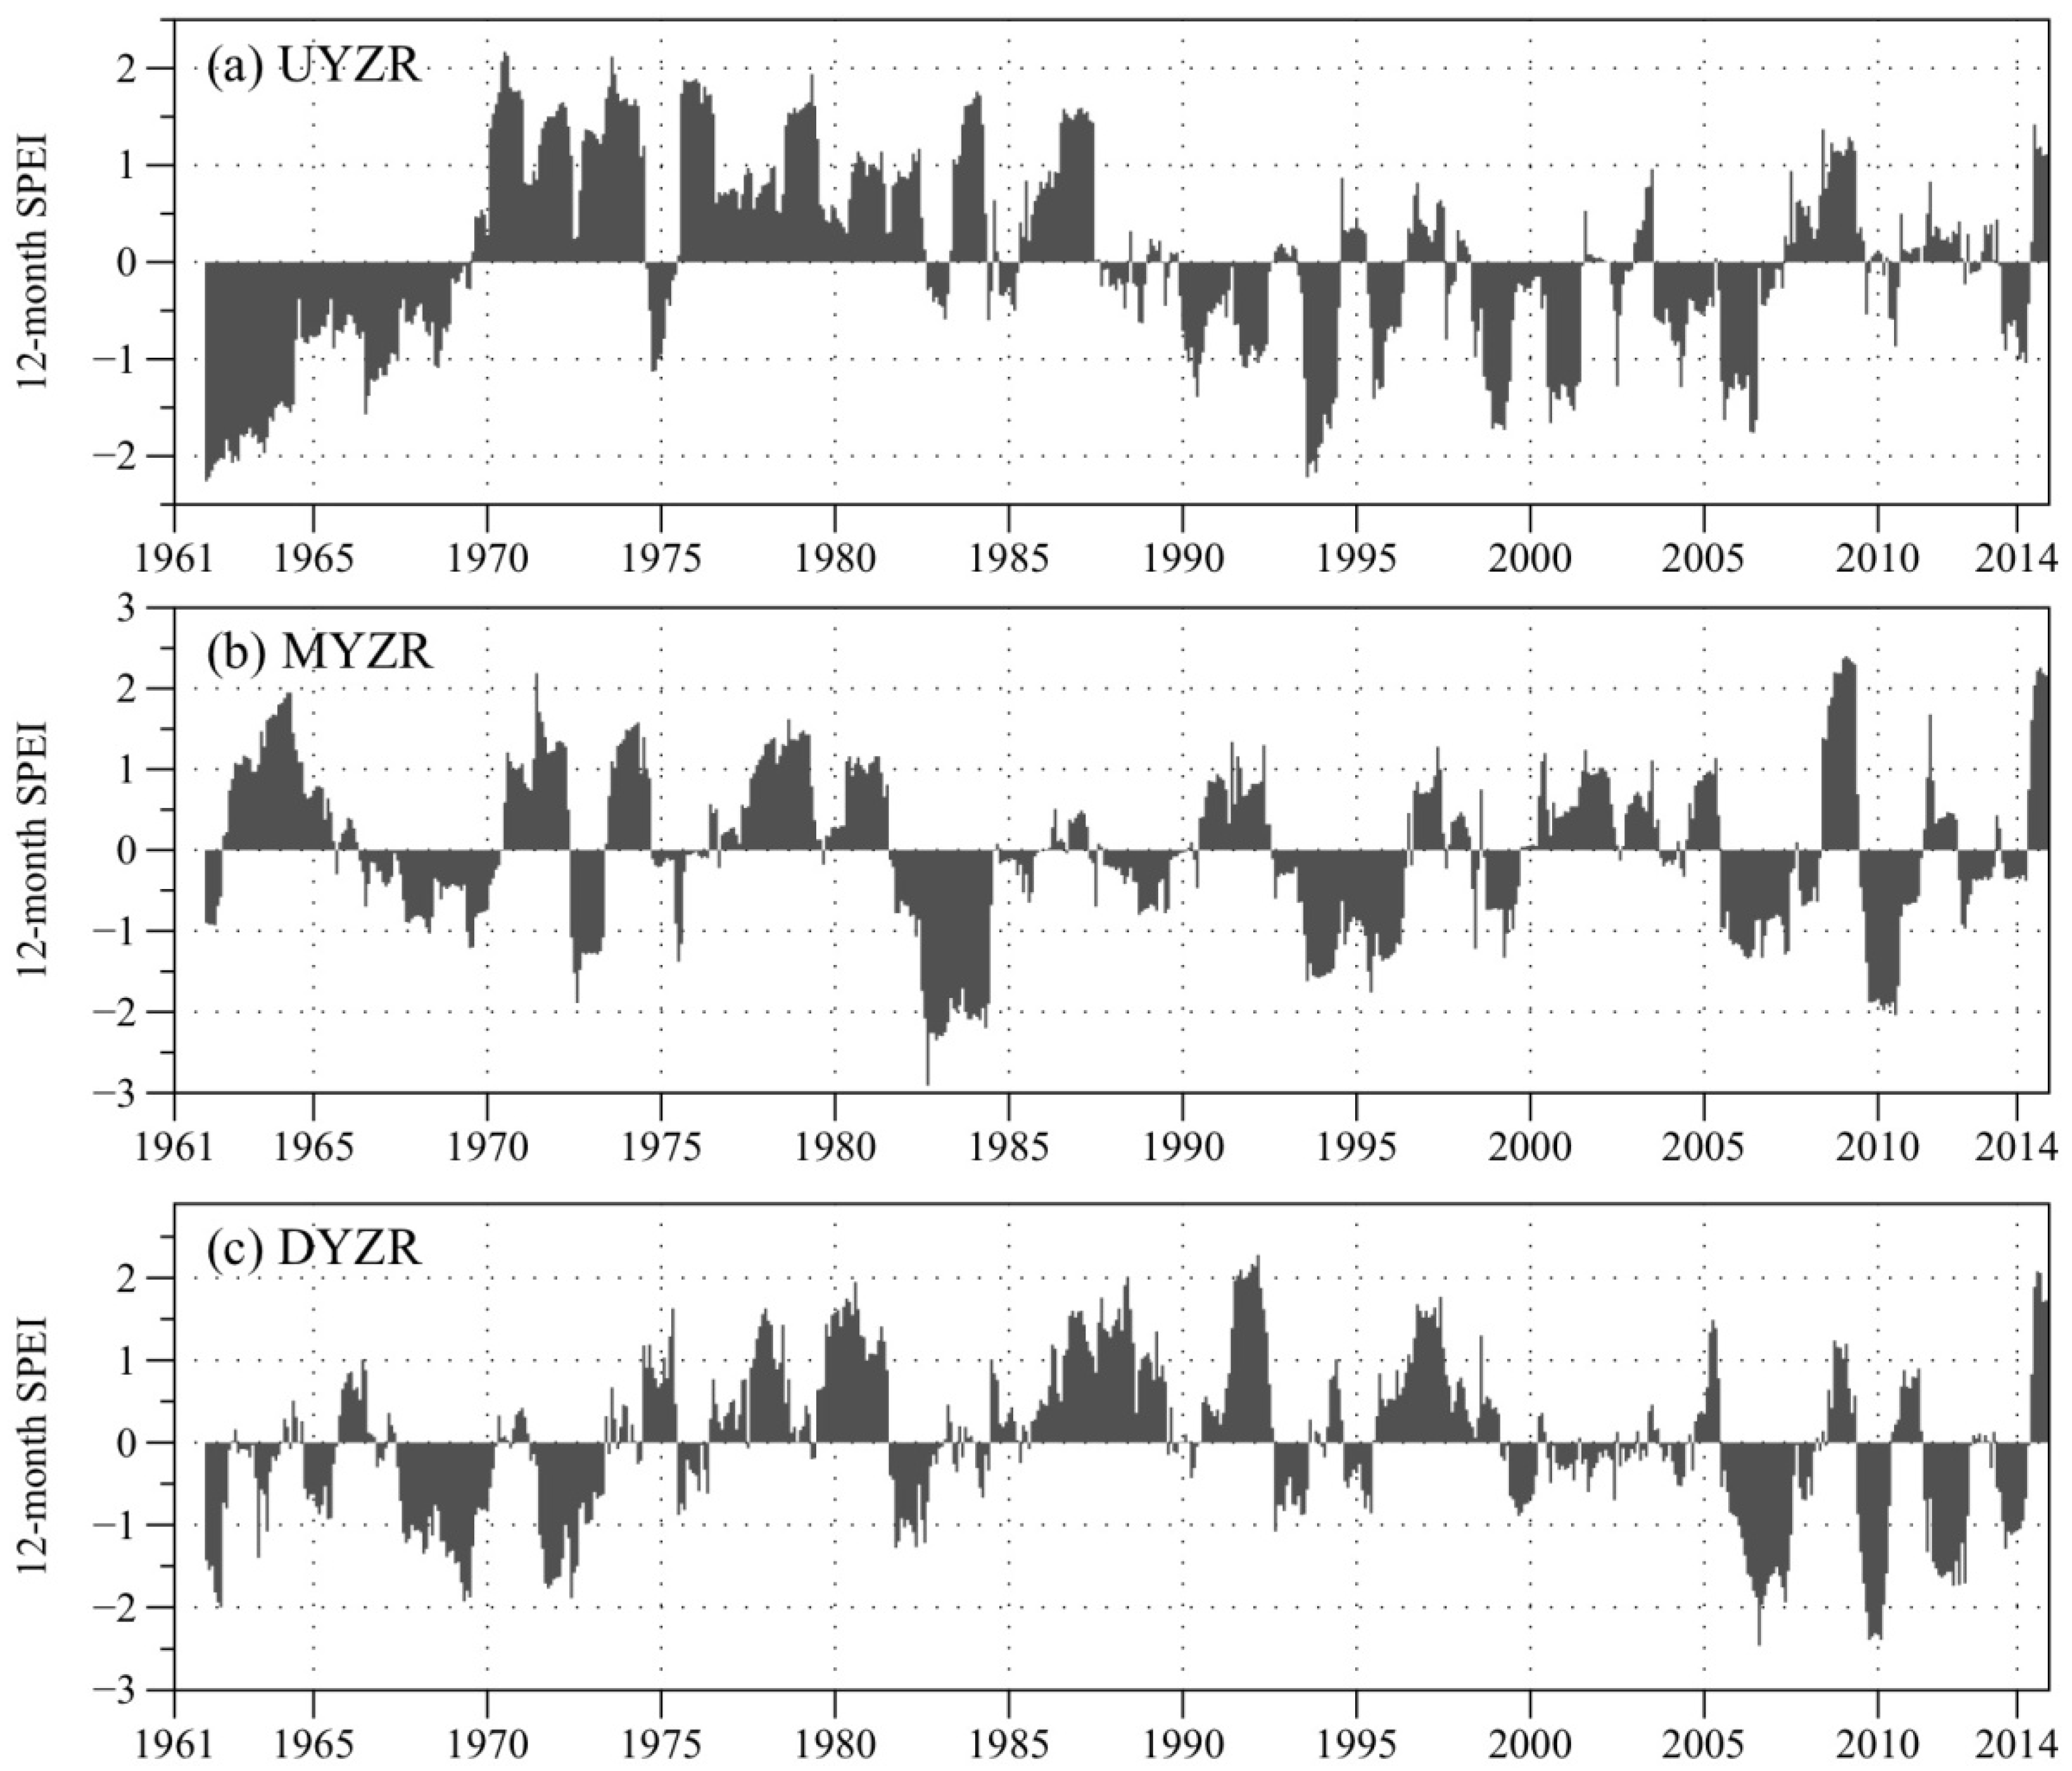
Figure 5 shows the 12-month SPEI series for different parts of the basin,
i.e., UYZR, MYZR, and DYZR, during 1961–2014, while the area mean SPEI values are calculated based on the drought index at each grid. Evident differences could be found in the spatial distribution of SPEI. In the UYZR area, dry and wet period always lasted for several consecutive years. For example, a dry condition controlled nine years from 1961 to 1969, and then wet condition took the main role during 1970–1990 except for a moderately dry period (−1.49 < SPEI < −1.00) of two months in October and November 1974 and some near normal condition periods (−1.00 < SPEI < 1.00). For the following years, dry episodes were still the dominating period but wet episodes increasingly occurred in the UYZR area. In the MYZR area, wet episodes obviously increased and controlled more time than that in the UYZR. In the DYZR area, dry and wet episodes occurred alternately. Thus, these parts of the basin showed different SPEI evolutions during 1961–2014. This is certainly determined by spatial variations of precipitation and mean air temperature.
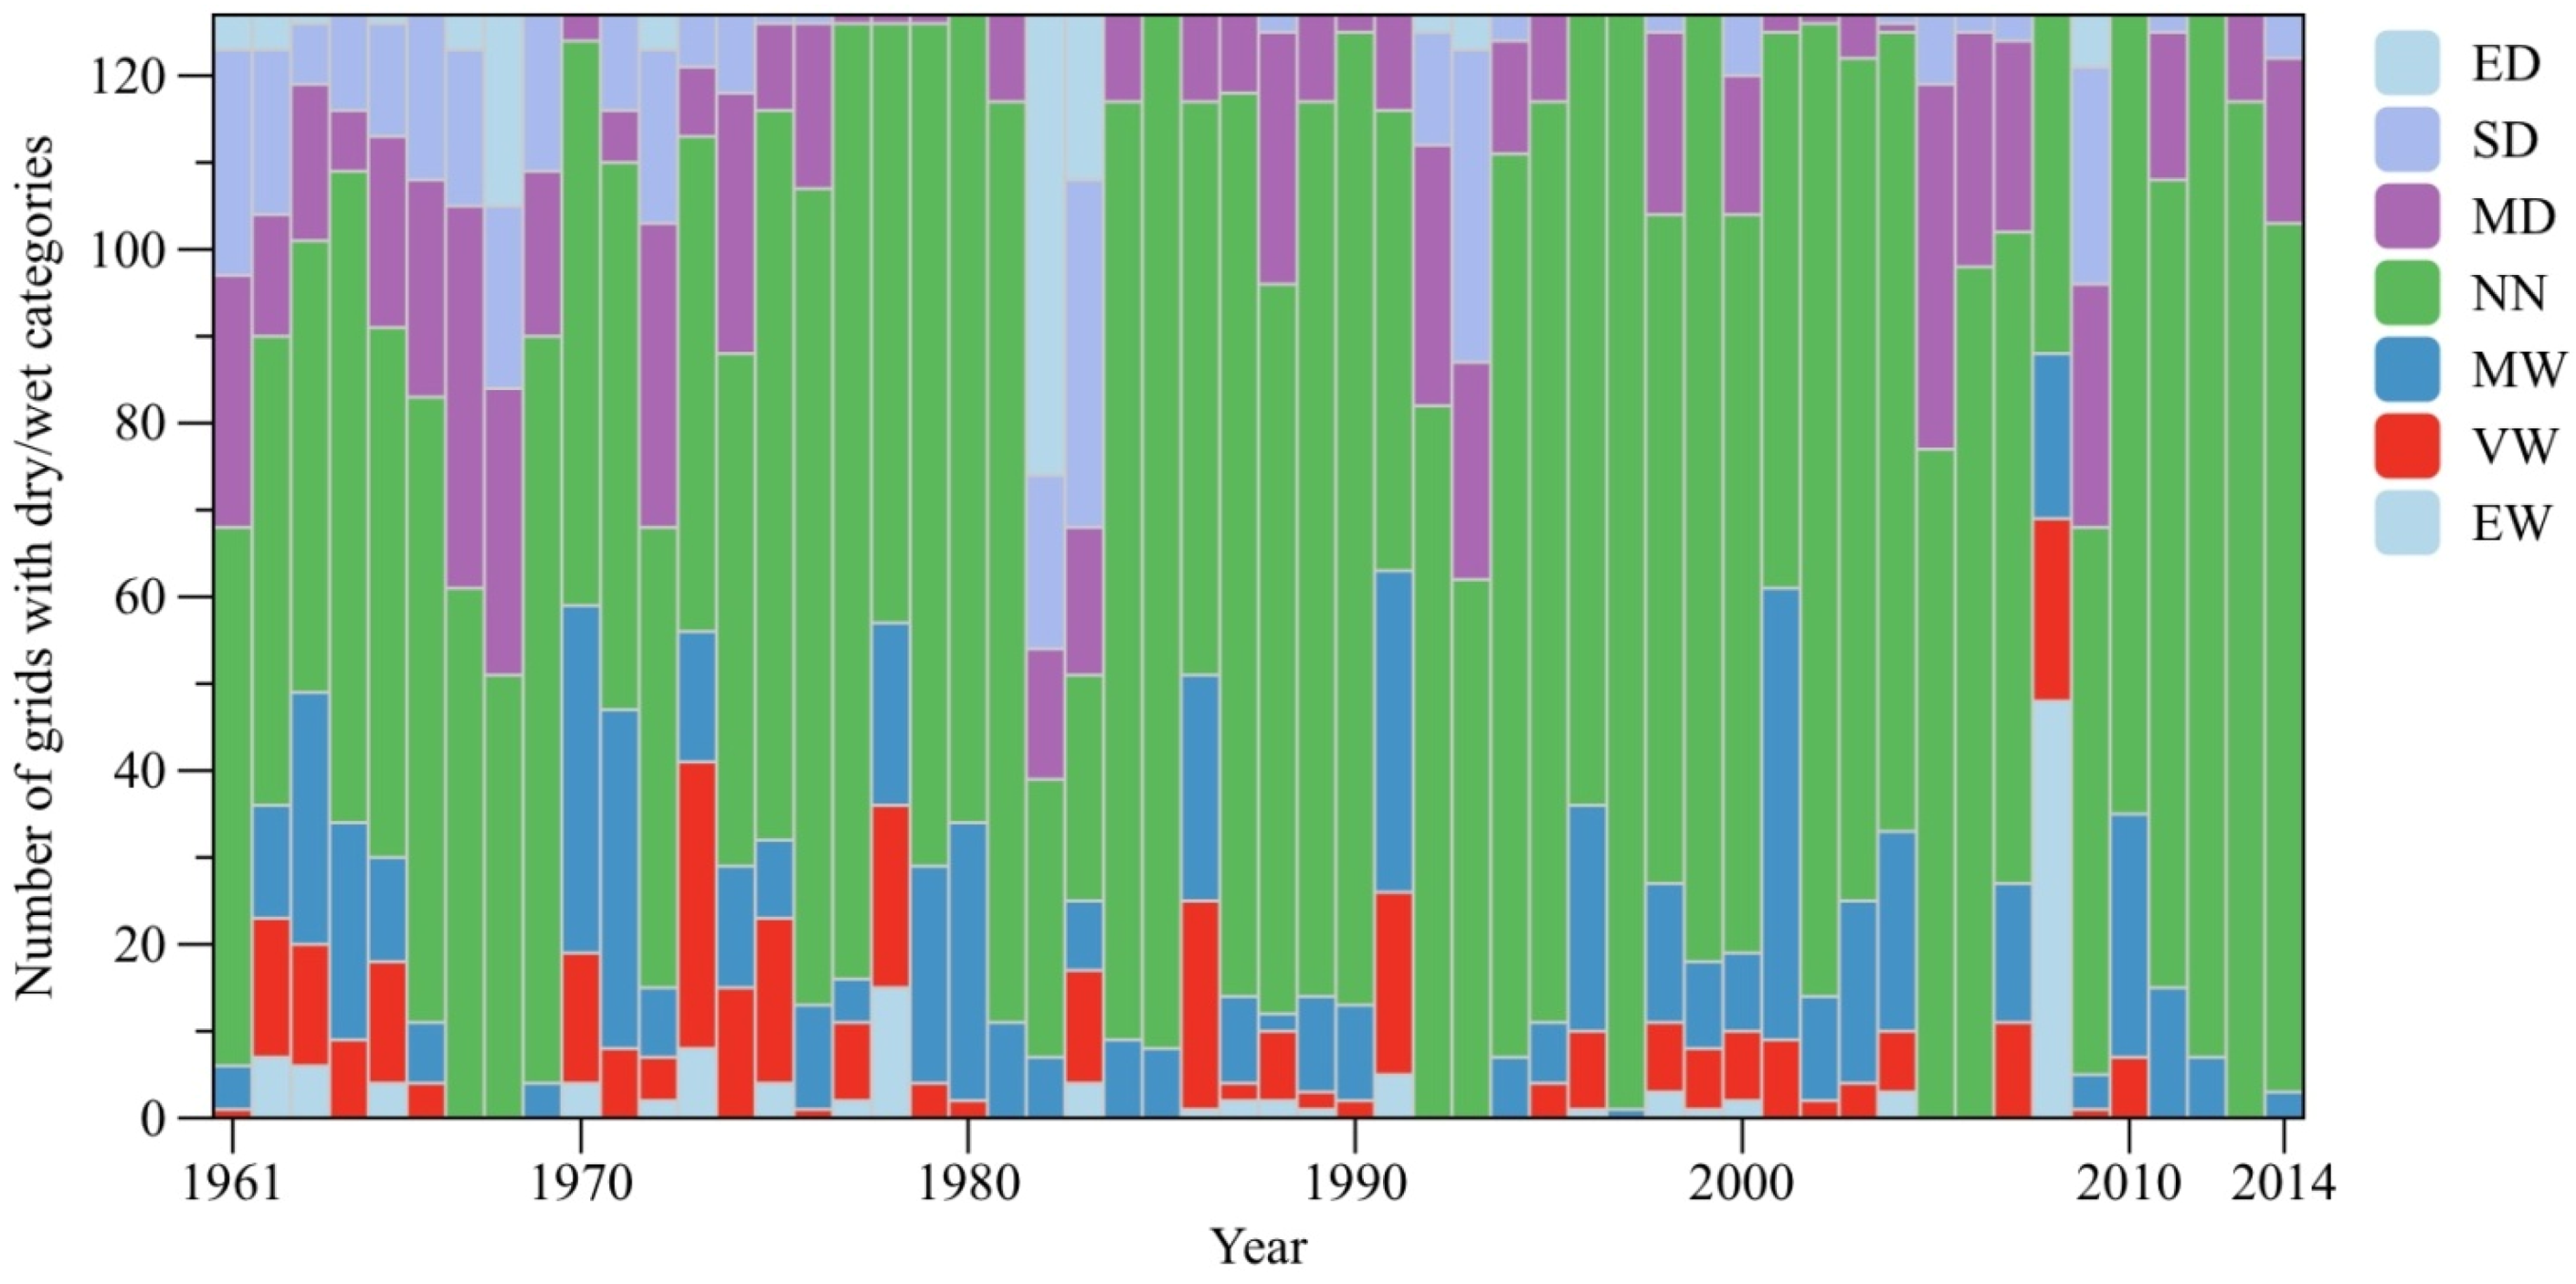
Spatial composition of each SPEI category in the YZR Basin (total 127 grids) was calculated every year in the
Figure 6. Results showed that there were 42 years with near normal grids exceeding 50% of total basin area. That is to say, near normal condition is the main weather status of the YZR Basin during 1961–2014. For severely dry and extremely dry grids, maximum area percentages were 31.4% in 1983 and 41.7% in 1982, respectively. For very wet and extremely wet grids, corresponding maximum values were 26.0% in 1973 and 37.8% in 2008, respectively. On average, for those years with non-dominated normal grids in the YZR Basin, a dry or wet condition mainly depends on the percent increase of a number of moderately dry and wet grids.
Figure 5.
Evolutions of 12-month SPEI for the UYZR, MYZR, and DYZR areas from 1961–2014.
Figure 5.
Evolutions of 12-month SPEI for the UYZR, MYZR, and DYZR areas from 1961–2014.
Figure 6.
Number of grids in the YZR Basin for each SPEI category during 1961–2014.
Figure 6.
Number of grids in the YZR Basin for each SPEI category during 1961–2014.
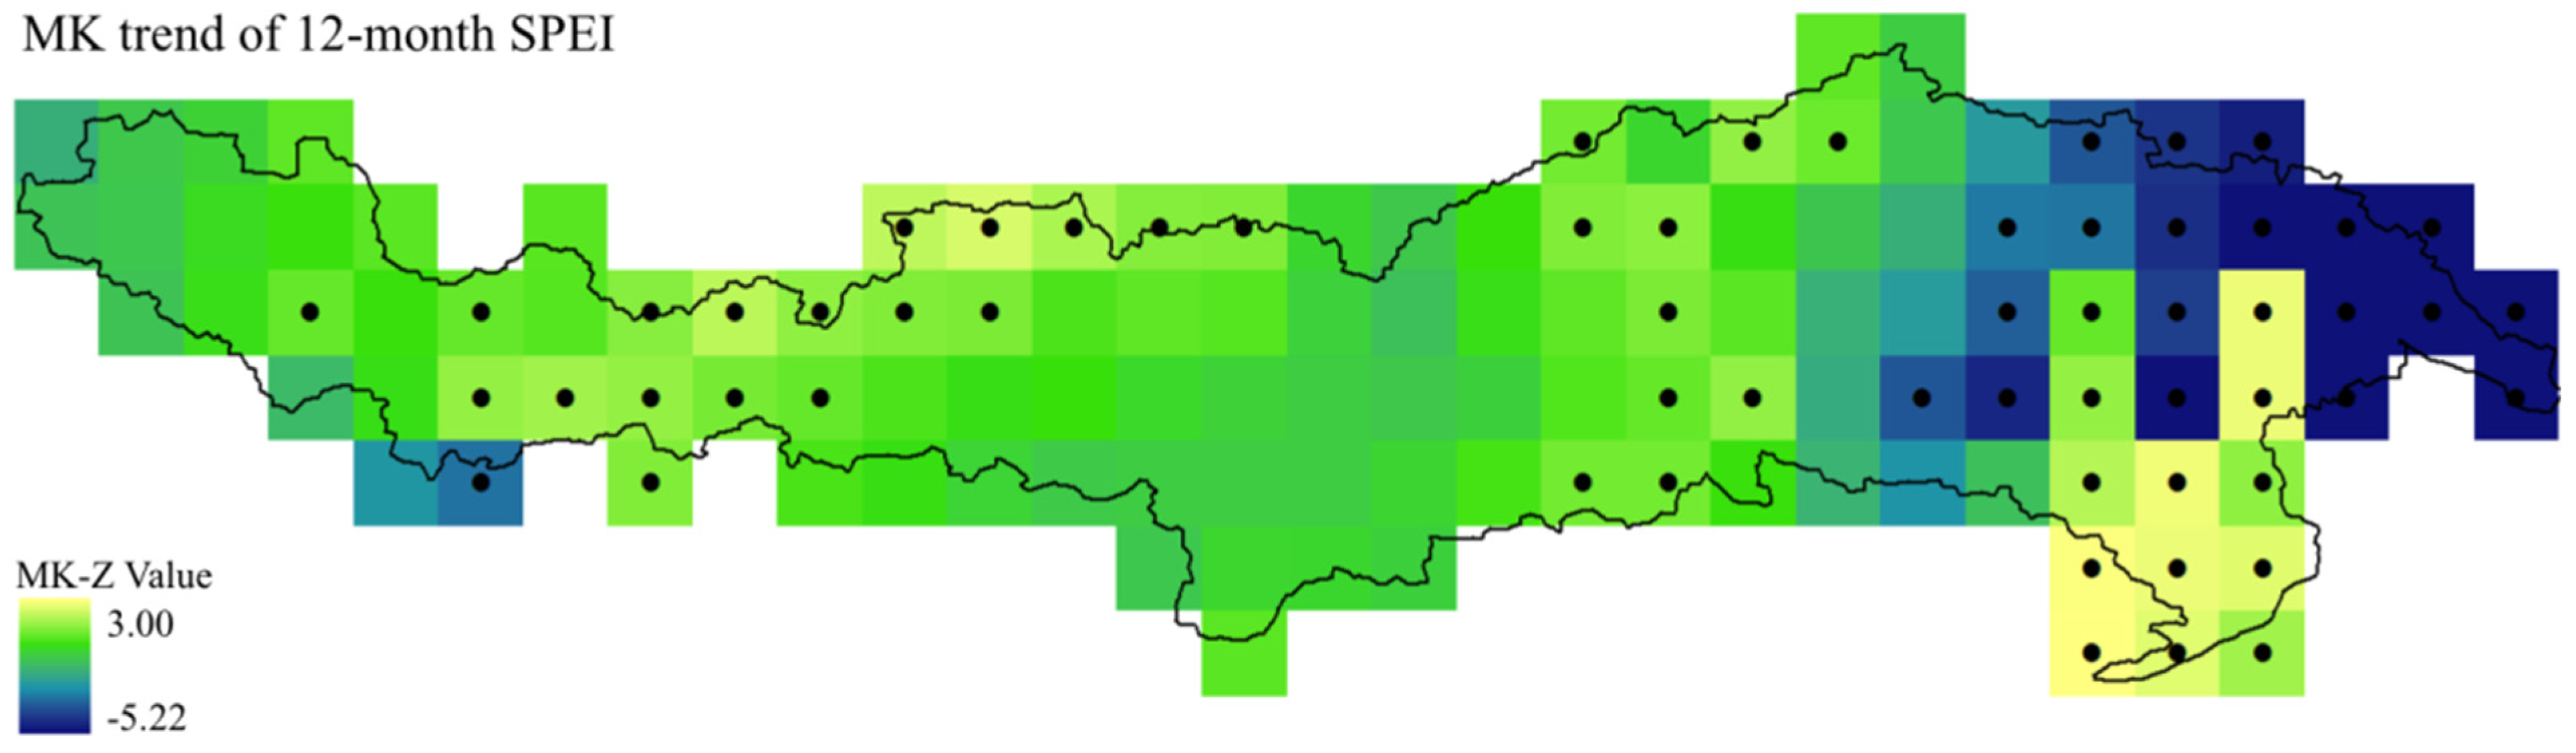
During the period of 1961–2014, SPEI trends of each basin grid was calculated and displayed in terms of the MK-Z value varying from −5.22 to 3.00 (
Figure 7). Results showed that a statistically significant downward (drier) trending grids are mainly located at the eastern part of the basin, while statistically significant upward (wetter) trending grids could be found in the southeastern part and near the boundary between UYZR and MYZR. Most of the basin grids experienced insignificant trends during the period of 1961–2014.
Figure 7.
Same as
Figure 2, but for 12-month SPEI.
Figure 7.
Same as
Figure 2, but for 12-month SPEI.
Drought and wetness periods were identified and evaluated by SPEI that depends on changes of precipitation and air temperature. In the YZR Basin, both precipitation and air temperature increased during 1961–2014, and contributed to the evolutions of drought and wetness periods. It is found that the trends of precipitation and SPEI are consistent in
Figure 2 and
Figure 7, respectively, but they are significantly different from the results of air temperature in
Figure 3. This discrepancy indicated that the SPEI calculation may be dominated by precipitation rather than temperature in the YZR Basin.
4. Conclusions
This study analyzed the climate change of the YZR Basin for the period of 1961–2014 based on the 0.5-degree precipitation and air temperature dataset with a high precision. This is different from the previous studies just using limited point climate station data. Therefore, our study suggests that input uncertainty of climate data can be reduced.
In the YZR Basin, annual mean precipitation increases considerably from the upstream to downstream with a mean of 512.40 mm for the period of 1961–2014. Annual and seasonal precipitation data were analyzed by using the MK trend test, and results showed that all series increased except for the winter precipitation. For the entire YZR Basin, precipitation experienced a statistically insignificant increasing trend with the slope rate of 6.32 mm/10 years. Additionally, only spring precipitation series had a statistically significant trend. Spatial analysis of precipitation trend indicated that most of the grids in the YZR Basin (75%) experienced an upward trend except for several grids in the downstream area for the period of 1961–2014.
Three temperature variables (TMAX, TMEAN, and TMIN) in the YZR Basin were 7.58 °C, 0.31 °C, and −2.52 °C, respectively, for the period of 1961–2014. Spatial pattern of air temperature was in accordance to the basin elevation,
i.e., becoming warmer from upstream to downstream. The MK trend tests suggested that annual and seasonal temperature series had statistically significant warmer trends during 1961–2014, while the slope rates of TMEAN and TMIN were 0.32 °C/10 years and 0.43 °C/10 years, respectively. These warming rates are larger than that in many other regions of the world as global mean surface temperature over the past 20 years (1993–2012) rose at the rate of 0.14 ± 0.06 °C/10 years (95% confidence interval) [
25].
Different timescales of SPEI were calculated for each grid in the YZR Basin for the period of 1961–2014. It was found that a temporal frequency and duration of dry/wet periods would be decreased and increased, respectively, with an increasing timescale. On average, the YZR Basin stood approximately an even chance of dry/wet condition during the period of 1961–2014. Decadal analysis suggested that, despite no evident trends of occurrence number, severity of dry episode aggravated in terms of duration and magnitude. The MK trend test of SPEI showed that most of the basin grids experienced insignificant trends during the period of 1961–2014, except for some drier grids in the eastern part and some wetter grids in the southeastern part of the basin and near the boundary between UYZR and MYZR.
Finally, during the period of 1961–2014, precipitation experienced a statistically insignificant increasing trend while air temperature became warmer remarkably in the YZR Basin. Analysis of meteorological drought index showed that the YZR Basin had no obvious statistical trend in the occurrence number of dry/wet episodes, but severity of dry episode aggravated in terms of duration and magnitude.
Acknowledgments
This work was supported by the National Natural Science Foundation of China (No. 51509067, No. 51539003), the Fundamental Research Funds for the Central Universities of China (No. 2015B00114) and the Special Fund of State Key Laboratory of Hydrology-Water Resources and Hydraulic Engineering. The SPEI program was provided by CSIC, Spain at
http://sac.csic.es/spei/index.html.
Author Contributions
All of the authors contributed extensively to the work. Binquan Li performed the calculation, result analysis, and wrote the article. Wei Zhou, Yaoyang Zhao, and Qin Ju contributed data collection and result calculation and analysis. Zhongbo Yu, Zhongmin Liang, and Kumud Acharya contributed to the article’s discussion and edition.
Conflicts of Interest
The authors declare no conflict of interest.
References
- Yang, Y.; Gao, D.; Li, B. Study on the moisture passage on the lower reaches of the Yarlung Zangbo River. Sci. China Ser. B 1989, 32, 580–593. [Google Scholar]
- Liu, T.; Zhang, X.; Xiong, S.; Qin, X.; Yang, X. Glacial environments on the Tibetan Plateau and global cooling. Quat. Int. 2002, 97, 133–139. [Google Scholar] [CrossRef]
- Zhou, S.; Wang, J.; Xu, L.; Wang, X.; Colgan, P.M.; Mickelson, D.M. Glacial advances in southeastern Tibet during the late Quaternary and their implications for climatic changes. Quat. Int. 2010, 218, 58–66. [Google Scholar]
- Steele-Dunne, S.; Lynch, P.; McGrath, R.; Semmler, T.; Wang, S.; Hanafin, J.; Nolan, P. The impacts of climate change on hydrology in Ireland. J. Hydrol. 2008, 356, 28–45. [Google Scholar] [CrossRef]
- Niedda, M.; Pirastru, M.; Castellini, M.; Giadrossich, F. Simulating the hydrological response of a closed catchment-lake system to recent climate and land-use changes in semi-arid Mediterranean environment. J. Hydrol. 2014, 517, 732–745. [Google Scholar] [CrossRef]
- Reinfelds, I.; Swanson, E.; Cohen, T.; Larsen, J.; Nolan, A. Hydrospatial assessment of streamflow yields and effects of climate change: Snowy Mountains, Australia. J. Hydrol. 2014, 512, 206–220. [Google Scholar] [CrossRef]
- Fatichi, S.; Rimkus, S.; Burlando, P.; Bordoy, R.; Molnar, P. High-resolution distributed analysis of climate and anthropogenic changes on the hydrology of an Alpine catchment. J. Hydrol. 2015, 525, 362–382. [Google Scholar] [CrossRef]
- Li, B.; Yu, Z.; Liang, Z.; Song, K.; Li, H.; Wang, Y.; Zhang, W.; Acharya, K. Effects of climate variations and human activities on runoff in the Zoige alpine wetland in the eastern edge of the Tibetan Plateau. J. Hydrol. Eng. 2014, 19, 1026–1035. [Google Scholar] [CrossRef]
- Li, B.; Yu, Z.; Liang, Z.; Acharya, K. Hydrologic response of a high altitude glacierized basin in the central Tibetan Plateau. Glob. Planet. Chang. 2014, 118, 69–84. [Google Scholar]
- Liu, X.; Chen, B. Climate warming in the Tibetan Plateau during recent decades. Int. J. Climatol. 2000, 20, 1729–1742. [Google Scholar] [CrossRef]
- You, Q.; Kang, S.; Wu, Y.; Yan, Y. Climate change over the Yarlung Zangbo River Basin during 1961–2005. J. Geogr. Sci. 2007, 17, 409–420. [Google Scholar] [CrossRef]
- Liu, Z.; Yao, Z.; Huang, H.; Wu, S.; Liu, G. Land use and climate changes and their impacts on runoff in the Yarlung Zangbo River Basin, China. Land Degrad. Dev. 2014, 25, 203–215. [Google Scholar]
- Guan, Z.H.; Chen, C.Y.; Ou, Y.X.; Fan, Y.Q.; Zhang, Y.S.; Chen, Z.M. Rivers and Lakes in Tibet; Science Press: Beijing, China, 1984. [Google Scholar]
- McKee, T.B.; Doesken, N.J.; Kleist, J. The relationship of drought frequency and duration to time scales. In Proceedings of the 8th Conference on Applied Climatology, Anaheim, CA, USA, 17–22 January 1993; American Meteorological Society: Boston, MA, USA, 1993; pp. 179–183. [Google Scholar]
- Vicente-Serrano, S.M.; Begueria, S.; López-Moreno, J.I. A multiscalar drought index sensitive to global warming: The standardized precipitation evapotranspiration index. J. Clim. 2010, 23, 1696–1718. [Google Scholar] [CrossRef]
- Palmer, W.C. Meteorologic Drought; US Department of Commerce, Weather Bureau: Washington, DC, USA, 1965.
- Allen, R.G.; Pereira, L.S.; Raes, D.; Smith, M. Crop Evapotranspiration-Guidelines for Computing Crop Water Requirements-FAO Irrigation and Drainage Paper 56; FAO: Rome, Italy, 1998. [Google Scholar]
- Thornthwaite, C.W. An approach toward a rational classification of climate. Geogr. Rev. 1948, 38, 55–94. [Google Scholar]
- Lorenzo-Lacruz, J.; Vicente-Serrano, S.M.; Lopez-Moreno, J.I.; Begueria, S.; Garcia-Ruiz, J.M.; Cuadrat, J.M. The impact of droughts and water management on various hydrological systems in the headwaters of the Tagus River (central Spain). J. Hydrol. 2010, 386, 13–26. [Google Scholar] [CrossRef] [Green Version]
- Li, B.; Liang, Z.; Yu, Z.; Acharya, K. Evaluation of drought and wetness episodes in a cold region (Northeast China) since 1898 with different drought indices. Nat. Hazards 2014, 71, 2063–2085. [Google Scholar] [CrossRef]
- Mann, H.B. Nonparametric tests against trend. Econometrica 1945, 13, 245–259. [Google Scholar] [CrossRef]
- Kendall, M.G. Rand Correlation Methods; Charles Griffin: London, UK, 1975. [Google Scholar]
- Yue, S.; Pilon, P.; Phinney, B.; Cavadias, G. The influence of autocorrelation on the ability to detect trend in hydrological series. Hydrol. Process. 2002, 16, 1807–1829. [Google Scholar] [CrossRef]
- Sen, P.K. Estimates of the regression coefficient based on Kendall’s tau. J. Am. Stat. Assoc. 1968, 63, 1379–1389. [Google Scholar] [CrossRef]
- Morice, C.P.; Kennedy, J.J.; Rayner, N.A.; Jones, P.D. Quantifying uncertainties in global and regional temperature change using an ensemble of observational estimates: The HadCRUT4 dataset. J. Geophys. Res. 2012, 117. [Google Scholar] [CrossRef]
© 2015 by the authors; licensee MDPI, Basel, Switzerland. This article is an open access article distributed under the terms and conditions of the Creative Commons Attribution license (http://creativecommons.org/licenses/by/4.0/).


