
Estimation of Transport Trajectory and Residence Time in Large River–Lake Systems: Application to Poyang Lake (China) Using a Combined Model Approach

Abstract
:1. Introduction
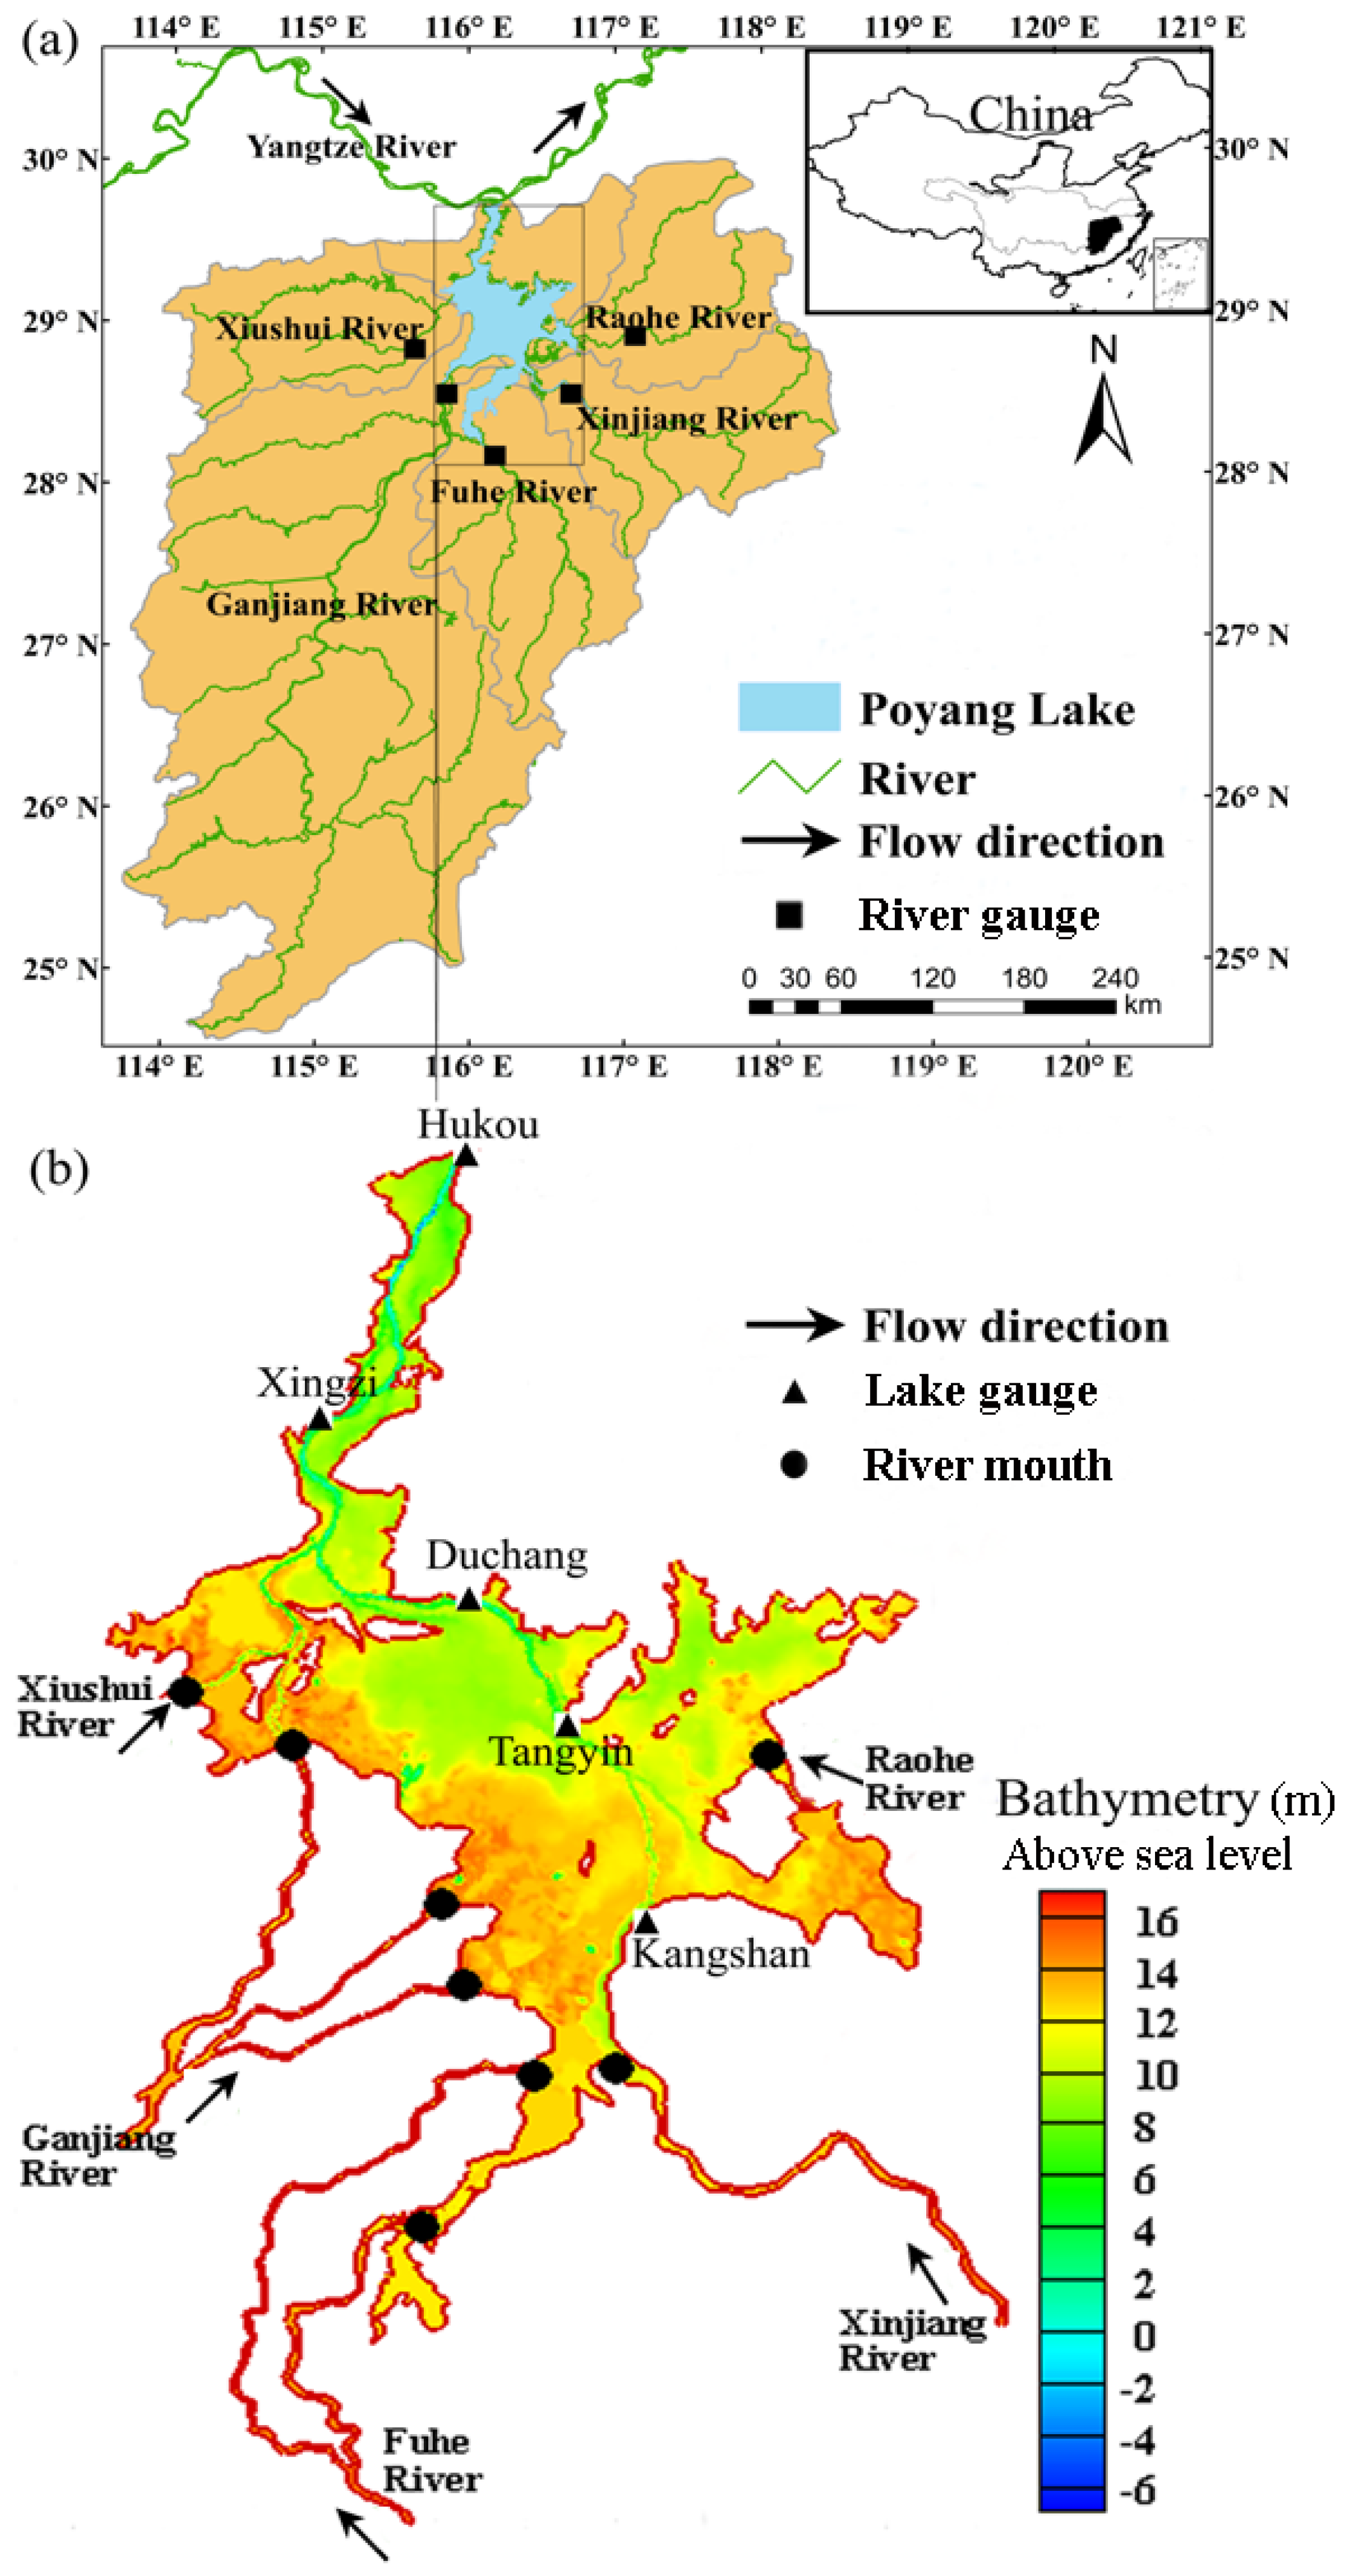
2. Study Site and Background
3. Materials and Methods
3.1. Data Availability and Model Description
3.2. Transport Trajectory Simulations
3.3. Residence Time Estimation

| Parameter | Description | Purpose | Values and Reference |
|---|---|---|---|
| M | Manning number | Hydrodynamic simulation | 30–50 m1/3/s [28,45] |
| Cs | Smagorinsky factor for eddy viscosity | Hydrodynamic simulation | 0.28 [28,45] |
| ωs | Settling velocity for particles | Particle tracking | 0.0082 m/s [39,44] |
| DV | Vertical dispersion | Particle tracking | 0.001 m2/s [39] |
| DH | Horizontal dispersion | Particle tracking and transport simulation | 0.05 m2/s [38,39,43] |
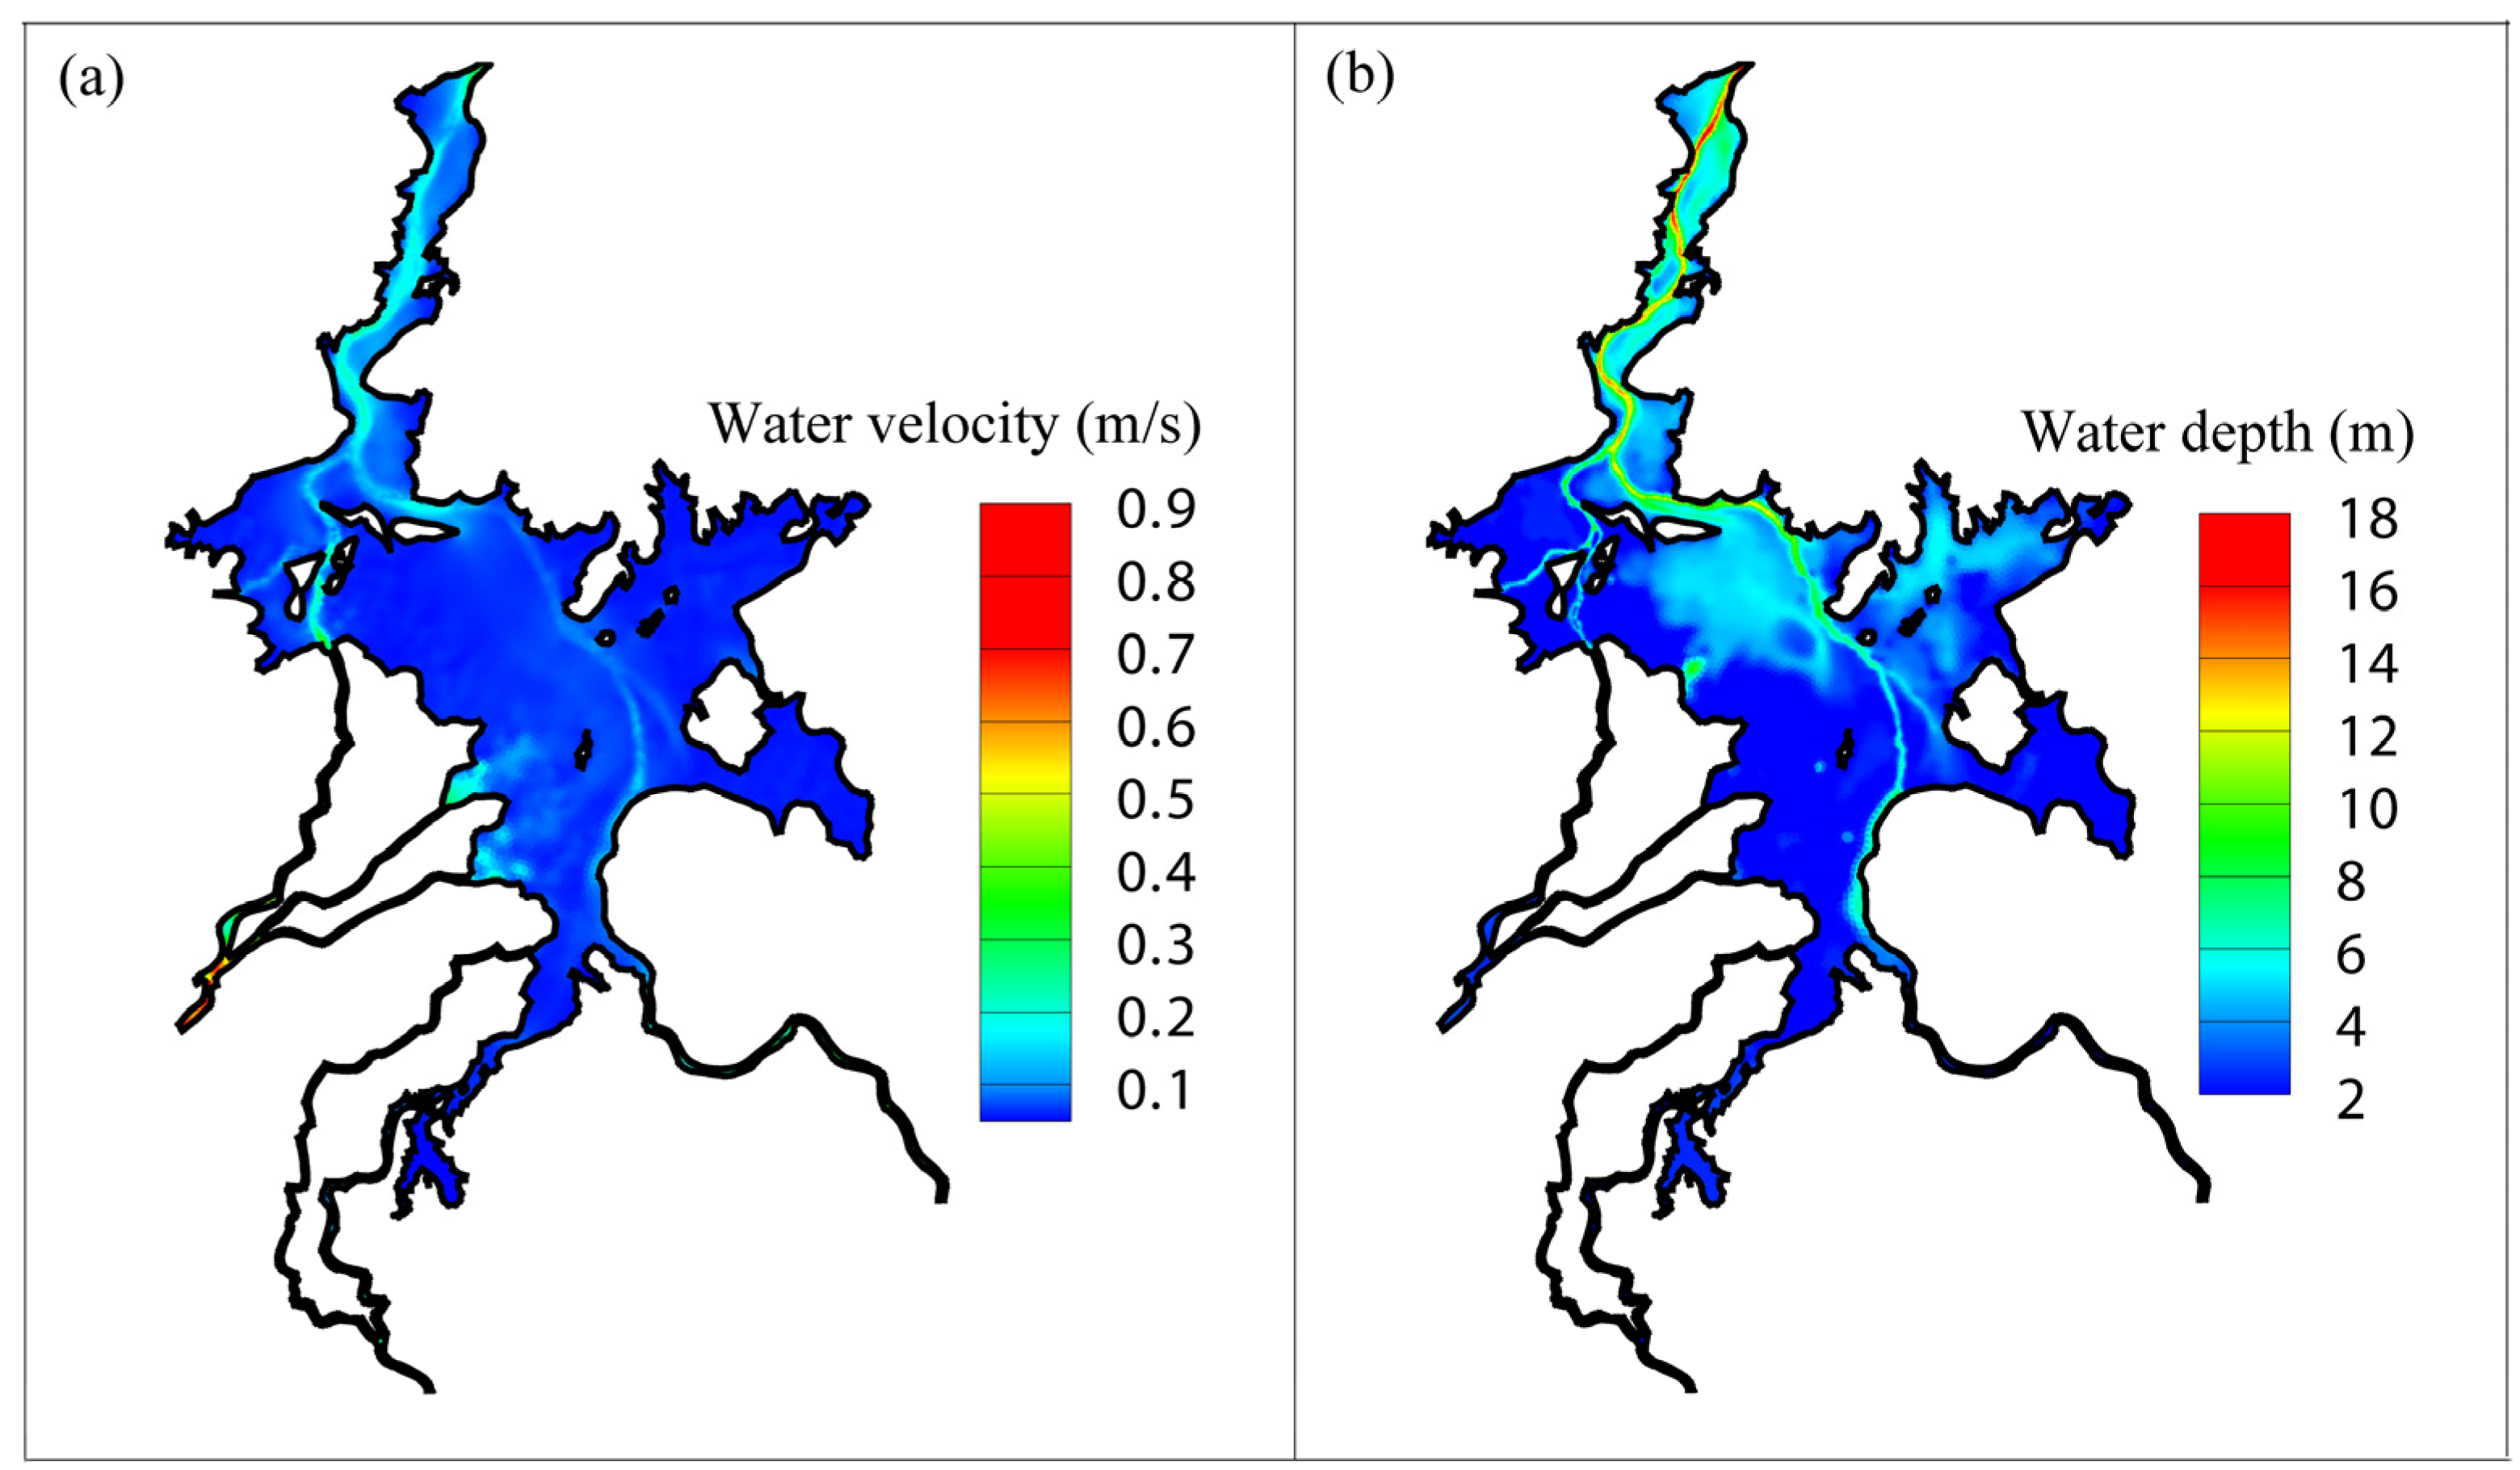
4. Results
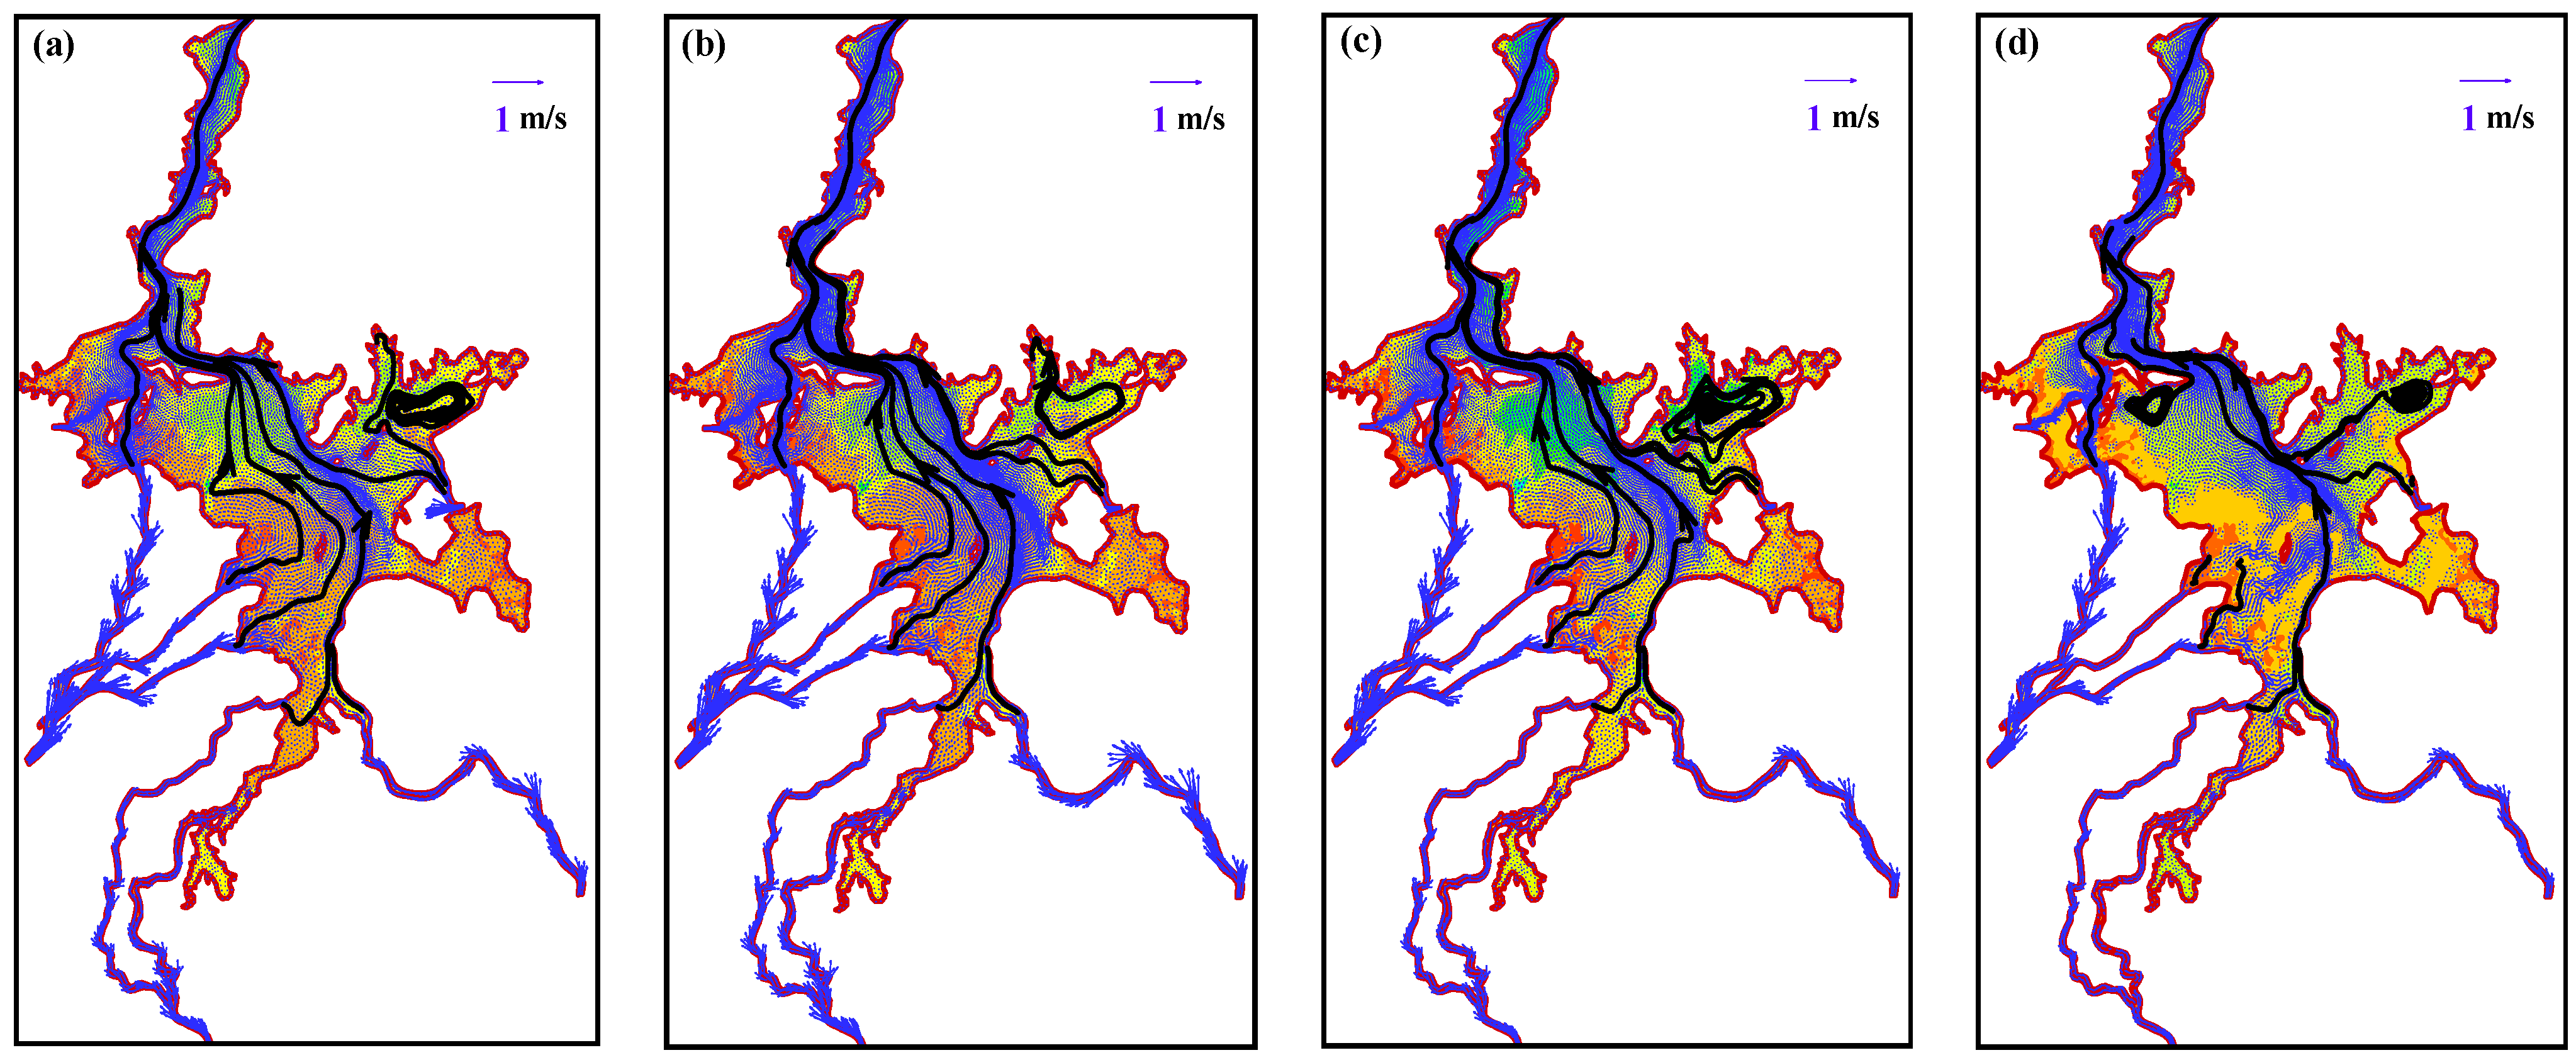
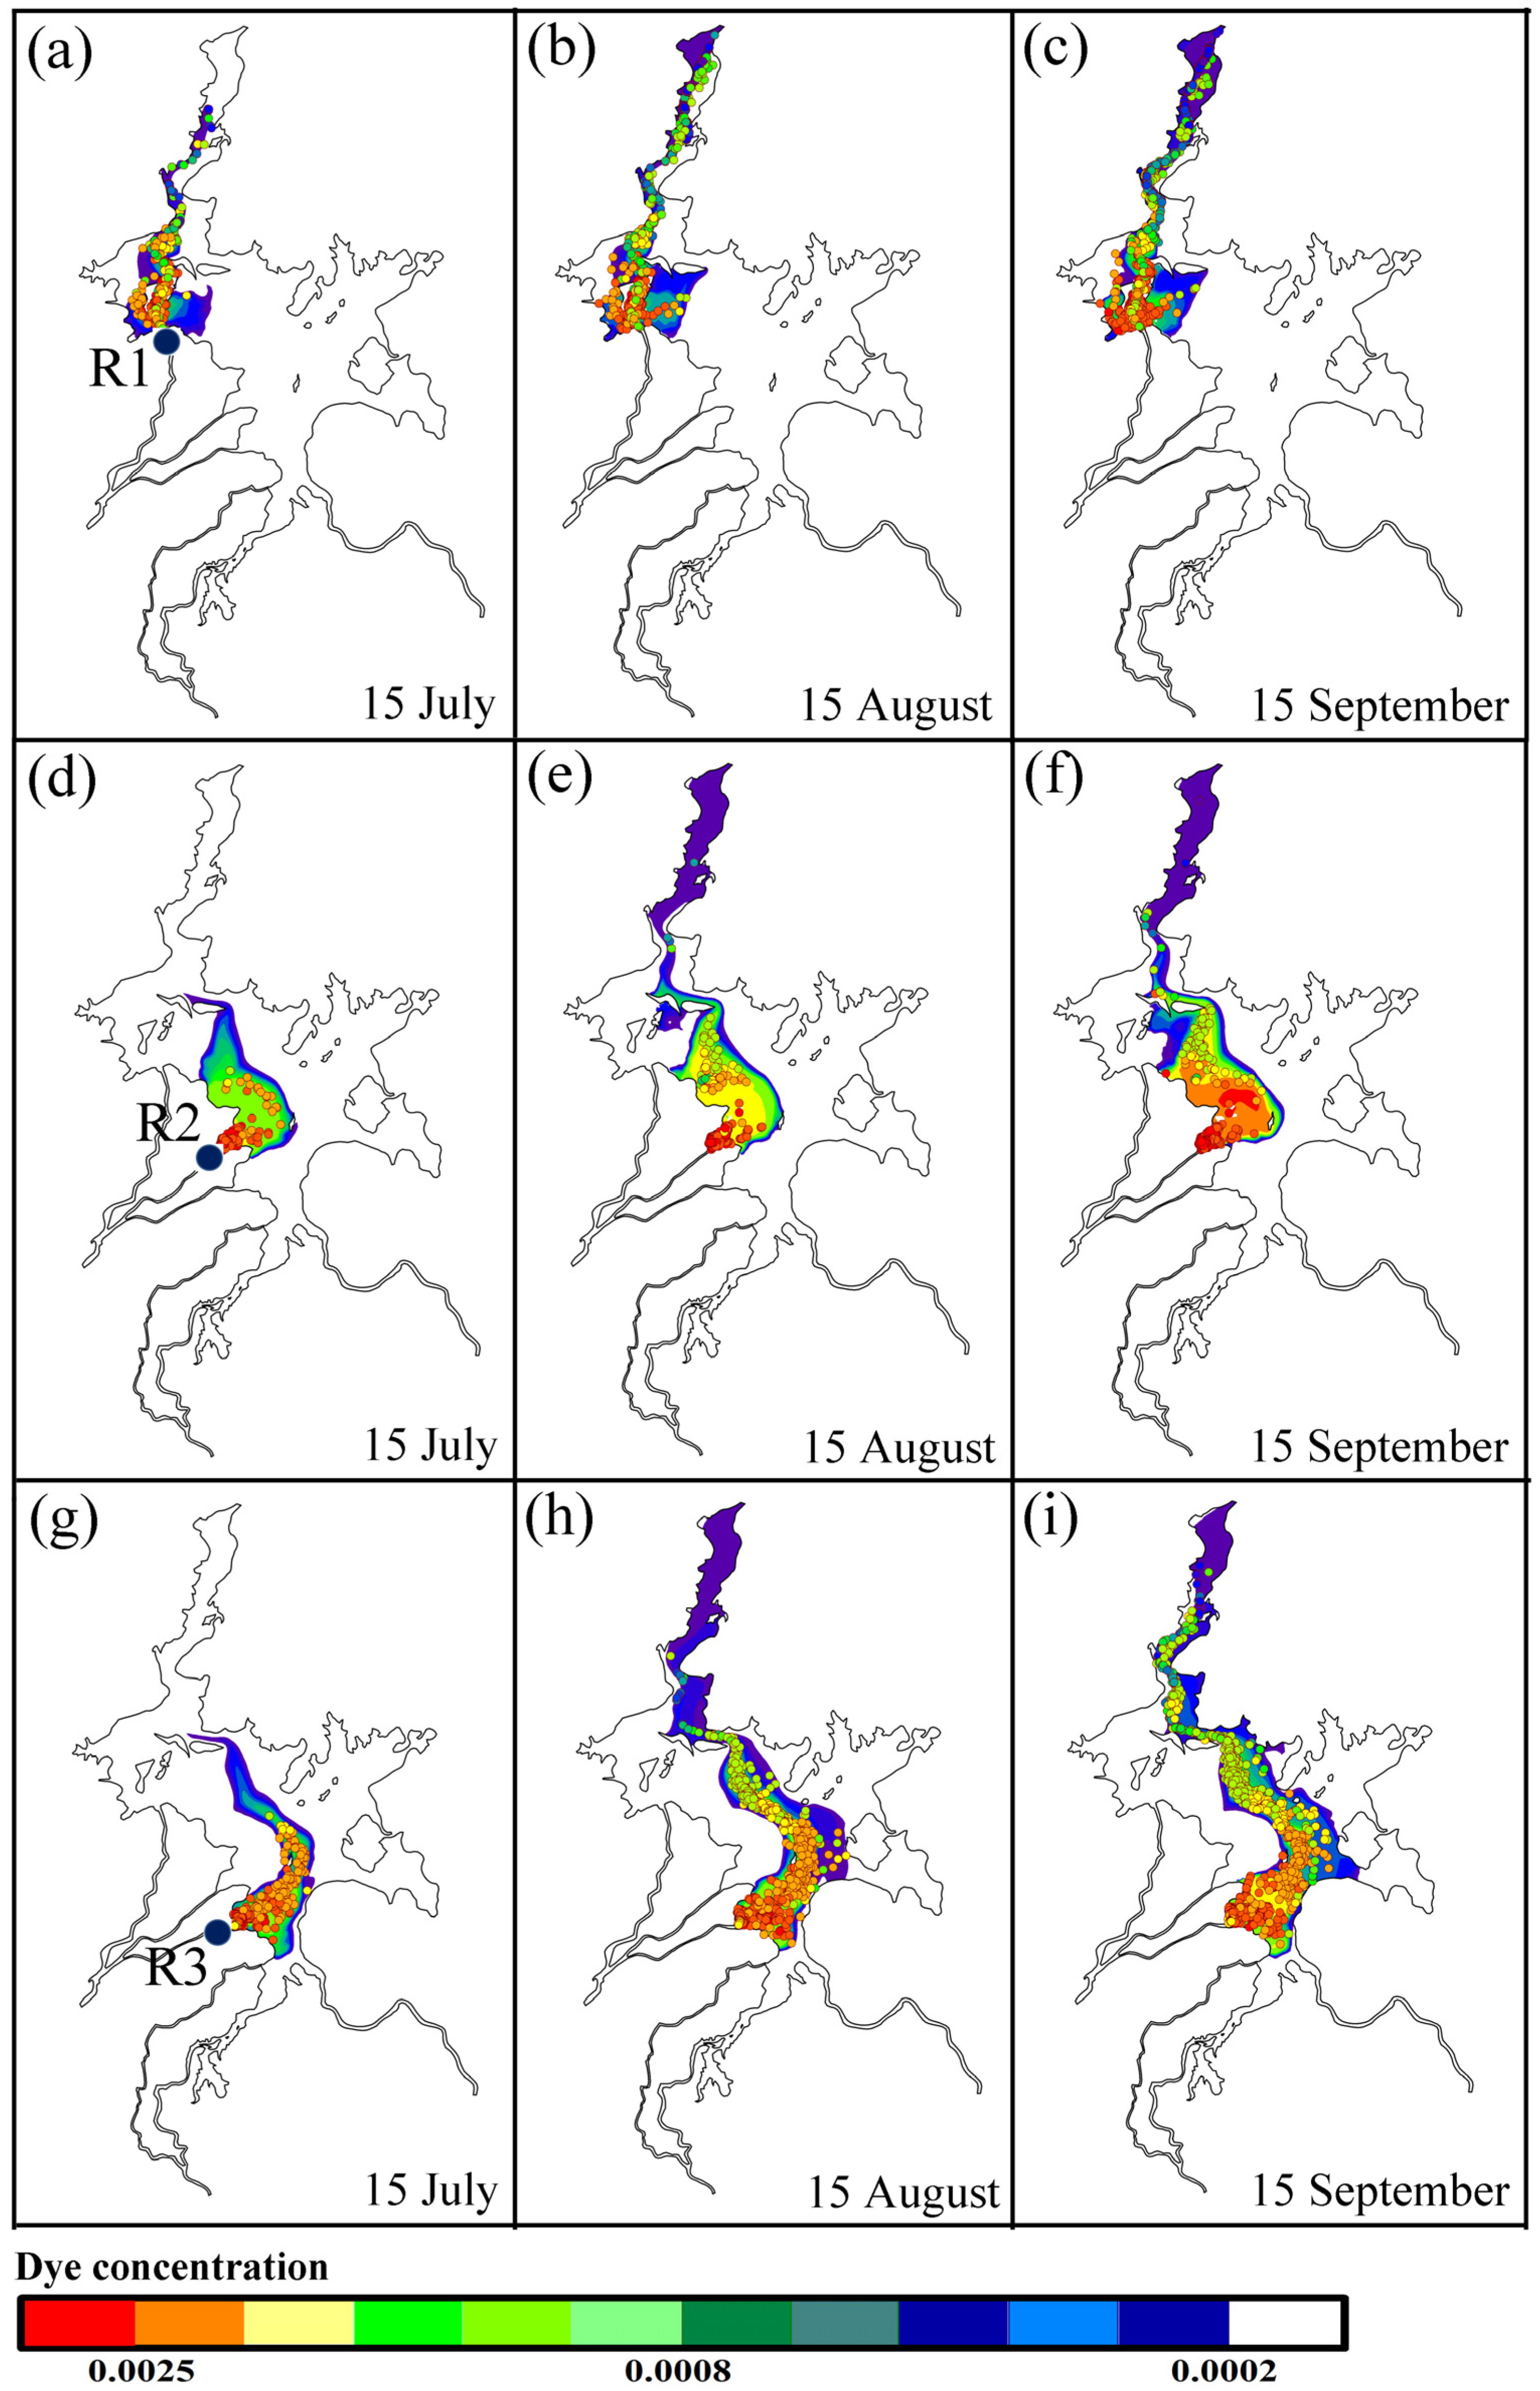
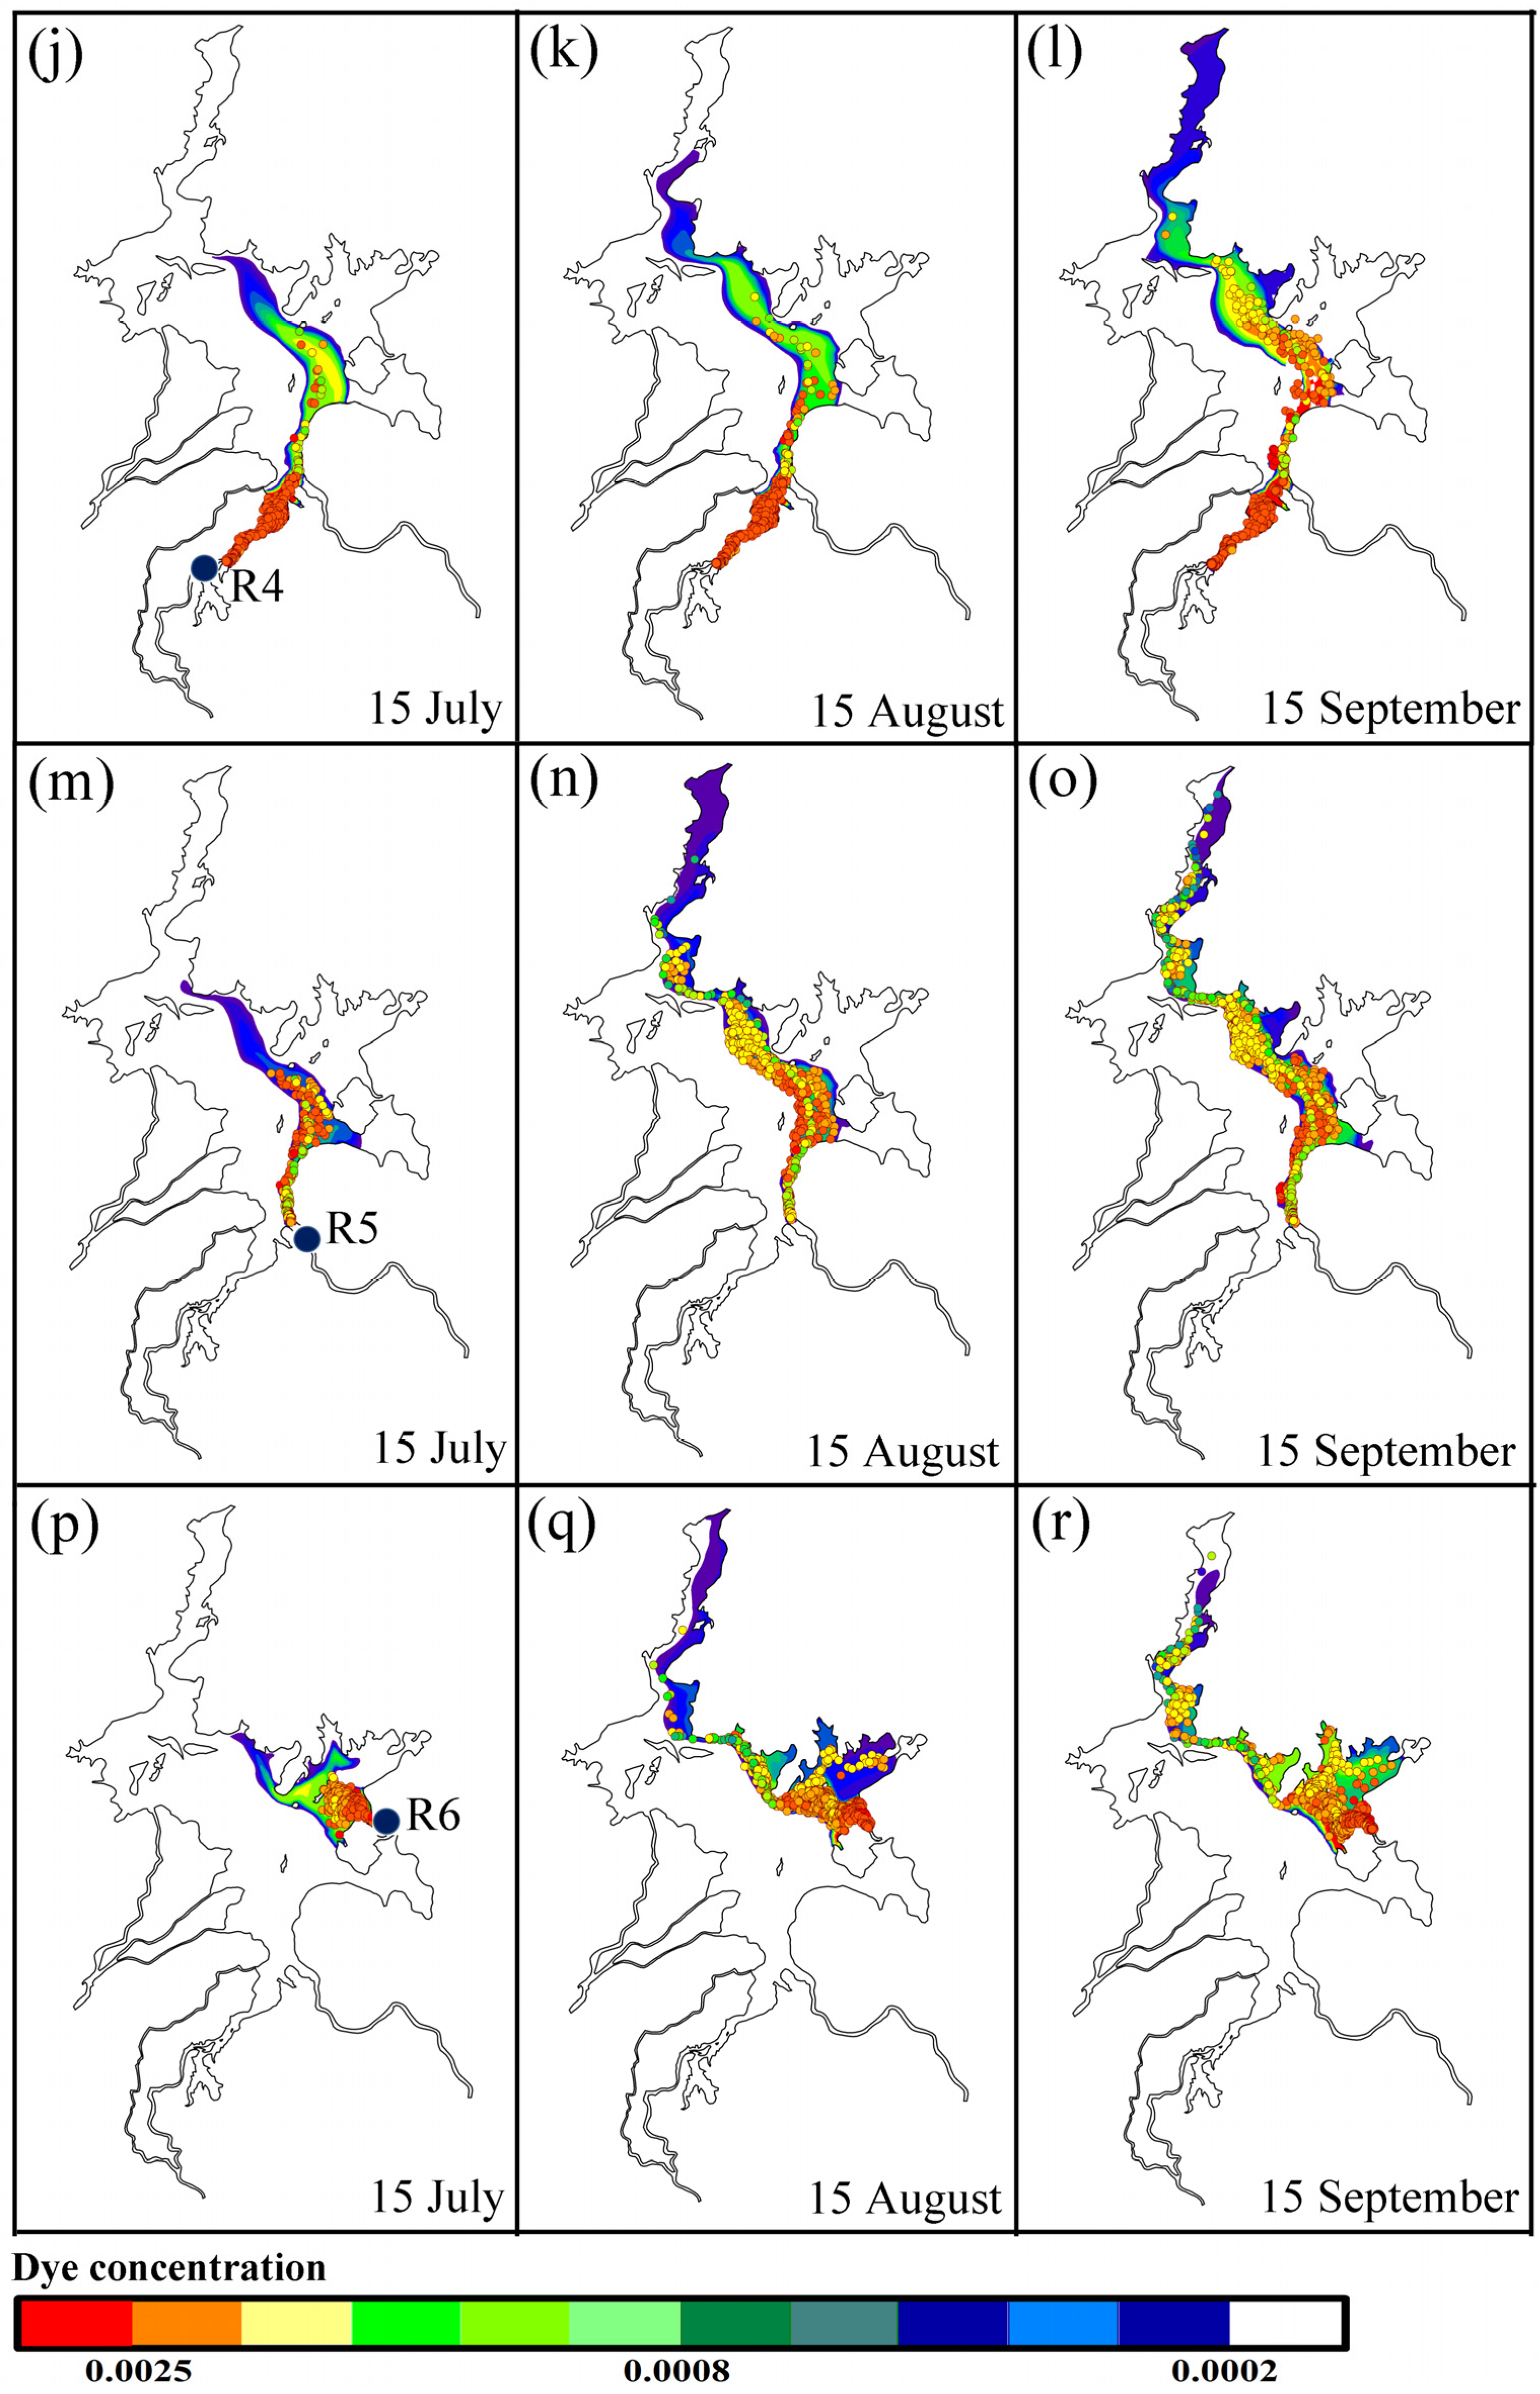
4.1. Transport Trajectories for Different Released Sources and Physical Interpretation


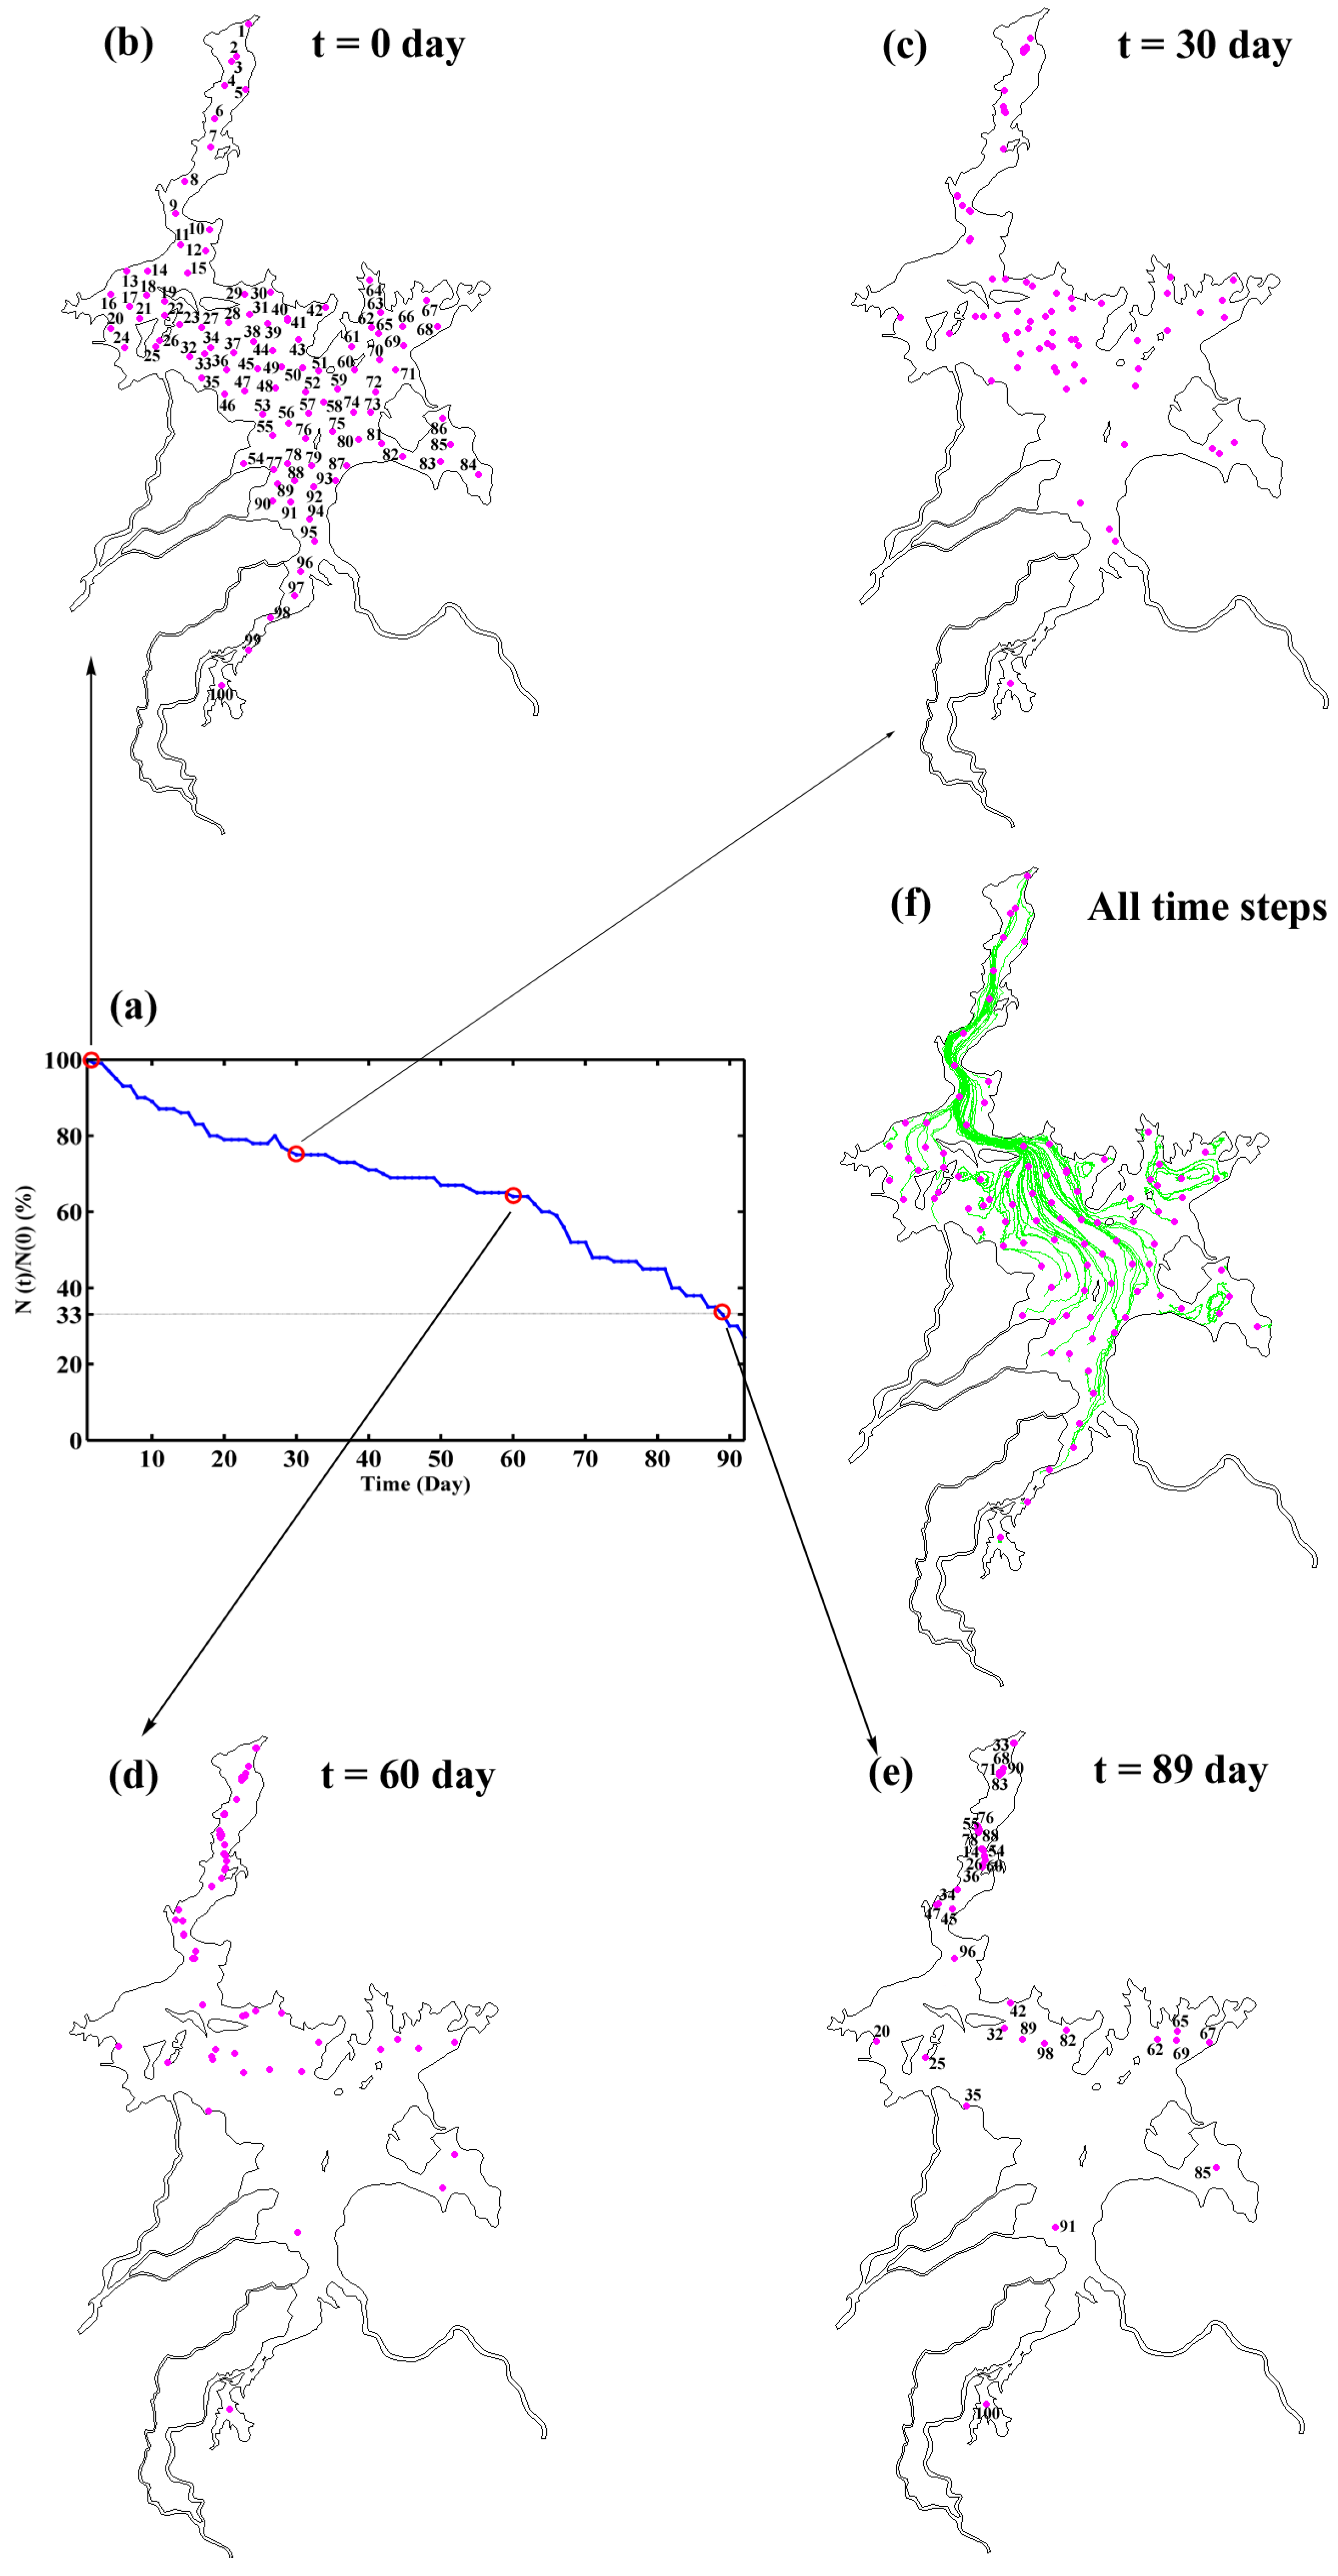
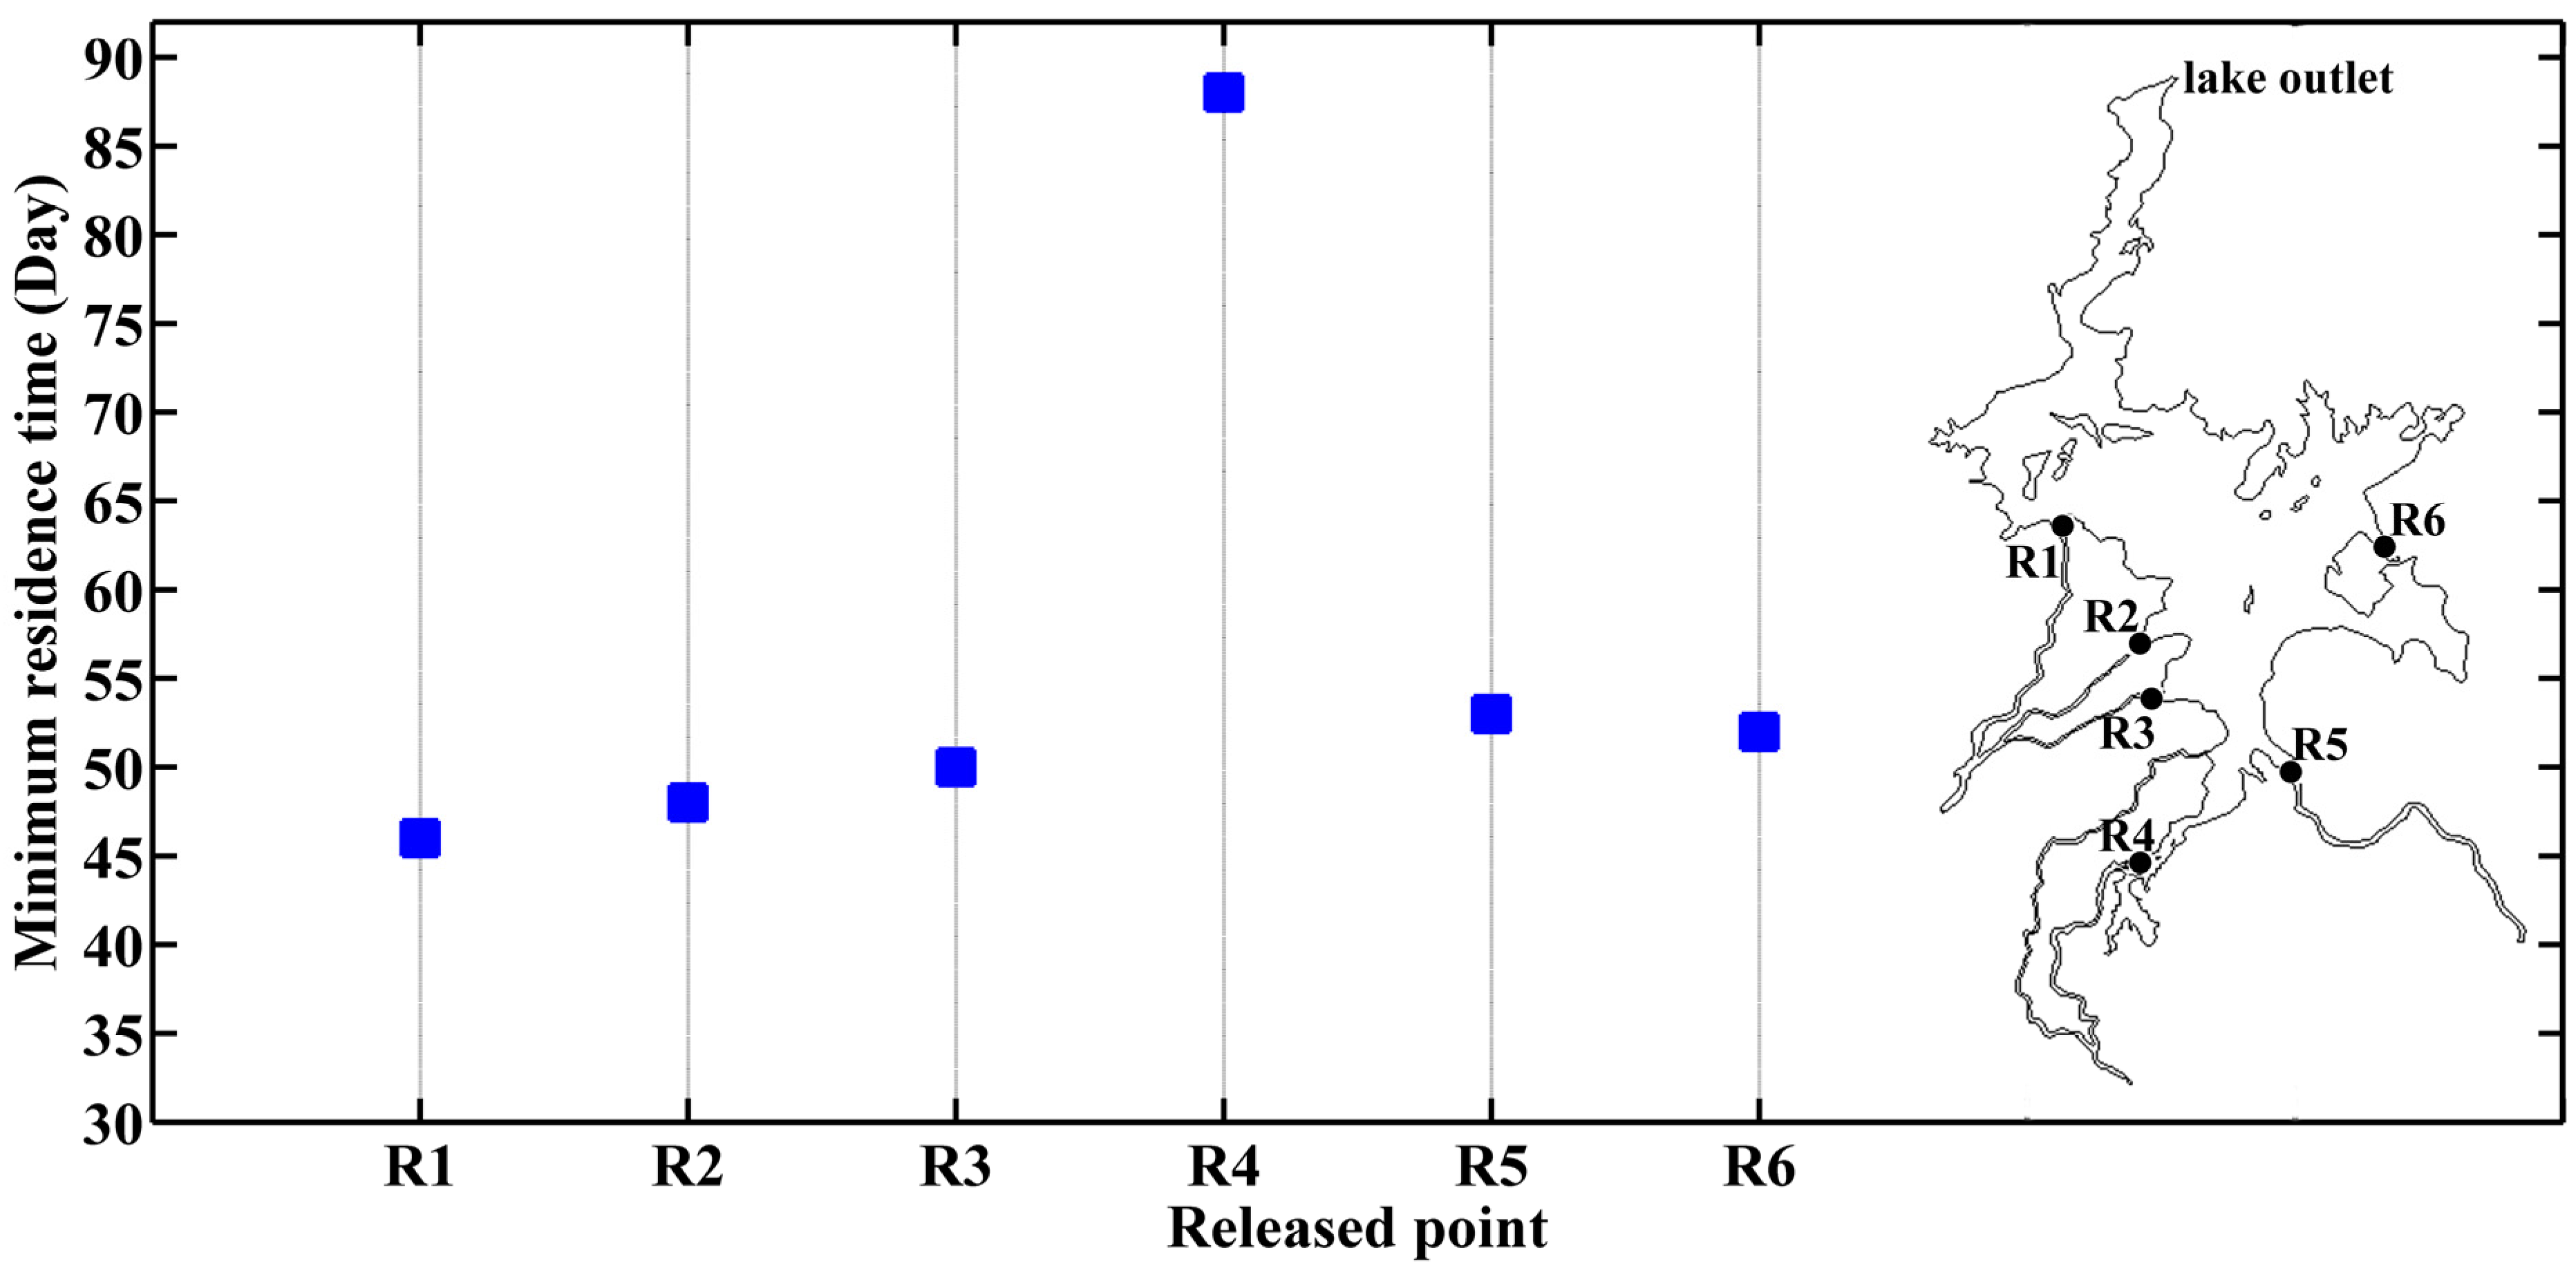
4.2. Residence Time for the Lake Flood Period

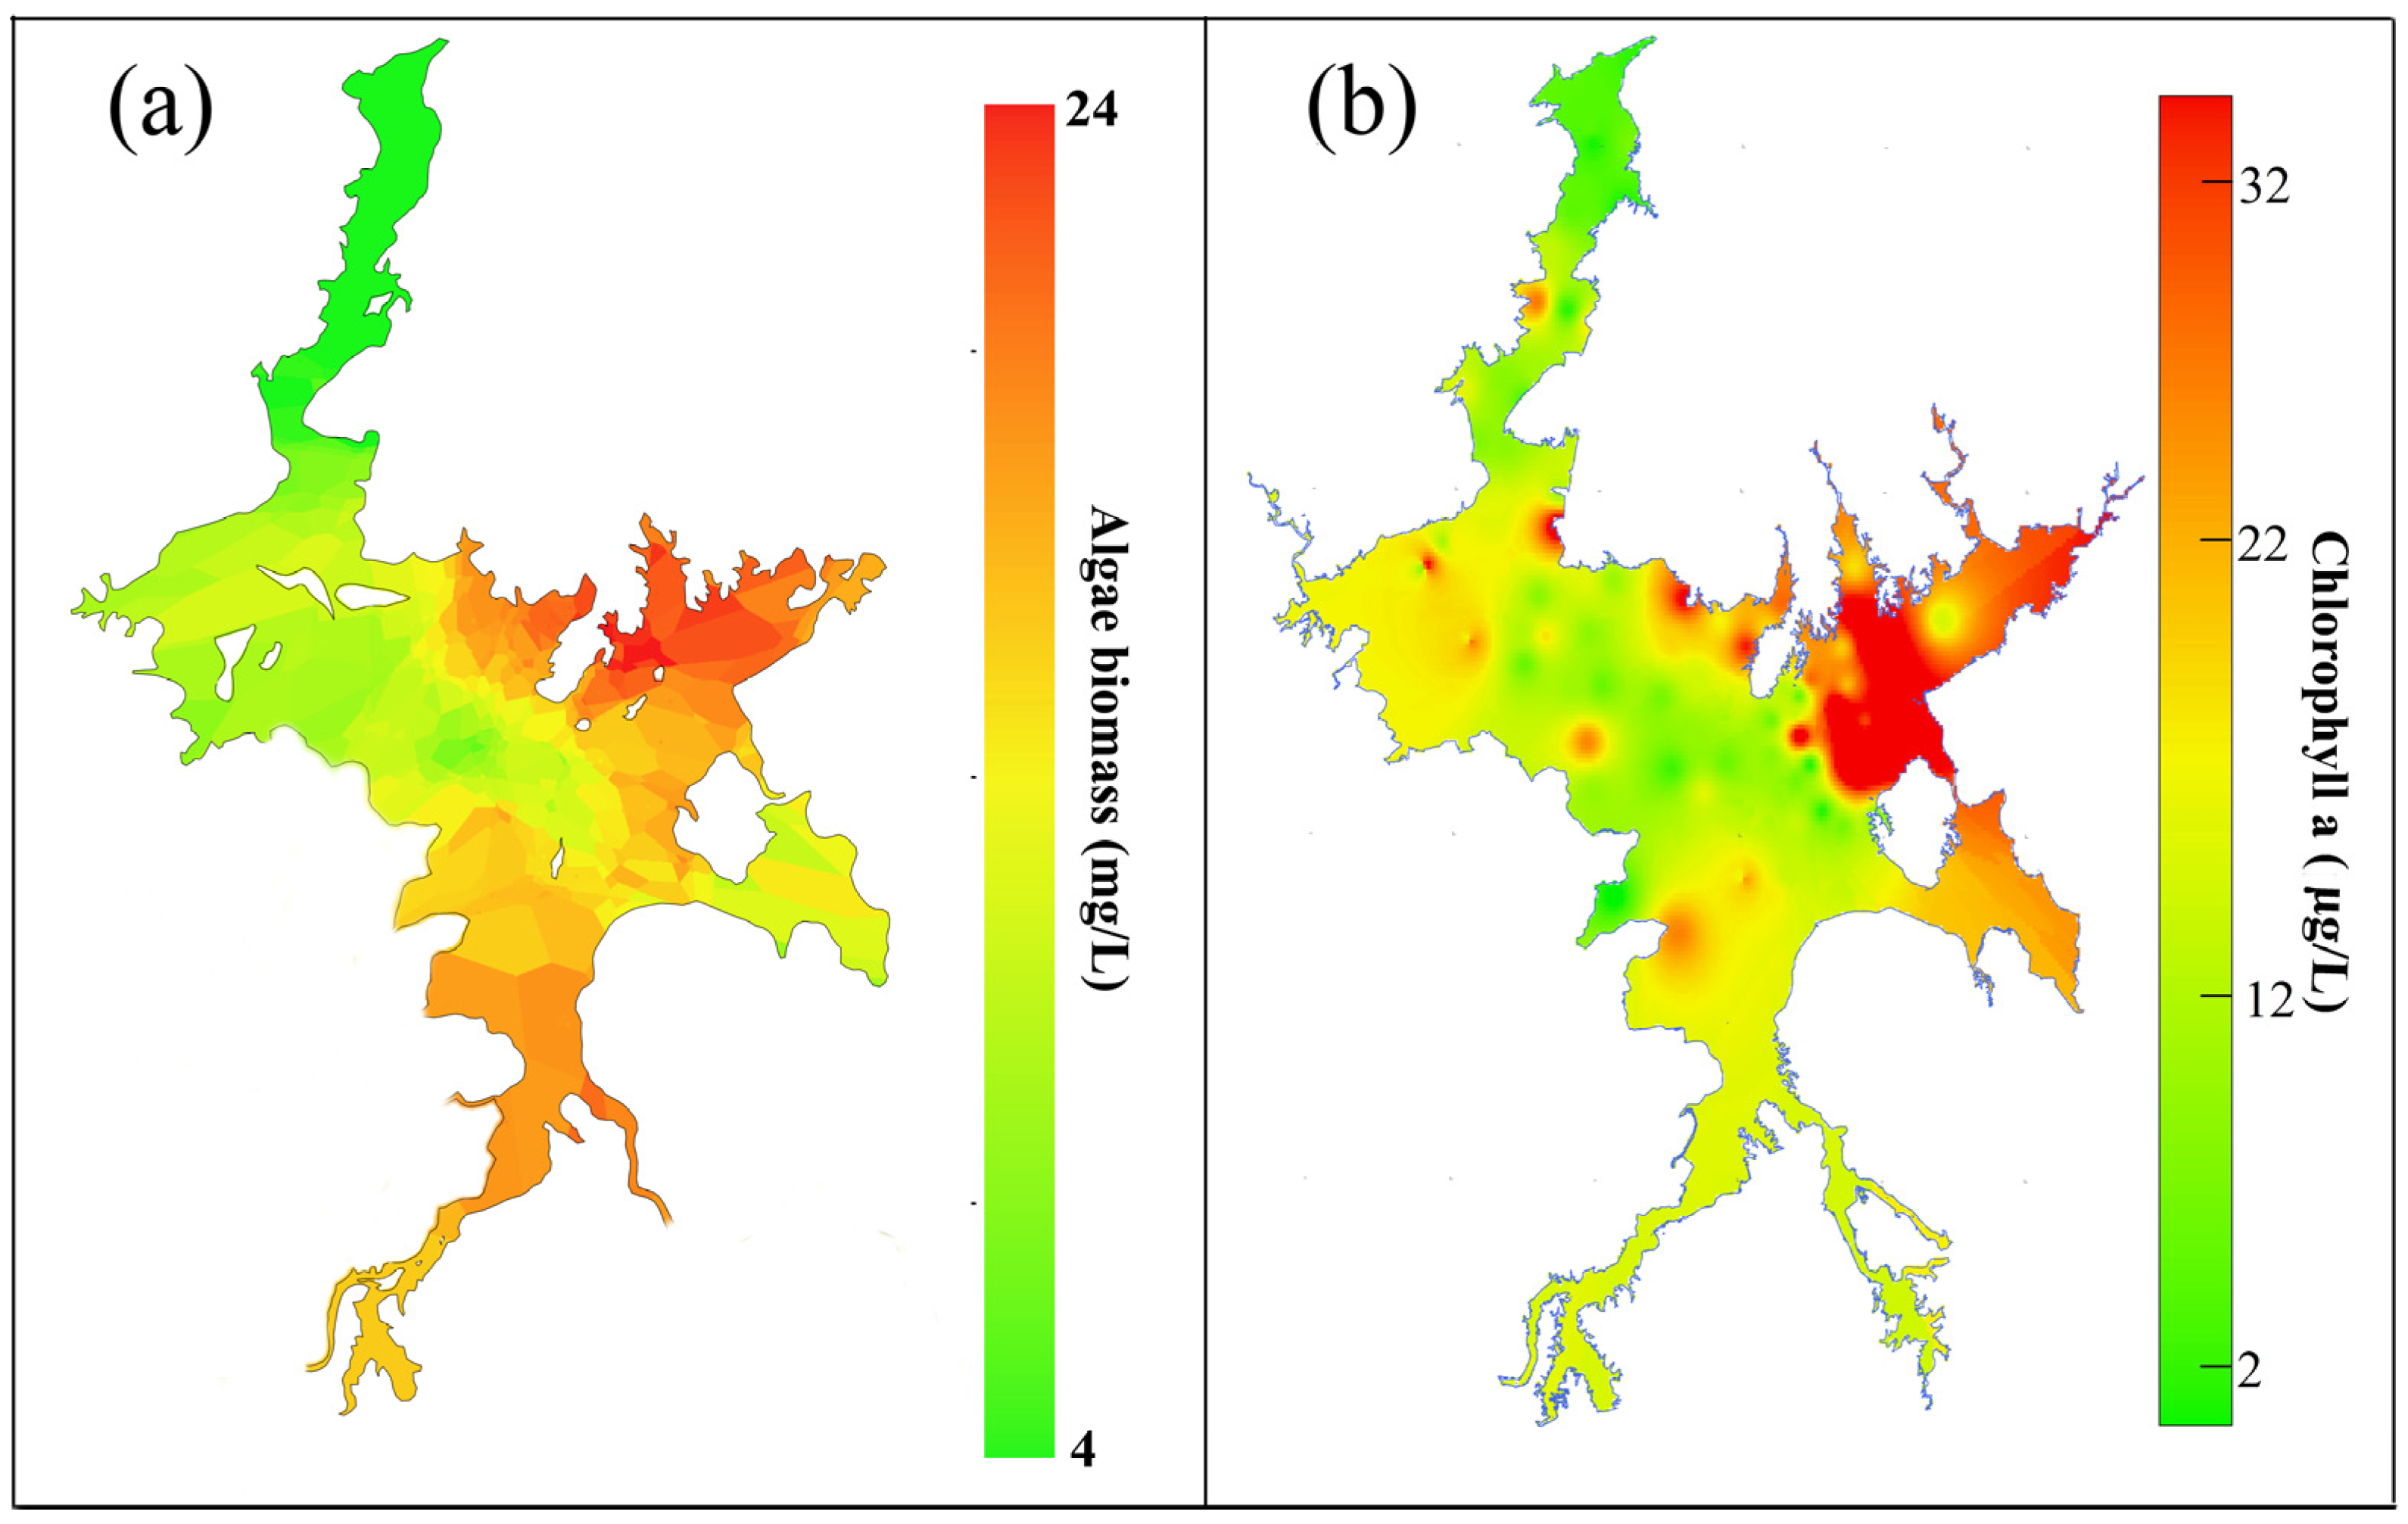

4.3. Comparison of the Effects of Local Catchment and the Yangtze River on Mean Residence Time
| Case | Catchment Inflows (Unit: m3/s) | Yangtze River Water Level (Unit: m) | Lake Residence Time (Unit: Day) |
|---|---|---|---|
| Case 0 | Averaged over 2001–2010 | Averaged over 2001–2010 | 89 |
| Case 1 | +25% | Averaged over 2001–2010 | 89 |
| Case 2 | +50% | Averaged over 2001–2010 | 87 |
| Case 3 | +75% | Averaged over 2001–2010 | 86 |
| Case 4 | Averaged over 2001–2010 | –5% | 84 |
| Case 5 | Averaged over 2001–2010 | –10% | 81 |
| Case 6 | Averaged over 2001–2010 | –15% | 77 |
5. Discussion
6. Conclusions
Acknowledgments
Author Contributions
Conflicts of Interest
References
- Zedler, J.B.; Kercher, S. Wetland resources: Status, trends, ecosystem services, and restorability. Annu. Rev. Env. Resour. 2005, 30, 39–74. [Google Scholar] [CrossRef]
- Kristal, D.; Anderson, M.A.; Yates, M.V. Distribution of indicator bacteria in Canyou Lake, California. Water Res. 2005, 39, 1277–1288. [Google Scholar]
- Hipsey, M.R.; Antenucci, J.P.; Brooks, J.D. A generic, process-based model of microbial pollution in aquatic systems. Water Resour. Res. 2008, 44. [Google Scholar] [CrossRef]
- Leon, L.F.; Smith, R.E.H.; Hipsey, M.R.; Bocaniov, S.A.; Higgins, S.N.; Hecky, R.E.; Antenucci, J.P.; Imberger, J.A.; Guildford, S.J. Application of a 3D hydrodynamic-biological model for seasonal and spatial dynamics of water quality and phytoplankton in Lake Erie. J. Great Lakes Res. 2011, 37, 41–53. [Google Scholar] [CrossRef]
- Razmi, A.M.; Barry, D.A.; Lemmin, U.; Bonvin, F.; Kohn, T.; Bakhtyar, R. Direct effects of dominat winds on residence and travel times in the wide and open lacustrine embayment: Vidy Bay (Lake Geneva, Switzerland). Aquat. Sci. 2014, 76, 59–71. [Google Scholar] [CrossRef]
- Cucco, A.; Umgiesser, G.; Ferrarin, C.; Perilli, A.; Canu, D.M.; Solidoro, C. Eulerian and lagrangian transport time scales of a tidal active coastal basin. Ecol. Model. 2009, 220, 913–922. [Google Scholar] [CrossRef]
- Liu, H.; Benoit, G.; Liu, T.; Liu, Y.; Guo, H. An integrated system dynamics model developed for managing lake water quality at the watershed scale. J. Environ. Manag. 2015, 155, 11–23. [Google Scholar] [CrossRef] [PubMed]
- Li, Y.L.; Zhang, Q.; Werner, A.D.; Yao, J. Investigating a complex lake-catchment-river system using artificial neural networks: Poyang Lake (China). Hydrol. Res. 2015, in press. [Google Scholar]
- Shankman, D.; Heim, B.D.; Song, J. Flood frequency in China’s Poyang Lake region: Trends and teleconnections. Int. J. Climatol. 2006, 26, 1255–1266. [Google Scholar] [CrossRef]
- Huang, J.; Xu, Q.; Xi, B.; Wang, X.; Jia, K.; Huo, S.; Su, J.; Zhang, T.; Li, C. Effects of lake-basin morphological and hydrological characteristics on theeutrophication of shallow lakes in eastern China. J. Great Lakes Res. 2014, 40, 666–674. [Google Scholar] [CrossRef]
- Wang, S. Poyang Lake: Ecological Security; Science Press: Beijing, China, 2014. (In Chinese) [Google Scholar]
- Luo, M.B.; Li, J.Q.; Cao, W.P.; Wang, M.L. Study of heavy metal speciation in branch sediments of Poyang Lake. J. Environ. Sci. 2008, 20, 161–166. [Google Scholar] [CrossRef]
- Yuan, G.L.; Liu, C.; Chen, L.; Yang, Z.F. Inputting history of heavy metals into the inland lake recorded in sediment profiles: Poyang Lake in China. J. Hazard. Mater. 2011, 185, 336–345. [Google Scholar] [CrossRef] [PubMed]
- Gao, G.; Ruan, R.; Ouyang, Q. Water quality status and changing trend in Poyang Lake. J. Nanchang Ins. Technol. 2010, 29, 50–53. (In Chinese) [Google Scholar]
- Wu, Z.; Lai, X.; Zhang, L.; Cai, Y.; Chen, Y. Phytoplankton chlorophyll a in Lake Poyang and its tributaries during dry, mid-dry and wet seasons: A 4-year study. Knowl. Manag. Aquat. Ecosyst. 2014, 412, 1–13. [Google Scholar]
- Lv, T.; Wu, C. Study on coupling degree and optimal path between land water resources and economic dvelopment in Poyang Lake Ecological Zone. Int. J. Environ. Sci. Dev. 2013, 4, 569–575. [Google Scholar] [CrossRef]
- Wu, G.; De Leeuw, J.; Skidmore, A.K.; Prins, H.H.T.; Liu, Y. Concurrent monitoring of vessels and water turbidity enhances the strength of evidence in remotely sensed dredging impact assessment. Water Res. 2007, 41, 3271–3280. [Google Scholar] [CrossRef] [PubMed]
- Wan, Y.; Qiu, C.; Doering, P.; Ashton, M.; Sun, D.; Coley, T. Modeling residence time with a three-dimensional hydrodynamic model: Linkage with chlorophyll a in a subtropical estuary. Ecol. Model. 2013, 268, 93–102. [Google Scholar] [CrossRef]
- Patgaonkar, R.S.; Vethamony, P.; Lokesh, K.S.; Babu, M.T. Residence time of pollutants discharged in the Gulf of Kachchh, northwestern Arabian Sea. Mar. Pollut. Bull. 2012, 64, 1659–1666. [Google Scholar] [CrossRef] [PubMed]
- Dabrowski, T.; Hartnett, M.; Olbert, A.I. Determination of flushing characteristics of the Irish Sea: A spatial approach. Comput. Geosic. UK 2012, 45, 250–260. [Google Scholar] [CrossRef]
- Harris, L.; Kotamarthi, V.R. The characteristics of the Chicago Lake Breeza and its effects on tracer particle transport: Results from an episodic event simulation. J. Appl. Meteorol. 2005, 44, 1637–1654. [Google Scholar] [CrossRef]
- He, C.; Droppo, I. Numerical modeling of fine particle plume transport in a large lake. J. Great Lakes Res. 2011, 37, 411–425. [Google Scholar] [CrossRef]
- McCombs, M.P.; Mulligan, R.P.; Boegman, L.; Rao, Y.R. Modeling surface waves and wind-driven circulation in eastern Lake Ontario during winter storms. J. Great Lakes Res. 2014, 3, 130–142. [Google Scholar] [CrossRef]
- Schoen, J.; Stretch, D.; Tirok, K. Wind-driven circulation patterns in a shallow estuarine lake: St Lucia, South Africa. Estuar. Coast. Shelf Sci. 2014, 146, 49–59. [Google Scholar] [CrossRef]
- Andutta, F.P.; Ridd, P.V.; Wolanski, E. The age and the flushing time of the Great Barrier Reef waters. Cont. Shelf Res. 2013, 53, 11–19. [Google Scholar] [CrossRef]
- Li, Y.; Acharya, K.; Yu, Z. Modeling impacts of Yangtze River water transfer on water ages in Lake Taihu, China. Ecol. Eng. 2011, 37, 325–334. [Google Scholar] [CrossRef]
- Gourgue, O.; Deleersnijder, E.; White, L. Toward a generic method for studying water renewal, with application to the epilimnion of Lake Tanganyika. Estuar. Coast. Shelf Sci. 2007, 74, 628–640. [Google Scholar] [CrossRef]
- Li, Y.L.; Zhang, Q.; Yao, J.; Werner, A.D.; Li, X.H. Hydrodynamic and hydrological modeling of Poyang Lake-catchment system in China. J. Hydrol. Eng. 2014, 19, 607–616. [Google Scholar] [CrossRef]
- Zhang, Q.; Ye, X.C.; Werner, A.D.; Li, Y.L.; Yao, J.; Li, X.H.; Xu, C.Y. An investigation of enhanced recessions in Poyang Lake: Comparison of Yangtze River and local catchment impacts. J. Hydrol. 2014, 517, 425–434. [Google Scholar] [CrossRef]
- Li, Y.L.; Zhang, Q.; Yao, J. Investigation of residence and travel time in a large floodplain lake with complex lake-river interactions: Poyang Lake (China). Water 2015, 7, 1991–2012. [Google Scholar] [CrossRef]
- Zhang, Q.; Werner, A.D. Hysteretic relationships in inundation dynamics for a large lake-floodplain system. J. Hydrol. 2015, 527, 160–171. [Google Scholar] [CrossRef]
- Kanai, Y.; Ueta, M.; Germogenov, N.; Nagendran, M.; Mita, N.; Higuchi, H. Migration routes and important resting areas of Siberian cranes (Grus leucogeranus) between northeastern Siberia and China as revealed by satellite tracking. Biol. Conserv. 2002, 106, 339–346. [Google Scholar] [CrossRef]
- Gao, J.; Jia, J.; Kettner, A.J.; Xing, F.; Wang, Y.P.; Xu, X.N.; Yang, Y.; Zou, X.Q.; Gao, S.; Qi, S.; et al. Changes in water and sediment exchange between the Changjiang River and Poyang Lake under nature and anthropogenic conditions, China. Sci. Total Environ. 2014, 481, 542–553. [Google Scholar] [CrossRef] [PubMed]
- Feng, L.; Hu, C.; Chen, X.; Cai, X.; Tian, L.; Gan, W. Assessment of inundation changes of Poyang Lake using MODIS observation between 2000 and 2010. Remote Sens. Environ. 2012, 121, 80–92. [Google Scholar] [CrossRef]
- Wei, Y.; Zhang, J.; Zhang, D.; Tu, T.; Luo, L. Metal concentrations in various fish orgrans of different fish species from Poyang Lake, China. Ecotox. Environ. Safe 2014, 104, 182–188. [Google Scholar] [CrossRef] [PubMed]
- Zhen, L.; Li, F.; Huang, H.; Dilly, O.; Liu, J.; Wei, Y.; Yang, L.; Cao, X. Households’ willingness to reduce pollution threats in the Poyang Lake region, southern China. J. Geochem. Explor. 2011, 110, 15–22. [Google Scholar] [CrossRef]
- Cheng, S.; Ru, B. The Characteristics of the lake current of Poyang Lake. Jiangxi Hydrau. Sci. Technol. 2003, 29, 105–108. (In Chinese) [Google Scholar]
- Danish Hydraulic Institute (DHI). MIKE 21 Flow Model FM: Transport Module User Guide; DHI Water and Environment: Hørsholm, Denmark, 2014; pp. 1–42. [Google Scholar]
- Danish Hydraulic Institute (DHI). MIKE 21 Flow Model FM: Particle Tracking Module User Guide; DHI Water and Environment: Hørsholm, Denmark, 2014. [Google Scholar]
- Zhang, D.W.; Wei, Y.H.; Zhang, L.; Lin, G.G.; Chen, Y.W.; Tu, T.T. Dsitribution of heavy metals in water, suspended particulate metetr and sediment of Poyang lake, China. Fresen. Environ. Bull. 2012, 21, 1910–1919. [Google Scholar]
- Miller, R.L.; McPherson, B.F. Estimating estuarine flushing and residence times in Charlotte harbor, Florida, via salt balance and a box model. Limnol. Oceanogr. 1991, 47, 1545–1553. [Google Scholar] [CrossRef]
- Liu, W.; Chen, W.; Hsu, M. Using a three-dimensional particle-tracking model to estimate the residence time and age of water in a tidal estuary. Comput. Geosci UK 2011, 37, 1148–1161. [Google Scholar] [CrossRef]
- Fan, X. The Study of Hydrodynamic Simulation of Poyang Lake Based on Delft3D Model. Master’s Thesis, Jiangxi Normal University, Nanchang, China, June 2010. [Google Scholar]
- Anderson, K.E.; Harrison, L.R.; Nisbet, R.M.; Kolpas, A. Modeling the influence of flow on invertebrate drift across spatial scales using a 2D hydraulic model and 1D population model. Ecol. Model. 2013, 265, 207–220. [Google Scholar] [CrossRef]
- Danish Hydraulic Institute (DHI). MIKE 21 Flow Model: Hydrodynamic Module User Guide; DHI Water and Environment: Hørsholm, Denmark, 2014. [Google Scholar]
- Wu, Z.; He, H.; Cai, Y.; Zhang, L.; Chen, Y. Spatial distribution of chlorophyll a and its relationship with the environment during summer in Lake Poyang: A Yangtze-connected lake. Hydrobiologia 2014, 732, 61–70. [Google Scholar] [CrossRef]
- Guo, H.; Hu, Q.; Zhang, Q.; Feng, S. Effects of the Three Gorges Dam on Yangtze River flow and river interaction with Poyang Lake, China: 2003–2008. J. Hydrol. 2012, 416, 19–27. [Google Scholar] [CrossRef]
- Chen, W.; Liu, W.; Kimura, N.; Hsu, M. Particle release transport in Danshuei River estuarine system and adjacent coastal ocean: A modeling assessment. Environ. Monit. Assess. 2010, 168, 407–428. [Google Scholar] [CrossRef] [PubMed]
- Jia, X.; Zeng, F.; Gu, Y. Semi-analytical solutions to one-dimensional advection-diffusion equations with variable diffusion coefficient and variable flow velocity. Appl. Math. Comput. 2013, 221, 268–281. [Google Scholar] [CrossRef]
- Zeinoddini, M.; Tofighi, M.A.; Vafaee, F. Evaluation of dike-type causeway impacts on the flow and salinity regimes in Urmia Lake, Iran. J. Great Lakes Res. 2009, 35, 13–22. [Google Scholar] [CrossRef]
© 2015 by the authors; licensee MDPI, Basel, Switzerland. This article is an open access article distributed under the terms and conditions of the Creative Commons Attribution license (http://creativecommons.org/licenses/by/4.0/).
Share and Cite
Li, Y.; Yao, J. Estimation of Transport Trajectory and Residence Time in Large River–Lake Systems: Application to Poyang Lake (China) Using a Combined Model Approach. Water 2015, 7, 5203-5223. https://doi.org/10.3390/w7105203
Li Y, Yao J. Estimation of Transport Trajectory and Residence Time in Large River–Lake Systems: Application to Poyang Lake (China) Using a Combined Model Approach. Water. 2015; 7(10):5203-5223. https://doi.org/10.3390/w7105203
Chicago/Turabian StyleLi, Yunliang, and Jing Yao. 2015. "Estimation of Transport Trajectory and Residence Time in Large River–Lake Systems: Application to Poyang Lake (China) Using a Combined Model Approach" Water 7, no. 10: 5203-5223. https://doi.org/10.3390/w7105203