Abstract
Beyond doubt, desalination is growing rapidly worldwide. However, there are still obstacles to its wider implementation and acceptance such as: (a) high costs and energy use for fresh water production; (b) environmental impacts from concentrate disposal; (c) a complex, convoluted and time-consuming project permitting process; and (d) limited public understanding of the role, importance, benefits and environmental challenges of desalination. In this paper, a short review of desalination in Greece is being made. Data on the cost of desalination shows a decrease in the future and the potential of water desalination in Greece. The paper summarizes the current status in southeastern Greece (e.g., Aegean islands and Crete), and investigates the possibility of production of desalinated water from brackish water.
1. Introduction
Ever since desalination was originally invented in antiquity, different technologies have been developed. Back in the 4th century BC, Aristotle, the Hellenic philosopher, described a desalination technique by which non-potable water evaporated and finally condensed into potable liquid. Likewise, Alexander of Aphrodisias in the 200 AD described a technique used by sailors, as follows: seawater was boiled to produce steam, and that steam was then absorbed by sponges, thereby resulting in potable water []. Since then, the technology of seawater desalination for the production of potable water evolved rapidly and has become quite popular [].
The most reliable desalination processes that can currently be exploited at the commercial scale can be divided in two main categories:
- (a)
- thermal (or distillation) processes like multi-stage flash distillation (MSF), multi-effect distillation (MED), thermal vapor compression (TVC), and mechanical vapor compression (MVC) processes; and
- (b)
- membrane processes: reverse osmosis (RO) and electrodialysis (ED) processes. ED is mostly used for brackish water installations, while RO can be used for both, brackish and seawater [].
Over the last few years, a large number of desalination plants began to operate globally. Moreover, the production cost of desalinated water has been considerably decreased and is expected to decrease even further [,]. This is mostly due to the recent improvements in membrane technology, but also due to the increase of the energy conversion coefficiency for desalination processes [].
In this paper, a short review of water desalination is provided before cost data are examined and processed. This paper focuses on water desalination processes and projects in Greece.
2. Desalination is Growing around the World
Desalination is growing so fast globally that it is more than certain that it will play a significant role in water supply in the years to come. Desalination is growing particularly in parts of the world where water availability is low. Annual desalination capacity seems to increase rapidly as years go by.
A sharp increase in the number of desalination projects to supply water is indicated. This rose from 326 m3/d in 1945 to over 5,000,000 m3/d in 1980 and to more than 35,000,000 m3/d in 2004 []. In 2008, the total daily capacity was 52,333,950 m3/d, from some 14,000 plants in operation globally []. In 2011, the total capacity was about 67,000,000 m3/d, while in 2012 it was estimated at about 79,000,000 m3/d from some 16,000 plants worldwide [].
The Gulf Region (Middle East) has the biggest number of desalination plants in the world, followed by the Mediterranean, the Americas, and Asia []. The percentages of desalination plants for each geographical area are shown in Figure 1.
The global capacity of desalination plants, including renewable desalination, is expected to grow at an annual rate of more than 9% between 2010 and 2016. The market is set to grow in both developed and emerging countries such as the United States, China, Saudi Arabia (SA) and the United Arab Emirates (UAE), as shown in Figure 2. A very significant potential also exists in rural and remote areas, as well as in islands (Figure 2, rest of world (ROW)), where grid electricity or fossil fuels to generate energy may not be available at affordable costs. About 54% of the global growth is expected to occur in the Middle East and North Africa (MENA) region [], where the 21 million m3/d of desalinated water in 2007 is expected to reach 110 million m3/d by 2030, of which 70% is in SA, the UAE, Kuwait, Algeria and Libya [].
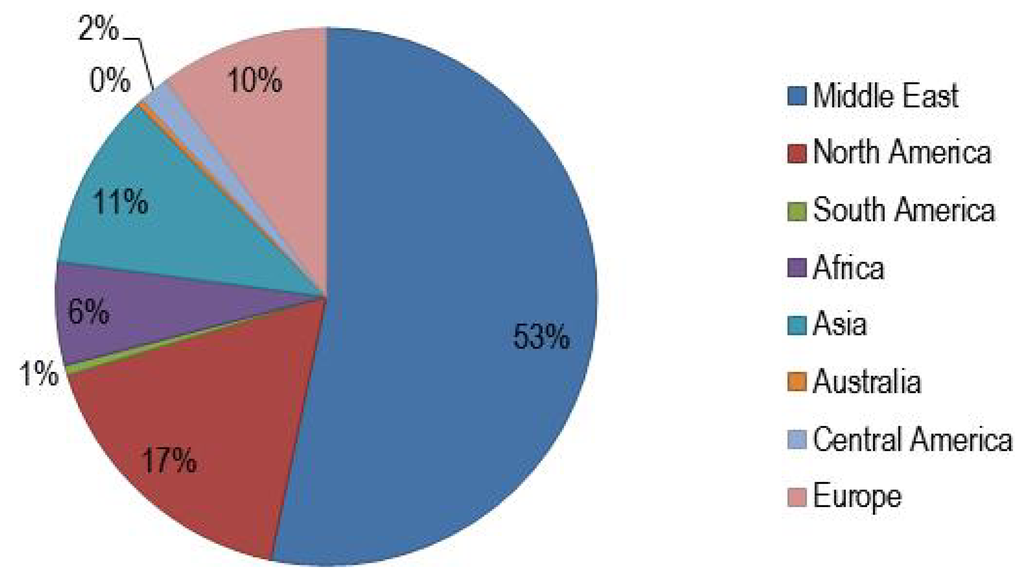
Figure 1.
World desalination plants per geographical area (%). Adapted from [].
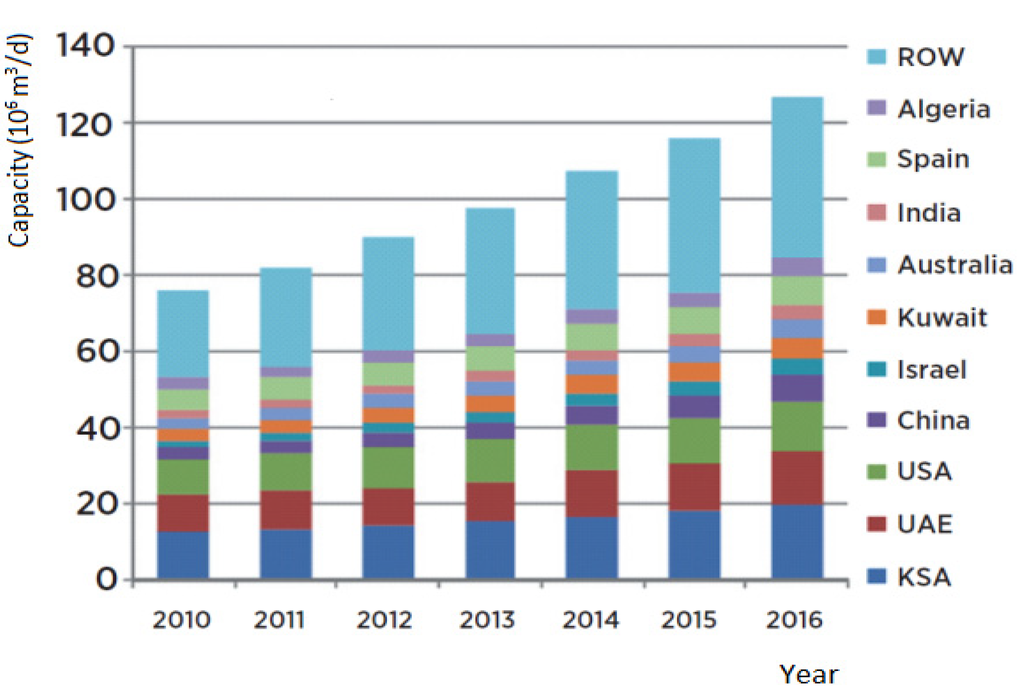
Figure 2.
Global installed desalination capacity, 2010–2016. Adapted from [].
The majority of the largest desalination plants (in operation or under construction) use seawater and are located in the Middle East. The biggest desalination plant is the Ras Al-Khair in the city of Ras Al-Khair (also called Ras Al-Zour or Ras Azzour) SA, which uses both membrane and thermal technology with a capacity over 1,000,000 m3/d, in operation since 2013. The Ras Al-Khair plant supplies Maaden factories with 25,000 m3 of desalinated water and 1350 MW of electricity. It also supplies with water the capital city of Riyadh and several central cities with a total need of 900,000 m3/d [,]. Another example is the 880,000 m3/d MSF Shuaiba 3 desalination plant that is located along the east coast of SA and supplies with potable water the cities of Jeddah, Makkah, and Taif. SA also hosts the Ras Al-Zour unit, producing 800,000 m3/d of water []. Table 1 shows some of the biggest desalination plants in the world.

Table 1.
The biggest desalination plants around the world. SA: Saudi Arabia; and UAE: United Arab Emirates. Adapted from [,,].
| Location | Capacity (m3/d) | Feedwater | Operation year |
|---|---|---|---|
| Ras Al-Khair, SA | 1,025,000 | N/A | 2013 |
| Shuaiba, SA | 880,000 | Seawater | 2007 |
| Ras Al-Khair, SA | 800,000 | Seawater | 2007 |
| Al Jubail, SA | 730,000 | Seawater | 2007 |
| Jebel Ali, United Arabic Emirates | 600,000 | Seawater | 2011 |
| Al-Zour North, Kuwait | 567,000 | Seawater | 2007 |
As far as the membrane technologies are concerned, especially the RO desalination technology (one of the most renowned), there are big plants around the world with great potential in energy saving and reasonable production cost (Table 2) []. The largest membrane desalination plant in the world is the Victoria Desalination Plant in Melbourne, Australia with a capacity 444,000 m3/d, in operation since 2012. However, larger units will soon operate, like the Magtaa plant in Algeria and the Soreq plant in Israel, with capacities of 500,000 m3/d and 510,000 m3/d, respectively [].
Table 2.
Major reverse osmosis (RO) desalination plants in the world. Adapted from [,].
| Location | City, Country | Capacity (m3/d) |
|---|---|---|
| Soreq desalination plant | Rishon Letzion, Israel | 510,000 |
| Magtaa desalination plant | Oran, Algeria | 500,000 |
| Victoria desalination plant | Melbourne, Australia | 444,000 |
| Point Lisas desalination plant | Point Lisas, Trinidad | 109,019 |
| Tampa Bay desalination plant | Tampa, FL, USA | 94,635 |
3. Production Cost of Desalinated Water
The overall cost of desalination can be divided into investment cost and maintenance-operation cost. Investment cost involves land, edifices and equipment, as well as transportation cost, insurance, construction, legal fees and unforeseen costs. Maintenance and operation cost is divided in energy cost, maintenance, repairs, personnel/staff, spare parts, and reconstruction when required. Energy cost is the higher contributor to operation cost and thus to the overall cost. In many cases, energy cost can reach almost the 60% of the operation and maintenance cost. A comparison of the total cost of the RO and MSF technologies is given in Table 3 [].
Table 3.
Cost percentage in conventional RO and multi-stage flash distillation (MSF) of the same capacity in Lybia. Adapted from [].
| Desalination technology | Investment cost (%) | Energy cost (%) | Maintenance & repair cost (%) | Membrane replacement cost (%) | Personnel cost (%) | Chemicals cost (%) |
|---|---|---|---|---|---|---|
| RO (membrane) | 31 | 26 | 14 | 13 | 9 | 7 |
| MSF (thermal) | 42 | 41 | 8 | 0 | 7 | 2 |
Cost evaluation for desalination is a difficult process as data are influenced by different factors such as energy cost, materials and labor. Those factors differ significantly from place to place. Moreover, cost is influenced by elements like desalination technology, total dissolved solids (TDS) concentration of the raw water used to feed the plant, and other economic parameters that related to local conditions []. In conclusion, desalination cost is significantly decreasing when brackish water is used instead of seawater and when the capacity of the plant is increased (Table 4).
Table 4.
Desalinated water production cost from seawater and brackish water.
| Capacity (m3/d) | Cost (€/m3) | |
|---|---|---|
| Sea water | Brackish water | |
| 3,800 | 0.97 | 0.50 |
| 7,600 | 0.70 | 0.27 |
| 19,000 | 0.54 | 0.21 |
| 38,000 | 0.50 | 0.17 |
| 57,000 | 0.49 | 0.15 |
Membrane desalination technologies such as RO are known for their lower energy demands compared to thermal technologies which can be further reduced using energy recovery systems. Such limited energy demands have direct effect on the cost of the produced desalinated water, which in most cases is lower than the cost of water produced by thermal technologies. The RO cost per feeding water and capacity is shown in Table 5, compared to the cost related to the most common thermal desalination technologies.
Table 5.
RO desalination production cost compared to thermal desalination technologies cost, per feeding water and production capacity. MED: multi-effect distillation; and VC: vapor compression. Adapted from [].
| Feedwater | Plant capacity (m3/d) | Cost (€/m3) |
|---|---|---|
| Brackish water RO | <20 | 4.50–10.32 |
| 20–1,200 | 0.62–1.06 | |
| 40,000–46,000 | 0.21–0.43 | |
| Seawater RO | <100 | 1.20–15.00 |
| 250–1,000 | 1.00–3.14 | |
| 1,000–4,800 | 0.56–1.38 | |
| 15,000–60,000 | 0.38–1.30 | |
| 100,000–320,000 | 0.36–0.53 | |
| MSF | <100 | 2.00–8.00 |
| 12,000–55,000 | 0.76–1.20 | |
| >91,000 | 0.42–0.81 | |
| MED | 23,000–528,000 | 0.42–1.40 |
| VC | 1,000–1,200 | 1.61–2.13 |
Hybrid desalination systems, which are used to combine desalination technologies, are suitable for big installations in order to accomplish scale economies that reduce the production cost. In such plants, membrane technologies can be combined with thermal technologies and vice versa. To give an example, in a plant where the brine flow of RO is the feed flow of membrane distillation, the cost is 0.94 €/m3. Had the system used only RO, the respective cost would be 0.94 €/m3, whereas the same system operating under membrane distillation would have a production cost of 0.99 €/m3. In other words, when technologies are combined the double quantity of water is produced at the same cost or less compared with the alternatives. To give another example, a MSF used in a desalination plant of 528,000 m3/d, produces water at a 0.32 €/m3, whereas when it is combined with RO, its cost is reduced by 15% []. It should be noted that the water production cost of a desalination plant that uses renewable energy is estimated to be higher than one that uses conventional energy []. An example of the cost per feeding water and energy source used is shown in Table 6.
Table 6.
Cost of desalinated water production per feeding water and energy source used. Adapted from [].
| Feedwater source | Energy source | Cost (€/m3) |
|---|---|---|
| Brackish water | Conventional energy | 0.21–1.06 |
| Photovoltaic panels energy | 4.50–10.32 | |
| Geothermal energy | 2.00 | |
| Seawater | Conventional energy | 0.35–2.70 |
| Wind power | 1.00–5.00 | |
| Photovoltaic panels energy | 3.14–9.00 |
A decreasing attitude is observed to the cost of desalination for production of potable water, compared with other technologies. Improvement on membrane technology will be a catalyst in cost reduction []. In Greece and other Mediterranean areas there have been several comparisons between desalinated water production and conventionally extracted water (e.g., dams and groundwater wells). However, in such comparisons, the rapid improvement of the RO membrane technology should be considered. In the near future it is expected that desalinated water cost (especially coming from brackish water) will be less than any other conventional technologies. It is estimated that desalination cost will be lowered 4% to 5% per year due to the continuous improvement of membrane technology.
Some examples of desalinated water production cost in different regions worldwide are presented:
- (a)
- In Malta, where 70% of the total water consumption comes from desalination, cost varies between 0.30 €/m3 and 0.45 €/m3.
- (b)
- In Cyprus, the country with a high density of dams worldwide, the last decade potable water supply was reinforced by three desalination plants. The total cost at the two plants at Larnaca varies today from 0.45 €/m3 to 0.54 €/m3.
- (c)
- In Israel, the cost of water production in the Ashkelon plant is around 0.50 €/m3. This quantity consists of desalinated seawater (48%), desalinated brackish (45%), and recycled wastewater (7%). The total cost for desalination at the five plants ranged from 0.61 €/m3 to 0.94 €/m3. Increased cost is due to: (i) the technology chosen (multiple stage evaporation) for the energy consumed; and (ii) very high TDS concentrations (47,000–50,000 mg/L) of seawater in the Gulf.
- (d)
- In East Australia, in areas with very low water availability (Perth), water supply was based on desalination for the past 10 years. Total cost was as low 0.33–0.42 €/m3.
- (e)
- In Greece, and especially in touristic areas, there are numerous RO installations. Today, the average water production cost from seawater for such technology is 0.60–0.70 €/m3. The production cost in case brackish water is used ranges from 0.3 €/m3 to 0.4 €/m3, depending on the feed water TDS concentration and the condition of operation and management. On the other hand, for the RO desalination plant on the island of Milos (with capacity 3360 m3/d and energy produced from wind turbines), the cost is 1.80 €/m3 [], whereas in the geothermal MED plant on the same island, the cost is less than 1 €/m3 [].
- (f)
- In California, USA, there are over 20 desalination plants operating or under construction that by 2015 will reach 2,600,000 m3/d, a quantity that covers 15% of the total water needs []. One of these plants (Carlsbad), with a capacity of 190,000 m3/d, is called a “Green desalination plant” as it has environmentally friendly installations, total energy reclamation as well as the respective minimization of greenhouse gasses. The plant was constructed as a build-own-transfer (BOT) project and is the biggest in the US, producing 8% of the water needs in the region of San Diego. Water production cost is estimated at 0.50 €/m3.
- (g)
- In general, the cost of recently constructed RO plants (e.g., in Tampa Bay USA in 2003 and in Singapore in 2005) has been reduced up to 1/3 in comparison with that of the plants constructed 13–18 years ago (e.g., in Bahamas in 1995, in Dekelia, Cyprus in 1997, and in Limassol, Cyprus in 2001) (Figure 3). Such a decrease is not only attributed to the rapid evolution of desalination technology during recent years but also to the cost reduction due to the increased size of those plants. It is difficult to quantify the effect that these parameters have, since they seem to act simultaneously [].
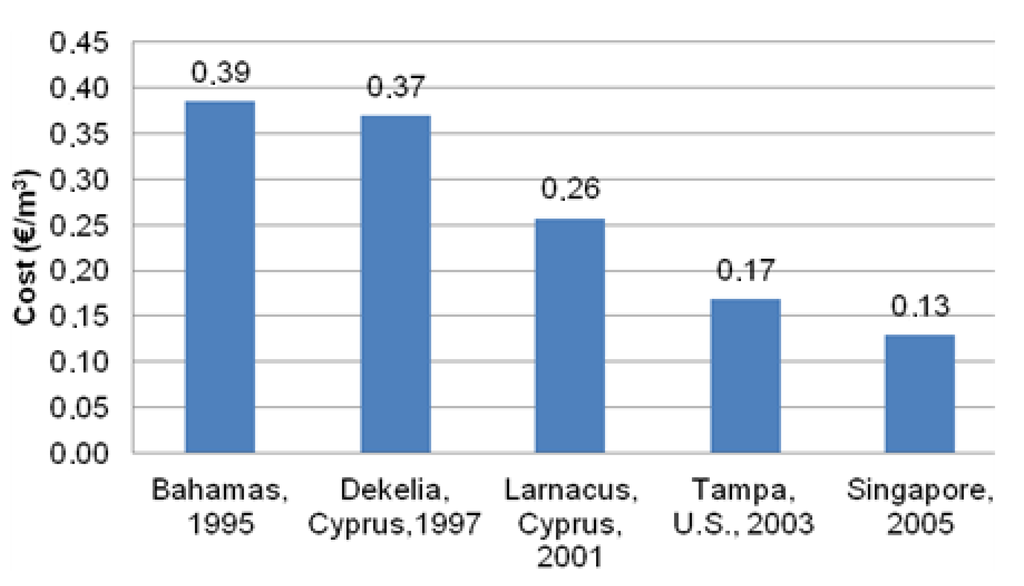
Figure 3.
Cost of desalination plants that were installed between 1995 and 2005. Adapted from [].
4. Desalination Environmental Impacts
The desalination process has relatively low environmental impact. However, it is reported that the discharge of brine into the sea may erode the seashore [] or harm the aquatic life []. Moreover, to avoid unregulated development of coastal areas, desalination activity should be included in the regional development projects [].
The main environmental impact concerns are land use, brine disposal, and energy consumption. Land use issues emerge from the fact that seawater desalination plants are situated close to sites with particularly sensitive environmental habitats and many social, economic, ecological, and recreational functions. The search for an appropriate plant location has to be carried out with great caution in order to minimize adverse impacts []. Furthermore, desalination processes produce a particularly high salinity flow (brine) and its disposal directly to the sea may also harm the environment. Potential environmental impacts should be minimized by refraining from discharging brine directly into the sea. Finally, as far as energy consumption is concerned, despite the great achievements in this field, desalination processes like RO are still quite energy-intensive. Since most of the energy is taken from fossil sources, the CO2 emissions are an issue that cannot be ignored. However, the use of modern processes and alternative energy sources can reduce the emissions of CO2 and other air pollutants [].
5. Water Scarcity in Greece
In Greece, and particularly in several southeastern regions, there is a very low water availability, which is exacerbated by the high water demand for tourism and irrigation in summertime. Therefore, the integration of desalinated water, treated wastewater and other marginal waters into water resources and the management of master plants are of paramount importance to meet future water demands [].
The problem seems to be more evident in the Aegean Islands (particularly the Dodecanese and Cyclades), Thessaly in Central Greece, eastern Continental Greece (Sterea Greece), eastern Crete and the southeastern Peloponnese (Figure 4). More specifically, in central Greece (Thessaly and Sterea Greece), there is a high water demand for agricultural irrigation [], while on the islands the problem is mainly attributed to the increased demand in potable water during the summertime []. Both the population density of the Region of Crete (Prefectures of Chania, Rethymno, Iraklio and Lasithi) and the Regions of North and South Aegean (Prefectures of Lesvos, Chios, Samos, Dodecanese and Cyclades) are below the population density of Greece. Both regions receive large numbers of visitors during the summer []. Nonetheless, that high water demand is also attributed to over-exploitation of groundwater aquifers, as well as to groundwater contamination, including seawater intrusion in coastal areas. In addition, the small size of the islands and their geography does not allow other possible cost-effective technologies to increase water availability [].
The aforementioned regions are located in the southeastern part of Europe. Their climate is typically Mediterranean: hot and dry. Their relatively long distance from the mainland adds to their economic woes compared to similar parts of Europe []. Due to their geographical isolation, these areas are equipped with autonomous, yet limited conventional power grids. However, there is an abundance in renewable energy sources such as aeolic and solar power, as well as geothermal and wave power (Figure 5) [].
Currently, the main way for meeting deficient water balance of the “semi-arid” islands is water transportation whose cost varies from 4.91 €/m3 to 8.32 €/m3 [], and has a great environmental burden in terms of ship emissions. Moreover, the water transported is in most cases not potable, therefore, an economic and environmental analysis should also take into consideration the impacts of increased use of bottled water. Other ways of meeting the water deficiency needs are the exploitation of ground water, dams, and rainwater collection.
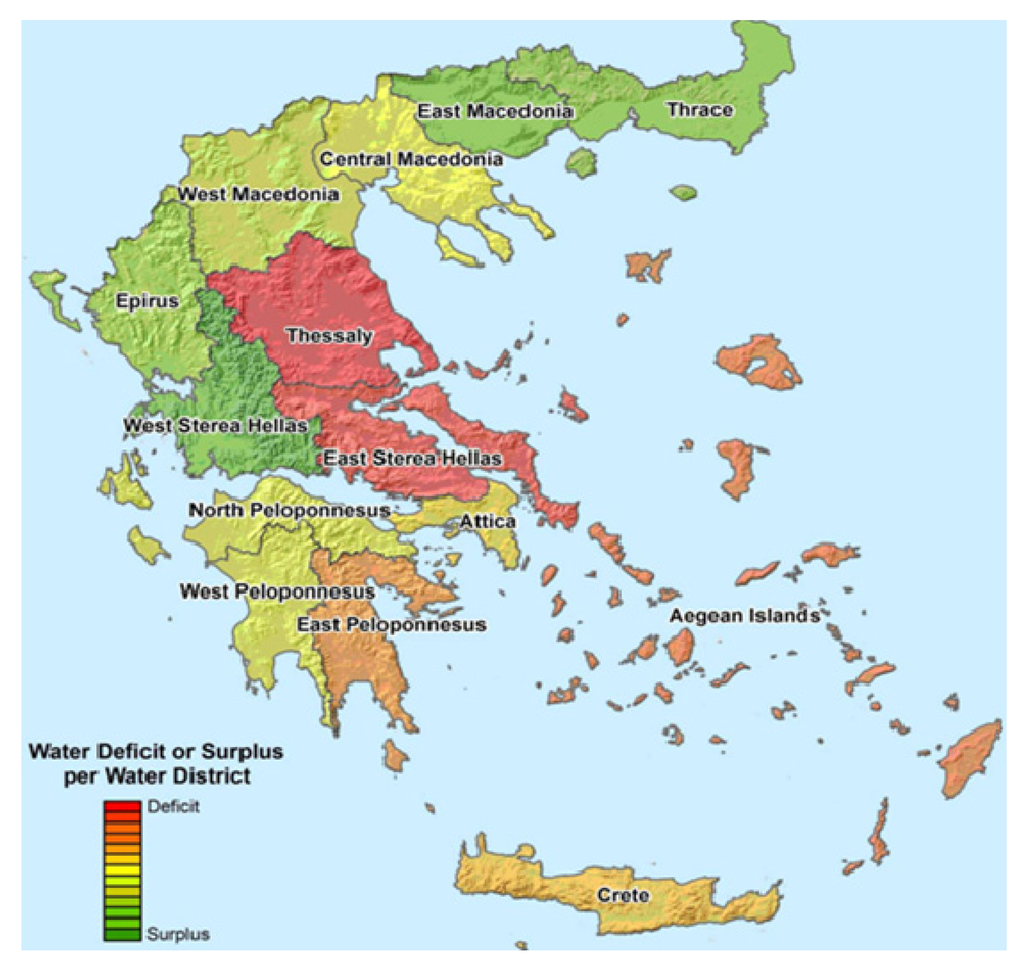
Figure 4.
Deficit and/or surplus of potable water per water district in Greece []. With permission of Stefopoulou et al. (2008) [].
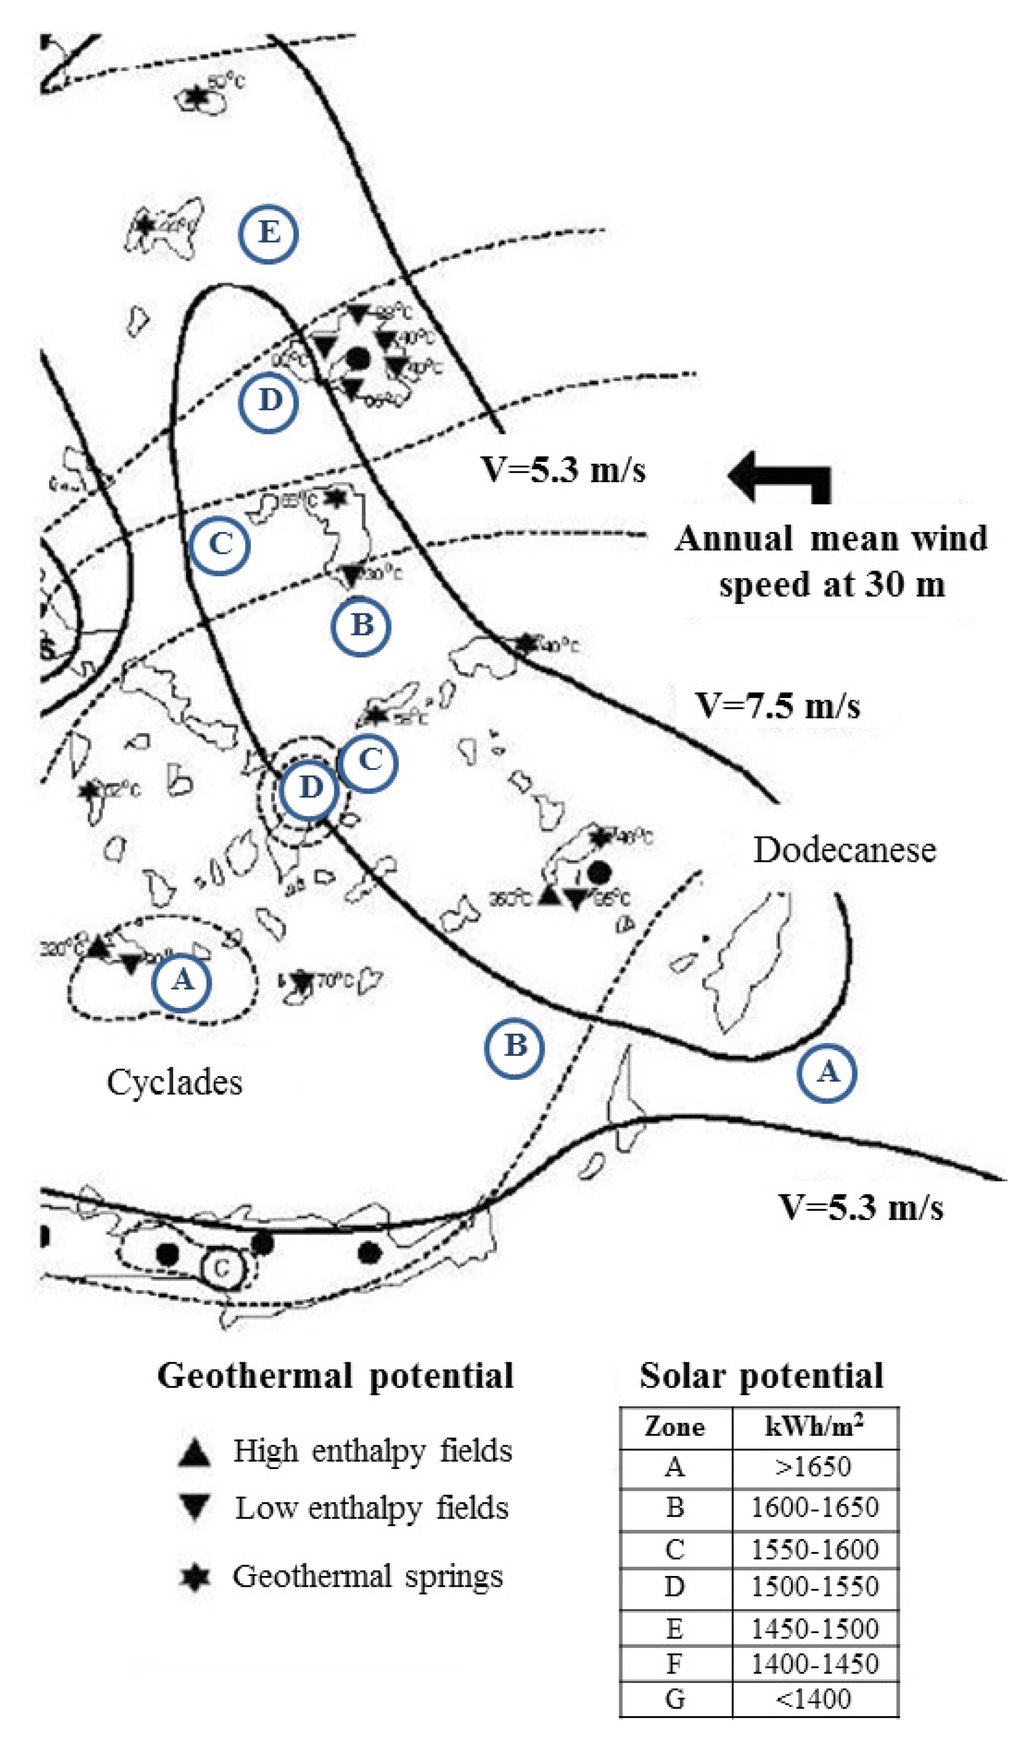
Figure 5.
Renewable energy sources in Cyclades and Dodecanese. With permission of Manolakos (2012) [].
Last but not least, there are also a few desalination plants, especially in southeastern water supply and sewage municipalities or where big hotels are located. Many of these desalination plants use the RO technology. Apart from the state-owned desalination plants, there are many private plants in operation owned by hotels. A significant number of desalination plants is currently under construction or under planning.
6. Desalination Status in Greece
According to the 2011 IDA Worldwide Desalting Plants Inventory in Greece, there are currently 157 operating desalination plants, with a total capacity of 109,115 m3/d, while another 35 are expected to soon be operational, with a total capacity of 40,135 m3/d. Moreover, in 2011, five more desalination plants were under construction, with a capacity reaching 32,800 m3/d [].
As for the feed water, 56% is seawater, while 41% is brackish water (Figure 6a). Regarding the use of the produced desalinated water, 48.08% is to supply the municipalities, 31.07% goes to the industry, 15.94% covers touristic demands, and 4.24% and 0.16% are directed to power production and water supply of military camps, respectively (Figure 6b).
RO is the most popular desalinating technology in Greece, as it produces 74.41% of the desalinated water. ED is used for the desalination of 10.20% of the total desalinated water produced, whereas MED is used for 8.47% of the produced water and MSF is used for the 6.75% (Figure 6c) [].
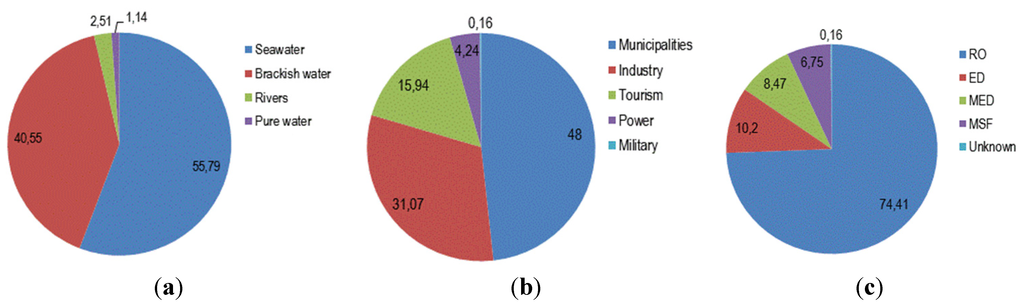
Figure 6.
Desalinated water production according to: (a) feed water; (b) its uses; and (c) the used technology, in Greece. Adapted from [].
There are 35 RO plants operating in the Hellenic island municipalities with a total capacity of 22,860 m3/d and operating costs ranging from 0.13 €/m3 to 2.70 €/m3 (Table 7). The newest desalination plant in Almyros (Iraklion, Crete), with a capacity of 2,400 m3/d, has been in operation since January 2014. This project is the first one whereby the produced water will be sold by the contractor to the Municipality of Iraklion, at a guaranteed price of 0.27 €/m3 for five years []. Also, a future upgrading of its capacity up to 20,000 m3/d is planned. Note that the Almyros brackish spring, from where the plant will be fed, has a capacity more than 620,000 m3/d.
The average operating costs of 30 RO plants of seawater desalination (Table 7) in the Hellenic islands has been estimated at 0.85 €/m3. More precisely, the 4800 m3/d capacity plant in Leros has a minimum operational cost of 0.13 €/m3, while the 500 m3/d capacity in Sifnos reaches the highest registered value of 3.5 €/m3. The range of this cost is depicted in Figure 7 [].
Table 7.
RO desalination plants in Hellenic islands’ municipalities. Adapted from [].
| Project | Year | Type | Capacity (m3/d) | Initial cost (M €) | Operation cost (€) | Contractor | Acceptance |
|---|---|---|---|---|---|---|---|
| Almyros Iraklion | 2014 | RO & UF | 2,400 | 0.850 | 0.25 | Sychem S.A., GR | Good |
| Syros 1st Ermoupoli | 1992 | RO | 800 | 0.589 | 2.70 | Christ, CH | Good |
| Syros 2nd Ermoupoli | 1997 | RO | 800 | 1.482 | 2.70 | Christ, CH | Good |
| Syros 3rd Ermoupoli | 2001 | RO (SW) | 40 | 0.346 | 2.00 | Culligan Greece | Good |
| Syros 4th (Ano Syros) | 2000 | RO | 250 | 0.215 | 0.50 | Temak, GR | Good |
| Syros 5th (Ano Syros) | 2002 | RO | 500 | 0.400 | 0.50 | Temak, GR | Good |
| Syros 6th (Ermoupolis) | 2002 | RO (SW) | 2,000 | 0.313 | 0.40 | Temak, GR | Good |
| Syros 7th (Ano Syros) | 2005 | RO | 1,000 | 1.000 | 0.40 | Temak, GR | Under construction |
| Shinousa | 2004 | RO | 100 | 0.120 | 0.70 | Temak, GR | Under construction |
| Mykonos (Korfou) old | 1981 | RO | 500 | N/A | 2.00 | Μetek, ΙΤ | Good |
| Mykonos (Korfou) new | 2001 | RO | 2,000 | 1.276 | 0.50 | Culligan Greece | Good |
| Paros (Naousa) | 2001 | RO | 1,200 | 0.415 | 0.50 | Ionics Itaba | Good |
| Tinos (old) | 2001 | RO | 500 | 0.434 | 0.62 | Culligan Greece | Good |
| Tinos (new) | 2005 | RO | 500 | 0.376 | 0.62 | Culligan Greece | Good |
| Ia, Santorini 1st | 1994 | RO | 220 | N/A | 2.00 | Matrix, USA | Good |
| Ia, Santorini 2nd | 2000 | RO | 320 | 0.210 | 2.00 | Culligan Greece | Good |
| Ia, Santorini 3rd | 2002 | RO | 160 | N/A | 2.00 | Matrix, USA | Good |
| Sifnos | 2002 | RO (BW) | 500 | 0.224 | 3.50 | Hoh, DM | Good |
| Omiroupolis, Chios, Municipality, 1st | 2000 | RO (BW) | 600 | 0.205 | 0.30 | Culligan Greece | Good |
| Omiroupolis, Chios, Municipality, 2nd | 2005 | RO | 3,000 | 0.710 | 0.26 | Culligan Greece | Under construction |
| Omiroupolis, Chios, Municipality, 3rd | 2005 | RO | 500 | 0.200 | 0.26 | Culligan Greece | Under construction |
| Nisiros (old) | 1991 | RO | 300 | 0.572 | N/A | Μetek, ΙΤ | Out of operation |
| Nisiros (new) | 2002 | RO | 350 | 0.295 | 0.66 | Τemak, GR | Good |
| Ithaki, Kefalonia 1st | 1981 | RO | 620 | 0.264 | 2.88 | Christ, CH | Good |
| Ithaki, Kefalonia 2nd | 2003 | RO | 520 | 0.587 | 0.58 | Judo, DE | Good |
| Lerou (Municipal Enterpr.) | 2001 | RO | 200 | 0.074 | 0.13 | Culligan Greece | Good |
| Kassopeon (Municipality) | 2001 | RO | 500 | 0.170 | 0.13 | Culligan Greece | Good |
| Posseidonia (Municipality), 1st | 2002 | RO | 500 | 0.464 | 0.56 | Culligan Greece | Good |
| Posseidonia (Municipality), 2nd | 2005 | RO | 1,000 | 0.574 | 0.45 | Culligan Greece | Under construction |
| Agios Georgios (Municipality) | 2002 | RO | 500 | 0.102 | 0.30 | Culligan Greece | Good |
| Paksoi (Municipality) 1st | 2005 | RO | 330 | 0.260 | 0.51 | Culligan Greece | Good |
| Paksoi (Municipality) 2nd | 2005 | RO | 150 | 0.162 | 0.59 | Culligan Greece | Good |
| Total: 32 | - | - | 22,860 | - | - | - | - |
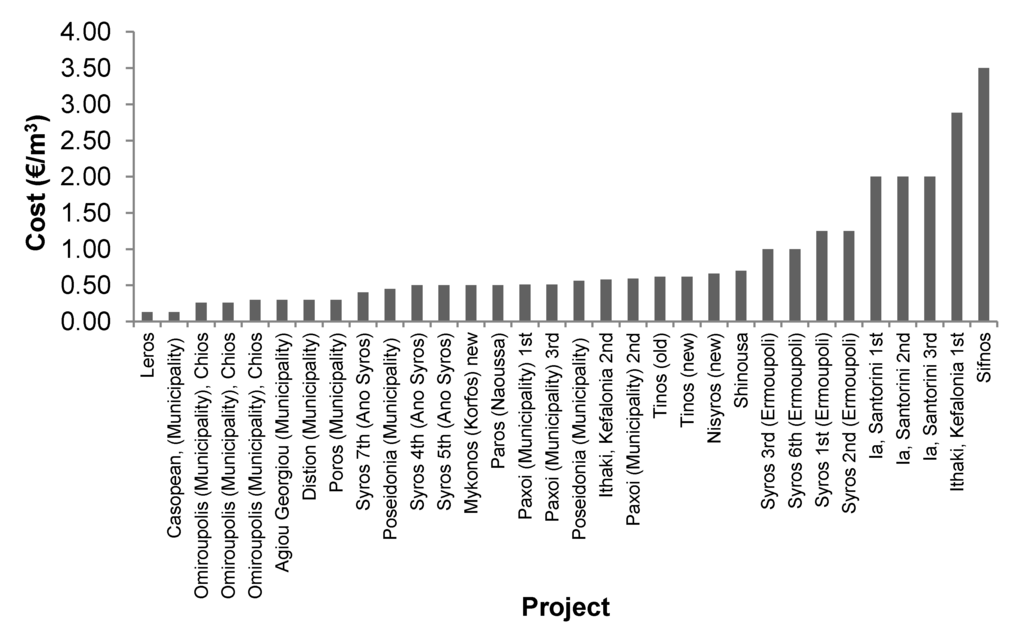
Figure 7.
Operating cost (€/m3) of seawater RO desalination plants in the Hellenic islands. Adapted from [].
The cost of desalinated water in Greece is between 0.5 €/m3 and 3.5 €/m3 [,]; however, in most cases, the cost is above 1.2 €/m3. The cost is relatively higher compared to the cost of large desalinations plants, like those operating in Israel, Malta, and Cyprus, where the cost is usually below 0.7 €/m3 due to the size of the Hellenic plants and their age []. However, as a consequence of the critical importance of desalinated water, it is expected that the Hellenic Government will subsidize the electric energy consumed for this purpose. In southeastern Greece, water supply in the future is expected to be mainly based on desalination. Modern desalination processes of utilizing solar [,], wind [], or wave [] energy, instead of fossil fuels, are under development. Desalination plants utilizing renewable energy sources have also been operating in Greece. Such plants are:
- (a)
- A vapor compression plant charged with a 750 kW wind turbine is located on the island of Symi, producing 450 m3/d, has been operating since 2009.
- (b)
- A MED plant using geothermal energy was built on the island of Kimolos in 2000. This unit has a 188 m well and is considered to be a low enthalpy one (61 °C), capable of producing 80 m3/d.
- (c)
- A hybrid RO was constructed on Keratea in 2002, combining wind turbines with photovoltaic panels. The capacity of this hybrid plant reaches 3 m3/d, while the wind turbines and photovoltaic cells are of 900 W and 4 kWp nominal power, respectively [].
- (d)
- Another plant of today’s capacity 3,360 m3/d is on the island of Milos. It is a RO plant which used the electrical energy needed from an 850 kW wind turbine operating at 600 kW [].
- (e)
- Finally, on Irakleia island, there is a removable RO desalination plant, which uses both wind and solar energy through a 30 kW wind turbine and a backup photovoltaic panel system.
7. The Potential of Using Brackish Waters for Desalination in Greece
Several studies indicate that throughout Greece, especially in island areas, millions m3/year of brackish water are available. Currently the use of brackish water is next to zero. For instance, Crete has an over 1000 hm3/year brackish water potential, while a considerable amount of brackish water also exists on the Aegean islands.
Only discharges of the well-known source of brackish springs (known as Almyroi) on Crete (Iraklion) reach more than 1000 million m3/year: one almyros in the west of Iraklion city has an average discharge of 235 million m3/year, quantities that correspond to 50% of the total annual water used in Crete []. Today, the brackish water is not exploited. Water from the Almyros of Iraklion could be used even as potable for 45–50 d/year when the TDS < 200 mg/L, which means about 5 million m3/year of fresh water could be saved []. One could draw similar examples from other islands.
The desalination of brackish water is of considerably lower cost, compared to the desalination of seawater. This cost reduction may be over 50%, mostly because the cost for the removal of dissolved salt is lower at power salt concentrations [].
8. Discussion and Conclusions
The global population boom, urbanization and climate change have severely reduced water supplies. Furthermore, tapping fresh water for metropolitan areas has become more difficult, if not impossible. Without any doubt, the future relies on the implementation of “NEWater” technologies such as desalination and direct potable reuse of treated wastewater []. Desalination, especially in coastal areas, is the most cost-effective approach to long-term water supply sustainability, compared with other options.
Desalination of sea and brackish water for both water supply and irrigation in arid and semi-arid coastal regions of the world seems to be a very promising technology. In fact, desalination is already a competitive alternative in regards to other options; as the water produced is low-priced in most cases, energy requirements have been significantly reduced and last but not least, it is friendly to the environment, especially when the process powered by renewable energy sources. Also it should be noted that the combination between desalination and renewable energy sources in autonomous independently operating desalination systems, is a unique solution for water in coastal, relatively isolated areas with weak and limited possibilities of local energy supply networks.
As far as Greece is concerned, desalination could be a sustainable option to face water scarcity in the “waterless” islands, especially during the summer months, when there is an increase in water demand. Given adequate public support, desalination plants could become highly competitive in regards to alternatives such as water transfer from the mainland. Transfer cost varies from 4.91 €/m3 to 8.32 €/m3 and is currently the main way of meeting deficient water balance of the semi-arid islands []. Finally, desalination plants could be used as storage of redundant renewable energy in RES installations.
Today, RO desalination technologies have turned out to be the most appropriate in Greece, especially for water supply of the semi-arid islands in the southeastern regions of the country. These technologies have the lowest energy requirements, which can be covered by air turbines or solar panels, e.g., renewable energy sources are abundant in those areas (such as wind and sun), and thus burden only to a minimum the rather sensitive local networks and the environment. Also, RO technologies have limited spatial requirements and are adaptable to changes in productivity. Their manufacture process is simple, a feature absolutely necessary for installations in limited areas, where water demands change continuously. Finally, the cost of water, also an important criterion, is kept low, although it remains somewhat higher than in other desalination processes. However, it remains lower than the cost of transporting water, while in the case of the hybrid RO system, costs are kept at the lowest possible level.
Conclusively, the main points that emerge from this study are the following:
- (a)
- The RO desalination costs over the last 15 years have been significantly reduced. The use of alternative energy sources will further reduce the cost.
- (b)
- Research and technology on the desalination membrane processes will continue to develop in the years to come to the direction of becoming friendly to the environment and cost effective.
- (c)
- Water demand will continue to increase and desalination and water reuse will be sustainable options in increasing the low water availability.
- (d)
- Greece has all the potential to move forward in terms of research and technology on water management internationally and especially in the Mediterranean region, provided there is investment in relative sectors. Emphasis should be put on the green aspect of the desalination technology.
- (e)
- The use of desalination technologies to solve the problem of water shortage in the “waterless” Hellenic islands may lead, under certain circumstances, to the best economic, environmental, and social results, for both the island environment and the local communities, contributing substantially to a comprehensive and worth-living growth.
Acknowledgments
Thanks are due to Veolia Environment, Paris, France and Sychem S.A., Iraklion, Greece for the information provided.
Author Contributions
Konstantinos Zotalis prepared the manuscript and made the data collection; Emmanuel G. Dialynas made the bibliographical review and contributed to manuscript preparation; Nikolaos Mamassis analyzed the data and codified the methodology; and Andreas N. Angelakis had the original idea and supervised the research.
Conflicts of Interest
The authors declare no conflict of interest.
References
- Kalogirou, S. Seawater desalination using renewable energy sources. Desalination 2005, 31, 242–281. [Google Scholar]
- Garcia-Rodriquez, L. Seawater desalination driven by renewable energies: A review. Desalination 2002, 143, 103–113. [Google Scholar] [CrossRef]
- Koroneos, C.; Dompros, A.; Roumbas, G. Renewable energy driven desalination systems modelling. J. Clean. Prod. 2007, 15, 449–464. [Google Scholar] [CrossRef]
- Shannon, M.A.; Bohn, P.W.; Elimelech, M.; Georgiadis, J.G.; Marinas, B.J.; Mayes, A.M. Science and technology for water purification in the coming decades. Nature 2008, 452, 301–310. [Google Scholar] [CrossRef]
- Khawaji, A.D.; Kutubkhanah, I.K.; Wie, J.M. Advances in seawater desalination technologies. Desalination 2008, 221, 47–69. [Google Scholar] [CrossRef]
- Fritzmann, C.; Löwenberg, J.; Wintgens, T.; Melin, T. State-of-the-art of reverse osmosis desalination. Desalination 2007, 216, 1–76. [Google Scholar] [CrossRef]
- Jiménez, B.; Kim, I.S.; Ng, H.Y.; Gray, S. Editorial. J. Water Reuse Desalin. 2011, 1, 1. [Google Scholar]
- Seamonds, A. Desalination in 2008: Global Market Snapshot; International Desalination Association (IDA): Topsfield, MA, USA, 2008. Available online: http://idadesal.org/wp-content/ uploads/2008/10/2008ida-desalination-snapshot_october-2008.pdf (accessed on 20 May 2012).
- Voutchkov, N. Overview of Desalination Status and Future Trends. In Proceedings of the Water and Energy Exchange (WEX) 2012, Lisbon, Portugal, 31 January–2 February 2012.
- Clayton, R.A. Review of Current Knowledge, Desalination for Water Supply; Foundation for Water Research: Marlow, UK, 2011. [Google Scholar]
- Isaka, M. Water Desalination Using Renewable Energy; Technology Brief I12; International Energy Agency (IEA)-Energy Technology Systems Analysis Program (ETSAP): Paris, France; International Renewable Energy Agency (IRENA): Abu Dhabi, United Arab Emirates, 2012. [Google Scholar]
- ConstructionWeekOnline. Largest Desalination Plant in World 75% Complete. 2013. Available online: http://www.constructionweekonline.com/article-22824-largest-desalination-plant-in-world-75-complete/#.UgjrLtJM_7E (accessed on 14 July 2013).
- The International Desalination & Water Reuse Quarterly Industry Website. Installed Desalination Growth Slowed in 2011–2012. 2013. Available online: http://www.desalination.biz/news/news_story.asp?id=6746&title=Installed+desalination+growth+slowed+in+2011%26%238209%3B2012 (accessed on 30 September 2013).
- Henthorne, L. The Current State of Desalination. In Proceedings of the International Desalination Association (ΙDΑ) World Congress, Dubai, United Arab Emirates, 7–12 November 2009.
- Gleick, P.H.; David Katz, H.C.; Lee, E. The World’s Water 2006–2007: The Biennial Report on Freshwater Resources (World’s Water Quality); Island Press: Washington, DC, USA; Pacific Institute for Studies in Development, Environment and Security: Oakland, CA, USA, 2006; Volume 5. [Google Scholar]
- Huntington Beach Facility. Desalination Worldwide: Worldwide Seawater Desalination Capabilities. 2010. Available online: http://hbfreshwater.com/desalination-101/desalination-worldwide (accesed on 12 December 2013).
- Al-Karaghouli, A.A.; Kazmerski, L.L. Renewable Energy Opportunities in Water Desalination. In Desalination, Trends and Technologies; Schorr, M., Ed.; InTech: Rijeka, Croatia, 2011; pp. 149–184. [Google Scholar]
- Gude, V.G.; Nirmalakhandan, N.; Deng, S. Renewable and sustainable approaches for desalination. Renew. Sustain. Energy Rev. 2010, 14, 2641–2654. [Google Scholar] [CrossRef]
- Karagiannis, I.C.; Soldatros, P.G. Water desalination cost literature: Review and assessment. Desalination 2008, 223, 448–456. [Google Scholar] [CrossRef]
- Mathioulakis, E.; Belessiotis, V.; Delyannis, E. Desalination by using alternative energy: Review and state-of-the-art. Desalination 2007, 203, 346–365. [Google Scholar] [CrossRef]
- Karamoutzis, D.; Alexopoulos, A.; Angelakis, A.N. Desalination Technologies for Water Supply; Union of Municipal Enterprises for Water Supply and Sewerage Systems: Larissa, Greece, 2008. (In Greek) [Google Scholar]
- Gerasimou, A. Desalination Using Wind Power in Milos, An Integrated Solution for the Water Availability Problem; Ios-Aegean Energy Agency: Cyclades, Greece, 2010. (In Greek) [Google Scholar]
- Tzen, E. Water Desalination Using Renewable Energy Sources. In Proceedings of the Promotion of Renewable Energies for Water Production through Desalination (ProDes) Project; Agricultural University of Athens (AUA) Workshop: Athens, Greece, 29 May 2010. (In Greek)[Google Scholar]
- Ebensperger, U.; Isley, P. Review of the Current State of Desalination; Working Paper 2005–2008; Environmental Policy Group at the Andrew Young School of Policy Studies: New York, NY, USA, 2005. [Google Scholar]
- Al-Barwani, H.H.; Purnama, A. Re-assessing the impact of desalination plants brine discharges on eroding beaches. Desalination 2006, 204, 94–101. [Google Scholar] [CrossRef]
- Latorre, M. Environmental impact of brine disposal on posidonia seagrasses. Desalination 2005, 182, 517–524. [Google Scholar] [CrossRef]
- Leverenz, H.L.; Tchobanoglous, G.; Asano, T. Direct potable reuse: A future imperative. J. Water Reuse Desalin. 2011, 1, 2–10. [Google Scholar] [CrossRef]
- Sea Water Desalination in the Mediterranean: Assessment and Guidelines; MAP Technical Report Series No. 139; United Nations Environmental Programme (UNEP)/Mediterranean Action Plan (MAP)/Programme for the Assessment and Control of Pollution in the Mediterranean Region (MED POL): Athens, Greece, 2003.
- Bleninger, T.; Jirka, G.H. Environmental Planning, Prediction and Management of Brine Discharges from Desalination Plants; Middle East Desalination Research Center (MEDRC): Muscat, Sultanate of Oman, 2010. [Google Scholar]
- Angelakis, A.N.; Bontoux, L.; Lazarova, V. Main challenges and prospectives for water recycling and reuse in EU countries. Water Supply 2003, 3, 59–68. [Google Scholar]
- Stefopoulou, A.; Soulis, K.; Papapetrou, M.; Kyritsis, S.; Epp, C. Institutional and policy framework analysis in relation to the application of autonomous desalination systems—Greece. Desalination 2008, 220, 455–467. [Google Scholar] [CrossRef]
- Spyrou, I.D.; Anagnostopoulos, J.S. Design study of a stand-alone desalination system powered by renewable energy sources and a pumped storage unit. Desalination 2010, 257, 137–149. [Google Scholar] [CrossRef]
- Dedian, V.; Katochianou, D.; Labropoulou, A. The Social-Economic Identity of the Water Compartments; Centre of Planning and Economic Research (KEPE): Athens, Greece, 2000. (in Greek) [Google Scholar]
- Kaldellis, J.K.; Kavadias, K.A.; Kondili, E. Renewable energy desalination plants for the Greek islands—Technical and economic considerations. Desalination 2004, 170, 187–203. [Google Scholar] [CrossRef]
- Manolakos, D. Desalination Systems in the Islands; Agricultural University of Athens (AUA): Athens, Greece, 2012. (In Greek) [Google Scholar]
- Zotalis, K. Energy and Cost Evaluation of Desalination Systems and their practice in Greece. Master’s Thesis, School of Rural and Surveing Engineering, National Technical University of Athens (NTUA), Athens, Greece, 2012. [Google Scholar]
- Cuenca, J.C. Report on Water Desalination Status in the Mediterranean Countries; Natural Resources Department, Instituto Murciano de Investigación y Desarrollo Agrario y Alimentario (IMIDA): Murcia, Spain, 2012. [Google Scholar]
- Angelakis, A.N. Water Reuse Technologies. In Desalination Technologies for Water Supply; Karamoutzis, D., Alexopoulos, A., Angelakis, A.N., Eds.; Union of Municipal Enterprises for Water Supply and Sewerage Systems: Larissa, Greece, 2008; pp. 17–28. (In Greek) [Google Scholar]
- Gikas, P.; Angelakis, A.N. Water resources management in the Greek river basin districts of Crete and Aegean islands, with emphasis on the utilization of non-conventional water sources. Desalination 2008, 248, 1049–1064. [Google Scholar] [CrossRef]
- Qiblawey, H.M.; Banat, F. Solar thermal desalination technologies. Desalination 2008, 220, 633–644. [Google Scholar] [CrossRef]
- Khaydarov, R.A.; Khaydarov, R.R. Solar powered direct osmosis desalination. Desalination 2007, 217, 225–232. [Google Scholar] [CrossRef]
- McBride, R.; Morris, R.; Hanbury, W. Wind power: A reliable source for desalination. Desalination 1987, 67, 559–564. [Google Scholar] [CrossRef]
- Davies, P.A. Wave-powered desalination: Resource assessment and review of technology. Desalination 2005, 186, 97–109. [Google Scholar] [CrossRef]
- Gerasimou, A. Proposal for Water Deficiency Coverage in the Arid Islands of Cyclades and Dodecanese; International Technological Application (ITA) S.A.: Athens, Greece, 2008. (In Greek) [Google Scholar]
- Knithakis, M.; Kaloumenos, K. The Risk for Bracketing of Surface and Underground Water Resources. In Water Resources Management in Crete; Greek Geotechnical Chamber, Department of Crete: Chania, Greece, 1993; pp. 37–56. (In Greek) [Google Scholar]
- Vergis, G. Study of the Possibility Construction of Water Reservoir in the Area of Almyros Brackish Spring in Iraklion, Greece. Master’s Thesis, School of Mining and Metallurgical Engineering, National Technical University of Athens, Athens, Greece, 2006; p. 148. [Google Scholar]
- Jaber, I.S.; Ahmed, M.R. Technical and economic evaluation of brackish groundwater desalination by reverse osmosis (RO) process. Desalination 2004, 165, 209–213. [Google Scholar] [CrossRef]
© 2014 by the authors; licensee MDPI, Basel, Switzerland. This article is an open access article distributed under the terms and conditions of the Creative Commons Attribution license (http://creativecommons.org/licenses/by/3.0/).