Optimal Reoperation of Multi-Reservoirs for Integrated Watershed Management with Multiple Benefits

Abstract
:1. Introduction
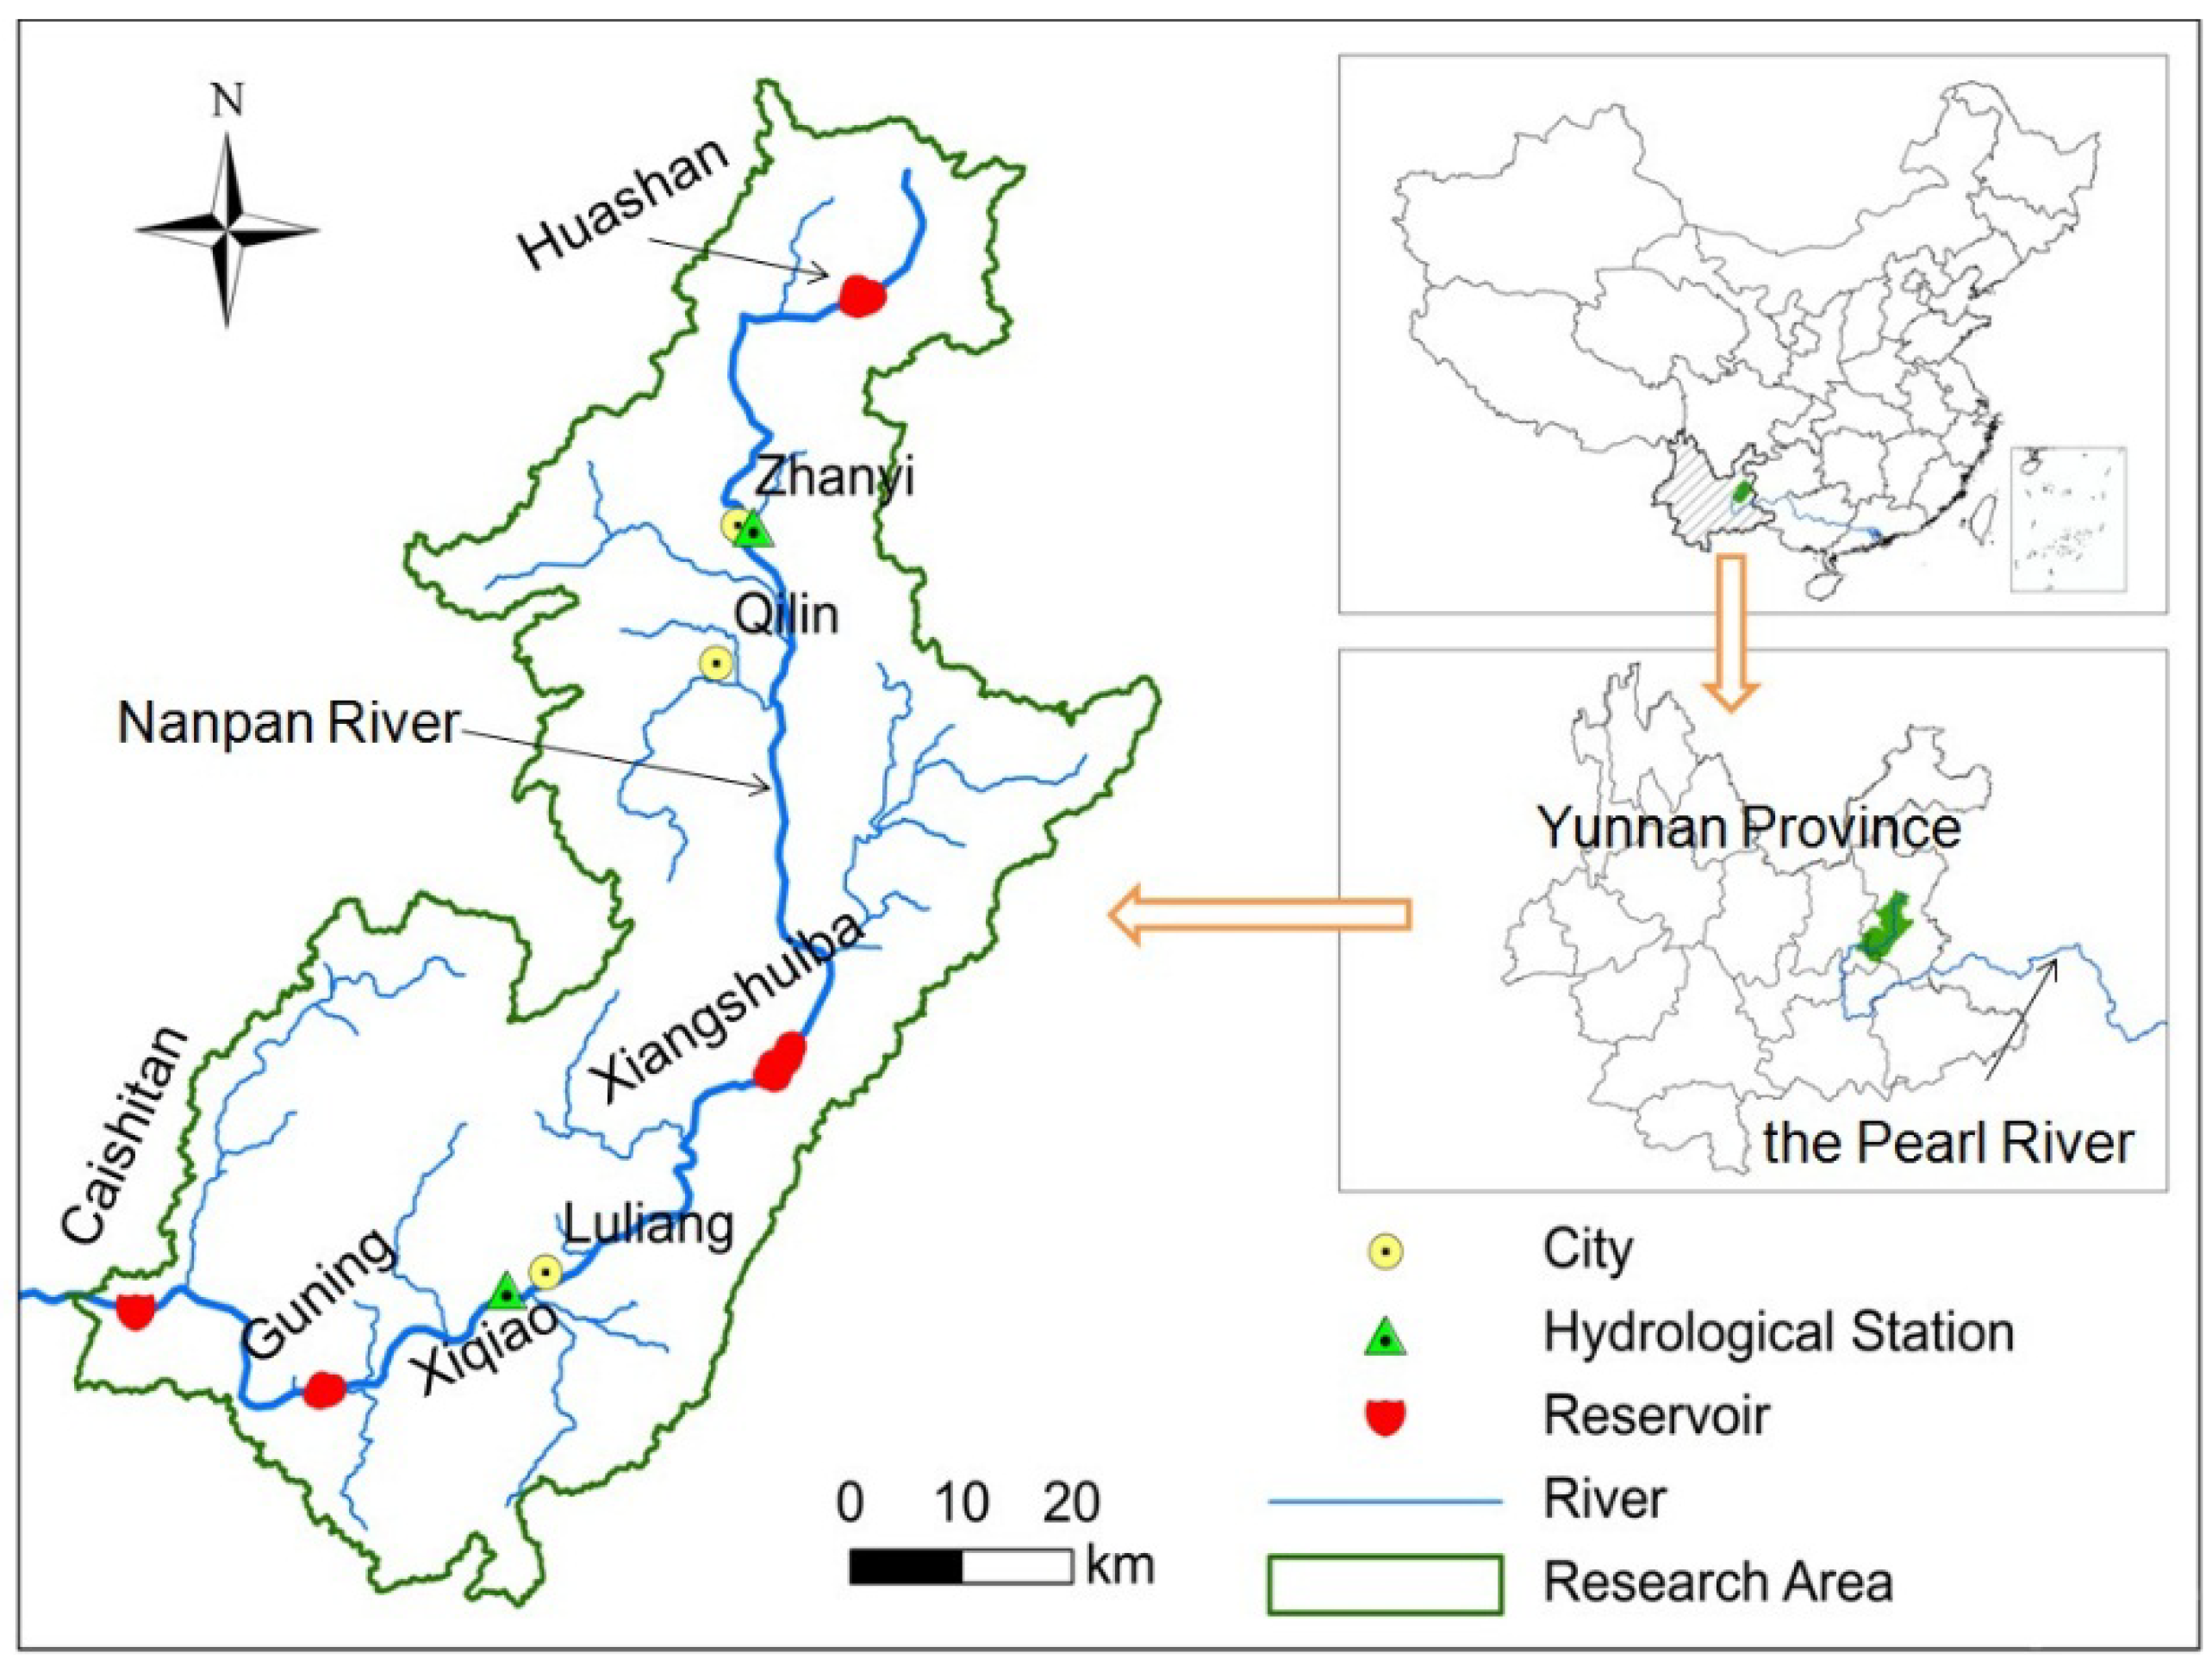
2. Study Area

3. Methods
3.1. Model Structure
3.2. Selection of Variables
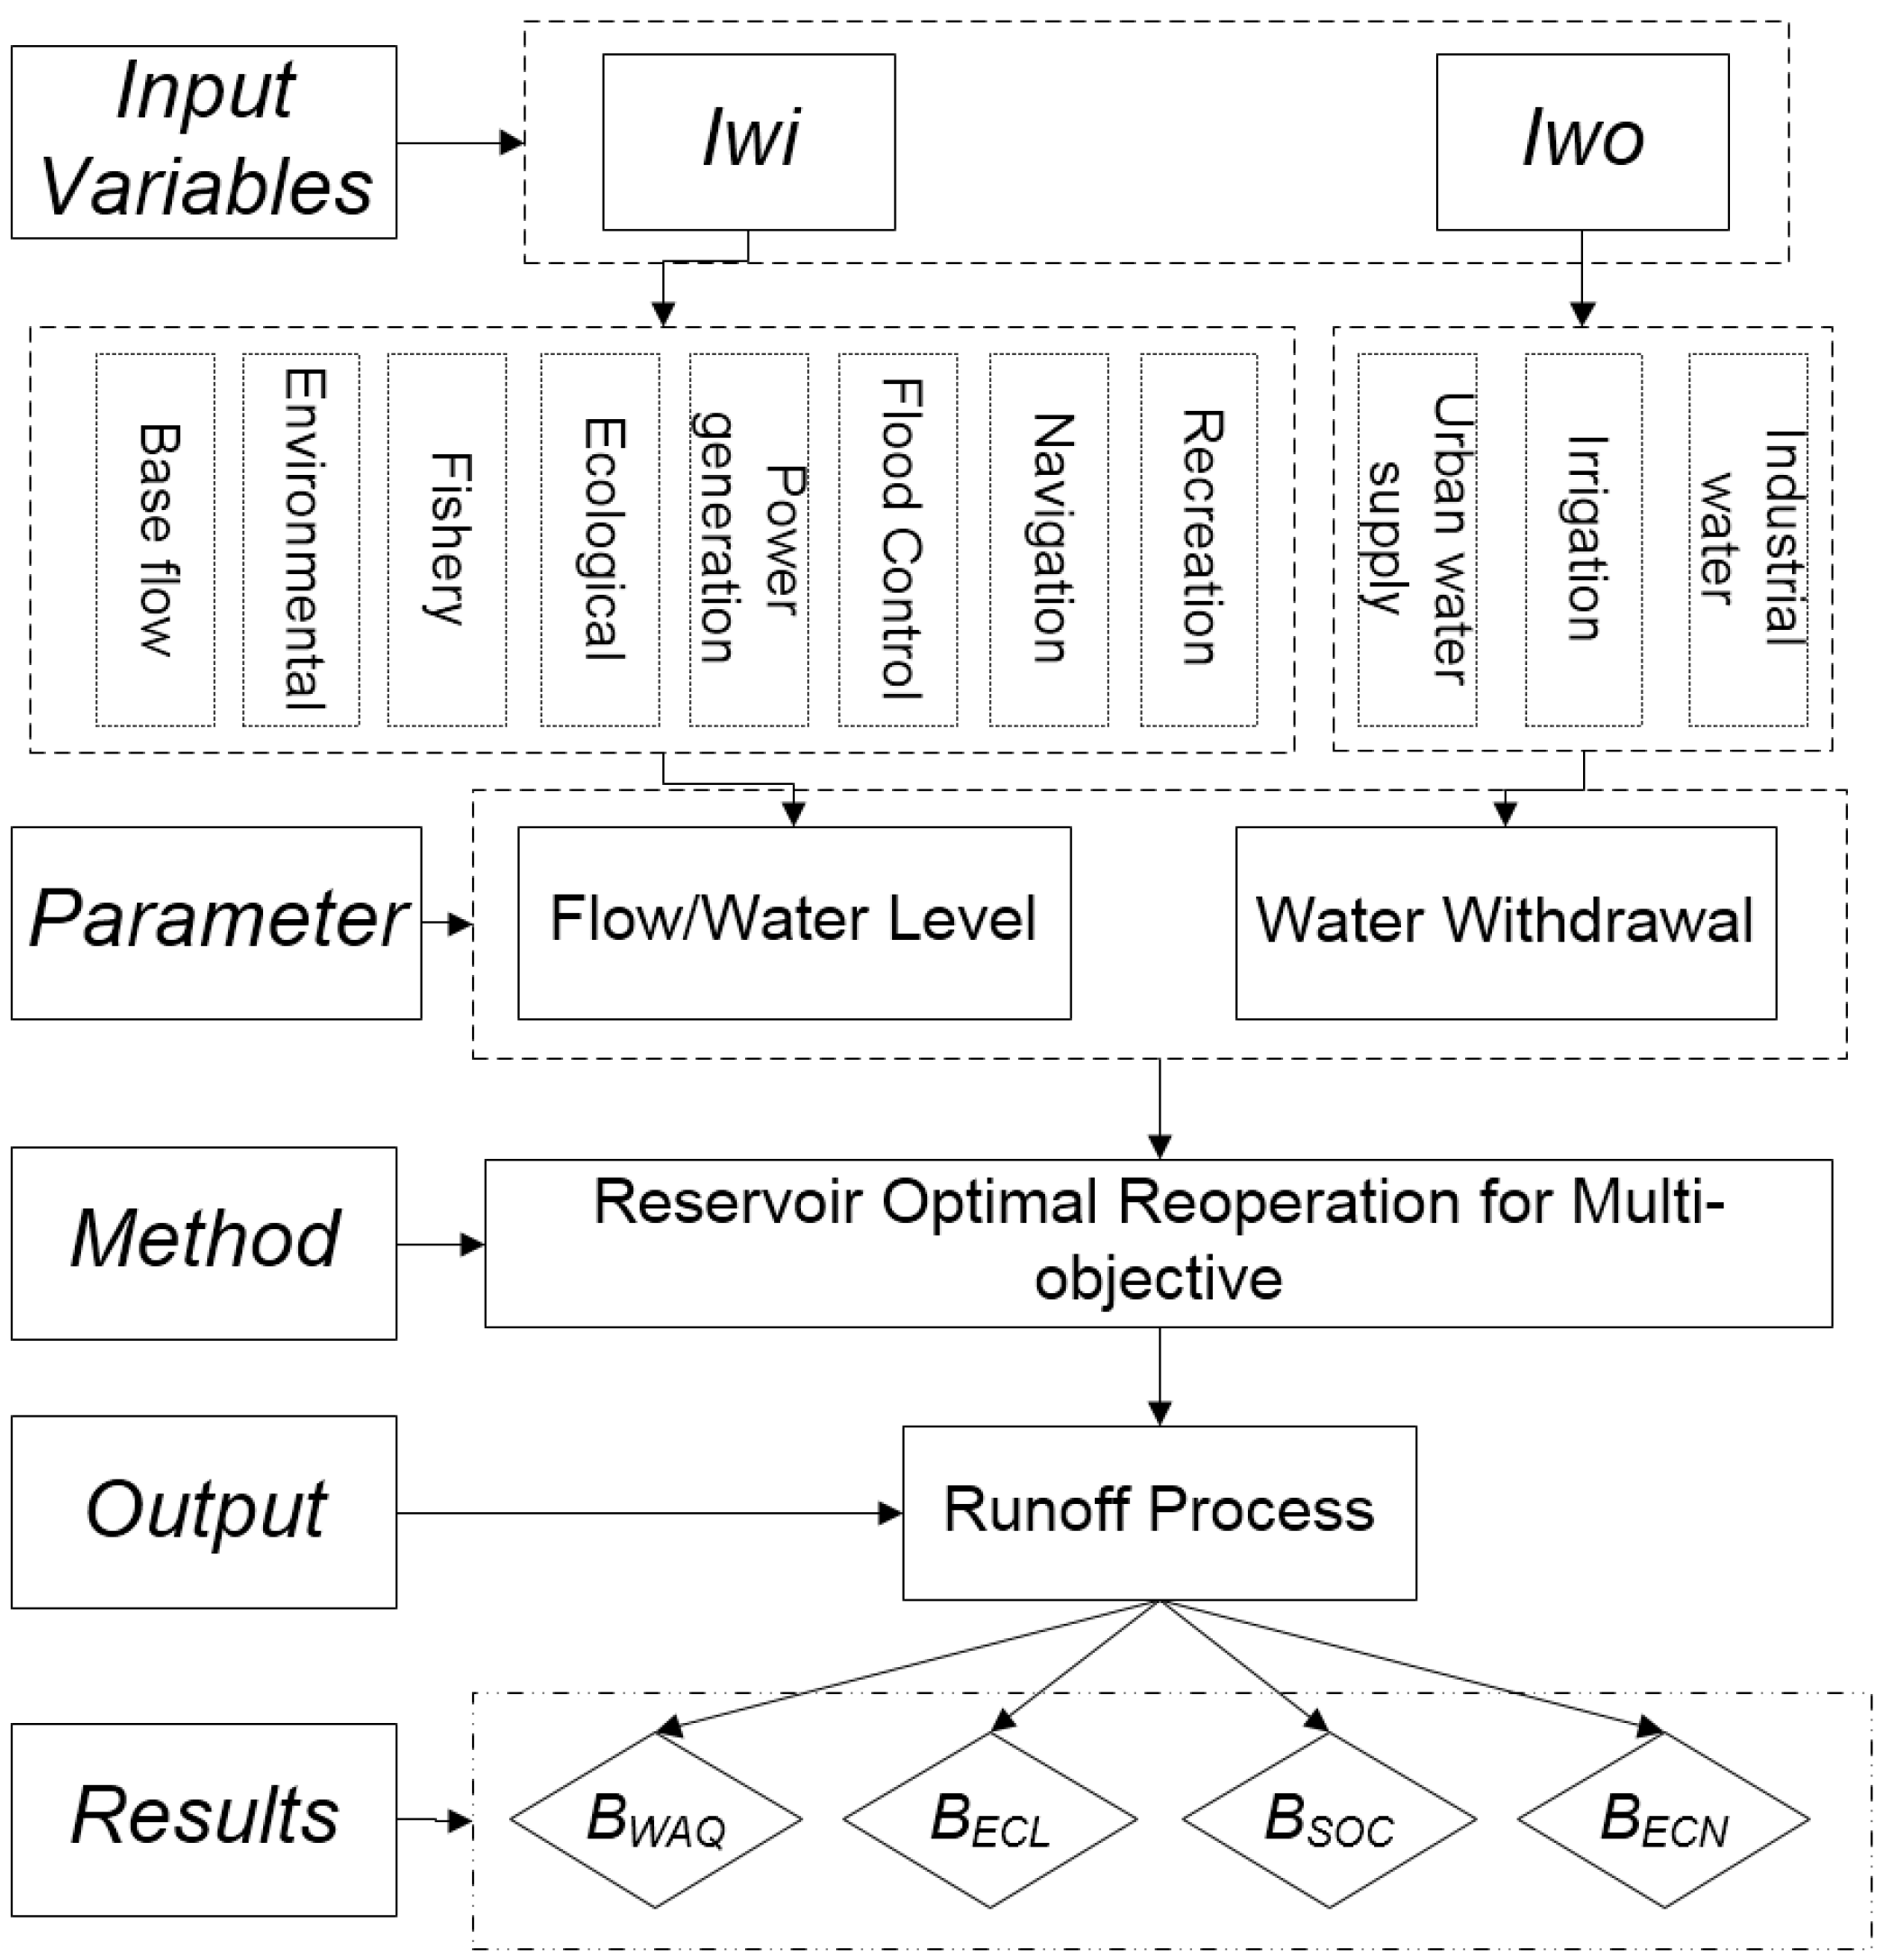
3.3. Objective
3.3.1. Water Quality Benefits

3.3.2. Ecological Benefits

3.3.3. Social Benefits

3.3.4. Economic Benefits
TRt = TR0, for t = 0;
TRt = (1 + g)TRt − 1, for t > 0
3.4. Constraint Conditions
3.5. Model Solution Methods
4. Results
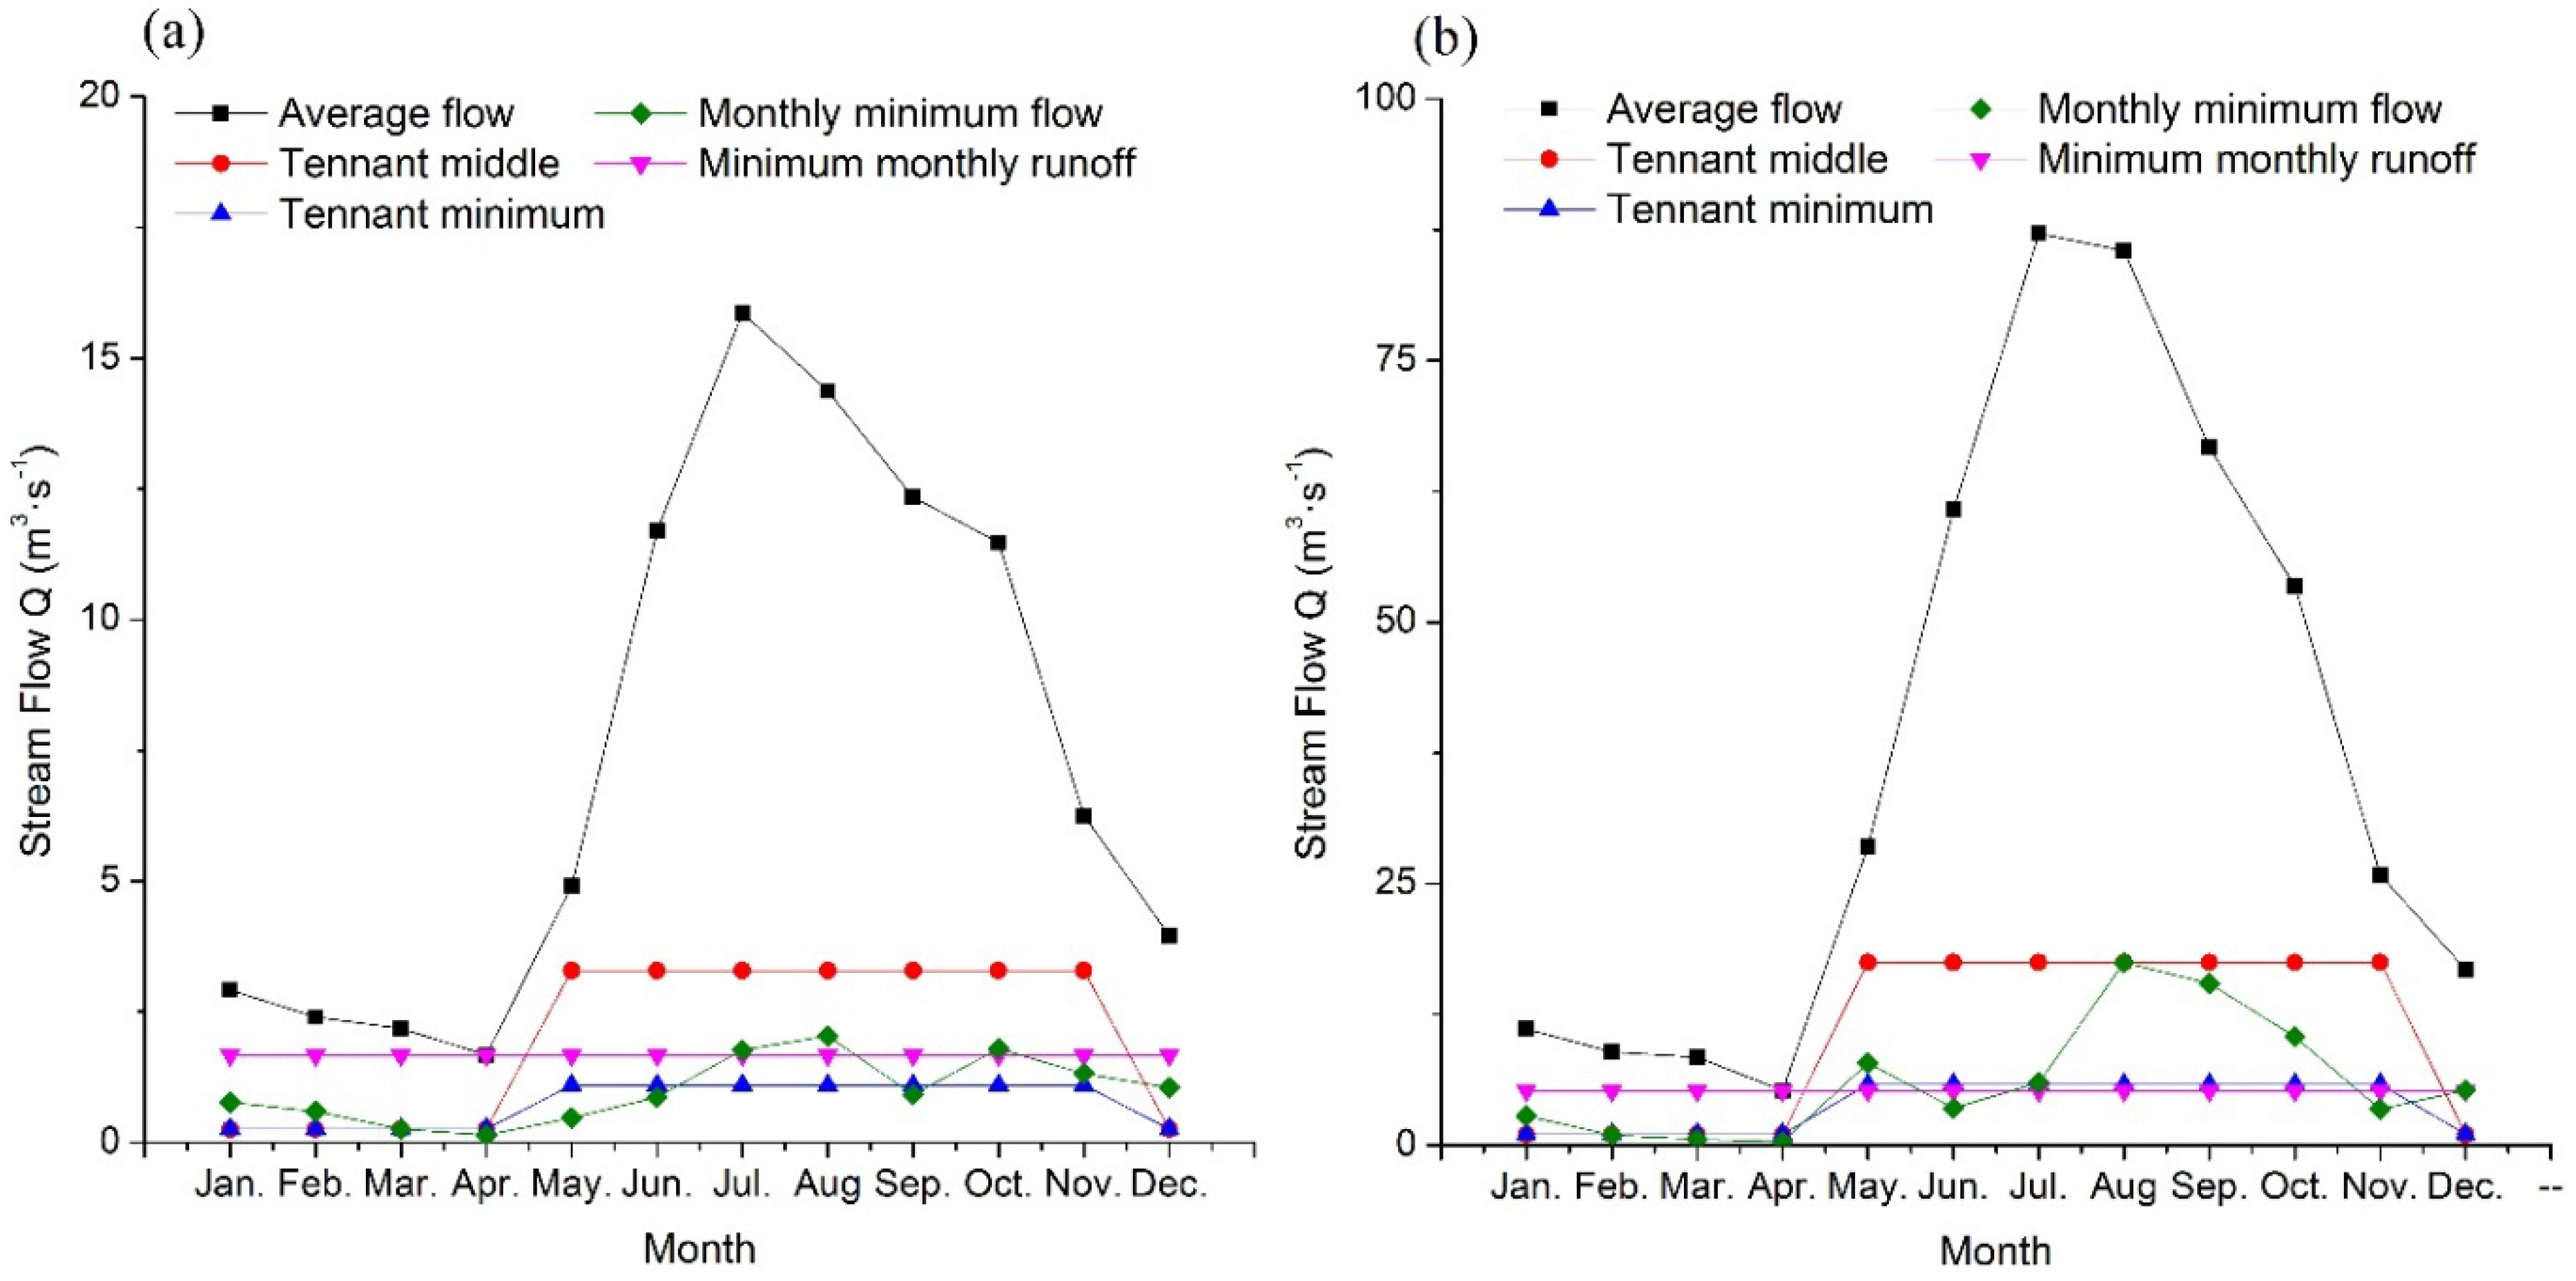
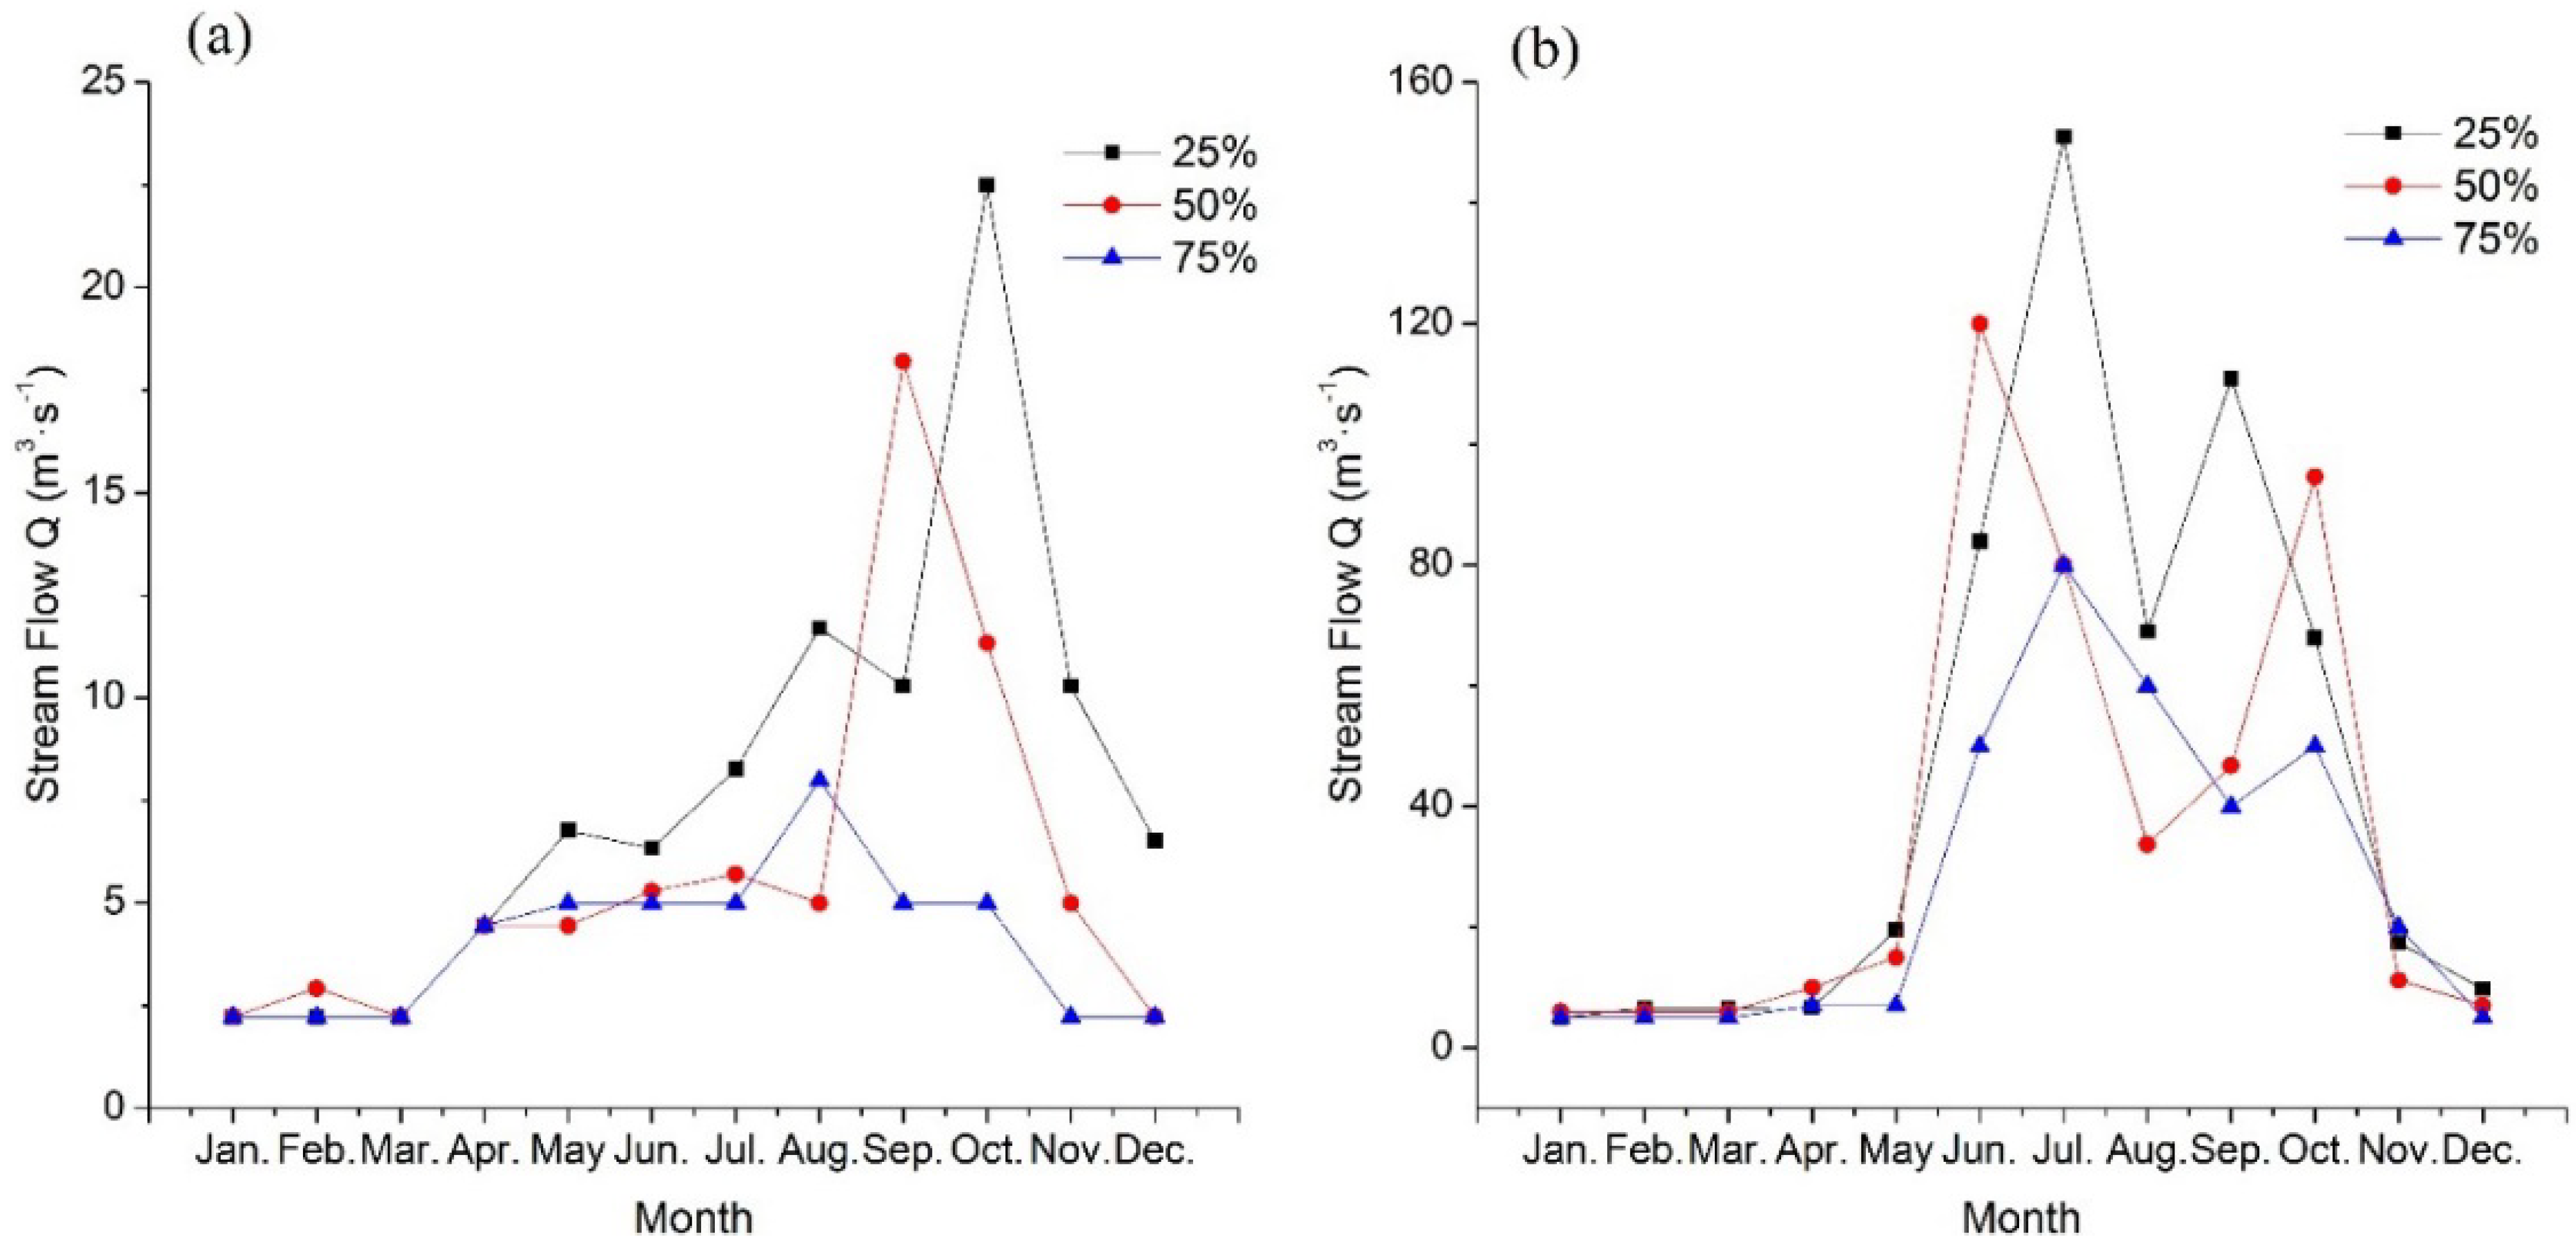
4.1. Runoff Distribution
4.2. Benefits Calculation
4.2.1. Water Quality Benefits

| Station | Freq. | Month | Jan. | Feb. | Mar. | Apr. | May | Jun. | Jul. | Aug | Sep. | Oct. | Nov. | Dec. | BEO | BER |
|---|---|---|---|---|---|---|---|---|---|---|---|---|---|---|---|---|
| Zhanyi | 25% | Cf | 57 | 51 | 41 | 22 | 14 | 75 | 37 | 30 | 20 | 20 | 21 | 26 | ||
| c | 1.08 | 1.14 | 1.24 | 1.41 | 1.49 | 0.97 | 1.35 | 1.42 | 1.52 | 1.52 | 1.44 | 1.39 | ||||
| BE | 1.29 | 1.36 | 1.48 | 2.27 | 2.39 | 1.56 | 2.17 | 2.28 | 2.44 | 2.44 | 1.71 | 1.65 | 23.05 | 20.04 | ||
| 50% | Cf | 57 | 39 | 41 | 22 | 22 | 90 | 53 | 70 | 20 | 27 | 44 | 77 | |||
| c | 1.08 | 1.26 | 1.24 | 1.41 | 1.41 | 0.82 | 1.19 | 1.02 | 1.52 | 1.45 | 1.21 | 0.88 | ||||
| BE | 1.29 | 1.5 | 1.48 | 2.27 | 2.27 | 1.32 | 1.91 | 1.64 | 2.44 | 2.33 | 1.45 | 1.04 | 20.93 | 17.64 | ||
| 75% | Cf | 57 | 51 | 41 | 22 | 19 | 95 | 61 | 44 | 32 | 62 | 98 | 77 | |||
| c | 1.08 | 1.14 | 1.24 | 1.41 | 1.44 | 0.77 | 1.11 | 1.28 | 1.4 | 1.1 | 0.67 | 0.88 | ||||
| BE | 1.29 | 1.36 | 1.48 | 2.27 | 2.31 | 1.23 | 1.79 | 2.06 | 2.26 | 1.77 | 0.8 | 1.04 | 19.66 | 14.29 | ||
| Xiqiao | 25% | Cf | 155 | 109 | 119 | 2 | 72 | 20 | 20 | 49 | 27 | 30 | 45 | 122 | ||
| c | 0.73 | 1.19 | 1.09 | 1.78 | 1.08 | 1.74 | 1.74 | 1.45 | 1.67 | 1.65 | 1.83 | 1.06 | ||||
| BE | 1.56 | 2.56 | 2.35 | 5.68 | 3.43 | 5.56 | 5.56 | 4.63 | 5.33 | 5.25 | 3.94 | 2.27 | 48.12 | 26.00 | ||
| 50% | Cf | 129 | 121 | 131 | 58 | 94 | 20 | 20 | 101 | 64 | 21 | 70 | 171 | |||
| c | 0.99 | 1.07 | 0.97 | 1.22 | 0.86 | 1.74 | 1.74 | 0.94 | 1.3 | 1.73 | 1.58 | 0.57 | ||||
| BE | 2.12 | 2.31 | 2.09 | 3.88 | 2.74 | 5.56 | 5.56 | 2.99 | 4.15 | 5.52 | 3.4 | 1.23 | 41.53 | 26.28 | ||
| 75% | Cf | 155 | 145 | 157 | 83 | 180 | 20 | 20 | 57 | 75 | 40 | 39 | 228 | |||
| c | 0.73 | 0.83 | 0.71 | 0.97 | 0 | 1.74 | 1.74 | 1.38 | 1.19 | 1.54 | 1.89 | 0 | ||||
| BE | 1.56 | 1.79 | 1.52 | 3.08 | 0 | 5.56 | 5.56 | 4.39 | 3.8 | 4.91 | 4.06 | 0 | 36.24 | 25.94 |
4.2.2. Irrigation Benefits
| Freq. | Kc | Irrigation Area (ha) | Rice Price(Yuan/kg) | Average Product (kg/ha) | BI (million RMB) |
|---|---|---|---|---|---|
| 25% | 0.5 | 13,400 | 2.5 | 9,000 | 150.75 |
| 50% | 0.45 | 13,400 | 2.5 | 9,000 | 135.68 |
| 75% | 0.4 | 13,400 | 2.5 | 9,000 | 120.60 |
4.2.3. Power Generation Benefits
| Freq. | Guning Reservoir | Caishitan Reservoir | BPO | BPR | ||||||
|---|---|---|---|---|---|---|---|---|---|---|
| Water used | Energy output | Unit price | BP | Water used | Energy output | Unit price | BP | |||
| 25% | 12.39 | 217.19 | 0.25 | 54.30 | 14.12 | 247.59 | 0.25 | 61.90 | 116.19 | 105.17 |
| 50% | 9.17 | 152.35 | 0.25 | 38.09 | 8.65 | 151.73 | 0.25 | 37.93 | 76.02 | 72.30 |
| 75% | 6.14 | 89.70 | 0.25 | 22.42 | 6.03 | 105.75 | 0.25 | 26.44 | 48.86 | 46.98 |
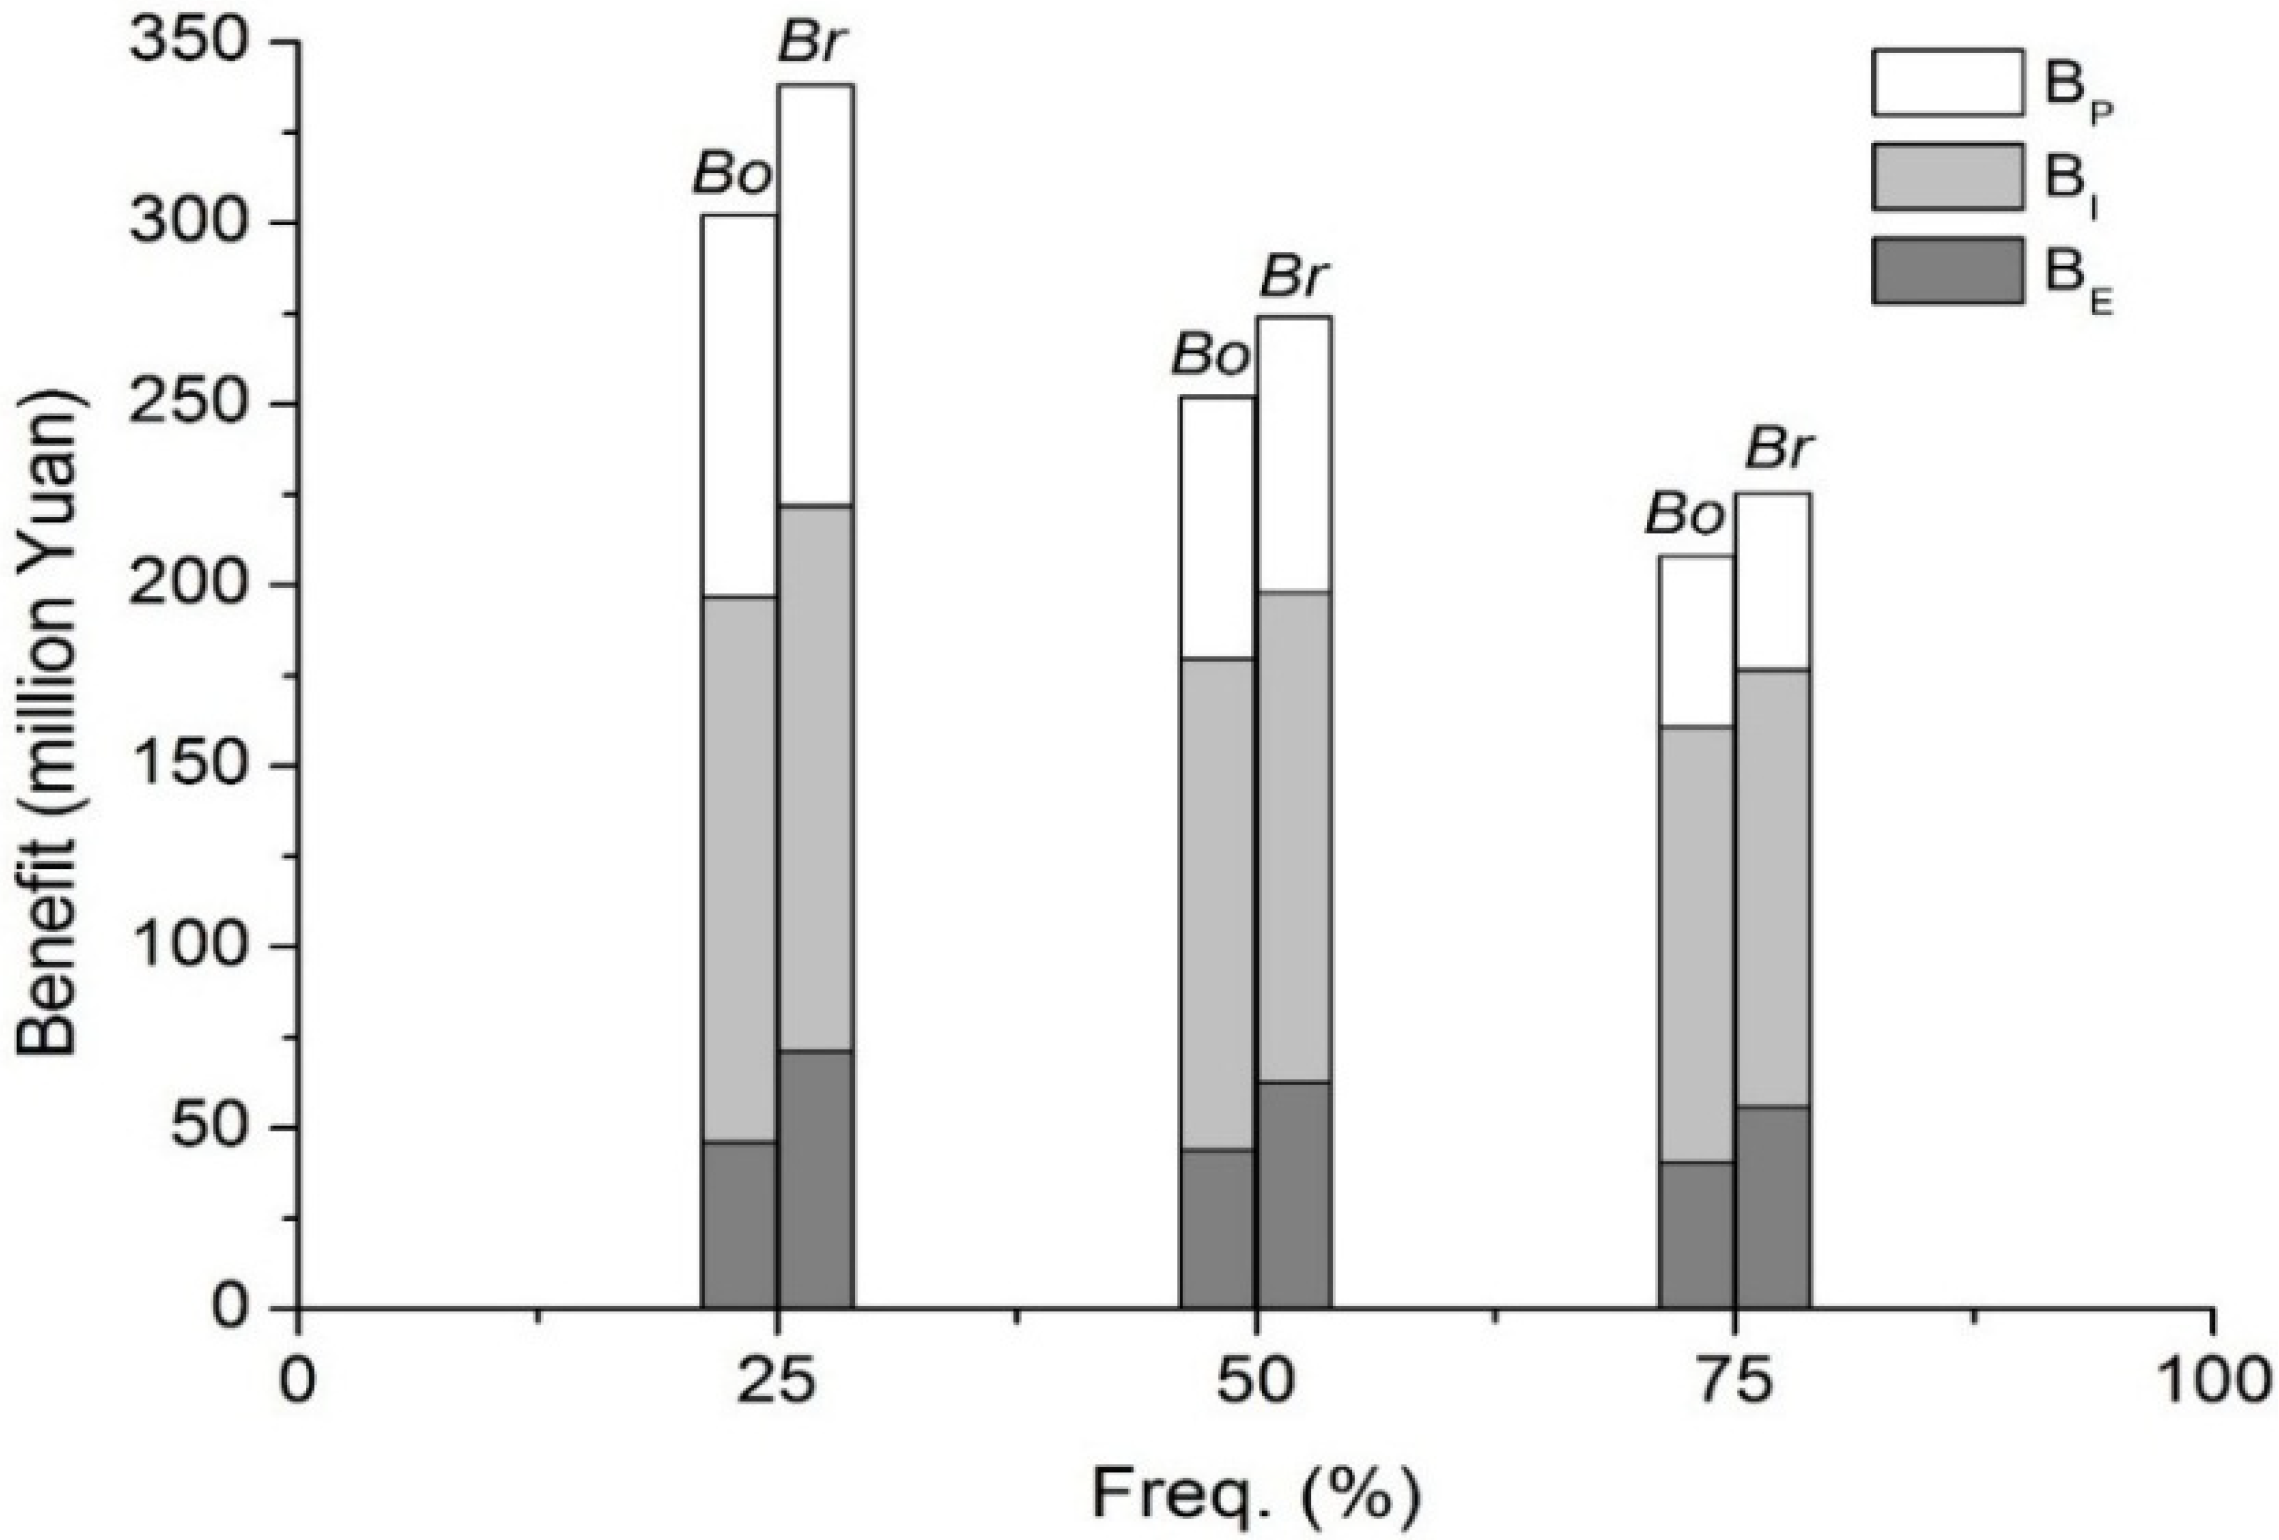
4.2.4. Benefits from Reservoir Optimal Reoperation and Routine Operation

5. Conclusions
Acknowledgments
Author Contributions
Conflicts of Interest
References
- Petts, G.E. Impounded Rivers: Perspectives for Ecological Management; Wiley: New York, NY, USA, 1984. [Google Scholar]
- Bergkamp, G.; McCartney, M.; Dugan, P.; McNeely, J.; Acreman, M. Dams, Ecosystem Functions and Environmental Restoration. Available online: http://acad.carleton.edu/curricular/BIOL/classes/bio252/DamsReport.pdf (accessed on 24 March 2014).
- Muñoz, J.G.; Montalban, F.; Gras, J.; Rubi, P.G.; Matador, F. Environmental integrated rules in dams with water quality problems: The Santomera Dam, an example on how to integrate water quality and water quantity needs. In Dams and Reservoirs, Societies and Environment in the 21st Century; Taylor & Francis Group: London, UK, 2006; pp. 237–244. [Google Scholar]
- Valero, E. Characterization of the water quality status on a stretch of River Lérez around a small hydroelectric power station. Water 2012, 4, 815–834. [Google Scholar] [CrossRef]
- Bartholow, J.M.; Campbell, S.G.; Flug, M. Predicting the thermal effects of dam removal on the Klamath River. Environ. Manag. 2004, 34, 856–874. [Google Scholar] [CrossRef]
- Campbell, S.G.; Hanna, R.B.; Flug, M.; Scott, J. Modeling Klamath River system operations for quantity and quality. J.Water Resour. Plan. Manag. 2001, 127, 284–294. [Google Scholar] [CrossRef]
- Suo, L.S. River management and ecosystem conservation in China. In Proceedings of the Ninth International Symposium on River Sedimentation, Yichang, China, 18–21 October 2004; Volume 1, pp. 3–9.
- Richter, B.D.; Thomas, G.A. Restoring environmental flows by modifying dam operations. Ecol. Soc. 2007, 12, 12. [Google Scholar]
- Suen, J.P.; Eheart, J.W. Reservoir management to balance ecosystem and human needs: Incorporating the paradigm of the ecological flow regime. Water Resour. Res. 2006, 42, W3417. [Google Scholar]
- Harman, C.; Stewardson, M. Optimizing dam release rules to meet environmental flow targets. River Res. Appl. 2005, 21, 113–129. [Google Scholar] [CrossRef]
- Yang, Y.; Cai, X.M. Reservoir reoperation for fish ecosystem restoration using daily inflows-case study of Lake Shelbyville. J. Water Resour. Plan Manag. ASCE 2011, 137, 470–480. [Google Scholar] [CrossRef]
- Nanninga, T.A.; Bisschops, L.; López, E.; Martínez-Ruiz, J.L.; Murillo, D.; Essl, L.; Starkl, M. Discussion on sustainable water technologies for peri-urban areas of Mexico City: Balancing urbanization and environmental conservation. Water 2012, 4, 739–758. [Google Scholar] [CrossRef]
- Zhang, Y.; Xia, J.; Liang, T.; Shao, Q. Impact of water projects on river flow regimes and water quality in Huai River basin. Water Resour. Manag. 2010, 24, 889–908. [Google Scholar] [CrossRef]
- Bai, X.; Shi, P. Pollution control: In China’s Huai River basin: What lessons for sustainability? Environment 2006, 48, 22–38. [Google Scholar]
- Saadatpour, M.; Afshar, A. Multi objective simulation-optimization approach in pollution spill response management model in reservoirs. Water Res. Manag. 2013, 27, 1851–1865. [Google Scholar] [CrossRef]
- Jager, H.I.; Smith, B.T. Sustainable reservoir operation: Can we generate hydropower and preserve ecosystem values? River Res. Appl. 2008, 24, 340–352. [Google Scholar] [CrossRef]
- Olivares, M.A. Optimal Hydropower Reservoir Operation with Environmental Requirements. Ph.D. Thesis, University of California, Oakland, CA, USA, September 2008. [Google Scholar]
- Afshar, A.; Shojaei, N.; Sagharjooghifarahani, M. Multiobjective calibration of reservoir water quality modeling using Multiobjective Particle Swarm Optimization (MOPSO). Water Resour. Manag. 2013, 27, 1931–1947. [Google Scholar] [CrossRef]
- Hou, Y.; Zhang, T. Evaluation of major polluting accidents in China—Results and perspectives. J. Hazard Mater. 2009, 168, 670–673. [Google Scholar] [CrossRef]
- Zhang, Z.; Huang, Q.; Wang, Y.; Qi, Q.; Li, Y. The compensation benefit computation of water environment of the Yellow River by regulation of Longyangxia and Liujiaxia reservoirs. J. Hydroelectr. Eng. 2008, 6, 48–52. [Google Scholar]
- Zheng, Z.H.; Zhang, Z.Z.; Xue, X.J. Basic ecological flow compensation benefit of Longyangxia andLiujiaxia cascade reservoirs for Yellow River. J. Hydroelectr. Eng. 2009, 28, 13–17. [Google Scholar]
- Tennant, D.L. Instream flow regimens for fish, wildlife, recreation and related environmental resources. Fisheries 1976, 1, 6–10. [Google Scholar] [CrossRef]
- Trice, A.H.; Wood, S.E. Measurement of recreation benefits. Land Econ. 1958, 34, 195–207. [Google Scholar] [CrossRef]
- Duffield, J.W.; Neher, C.J.; Brown, T.C. Recreation benefits of instream flow: Application to Montana’s Big Hole and Bitterroot Rivers. Water Resour. Res. 1992, 28, 2169–2181. [Google Scholar] [CrossRef]
- Hosoda, T. Evaluation of people’s awareness and consensus level to river improvement projects with flood control and dam construction for a few river basins. J. Disaster Res. 2013, 8, 161–162. [Google Scholar]
- Kwak, S.; Yoo, S.; Kim, C. Measuring the willingness to pay for tap water quality improvements: Results of a contingent valuation survey in Pusan. Water 2013, 5, 1638–1652. [Google Scholar] [CrossRef]
- Lehtoranta, V.; Sepp, L.E.; Kosenius, A. Willingness to pay for water level regulation in Lake Pielinen, Finland. J. Environ. Econ. Policy 2013, 2, 148–163. [Google Scholar] [CrossRef]
- Moghaddasi, M.; Araghinejad, S.; Morid, S. Water management of irrigation dams considering climate variation: Case study of Zayandeh-rud Reservoir, Iran. Water Resour. Manag. 2013, 27, 1651–1660. [Google Scholar] [CrossRef]
- Morimoto, R.; Hope, C.A. CBA model of a hydro project in Sri Lanka. Int. J. Glob. Energy Issues 2004, 21, 47–68. [Google Scholar]
- Jowett, I.G. Instream flow methods: A comparison of approaches. Regul. Rivers 1997, 13, 115–127. [Google Scholar] [CrossRef]
- Hakimi-Asiabar, M.; Ghodsypour, S.H.; Kerachian, R. Deriving operating policies for multi-objective reservoir systems: Application of self-learning genetic algorithm. Appl. Soft Comput. 2010, 10, 1151–1163. [Google Scholar] [CrossRef]
- Ai, X.S.; Ran, B.Y. FS-DDDP method and its application to optimal operation of groups of reservoirs. Hydropower Autom. Dam Monit. 2007, 1, 13–16. [Google Scholar]
© 2014 by the authors; licensee MDPI, Basel, Switzerland. This article is an open access article distributed under the terms and conditions of the Creative Commons Attribution license (http://creativecommons.org/licenses/by/3.0/).
Share and Cite
Xu, X.; Bin, L.; Pan, C.; Ding, A.; Chen, D. Optimal Reoperation of Multi-Reservoirs for Integrated Watershed Management with Multiple Benefits. Water 2014, 6, 796-812. https://doi.org/10.3390/w6040796
Xu X, Bin L, Pan C, Ding A, Chen D. Optimal Reoperation of Multi-Reservoirs for Integrated Watershed Management with Multiple Benefits. Water. 2014; 6(4):796-812. https://doi.org/10.3390/w6040796
Chicago/Turabian StyleXu, Xinyi, Lingling Bin, Chengzhong Pan, Aizhong Ding, and Desheng Chen. 2014. "Optimal Reoperation of Multi-Reservoirs for Integrated Watershed Management with Multiple Benefits" Water 6, no. 4: 796-812. https://doi.org/10.3390/w6040796