1. Introduction
The concept of rainwater harvesting consists of the process of collecting, storing and utilizing rainwater as a major or supplementary water resource. Rainwater harvesting systems have a long history. Examples are given of systems dating back to 2000BC in Rome, the Middle East, Africa, India and China. In fact examples of rainwater harvesting can be found for most areas in the world [
1].
Rainwater harvesting systems can be used for the following purposes:
As the main source of potable water;
A supplementary source of potable water;
A supplementary source of non-potable water.
The use of rainwater harvesting systems in both rural and urban areas of developing countries has been thoroughly documented [
2,
3,
4,
5,
6]. Rainwater harvesting systems are mainly used for non-potable water supplies, and recently, they have become a crucial alternative water resource for urban and suburban areas in developed countries affected by water shortage [
7,
8,
9]. Rainwater harvesting systems can be easily implemented at the household, commercial, and community levels [
9,
10,
11,
12,
13].
The basic problem in a rainwater harvesting system is to analyze both inflow and outflow data to satisfy a certain level of system reliability. The sizing of storage capacity was reviewed by McMahon and Mein [
14], who identified two broad categories of sizing model: the Moran and critical methods. Moran derived an integral equation relating the inflow to the storage capacity and release by considering time and water volume as discrete variables. The Moran method was subsequently modified to obtain a general method of direct practical, called the Gould matrix technique. Tsai [
15] used this technique to assess the probability of failure for a range of roof areas, tank sizes, and water demand for the Keelung area in Taiwan. Critical period methods use sequences of flows under conditions where demand exceeds supply to determine the storage capacity. The best known and earliest example of this approach to storage sizing is the mass curve method [
16]. The storage change in a tank is calculated using a mass balance equation. Some researchers have applied behavioral models to the task of sizing rainwater storage; for example, Chu
et al. [
17] and Walther and Thanasekaren [
18] identified two fundamental algorithms to describe the operation of rainwater storage: yield after spillage (YAS) and yield before spillage (YBS). Latham and Schiller [
19] defined the storage operating algorithm in a more general form. In addition to the mass curve method and behavioral models, a range of other critical period methods have been developed, such as the semi-infinite reservoir method, the Hurst method, sequent peak algorithm method, and the Alexander method [
20]. However, these methods have not been widely used for sizing rainwater storage.
The mass curve method that can be used for rapid assessment is designated a preliminary design method. The main limitation of this method is that system reliability cannot be assessed. To overcome this limitation, this method has been combined with statistical methods. A statistical approach is sometimes adopted to determine the relationship of the storage capacity with rainfall and with rainwater demand [
21,
22,
23,
24,
25]. Youn
et al. [
26] proposed a methodology to establish a probabilistic relation between storage capacity and deficit rate, involving fitted probability distributions and under the impact of climate change. Many researchers have used simulation and economic optimization [
27,
28,
29] to investigate the performance of DRWHSs. Roebuck
et al. [
30] recommended that simplified approaches should not be relied upon and preference should be given to the use of detailed simulations that explicitly account for serial correlation and seasonal variations and are applicable to any time interval. Imteaz
et al. [
31,
32,
33] showed that the variability of rainfall, especially in regions where this variability was high between dry, average, and wet years, could have a significant impact on the reliabilities of the rainwater harvesting system. In these situations the authors had concluded that the longer term mean of the annual rainfall may not be useful. In general, DRWHS design cannot be standardized, and the amount of rainwater supplied depends on the local conditions [
34]. In the design of a rainwater harvesting, system to meet projected water demands, the use of long term data is preferred for several reasons. First, in most cases, the long term efficiency and long term utility are one of the primary goals in designing a rainwater harvesting system. To place too much focus on any specific period of time may depart from this goal. In addition, the fact that as low rainfall tends to occur consecutively (known as persistence), and therefore would require a larger tank design is not overlooked in the design of a rainwater harvesting system.
The aforementioned DRWHS design methods are concerned with rainfall data from a single station. Data from a single location is a random sample from an unknown population [
35]. To design a DRWHS, detailed rainfall information is required. However, such information is available only at a few locations, and in the majority of catchments, particularly those at remote locations, the data are normally extremely scant. For areas with incomplete or no rainfall data, storage sizing is difficult for DRWHS design.
Considering the variability inherent in a random sample of rainfall data and incomplete rainfall data, it is desirable to conduct DRWHS design studies on a regional basis. In a specific region, empirical equations or dimensionless graphs that relate the input variable (roof area and storage capacity) to the output variables (rainwater supply and water supply reliability) are required. Fewker
et al. [
36,
37] had proposed and defined the storage fraction and demand fraction to examine the water saving efficiency and evaluate the accuracy of a monthly time interval model using generic values of the parameter theta. Huang [
38] used a nonhierarchical cluster method to classify Northern Taiwan into four zones and developed regional dimensionless curves for estimating the required storage capacity. Cheng and Liao [
39] and Liaw and Chiang [
40] investigated the use of regional zoning for DRWHS design in Northern Taiwan by using a two-step cluster analysis. Hanson
et al. [
41] developed a log-linear regressive model to calculate the storage capacity of a DRWHS in the United States; however, the model requires statistics of climatic variables. Campisano and Modica [
42,
43] constructed regional regression models relating the system performance (annual water saving and annual overflow discharge) to the dimensionless demand fraction and modified storage fraction by considering average daily values of water demand and rainfall in Italy.
In a regional analysis, attempts are made to define a region that is hydrologically homogenous in terms of the characteristic being studied. Subsequently, rainfall data from several locations are combined to perform a single regional analysis. The first step in a regional study is to define the region itself, for which several methods have been used. Some methods are based on the location of watershed division, political boundaries, land resource regions, and physiographic regions. Regional boundaries are also defined in terms of similarity of design graphs. One commonly used regional analysis method postulates that a particular function is applicable. The parameters of this function are then related to the input and output variables within a region.
3. Methodology
The concept of DRWHS is typically based on the collection of rainwater from a building’s roof and its storage. The storage container, which is sometimes called a cistern, is the primary component of the system and is typically the most expensive. Before launching a rainwater harvesting project, the following points must be considered:
How much rainfall is available?
What is the required effective roof area?
What are the anticipated uses of harvested water and what is the water demand?
How reliable should the system be?
What is the storage capacity required?
The development of the DRWHS is a production process [
44]. Production theory is intended to explain the process and how inputs are combined to produce a specific output. Economists have traditionally expressed the capability of a production process to produce an output vector from an input vector, by using the following production function:
where
X is total input vector and
Z is the total output vector.
The effective roof area and storage capacity are two key inputs to the DRWHS, whose output is the amount of rainwater supply. If the storage capacity (
S) is chosen as the input and rainwater supply (
Y) as the output and if other variables are kept constant, the production curve between
Y and
S is characterized by the ratio of a unit increase in
Y to a unit increase in
S decreasing with an increase in
S (
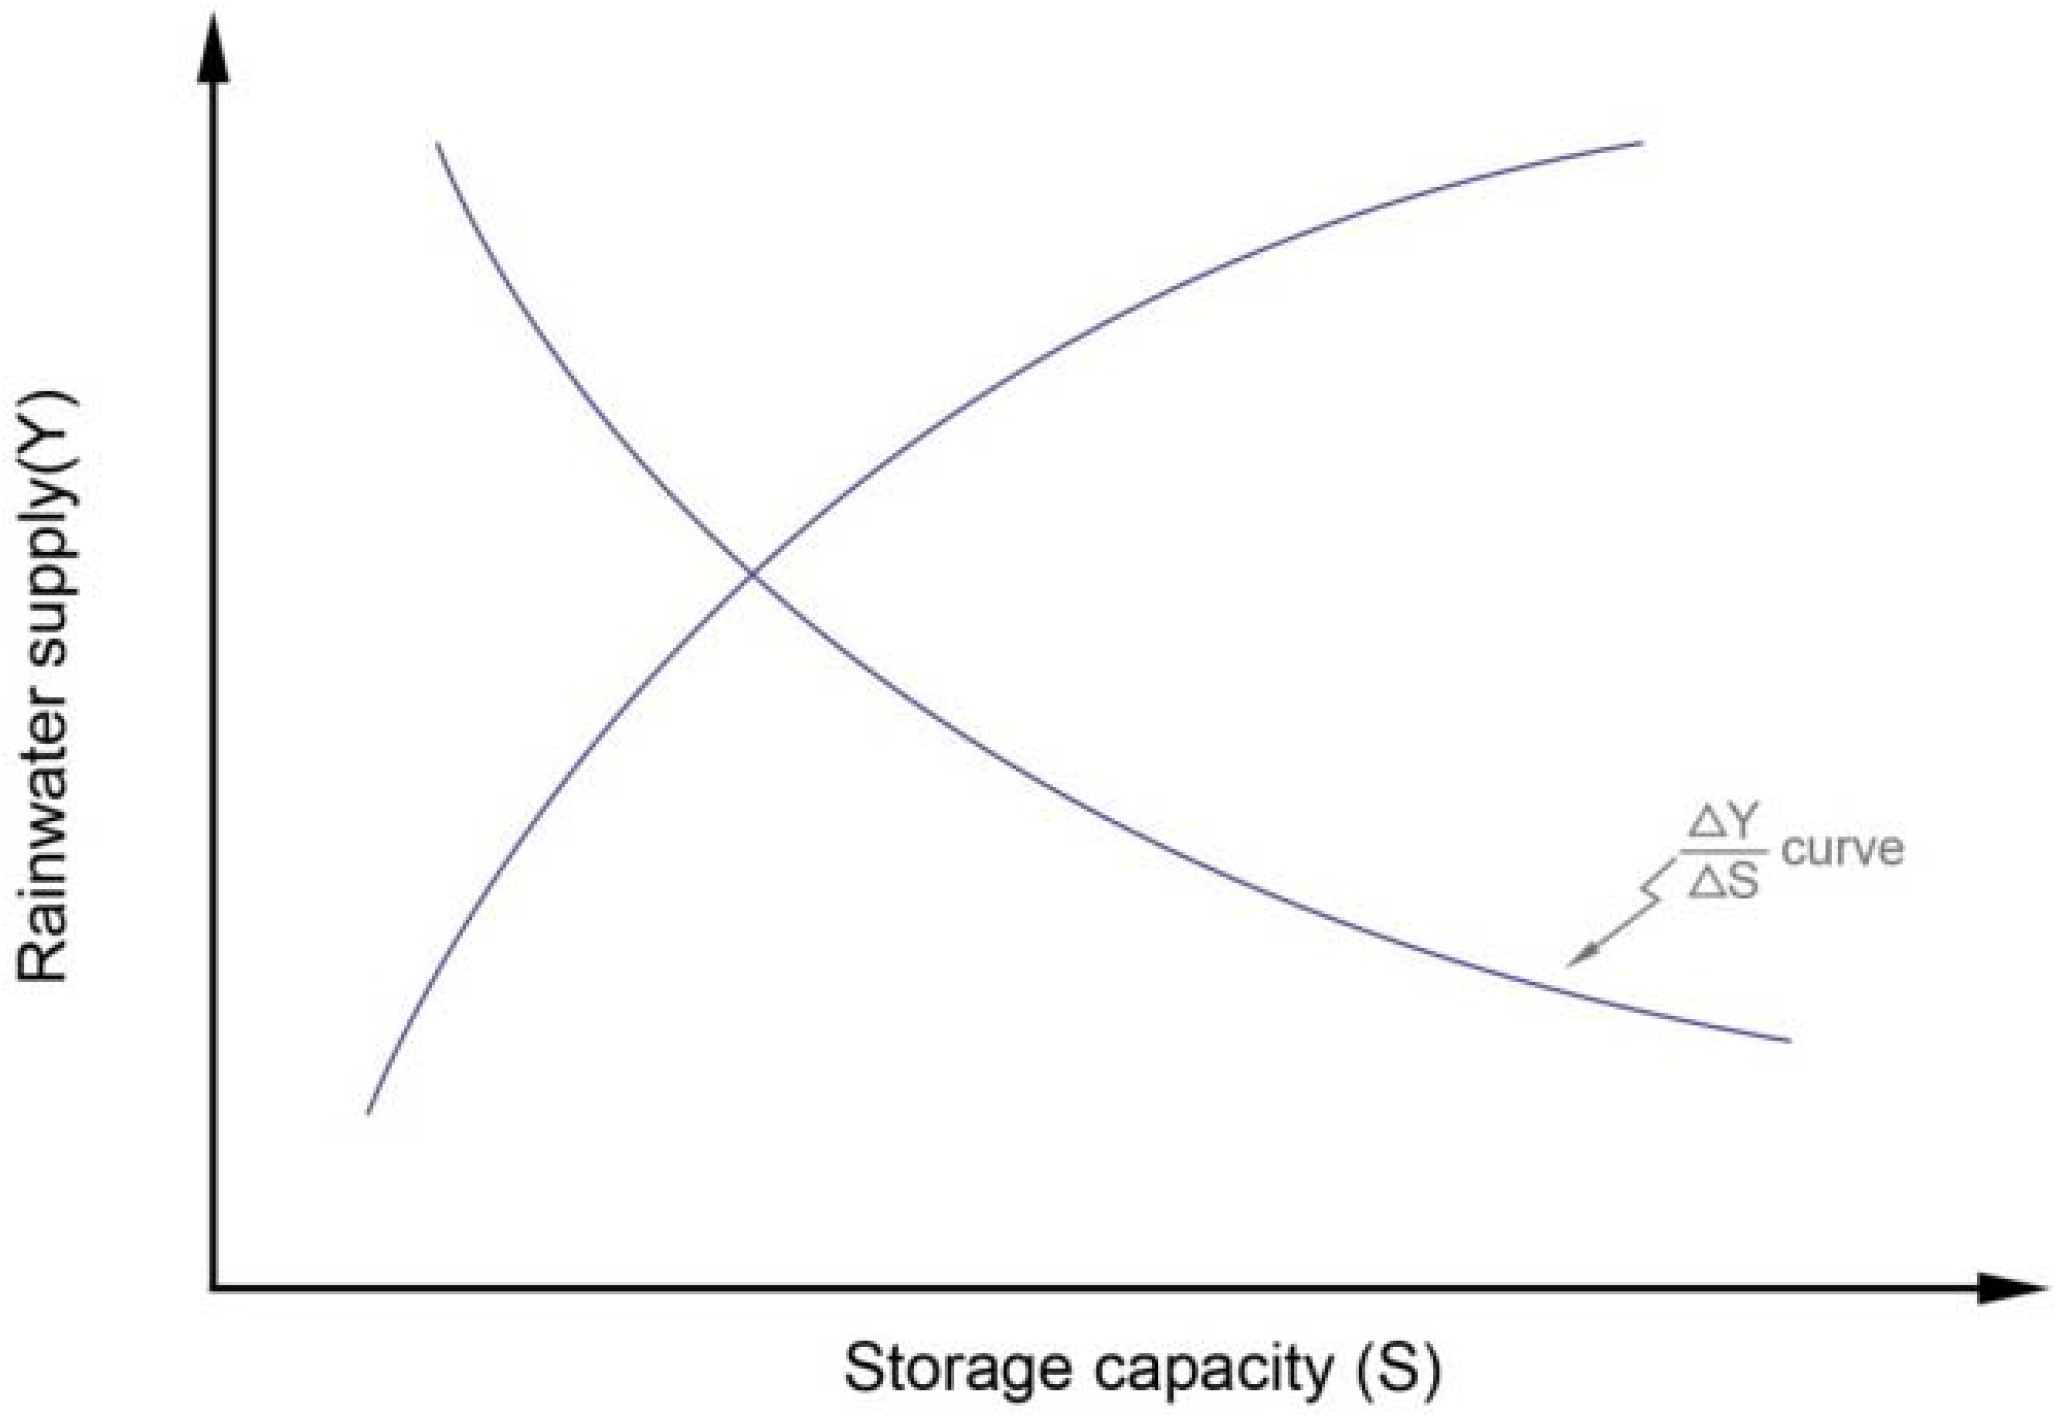
i.e., the principle of a diminishing rate of return). Hence, the relationship between
Y and
S can be illustrated as shown in
Figure 1 and can be written as:
where
b and
c are regression coefficients.
For areas without rainfall data or with incomplete rainfall data, the construction of a figure between S and Y is impossible.
Figure 1.
General relationship between storage capacity (S) and rainwater supply (Y).
Figure 1.
General relationship between storage capacity (S) and rainwater supply (Y).
The rainwater supply derived from such a DRWHS was evaluated through water balance simulations, using a behavioral model based on the well-known YAS algorithm release rule [
28]:
where
is the water demand at time
is storage at the beginning of the (
t − 1)th time period;
St is storage at the beginning of the
tth time period;
Qt is inflow during the
tth time period;
is the rainwater supply during the
tth time period; and
is the maximum storage capacity.
The DRWHS performance is generally described in terms of reliability. It can be expressed as either the total actual rainwater supply over water demand (volumetric reliability,
Rv) or the fraction of time during which the demand is fully met (
Re = 1 −
n/
N). The term
Rv can be mathematically expressed as:
where
n is the number of time units at which water demand exceeds storage and
N is the total number of time units in the rainfall sequence.
For small storage capacity and high water demand,
Re cannot be used to determine the reliability of the water supply. In the contrary,
Rv is available under all circumstances [
28], and therefore,
Rv is used hereafter.
Several variables contribute to the rainwater supply performance of the DRWHS. In addition to the storage capacity, the water demand, effective roof area, and rainfall amount at the site are crucial to evaluate the rainwater supply. Normally, the average annual values of the water demand and rainfall are considered. The annual rainwater supply can be calculated from the annual water demand and volumetric reliability. To consider various combinations of water demand, storage capacity, effective roof area, and rainfall, two dimensionless ratios proposed by Fewker
et al. [
36,
37] have traditionally been considered, namely, demand fraction and storage fraction; these ratios are defined as:
where
is the demand fraction;
is the storage fraction;
is the effective roof area in square meters;
is the annual water demand in terms of volume (in cubic meters);
is the annual water demand in terms of depth (in meters);
is the average annual rainfall (in meters);
is the storage capacity in terms of volume (in cubic meters); and
is the storage capacity in terms of depth (meters).
A regional regression analysis was conducted to relate the DRWHS performance to the adopted dimensionless parameters. The parameter
d was substituted for
Y, and
s was substituted for
S in Equation (2) for the selected rainwater supply reliability. The relationship between
d and
s can be expressed as:
where
and
c are regression coefficients that are calibrated based on simulation results. The relationship between these coefficients can be expressed as
If a constant daily water demand (
q) is considered, it can be expressed as a function of the storage capacity, effective roof area, and average annual rainfall, as follows:
Equation (9) can also be expressed as:
where
and
4. Case Study
The proposed methodology was applied to Northern Taiwan, the climate of which is strongly influenced by high-pressure cold fronts from Siberia in winter and by typhoons in summer and fall. The total land area of the region is 7347.23 km
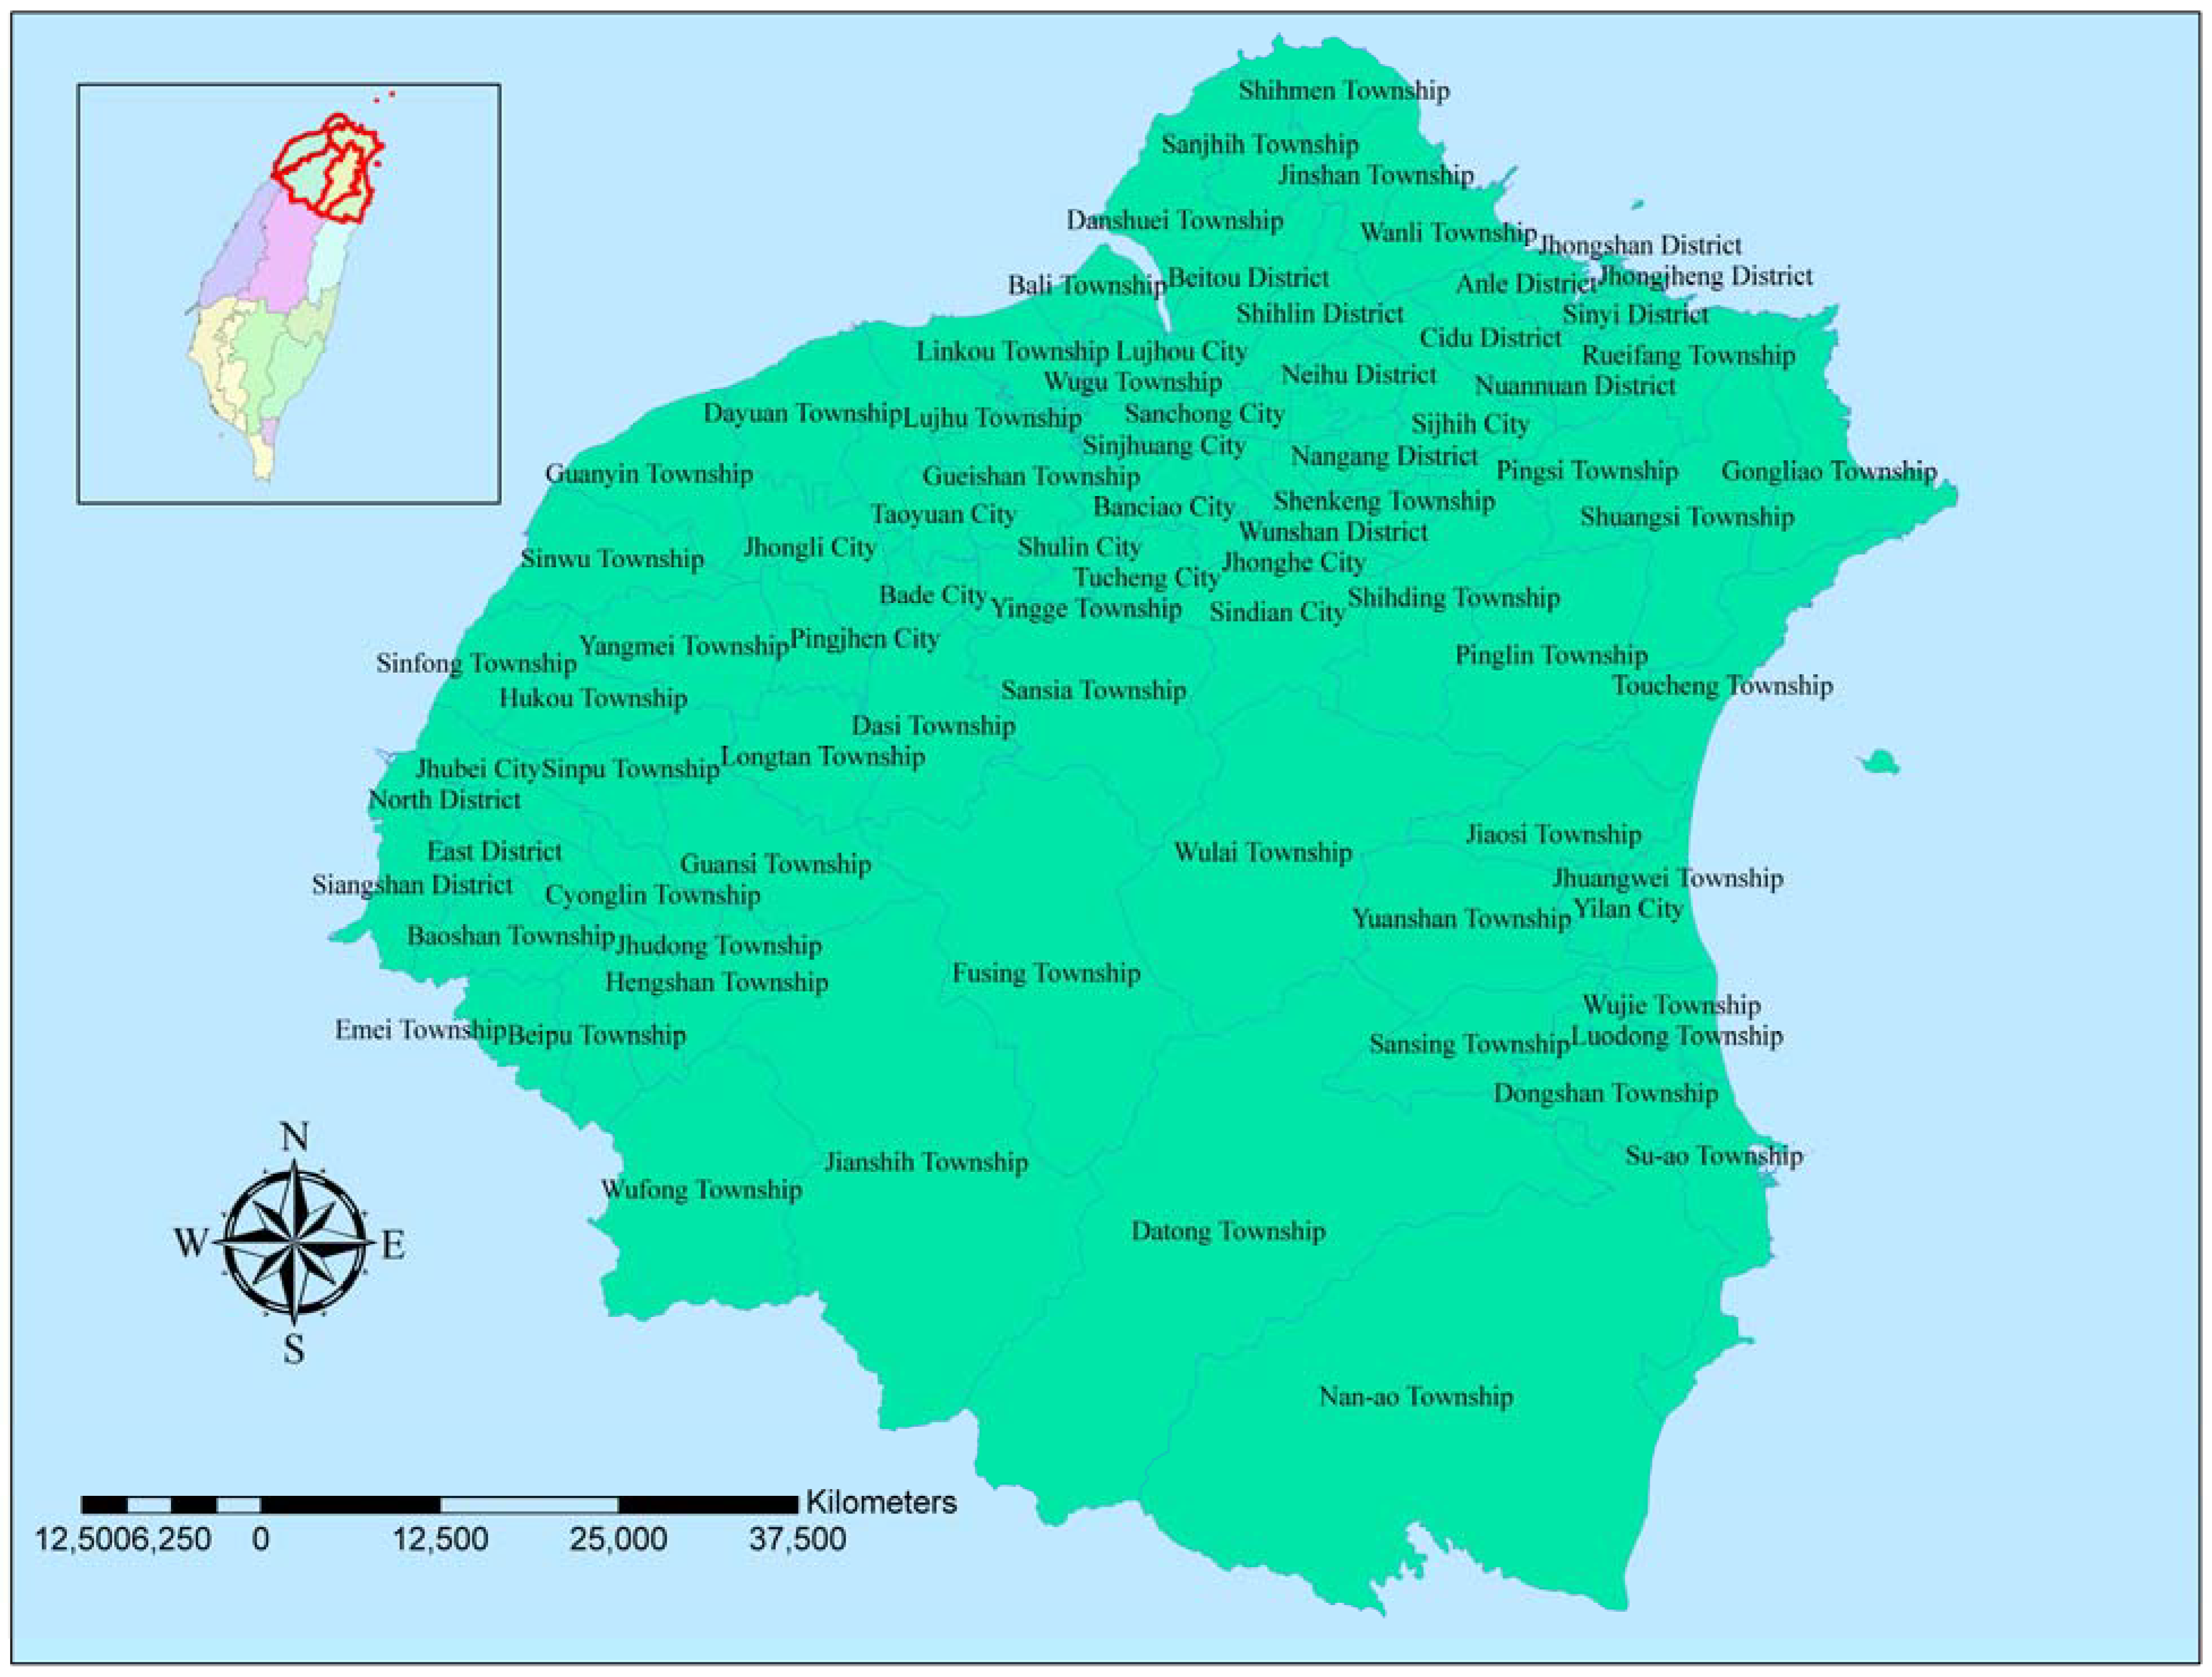
2, and the region includes 69 administrative districts in Keelung City, New Taipei City, Taipei City, Taoyuan County, Hsinchu County, Hsinchu City, and Yilan County (
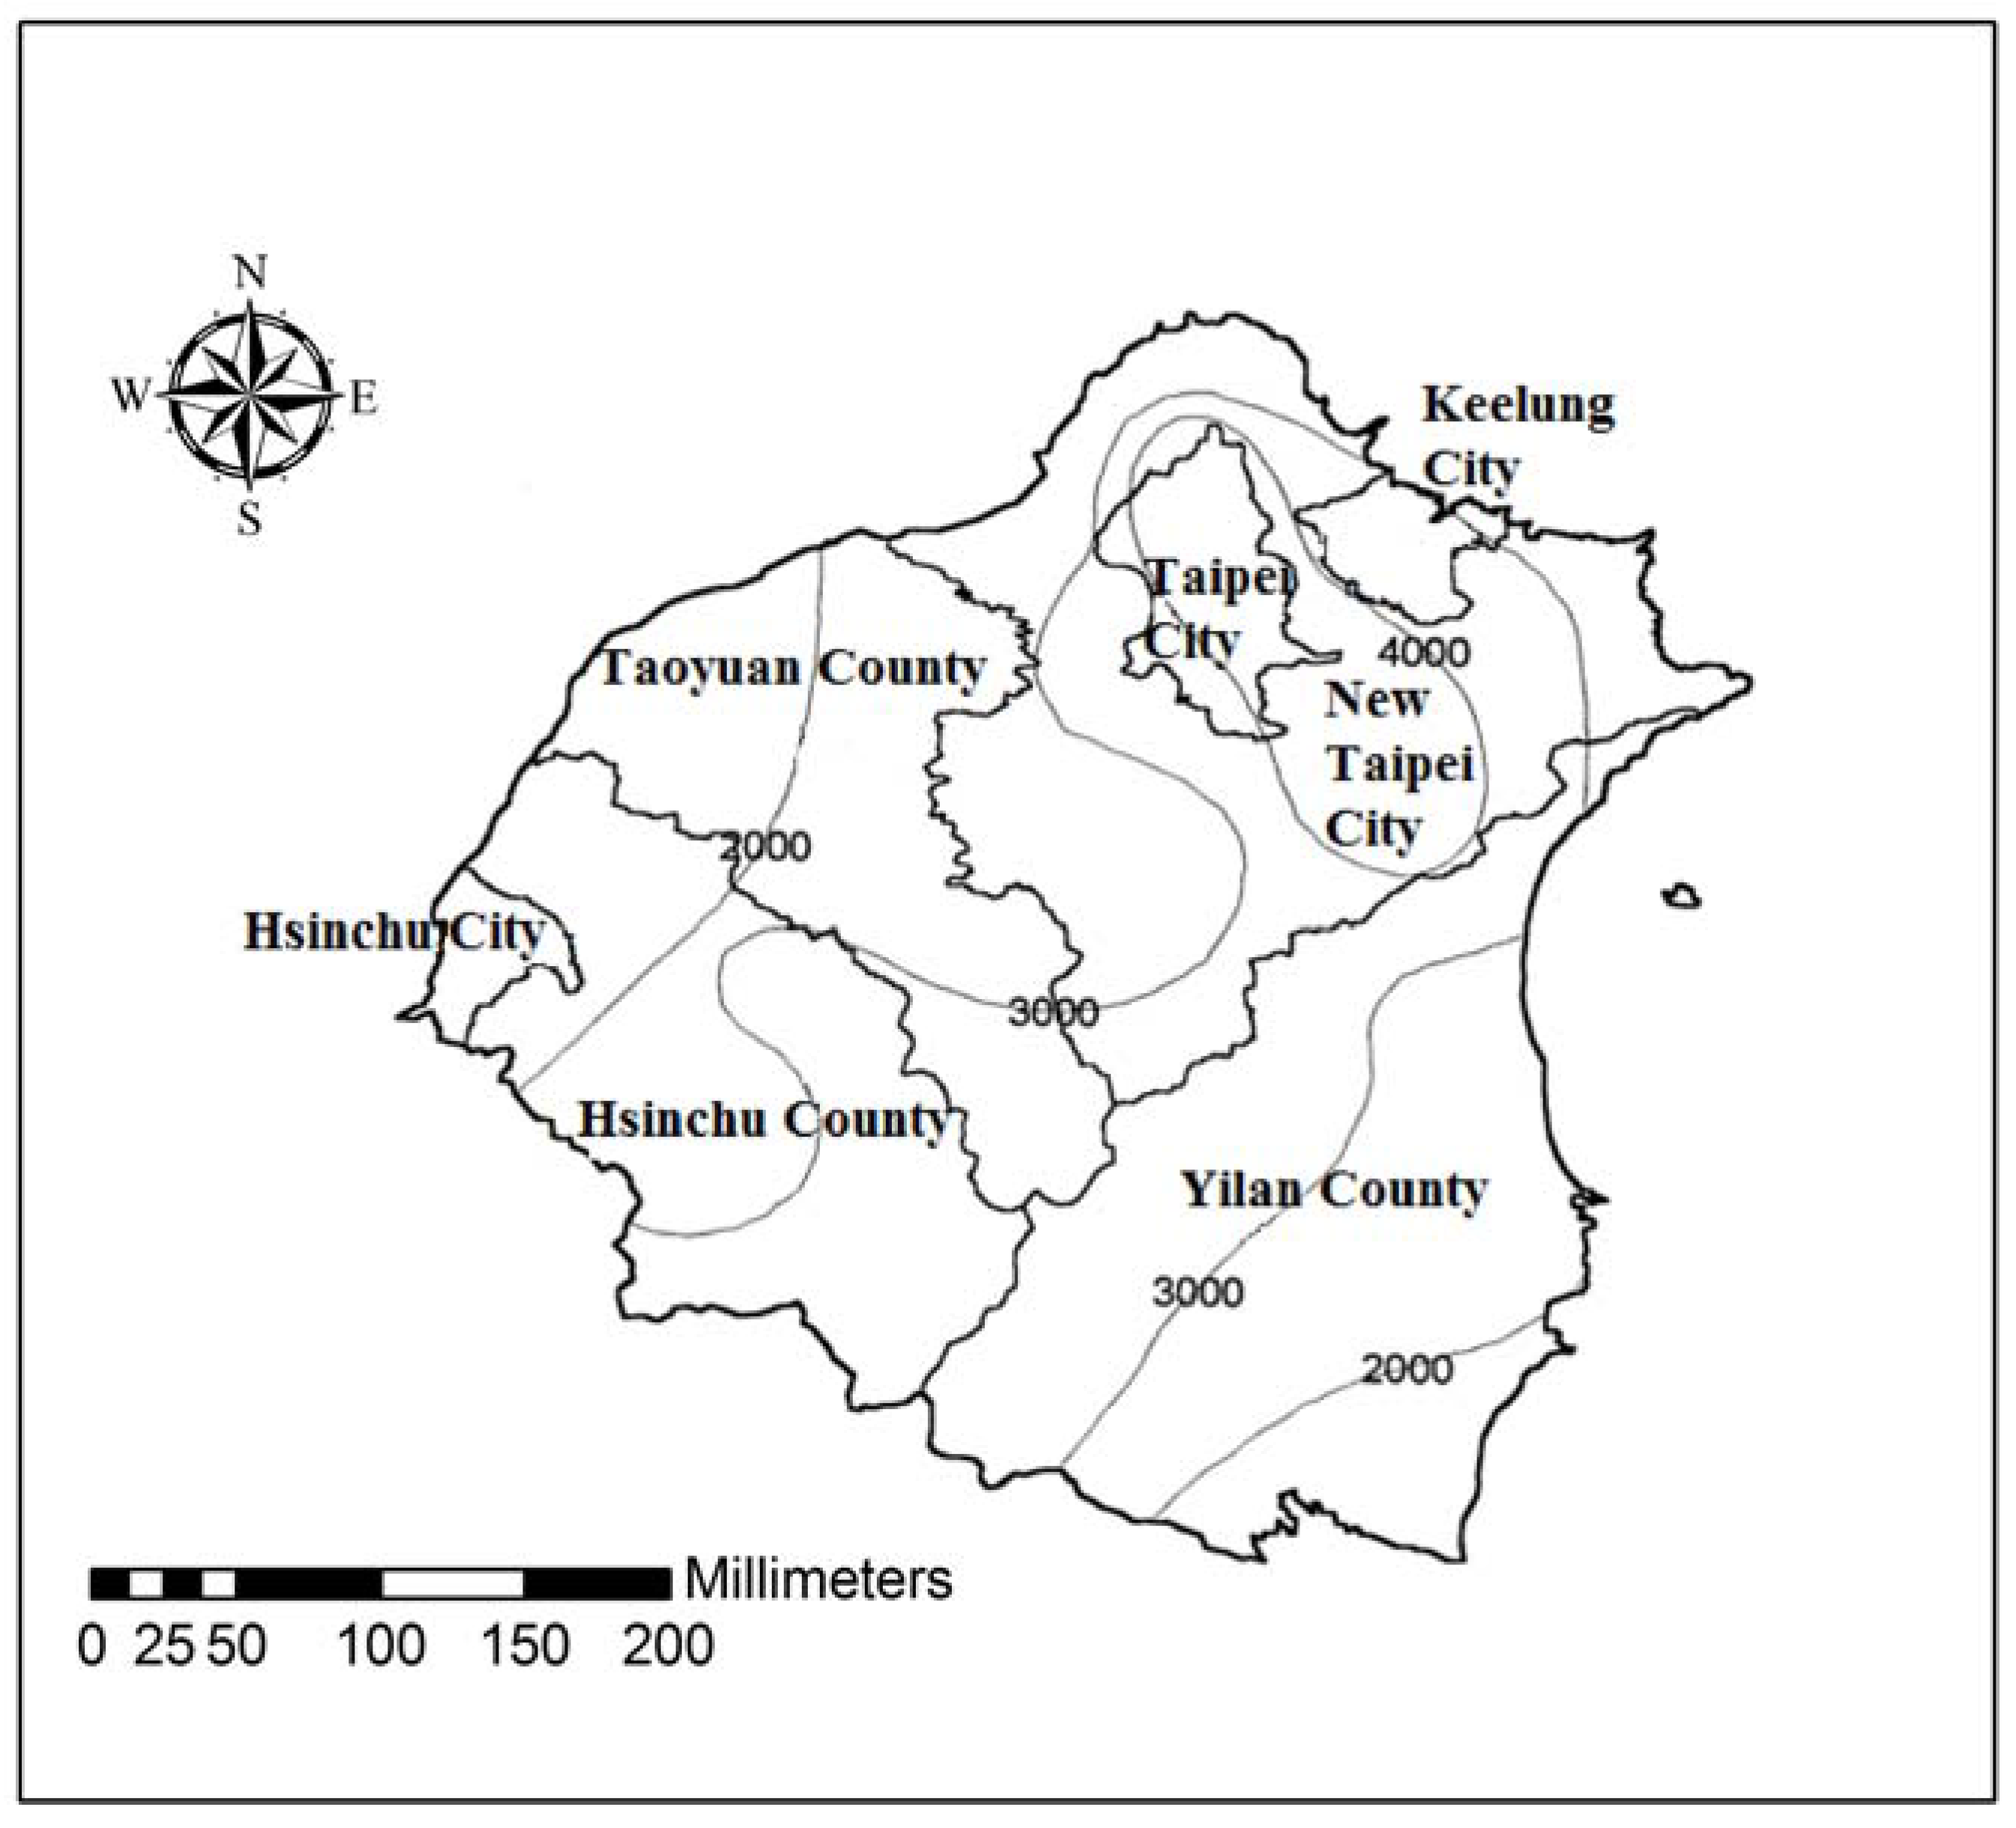
Figure 2). The population of the region exceeds 10 million and is mostly concentrated in coastal areas and the western part. The eastern, southern, and central parts of this region are mountainous areas. This region is located in a subtropical area and has an ocean monsoon climate and an average annual rainfall of 2800 mm. The average annual rainfall can reach 4800 mm on the windward side in the northeast area. Because of the moist monsoons from the northeast and the geographic location of the region, precipitation is concentrated on the windward side and in mountainous areas. Therefore, coastal areas and the western region have less rainfall. The monthly average rainfall in this region is higher in September and October than in other months. Rainfall mostly occurs during the wet season (from May to October), and it is caused mostly by typhoons. The percentage of rainfall during the wet season is approximately 62%. The spatial distribution of the average annual rainfall in the region is shown in the isohyetal map in
Figure 3.
Figure 2.
Map of distribution of administrative districts in study region.
Figure 2.
Map of distribution of administrative districts in study region.
Figure 3.
Isohyetal map of average annual rainfall (isohyets are in mm).
Figure 3.
Isohyetal map of average annual rainfall (isohyets are in mm).
Daily rainfall data were obtained from the Water Resources Agency of the Ministry of Economic Affairs, Taiwan. Currently, 152 effective rainfall stations operate in the area. Liaw and Tsai [
28] indicated that as the record lengths have increased, variations in
Rv have become more stable. The difference between the maximum and minimum values of
Rv at 95% and 90% confidence levels decreased to approximately 3% for data record lengths above 50 years. Therefore, the 58 rainfall stations selected in this study cover the entire region and are characterized by rainfall series with at least 50-year records, which helps the avoid inaccuracies associated with the shortness of data sets in DRWHS design.
5. Results and Discussion
5.1. Rainfall Zoning
The first step in a regional study is to define sub-regions. The division into sub-regions must be based on homogeneity of rainfall and political boundary. The rainfall amount and distribution are the two most critical factors in DRWHS design. In the current study, a two-step cluster analysis method [
39,
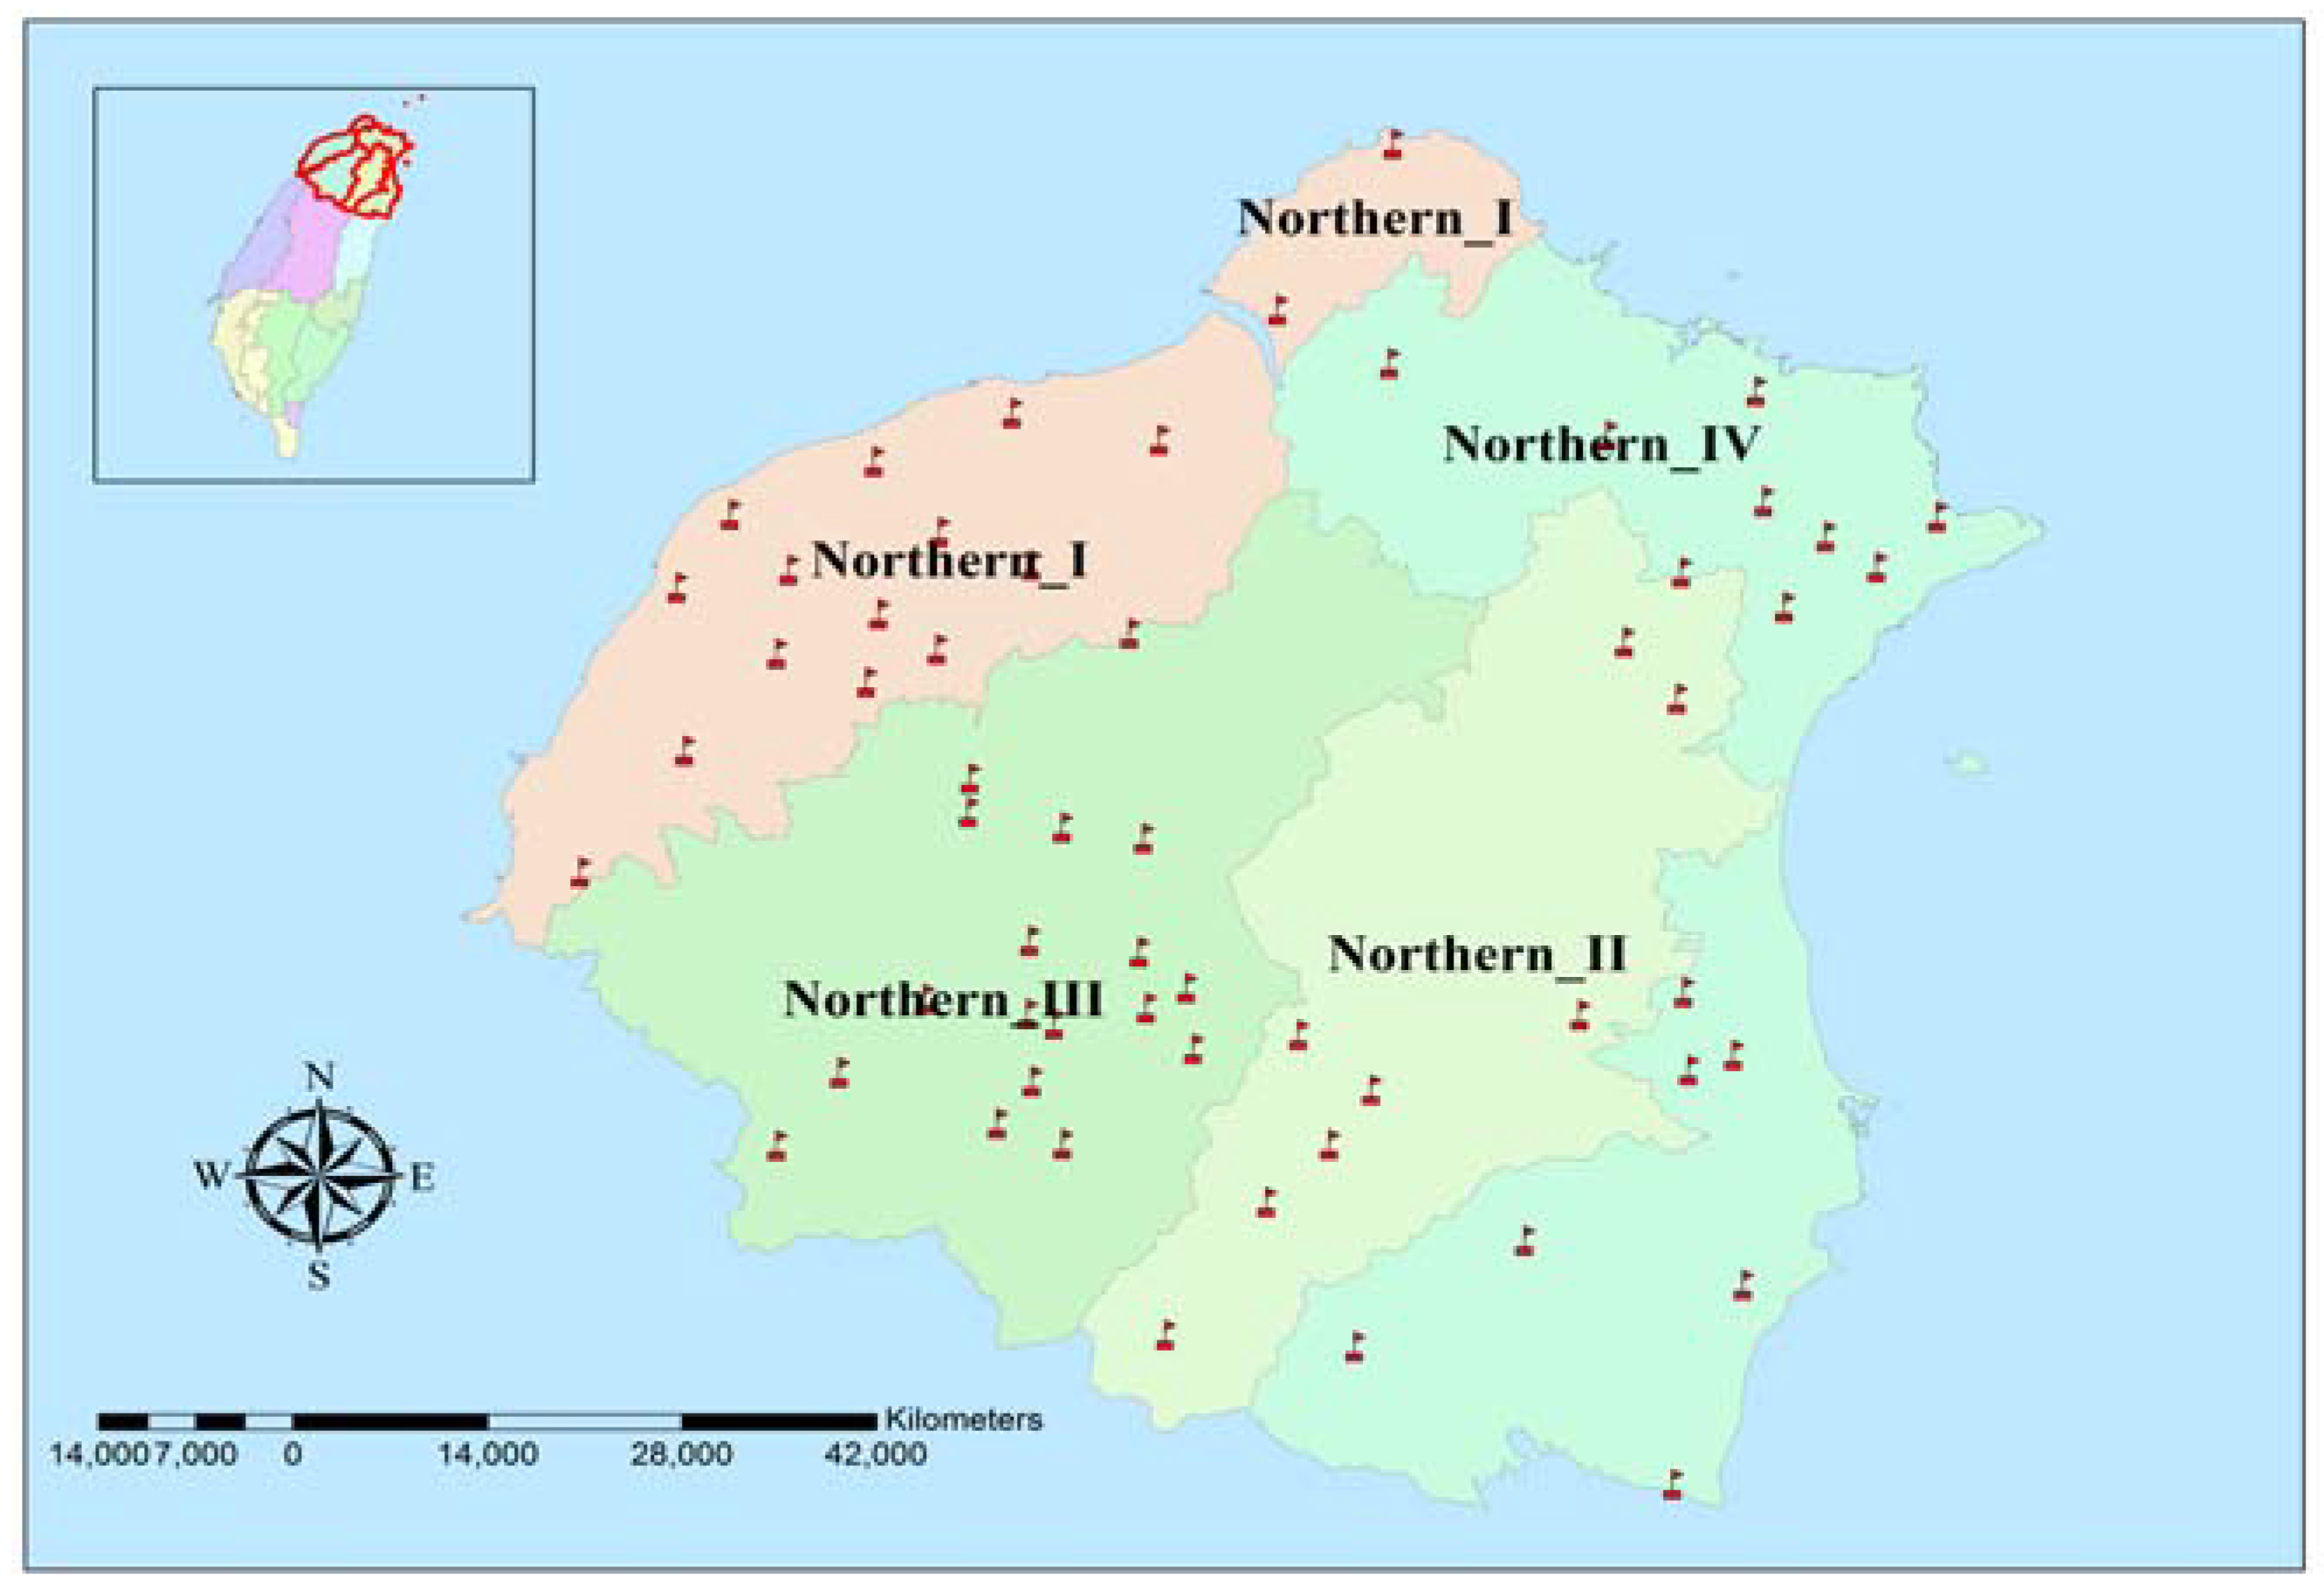
40] was used, and the average annual 10-day rainfall distribution at rainfall stations was treated as a single variable. The 10-day rainfall distribution was selected to carry out cluster analysis because this allows us to obtain dimensionless design curves in the most accurate and effective manner. The analysis consisted of the following three steps: (1) a hierarchical cluster was adopted to determine the optimal number of clusters; (2) a nonhierarchical cluster was introduced for classification; and (3) the clusters were tested to ensure their accuracy. SPSS Version 19.0 software was used for the cluster analysis. Based on the results, the study region was clustered into four sub-regions. The distribution of the sub-regions and rainfall stations and their statistical characteristics are presented in
Figure 4 and
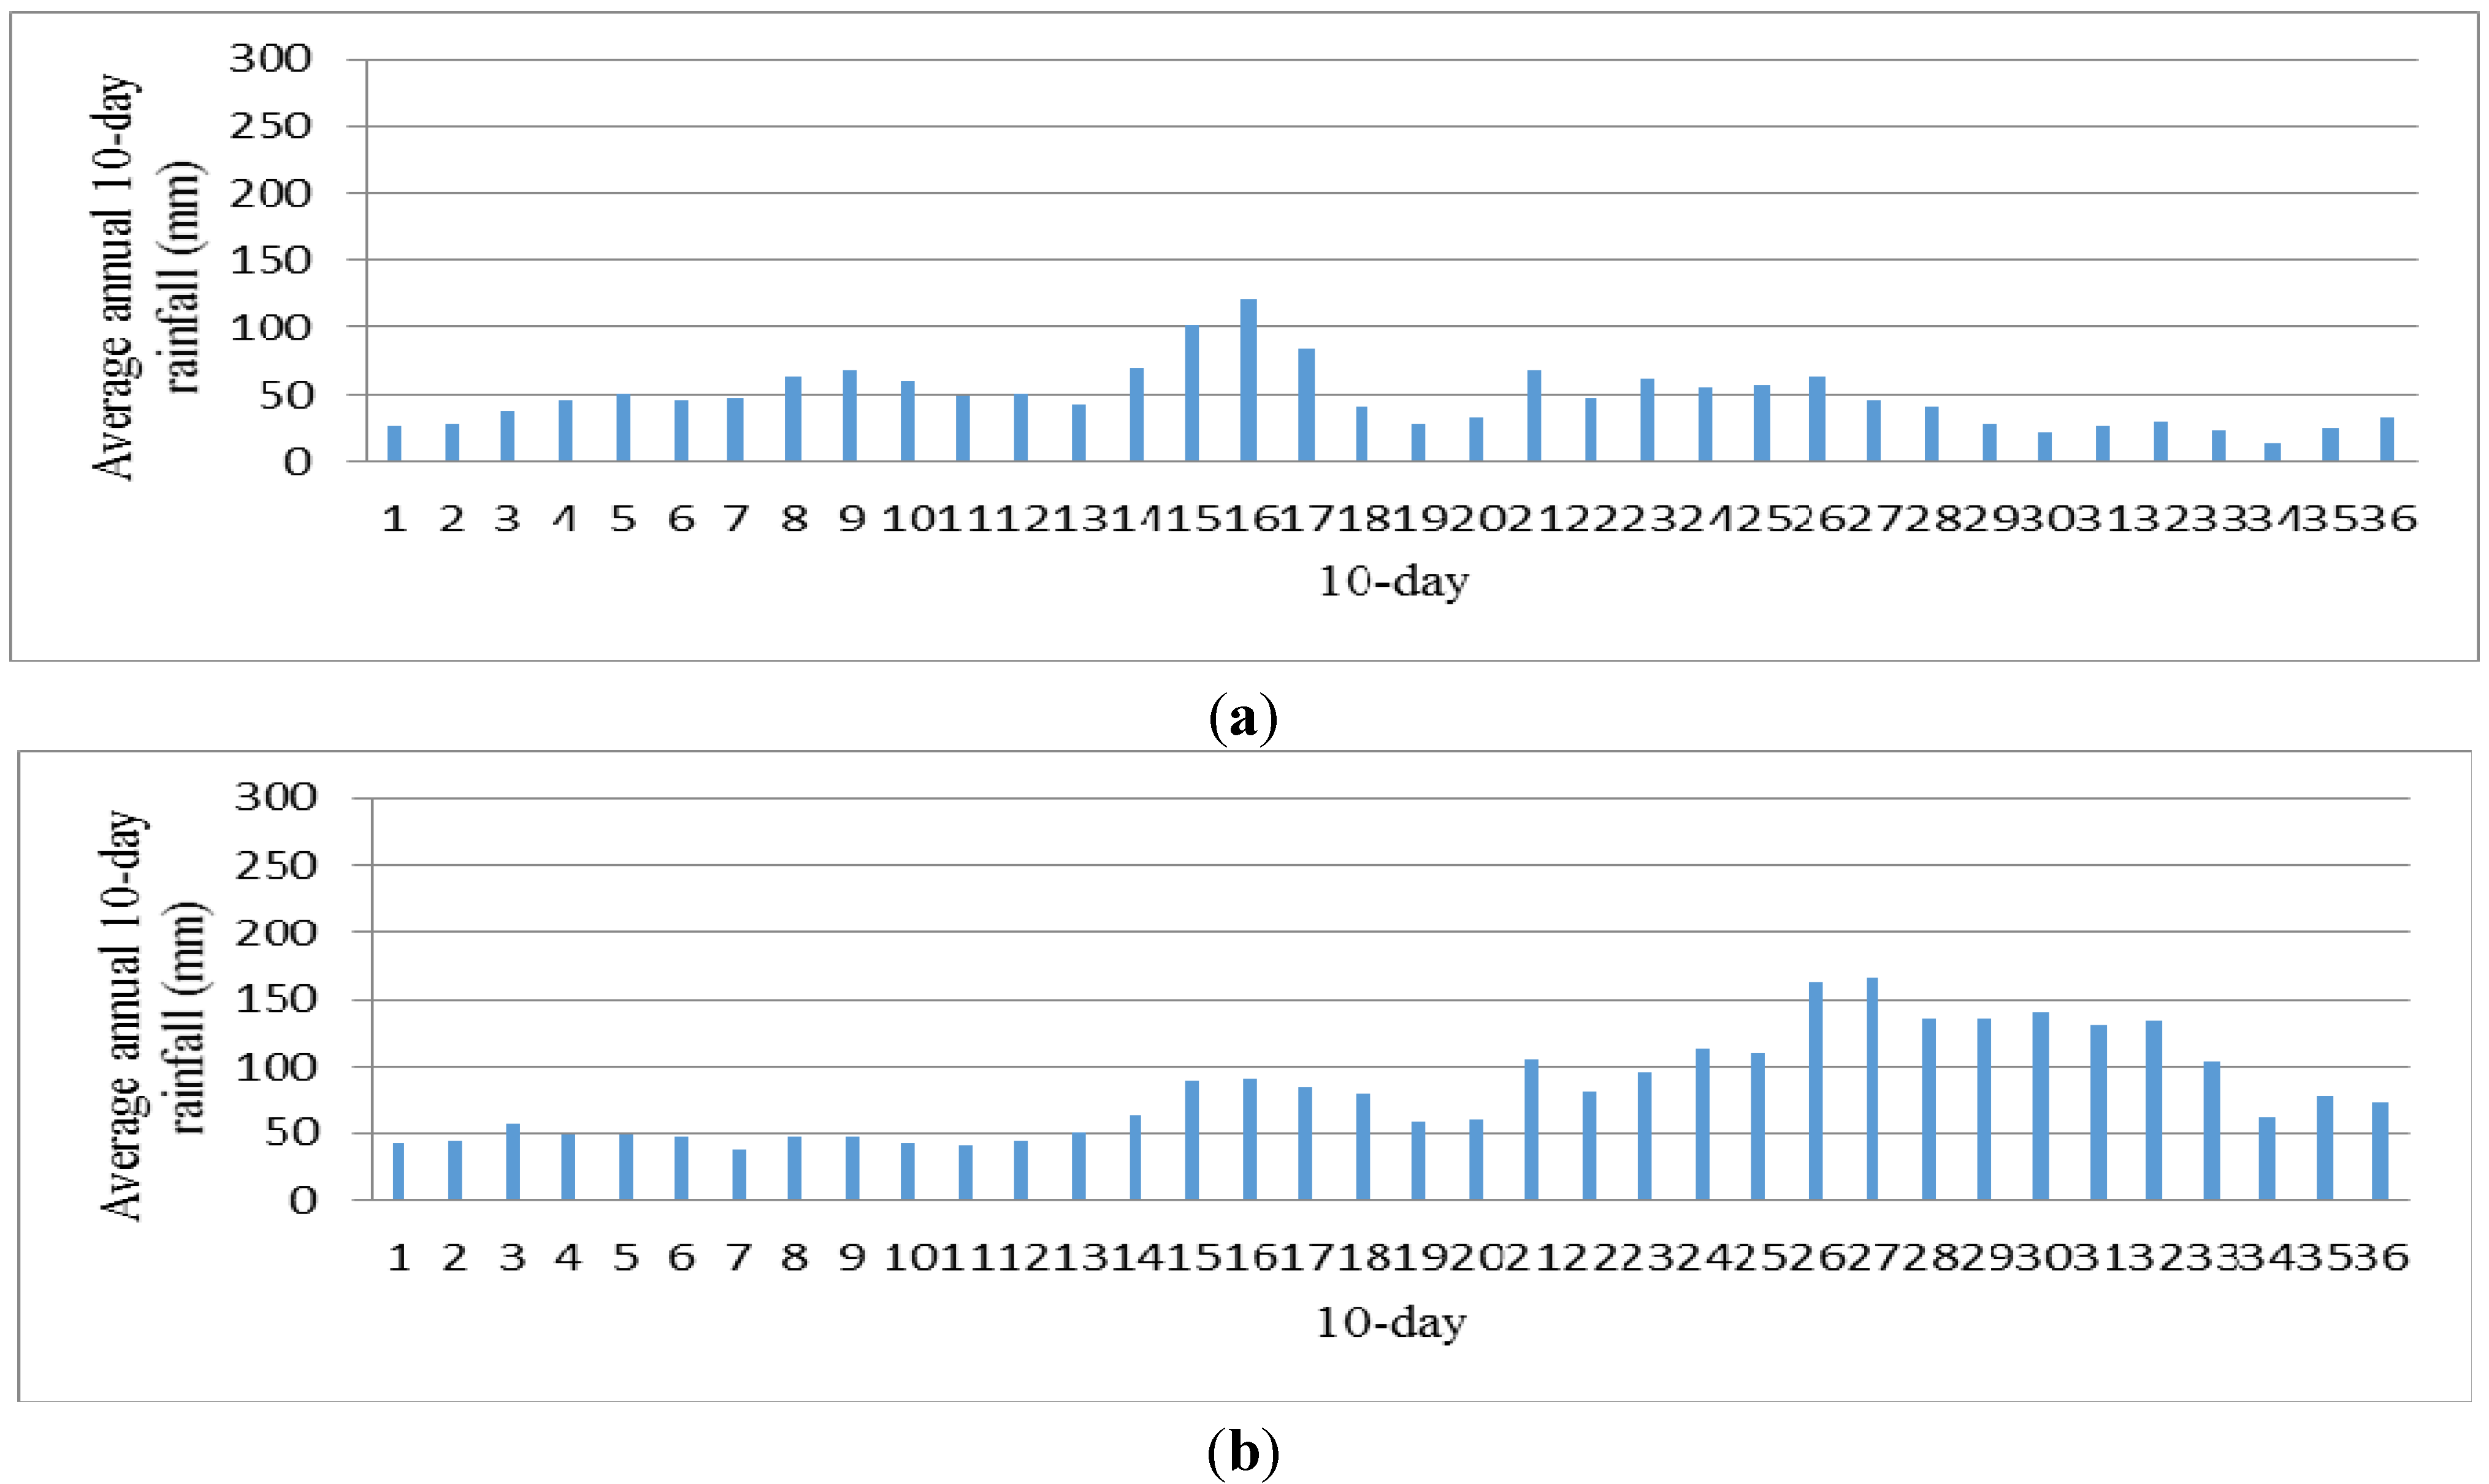
Table 1, respectively. The average annual rainfall and coefficient of variation in sub-region I are 1815.0 mm and 0.49, respectively; the values are 3524.5 mm and 0.58 in sub-region II, respectively; the values are 2302 mm and 0.61 in Sub-region III, respectively; and the values amount to 3564.6 mm and 0.52 in sub-region IV, respectively. The number of administrative districts included in sub-regions I, II, III, and IV was 26, 7, 12, and 19, respectively. The average annual 10-day rainfall distributions for each sub-region are shown in
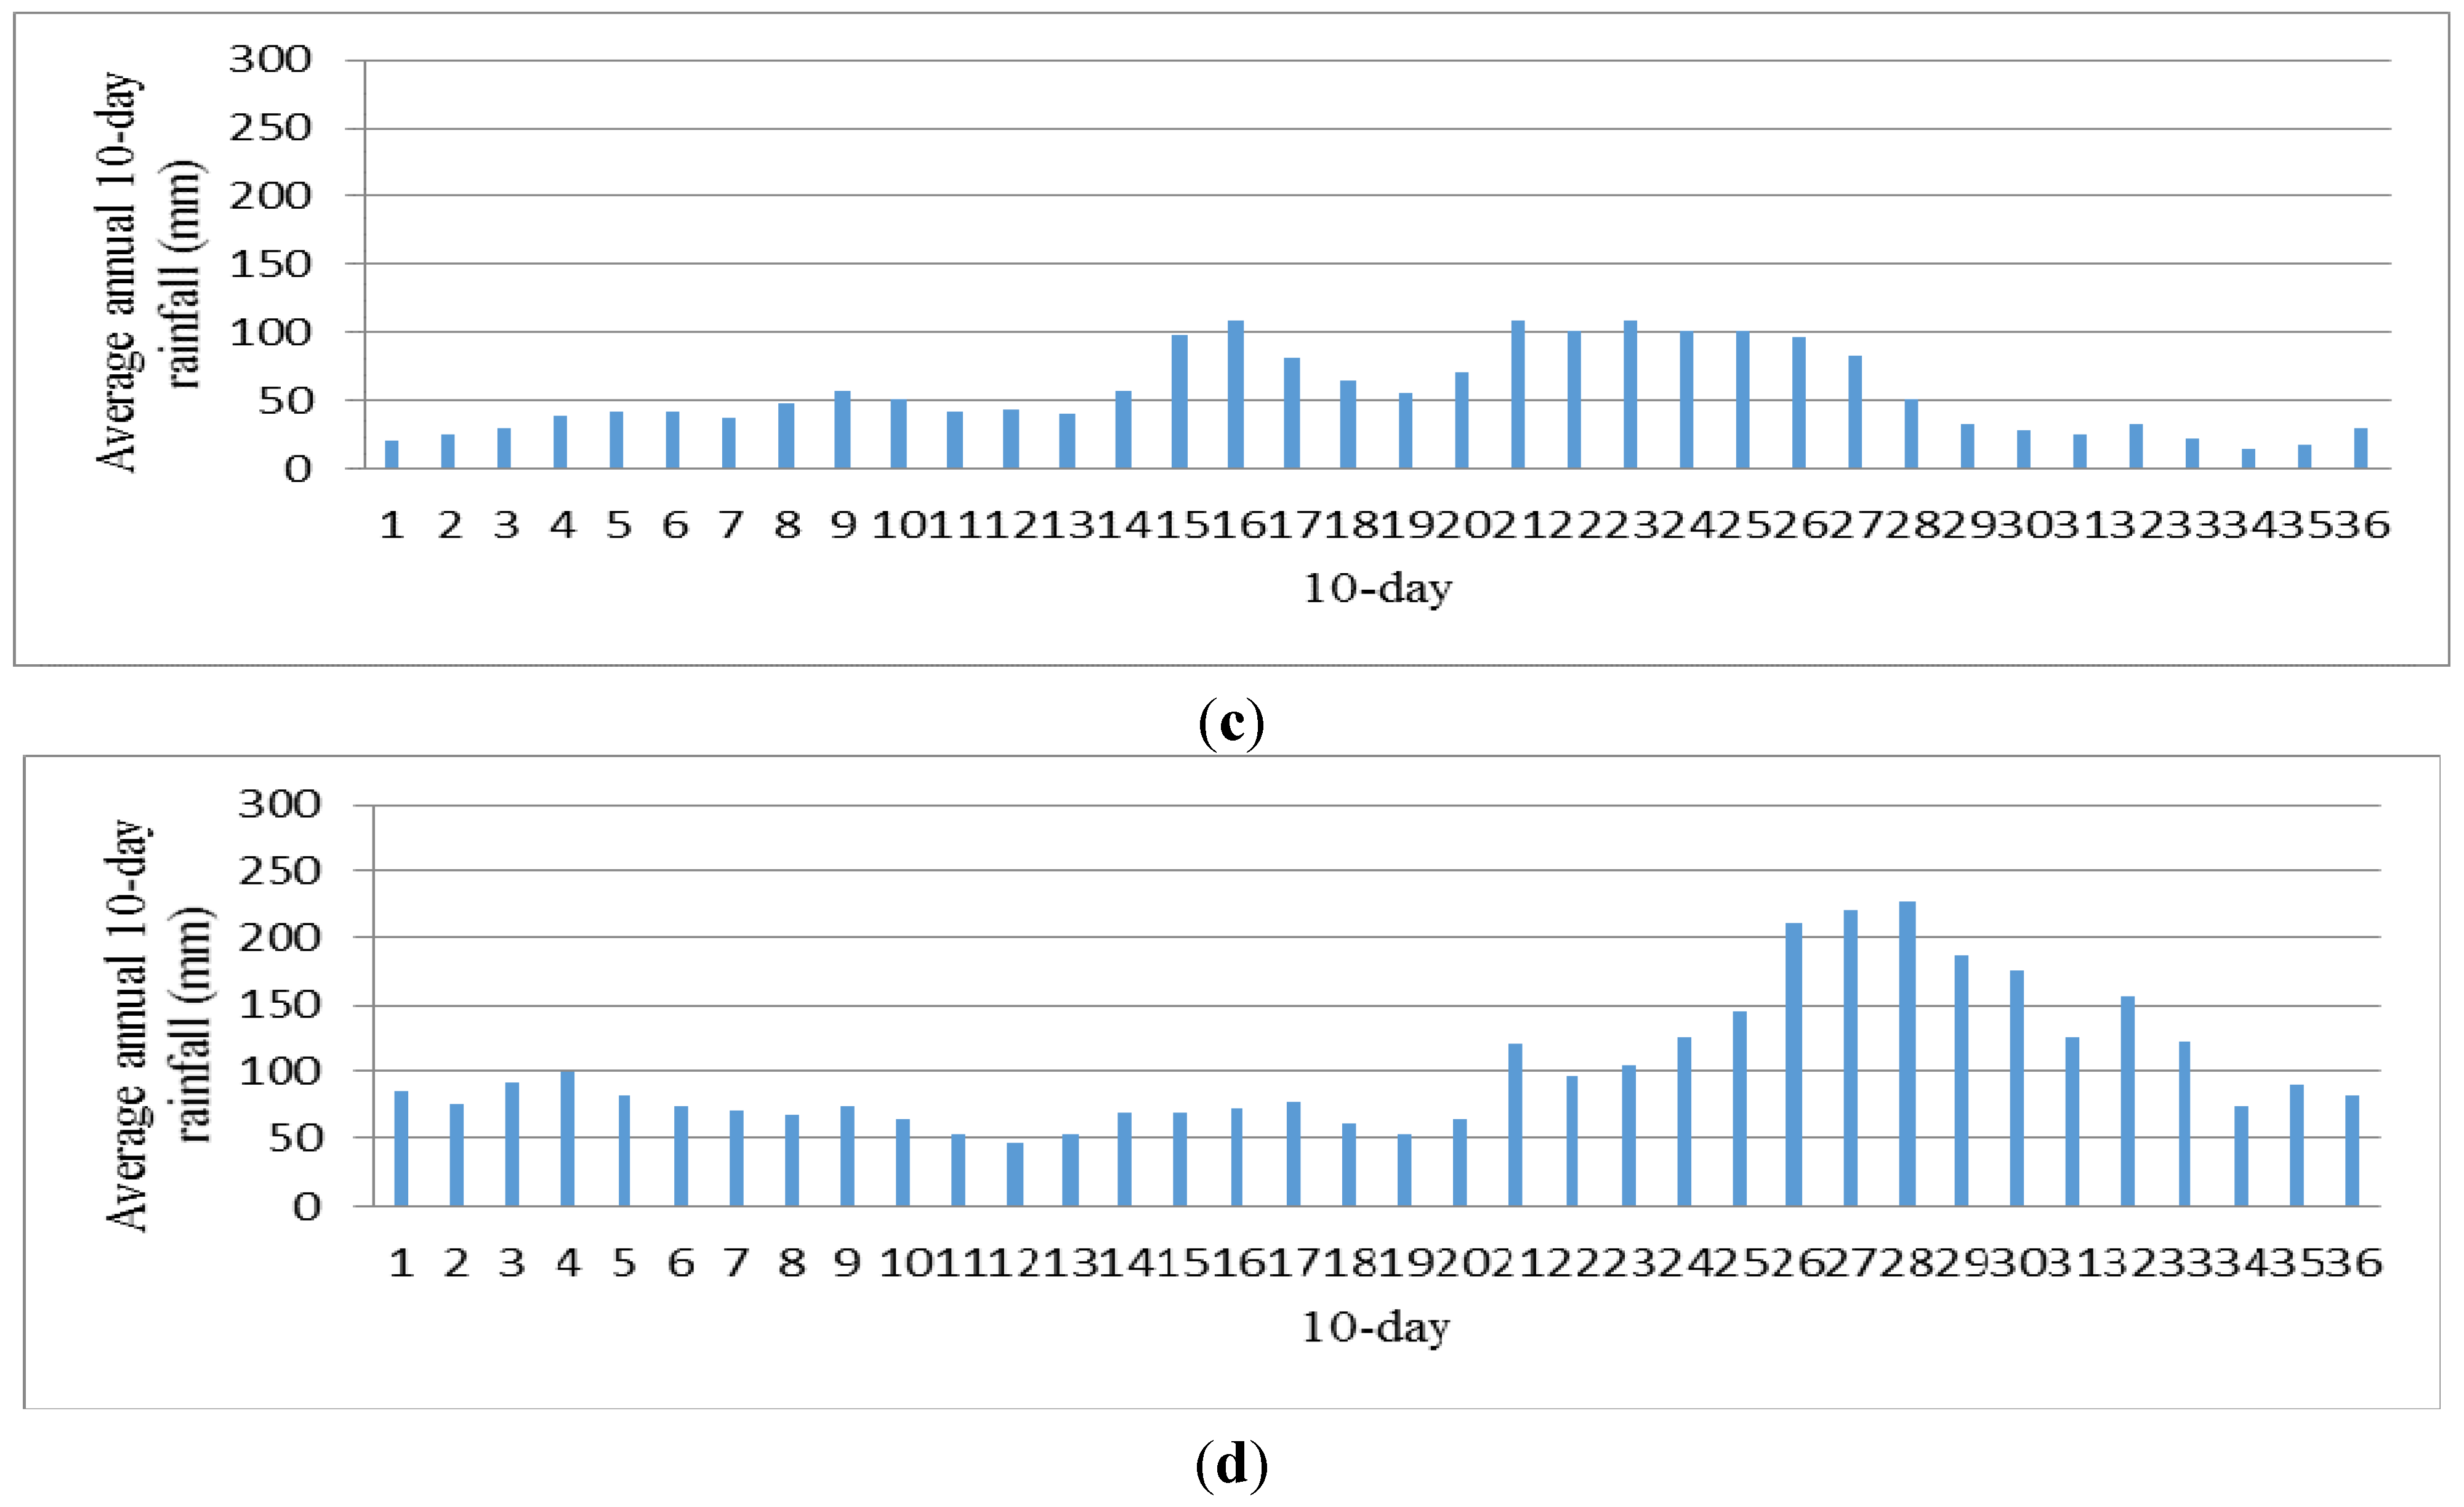
Figure 5. The rainfall distribution differs considerably among the four sub-regions. The rainfall in sub-region I is uniformly distributed; rainfall is greatest in summer and lowest in winter. Sub-region II is located to the east of the Central Mountain Range, and rainfall is greater in summer and winter compared with the other seasons because of typhoons. Sub-region III is located on the west side of the Central Mountain Range, and it has more rainfall in summer. Sub-region IV has more rainfall in winter because of high-pressure cold fronts from Siberia. The large differences in rainfall distribution among the four sub-regions indicate the necessity of sub-region cluster analysis.
Figure 4.
Map of distribution of rainfall stations and boundary of four sub-regions in study region.
Figure 4.
Map of distribution of rainfall stations and boundary of four sub-regions in study region.
Table 1.
Statistical characteristics of annual rainfall for selected rainfall stations in four sub-regions.
Table 1.
Statistical characteristics of annual rainfall for selected rainfall stations in four sub-regions.
| Sub-Region | Ⅰ | Ⅱ | Ⅲ | Ⅳ |
|---|
| Average annual rainfall (mm) | 1792.05 | 3272.10 | 2134.00 | 3489.15 |
| No. of rainfall stations | 16 | 9 | 18 | 15 |
| Variance | 0.48 | 0.61 | 0.62 | 0.51 |
| Administrative districts included | 26 | 7 | 18 | 19 |
Figure 5.
Average annual 10-day rainfall distribution in four sub-regions: (a) Sub-region I; (b) Sub-region II; (c) Sub-region III; and (d) Sub-region IV.
Figure 5.
Average annual 10-day rainfall distribution in four sub-regions: (a) Sub-region I; (b) Sub-region II; (c) Sub-region III; and (d) Sub-region IV.
5.2. Dimensionless Curve Construction
Daily water balance simulations using the YAS algorithm were conducted to evaluate the DRWHS performance at each rainfall station in each sub-region. In Taiwan, the number of people per household ranges from 2.9 to 3.4, with the average being 3.2 people. The floor area of a housing unit depends on the structural material, and it ranges from 111.4 to 137.6 m
2, with an average value of 124.5 m
2 per housing unit. More than 95% of the residents live in apartments, most of which have 2 to 5 stories, built by the public and private sectors. The daily potable water demand per user is 0.25 m
3, and 32% of this amount in the residential sector can be replaced by rainwater because it is mainly used for toilet flushing. The DRWHS performance was modeled by considering values of the annual water demand in the range of 100 of 1000 m
3, effective roof area in the range 100 of 500 m
2, and storage capacity in the range 1 to 300 m
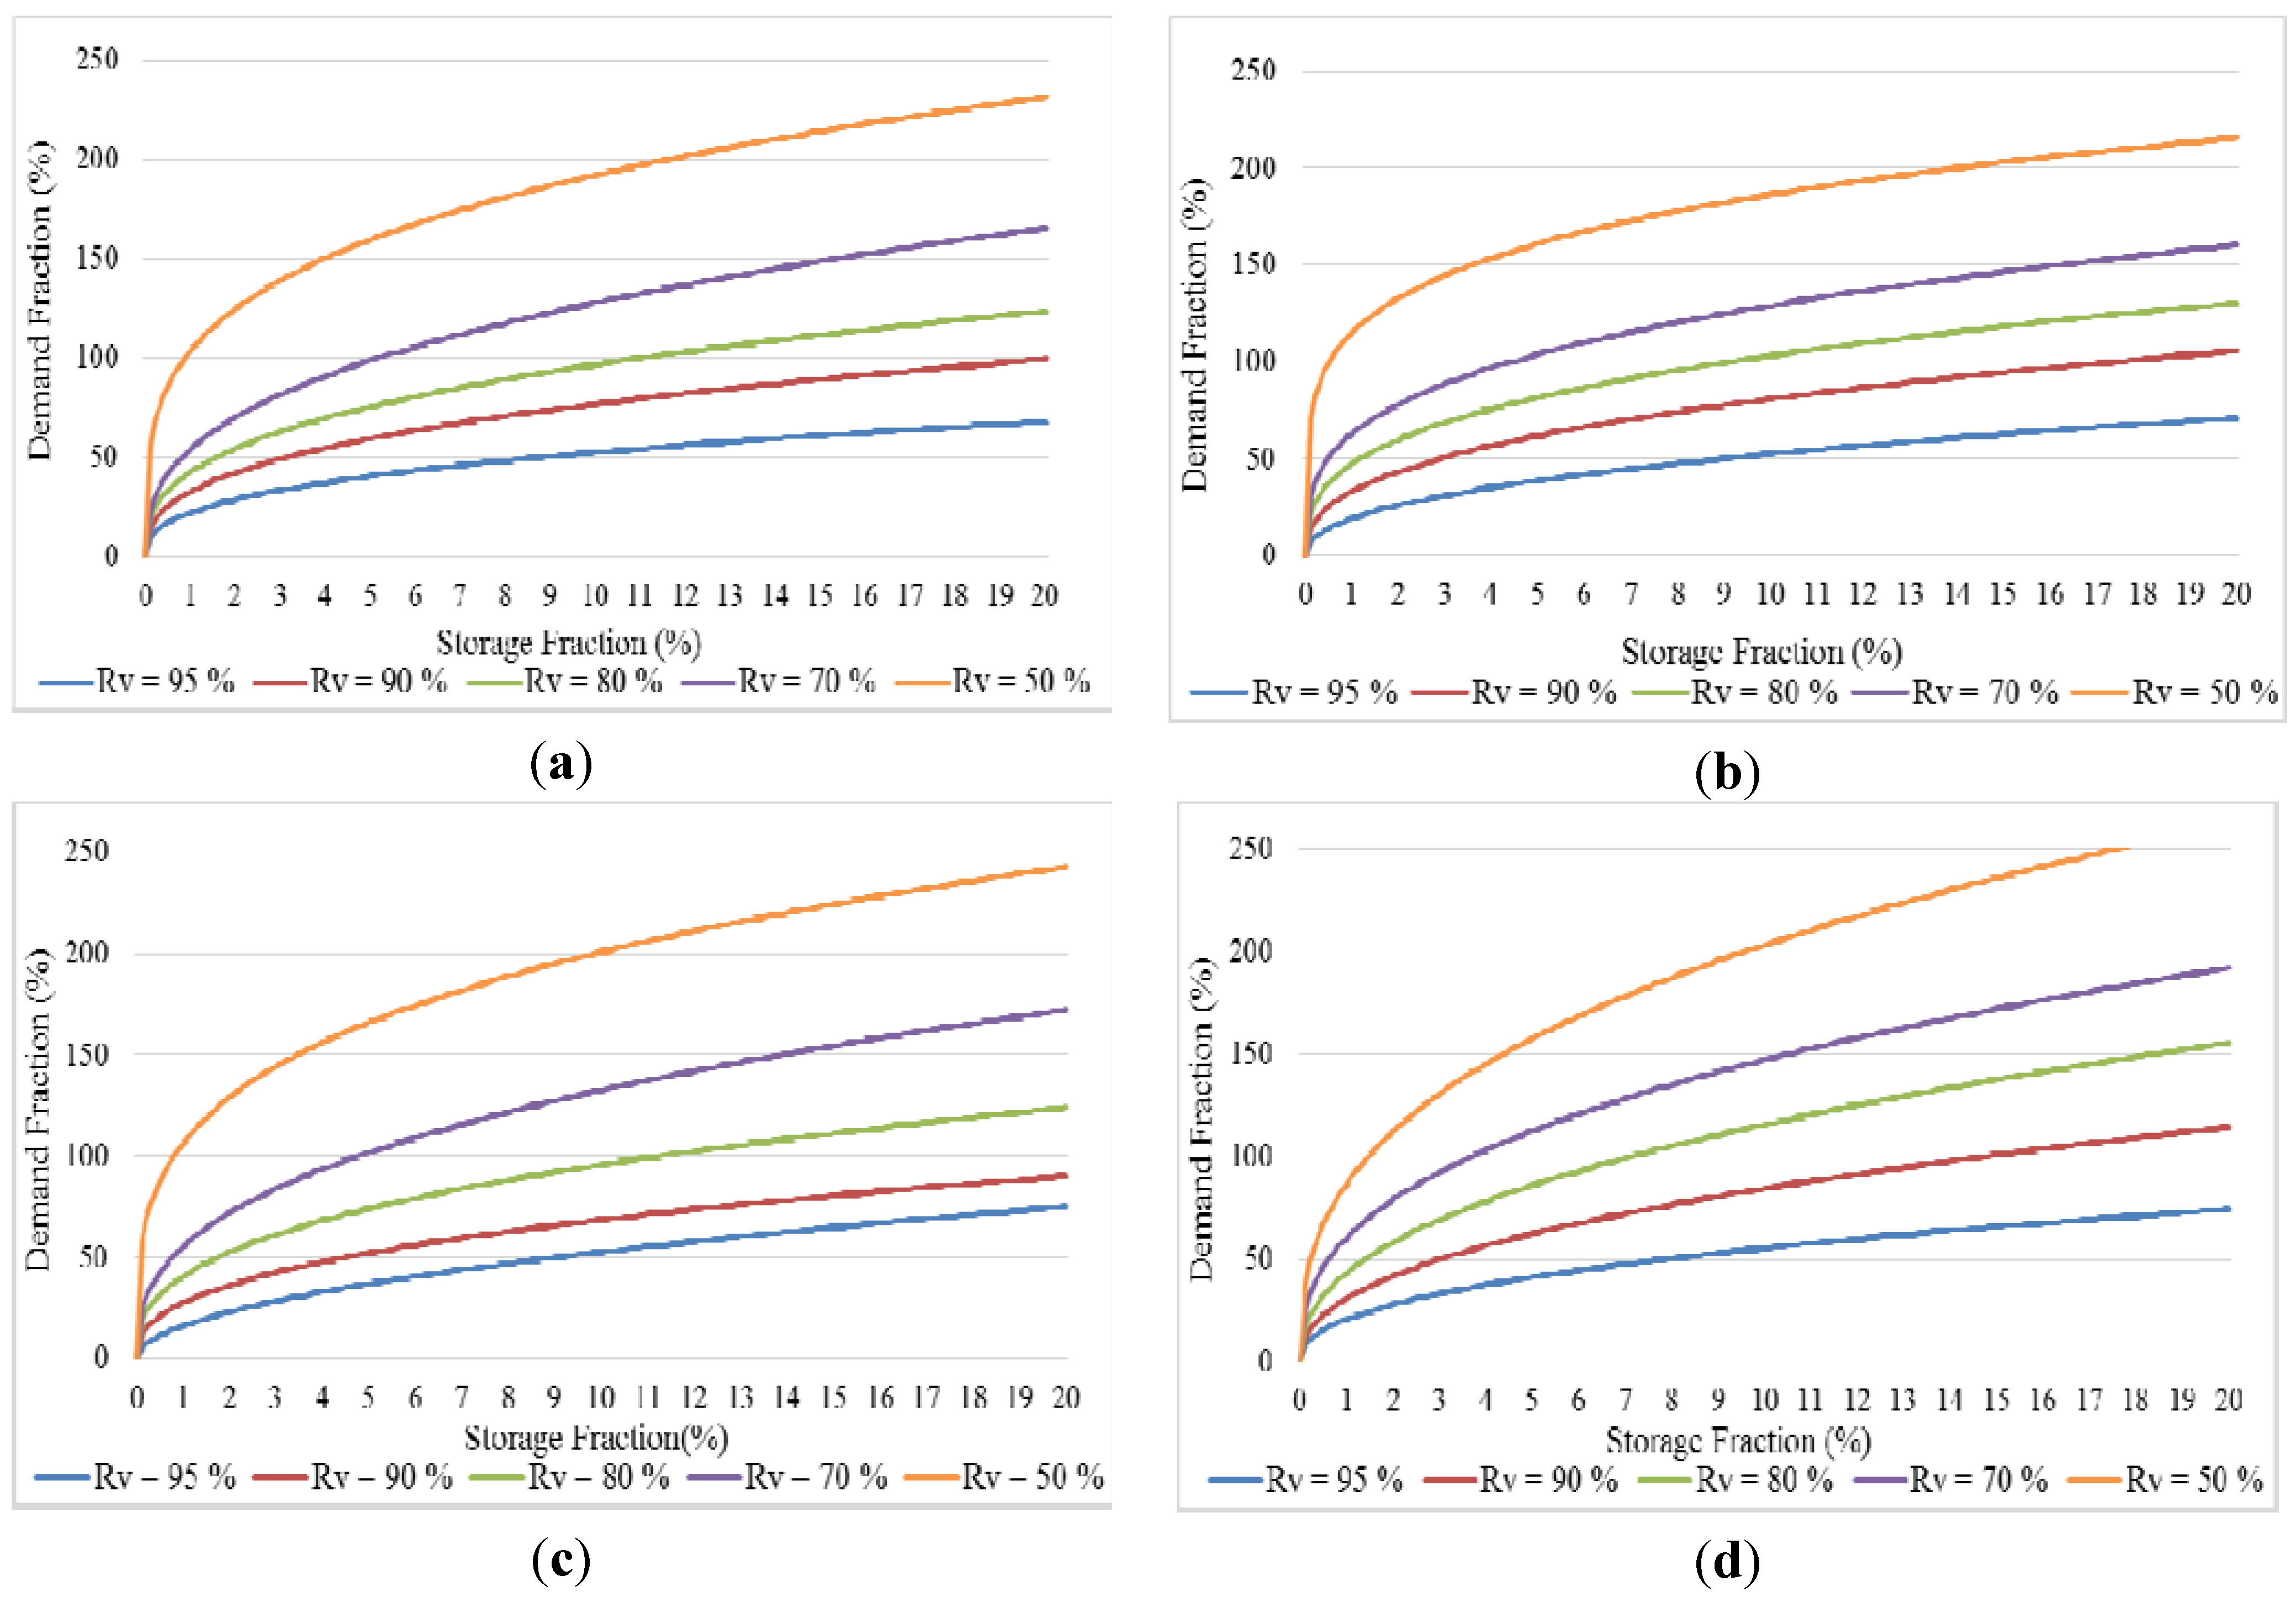
3. The ranges were selected by considering values used in practical applications. Dimensionless curves obtained from simulations for five rainwater supply reliabilities—95%, 90%, 80%, 70%, and 50%—are presented in
Figure 6. As expected, the storage fraction increases with the demand fraction. In addition, curve derivatives tend to decrease, showing a reduced unit increase in the demand fraction as the storage fraction increases. This indicates the benefits of reduced water supply for a large storage capacity when the effective roof area and rainfall are limited. The regression coefficients for each sub-region for the five rainwater supply reliabilities are listed in
Table 2, together with the
r2 values. High values of
r2 indicate strong agreement obtained with regressions and the necessity of sub-region analysis. The regression coefficients of Equation (10) for the five rainwater supply reliabilities are also listed in
Table 3.
Figure 6.
Dimensionless design curves for selected rainwater supply reliabilities in four sub-regions: (a) Sub-region I; (b) Sub-region II; (c) Sub-region III; and (d) Sub-region IV.
Figure 6.
Dimensionless design curves for selected rainwater supply reliabilities in four sub-regions: (a) Sub-region I; (b) Sub-region II; (c) Sub-region III; and (d) Sub-region IV.
Table 2.
Regression coefficients of dimensionless curves between demand fraction and storage fraction for five rainwater supply reliabilities in four sub-regions.
Table 2.
Regression coefficients of dimensionless curves between demand fraction and storage fraction for five rainwater supply reliabilities in four sub-regions.
| Rainwater Supply Reliabilities (Rv) | Regression Parameters | Sub-Region |
|---|
| I | II | III | IV |
|---|
| 95% | b' | 1.212 | 1.404 | 1.671 | 1.446 |
| c | 0.374 | 0.438 | 0.514 | 0.428 |
| r2 | 0.998 | 0.996 | 0.997 | 0.994 |
| 90% | b' | 1.731 | 1.886 | 1.631 | 2.214 |
| c | 0.371 | 0.386 | 0.395 | 0.439 |
| r2 | 0.989 | 0.954 | 0.990 | 0.970 |
| 80% | b' | 2.021 | 2.082 | 2.071 | 2.804 |
| c | 0.356 | 0.338 | 0.371 | 0.426 |
| r2 | 0.983 | 0.957 | 0.947 | 0.945 |
| 70% | b' | 2.637 | 2.367 | 2.762 | 3.112 |
| c | 0.373 | 0.312 | 0.378 | 0.385 |
| r2 | 0.959 | 0.942 | 0.932 | 0.942 |
| 50% | b' | 2.955 | 2.612 | 3.125 | 3.678 |
| c | 0.268 | 0.21 | 0.275 | 0.368 |
| r2 | 0.943 | 0.932 | 0.943 | 0.938 |
Table 3.
Regression coefficients of equation 10 for five rainwater supply reliabilities in four sub-regions.
Table 3.
Regression coefficients of equation 10 for five rainwater supply reliabilities in four sub-regions.
| Rainwater Supply Reliabilities (Rv) | Regression Parameters | Sub-Region |
|---|
| I | II | III | IV |
|---|
| 95% | b'' | 1.212 | 1.404 | 1.671 | 1.446 |
| c | 0.374 | 0.438 | 0.514 | 0.428 |
| d | 0.626 | 0.562 | 0.486 | 0.572 |
| 90% | b'' | 1.731 | 1.886 | 1.631 | 2.214 |
| c | 0.371 | 0.386 | 0.395 | 0.439 |
| d | 0.629 | 0.614 | 0.605 | 0.561 |
| 80% | b'' | 2.021 | 2.082 | 2.071 | 2.804 |
| c | 0.356 | 0.338 | 0.371 | 0.426 |
| d | 0.644 | 0.662 | 0.629 | 0.574 |
| 70% | b'' | 2.637 | 2.367 | 2.762 | 3.112 |
| c | 0.373 | 0.312 | 0.378 | 0.385 |
| d | 0.627 | 0.688 | 0.622 | 0.615 |
| 50% | b'' | 2.955 | 2.612 | 3.125 | 3.678 |
| c | 0.268 | 0.21 | 0.275 | 0.368 |
| d | 0.732 | 0.79 | 0.725 | 0.632 |
5.3. Comparison between Storage Capacity Values Obtained from Dimensionless Curves and Those Derived from Simulations
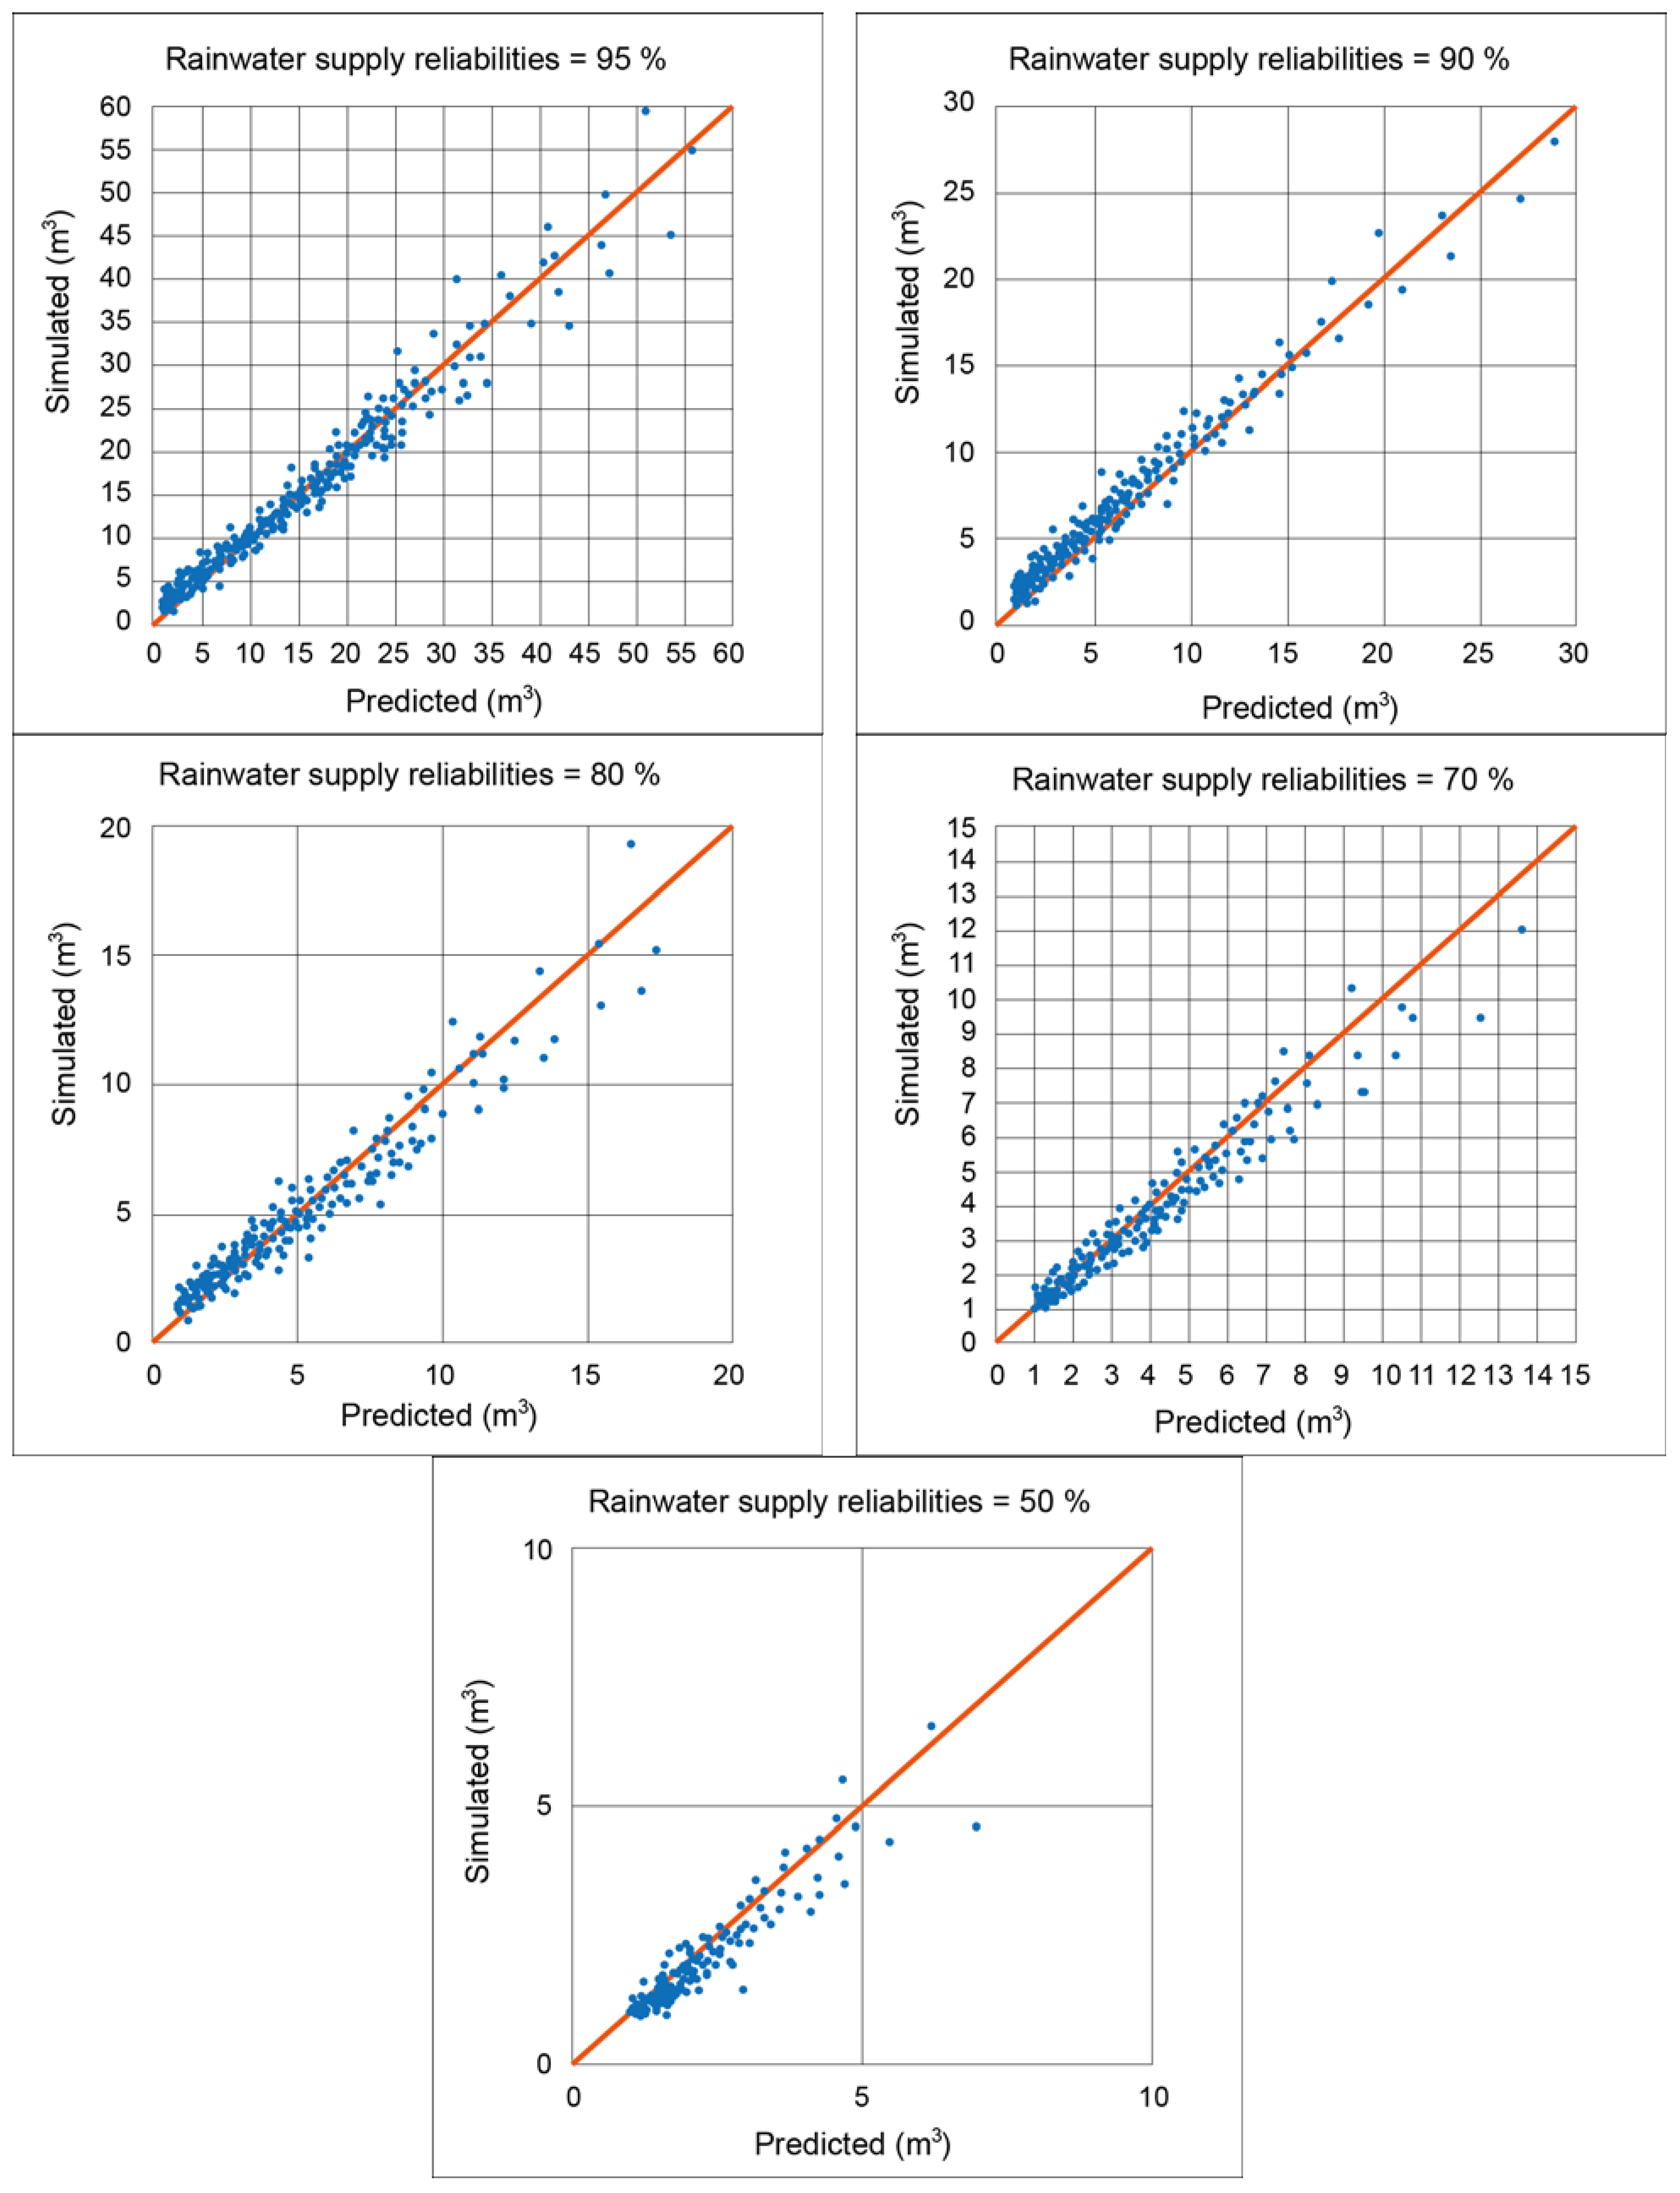
Figure 7 shows graphical comparisons between the storage capacity values obtained from water balance simulations and those predicted by dimensionless curves for the five rainwater supply reliabilities for the sub-region I. In general, the figure shows strong agreement between storage capacities obtained from regression curves and those derived from a simulated model for the five rainwater supply reliabilities. For cases of low rainwater supply reliability and large storage capacity for the specific rainwater supply reliability, slightly higher differences were observed between simulated and predicted values. The other three sub-regions have the same tendency.
The practical use of the aforementioned dimensionless curve in DRWHS design can be summarized as follows:
Select the sub-region and determine R.
Estimate Dawd and A.
Select the rainwater supply reliability.
Estimate the storage capacity from the dimensionless curve.
An example of the application of steps 1 to 4 in sub-region I is as follows. Set Dawd = 100 m3, R = 1769.1 mm, and A = 100 m2. The storage capacities (S) of the DRWHS are then 31.1 m3, 11.3 m3, 7.7 m3, 6.0 m3, and 0.38 m3 for the rainwater supply reliabilities of 95%, 90%, 80%, 70%, and 50%, respectively.
Figure 7.
Comparison between simulated (from water balance) and predicted (from dimensionless curves) storage capacities for selected rainwater supply reliabilities in sub-region I.
Figure 7.
Comparison between simulated (from water balance) and predicted (from dimensionless curves) storage capacities for selected rainwater supply reliabilities in sub-region I.
5.4. Nomograms for Designing DRWHS
A nomogram provides a direct solution to all types of DRWHS design solutions.
A nomogram based on the dimensionless curves can be constructed for each sub-region for any rainwater supply reliability.
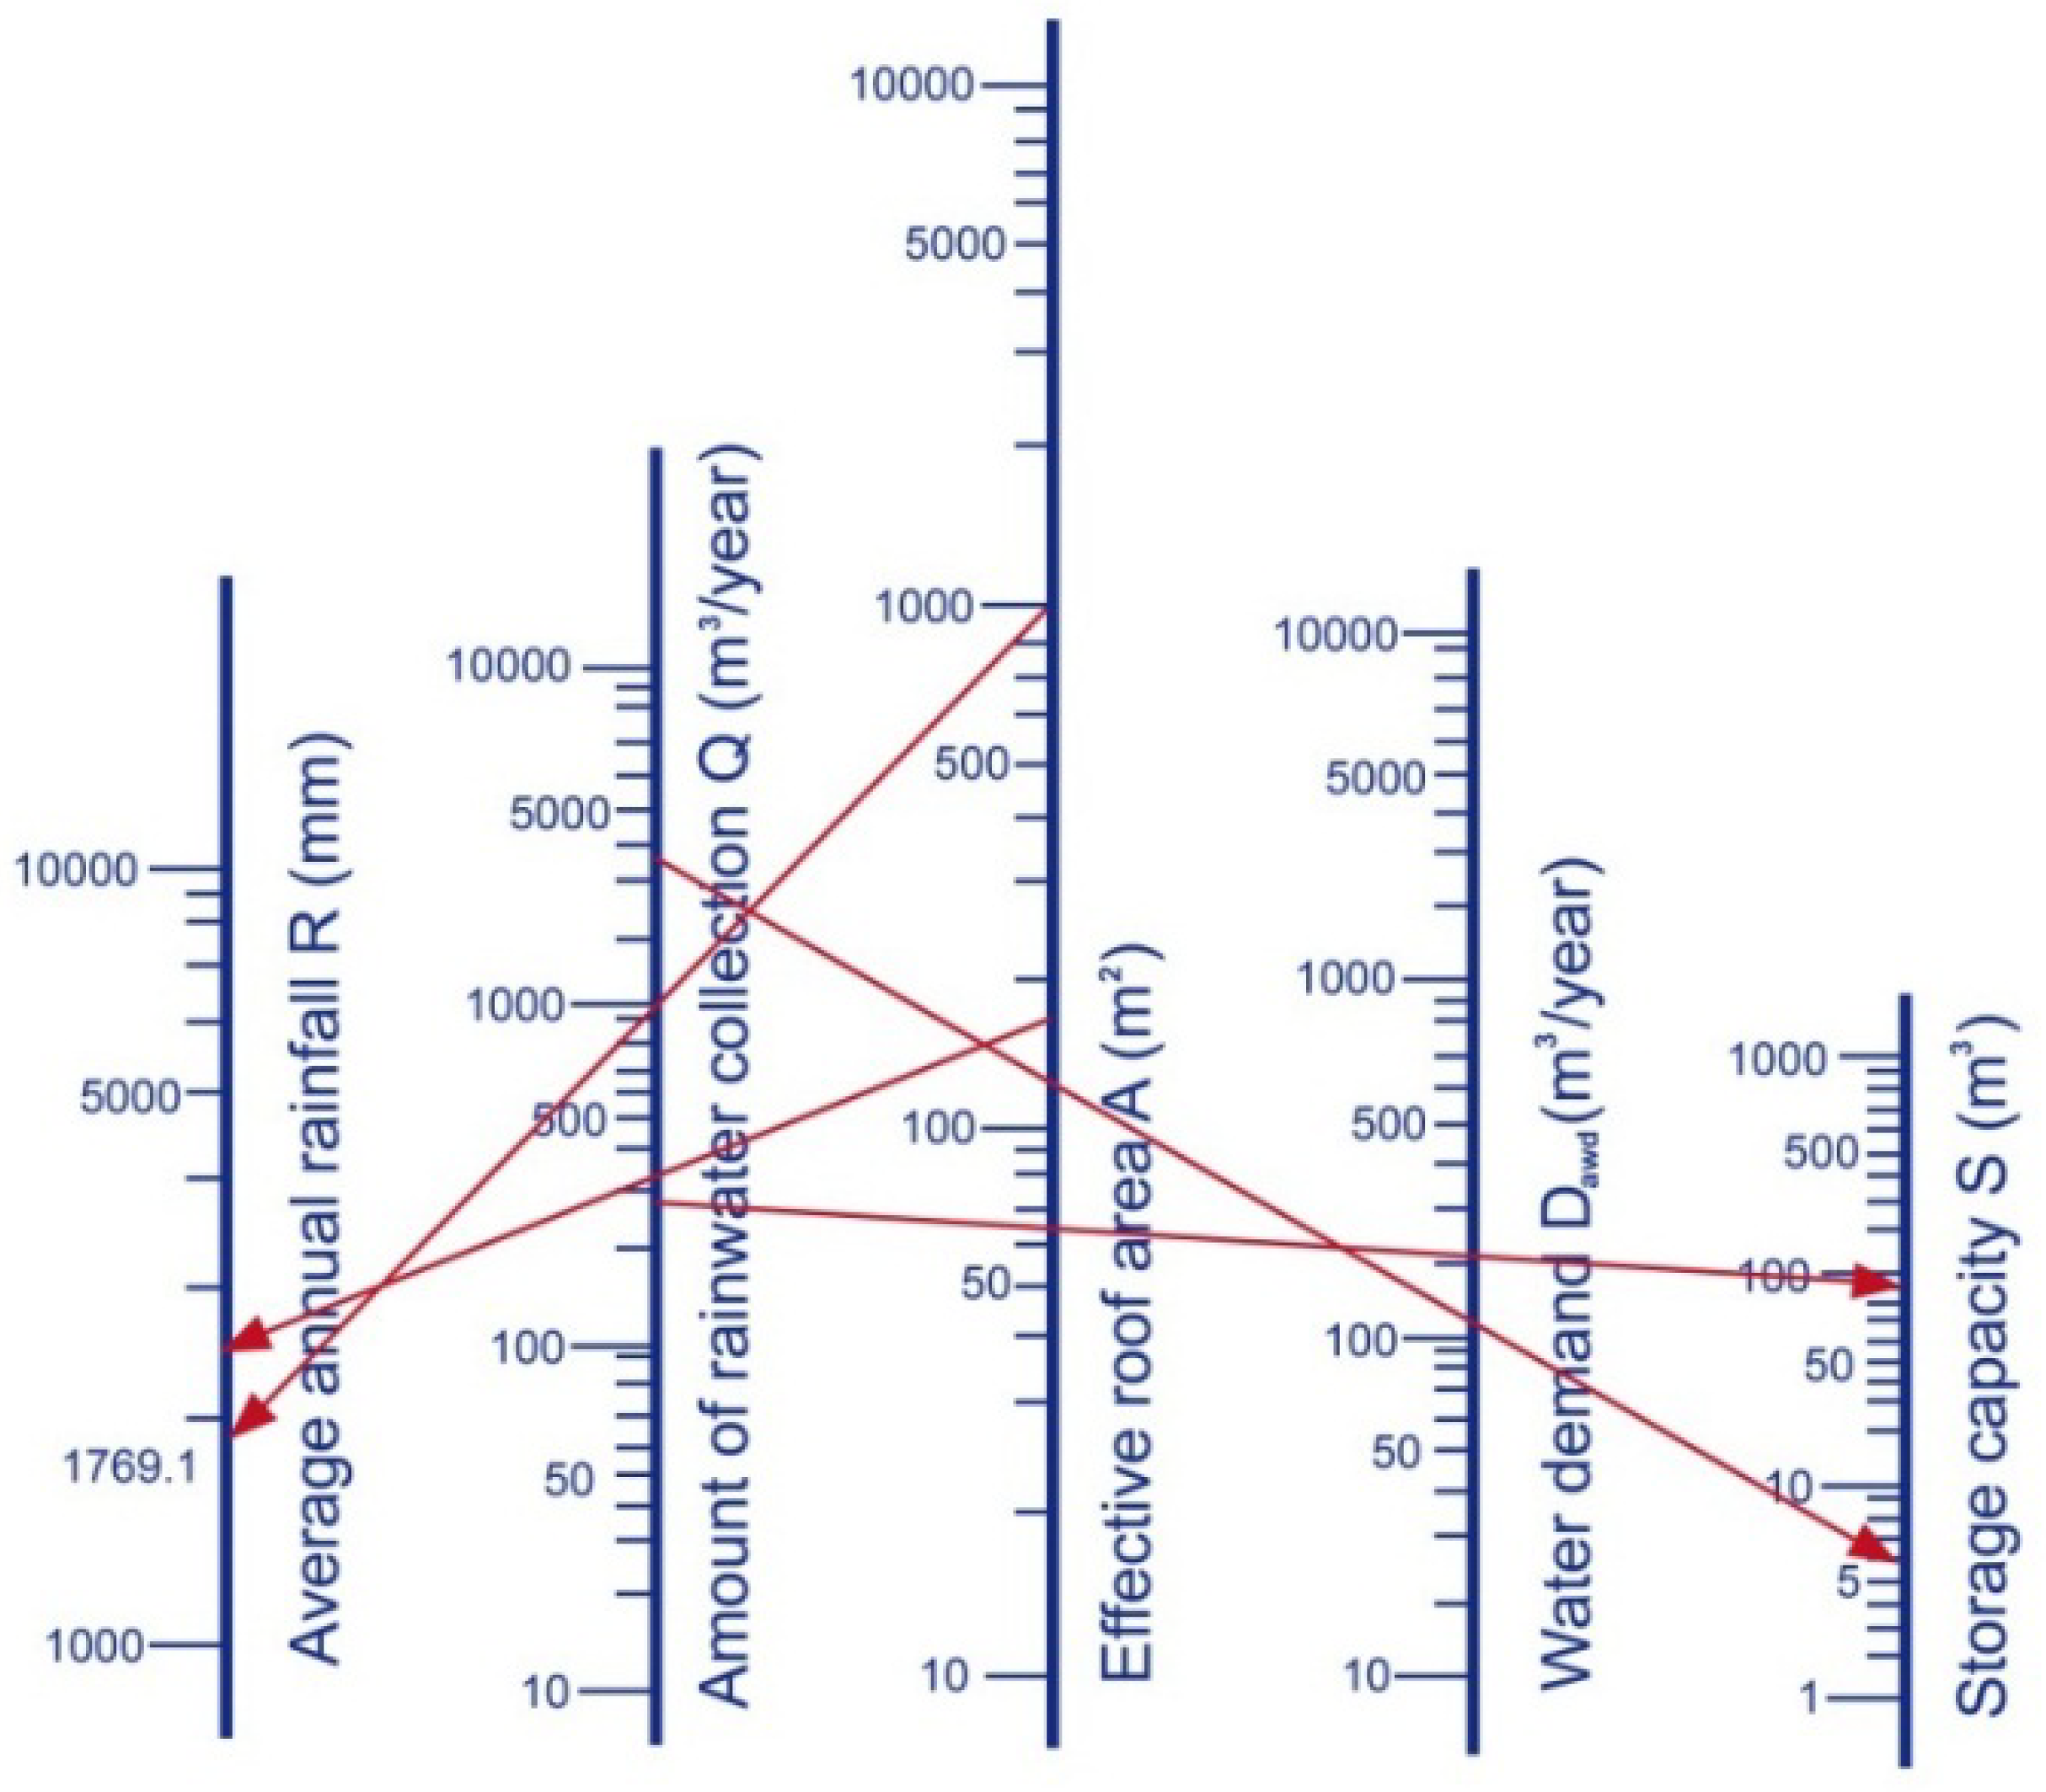
Figure 8 shows the nomogram for sub-region I for
Rv = 95% and for the average annual rainfall, amount of rainwater collected
effective roof area, annual water demand, and storage capacity scale.
Figure 8.
Nomogram for designing a domestic rainwater harvesting system (DRWHS) at 95% of rainwater supply reliability for sub-regionⅠ.
Figure 8.
Nomogram for designing a domestic rainwater harvesting system (DRWHS) at 95% of rainwater supply reliability for sub-regionⅠ.
The practical use of the nomogram to determine the storage capacity of the DRWHS in sub-region I, where
R = 1769.1 mm,
D = 100 m
3, and
A = 100 m
2, can be described by the following steps:
A point is marked at 1769.1 on the average annual rainfall scale.
Another point is marked at 100 on the effective roof area scale.
The straight line joining these two points meets the amount of rainwater collected scale at 176.9.
The straight line joining the amount of rainwater collected scale at 176.9 and the annual water demand scale at 100 meet the storage capacity scale at 31.1 m3.
If A increases to 1000 m2, then S decreases to 1.3 m3. The nomograms developed in this study can be used as an easy-to-use tool by architects for designing DRWHSs.
5.5. Comparison between Storage Capacity Values Obtained from Dimensionless Curves and Those Derived from the Method Adopted in the Green Building Evaluation Manual
In 2009, the Water Resources Agency of the Ministry of Economic Affairs, Taiwan [
45] imposed a new water resource development regulation, which included the DRWHS as an alternative water resource for domestic water supply, and listed it in the Water Law. The Green Building policy was implemented, and the DRWHS has been included as a water resource indicator for green buildings since 2003 [
46]. The policy requires all new buildings with a total floor area greater than 10,000 m
2 to install a DRWHS that provides at least 5% of the total water demand of the building. In 2007, a method to estimate the storage capacity of a DRWHS based on the administrative district in which the building was located was developed. The method can be summarized as follows:
The rainwater collected (Wr) is determined using the daily precipitation (Rd), effective roof area (A), and daily rainfall probability (P): Wr (m3) = A (m2) × Rd (mm/day) × P.
Both Rd and P values can be obtained from the Green Building Evaluation Manual (GBEM)—Basic Version based on the administrative district.
Designed water demand (Wd) = ∑Ri, where Ri is the ith water use, mainly for toilet flushing, cleaning, and irrigation.
Determine the amount of rainwater used in place of the main water supply (Ws):
If Wr ≤ Wd then Ws = Wr.
If Wr > Wd then Ws = Wd.
The term S is equal to or greater than the value determined by the product of the number of days for which rainwater has been stored (Ns) and Ws. S ≥ Ns × Ws. The term Ns can be obtained from the GBEM—Basic Version based on the administrative district.
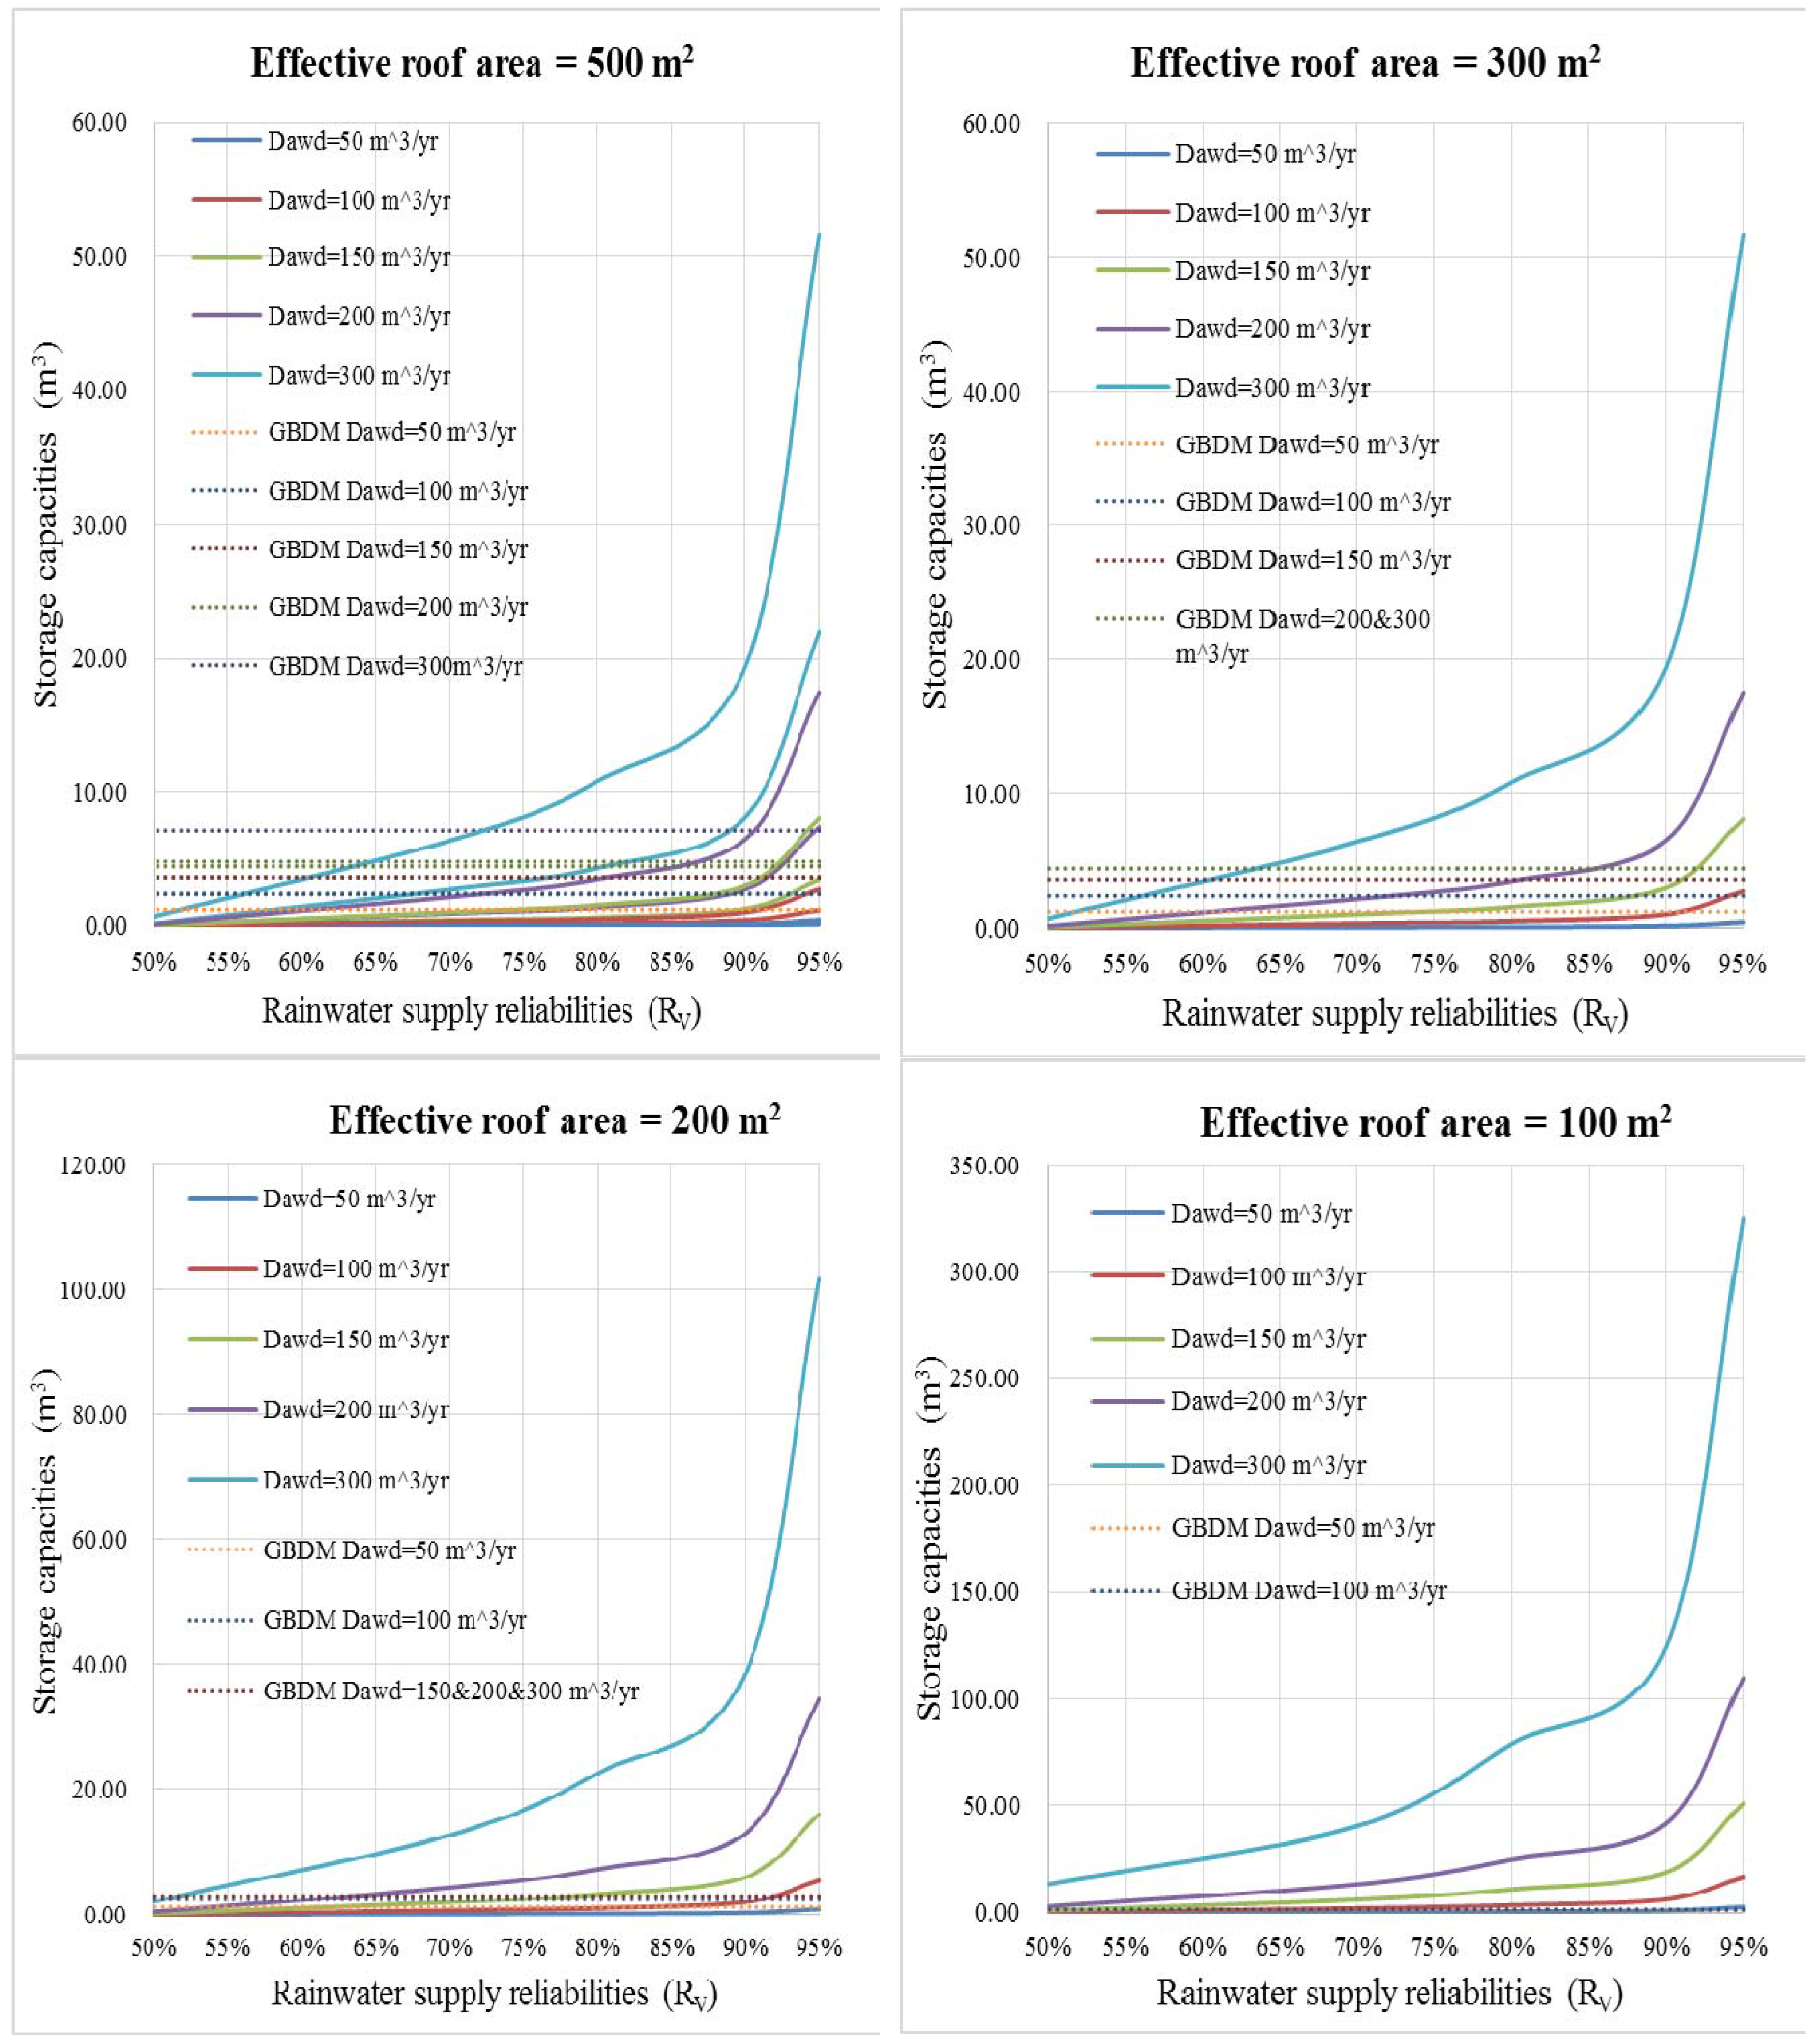
Figure 9 shows a comparison between the storage capacity values estimated using the aforementioned method and those predicted by dimensionless curves for the five rainwater supply reliabilities and selected ranges of the water demand (50–300 m
3/year) and effective roof area (100–500 m
2) in the sub-region I. The figure indicates that storage capacities estimated using the GBEM method have no relationship with the system reliability and meet the designed water demand with 100% reliability. It is impossible to implement engineering projects designed with 100% reliability and the costs involved are also high. For a rainwater supply reliability of 95%, storage capacities estimated using the GBEM method were highly underestimated for all water demand values compared with values predicted by the dimensionless curves. A possible reason is that the daily precipitation, daily rainfall probability, and number of days for which rainwater has been stored do not reflect the serial correlation and seasonal variations in rainfall data (discussed in the introduction). In addition, in cases with small effective roof areas, the storage capacity is not sensitive to changes in the water demand. The reason is that rainwater collected is typically less than the designed water demand, and the rainwater collected is treated as the amount of rainwater used in place of the main water supply for estimating the storage capacity, which is not reasonable. In general, the storage capacity increases with the designed water demand for a specific effective roof area and a specific rainwater supply reliability. In the contrast, the storage capacity increases considerably more when the designed water demand increases for cases with a large effective roof area. To elucidate the limitations of the GBEM method, envelope curves between the maximum storage capacity for different water demands and the effective roof area for the four sub-regions are plotted in
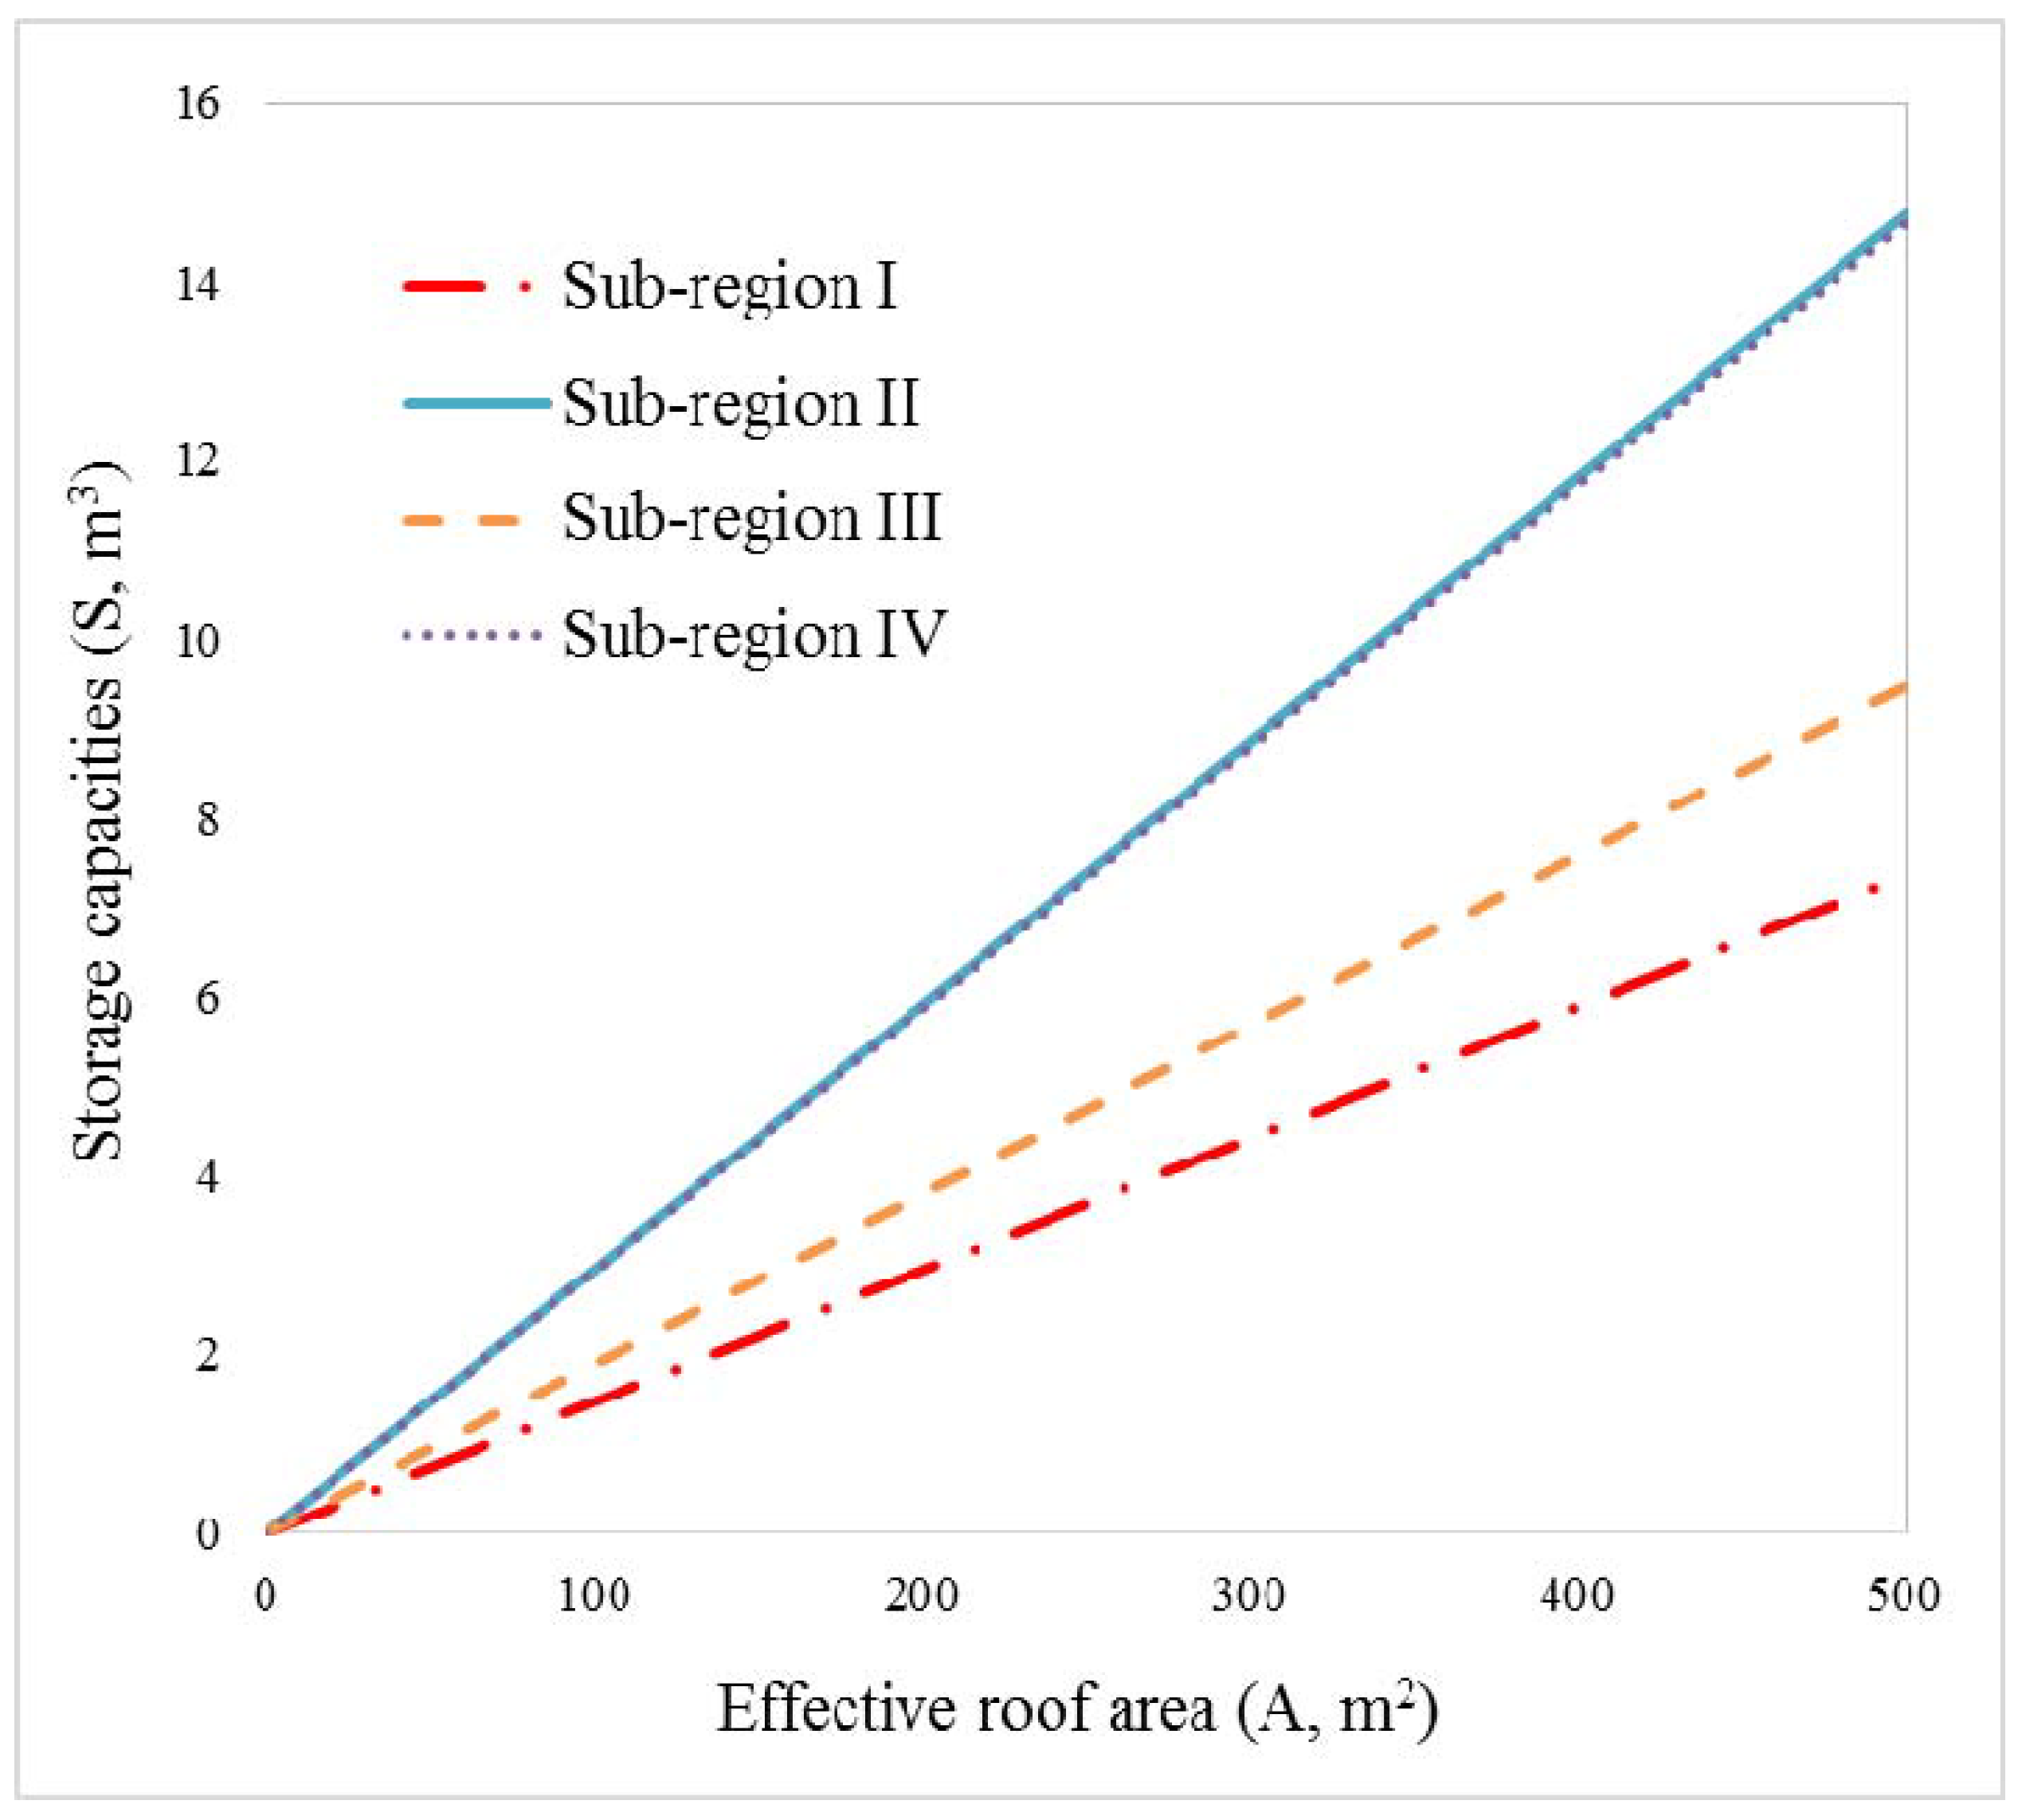
Figure 10. It is evident that that there is a limit to the storage capacity for any selected effective roof area in the four sub-regions. The storage capacity initially increases with the water demand and then becomes constant for any given effective roof area. The limit is imposed when the rainwater collected equals the designed water demand. If the designed water demand increases further, it will become larger than the amount of rainwater collected. Hence, the storage capacity is determined by the rainwater collected and becomes constant.
Figure 9.
Comparison between predicted (from dimensionless curves) and calculated (from Green Building Design Manual) storage capacities for five rainwater supply reliabilities in sub-region I.
Figure 9.
Comparison between predicted (from dimensionless curves) and calculated (from Green Building Design Manual) storage capacities for five rainwater supply reliabilities in sub-region I.
Figure 10.
Envelope curves of max. storage capacity estimated by the Green Building Design Manual for various effective roof areas for four sub-regions.
Figure 10.
Envelope curves of max. storage capacity estimated by the Green Building Design Manual for various effective roof areas for four sub-regions.
From the aforementioned analysis, it is clear that storage capacities estimated using the GBEM method are highly underestimated compared with those estimated using the method developed in this study. For cases with a large effective roof area and water demand, the difference between these two values decreases. Storage capacity for a given effective roof area is limited in the GBEM method. Therefore, the method of estimating storage capacity adopted in the Green Building Evaluation Manual should be examined and revised.
6. Conclusions
To design a DRWHS, detailed rainfall information is required. In the majority of catchments, particularly in remote areas, such information is not always available. Hence, storage sizing is difficult for DRWHS design. To overcome the difficulties faced in designing a DRWHS without rainfall data, with incomplete rainfall data, and with variable rainfall data, the authors have extended the methodology to determine storage tanks sizes in situations where rainfall data are unavailable by regionalizing the study area. Then a regional scale analysis to design storage tanks for DRWH systems was developed in this paper. In the current study, dimensionless graphs for DRWHS design at a regional level in Northern Taiwan were developed.
Northern Taiwan was firstly divided into four sub-regions based on homogeneity of rainfall and political boundary by using the two-step cluster analysis method. Average annual 10-day rainfall distribution charts for the four sub-regions showed considerable differences in the rainfall amount and rainfall distribution, which indicates the necessity of sub-region cluster analysis. The average annual rainfall and coefficient of variation in sub-region I are 1815.0 mm and 0.49, respectively; the values are 3524.5 mm and 0.58 in sub-region II, respectively; the values are 2302 mm and 0.61 in Sub-region III, respectively; and the values amount to 3564.6 mm and 0.52 in sub-region IV, respectively.
The method then identified the relationship between rainwater supply and storage capacity for the DRWHS, based on production theory if other parameters are constant. A dimensionless curve based on two dimensionless parameters, storage fraction and demand fraction, was obtained, allowing the consideration of practical ranges for water demand, storage capacity, and effective roof area in the four sub-regions of Northern Taiwan.
A method for storage water balance simulation at all rainfall stations in each sub-region was set up. 58 rainfall stations characterized by rainfall series with at least 50-year records in the entire region were selected in this study. Dimensionless curves based on the two dimensionless parameters were obtained for each sub-region for the rainwater supply reliabilities of 50%, 70%, 80%, 90%, and 95%. Storage capacities estimated from dimensionless curves demonstrated strong fits with values from the simulation method for the five rainwater supply reliabilities in each sub-region. Easy-to-use nomogram based on dimensionless curve is currently under construction for designing DRWHSs for a rainwater supply reliability of 95% in the sub-region I. Furthermore, storage capacities obtained from dimensionless curves for the five rainwater supply reliabilities were compared with the values obtained using the method adopted by the GBEM method for selected ranges of the effective roof area and water demand in the sub-region I. The results showed that storage capacities obtained from dimensionless curves were higher than the values obtained using the GBEM method under most conditions. The method adopted in the GBEM lacks the concept of system reliability and limits the storage capacity for a given effective roof area, and it should be examined and revised in the future.
This study elucidates a general framework for obtaining region-based dimensionless design graphs and can be used for all regions. The regression coefficients used were based on results of rainfall data simulations in specific regions. The results obtained are valid for a constant daily water demand. For considering variable water demand, selected water demand patterns are required to simulate the water balance.


