1. Introduction
In recent decades, streamflow decline has been observed in many rivers throughout the world. For instance, Banasik
et al. [
1,
2] reported a decreasing trend of runoff in the Zagożdżonka catchment in central Poland; Pekarova
et al. [
3] showed the long-term trends and runoff fluctuations of many rivers in Europe; In China, many large rivers have experienced a strong decreasing trend in discharge (e.g., the Yellow River in Central China [
4], the Tarim River in West China [
5], and the Songhua River in Northeast China [
6]). Factors that could have affected the change include both climatic variation (e.g., changes in precipitation and temperature) and anthropogenic activities (e.g., land use change, dam construction, and river engineering). There has been an ongoing debate as to which of the two factors has played a greater role in the changes of discharge from the river basins.
A number of studies have been conducted to separate the impact of climate variation and human activities on river discharge [
7,
8,
9]. Using regression techniques Ye
et al. [
10] and Tian
et al. [
11] investigated the effects of climate variability and human activities on the long-term change in runoff of the Lena River Basin and Hutuo River Basin in China; however, a clear conclusion on the magnitude of each of the two factors could not be drawn due to the limitation of the analytical method. Using hydrologic simulation other researchers [
12,
13,
14] reconstructed long-term runoff time series that were then used for separation of the climate variation and human activity effects on river basin runoff. In the recent decade, Dooge
et al. [
15] and Milly and Dunne [
16] introduced a hydrologic sensitivity analysis approach to separate the effect of climate change on runoff from that of human activities by isolating the precipitation and potential evapotranspiration effects. The approach found wide applications for various climatic regions in the world [
17,
18,
19,
20,
21,
22].
For a given river basin, runoff can exhibit spurious changes [
23]. Determining a spurious change-point in long-term runoff records is therefore necessary for assessing individual contribution of climate variation and human activities on basin runoff. This can be done using statistical approaches (e.g., non-parametric tests and time series analysis) combined with graphical methods (e.g., double mass curves, single mass curves and flow duration curves) [
24,
25]. In their study on assessing the impacts of climate variation and human activities on river runoff, for instance, Zhao
et al. [
21] identified a spurious change point and defined the period before the change point as a natural period (
i.e., with little or no human disturbance) to estimate the effect of climate variation on runoff.
The Songhua River Basin (SRB) is one of China’s most important commodity grain production bases. It is also the largest inland wetland region with diverse freshwater marshes, fens, bogs, peat swamps, and wet meadows. Stream and river discharge in the SRB are the mostly used water sources for agricultural irrigation, industry, and public supplies. The surface water source is also crucial for the large area of wetlands in the region that support diverse ecosystems and many endangered wildlife species including six of the world’s fifteen crane species. In the past half century, climate in the SRB has become warmer and drier [
6] and a large area of wetlands has degraded while farmland has been increasing rapidly within the river basin [
26]. At the same time large-scale river engineering projects (primarily, construction of dams and ditches) were completed in the basin to meet the increased water use demand for agriculture, industry, and public [
27]. A recent study [
6] found a decreasing trend of discharge in all major tributaries of the SRB over the past half century. The reduction in discharge has raised the concern over wetland shrinkage and biodiversity loss in the river basin. In order to develop best management strategies for effective utilization and protection of the limited water resources in the SRB, it is of both scientific interest and practical relevance for integrated river basin management to gain insights into individual contribution of the climate variation and human activities to the discharge decline from the basin. There are several studies addressing the change and its influencing factors in the SRB [
28,
29], but these studies neglected land use effects across the SRB.
Land use change has been found globally to be a major factor affecting river basin runoff. Up to now, to the best of our knowledge, detailed analysis on the long-term change in runoff of the SRB and the individual contribution of climatic variation and human activities have not been reported. The objectives of this study were to: (1) assess long-term runoff change in five major tributary basins of the SRB; (2) detect critical change points of annual runoff in these basins; and (3) quantitatively evaluate the individual contribution of climate variation and human activities to the runoff change across the SRB.
2. Study Area
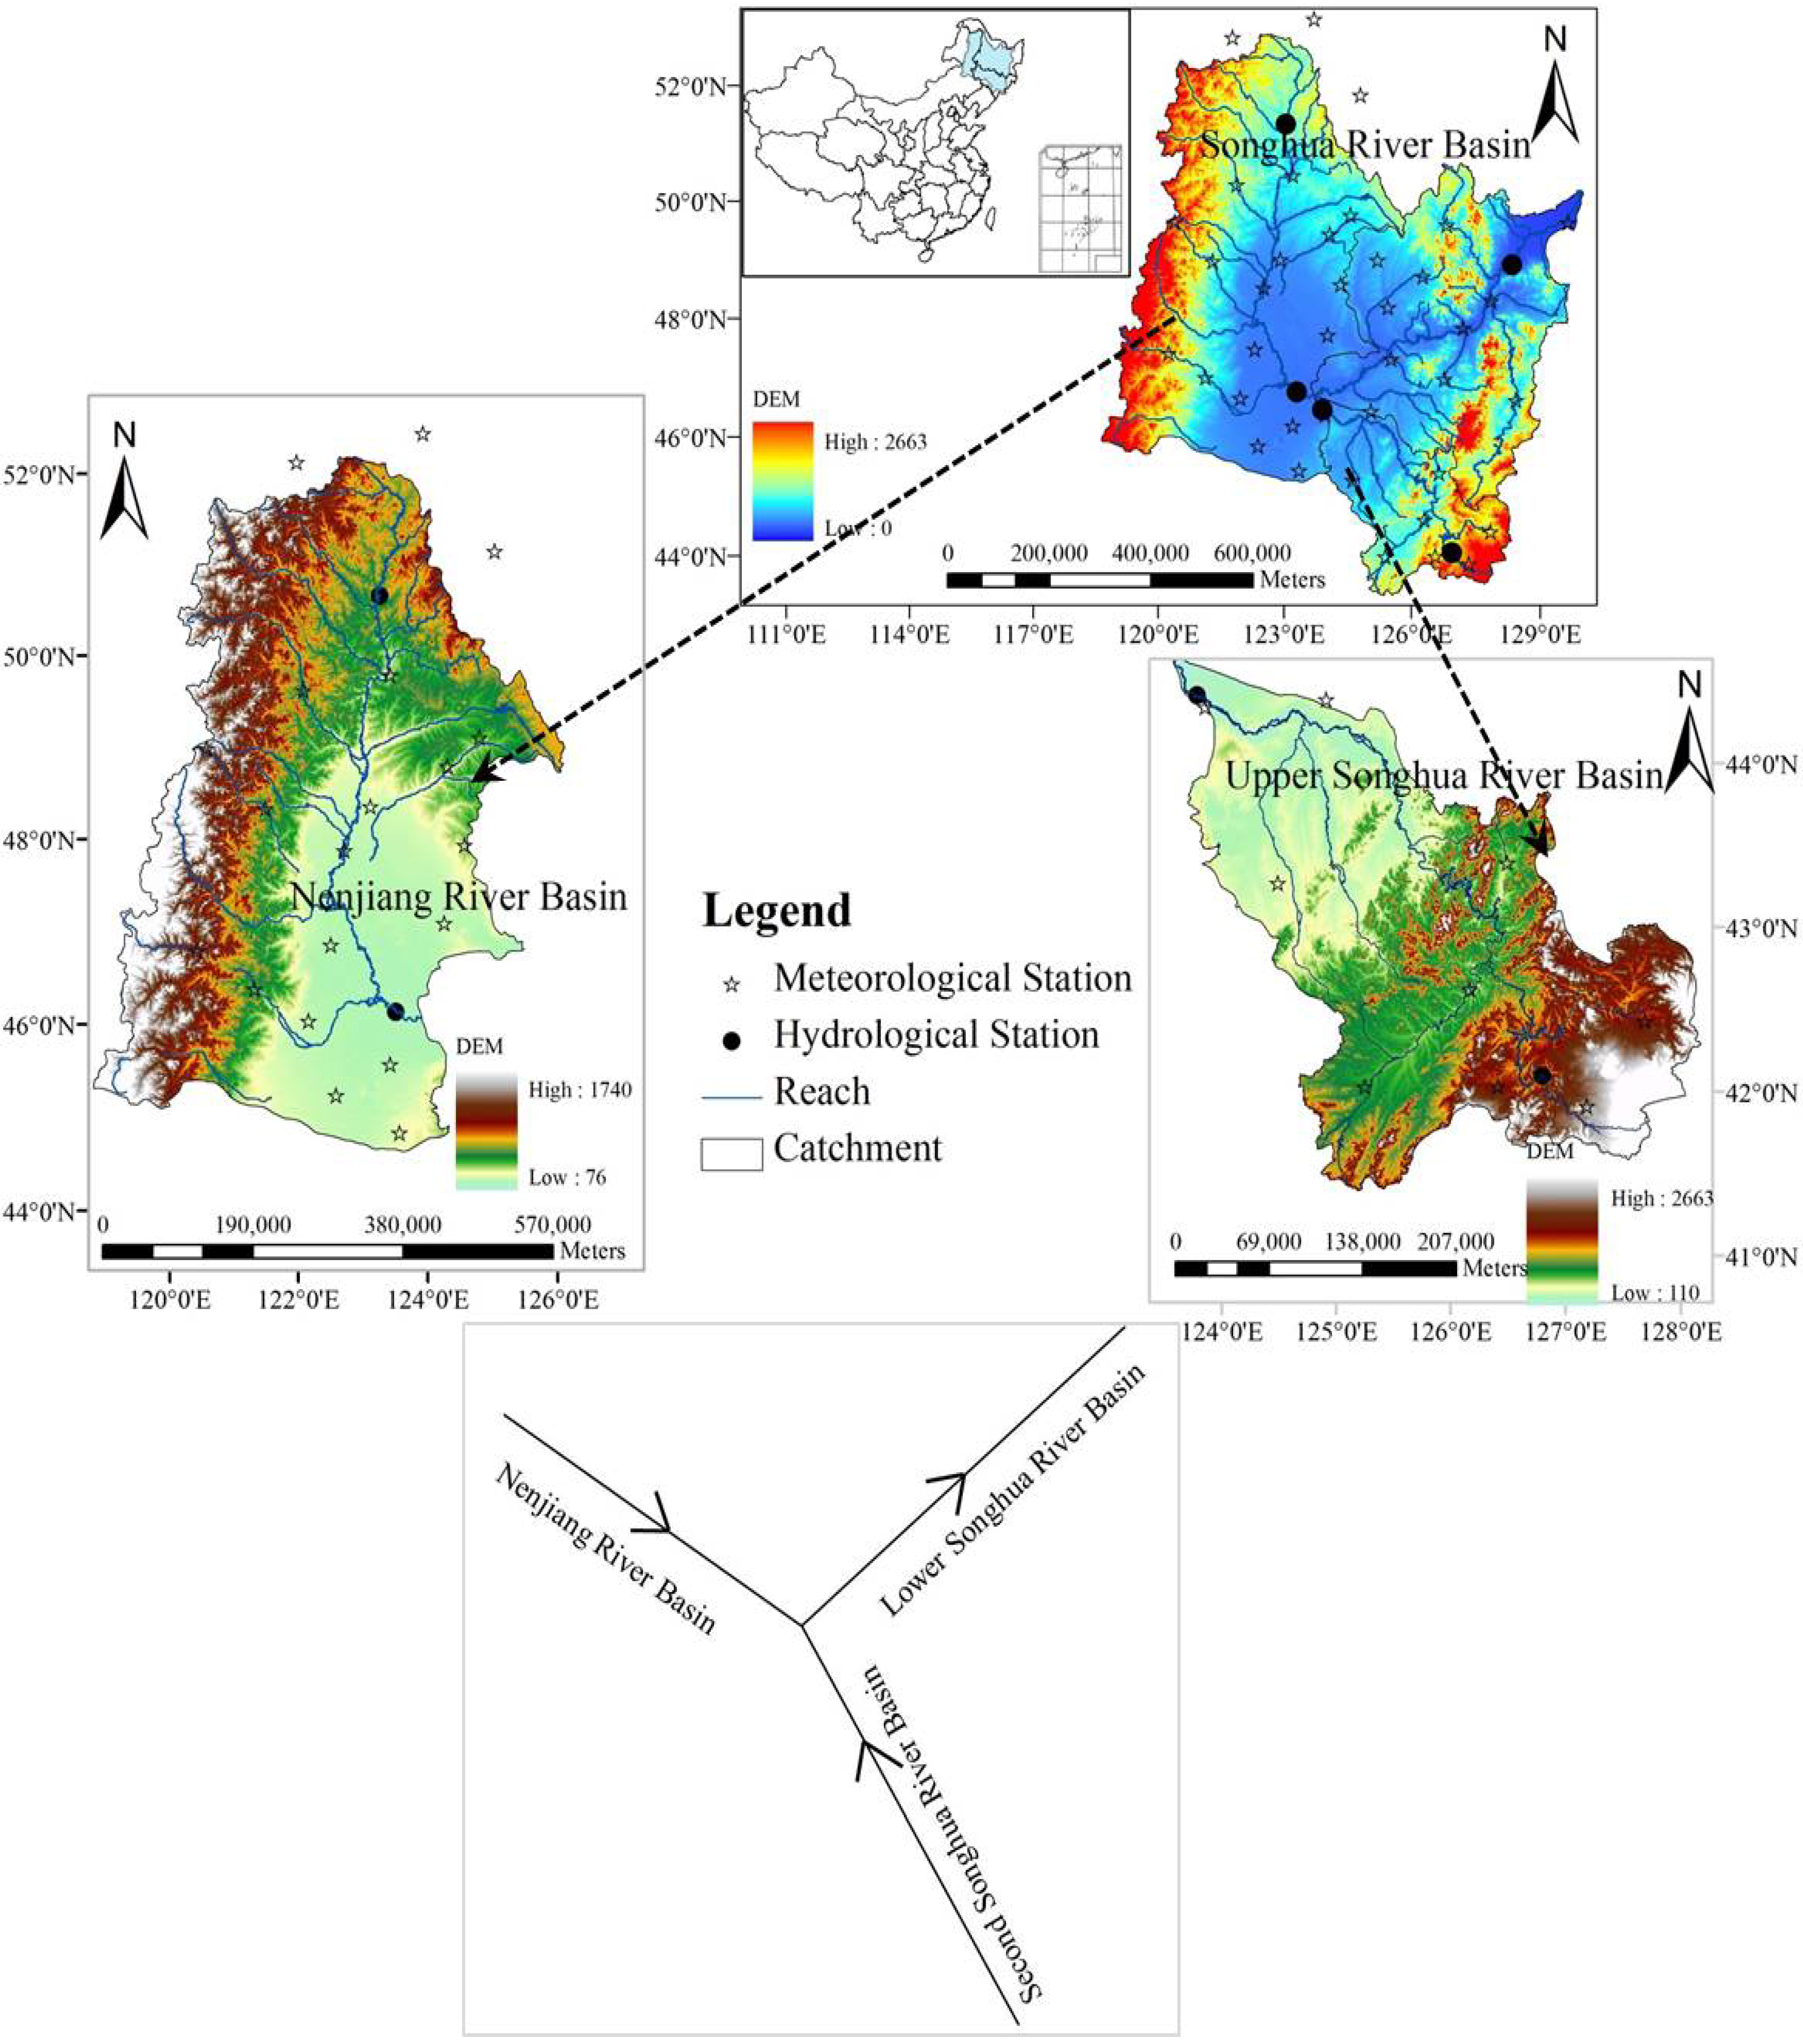
The Songhua River Basin is located in the far northeast of China stretching longitudinally from 119°52' E to 132°31' E and latitudinally from 41°42' N to 51°38' N (
Figure 1). It is one of China’s seven major river basins, covering a total land area of 556,800 km
2. The river basin comprises a large portion of Heilongjiang Province, Jilin Province, and northeastern Inner Mongolia Autonomous Region.
Two major tributaries drain the SRB: the Nenjian River (the northern source) and the Second Songhua River (the southern source). The Nenjiang River tributary originates from the Yilehuli Mountain in the Great Khingan Mountains, traveling 1370 km from northwest to southeast and draining 297,000 km2 land. The Second Songhua River originates from Tianchi Lake in the Changbai Mountain and flows 958 km from southeast to northwest draining a land area of 73,400 km2. With gentle slope and wide river channel, the Lower Songhua River carries the combined flow from the Nenjiang and Second Songhua Rivers and flows 939 km northeastward before entering the Amur River. The elevation of the SRB varies from 50 to 2700 m above sea level, with an extensive floodplain—the Songnen Plain—in the middle of the basin after the confluence of the Nenjian and Second Songhua Rivers.
Climatic and hydrologic conditions of the SRB are complex because of the large geographical extent and elevation difference. Long-term mean annual precipitation is about 455 mm in the Nenjiang River Basin (NRB), 668 mm in the Second Songhua River Basin (SSRB), and 563 mm in the entire SRB [
6]. Monthly average temperature has been reported to be 3.2 °C, 4.2 °C and 3.5 °C, respectively, in the NRB, SSRB and the entire SRB [
6]. Long-term average annual potential evapotranspiration (PET) is estimated for 877 mm in the SRB, fluctuating from 839 to 945 mm.
Figure 1.
The Songhua River Basin and its two tributary basins (the Nenjiang River Basin and the Second Songhua River Basin) in northeast China and the gauge (dots) and meteorological (stars) stations used in this study.
Figure 1.
The Songhua River Basin and its two tributary basins (the Nenjiang River Basin and the Second Songhua River Basin) in northeast China and the gauge (dots) and meteorological (stars) stations used in this study.
Besides being one of the major grain production bases in China, the SRB is also China’s largest inland wetland region with many nature preserves and national parks. The Songhua River is a major source for industry, agriculture, and public drinking water supplies in Northeast China. Therefore, the analysis of the runoff variations and its sensitivity to climate variation and human activities is of great importance.
3. Available Data and Methods
3.1. Data Collection
Meteorological data were collected from 40 national weather stations relatively evenly distributed across the Songhua River Basin (
Figure 1). Monthly data were used to calculate potential evapotranspiration using the Penman-Monteith equation recommended by the Food and Agriculture Organization (FAO) [
30]. The average precipitation and PET for each sub river basin were estimated using the Thiessen Polygon method.
Monthly discharge records for the period from 1960 to 2009 were obtained from five gauge stations (
Figure 1) that represent the total discharge of the five drainage areas (
Table 1). Selection of the gauge stations was intended to determine runoff changes in (1) the upper river basin areas of the two tributaries of the Songhua River—the Nenjiang and Second Songhua Rivers; (2) the lower river basin areas of the two tributaries; and (3) the lower Songhua River Basin. Specifically, discharge at the Shihuiyao and Gaolichengzi stations were used to represent flows from the Upper NRB (UNRB) and Upper SSRB (USSRB), respectively; the difference between discharge at the Dalai and Shihuiyao stations was used as the discharge from the Lower NRB (LNRB); the difference in discharge between the Fuyu and Gaolichengzi stations was used as the discharge from the Lower SSRB (LSSRB); the difference in discharge between the Jiamusi and the sum of discharge at the Dalai and Fuyu stations was used to represent flows from the Lower SRB (LSRB). Monthly discharge data from the stations were used to compute monthly flow volume for each of the five sub river basins. The flow volumes were then divided by the representing drainage areas to obtain monthly runoff in depth.
Table 1.
Location, drainage area, and representative gauge stations of the Upper Nenjiang River Basin (UNRB), Lower Nenjiang River Basin (LNRB), Upper Second Songhua River Basin (USSRB), Lower Second Songhua River Basin (LSSRB), and Lower Songhua River Basin (LSRB) in Northeast China.
Table 1.
Location, drainage area, and representative gauge stations of the Upper Nenjiang River Basin (UNRB), Lower Nenjiang River Basin (LNRB), Upper Second Songhua River Basin (USSRB), Lower Second Songhua River Basin (LSSRB), and Lower Songhua River Basin (LSRB) in Northeast China.
| Basin | Gauge station | Longitude (° E) | Latitude (° N) | Drainage Area (km2) |
|---|
| UNRB | Shihuiyao | 125°19'12'' | 50°03'00'' | 17,205 |
| LNRB | Dalai | 124°16'12'' | 45°33'00'' | 204,510 |
| USSRB | Gaolichengzi | 127°13'48'' | 42°21'00'' | 4,728 |
| LSSRB | Fuyu | 124°49'12'' | 45°10'12'' | 67,055 |
| LSRB | Jimusi | 130°19'12'' | 46°48'00'' | 234,799 |
Furthermore, we collected land use/land cover (LULC) maps for 1975, 1986, 1996 and 2005. Changes in nine LULC categories, including paddy farmland, dry farmland, forest, grassland, open water, reservoir & pond, residential & industry land, bared land, and wetland, were quantified for NRB, SSRB and LSRB.
3.2. Trend Analysis
The Mann-Kendall test [
31,
32] was applied to analyze the trend of temporal variations of climatic parameters and river basin runoff. In the Mann-Kendall test, the null hypothesis
H0 states that
x1, … ,
xn are samples of
n independent and identically distributed random variables with no seasonal change. The alternative hypothesis
H1 for a two-sided test defines the distributions of
xk and
xi as non-identical for all
k,
j ≤
n; with
k ≠
j. The test statistic
S is given as:
If the data set is independent and identically distributed, then the mean of
S will be zero and the variance of
S will be:
where
n is the number of data points;
t is the extend of a given time;
m is the number of tied groups; and
tj is the number of data points in the
j-th group. A tied group is a set of data points that have the same value. A normalized test statistic
Z can be computed based on
S as follows:
When the significance levels are set at 0.01, 0.05 and 0.1, |Zα| is 2.58, 1.96, and 1.65, respectively. At certain significance level, if |Z| > |Zα|, the null hypothesis H0 is rejected. In other words, the trend is significant at the set level of significance. Otherwise, no significant trend exists.
The Mann-Kendall test assumes that the time series data are independent [
33,
34]. However, certain hydrological time series may frequently display statistically significant serial correlation. Therefore, in order to eliminate the influence of serial correlation, “pre-whitening” was proposed by Von Storch [
35] to remove the lag-1 serial correlation (
r1) from the time series.
To determine whether the observed data set is serially correlated, the significance of the lag-1 serial correlation (
r1) should be tested at the 0.10 significance level.
r1 is calculated using the following formula:
If
, the time series is assumed to be independent at the 0.10 significance level and can be subjected to the original Mann-Kendall test. Otherwise, the effect of serial correlation should be removed from the time series by pre-whitening prior to applying the Mann-Kendall test, and the Mann-Kendall test was then used to detect a trend in the residual series. The new time series was obtained as follows:
The
r1 value of this new time data set was calculated and used to determine the residual series as:
The value of
β ×
i was added again to the residual data set as follows:
The yi series was subjected to trend analysis.
3.3. Change-Point Detection
A moving
t-test was conducted to analyze the change point of the hydrometeorological series. In moving
t-test, an
n-sample series was divided by random variables into sub-sequences
x1 and
x2, whose data length was
n1 and
n2, respectively. The sub-sequences have their own mean value of
x1 and
x2, and variance of
s1 and
s2. The statistic is defined as:
where the statistic
t obeys the distribution of
t (
n1 +
n2 − 2). Given the significance level of
α, the null hypothesis of no difference will be rejected if |
t0| >
tα/2, indicating a significant difference between
x1 and
x2.
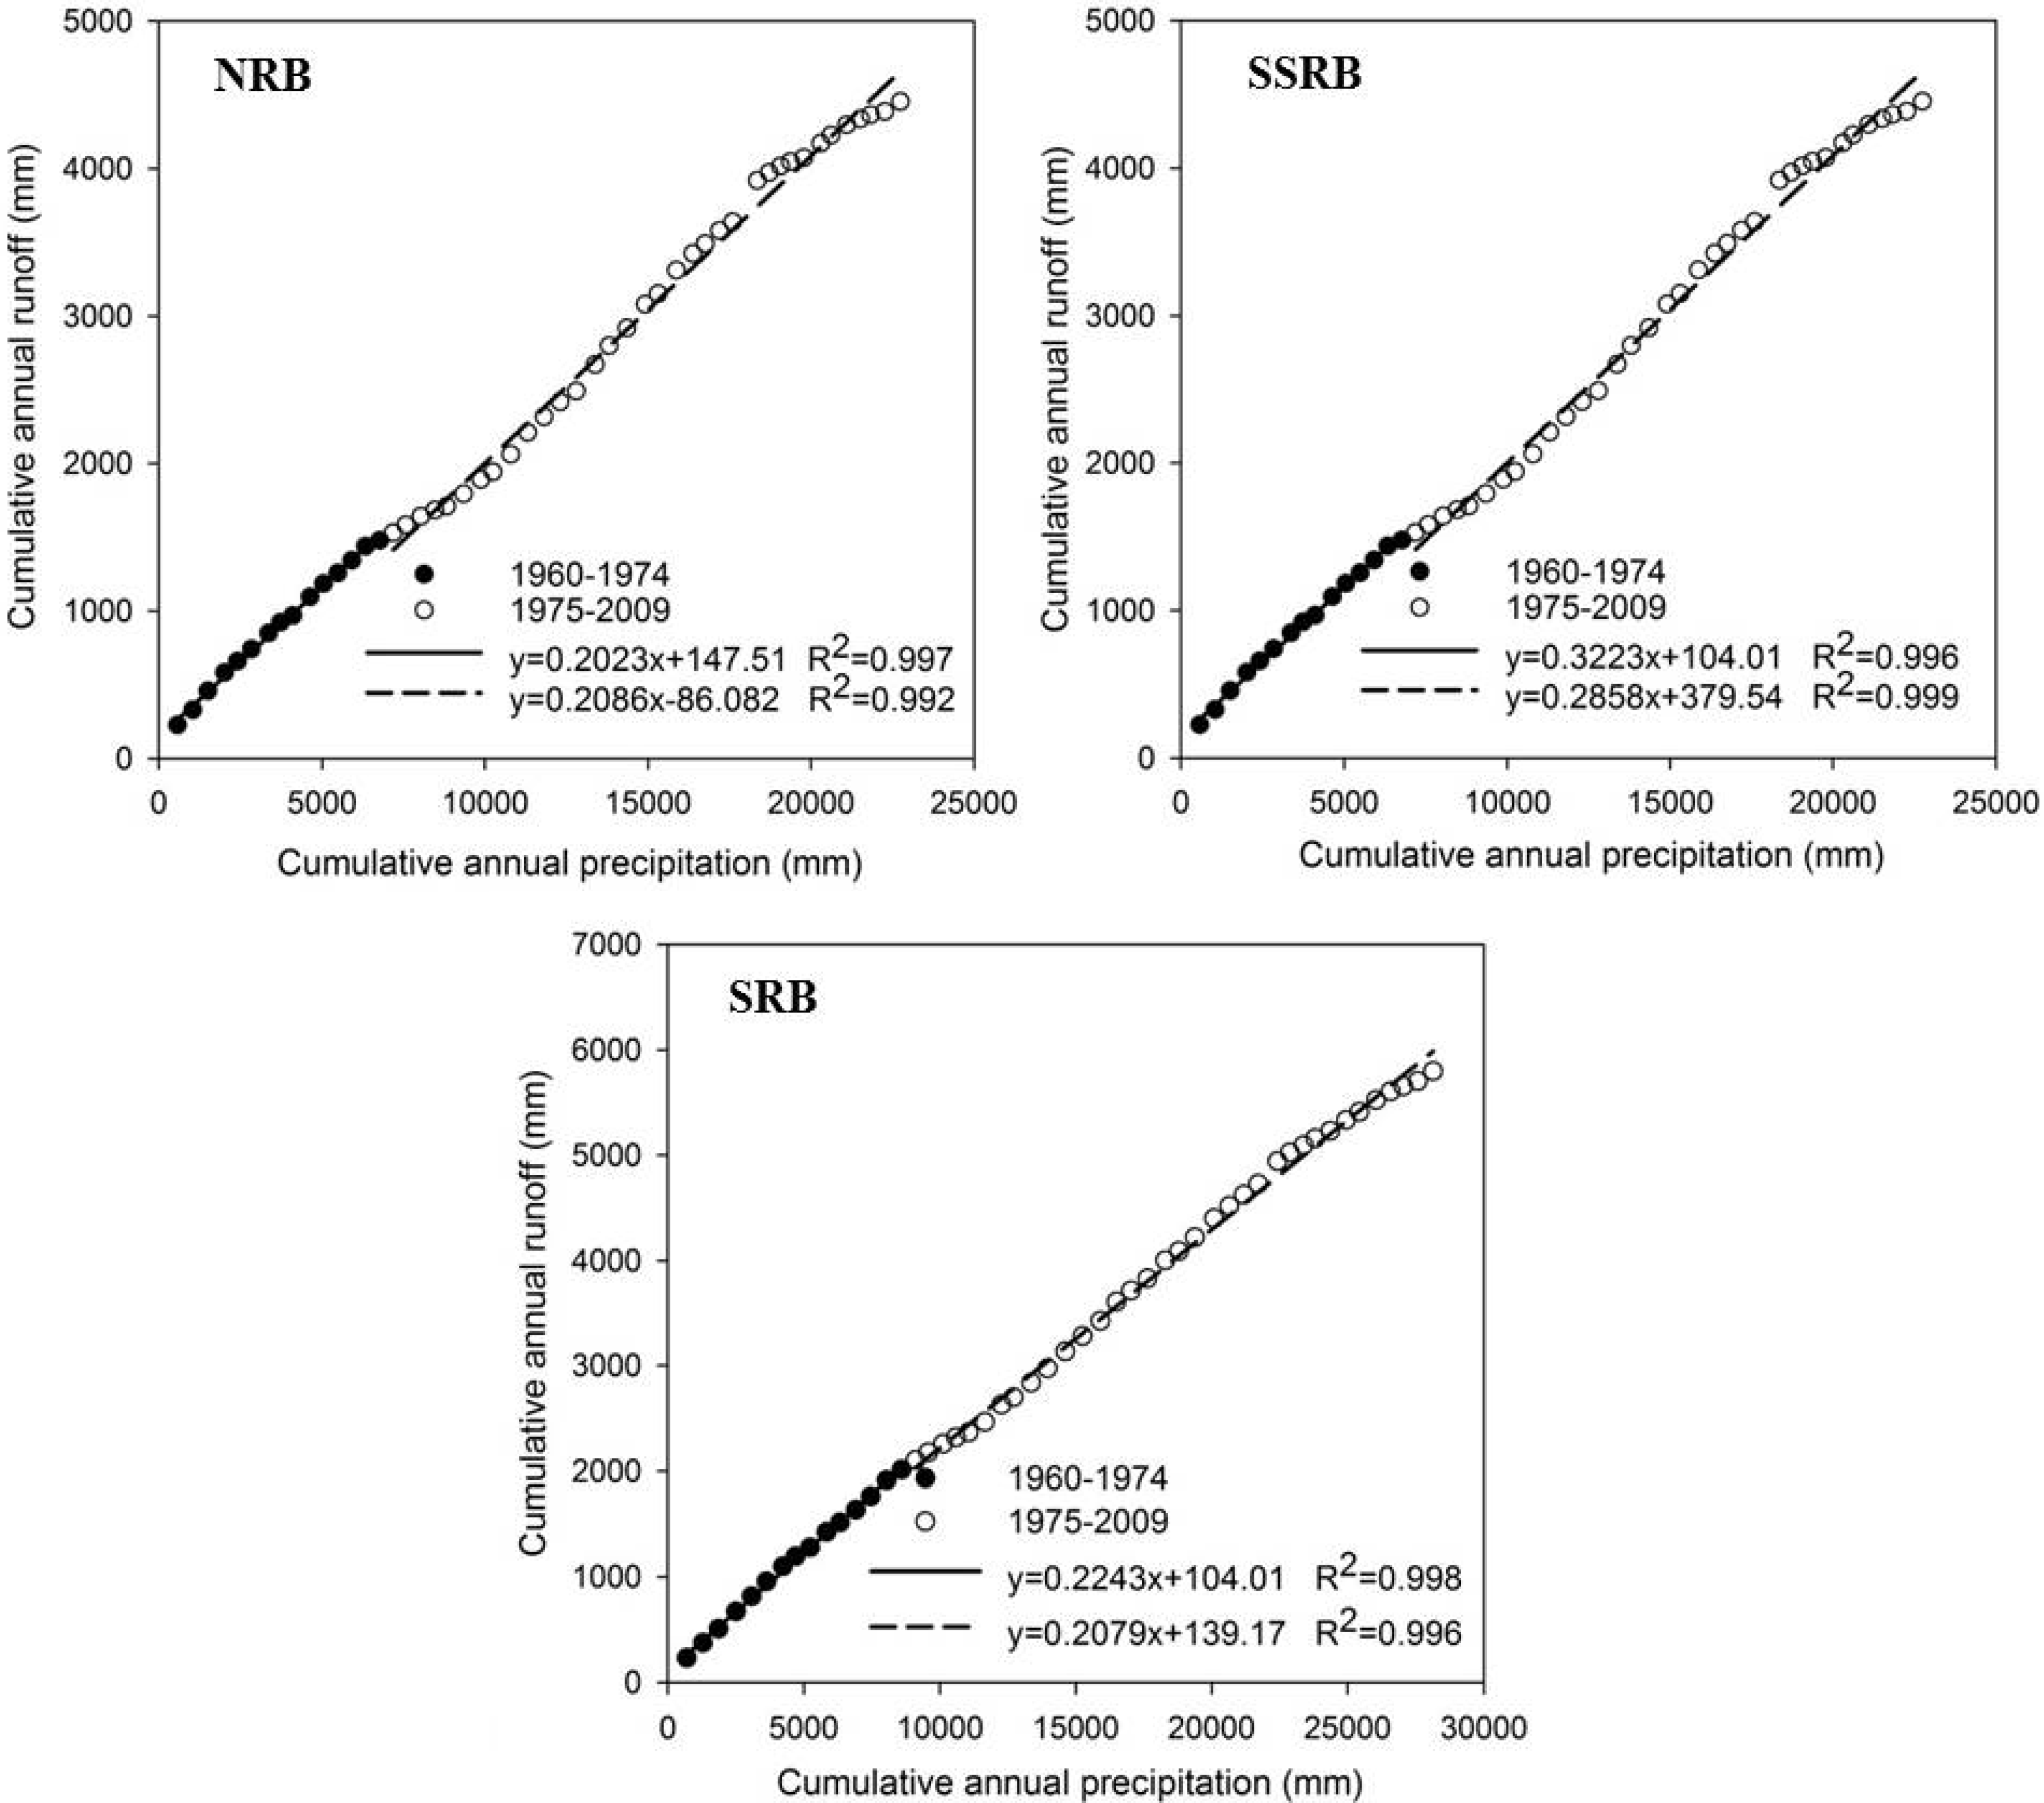
In addition, the precipitation-runoff double cumulative curve (DCC) was generated to identify change-points of the runoff series. The precipitation-runoff DCC analysis provides a visual representation of the consistency of the precipitation and runoff data [
36]. It should be a straight line if two variables are proportional, and the slope of this line will present the ratio between the two variables. Changes in the gradient of the curve may indicate that the characteristics of the precipitation or runoff have changed. In this study, DCC between precipitation and runoff was used as an auxiliary confirmation of the change points when human activities imposed the influences on the river.
Through the trend and change-point analysis, the runoff series were divided into (1) a reference period where little to no anthropogenic disturbance occurred in the river basin; and (2) other time periods when intensive human activities took place. Based on the period division, the contribution of climate variation and human activities on runoff were separated through the following approach.
3.4. Quantitative Assessment of the Effects of Climate Variation and Human Activities on the Runoff
A change in mean annual runoff can be calculated as follows:
where Δ
Robs indicates the observed change in mean annual runoff between two different periods;
is the average annual runoff during the reference period; and
is the average annual runoff during other periods.
Climate variation and human activities are two main driving factors affecting the change of catchment hydrology. Although they are inter-related, we attempt to assess their individual impact on runoff in this study. As a first-order approximation, the total change in mean annual runoff can be estimated as:
where Δ
Rclim and Δ
Rhum indicate the changes in the mean annual runoff due to climate variation and human activities, respectively.
Jones
et al. [
18] and Ma
et al. [
37] used percentage changes in runoff in response to the change in precipitation and potential evapotranspiration to weigh out the role of climate variation
versus land use change. The concept is based on a water balance for a river basin:
where
P is the precipitation (mm);
AET is the actual evapotranspiration (mm);
R is the runoff (mm); and Δ
S is the change in the basin water storage (mm). Over a long period of time (
i.e., equal to or greater than 10 years), Δ
S can be assumed as zero.
Using an equation developed by Zhang
et al. [
38], the actual evapotranspiration (
AET) can be estimated as follows:
where
PET is the potential evapotranspiration; and
w is a model parameter related to the vegetation type, soil hydraulic property, and topography [
38].
w can be obtained using long-term hydrometeorological data and estimates of potential evapotranspiration through:
In this study, we estimated AET with Equation (13) and PET with the Penman-Monteith equation, and then calculated w with Equation (15) for different time periods to reflect changes in vegetation cover.
Variation in both precipitation and
PET can lead to changes in the water balance. Based on the hydrologic sensitivity relationship, the change in mean annual runoff due to climate variation (Δ
Rclim) can be approximated as follows [
16,
39]:
where Δ
P and Δ
PET are changes in mean annual precipitation and potential evapotranspiration respectively;
β and
γ are the sensitivity parameters given as [
19]:
where
x is the dryness index (equal to
PET/P);
w is same as in Equations (14) and (15).
Once Δ
Rclim is obtained, Δ
Rhum can be known using Equation (12). The relative contribution of climate variation and human activities on runoff can be then expressed in percentage as follows:
where
ηclim and
ηhum are the percentage of the climate-variation-induced impact and human-activity-inducted impact on runoff, respectively.
5. Discussion
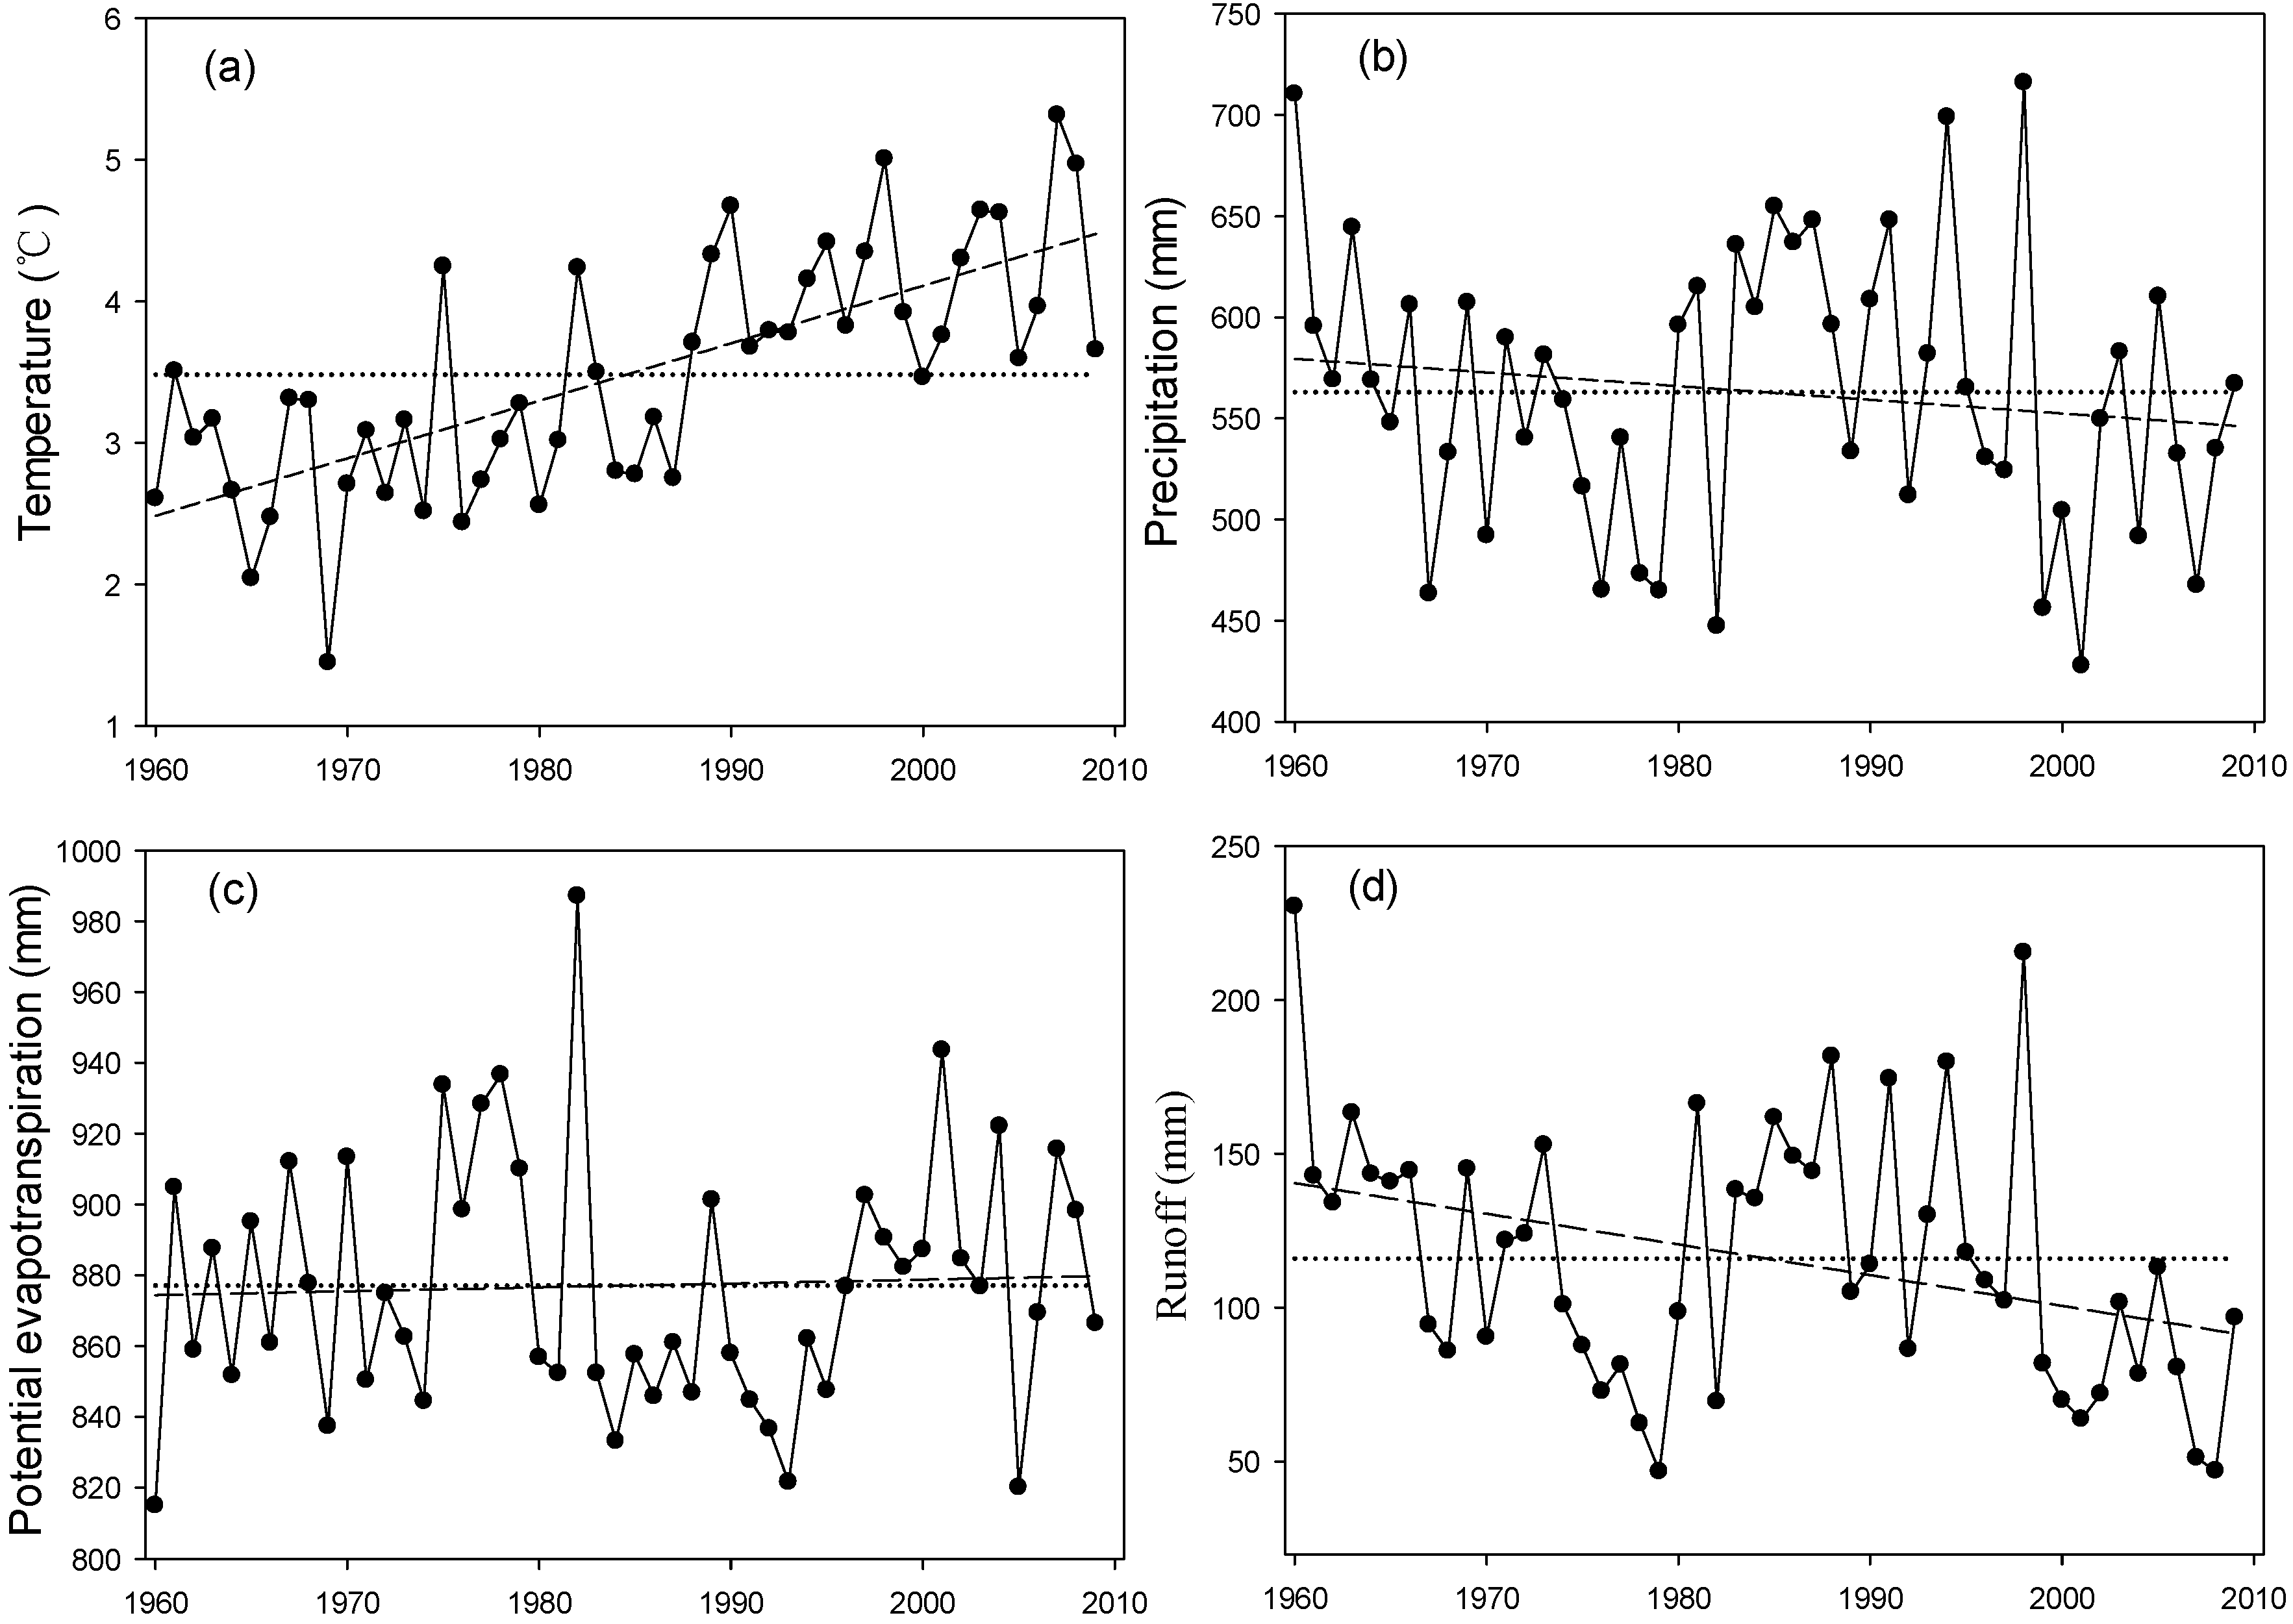
Several studies reported a decrease in precipitation [
6,
40] and an increase in PET [
41] in the Songhua River Basin. Overall, our findings showed similar trends in precipitation and PET for the entire SRB. However, the specific changing characteristics were found to be various among the five sub river basins and different sub periods in our study. Apart from the decreasing trend in streamflow of the SRB reported by other researchers [
27,
42], our study identified a change-point of the year of 1974 for runoff. The results showed that the average runoff during the last 35 years declined in all sub river basins of the SRB when compared with that of the previous 15 years before 1974.
The change of runoff was closely related to the variations of precipitation and PET. However, human activities also played an important role in runoff change. Recent studies have attempted to quantify the impact of climate variability on runoff under land use change [
19,
22,
25,
43,
44]. In the following sections, we discuss how the runoff responses to climate variation and human activities based on our findings. However, it is essential to point out that we attempted to identify the individual impact of climate variation and human activities on runoff and supposed them to be independent in this paper. In reality, land use/cover can be influenced by both climate variation and human activities and climate variation can also be affected by human activities.
5.1. Contribution of Climate Variation to Runoff Change in SRB
Generally, climate variation played a negative effect on runoff in the Songhua River Basin. However, runoff in LNRB increased by 19 mm due to climate variation in 1975–1989. As presented in
Table 4, both the mean annual precipitation and PET of 1975–1989 increased compared with the period of 1960–1974, but the increase in proportion of precipitation was larger than that of PET. In addition, the runoff was more sensitive to precipitation than PET according to the results of
β and
γ in our calculating process. The combination of these two reasons led to the positive effect of climate variation on the runoff during 1975–1989 in LNRB. Similarly, the runoff increase caused by climate variation between 1990 and 1999 in UNRB, LNRB and LSRB can mainly be attributed to the increase of precipitation and decrease of PET during this period (
Table 4).
In LSSRB, human activities played a dominant role in runoff decline and the impact in 1990–1999 was much larger than that of other periods. This can be explained from the aspect of climate impact: compared to the period of 1960–1974, the precipitation reduced less in 1990–1999 than in other periods and the PET decreased during this period while increased in other periods (
Table 4), which may lead to less reduction of runoff due to climate variation. At the same time, there was not so much difference between the total reduction of runoff in 1990–1999 and that in other periods. All the above resulted in the largest portion of reduction in runoff caused by human activities in 1990–1999 in LSSRB.
5.2. Contribution of Human Activities to Runoff Change in SRB
Land use/cover in the Songhua River Basin has changed substantially since the 1970s (
Table 6). The area of forest in 2005 has decreased by 9.6%, 5.4%, and 6.5%, respectively, in NRB, SSRB, and LSRB when compared with that of 1975 (
Table 6). However, there is an increase in area of residential and industrial land, especially in the 1980s and the 1990s, when the area increased by 380%, 410% and 470%, respectively, in NRB, SSRB and LSRB. The increasing area reveals an increasing water demand in domestic and industry that could aggravate the conflict in water supply and demand. In addition, with the rapid growth of population, the Chinese government promoted the region to become China’s future major grain production base over recent years. The area of cultivated land expanded, which was most obvious in the NRB. The area of paddy land in 2005 increased by more than 175% than that of 1975 (
Table 6). The increasing water demand for agriculture irrigation would consequently increase the water consumption.
Table 6.
Land use in 1975, 1986, 1996 and 2005 in the Nenjiang River Basin (NRB), Second Songhua River Basin (SSRB), and Lower Songhua River Basin (LSRB) in Northeast China.
Table 6.
Land use in 1975, 1986, 1996 and 2005 in the Nenjiang River Basin (NRB), Second Songhua River Basin (SSRB), and Lower Songhua River Basin (LSRB) in Northeast China.
| Basin | Time Stage | Paddy Land (103 km2) | Dry Land (103 km2) | Forest (103 km2) | Grassland (103 km2) | Water (103 km2) | Reservoir & Pond (103 km2) | Residential & Industry (103 km2) | Bared Land (103 km2) | Wetland (103 km2) |
|---|
| NRB | 1975 | 1.88 | 82.5 | 113 | 49.1 | 5.55 | 0.374 | 1.13 | 9.46 | 30.5 |
| 1986 | 1.87 | 80.7 | 97.6 | 68.4 | 7.91 | 0.380 | 5.50 | 11.1 | 19.5 |
| 1996 | 4.80 | 85.1 | 98.4 | 62.3 | 7.34 | 0.493 | 5.47 | 9.27 | 19.8 |
| 2005 | 5.17 | 100 | 102 | 38.5 | 6.00 | 0.488 | 1.80 | 11.5 | 27.7 |
| SSRB | 1975 | 5.05 | 25.3 | 39.9 | 1.27 | 0.682 | 0.502 | 0.556 | 0.151 | 0.486 |
| 1986 | 5.58 | 24.8 | 35.8 | 1.54 | 1.22 | 0.734 | 3.22 | 0.232 | 0.249 |
| 1996 | 5.78 | 24.5 | 35.4 | 1.65 | 1.21 | 0.673 | 3.46 | 0.218 | 0.346 |
| 2005 | 6.06 | 26.7 | 37.8 | 0.846 | 0.675 | 0.495 | 0.875 | 0.173 | 0.295 |
| LSRB | 1975 | 10.9 | 58.8 | 97.3 | 6.14 | 3.49 | 0.428 | 1.17 | 0.669 | 7.79 |
| 1986 | 10.9 | 60.6 | 90.6 | 7.14 | 7.35 | 0.654 | 4.80 | 26.5 | 6.00 |
| 1996 | 11.8 | 62.5 | 88.9 | 6.70 | 6.38 | 0.624 | 4.94 | 27.1 | 6.21 |
| 2005 | 14.7 | 63.8 | 91.0 | 5.00 | 3.46 | 0.591 | 1.67 | 0.803 | 5.72 |
Additionally, many hydraulic projects (e.g., Chaersen Reservoir, Baishan and Nierji Hydropower Stations) were constructed to meet the agricultural, industrial and domestic water demands in the SRB in recent years. On the one hand, the storage of hydraulic projects may lead to a runoff decline in the downstream directly. On the other hand, the hydraulic projects may cause an increase of PET and influence runoff indirectly. Moreover, the hydraulic projects not only change the distribution of seasonal water resource, but also re-distribute the inter-annual runoff.
5.3. Uncertainty of the Hydrological Sensitivity Analysis
Some uncertainties may exist in the hydrologic sensitivity analysis method when assessing the effects of climate variation and human activities on runoff. First, the method is based on long-term hydro-meteorological observation data. The limited number and distribution of hydro-meteorological stations may affect the simulation accuracy of the hydro-climatic variables such as PET, runoff, and AET in this method. In addition, the method assumes that human activities and climate variation are independent of each other [
45]. However, climate variation may influence human activities such as land use, and human activities such as extensive urbanization and expanded population may cause changes in climate. Thus, these two factors are inter-related, and due to the limited length of data combined with the insufficiency in change-point analysis, there were some human disturbances during the natural period. Uncertainty may also arise from the parameter of
w in the method.
Despite of the uncertainties and limitations, our study sheds light in understanding of the sensitivity of runoff to climate variation and human activities in the Songhua River Basin, where water is crucial for grain-production and the wetland ecosystem. In addition, more work will be carried out on the estimation of these uncertainties in our future studies to improve the results of quantification.
6. Conclusions
In this study, we investigated the impacts of climatic variability and human activities on a 50-year long trend of runoff in the Songhua River Basin, Northeast China. We found a clear downward trend in the river basin’s runoff, accompanied by a declining trend of precipitation. However, the runoff decline was much greater than the precipitation decline, especially after 1974 when large-scale land use change and river engineering projects had been undertaken. The contribution of climate variation and human activities varied temporally and spatially. Generally, human activities contributed 62%–82% to the reduction of runoff for the entire study period of 1975–2009. However, climate variation was the main factor leading to the runoff increase in 1990–1999 in UNRB and LNRB as a result of the increase in precipitation and decrease in PET. Due to the more intensive human activities in the downstream basins, the effects of human activities were relatively stronger in the lower basin areas than in the upper basin areas. However, the impact of human activities in the upper basins has been increasing with more land development. Based on the findings we suggest adaptive management strategies to avoid the risk of water resources shortage in this region.


