Article

Nitritation and N2O Emission in a Denitrification and Nitrification Two-Sludge System Treating High Ammonium Containing Wastewater

1
Key Laboratory of Microorganism Application and Risk Control (MARC) of Shenzhen, Graduate School at Shenzhen, Tsinghua University, Shenzhen 518055, Guangdong, China
2
School of Municipal and Environmental Engineering, Shandong Jianzhu University, Jinan 250101, Shandong, China
*
Author to whom correspondence should be addressed.
Water 2014, 6(10), 2978-2992; https://doi.org/10.3390/w6102978
Submission received: 8 August 2014 / Revised: 20 September 2014 / Accepted: 22 September 2014 / Published: 1 October 2014

Abstract

:
The effective management of high ammonium containing wastewater is important for the sustainable development of the wastewater industry. A pre-denitrification and post-nitrification two-sludge system was proposed to treat high ammonium containing wastewater with low carbon-to-nitrogen (C/N) ratios. In the system, pre-denitrification was adopted to use organic carbon in raw wastewater efficiently for nitrogen removal, while post-nitrification was adopted to achieve nitritation. System performance and the characteristics of nitrous oxide (N2O) emission were examined. As to the influent chemical oxygen demand (COD) and ammonium nitrogen (NH4-N) concentration, both 800 mg/L, nitrogen removal was mainly through pre-denitrification, and the nitrogen removal percentage was 43.4%. In post-nitrification, nitritation was achieved with a nitrite accumulation efficiency of 97.8% and a NH4-N removal loading rate of 0.45 g/(L·d). With nitrite as the electron acceptor during denitrification, its removal rate increased, while the N2O emission factor decreased with increasing C/N ratios. Nitrification was affected significantly by the aeration rate. When the aeration rate was below 0.6 L/min, the NH4-N removal rate increased, while the N2O emission rate decreased with increasing aeration rates. However, when the aeration rate was above 0.6 L/min, it had little influence on N2O emission. During nitrification, N2O emission factors decreased exponentially with increasing ammonium oxidation rates.

1. Introduction

Wastewater, such as landfill leachate and anaerobic digestion effluent, has high ammonium and low organic carbon concentrations. In a wastewater treatment plant, the effluent from anaerobic digestion is usually recirculated to the main treatment strain, which may increase the nitrogen loading rate by 3%–30% [1]. In addition, the recirculation of digester liquid would cause shock nitrogen loading to the system and induce nitrous oxide (N2O) emission [2]. When conventional nitrification and denitrification is applied to treat high ammonium containing wastewater, it requires high energy input for supplying oxygen during nitrification and also consumes high alkalinity, causing pH to decrease and affecting system stability. In addition, due to the low organic carbon and high ammonium, the nitrogen removal through denitrification is limited. If external organic carbon is dosed for denitrification, the operating cost will increase significantly. Therefore, novel processes, such as SHANRON, short-cut nitrification and anaerobic ammonium oxidation, and so on, have been developed to treat high ammonium containing wastewater [3,4]. The prerequisite of these processes is to achieve short-cut nitrification, namely nitritation (nitrifying ammonium to nitrite rather than nitrate). By this means, it is necessary to develop high efficiency nitritation technology for treating high ammonium containing wastewater. For a single completely mixed sludge wastewater treatment system, it is difficult to ensure that different functional microorganisms grow at their optimal conditions simultaneously. For example, when nitrifiers and denitrifiers grow in a single sludge system, denitrifiers grow faster than nitrifiers, which may inhibit the growth of nitrifiers. If an efficient nitrification were to be maintained, a high sludge retention time (SRT) or aeration duration will be required, resulting in denitrifiers experiencing a long endogenous period. In a single-sludge system, the activities of nitrifiers were affected significantly by heterotrophic bacteria, such as inducing increased N2O emission during nitrification [5]. If a two-sludge treatment process is adopted, nitrifiers and denitrifiers are acclimated separately in two reactors, and they will grow at their optimal environment conditions; this will benefit nitrogen removal. In addition, if nitrification is controlled at the nitritation stage, denitrification with nitrite nitrogen (NO2-N) as the electron acceptor will increase the denitrification rate and decrease the production of sludge and operating cost.
According to ecological theory, every type of bacteria can be divided into r- and K-strategy groups [6]. r-strategy microorganisms possess a high reaction rate and a high half saturation constant value, and they are dominant under high substrate concentrations. K-strategy microorganisms possess a low reaction rate and a low half saturation constant value. For nitrification of high ammonium containing wastewater, some previous studies might have acclimated K-strategy nitrifiers by applying a low loading rate and low substrate concentrations [7]. Based on the r/K theory, to achieve both a high nitrification rate and efficiency, acclimating r-strategy nitrifiers would be advantageous in saving the system footprint, etc. Nitritation can be achieved by controlling the operating parameters, including dissolved oxygen (DO), SRT, hydraulic retention time (HRT), pH, temperature (T), substrate concentration, and so on [8,9,10,11]. Because nitrite oxidizing bacteria (NOB) have a lower affinity for DO than ammonia oxidizing bacteria (AOB), AOB will over-compete NOB under low DO conditions, resulting in NO2-N accumulation [12]. In addition, free ammonia (FA) in the range of 1–5 mg/L inhibits the activities of NOB, while having little effect on AOB [13]. Furthermore, intermittent aeration benefits NO2-N accumulation due to that AOB and NOB having different lag times, which could be applied easily [7]. For treating high ammonium containing wastewater, few studies have been carried out to acclimate r-strategy nitrifiers and to examine the system performance.
For sustainable development, it is necessary to avoid secondary pollution, such as N2O emission during nitrification and denitrification. Factors affecting N2O emission during nitrification and denitrification include DO (or aeration rate), SRT, NO2-N, intermittent aeration operating mode, the NH4-N loading rate, and so on [14,15,16,17,18,19]. During treatment of high ammonium containing wastewater, achieving nitritation means the production of high concentrations of nitrite, which may lead to increased N2O emission [14]. During both nitrification and denitrification, DO concentration (or the aeration rate) has a significant influence on N2O emissions. Up to now, there have been different opinions on the effect of DO on N2O emission. Tallec et al. [20] obtained that when DO was in the range of 0.1–6.2 mg/L, the N2O production rate reached the maximum at 1 mg DO/L, while the N2O emission factor was very low, with values of 0.1%–0.4%. Stenström et al. [21] reported that when DO was below 1–1.5 mg/L, decreasing DO would cause NO2-N accumulation and induce high N2O emissions through nitrifiers denitrification. Quan et al. [22] showed that at aeration rates of 0.2, 0.6 and 1.0 L/min, N2O emissions increased with decreasing aeration rates. Therefore, it is necessary to further investigate DO’s (or the aeration rate’s) effect on N2O emission during nitrification. One of the main factors affecting N2O emissions during denitrification is the C/N ratio [23]. Previous studies on the effect of C/N ratios on N2O emission during denitrification were mainly focused on nitrate as the electron acceptor, and the results were different. Li et al. [24] found that high C/N ratios caused both high denitrification rates and N2O emissions. Stenström et al. [21] found that N2O emissions during denitrification were the combined effect of the C/N ratio and NO2-N. Quan et al. [22] showed that for aerobic granular sludge, N2O emissions during denitrification with NO2-N as the electron acceptor were higher than with NO3-N as the electron acceptor. Therefore, it is also necessary to further examine N2O emissions during denitrification with NO2-N as the electron acceptor under different C/N ratios.
This study aimed to treat high ammonium containing wastewater by a two-sludge system (separated nitrification and denitrification), with the purposes of the efficient utilization of organic carbon in raw wastewater for denitrification and the achievement of nitritation during nitrification under high nitrogen loading rates. In addition, the effects of aeration rates on N2O emissions during nitrification and C/N ratios on N2O emissions during denitrification with NO2-N as the electron acceptor were investigated. Through these studies, not only a highly efficient nitrogen removal process, but also strategies to avoid N2O emissions would be provided.

2. Materials and Methods

2.1. Experimental System and Its Operating Conditions

The nitrification and denitrification reactors were made from a cylindrical Plexiglas column (50 cm in height and 15 cm in diameter) with a working volume of 6 L. Two reactors were operated at 30 °C as sequencing batch reactors with an operating cycle of 8 h. The feed and withdrawal of reactors were realized by peristaltic pumps controlled by timers. During the aerobic phase, air was supplied though oxygen diffusers, while during the anoxic phase, the reactors were mixed thoroughly with magnetic stirrers. The inoculated sludge of two reactors was taken from nitrification and denitrification mixed liquors acclimated in the laboratory.
The operating cycle of the denitrification reactor included phases of 120 min anoxic, 60 min aerobic, 40 min anoxic, 60 min aerobic, 40 min anoxic, 100 min aerobic, 45 min settlement and 15 min withdrawal/idle. The feed volume during each sequencing batch reactor (SBR) cycle was 3 L (containing 2 L of synthetic wastewater and 1 L of effluent from the nitrification reactor), and the effluent of the reactor was also 3 L, resulting in an HRT of 16 h. The operating cycle of the nitrification reactor included phases of 60 min aerobic, 60 min anoxic, 60 min aerobic, 60 min anoxic, 60 min aerobic, 60 min anoxic, 60 min aerobic, 45 min settlement and 15 min withdrawal/idle. The feed volume of the reactor was 3 L, and the feed was the effluent from the denitrification reactor, with an HRT of also 16 h. For the whole system, both the feed and the effluent of every cycle were 2 L, resulting in an HRT for the whole system of 2 d. During the acclimation period, the SRT of the denitrification reactor was controlled at around 15 days by wasting 400 mL of mixed liquor each day, while no mixed liquor was wasted from the nitrification reactor.
The components of the synthetic wastewater were 3060 mg/L NH4Cl, 1000 mg/L sodium acetate, 7000 mg/L NaHCO3, 100 mg/L Na2HPO4, 56 mg/L CaCl2, 360 mg/L MgSO4, 10 mg/L yeast extract and 0.4 mL/L of trace element solutions. The detailed composition of the trace element solution was made according to Smolders et al. [25].

2.2. Batch Experiments

The active sludge for batch experiments was taken from both SBRs. For the nitrifying activated sludge, the effects of different aeration rates on N2O emissions during nitrification were examined, and for denitrifying activated sludge, different C/N ratios on N2O emissions during denitrification were examined. The batch reactors were glass bottles with gas tight rubber stoppers, and there were ports on the cap connected by silicone pipes for water sampling, gas sampling (simultaneously measuring the gas flow rate) and aeration. During batch experiments, the glass bottles were placed onto magnetic stirrers to guarantee adequate mixing.
The effect of different aeration rates on N2O emissions for the acclimated nitrifiers during nitrification was examined. Firstly, 3 L of mixed liquor was taken from the nitrification reactor at the end of the feed phase and then transferred to three batch reactors with each 1 L. Secondly, the mixed liquor was aerated under aeration rates of 0.1, 0.2, 0.4, 0.6, 0.9 and 1.2 L/min. Thirdly, water and gas samples were taken at intervals of 10 min, and simultaneously, the pH and DO were measured. Finally, the mixed liquor suspended solids (SS) were measured at the end of reaction, and water and gas samples were analyzed.
The effect of different C/N ratios on N2O emissions for acclimated denitrifiers during denitrification was examined. Four hundred milliliters of mixed liquor were taken from the denitrification reactor before the end of the aerobic phase. After centrifugation, the supernatant was discarded, and the activated sludge was re-suspended with the synthetic wastewater to achieve different C/N ratios (1, 2 and 4). The initial NO2-N concentration was 100 mg/L, and the initial COD concentrations were 100, 200 and 400 mg/L, respectively. The experiment was carried out in the sealed reactors with ports on the cap connected by silicone pipes for water sampling and gas sampling. Water and gas samples were taken at intervals of 20 min, and simultaneously, the pH at the beginning and the end of the experiment was measured. SS was measured at the end of the reaction, and also water and gas samples were analyzed.

2.3. Analytical Methods

After water sample was centrifuged or filtrated through 0.45-μm filter papers, NH4-N, NO2-N and NO3-N were analyzed according to standard methods for the examination of water and wastewater [26]. The pH and DO were measured using a pH meter (pH3110, WTW, Munich, Germany) and a DO meter (oxi 315i, WTW, Munich, Germany), respectively. FA and free nitrous acid (FNA) in the liquid phase were calculated after Anthonisen et al. [27].
N2O was determined by a gas chromatograph (Agilent 6820, Agilent Technologies, Wilmington, DE, USA) equipped with an electron capture detector (ECD) and HP-PLOT/Q column (J&W GC Columns, Agilent Technologies, Wilmington, DE, USA). The detector temperature and oven temperature were 300 °C and 50 °C, respectively. High purity nitrogen gas was used as the carrier gas at a flow rate of 15 mL/min. Pure N2O gas was used as the standard for calibration. For a convenient comparison, the cumulatively produced N2O in the gas phase was calculated and then divided by the reactor volume; as a result, it was expressed as mg/L, representing mg N2O (gas) produced from the unit volume (liter) of mixed activated sludge liquor. The ratio of N2O emissions to the nitrified NH4-N was obtained by dividing the N2O emission rate by the NH4-N reduction rate (rN2O-N/rNH4-N). The ratio of N2O emissions to the denitrified NO2-N was obtained by dividing the N2O emission rate by the NO2-N reduction rate (rN2O-N/rNO2-N).

3. Results and Discussion

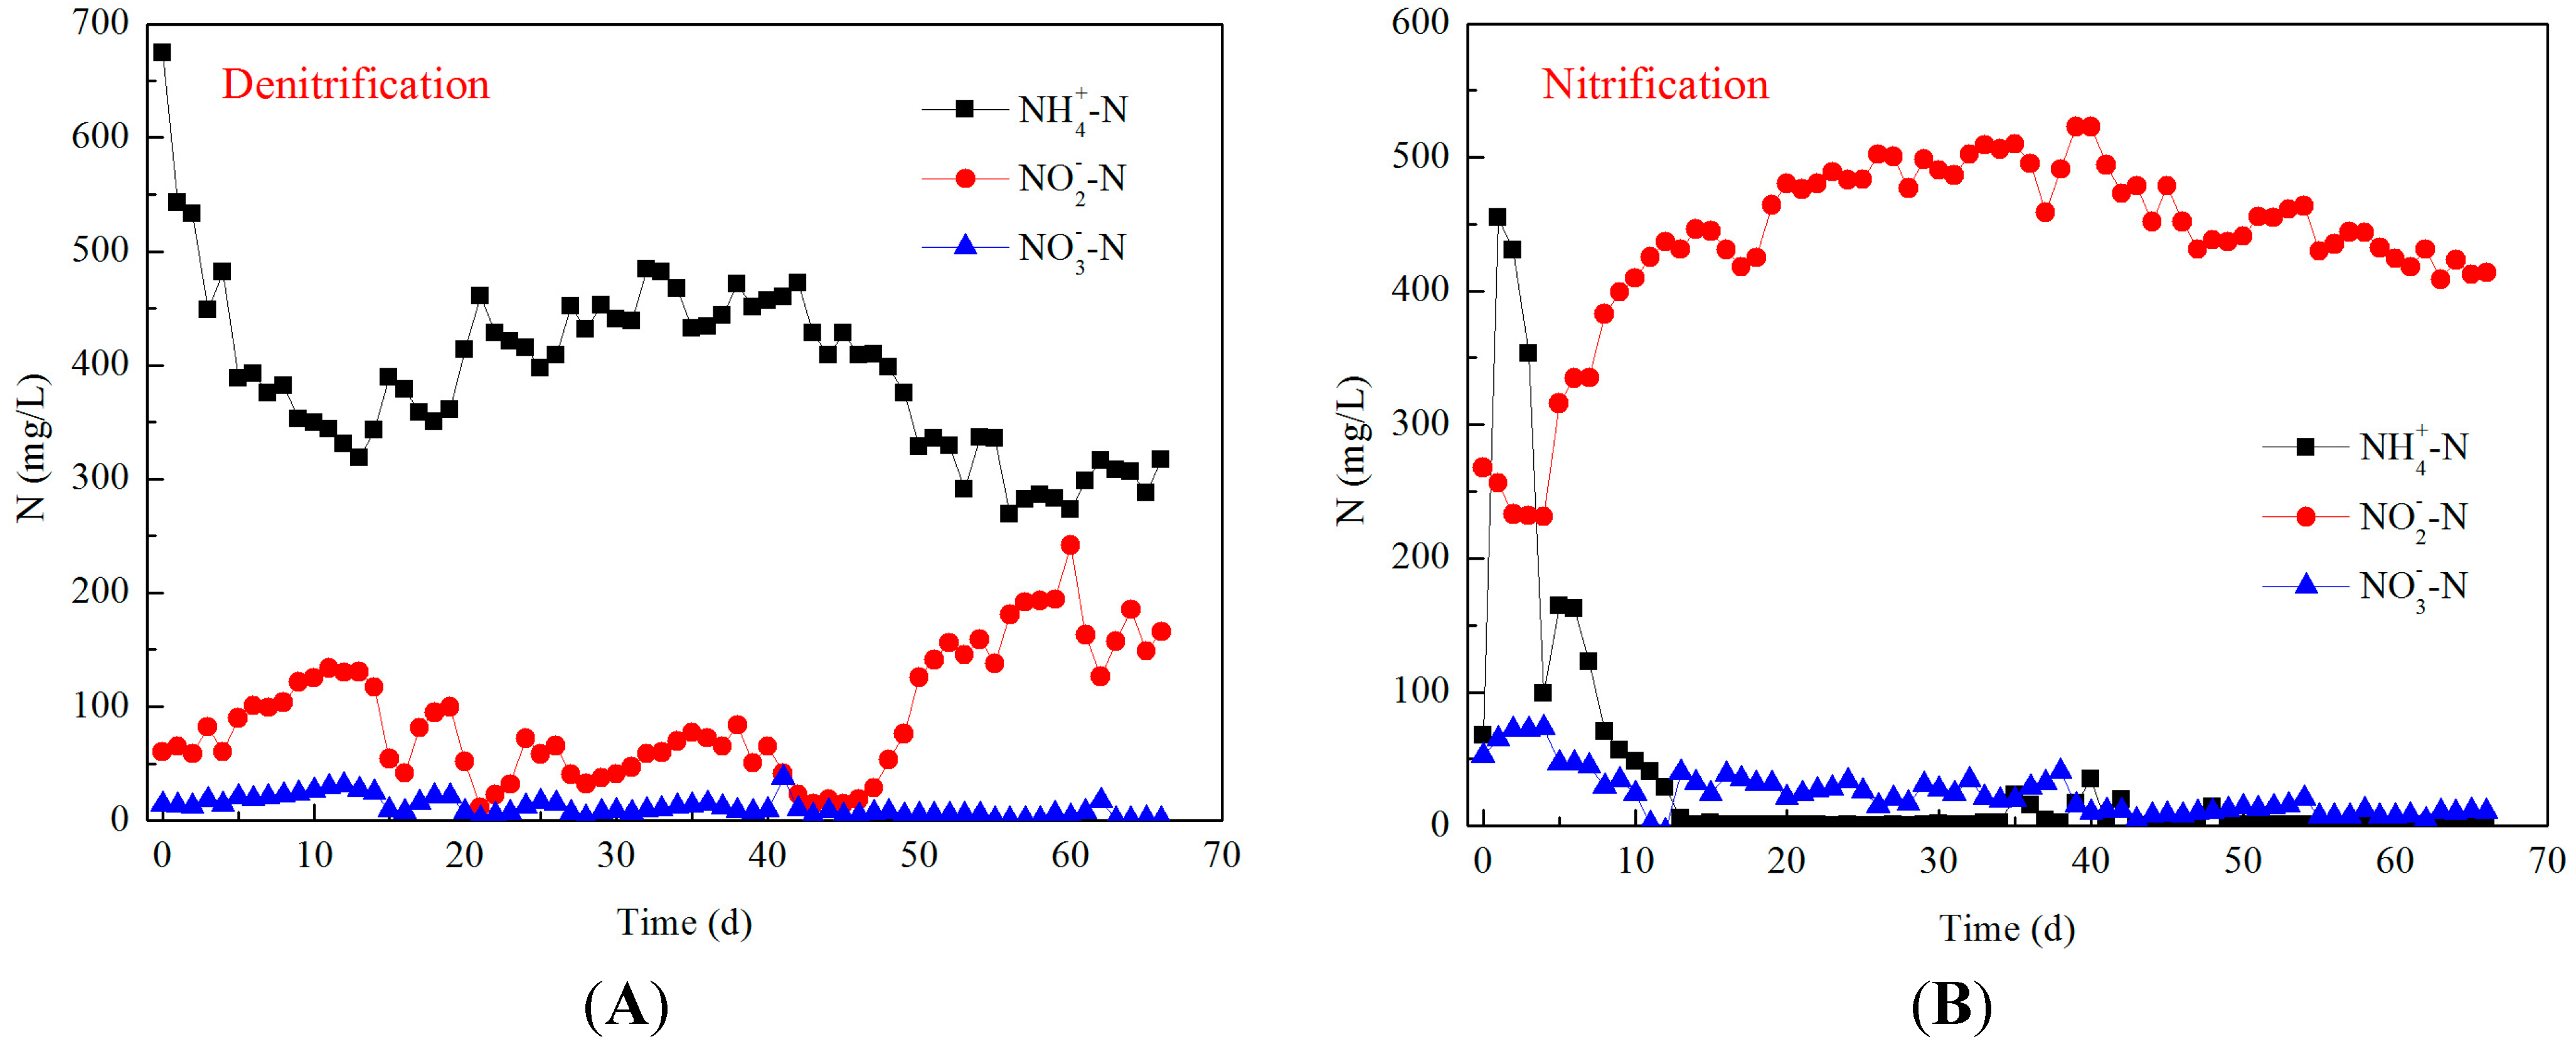
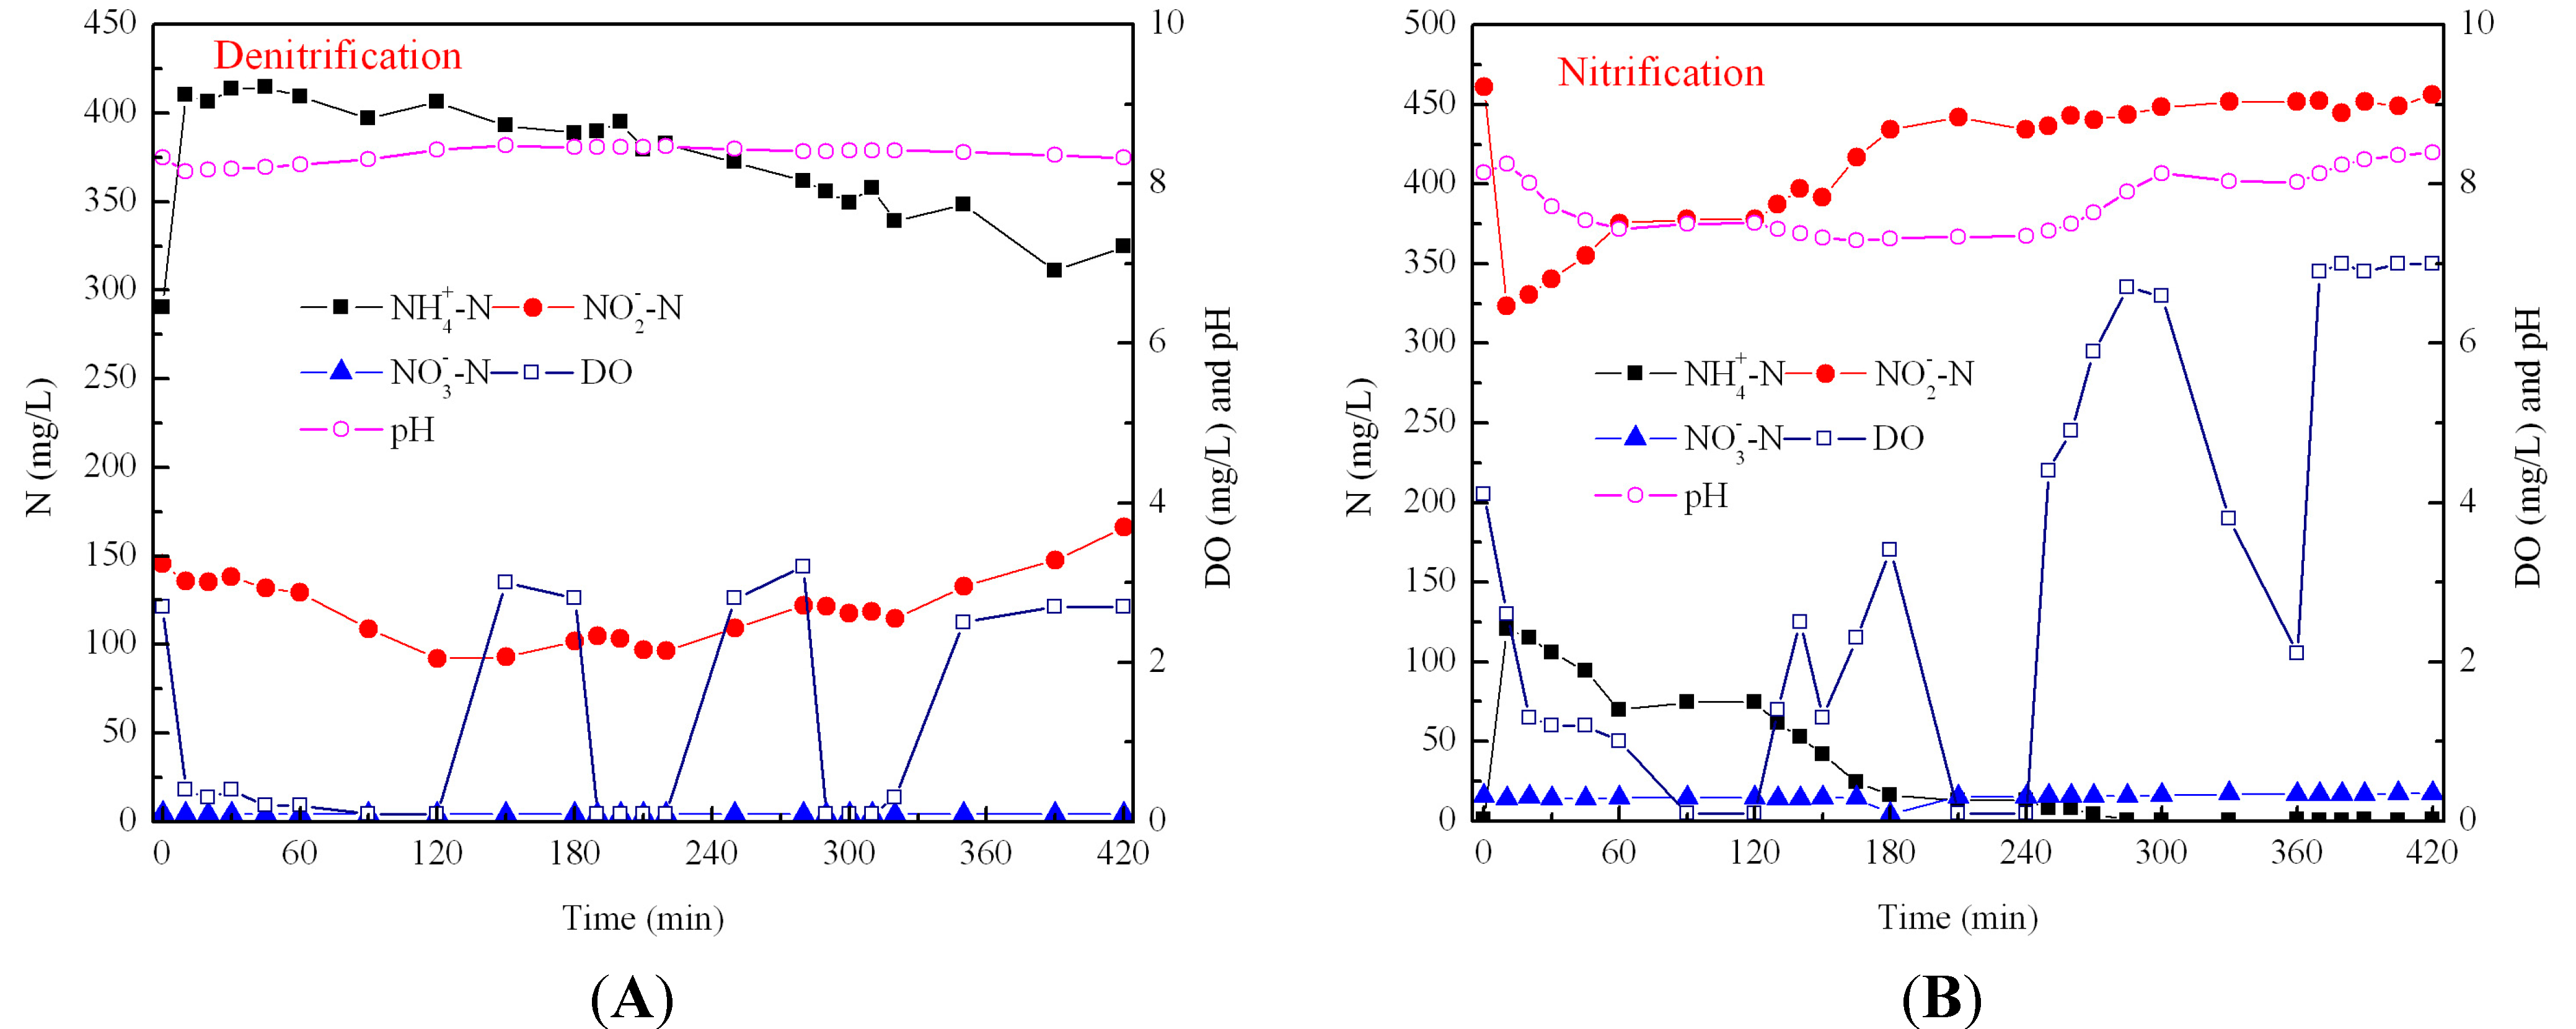
3.1. Long-Term Operation and Typical Cycle Examination

Both concentrations of COD and NH4-N in the feed were 800 mg/L, giving a low C/N ratio of one. The wastewater was treated in the two-sludge system of nitrification and denitrification. Denitrification reached steady state after 50 days of operation (Figure 1), with effluent concentrations of NH4-N, NO2-N and NO3-N of 303.9 mg/L, 153.9 mg/L and 3.4 mg/L, respectively. After 45 days of operation, the nitrification reactor achieved stable nitritation (Figure 1), with effluent concentrations of NH4-N, NO2-N and NO3-N of 3.0 mg/L, 446.1 mg/L and 10.0 mg/L, respectively. For the two-sludge system, the total nitrogen removal percentage was 43.4%, and the nitritation efficiency of the nitrification reactor was 97.8%. Therefore, the process achieved short-cut nitrification efficiently, namely achieving NO2-N accumulation. As to the final effluent of the nitrification reactor, it contained mainly high concentrations of nitrite, and it could be further treated through denitrification by adding external organic carbons or through anaerobic ammonium oxidation.
The NH4-N loading rate in the nitrification reactor was 0.45 g/(L·d). Under steady state, the SS of the nitrification reactor was 1.94 g/L. Hence, the corresponding NH4-N mass loading rate was 0.23 g/(g SS·d). Previous studies had applied relatively low NH4-N loading rates; for example, Li et al. [7] adopted a NH4-N loading rate of 0.11 g/(L·d) for efficient utilization of the influent organic carbon for removal of nitrogen and phosphorus. Law et al. [28] adopted a NH4-N loading rate of about 1 g/(L·d), while as the effluent included around an equal amount of NH4-N and NO2-N, the NH4-N removal loading rate was also about 0.5 g/(L·d). Because the operating condition in this study was not optimized, the NH4-N loading rate could be increased to 1.35 g/(L·d) if the aerobic duration were shortened. Therefore, for the treatment of high ammonium wastewater, high NH4-N loading rates could be adopted, so as to decrease the reactor volume and increase the treatment capacity.
Figure 1. Dynamics of different types of nitrogen during the long-term operation from both the (A) denitrification and (B) nitrification reactors.
Water 06 02978 g001
The dynamics of nitrogen, pH and DO in typical cycles of the denitrification reactor are shown in Figure 2. The pH was in the range of 8–9, and DO concentrations in the anaerobic and aerobic phases were about 0 mg/L and 3 mg/L, respectively. At the initial 2 h of the anaerobic phase, heterotrophic denitrifiers utilized external organic carbon with NO2-N as the electron acceptor. However, after the initial two hours reaction, the concentration of NO2-N had little change in the following reaction phases, indicating that denitrification by utilizing external carbon occurred mainly during the initial 2 h. The dynamics of NH4-N showed that there were nitrifiers in the reactor, where NH4-N was almost nitrified to NO2-N and little NO3-N during the aerobic phase.
The dynamics of nitrogen, pH and DO in typical cycles of the nitrification reactor are shown in Figure 2. All NH4-N was nitrified by nitrifiers within the initial 3 h (containing a 2-h aerobic period), which was mainly converted to NO2-N. In this reactor, no changes in the concentration of NO3-N occurred, as NOB was inhibited. Even under conditions of no NH4-N and increased DO, NOB was still inhibited, with the effluent containing mainly NO2-N. In the initial aerobic phase, the pH decreased, owing to nitrification, and then increased as the stripping of CO2 when NH4-N was nitrified completely.
From the typical cycle result, nitrification also occurred in the denitrification reactor. Therefore, the activities of nitrifiers in both the nitrification and denitrification reactors were examined. With a pH of 8.3–9.0 and DO of 5–7 mg/L, for nitrifiers from the nitrification reactor, NH4-N was mainly nitrified to NO2-N, with a NH4-N nitrifying rate of 25.5 mg/(g·h) and a production rate of NO2-N and NO3-N of 24.6 and 0.7 mg/(g·h), respectively. With a pH of 8.3–9.0 and DO of 6–7 mg/L, for nitrifiers from the denitrification reactor, NH4-N was also mainly nitrified to NO2-N, with a NH4-N nitrifying rate of 7.4 mg/(g·h) and a production rate of NO2-N and NO3-N of 8.2 and 0.5 mg/(g·h), respectively. Comparing the activities of nitrification from both reactors, the activities of AOB from the nitrification reactor were three-times those from the denitrification reactor. The activities of NOB from both reactors were very low. This showed that NOB was inhibited efficiently during the reaction and then washed out, maintaining stable nitritation in both reactors.
Figure 2. Dynamics of nitrogen, pH and DO during a typical cycle from both the (A) denitrification and (B) nitrification reactors.
Water 06 02978 g002
The reasons for achieving stable nitritation are analyzed as follows. Firstly, intermittent aeration might be the main reason. Because the lag time of NOB was longer than that of AOB and after exposure from anoxic to aerobic phases, the activities of NOB could be inhibited more seriously than those of AOB by the intermittent aeration [24]. Secondly, the aeration rate in the nitrification reactor was 1.2 L/min, and the DO concentration was in the range of 1–2 mg/L. Ruiz et al. [29] showed that when DO decreased to 1.4 mg/L, NO2-N began to accumulate, and the NO2-N accumulation rate increased with decreasing DO, with the highest NO2-N accumulation at a DO concentration of 0.7 mg/L. Thus, the low concentration of DO during the initial phase would inhibit the activity of NOB, resulting in the accumulation of NO2-N. However, when the concentration of DO increased to 4–7 mg/L at the later aerobic phases, the activity of NOB was still low, showing that some other reasons responsible for NO2-N accumulation. Thirdly, during the initial two aerobic phases, NH4-N/DO was in the range of 4.8–88.4, with the status of a high NH4-N loading rate. Bernet et al. [30] obtained that nitrite accumulation could be achieved by controlling the NH4-N/DO ratio, and when the ratio of NH4-N/DO was in the range of 10–20, 80% of ammonium could be nitrified to nitrite. According to this result, high NH4-N/DO ratios might cause a high NH4-N loading rate, achieving NO2-N accumulation during the initial two aerobic phases. Finally, the concentration of FA and FNA were in the range of 0.037–18.72 mg/L and 0.012–0.142 mg/L, respectively. Anthonisen et al. [27] found that nitrifiers were inhibited with FA concentrations from 10 to 150 mg/L for AOB and from 0.1 to 1.0 mg/L for NOB, with FNA concentrations between 0.22 and 2.8 mg/L for both AOB and NOB. Therefore, FNA in the typical cycle was below the inhibiting concentration. However, FA was high during the initial phase and was below 10 mg/L after 20 min, and it could inhibit the activities of NOB, resulting in NO2-N accumulation. In a word, the combination of intermittent aeration, low DO, high FA and a high initial NH4-N loading rate were the reasons responsible for the achievement of stable nitritation.

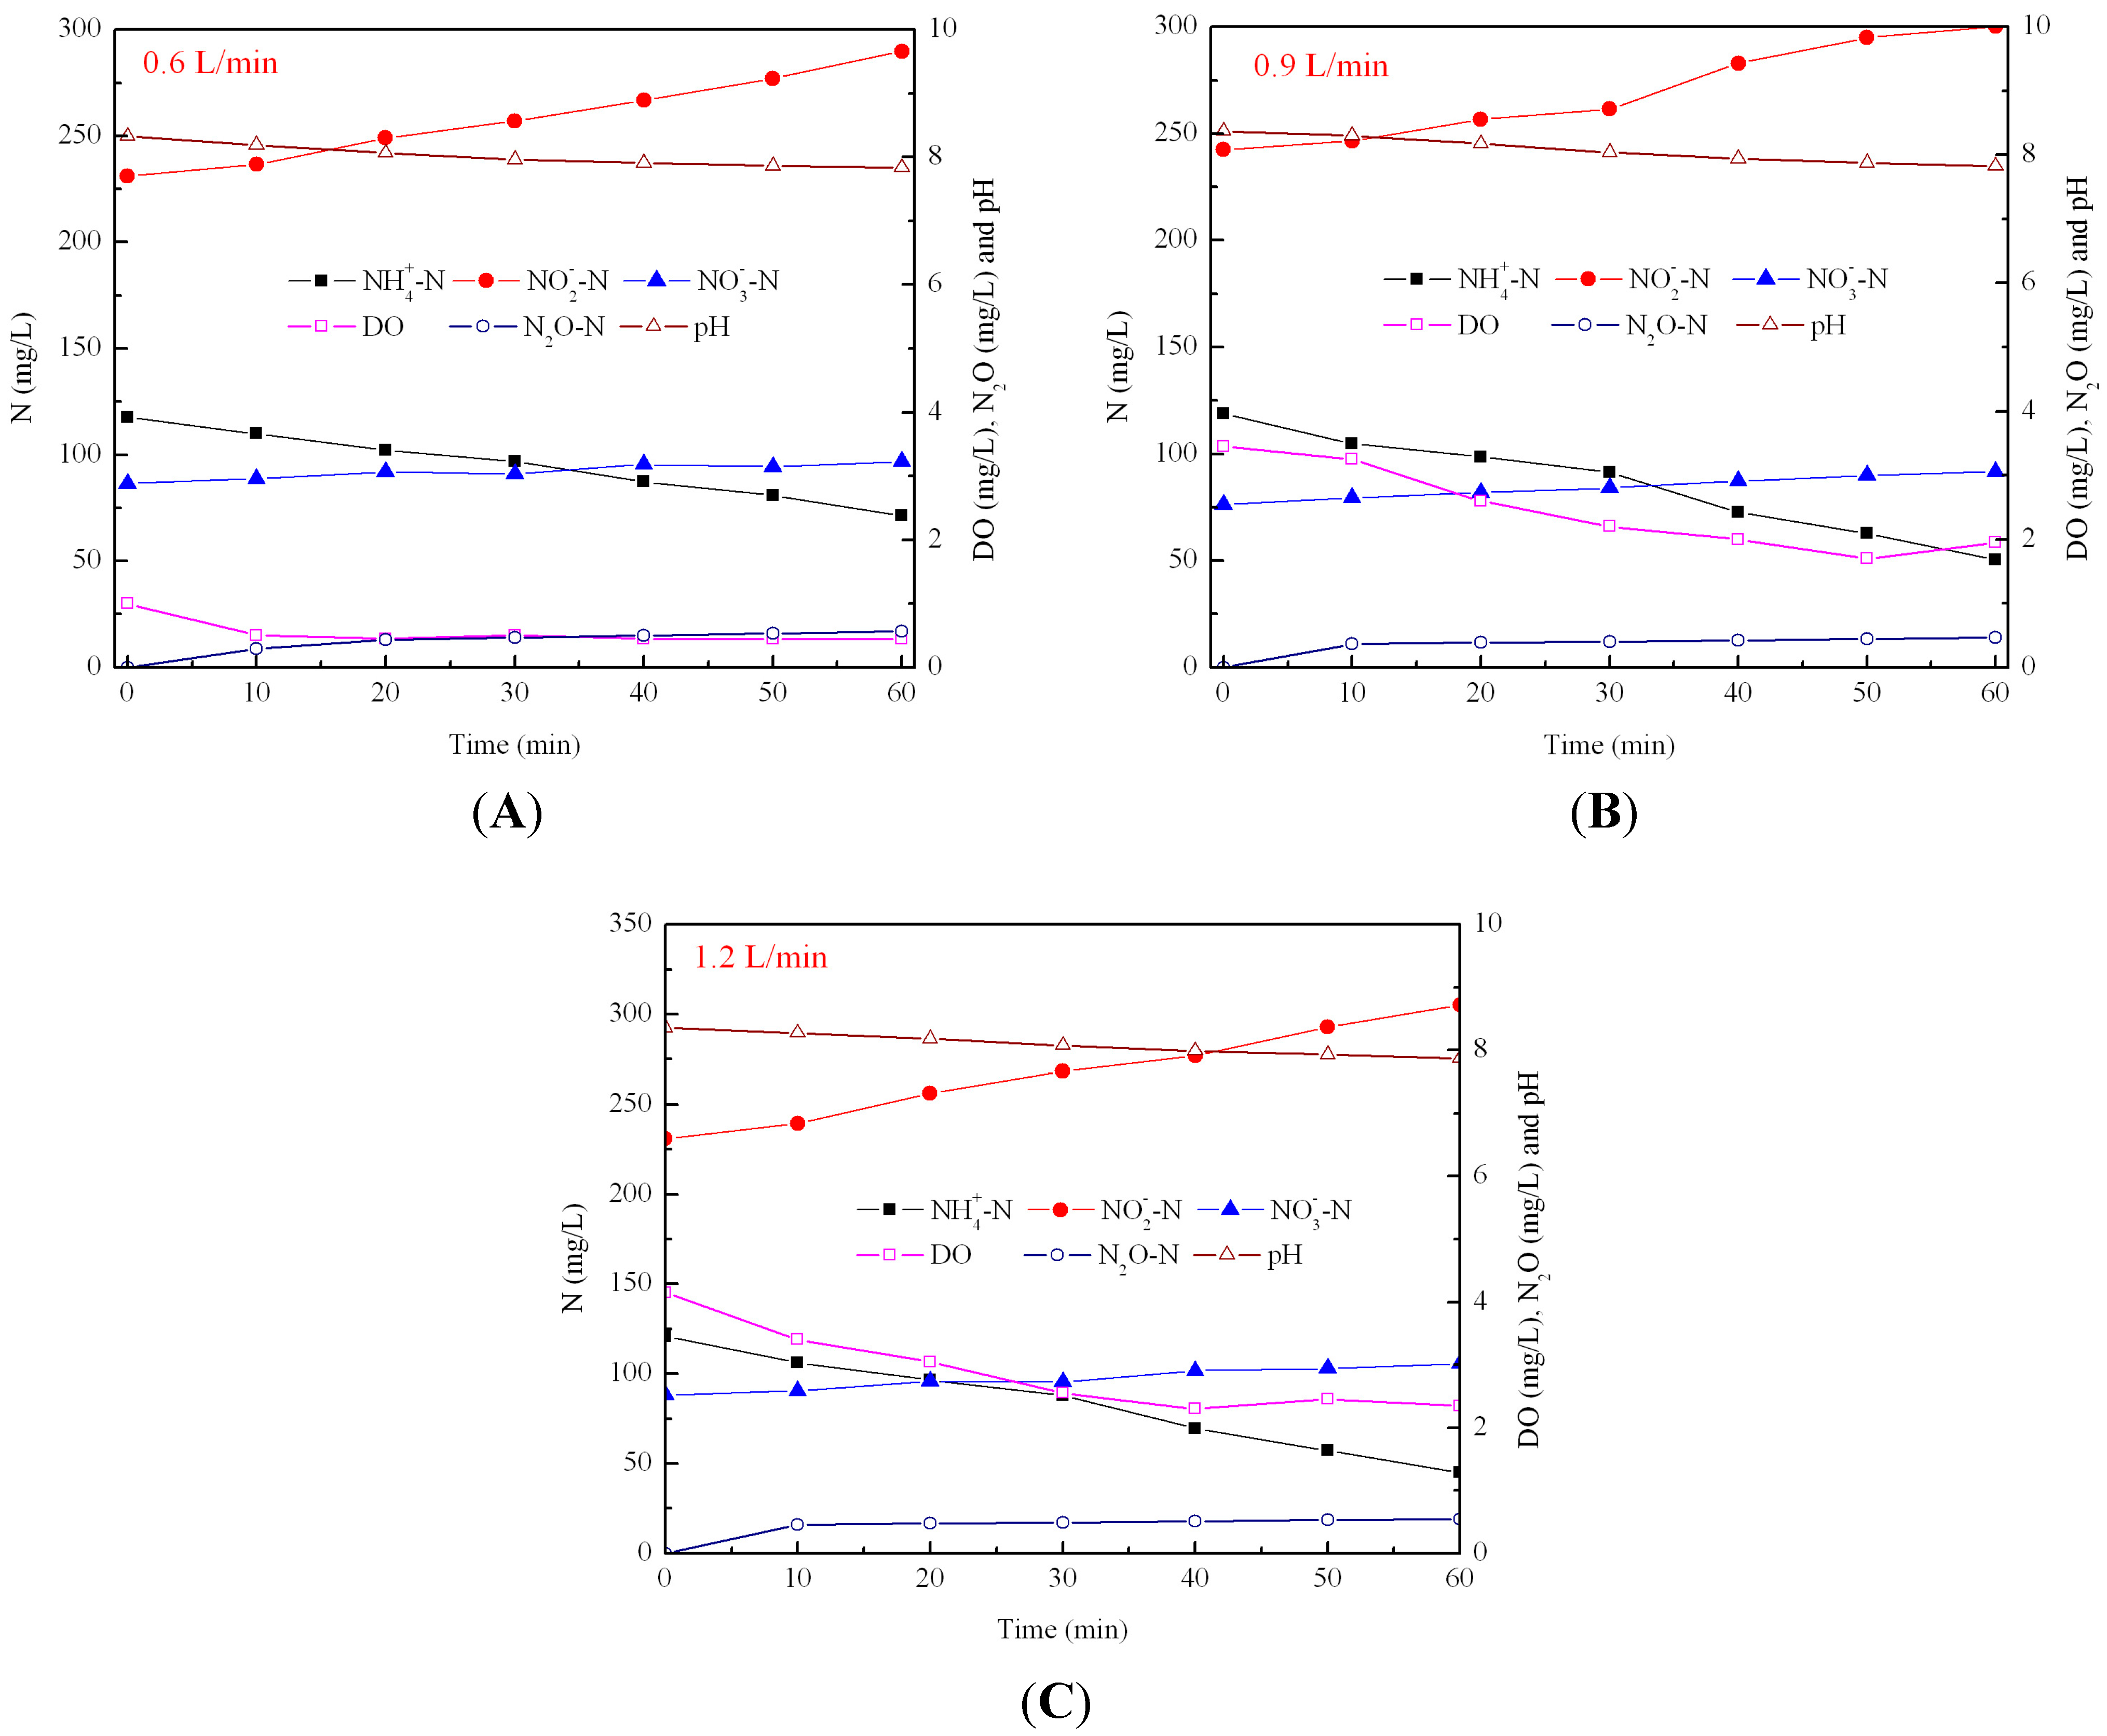
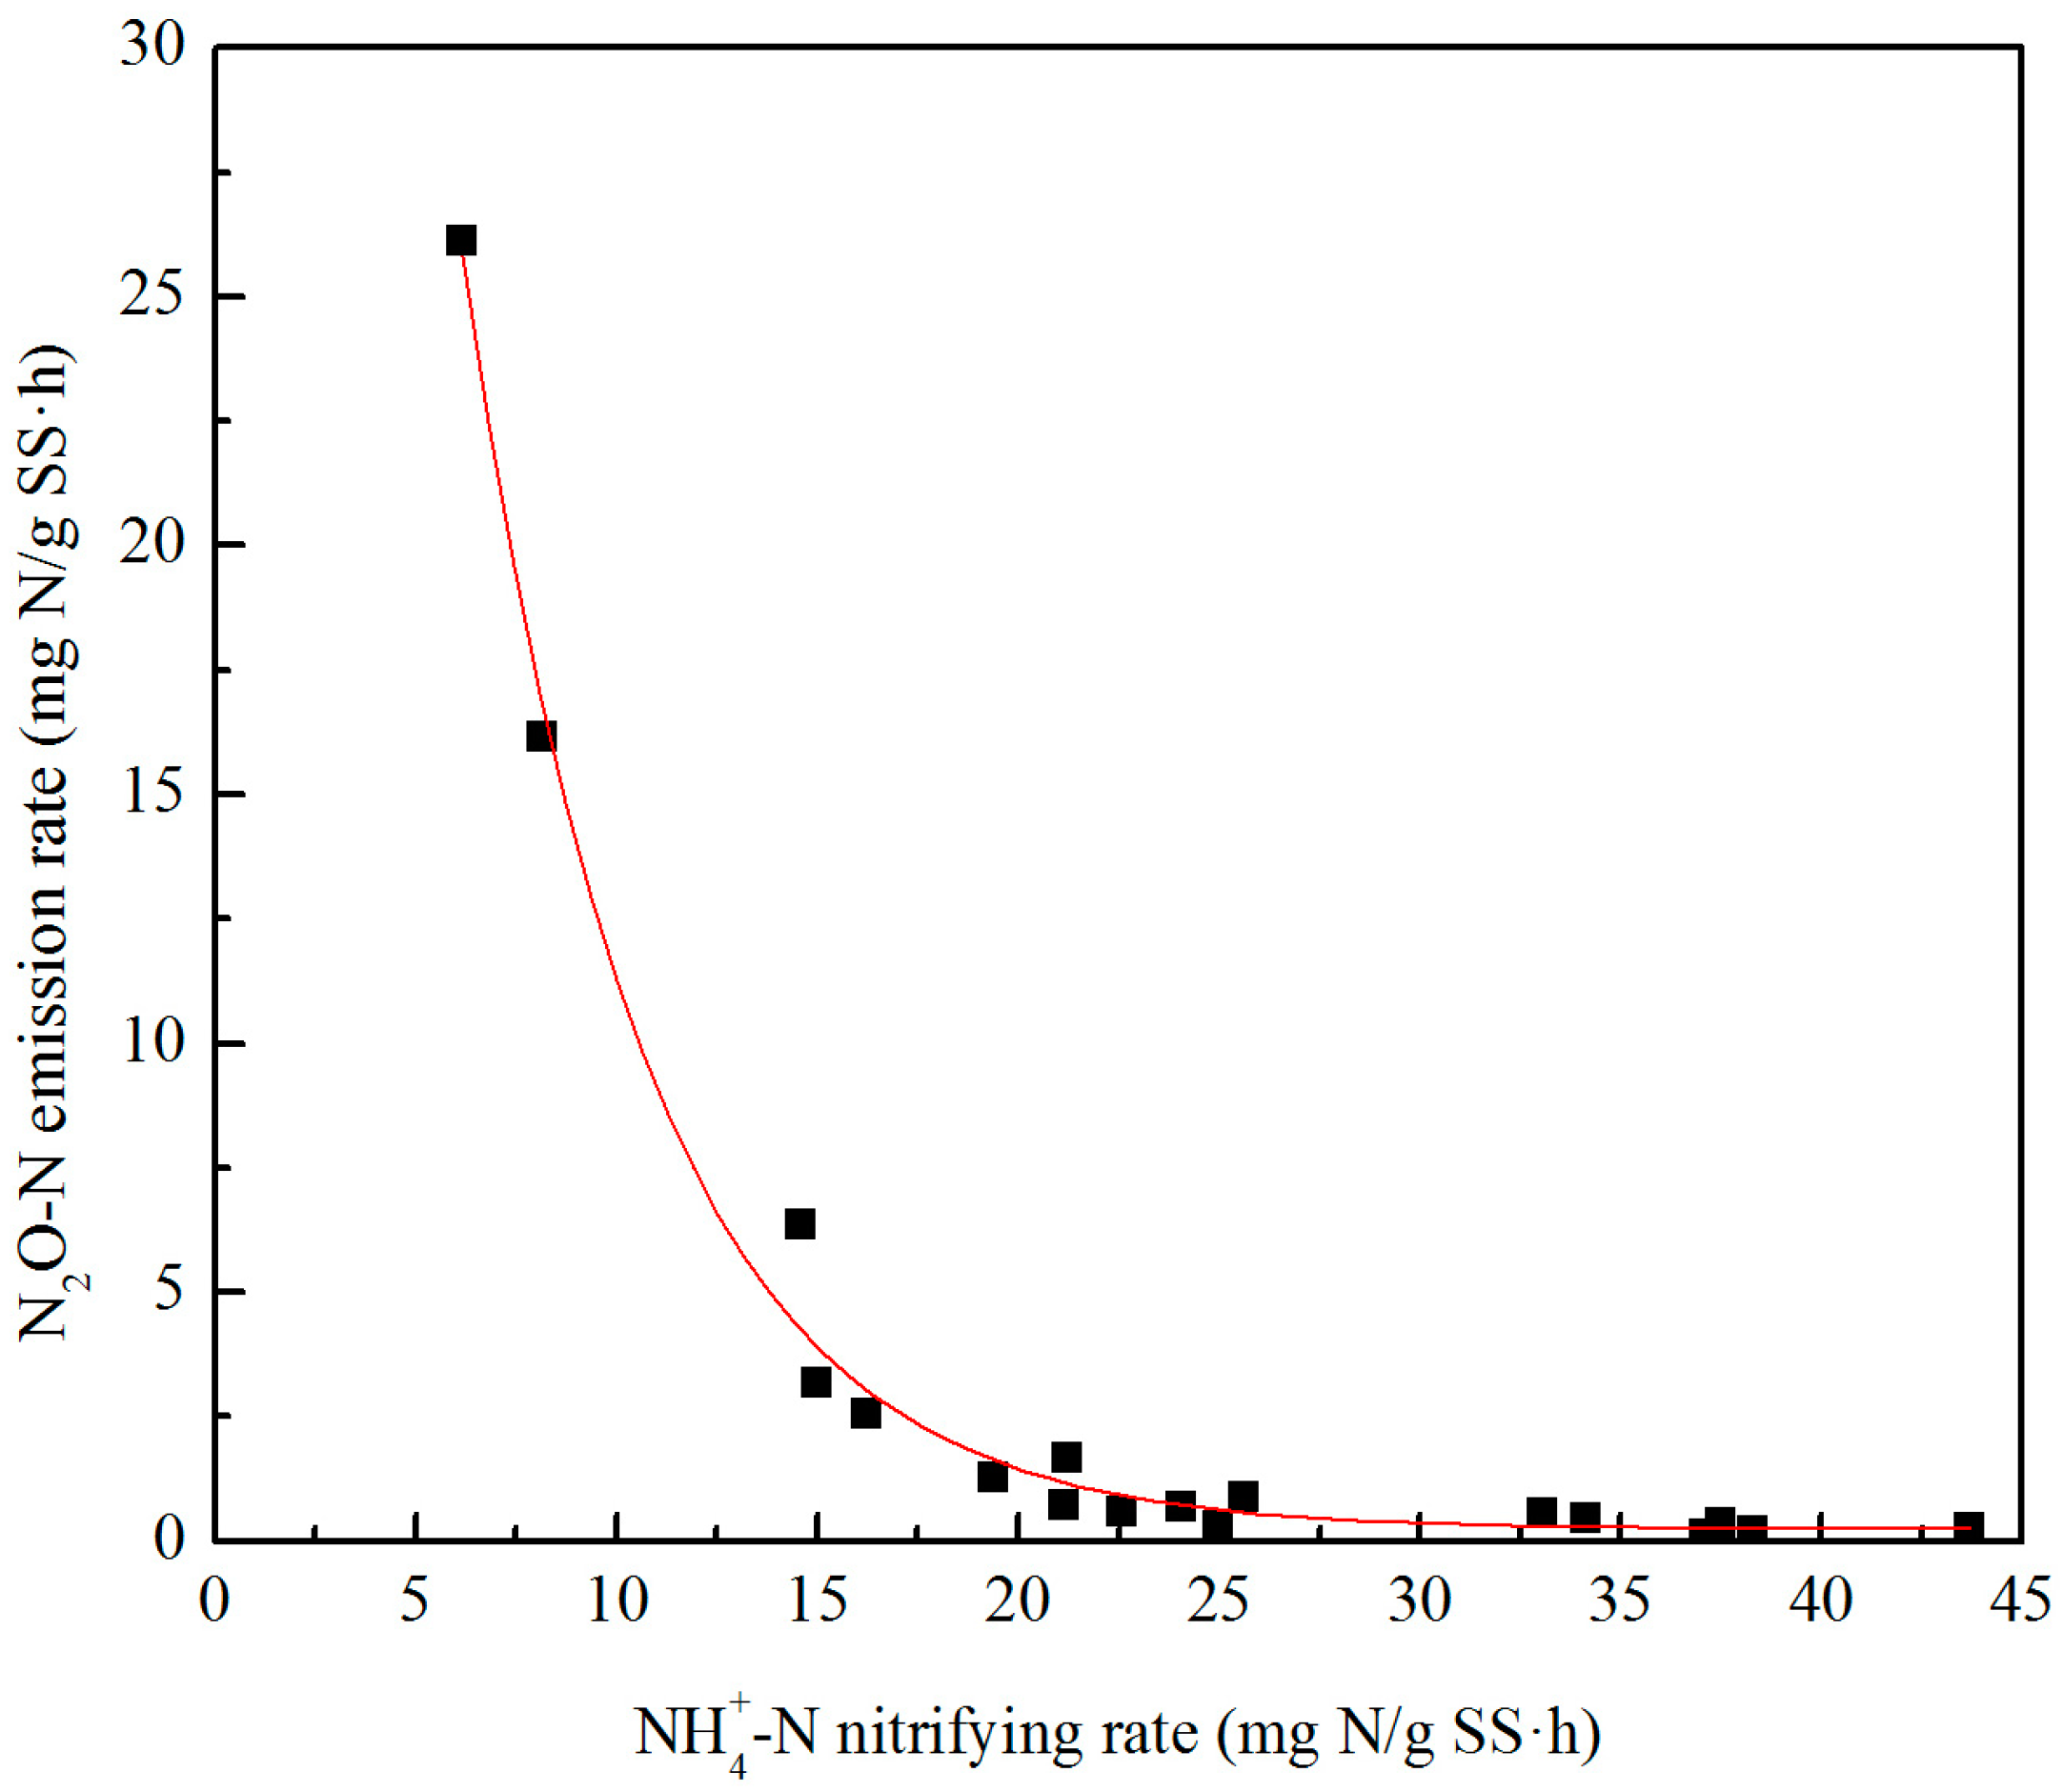
3.2. Effect of Aeration Rates on N2O Emission during Nitrification

The effect of different aeration rates on N2O emission for sludge taken from the nitrification reactor is shown in Figure 3. At an aeration rate of 0.6 L/min, DO was below 1 mg/L, and the activities of AOB were low, with a small amount of NH4-N nitrified to NO2-N. The activities of NOB were even lower, and the production of NO3-N was negligible. At this aeration rate, the amount of N2O emission was very low. When the aeration rate was increased to 0.9 and 1.2 L/min, the concentration of DO was above 2 mg/L and the activity of AOB increased compared with that at an aeration rate of 0.6 L/min. More NH4-N was nitrified to NO2-N, and a small amount of NO3-N was produced.
Table 1 shows the biokinetics of nitrification at different aeration rates. With increasing aeration rates, the oxidation rates of NH4-N and NO2-N increased, but the emission rate of N2O decreased. Simultaneously, by comparing the ratio of the NH4-N oxidation rate and the NO3-N production rate, it was shown that the AOB activity was 4–5-times higher than that of NOB at the three aeration rates. It was also indicated that NO2-N accumulation was due to the higher activity of AOB compared to that of NOB. The activity of AOB increased with increasing aeration rate, leading to an increased NH4-N oxidation rate, while the N2O emission factor decreased. When the aeration rate was above 0.6 L/min, the N2O emission factor was below 1%, while when the nitrifier activity was low, it reached the highest ratio of 26.1%. Rathnayake et al. [4] reported that the N2O emission factors to the influent NH4-N loading rate or to the removal of NH4-N during nitritation were 0.8% and 1.5%, respectively. However, Desloover et al. [3] found that the N2O emission factor was in the range of 5.1%–6.6%. Schneider et al. [31] reported that when the concentration of NO2-N was above 220 mg/L, it had little influence on N2O emission. Compared with the study of Schneider et al. [31], the concentration of NO2-N was not the main factor affecting N2O emission. Thus, the main factor for N2O emission under different aeration rates was mainly due to the supplied amount of DO.
Figure 3. The effect of aeration rates on the N2O emissions for nitrifiers taken from the nitrification reactor. The air flow rate was 0.6 L/min (A); 0.9 L/min (B) and 1.2 L/min (C), respectively.
Water 06 02978 g003
Table 1. The effect of different aeration rates on biokinetics for nitrifiers taken from the nitrification reactor.
Aeration rate (L/min)rNH4-N (mg/g·h)rNO2-N (mg/g·h)rNO3-N (mg/g·h)rN2O (mg/g·h)rNH4-N/rNO3-NrN2O-N/rNH4-N (%)
0.624.8532.245.300.194.690.78
0.936.2234.038.360.114.330.31
1.237.3136.898.810.094.230.24
To further examine the relationship between the oxidation rate of NH4-N and the N2O emission factor, experimental results with aeration rates of 0.1, 0.2, 0.4, 0.6, 0.9 and 1.2 L/min are shown in Figure 4. For the N2O emission factor (η) and the NH4-N oxidation rate (rNH4-N), an exponential relationship existed, and the expression was η = 99.55e (−0.22rNH4−N) +0.23 (R2 = 0.99). When the NH4-N oxidation rate was above 20 mg N/(g SS·h), the N2O emission factor was quiet low. It was possible that at low DO conditions, the NH4-N oxidation rate was low due to the limited supply of oxygen, and AOB would use NO2-N as the electron acceptor, inducing high N2O emissions through nitrifier denitrification by AOB. Schneider et al. [31] found that the NH4-N oxidation rate had a positive correlation with the N2O production rate, but it had no obvious effect on the N2O emission factor. Law et al. [32] found that for the treatment of supernatant from anaerobic digestion sludge, the N2O production rate increased exponentially with the NH3 oxidation rate, and N2O production was due to the chemical breakdown of nitrosyl radical (NOH), an intermediate in hydroxylamine (NH2OH) oxidation, rather than nitrifier denitrification or the biological reduction of NO formed during NH2OH oxidation to nitrite. The possible reasons for the different results might be due to different operating conditions, different acclimated functional bacteria and metabolic patterns (such as nitrifier denitrification or hydroxylamine oxidation) [33,34]. Therefore, it is necessary to further clarify the relationship between the N2O emission factor and the corresponding biological activities.
Figure 4. The relationship between the N2O emission factor and the nitrifying rate for nitrifiers taken from the nitrification reactor. (SS referring to suspended solids).
Water 06 02978 g004

3.3. Effect of C/N Ratios on N2O Emissions during Denitrification
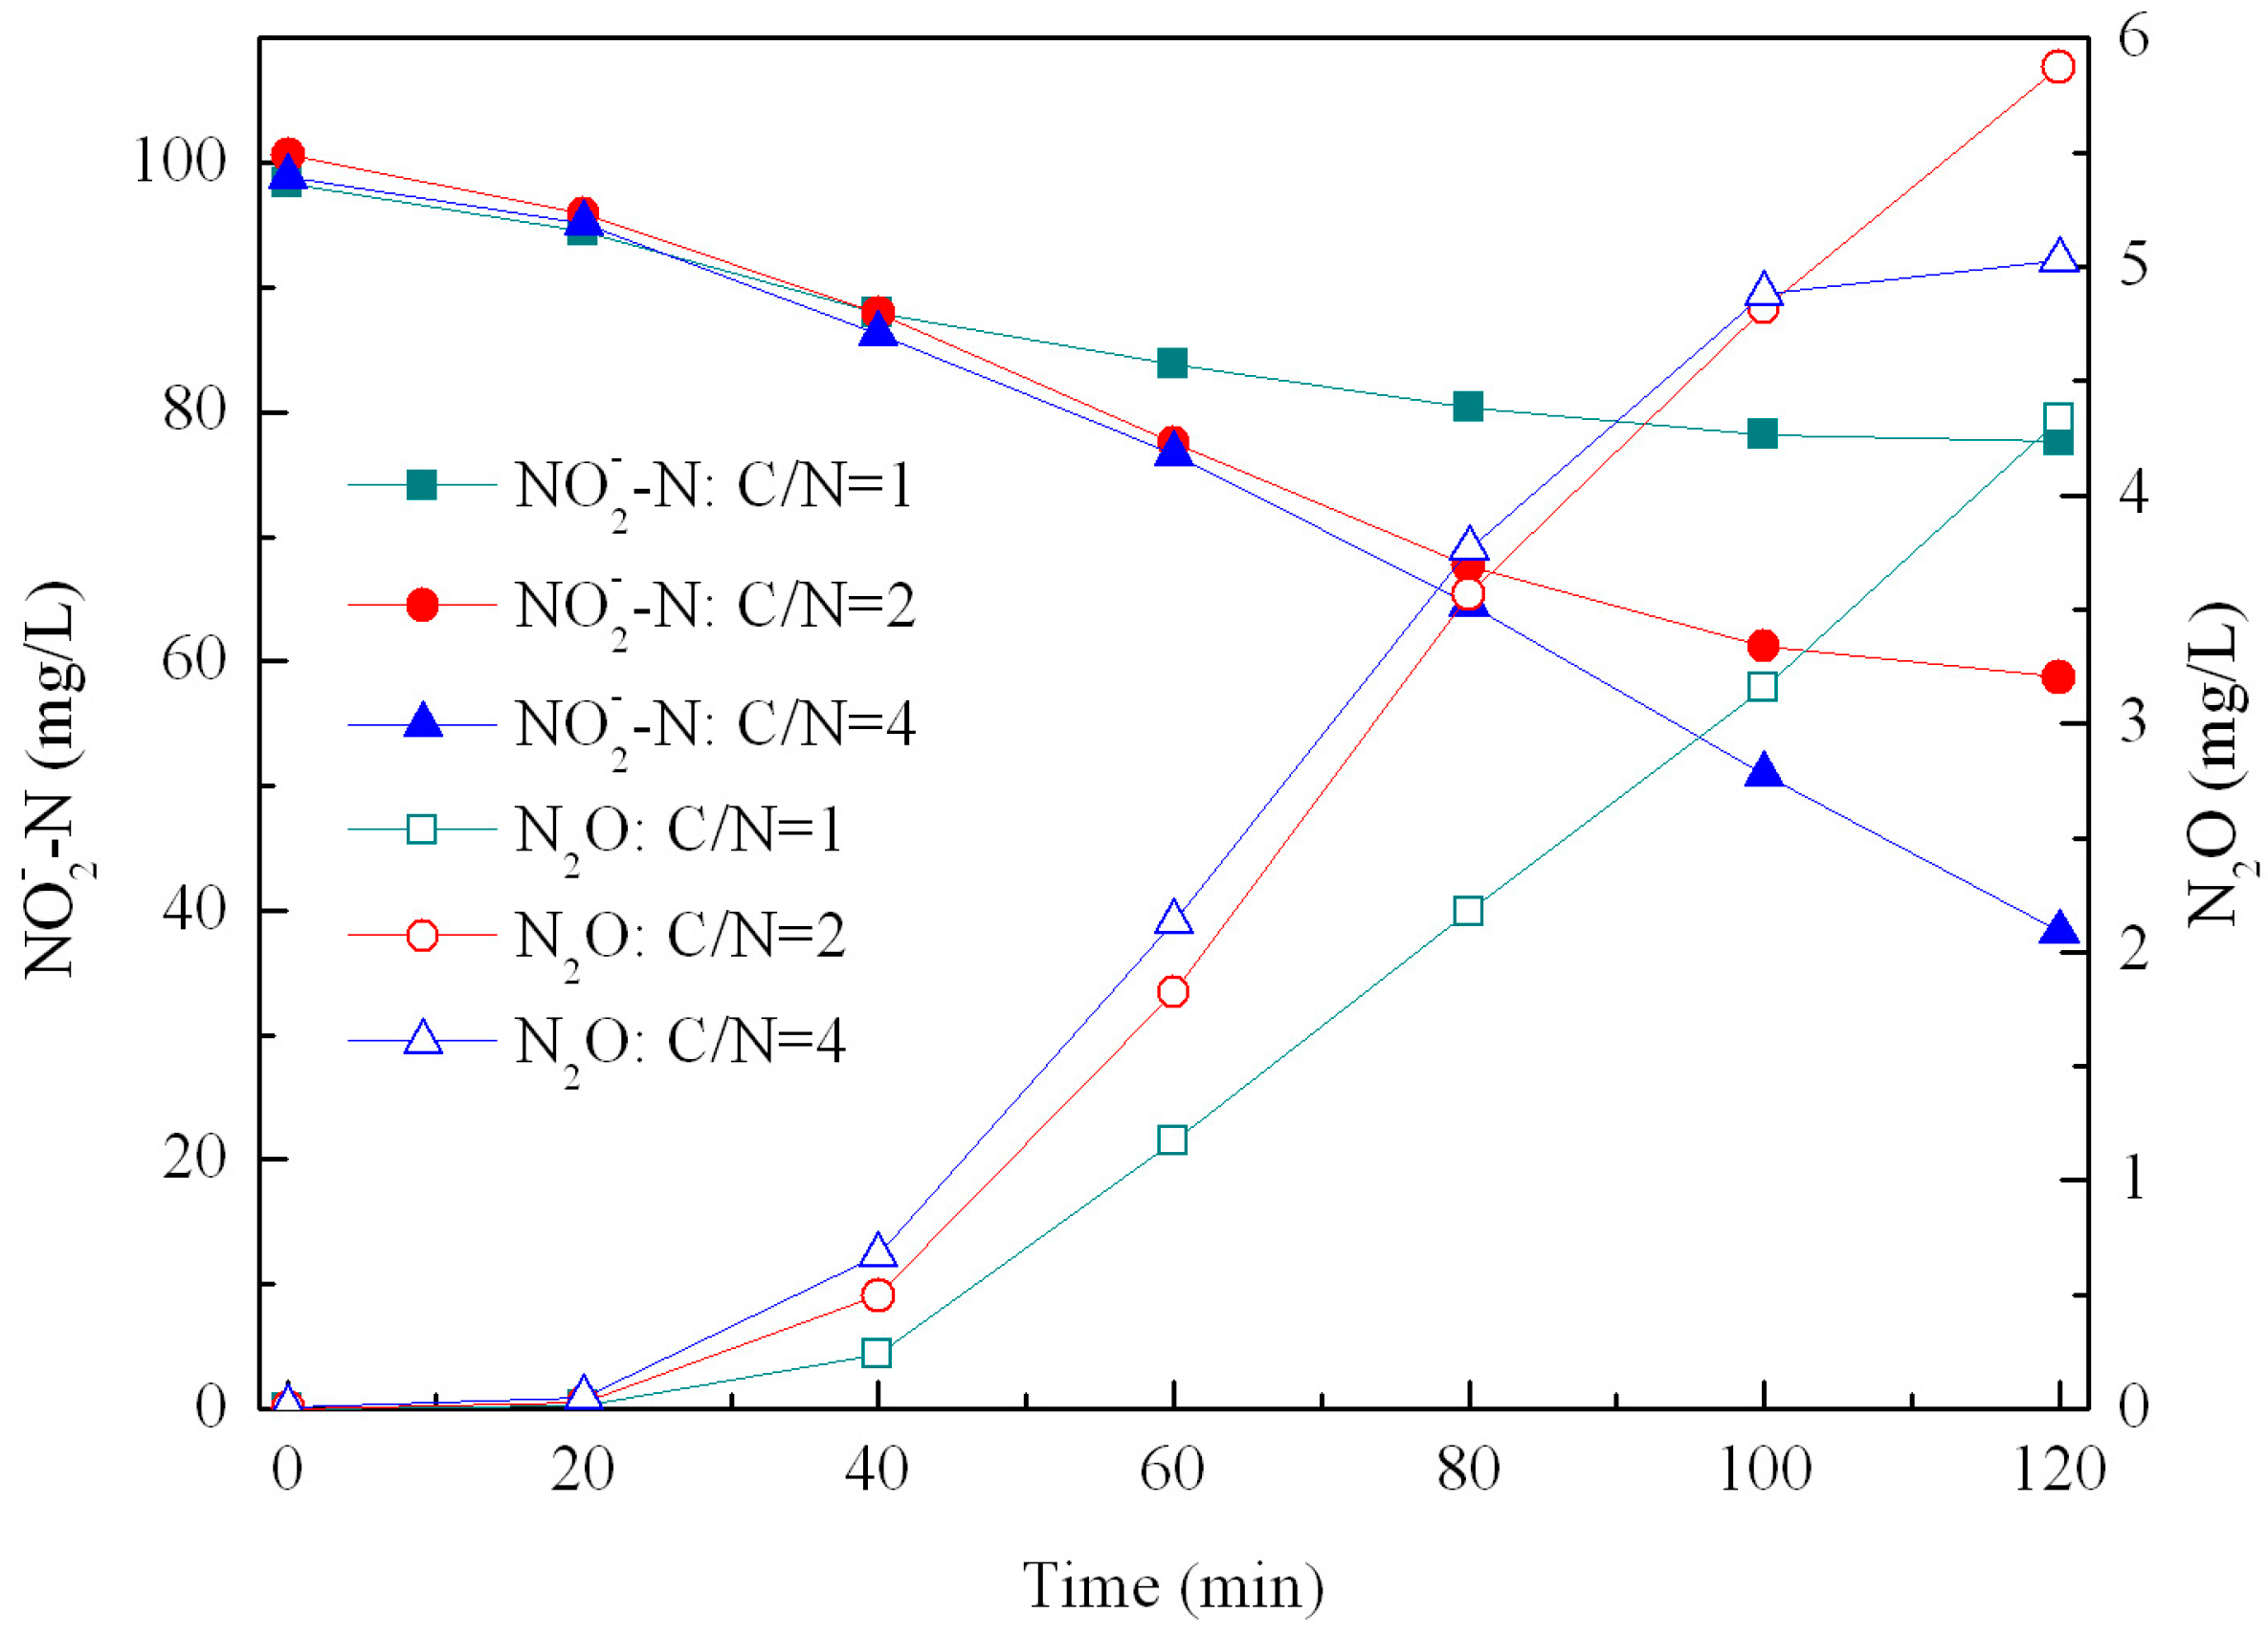
Figure 5 shows the effects of C/N ratios on N2O emissions during denitrification with NO2-N as the electron acceptor. When the C/N ratio was one, the concentration of NO2-N decreased from 100 mg/L to 80 mg/L during the initial 2 h, which had a slow denitrification rate. During the initial 2 h, the amount of N2O-N emissions was 5.5 mg/L. With the C/N ratio increased to two and four, the removal of NO2-N increased, and the N2O-N emissions were in the range of 6–8 mg/L. Therefore, with increasing C/N ratios, the denitrification rate increased, while having less effect on the N2O emissions.
Table 2 shows the biokinetics parameters of denitrification with NO2-N as the electron acceptor under different C/N ratios. When the C/N ratio increased from one to four, denitrification activities increased and the denitrification rate increased from 6.52 mg N/(g SS·h) to 18.35 mg N/(g SS·h). While the N2O emission factor changed a little, it decreased with increasing C/N ratios, which had also been observed in some previous studies with nitrate as the electron acceptor [35]. Alinsafi et al. [36] obtained that during denitrification with NO3-N as the electron acceptor, a low C/N ratio caused NO2-N accumulation, inhibited N2O reductase and induced N2O emissions. Itokawa et al. [37] found that at the low C/N ratio, NO2-N existence and endogenous denitrification were the main reasons for the increased N2O emissions. Some studies showed that the inhibitory effect of denitrifiers was not directly due to NO2-N, but due to its role in the biological formation of NO, which was a highly toxic compound [38]. Hence, during denitrification with NO2-N as the electron acceptor, it was possible that a low C/N ratio meant a carbon shortage and led to NO accumulation, which inhibited the activity of denitrification and induced increased N2O emissions; in addition, NO2-N might inhibit the N2O reductase activity and cause N2O emissions [36,39]. The N2O emission factor during denitrification under different C/N ratios was in the range of 12.0%–26.6%. Alinsafi et al. [36] obtained N2O emission factors during denitrification with NO3-N as the electron acceptor of 5.1%, 2.6% and 1% at C/N ratios of 3, 5 and 7, respectively. The N2O emission factor in this study was relatively high, which could be due to NO2-N being the electron acceptor. Lemaire et al. [40] found that during denitrification, the N2O emission factor increased three-times after adding NO2-N. Therefore, denitrification with NO2-N as the electron acceptor might cause high N2O emissions. For practical system operation, an appropriate operating mode should be adopted to decrease N2O emissions. For example, continuous feed may be a way to control the concentration of NO2-N and to reduce N2O emissions.
Figure 5. The effect of C/N ratios on N2O emissions for denitrifiers taken from the denitrification reactor.
Water 06 02978 g005
Table 2. The effect of different C/N ratios on the biokinetics of denitrifiers taken from the denitrification reactor.
C/NrNO2-N (mg/g·h)rN2O (mg/g·h)rN2O-N/rNO2-N (%)
16.521.7126.63
212.962.2717.55
418.352.1711.98
For the treatment of high ammonium and low C/N ratio containing wastewater, the two-sludge system achieved nitritation efficiently. The denitrification reactor removed nitrogen by utilizing the influent organic carbon efficiently. For the nitrification reactor, the main reasons for achieving nitritation were the intermittent aeration, high FA and low DO that washed out NOB, resulting in stable nitrite accumulation. By the two-sludge system, stable nitritation was achieved, with a nitritation efficiency of 97.8%. This was an important prerequisite step for the following novel nitrogen removal processes, so as to achieve highly efficient nitrogen removal. One of the ultimate aims of wastewater treatment is to remove nitrogen efficiently and, at the same time, to avoid secondary pollutant emissions, such as N2O emissions, and by this means, the sustainable management of the wastewater industry could be achieved. During nitrogen removal, both nitrification and denitrification may lead to N2O emissions. During nitrification, the NH4-N oxidation rate and N2O emissions could be controlled by appropriate aeration rates. During denitrification, C/N ratios had a high effect on N2O emissions, and the N2O emission factor could reach 26.6% when the C/N ratio was one. Therefore, for denitrifying high ammonium containing wastewater with low C/N ratios, the recycling ratio of nitrified wastewater should be adjusted, so as to control the concentration of NO2-N, namely the C/N ratio, consequently decreasing N2O emissions. From the view of controlling N2O emission, it was necessary to further optimize the two-sludge treatment process, in which stable nitritation would save the cost of aeration, decrease N2O emissions and provide nitrite for the following novel nitrogen removal processes, such as anaerobic ammonium oxidation.

4. Conclusions

(1)
For the treatment of high ammonium containing wastewater with a low C/N ratio, the two-sludge system achieved nitritation efficiently with a nitrite accumulation efficiency of 97.8%. As to the influent NH4-N of 800 mg/L, the nitrogen removal percentage was 43.4% and the NH4-N removal loading rate was 0.45 g/(L·d).
(2)
During nitrification, the N2O emission factor had a negatively exponential relationship with the NH4-N oxidation rate. A low NH4-N nitrifying rate caused high N2O emissions, and the N2O emission factor was in the range of 0.24%–0.78% when aeration rates were in the range of 0.6–1.2 L/min.
(3)
Denitrifying activities with NO2-N as the electron acceptor increased with increasing C/N ratios, but the N2O emission factor decreased with values in the range of 12.0%–26.6%.

Acknowledgments

This study was supported by the Shenzhen Overseas High-Level Talents Innovation Funds Peacock Plan Project (KQCX20120814155347053).

Author Contributions

Guangxue Wu and Derui Zheng carried out the experiment and prepared the first edition of the manuscript; Lizhen Xing contributed to the collection and analysis of the experiment data.

Conflicts of Interest

The authors declare no conflict of interest.

References

  1. Van Kempen, R.; Mulder, J.W.; Uijterlinde, C.A.; van Loosdrecht, M.C.M. Overview: Full scale experience of the SHARON® process for treatment of rejection water of digested sludge dewatering. Water Sci. Technol. 2001, 44, 145–152. [Google Scholar]
  2. Wunderlin, P. Mechanisms of N2O Production in Biological Wastewater Treatment: From Pathway Identification to Process Control. Ph.D. Thesis, ETH Zurich, Zurich, Switzerland, 2013. [Google Scholar]
  3. Desloover, J.; de Clippeleir, H.; Boeckx, P.; du Laing, G.; Colsen, J.; Verstraete, W.; Vlaeminck, S.E. Floc based sequential partial nitritation and anammox at full scale with contrasting N2O emissions. Water Res. 2011, 45, 2811–2821. [Google Scholar] [CrossRef]
  4. Rathnayake, R.M.L.D.; Song, Y.; Tumendelger, A.; Oshiki, M.; Ishii, S.; Satoh, H.; Toyada, S.; Yoshida, N.; Okabe, S. Source identification of nitrous oxide on autotrophic partial nitrification in a granular sludge reactor. Water Res. 2013, 47, 7078–7086. [Google Scholar] [PubMed]
  5. Shen, L.; Guan, Y.; Wu, G.; Zhan, X. Nitrous oxide emission from a sequencing batch reactor for biological nitrogen and phosphorus removal. Front. Environ. Sci. Eng. 2014, 8, 776–783. [Google Scholar] [CrossRef]
  6. Andrews, J.H.; Harris, R.F. r- and K-selection and microbial ecology. In Advances in Microbial Ecology; Marshall, K.C., Ed.; Springer Science and Business Media: New York, NY, USA, 1986. [Google Scholar]
  7. Li, J.P.; Healy, M.G.; Zhan, X.M.; Rodgers, M. Nutrient removal from slaughterhouse wastewater in an intermittently aerated sequencing batch reactor. Bioresour. Technol. 2008, 99, 7644–7650. [Google Scholar] [CrossRef] [PubMed]
  8. Wang, J.; Yang, N. Partial nitrification under limited dissolved oxygen conditions. Process Biochem. 2004, 39, 1223–1229. [Google Scholar] [CrossRef]
  9. Zekker, I.; Rikmann, E.; Tenno, T.; Menert, A.; Lemmiksoo, V.; Saluste, A.; Tenno, T.; Tomingas, M. Modification of nitrifying biofilm into nitritating one by combination of increased free ammonia concentrations, lowered HRT and dissolved oxygen concentration. J. Environ. Sci. 2011, 23, 1113–1121. [Google Scholar] [CrossRef]
  10. Zeng, R.J.; Lemaire, R.; Yuan, Z.; Keller, J. Simultaneous nitrification, denitrification, and phosphorus removal in a lab-scale sequencing batch reactor. Biotechnol. Bioeng. 2003, 84, 170–178. [Google Scholar] [CrossRef] [PubMed]
  11. Kampschreur, M.J.; Tan, N.C.; Kleerebezem, R.; Picioreanu, C.; Jetten, M.S.; van Loosdrecht, M.C.M. Effect of dynamic process conditions on nitrogen oxides emission from a nitrifying culture. Environ. Sci. Technol. 2007, 42, 429–435. [Google Scholar] [CrossRef]
  12. Blackburne, R.; Yuan, Z.; Keller, J. Partial nitrification to nitrite using low dissolved oxygen concentration as the main selection factor. Biodegradation 2008, 19, 303–312. [Google Scholar] [CrossRef] [PubMed]
  13. Abeling, U.; Seyfried, C.F. Anaerobic-aerobic treatment of high-strength ammonium wastewater-nitrogen removal via nitrite. Water Sci. Technol. 1992, 26, 1007–1015. [Google Scholar]
  14. Kampschreur, M.J.; Temmink, H.; Kleerebezem, R.; Jetten, M.S.; van Loosdrecht, M. Nitrous oxide emission during wastewater treatment. Water Res. 2009, 43, 4093–4103. [Google Scholar] [CrossRef] [PubMed]
  15. Beline, F.; Martinez, J. Nitrogen transformations during biological aerobic treatment of pig slurry: Effect of intermittent aeration on nitrous oxide emissions. Bioresour. Technol. 2002, 83, 225–228. [Google Scholar] [CrossRef] [PubMed]
  16. Rodriguez-Caballero, A.; Pijuan, M. N2O and NO emissions from a partial nitrification sequencing batch reactor: Exploring dynamics, sources and minimization mechanisms. Water Res. 2013, 47, 3131–3140. [Google Scholar] [CrossRef] [PubMed]
  17. Rodriguez-Caballero, A.; Ribera, A.; Balcázar, J.L.; Pijuan, M. Nitritation versus full nitrification of ammonium-rich wastewater: Comparison in terms of nitrous and nitric oxides emissions. Bioresour. Technol. 2013, 139, 195–202. [Google Scholar] [CrossRef] [PubMed]
  18. Adouani, N.; Lendormi, T.; Limousy, L.; Sire, O. Effect of the carbon source on N2O emissions during biological denitrification. Resour. Conserv. Recycl. 2010, 54, 299–302. [Google Scholar] [CrossRef]
  19. Pijuan, M.; Torà, J.; Rodríguez-Caballero, A.; César, E.; Carrera, J.; Pérez, J. Effect of process parameters and operational mode on nitrous oxide emissions from a nitritation reactor treating reject wastewater. Water Res. 2014, 49, 23–33. [Google Scholar] [CrossRef]
  20. Tallec, G.; Garnier, J.; Billen, G.; Gousailles, M. Nitrous oxide emissions from secondary activated sludge in nitrifying conditions of urban wastewater treatment plants: Effect of oxygenation level. Water Res. 2006, 40, 2972–2980. [Google Scholar] [CrossRef] [PubMed]
  21. Stenström, F.; Tjus, K.; la Cour Jansen, J. Oxygen-induced dynamics of nitrous oxide in water and off-gas during the treatment of digester supernatant. Water Sci. Technol. 2014, 69, 84–91. [Google Scholar] [CrossRef] [PubMed]
  22. Quan, X.; Zhang, M.; Lawlor, P.G.; Yang, Z.; Zhan, X. Nitrous oxide emission and nutrient removal in aerobic granular sludge sequencing batch reactors. Water Res. 2012, 46, 4981–4990. [Google Scholar] [CrossRef] [PubMed]
  23. Chiu, Y.C.; Chung, M.S. Determination of optimal COD/nitrate ratio for biological denitrification. Int. Biodeterior. Biodegrad. 2003, 51, 43–49. [Google Scholar] [CrossRef]
  24. Li, Q.; Li, P.; Zhu, P.; Wu, J.; Liang, S. Effects of exogenous organic carbon substrates on nitrous oxide emissions during the denitrification process of sequence batch reactors. Environ. Eng. Sci. 2008, 25, 1221–1228. [Google Scholar] [CrossRef]
  25. Smolders, G.J.F.; van der Meij, J.; van Loosdrecht, M.C.M.; Heijnen, J.J. Model of the anaerobic metabolism of the biological phosphorus removal process: Stoichiometry and pH influence. Biotechnol. Bioeng. 1994, 43, 461–470. [Google Scholar] [CrossRef] [PubMed]
  26. Clescerl, L.S.; Greenberg, A.E.; Eaton, A.D. (Eds.) Standard Methods for the Examination of Water and Wastewater, 20th ed.; American Public Health Association: Washington, DC, USA, 1999.
  27. Anthonisen, A.C.; Loehr, R.C.; Prakasam, T.B.S.; Srinath, E.G. Inhibition of nitrification by ammonia and nitrous acid. J. Water Pollut. Control Fed. 1976, 48, 835–852. [Google Scholar] [PubMed]
  28. Law, Y.; Lant, P.; Yuan, Z. The effect of pH on N2O production under aerobic conditions in a partial nitritation system. Water Res. 2011, 45, 5934–5944. [Google Scholar] [CrossRef] [PubMed]
  29. Ruiz, G.; Jeison, D.; Chamy, R. Nitrification with high nitrite accumulation for the treatment of wastewater with high ammonia concentration. Water Res. 2003, 37, 1371–1377. [Google Scholar] [CrossRef] [PubMed]
  30. Bernet, N.; Sanchez, O.; Cesbron, D.; Steyer, J.P.; Delgenès, J.P. Modeling and control of nitrite accumulation in a nitrifying biofilm reactor. Biochem. Eng. J. 2005, 24, 173–183. [Google Scholar] [CrossRef]
  31. Schneider, Y.; Beier, M.; Rosenwinkel, K.H. Nitrous oxide formation during nitritation and nitrification of high-strength wastewater. Water Sci. Technol. 2013, 67, 2494–2502. [Google Scholar] [CrossRef] [PubMed]
  32. Law, Y.; Ni, B.J.; Lant, P.; Yuan, Z. N2O production rate of an enriched ammonia-oxidising bacteria culture exponentially correlates to its ammonia oxidation rate. Water Res. 2012, 46, 3409–3419. [Google Scholar] [CrossRef] [PubMed]
  33. Ni, B.-J.; Peng, L.; Law, Y.; Guo, J.; Yuan, Z. Modeling of nitrous oxide production by autotrophic ammonia-oxidizing bacteria with multiple production pathways. Environ. Sci. Technol. 2014, 48, 3916–924. [Google Scholar] [CrossRef] [PubMed]
  34. Ni, B.-J.; Ye, L.; Law, Y.; Byers, C.; Yuan, Z. Mathematical modeling of nitrous oxide (N2O) emissions from full-scale wastewater treatment plants. Environ. Sci. Technol. 2013, 47, 7795–7803. [Google Scholar] [CrossRef] [PubMed]
  35. Kishida, N.; Kim, J.; Kimochi, Y.; Nishimura, O.; Sasaki, H.; Sudo, R. Effect of C/N ratio on nitrous oxide emission from swine wastewater treatment process. Water Sci. Technol. 2004, 49, 359–371. [Google Scholar] [PubMed]
  36. Alinsafi, A.; Adouani, N.; Béline, F.; Lendormi, T.; Limousy, L.; Sire, O. Nitrite effect on nitrous oxide emission from denitrifying activated sludge. Process Biochem. 2008, 43, 683–689. [Google Scholar] [CrossRef]
  37. Itokawa, H.; Hanaki, K.; Matsuo, T. Nitrous oxide production in high-loading biological nitrogen removal process under low COD/N ratio condition. Water Res. 2001, 35, 657–664. [Google Scholar] [CrossRef] [PubMed]
  38. Goretski, J.; Hollocher, T.C. Trapping of nitric oxide produced during denitrification by extracellular hemoglobin. J. Biol. Chem. 1988, 263, 2316–2323. [Google Scholar] [PubMed]
  39. Von Schulthess, R.; Wild, D.; Gujer, W. Nitric and nitrous oxides from denitrifying activated sludge at low oxygen concentration. Water Sci. Technol. 1994, 30, 123–132. [Google Scholar]
  40. Lemaire, R.; Meyer, R.; Taske, A.; Crocetti, G.R.; Keller, J.; Yuan, Z.G. Identifying causes for N2O accumulation in a lab-scale sequencing batch reactor performing simultaneous nitrification, denitrification and phosphorus removal. J. Biotechnol. 2006, 122, 62–72. [Google Scholar] [CrossRef] [PubMed]

