Article

Manganese Coated Sand for Copper (II) Removal from Water in Batch Mode

1
Centre for Water Advanced Technologies and Environmental Research (CWATER), College of Engineering, Swansea University, Swansea SA2 8PP, UK
2
Institute Teknologi Nasional, Bandung, Jawa Barat 40124, Indonesia
*
Author to whom correspondence should be addressed.
Water 2013, 5(4), 1487-1501; https://doi.org/10.3390/w5041487
Submission received: 28 July 2013 / Revised: 12 September 2013 / Accepted: 13 September 2013 / Published: 26 September 2013

Abstract

:
Removal of heavy metals, such as copper ions, from water is important to protect human health and the environment. In this study, manganese coated sand (MCS) was used as an adsorbent to remove copper ions in a batch system. Equilibrium data were determined at a temperature of 25.6 °C and the Langmuir model was used to describe the experimental data. Mn-coating improved the removal of copper ions by 70% as compared to uncoated sand. Based on a kinetics study, the adsorption of copper ions on MCS was found to occur through a chemisorption process and the pseudo-second-order model was found to fit the kinetics experimental data well. Due to particle interactions, the equilibrium uptake was reduced as the ratio of sand to volume of solution increased. pH affected the removal of copper ions with lowest uptakes found at pH 3 and pHs >7, whilst at pHs in the range of 4 to 7, the uptake was highest and almost constant at the value of 0.0179 mg/g ± 4%. This study has also revealed that copper ions removal was dissolved oxygen (DO) dependent with the highest removal occurring at ambient DO concentration, which suggests that DO should be carefully studied when dealing with copper ions adsorption.

1. Introduction

Access to safe drinking water is a key factor for public health. However, about one billion people still live in poor regions with limited access to a clean water supply, or water supplies prone to contamination [1]. Because of their health effects, metals in water supplies are of particular interest and high concentrations of metals have already been detected globally in ground waters [2]. Surface water may also become contaminated with metals, as humans and/or industries discharge their wastewaters to nearby water bodies. For example, rivers receiving effluent from electro-plating industries may contain copper, zinc, nickel, chromium (VI), and manganese [3,4]. Heavy metals are not biodegradable and tend to accumulate in living organisms.
Copper occurs naturally as both un-combined metal and in many minerals. Discharges of copper to the environment takes place mainly from anthropogenic activities [5], i.e., mining and smelting, industrial activities, municipal wastes, and sewage sludge [5,6,7,8]. Natural sources of Cu are sea salt sprays, windblown dusts, volcanogenic particles, and decaying vegetation [5].
Excess exposure to Cu in drinking water may cause vomiting, diarrhoea, stomach cramps, nausea, or greenish or bluish stools and saliva [5]; and may have a severe effect on the brain and liver of people with Wilson’s disease [5,9]. Elevated intake of Cu may cause liver and kidney damage, and sometimes death, particularly in children [5,6,7]. Cu concentrations >3.0 mg/L in drinking water have been reported to cause adverse effects in infants [5]. Moreover, long term consumption of water consisting of 2.2–7.8 mg/L Cu(II) may result in stomach pain, vomiting, and hepatocirrhosis (liver disruption) [8]. Removal of copper ions from waters destined for consumption is therefore required.
Despite being widely used, the alkaline precipitation process generates large amounts of sludge that require further disposal [10]. As an alternative, in recent years, metal oxides have been used to remove heavy metals by adsorption from water. Iron, aluminum, and manganese oxides are found to significantly remove heavy metals in waters due to their relatively high surface area, microporous structure, and possession of OH functional groups capable of reacting with metals. Compared to precipitation, adsorption can remove metals over a wider pH range and at lower concentrations. Nevertheless, most metal oxides are only available as fine powders, or are formed in aqueous suspensions as hydroxide floc or gel, requiring additional sedimentation or filtration units to separate the solids formed from the liquid phase. In addition, metal oxides alone are inappropriate as a filter medium due to their low hydraulic conductivity [11,12].
To solve these problems, recent techniques using sand coated with metal oxides were developed and have been found effective to remove heavy metals [12]. A recent study carried out by the authors showed that manganese coated sand (MCS), used in an activated unsaturated sand filter (AUSF), effectively removed Cu from water [13]. To gain a deeper understanding of the effects of the operating parameters on the kinetics of Cu removal with MCS, this study was carried out in a batch system. The effects of initial concentration, ratio of MCS to solution volume, pH, and dissolved oxygen concentration (DO) on the adsorption of Cu ions by MCS under batch conditions were also studied. Langmuir and Freundlich models were used to describe the equilibrium data whilst the kinetics of Cu adsorption was analyzed using the pseudo-first-order, the pseudo-second-order [14], and the Elovich models [15].

2. Materials and Methods

2.1. Materials

All chemicals were purchased from Fisher Scientific, UK, and were of reagent grade. All Cu solutions of desired concentrations were prepared by dissolving the appropriate mass of solid copper nitrate [Cu(NO3)2·3H2O] in Milli-Q water [Millipore (UK) Ltd., Watford, UK] with resistivity of 18.2 MΩ·cm. KMnO4 solutions were also prepared in the same way.

2.2. Preparation of Manganese Coated Sand (MCS)

Natural quartz sand and uncrushed silica sand fractions B (1.18mm–600µm) and C (600µm–300µm) from David Ball Group plc, Cambridge, UK were sieved to the desired sand particle size using a laboratory sieve shaker (Russell Finex Ltd., Middlesex, UK). The preparation of the MCS was done following the detailed procedure at [13]. Briefly the procedure involved drying the sand, soaking it in a 0.01 N KMnO4 solution for about 24 hours, drying, washing to remove excess KMnO4, drying, cooling, and storage before use. The BET specific surface area of MCS is 0.365 m2/g and the pH at which zero charge occurred (pzc) is 7.78 [13]. Further characteristics of MCS can be found in Tizaoui et al. [13].

2.3. Copper Concentration Analysis

The concentration of Cu was determined using an Atomic Absorption Spectrometer (Varian AA240FS Fast Sequential AAS) equipped with Varian SPS3 Autosampler and connected to Varian SpectrAA Worksheet Oriented AA Software Version 5.1 Pro. The wavelength, slit width, and lamp current were 324.8 nm, 0.5 nm, and 4 mA, respectively. The air flow, acetylene flow, and burner height were 13.50 L/min, 2 L/min, and 13.5 nm, respectively. The standard calibration was linear with a correlation coefficient R2 of 0.998 and the instrument detection limit was 0.0030 mg Cu/L.

2.4. Batch Experiments

If not specifically stated, the initial concentration of Cu solution, Mn to sand ratio (γMn), mass of sand (m), pH, and dissolved oxygen concentration (DO) were 23 mg/L, 0.0709 mg Mn/g sand, 50 g, 5, and 8.95 mg/L, respectively. The pH was adjusted using 1 M HNO3 or 1M NaOH solutions. The experiments were done at a constant temperature of 25.6 °C and stirring speed of 150 rpm using an incubator (Innova 44 Incubator Shaker series, New Brunswick Scientific, New Brunswick, NJ, USA). For experiments carried out at pH ≥6, the solutions were initially filtered to remove any potential precipitates of copper hydroxide (theoretically at 23 mg/L, precipitation occurs at pH 5.91, whilst at pHs of 6, 7, 8, and 9, precipitation occurs at copper concentrations of 14.9, 0.1, 1.5 × 10⁻³, and 1.5 × 10⁻⁵ mg/L respectively). The equilibrium isotherm was determined by contacting 50 g MCS with 50 mL of Cu solutions at different concentrations (7–23 mg/L) in 250 mL conical flasks. For the kinetic studies, an initial Cu concentration of approximately 23 mg/L was used and samples were collected at predetermined times in the range 0–240 min. Samples were filtered through a Millex GP Filter (0.22 μm Millipore Express PES Membrane) using a 10 mL Syringe BD Plastipak and the filtrates were then diluted (four times) with millipore water, before analysis for copper with the AAS. Initial experiments revealed that filtration of the sample reduced the concentration of Cu by less than 5%; hence its effect was neglected. The effects of sorbent dosage, DO content and coating were also studied. Various DO concentrations were initially set in the range 0.29 to 17.08 mg/L by bubbling, for a given time, either pure nitrogen or pure oxygen (BOC compressed gas) into the solutions placed in conical flasks. Immediately at the end of bubbling, the conical flasks were covered by double parafilm and tightened by sellotape or wrist rubber to avoid oxygen transfer with the atmosphere. DO was measured by Hach Luminescent Biochemical Oxygen Demand (LBOD) 101 probe connected to HQ30d portable meter. The concentration of Cu adsorbed on MCS at a given time, q, is calculated using Equation (1) derived from a mass balance over the liquid phase.
Water 05 01487 i001
where: q is adsorption uptake (mg of Cu/g MCS); C0 and C are Cu concentrations (mg/L) at t = 0 and at a time t respectively; V is the solution volume (L); and m is the adsorbent mass (g). At equilibrium q and C become qe and Ce respectively.

3. Results and Discussion

3.1. Equilibrium Isotherm

Equilibrium isotherm of Cu ions adsorption by MCS at 25.6 °C was studied using initial Cu concentrations (C0) of 7, 14, 18, and 23 mg/L. Figure 1 shows the equilibrium uptake, qe, at 25.6 °C versus the liquid concentration at equilibrium. The equilibrium data were fitted with Langmuir (qe = qmbCe/(1 + bCe)) and Freundlich (qe = KCe1/n) equations and the former gave the best fit with R2 = 0.992 (Figure 1 and Table 1). Other adsorption studies on metal removal in water have also shown that Langmuir equation fitted the experimental data better than Freundlich equation [14,16,17]. In this study, the maximum uptake of Cu by MCS, qm was 0.0164 mg/g; while the Langmuir constant, b, was 3.1326 L/mg. It is to note that the qm value obtained in this study is lower than that obtained by Lee et al. [10], who obtained qm = 1 mg Cu2+/g manganese-coated sand in a fluidized bed. This may due to the high Mn ratio of 8.03 mg Mn/g MCS they used as compared to only 0.0709 mg Mn/g MCS used in this study. To assess the feasibility of the process, the separation factor RLwas calculated (RL = 1/(1 + bC0)) using Langmuir constant b and concentrations in the range 7–23 mg/L (Table 2). It was found that RL varied in the range 0.0135–0.0444 (i.e., 0 < RL < 1) indicating that at all C0, the adsorption of Cu by MCS was favorable.
Table 1. Langmuir and Freundlich parameters (Cin = 7–23 mg/L, msand = 50 g, pH = 5, Vsolution = 50 mL, shaker speed = 150 rpm).
IsothermParameterValue
Langmuirqm (mg/g)0.0164
b (L/mg)3.1326
R20.9920
Freundlichn4.5351
K ((mg/g) (L/mg)1/n)0.0103
R20.9890
Figure 1. Equilibrium isotherm of Cu adsorption by MCS at 25.6 °C, pH = 5 and γMn = 0.0709 mg Mn/g sand. Langmuir equation is presented by the dashed line.
Water 05 01487 g001
Table 2. Separation factor values for copper sorption by manganese coated sand (MCS) at 25.6 °C (msand = 50 g, Vsolution = 50 mL, pH = 5, shaker speed = 150 rpm).
Cin (mg/L)CL (L/mg)RL
73.13260.0444
143.13260.0225
183.13260.0174
233.13260.0135

3.2. Adsorption Kinetics

3.2.1. Effect of Initial Copper Concentration

The rate of metal removal is an important factor in developing an adsorbent-based water treatment technology. The kinetics of the adsorption of Cu ions on MCS were studied using contact times ranging from 0 to 240 min. 
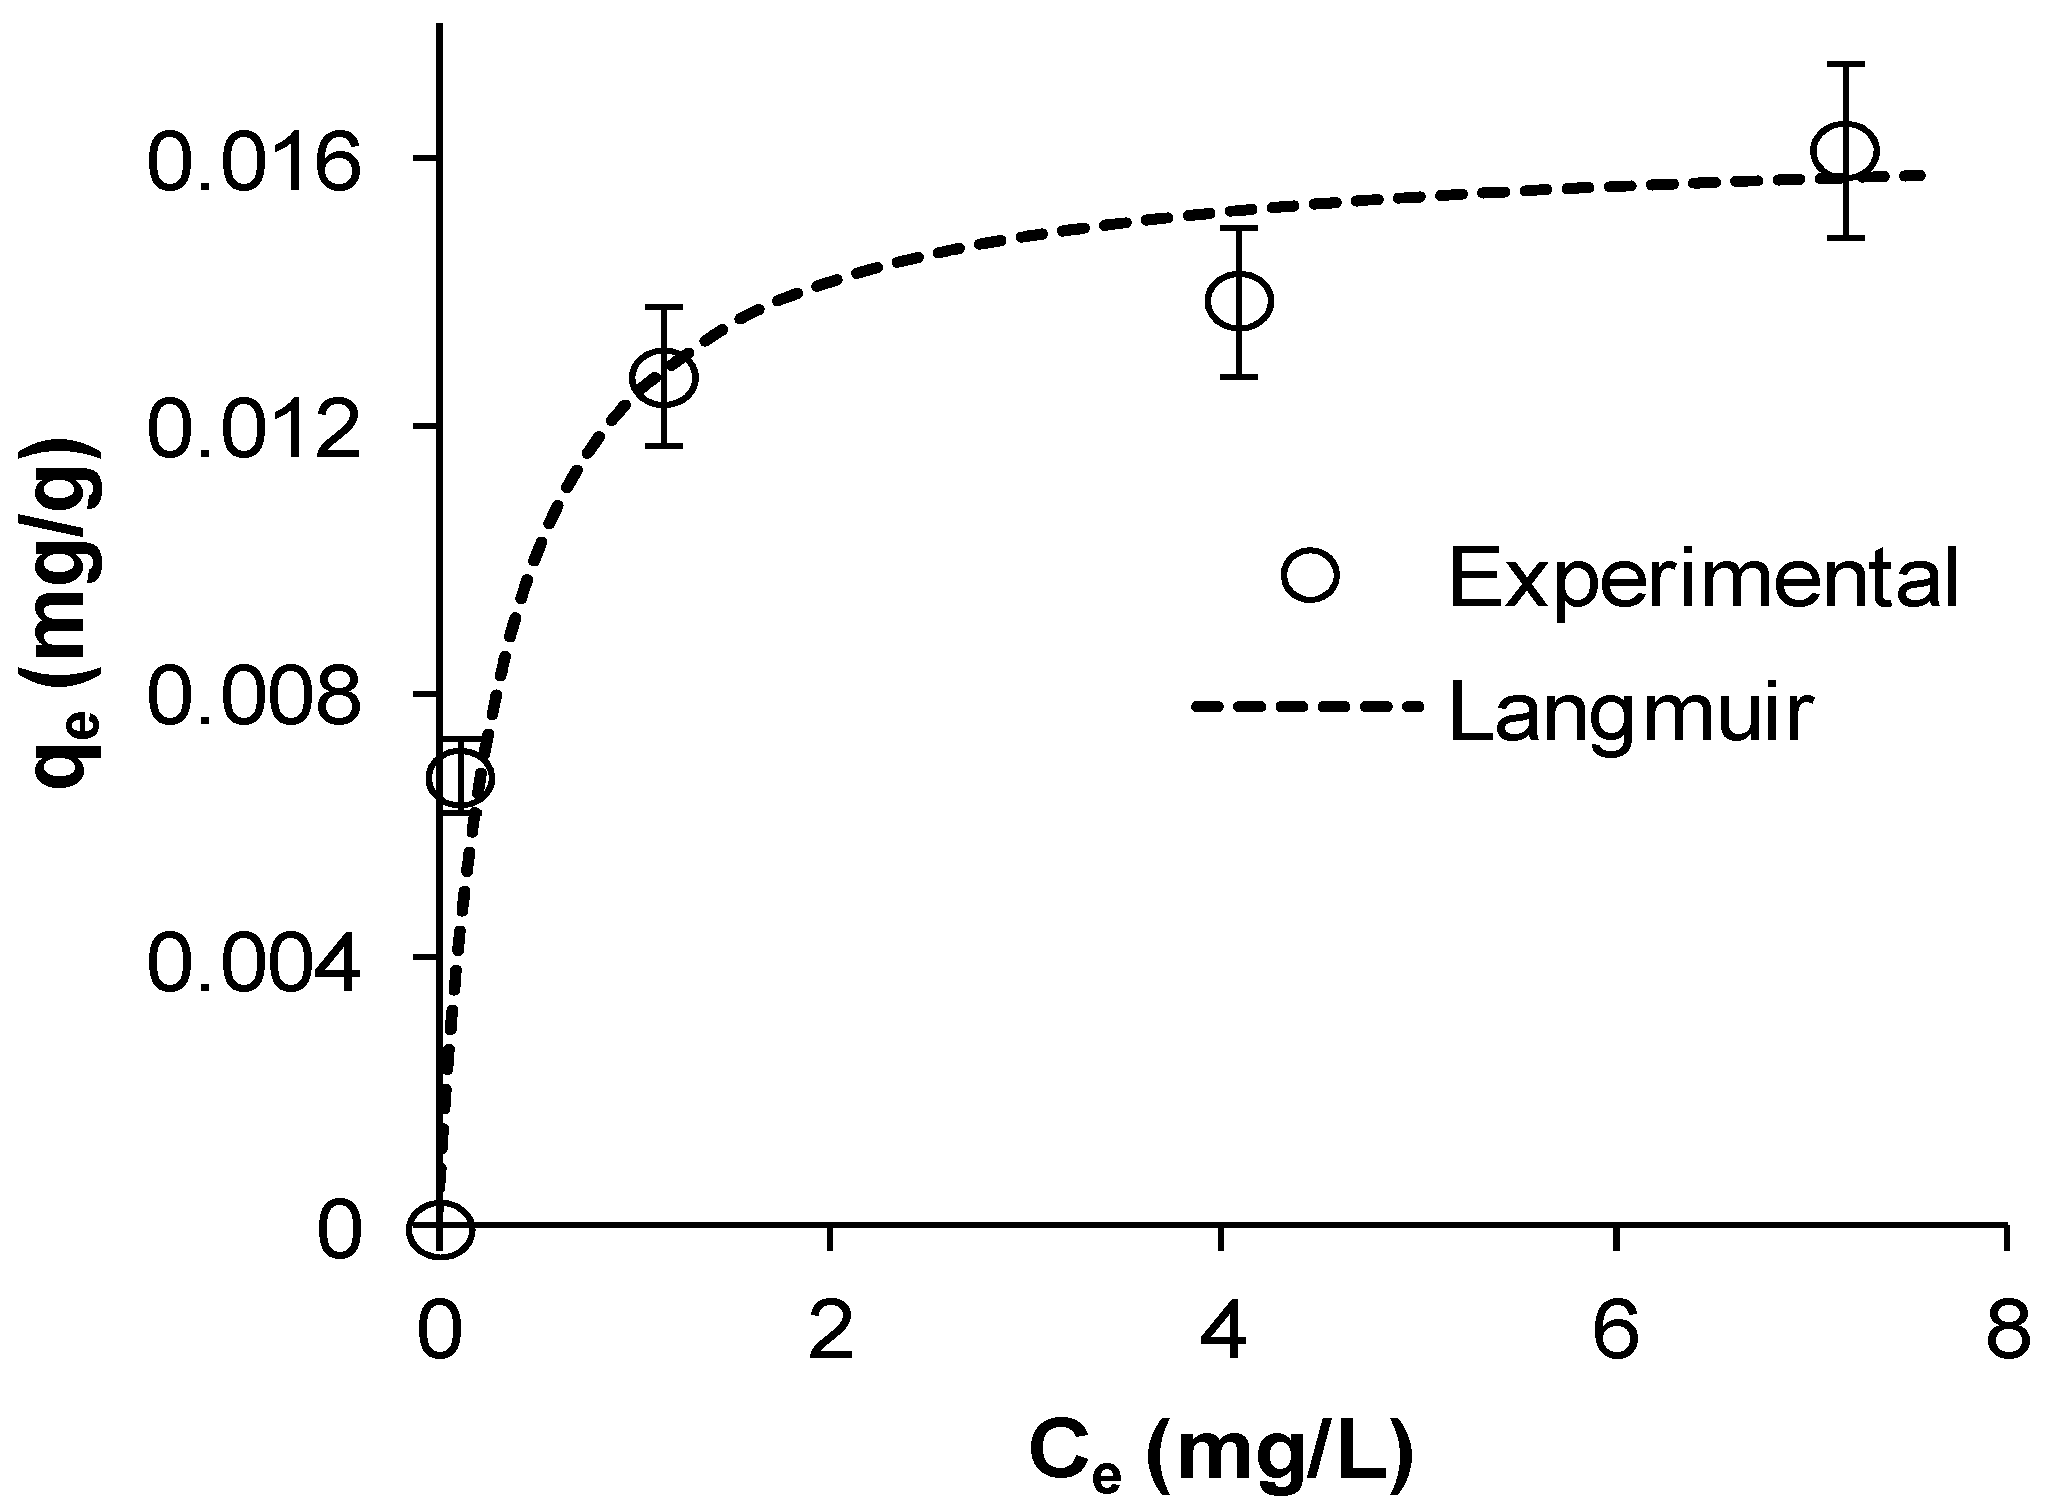
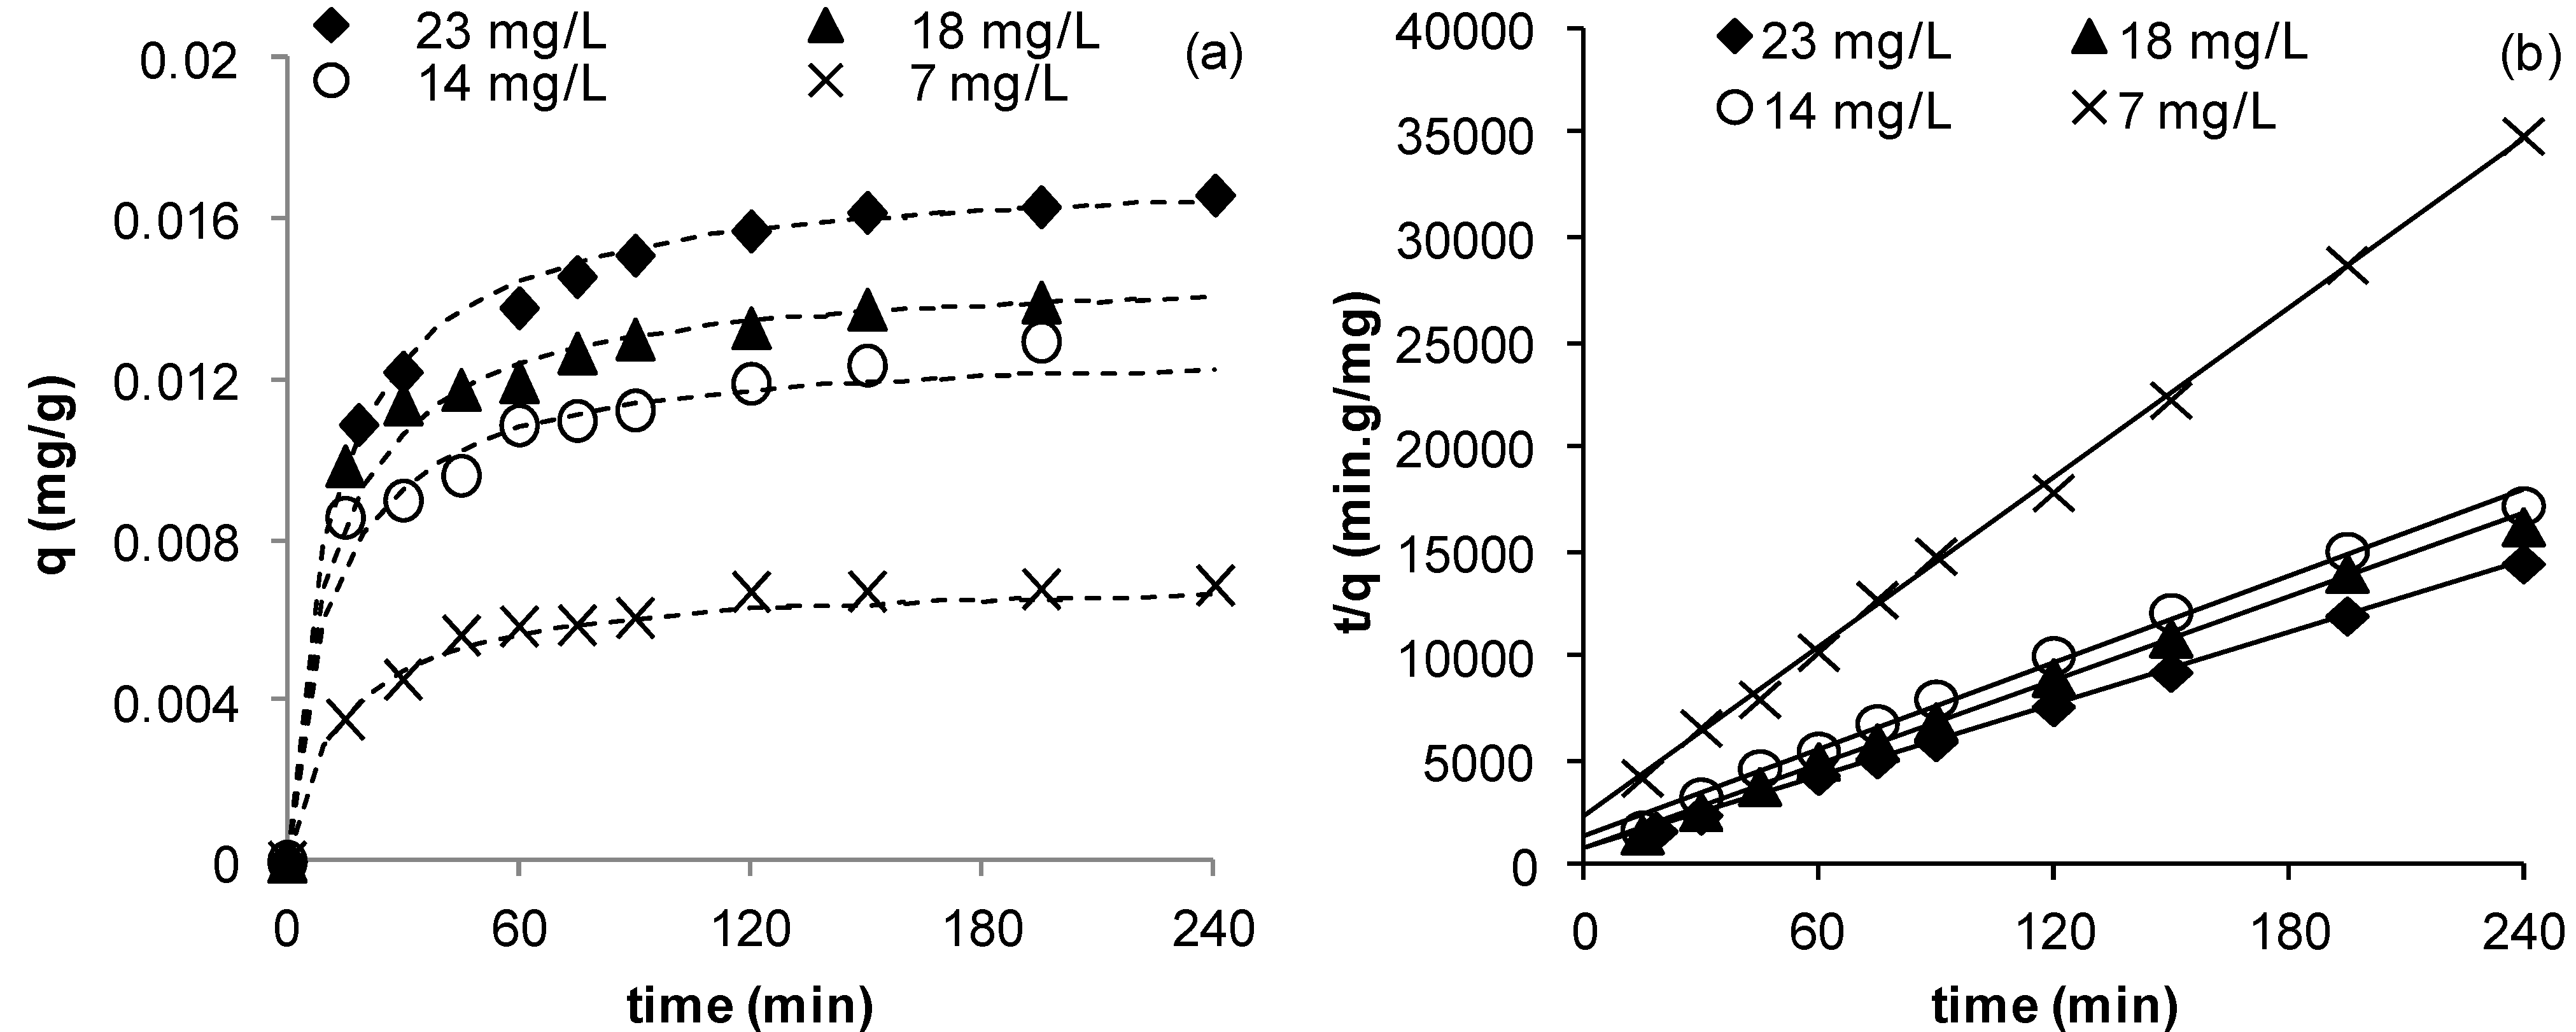
Figure 2a shows that Cu adsorption increased gradually with increasing contact times until reaching a plateau indicating equilibrium. The figure also shows that as C0 increased, the uptake also increased, which is typical for adsorption processes. This is consistent with Figure 1, which shows an increase in the amount of copper sorbed at equilibrium when C0 was raised from 7 to 23 mg/L. Ghodbane et al. [14] observed similar trends in their study. Cu removal was fast in the initial 15 min followed by a slow decrease to almost a nil rate at the end of the experiment. Copper removals after 30 min were 52%, 63%, 65%, and 66% for initial concentrations of 23, 18, 14, and 7 mg/L, respectively. This indicates that the Mn coated sand is an effective adsorbent for the removal of Cu from water and it is likely that adsorption is the main mechanism by which the metal is removed from water. The results indicate that the adsorption equilibrium capacity of MCS increased from 0.0078 to 0.0177 mg/g as C0 was raised from 7 to 23 mg/L (Figure 2). The rate of Cu removal was highest at the beginning of the experiment, possibly due to the availability of a large number of empty surface sites during the early stage of adsorption. Afterwards, the remaining available sites were difficult to inhabit because of reduction in driving force and increased repulsive forces between the solute molecules on the bulk and solid phases [18].
The adsorption of Cu ions onto MCS may proceed through three steps including adsorption of Cu ions to the external surface of MCS by diffusion through a film located in the fluid phase followed by intra-particle diffusion in the interior of the coating and adsorption at the surface of MCS that may involve chemical binding of the adsorbate. To discern which mechanism controls the overall adsorption process of Cu2+ on MCS, kinetic models for film diffusion [19], intra-particle diffusion [20], and adsorption reaction models were used to correlate the experimental data. The adsorption reaction models used here were Lagergren’s pseudo first-order [21], pseudo second-order [22], and Elovich’s equation [23]. Table 3 summarizes the linear form of each model used in this study and Figure 2b plots the linearized form for the pseudo second-order model at the different initial concentrations used.
Figure 2. Kinetics of Cu ions adsorption on MCS at different initial copper concentrations (a) experimental data, dashed lines represent the pseudo second-order model; (b) linearized pseudo second-order model (γMn = 0.0709 mg Mn/g sand, msand = 50 g, Vsolution = 50 mL, pH = 5, shaker speed = 150 rpm, T = 25.6 °C).
Water 05 01487 g002
Whilst the adsorption reaction models cannot identify the diffusion mechanisms during the adsorption process, they describe well the experimental data if the adsorption process involves chemisorption [24]. As high-speed mixing of the solution, which reduces the boundary layer resistance to mass transfer, was used in this study, the film diffusion was assumed to not be a controlling step as also evidenced by the poor fitting of the experimental data with a liquid film model (results are not shown here). The correlation coefficient R2 was used to measure how good the fitting of the experimental data to each model was by comparing its closeness to one. The parameters obtained by fitting the experimental data at different C0 to the models are shown in Table 3. The Table shows that, overall, the values of the equilibrium capacity, qe, obtained by the pseudo second-order and the pseudo first-order models were close to the experimental values (Figure 1). The Table also shows that the pseudo second-order kinetic model has the greatest R2 with an average value of 0.995 (a minimum of 0.993) for all the C0 used in the study followed by Elovich then the pseudo first-order models. As the pseudo second-order kinetic model is based on the assumption that the rate-limiting step is that of chemisorption [12,25], and considering the good correlation between the model and the experimental data, it can be assumed that the adsorption of Cu ions on MCS occurred through chemisorption involving valence forces through sharing or exchange of electrons between copper and MCS [25]. Similar findings have also been reported in the literature [14,15,25,26].
Table 3 shows that the rate constant K2 obtained by the pseudo second-order kinetic model, increased as C0 decreased and the initial adsorption rate, h, and the theoretical amount of Cu adsorbed at equilibrium, qe, decreased with a decrease in the initial concentration C0, which is confirmed by the experimental data. Sen and Sarzali [25] have also found that h decreased with a decrease in C0 for cadmium adsorption on aluminium oxide (Al2O3) and Demirbas et al. [27] have also found K2 to increase as the initial concentration decreased.
Table 3. Kinetic parameters for different initial Cu2+ concentrations (γMn = 0.0709 mg Mn/g sand, pH = 5, T = 25.6 °C).
Kinetic modelParametersInitial Concentration (mg/L)
2318147
Pseudo First-orderLinear form Water 05 01487 i002
qe (mg/g)0.01620.01390.01280.0068
K1 (min−1)0.02650.02370.01930.0244
R²0.96490.9320.93950.9114
Pseudo second-orderLinear form Water 05 01487 i003
K2 (g/mg·min)5.015.876.8411.28
qe (mg/g) 0.01720.01470.01280.0075
h=K2qe2 (mg/g·min)0.00150.00130.00110.0006
R²0.99730.99480.99340.9940
ElovichLinear form Water 05 01487 i004
α(mg/g·min)0.01560.03620.02210.0015
β(g/mg)434.8588.2625.0714.3
0.98100.98680.99100.9614

3.2.2. Effect of Sand Coating

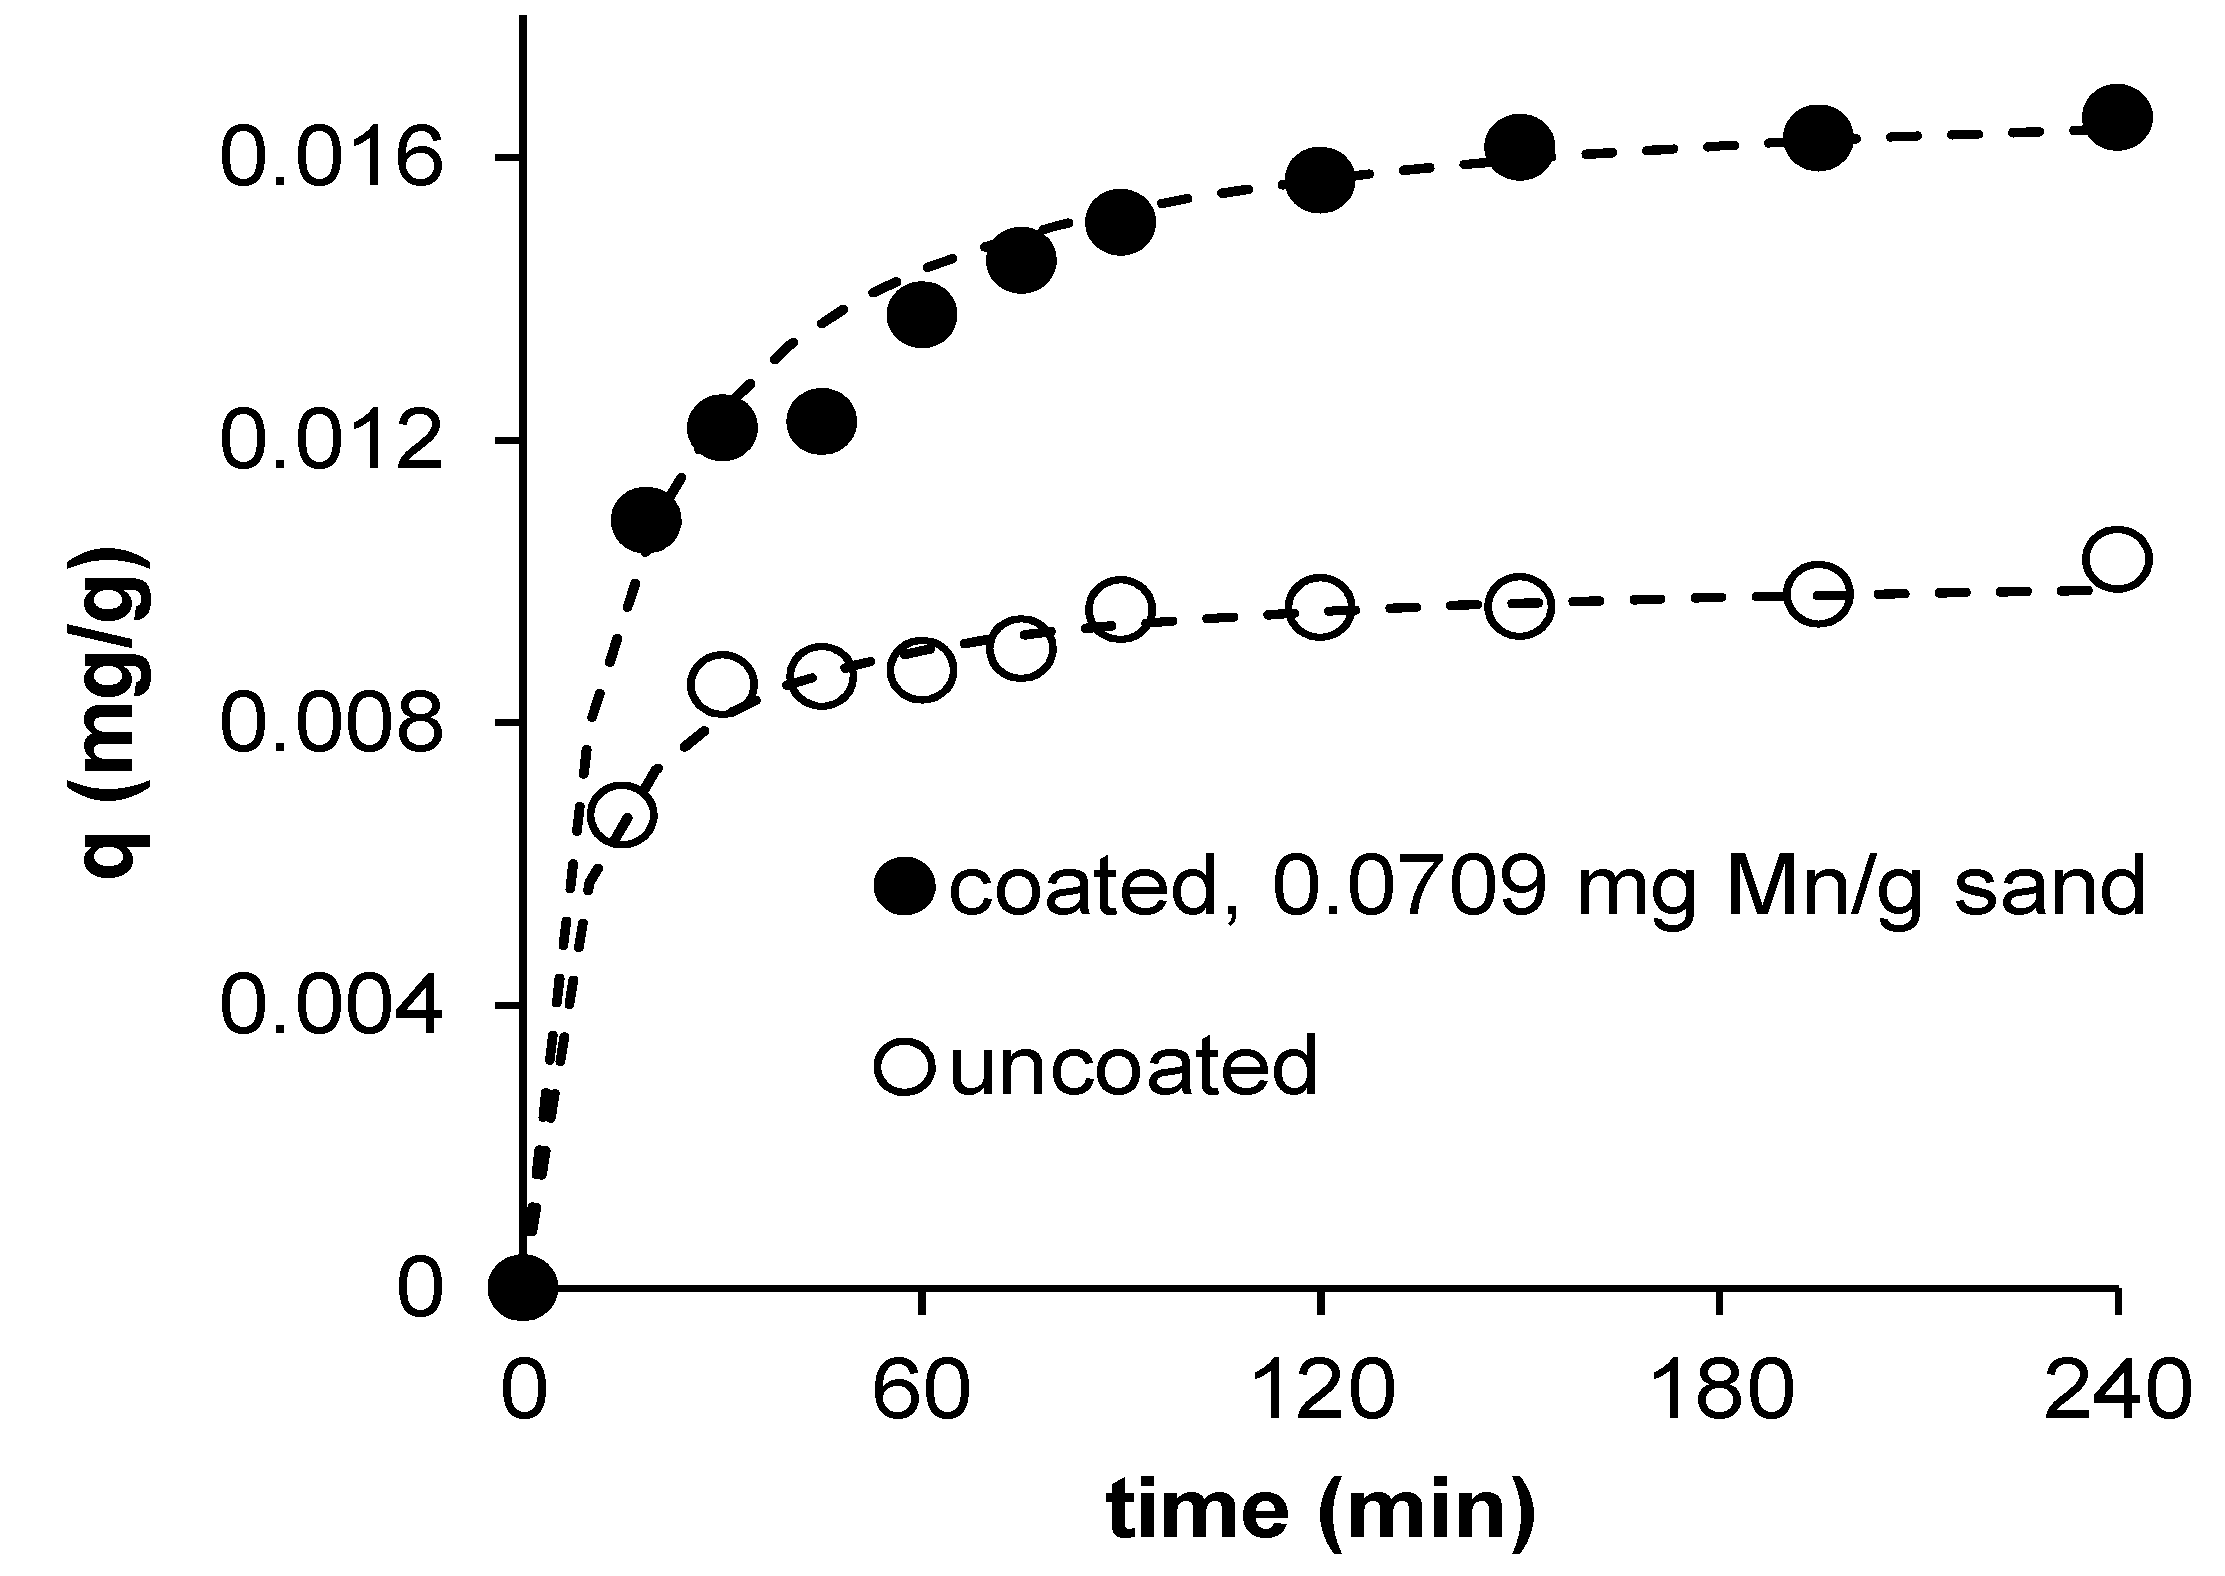
Coated sand (0.0709 mg Mn/g sand) and uncoated sand were used to study the effect of sand coating on the kinetics of Cu2+ adsorption.msand, C0, Vsolution, pH, T, and shaking speed were kept constant at 50 g, 23 mg/L, 50 mL, 5, 25.6 °C, and 150 rpm respectively.
Figure 3 illustrates the change in copper uptake as function of time by the coated and uncoated sands. Although similar profiles for both sands are obtained (Figure 3), clearly the maximum uptake by the coated sand was higher than that of the uncoated sand with values of 0.0172 and 0.0102 mg Cu2+/g sand for coated and uncoated sands respectively (Table 4). This indicates that the coating has improved copper removal by about 70%. This may be explained by the increased surface area of the Mn-coated sand as compared to uncoated sand [13], which results in more active sites. The experimental kinetic data was well fitted to the pseudo second-order kinetic model with R2 values >0.999 for both sands indicating that chemisorption may control the adsorption of Cu2+ on uncoated sand. The initial adsorption rate, h, was found to be slightly higher for coated sand (coated: 0.0015 mg/g·min; uncoated: 0.0013 mg/g·min) whereas values of K2 decreased with coating the sand (coated: 5.01 g/mg·min; uncoated: 12.64 g/mg·min).
Figure 3. Effect of sand coating on the adsorption of Cu2+ (msand = 50 g, C0 = 23 mg/L, Vsolution = 50 mL, pH = 5, shaker speed = 150 rpm, T = 25.6 °C).
Water 05 01487 g003
Table 4. Kinetic parameters obtained using pseudo-second-order kinetic model for different coating conditions (msand = 50 g, C0 = 23 mg/L, Vsolution = 50 mL, pH = 5, shaker speed = 150 rpm, T = 25.6 °C).
ParametersCoated (=0.0709 mg Mn/g sand)Uncoated (= 0 mg Mn/g sand)
K2 (g/mg·min)5.0112.64
qe (mg/g)0.01720.0102
h (mg/g·min)0.00150.0013
R20.99730.9959

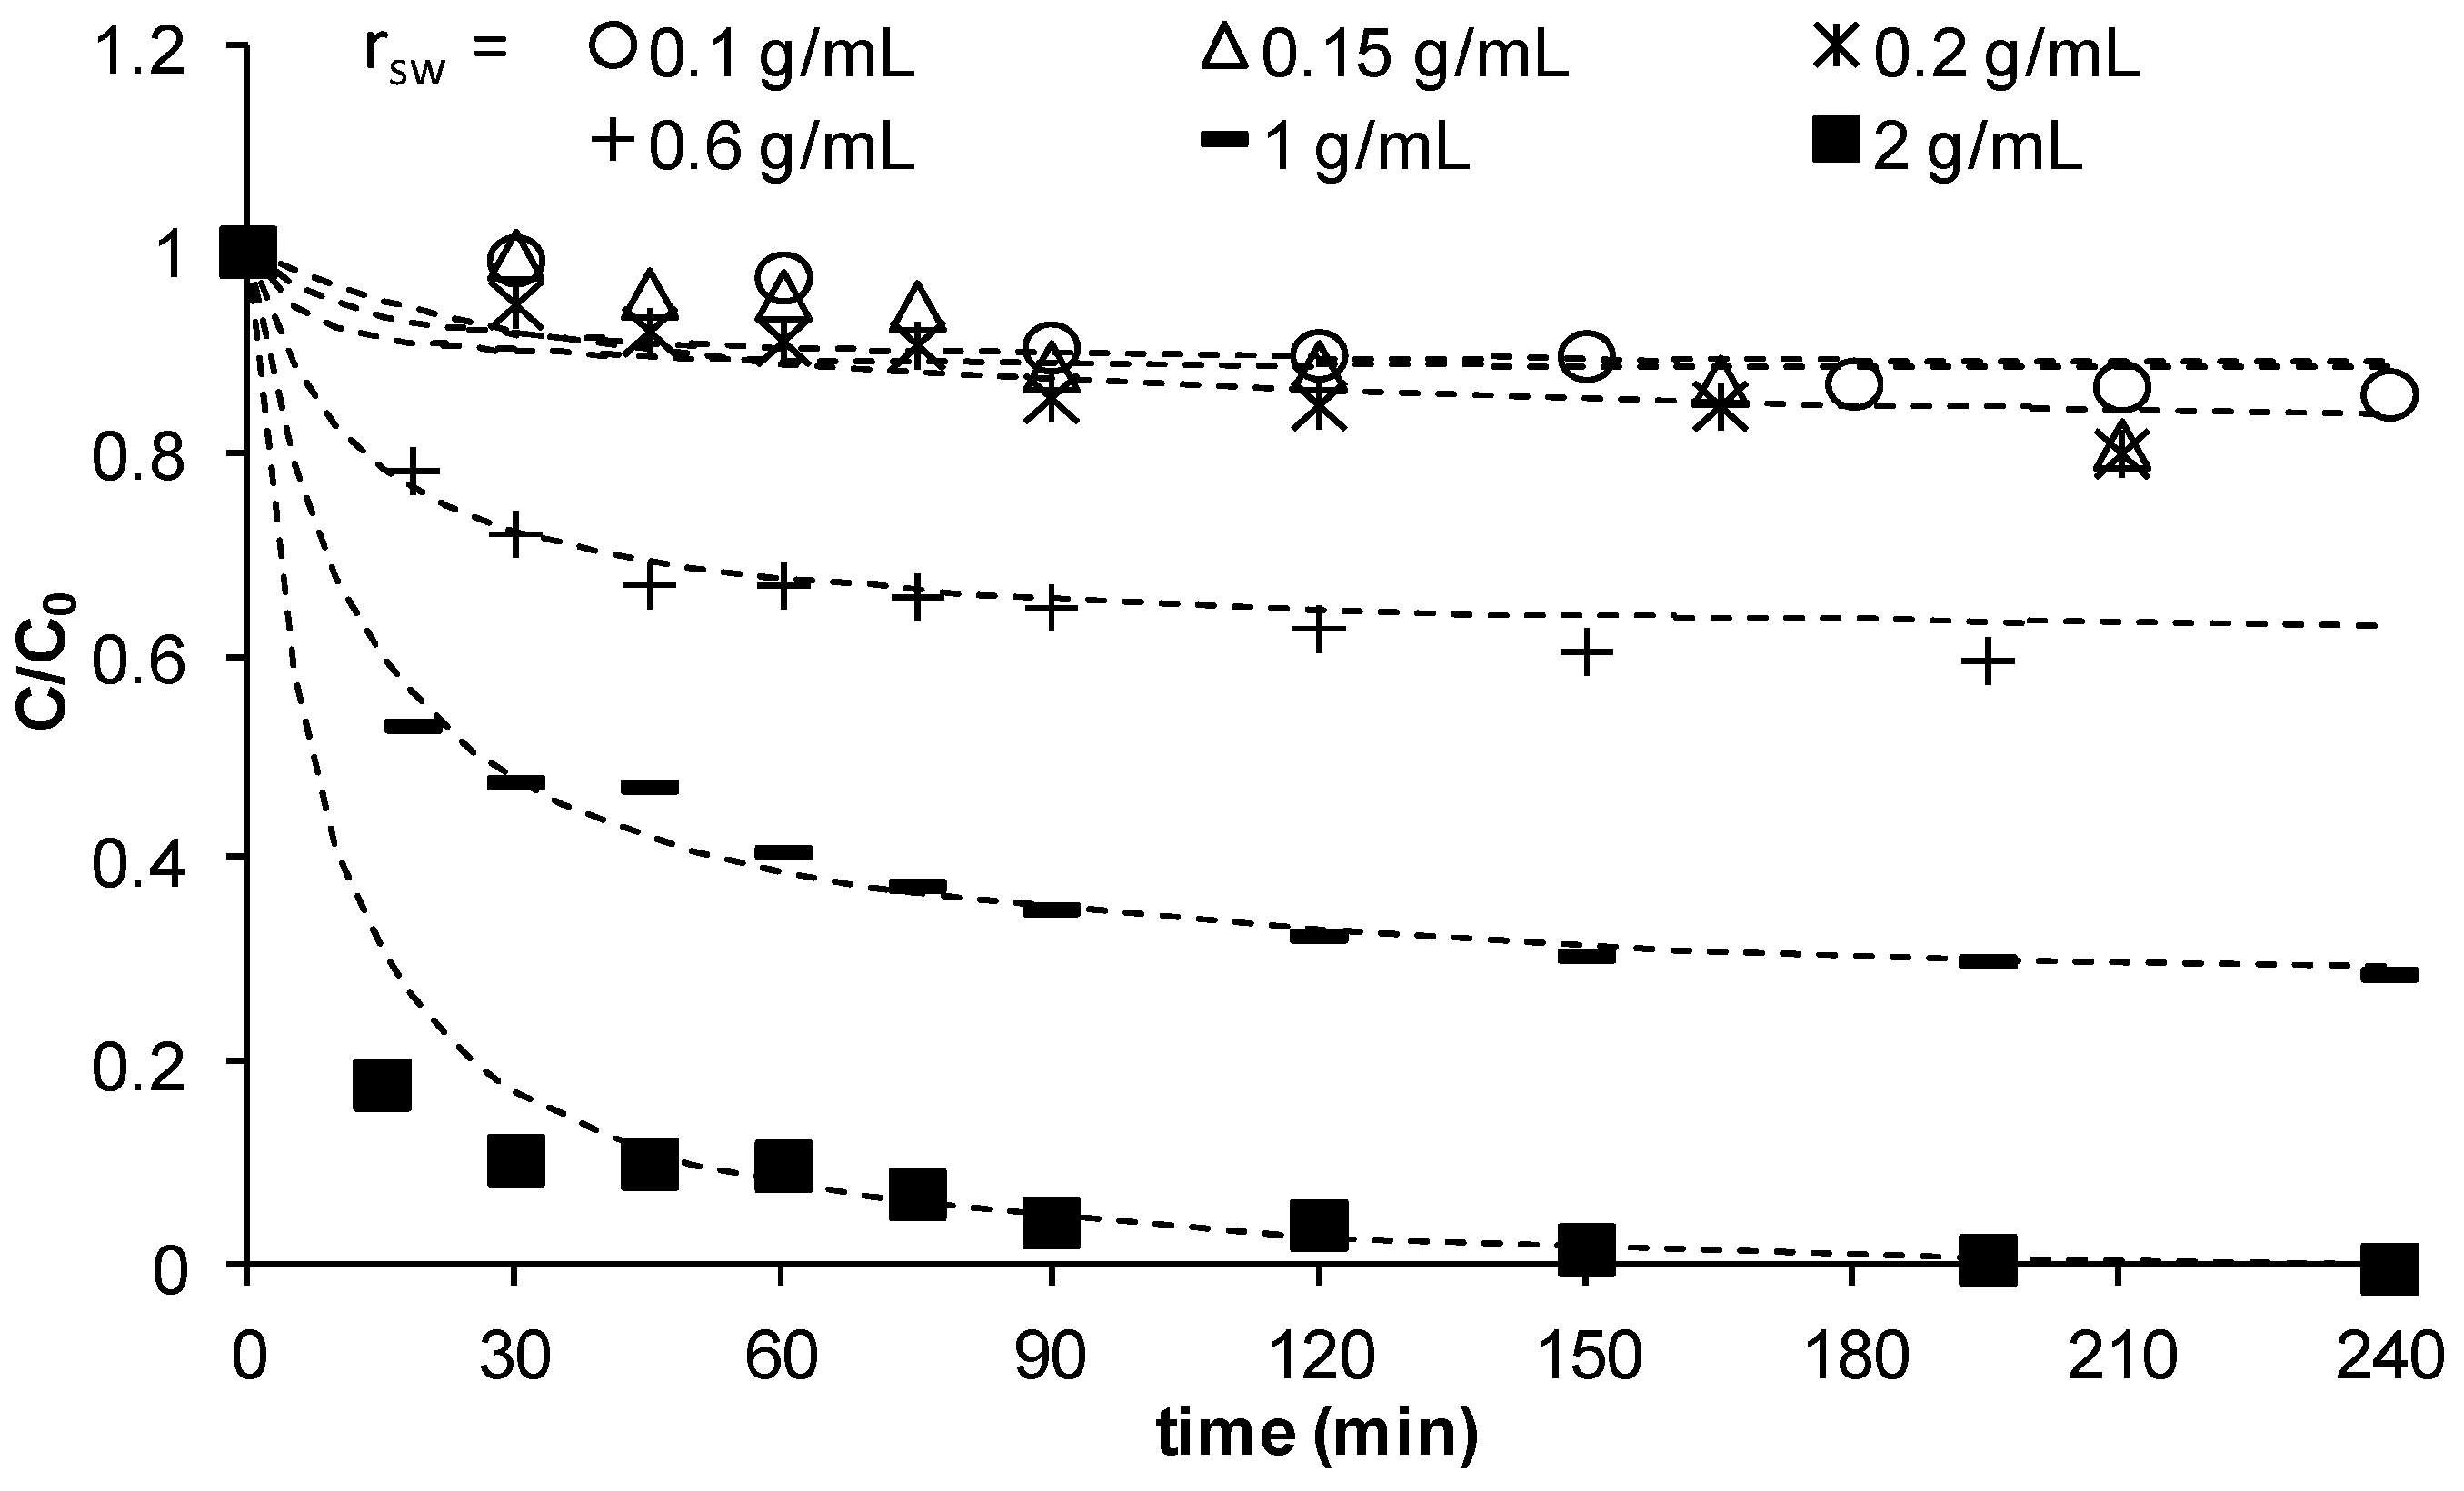
3.2.3. Effect of the Ratio Mass of Sand to Solution Volume, rsw

The effect of the ratio of mass of sand to the solution volume, rsw, on the adsorption of Cu2+ on MCS was studied using different sand masses 5, 7.5, 10, 30, 50, and 100 g at a constant solution volume of 50 mL. Figure 4 illustrates the changes of C/C0 as function of time at different rsw values and shows that the change of C/C0 at low rsw <0.2 g/mL is significantly small due to the small mass of sand available in solution to remove copper. As rsw increased to 0.6, and further to 1, then to 2 g/mL, a clear reduction in concentration is observed meaning significant removal of copper. At all rsw values, the concentration reduces with time until reaching a plateau indicating saturation of the sand with lowest reduced concentrations obtained as rsw increased. However, the mass of copper removed at equilibrium per unit mass of MCS decreased with an increase in rsw (data not shown here). Other studies have also obtained similar effect [14,25], which can be explained by particle-particle interactions [25] at high solid content. These interactions result in blockage of some active sites, hence a decrease in adsorption capacity. It may also lead to electrostatic interferences such that the electrical surface charges on the closely packed particles reduce attraction between the adsorbate and surfaces of individual sand particles. The experimental kinetic data was found to fit well to the pseudo-second-order kinetic model (dashed lines in Figure 4). The data showed that h decreased as rsw increased, whilst no clear trend was observed for K2. Ghodbane et al. [14] have also observed that h decreased with increasing the adsorbent mass (m), though they found that increasing m enhanced K2 but reduced qe.
Figure 4. C/C0 vs time for different ratios of mass of sand to solution volume (γMn = 0.0709 mg Mn/g sand, C0 = 23 mg/L, Vsolution = 50 mL, pH = 5, shaker speed = 150 rpm, T = 25.6 °C).
Water 05 01487 g004

3.2.4. Effect of Initial pH

As pH is an important parameter controlling the removal of metals in solution, its effect on the kinetics of copper adsorption on MCS was studied using initial values in the range 3 to 9. The other experimental parameters were as in previous experiments. 
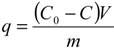
Figure 5a shows the change of copper uptake as a function of time for the different pH values studied. Figure 5a clearly shows that copper removal is strongly pH dependent and that at all pHs, the uptake evolved until reaching a plateau, indicating exhaustion of the adsorbent as saturation was reached. The figure also shows that the uptake of copper, q, increased as pH increased from 3 to 4 and remained almost constant until pH 7 after which, a further increase to pHs 8 and 9 reduced q significantly. This is clearly depicted in Figure 5b, which shows the equilibrium adsorption uptake as a function of pH. A similar effect of pH on adsorption of metals was also observed by Ghodbane et al. [14], and Sen and Sarzali [25]. The reduction in the equilibrium adsorption uptake at pHs 8 and 9 may be due to a blockage of the exterior surface of MCS as a result of precipitation of copper hydroxide, which is expected to take place strongly at these pHs (note: at C0 = 23 mg/L, precipitation occurs at pH 5.91 [13]). On the other hand, the low adsorption observed at low pH 3 may be attributed to excessive protonation of the adsorbent surface and to high mobility of H+ ions, which are more preferentially adsorbed than Cu ions [17,25]. In addition, it was observed as discussed below that at pH 3, the leaching of Mn2+ was high (17% and 5% of initial Mn2+ leached out at pHs 3 and 5 respectively). The leaching of Mn2+ into solution should result in reduction of adsorption sites on MCS hence contributing to the observed reduction in equilibrium capacity at pH 3. As pH increases, the surface charge becomes less positive favoring attraction of Cu cations to MCS surface. In addition, as the proportion of hydrated Cu ions increases with pH, these ions may become more strongly attracted to MCS surface than unhydrated ions. Both of these synergistically increase the adsorption of Cu ions as pH increases to below precipitation pHs, which explains the observed increase in removal for pHs >3. Figure 5b shows that for 4 < pH < 7, qe does not change significantly hence an average value within this pH range was calculated; qe,4 < pH < 7 = 0.0179 mg/g ± 4%. From an operating point of view, this result is important since the process may be operated within this large pH range without the need for significant pH adjustment.
Figure 5. Effect of initial pH on the adsorption of Cu ions by MCS (a) change of q as function of time at different pHs; (b) effect of pH on equilibrium adsorption uptake, qe (γMn = 0.0709 mg Mn/g sand, msand = 50 g, C0= 23 mg/L, Vsolution = 50 mL, shaker speed = 150 rpm, T = 25.6 °C).
Water 05 01487 g005

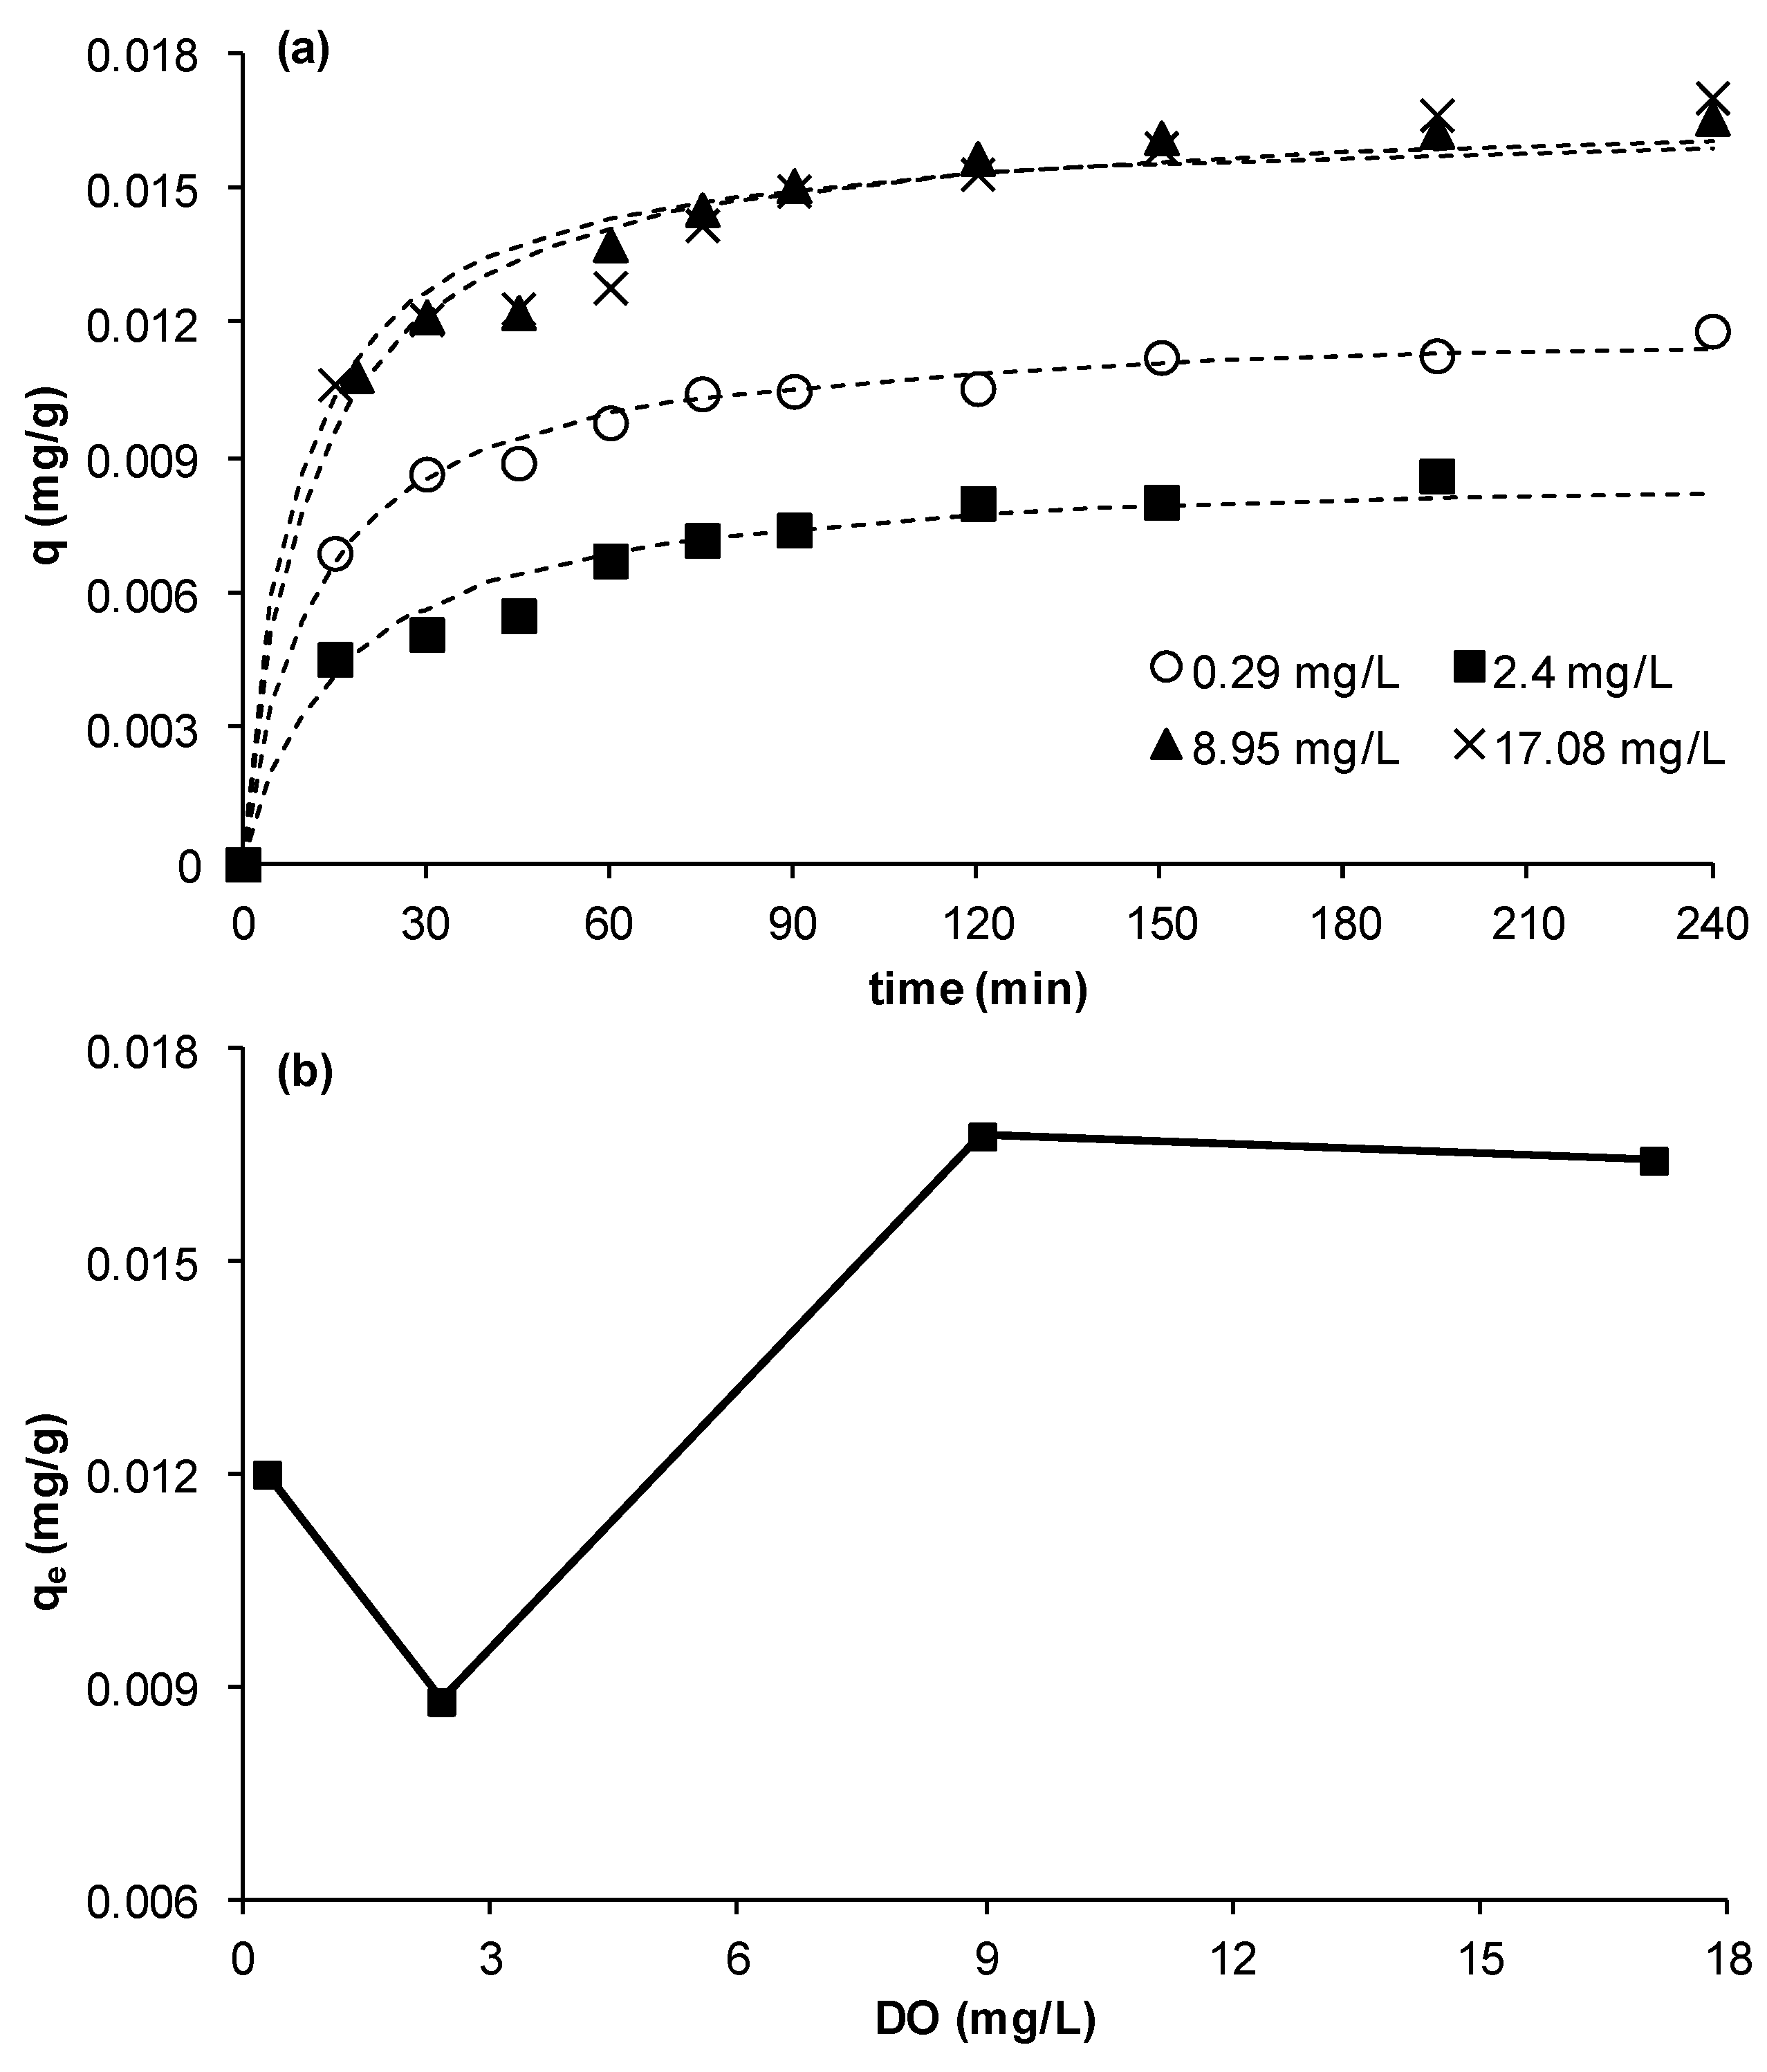
3.2.5. Effect of Dissolved Oxygen Concentration (DO)

The effect of DO on the adsorption kinetics of Cu on MCS was studied using DO values of 0.29, 2.40, 8.95, and 17.08 mg/L. The other experimental parameters were as in previous experiments. It was observed that the removal of Cu reduced by about 27% when DO increased from 0.29 to 2.4 mg/L however, when DO was raised to 8.95 mg/L a significant increase in removal by about 91% occurred. A further increase of DO to 17.08 mg/L did not result in any further change in copper ion removal (Figure 6a,b).
Figure 6. Effect of dissolved oxygen on copper ion removal by MCS (a) change of q as function of time at different DO concentrations; (b) effect of DO concentration on equilibrium adsorption uptake, qe (γMn= 0.0709 mg Mn/g sand, msand = 50 g, C0= 23 mg/L, Vsolution = 50 mL, pH = 5, shaker speed = 150 rpm, T = 25.6 °C).
Water 05 01487 g006
Although it is not clear why there was a dip at 2.4 mg/L or an increase at 0.29 mg/L, the results clearly show that copper removal was DO dependent. The overall trend is that the removal is enhanced with increasing DO up to a maximum obtained at ambient DO concentrations. This trend is in agreement with that obtained in our previous work which showed that aeration enhanced removal of copper in a bed of MCS [13]. A plausible explanation is that DO increases the formation of manganese oxide, which results from the reaction between oxygen and manganese (Mn2+ + 0.5O2 + H2O → MnO2(s) + 2H+), promoting the removal of copper ions under the studied pH [13]. It was also observed in this study that the final pH of the solution was lower for higher DO concentrations by about 0.5 pH units, which reflects that more copper was removed by the coated sand at high DO. Indeed, lower pH (i.e., increased concentration of H+) may result from the above reaction but also based on ion exchange principle, the more copper ions adsorbed by the coated sand, the more hydrogen ions are released. Moreover, it was observed in this study and as discussed in the next section, that leaching of Mn2+ into solution was high at low DO (about 9% of initial Mn2+ leached out at DO = 0.29 mg/L as compared to 5% at DO = 8.95 mg/L), which should result in reduction of adsorption sites on the surface of MCS hence contributing to the observed reduction in equilibrium capacity at low DO. The experimental kinetic data were well fitted to the pseudo-second-order kinetic model (Figure 6a). It was found that the value of the rate constant K2 was not significantly affected by DO concentrations; an average value for K2 of 6.45 ° 12% (g/mg·min) was calculated, whilst h was almost doubled when DO increased from 0.29 to 17.08 mg/L. Although there are no previous studies on DO effect to compare to the results obtained in this study, clearly the effect of DO should be studied when removing metal ions by adsorption. This is important as, in real practical cases, DO may change as a result of for example biological processes or changes in temperature.

3.3. Manganese Leaching into Solution: Effect of pH and DO

The effects of pH and DO on manganese leaching into solution were studied and the results are shown in Figure 7. Figure 7a shows that low pH (i.e., pH = 3) promotes manganese leaching, a result which is in agreement with previous works [11,13]. After 240 min reaction and at pH 3, about 17% of the manganese initially coated on MCS have leached out in solution, while the figure reduces to about 5% at pH 4, or higher pHs. Concentrations of Mn in solution were as high as 11.8 mg/L for pH 3 and 3.8–6.6 mg/L at pHs 4–8 after 240 min reaction. Equally, Figure 7b shows that dissolved oxygen has also affected the leaching of Mn. For all DO concentrations, a significant amount of Mn leached into the solution as the contact time increased. The figure shows that the leaching of Mn increases as DO concentration reduces. At 240 min reaction time, Mn concentrations of 6.2 and 3.8 mg/L were obtained at DO concentrations of 0.29 and 8.95 mg/L respectively. This may suggest that in the presence of oxygen a layer of manganese oxide coats the exterior surface of MCS particles resulting in stabilization of the manganese on MCS and preventing further leaching of Mn into solution. Increasing the DO content to 17.08 mg/L, however, did not result in further decrease of the amount of manganese leaching into solution.
Figure 7. Mn leaching into solution (a) effect of pH; (b) effect of DO [γMn = 0.0709 mg Mn/g sand, msand = 50 g, C0 = 23 mg/L, Vsolution = 50 mL, shaker speed = 150 rpm, T = 25.6oC; (a) DO = 8.95 mg/L; (b) pH = 5].
Water 05 01487 g007

4. Conclusions

Activation of the sand was made by coating with potassium permanganate and the manganese-coated sand (MCS) was used to remove copper in a batch mode. The coating of the sand was effective as it improved copper removal by about 70%. The adsorption of Cu ions on MCS was well described by the Langmuir model and was found to be favorable since the condition 0 < RL < 1 was satisfied. The study of kinetics revealed that the pseudo-second-order model fitted well the experimental results indicating that Cu ions removal by MCS occurred through a chemisorption process. The ratio of sand to volume of solution, rsw, was found to affect copper removal and the uptake at equilibrium reduced as rsw increased possibly due to particle-particle interactions. The study revealed that both pH and dissolved oxygen affected the removal of copper ions by MCS. At low pH <4 and at higher pHs >7, the equilibrium uptake, qe, was reduced whilst at pHs in the range 4 to 7, qe was almost constant at a highest value of an average equal to 0.0179 mg/g ± 4%. Copper removal was DO dependent and the overall trend is that the removal is enhanced with increasing DO up to a maximum obtained at ambient DO concentration. Low pH and low DO were found to increase the leaching of Mn2+ into solution, which contributed to the observed reduction in copper uptake at low pH and DO. The study showed that it is important to investigate the effect of DO when adsorption is used for the removal of metal ions into water.

Acknowledgments

Sugihhartati Dj Rachmawati would like to thank the Government of Indonesia (Directorate General of Higher Education, Ministry of National Education) and the Insitut Teknologi Nasional (ITENAS) for sponsoring her PhD study.

Conflicts of Interest

The authors declare no conflict of interest.

References

  1. WHO. UNICEF Progress on sanitation and drinking water. Available online: http://whqlibdoc.who.int/publications/2010/9789241563956_eng_full_text.pdf (accessed on 16 September 2013).
  2. Halim, M.A.; Majumder, R.K.; Nessa, S.A.; Hiroshiro, Y.; Uddin, M.J.; Shimada, J.; Jinno, K. Hydrogeochemistry and arsenic contamination of groundwater in the ganges delta plain, bangladesh. J. Hazard. Mater. 2009, 164, 1335–1345. [Google Scholar] [CrossRef]
  3. Wang, Z.; Liu, G.; Fan, Z.; Yang, X.; Wang, J.; Wang, S. Experimental study on treatment of electroplating wastewater by nanofiltration. J. Membr. Sci. 2007, 305, 185–195. [Google Scholar] [CrossRef]
  4. Chen, S.-S.; Cheng, C.-Y.; Li, C.-W.; Chai, P.-H.; Chang, Y.-M. Reduction of chromate from electroplating wastewater from pH 1 to 2 using fluidized zero valent iron process. J. Hazard. Mater. 2007, 142, 362–367. [Google Scholar] [CrossRef]
  5. Eisler, R. Eisler’s Encyclopedia of Environmentally Hazardous Priority Chemicals, 1st ed.; Elsevier: Amsterdam, the Netherlands, 2007; p. 933. [Google Scholar]
  6. Wang, S.B.; Li, L.; Zhu, Z.H. Solid-state conversion of fly ash to effective adsorbents for Cu removal from wastewater. J. Hazard. Mater. 2007, 139, 254–259. [Google Scholar] [CrossRef]
  7. Bouzid, J.; Elouear, Z.; Ksibi, M.; Feki, A.; Montiel, A. A study on removal characteristics of copper from aqueous solution by sewage sludge and pomace ashes. J. Hazard. Mater. 2008, 152, 838–845. [Google Scholar] [CrossRef]
  8. Zhou, L.-C.; Li, Y.-F.; Bai, X.; Zhao, G.-H. Use of microorganisms immobilized on composite polyurethane foam to remove Cu(II) from aqueous solution. J. Hazard. Mater. 2009, 167, 1106–1113. [Google Scholar] [CrossRef]
  9. Bojic, A.L.; Bojic, D.; Andjelkovic, T. Removal of Cu2+ and Zn2+ from model wastewaters by spontaneous reduction-coagulation process in flow conditions. J. Hazard. Mater. 2009, 168, 813–819. [Google Scholar] [CrossRef]
  10. Lee, C.I.; Yang, W.F.; Hsieh, C.I. Removal of copper(II) by manganese-coated sand in a liquid fluidized-bed reactor. J. Hazard. Mater. 2004, 114, 45–52. [Google Scholar] [CrossRef]
  11. Hu, P.-Y.; Hsieh, Y.-H.; Chen, J.-C.; Chang, C.-Y. Characteristics of manganese-coated sand using SEM and EDAX analysis. J. Colloid Interface Sci. 2004, 272, 308–313. [Google Scholar] [CrossRef]
  12. Han, R.; Zou, W.; Zhang, Z.; Shi, J.; Yang, J. Removal of copper(II) and lead(II) from aqueous solution by manganese oxide coated sand: I. Characterization and kinetic study. J. Hazard. Mater. 2006, 137, 384–395. [Google Scholar] [CrossRef]
  13. Tizaoui, C.; Rachmawati, S.D.; Hilal, N. The removal of copper in water using manganese activated saturated and unsaturated sand filters. Chem. Eng. J. 2012, 209, 334–344. [Google Scholar] [CrossRef]
  14. Ghodbane, I.; Nouri, L.; Hamdaoui, O.; Chiha, M. Kinetic and equilibrium study for the sorption of cadmium(II) ions from aqueous phase by eucalyptus bark. J. Hazard. Mater. 2008, 152, 148–158. [Google Scholar] [CrossRef]
  15. Al-Rashdi, B.; Tizaoui, C.; Hilal, N. Copper removal from aqueous solutions using nano-scale diboron trioxide/titanium dioxide (B2O3/TiO2) adsorbent. Chem. Eng. J. 2012, 183, 294–302. [Google Scholar] [CrossRef]
  16. Lee, S.M.; Laldawngliana, C.; Tiwari, D. Iron oxide nano-particles-immobilized-sand material in the treatment of Cu(II), Cd(II) and Pb(II) contaminated waste waters. Chem. Eng. J. 2012, 195, 103–111. [Google Scholar]
  17. Boujelben, N.; Gouider, M.; Elouear, Z.; Bouzid, J.; Feki, M.; Montiel, A. Retention of copper and nickel from aqueous solutions using manganese oxide-coated burned brick. Environ. Prog. Sustain. Energy 2012, 31, 426–434. [Google Scholar] [CrossRef]
  18. Srivastava, V.C.; Swamy, M.M.; Mall, I.D.; Prasad, B.; Mishra, I.M. Adsorptive removal of phenol by bagasse fly ash and activated carbon: Equilibrium, kinetics and thermodynamics. Colloid Surf. A 2006, 272, 89–104. [Google Scholar] [CrossRef]
  19. Boyd, G.E.; Adamson, A.W.; Myers, L.S. The exchange adsorption of ions from aqueous solutions by organic zeolites, II, kinetics. J. Am. Chem. Soc. 1947, 69, 2836–2848. [Google Scholar] [CrossRef]
  20. Weber, W.J.; Moris, J.C. Kinetics of adsorption on carbon from solution. J. Sanit. Eng. Div. 1963, 89, 31–60. [Google Scholar]
  21. Ho, Y.S. Citation review of lagergren kinetic rate equation on adsorption reactions. Scientometrics 2004, 59, 171–177. [Google Scholar] [CrossRef]
  22. Ho, Y.S.; McKay, G. Pseudo-second order model for sorption processes. Process Biochem. 1999, 34, 451–465. [Google Scholar] [CrossRef]
  23. Low, M.J.D. Kinetics of chemisorption of gases on solids. Chem. Rev. 1960, 60, 267–312. [Google Scholar] [CrossRef]
  24. Qiu, H.; Lv, L.; Pan, B.-C.; Zhang, Q.-J.; Zhang, W.-M.; Zhang, Q.-X. Critical review in adsorption kinetic models. J. Zhejiang Univ. Sci. A 2009, 10, 716–724. [Google Scholar] [CrossRef]
  25. Sen, T.K.; Sarzali, M.V. Removal of cadmium metal ion (Cd2+) from its aqueous solution by aluminium oxide (Al2O3): A kinetic and equilibrium study. Chem. Eng. J. 2008, 142, 256–262. [Google Scholar] [CrossRef]
  26. Ho, Y.S.; McKay, G. The kinetics of sorption of divalent metal ions onto sphagnum moss peat. Water Res. 2000, 34, 735–742. [Google Scholar] [CrossRef]
  27. Demirbas, E.; Kobya, M.; Senturk, E.; Ozkan, T. Adsorption kinetics for the removal of chromium (VI) from aqueous solutions on the activated carbons prepared from agricultural wastes. Water SA 2004, 30, 533–539. [Google Scholar]

