Arsenic Contamination in Groundwater of Bangladesh: Perspectives on Geochemical, Microbial and Anthropogenic Issues


Abstract
:1. Introduction
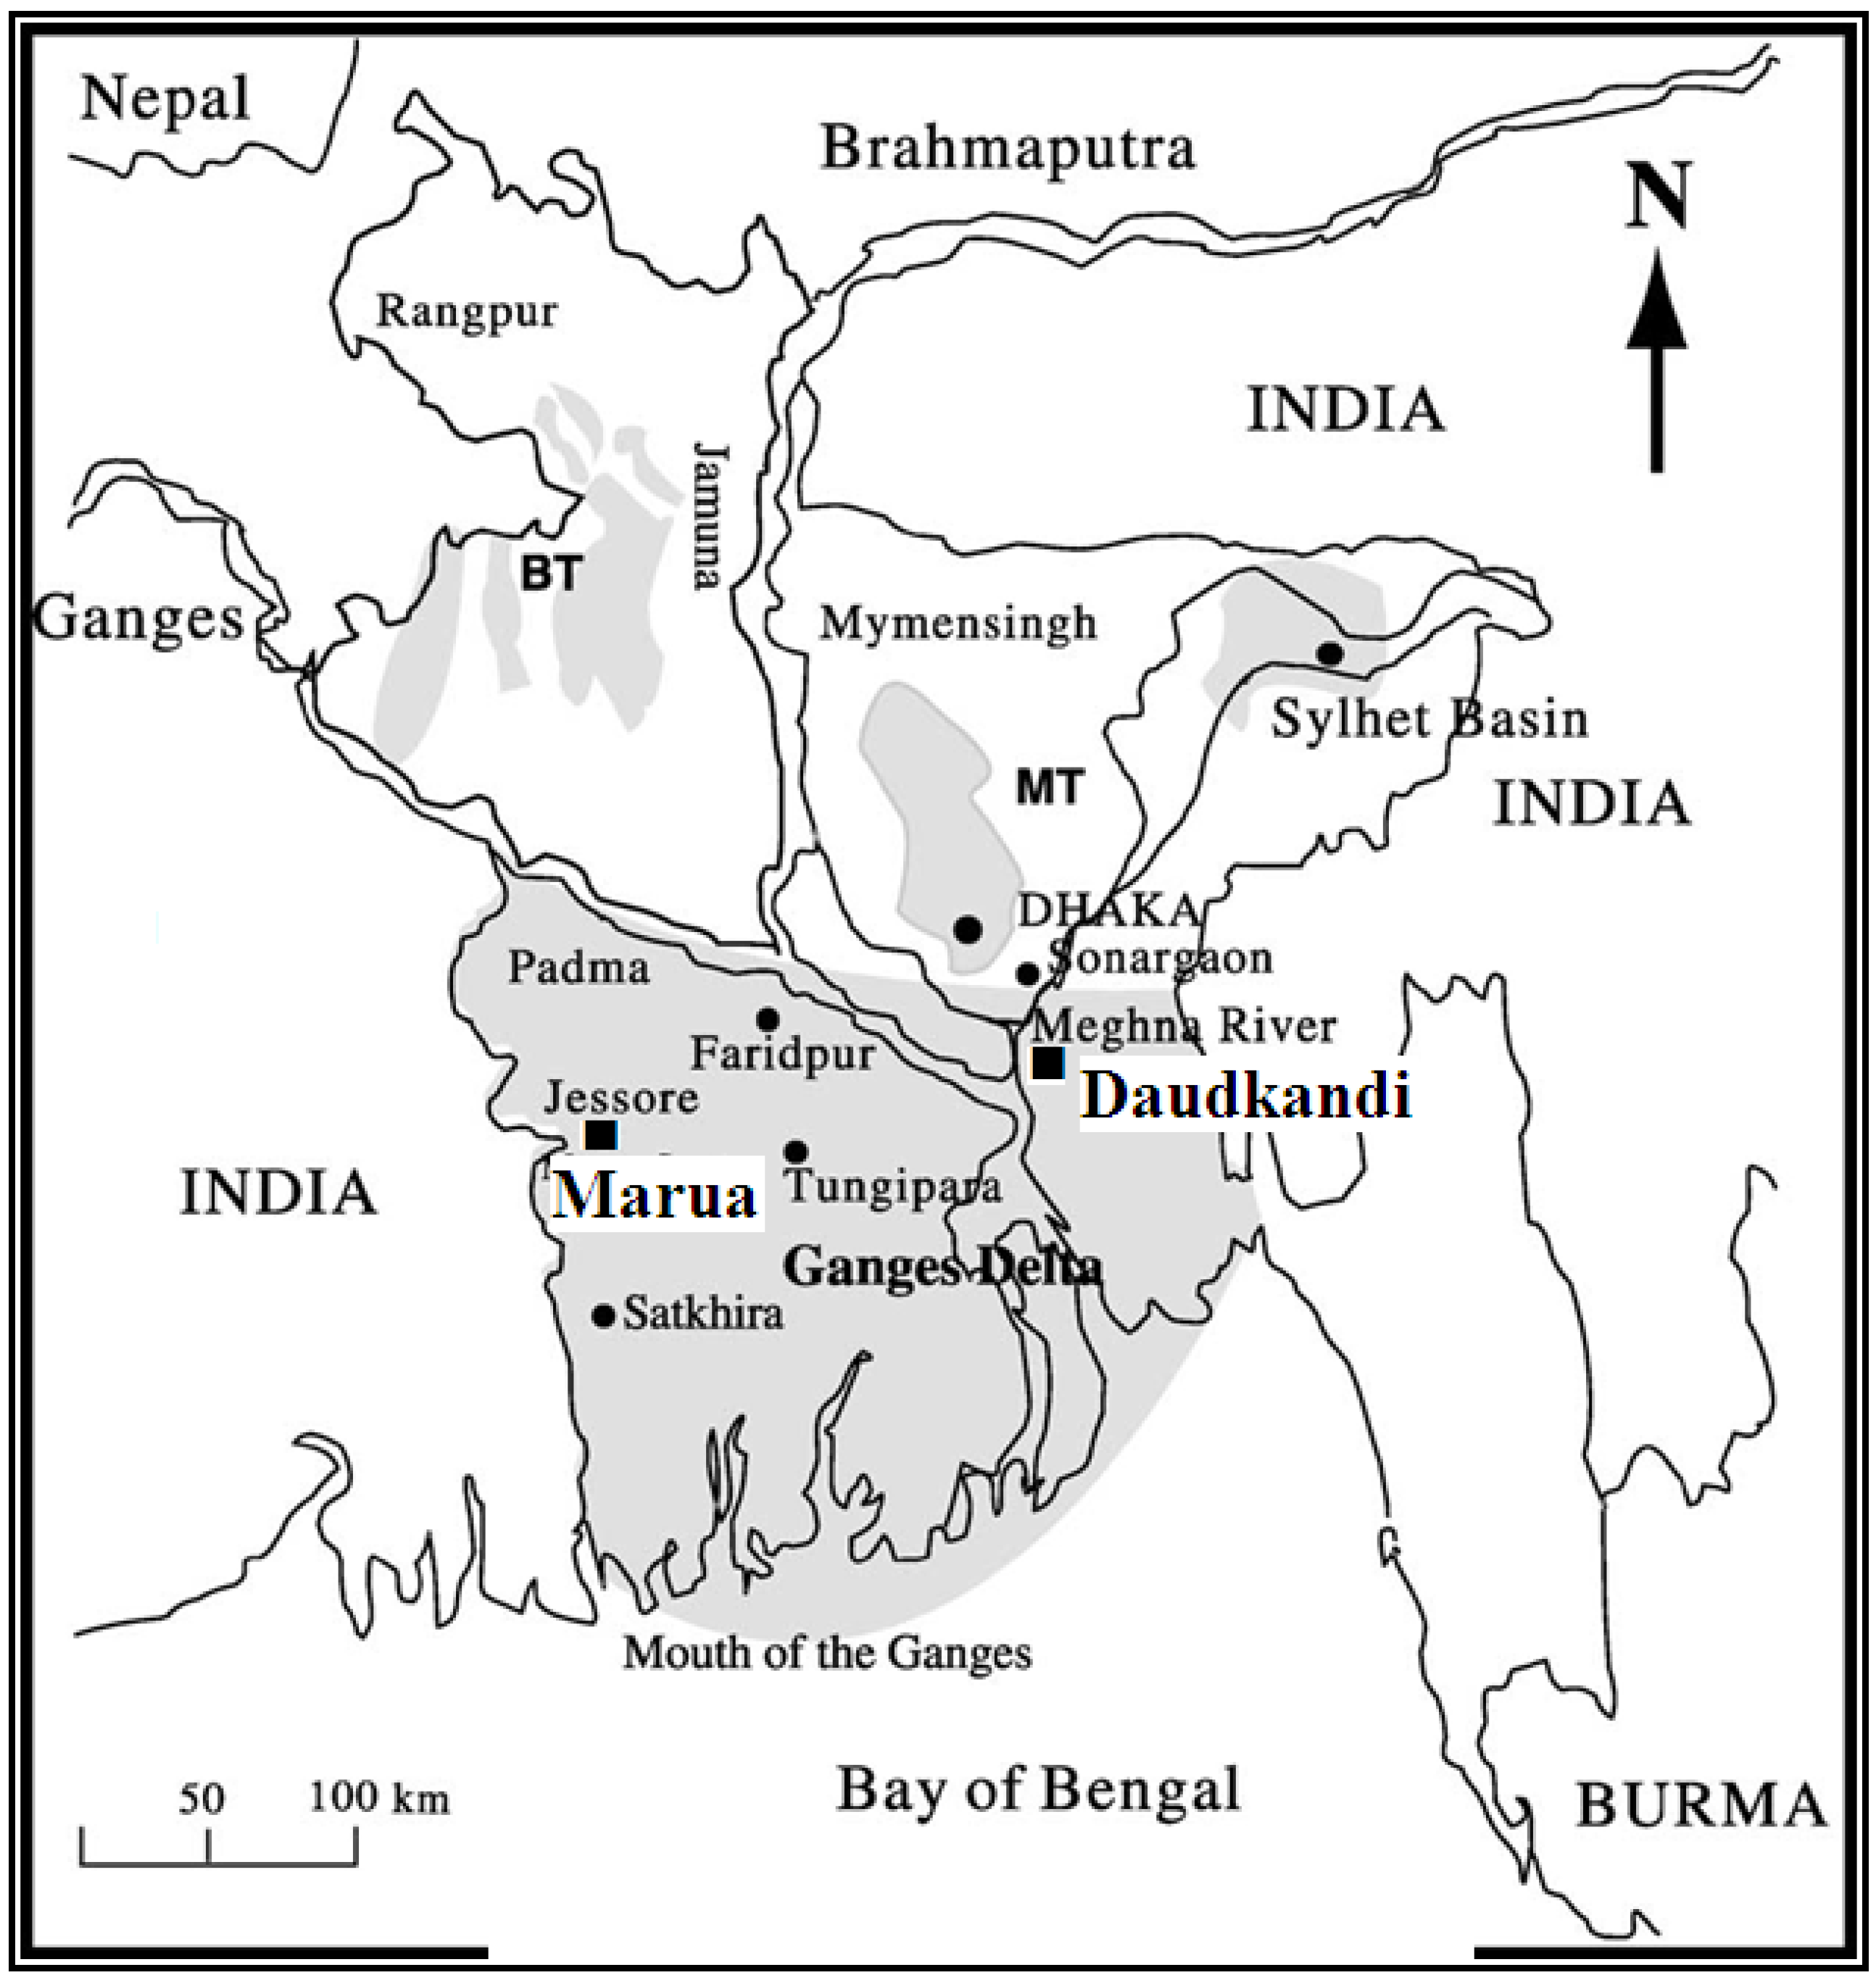
2. Geology of Study Areas
3. Materials and Methods
3.1. Sampling and Analysis of Water, Soils and Sediments
3.2. Analysis of Soils and Sediment
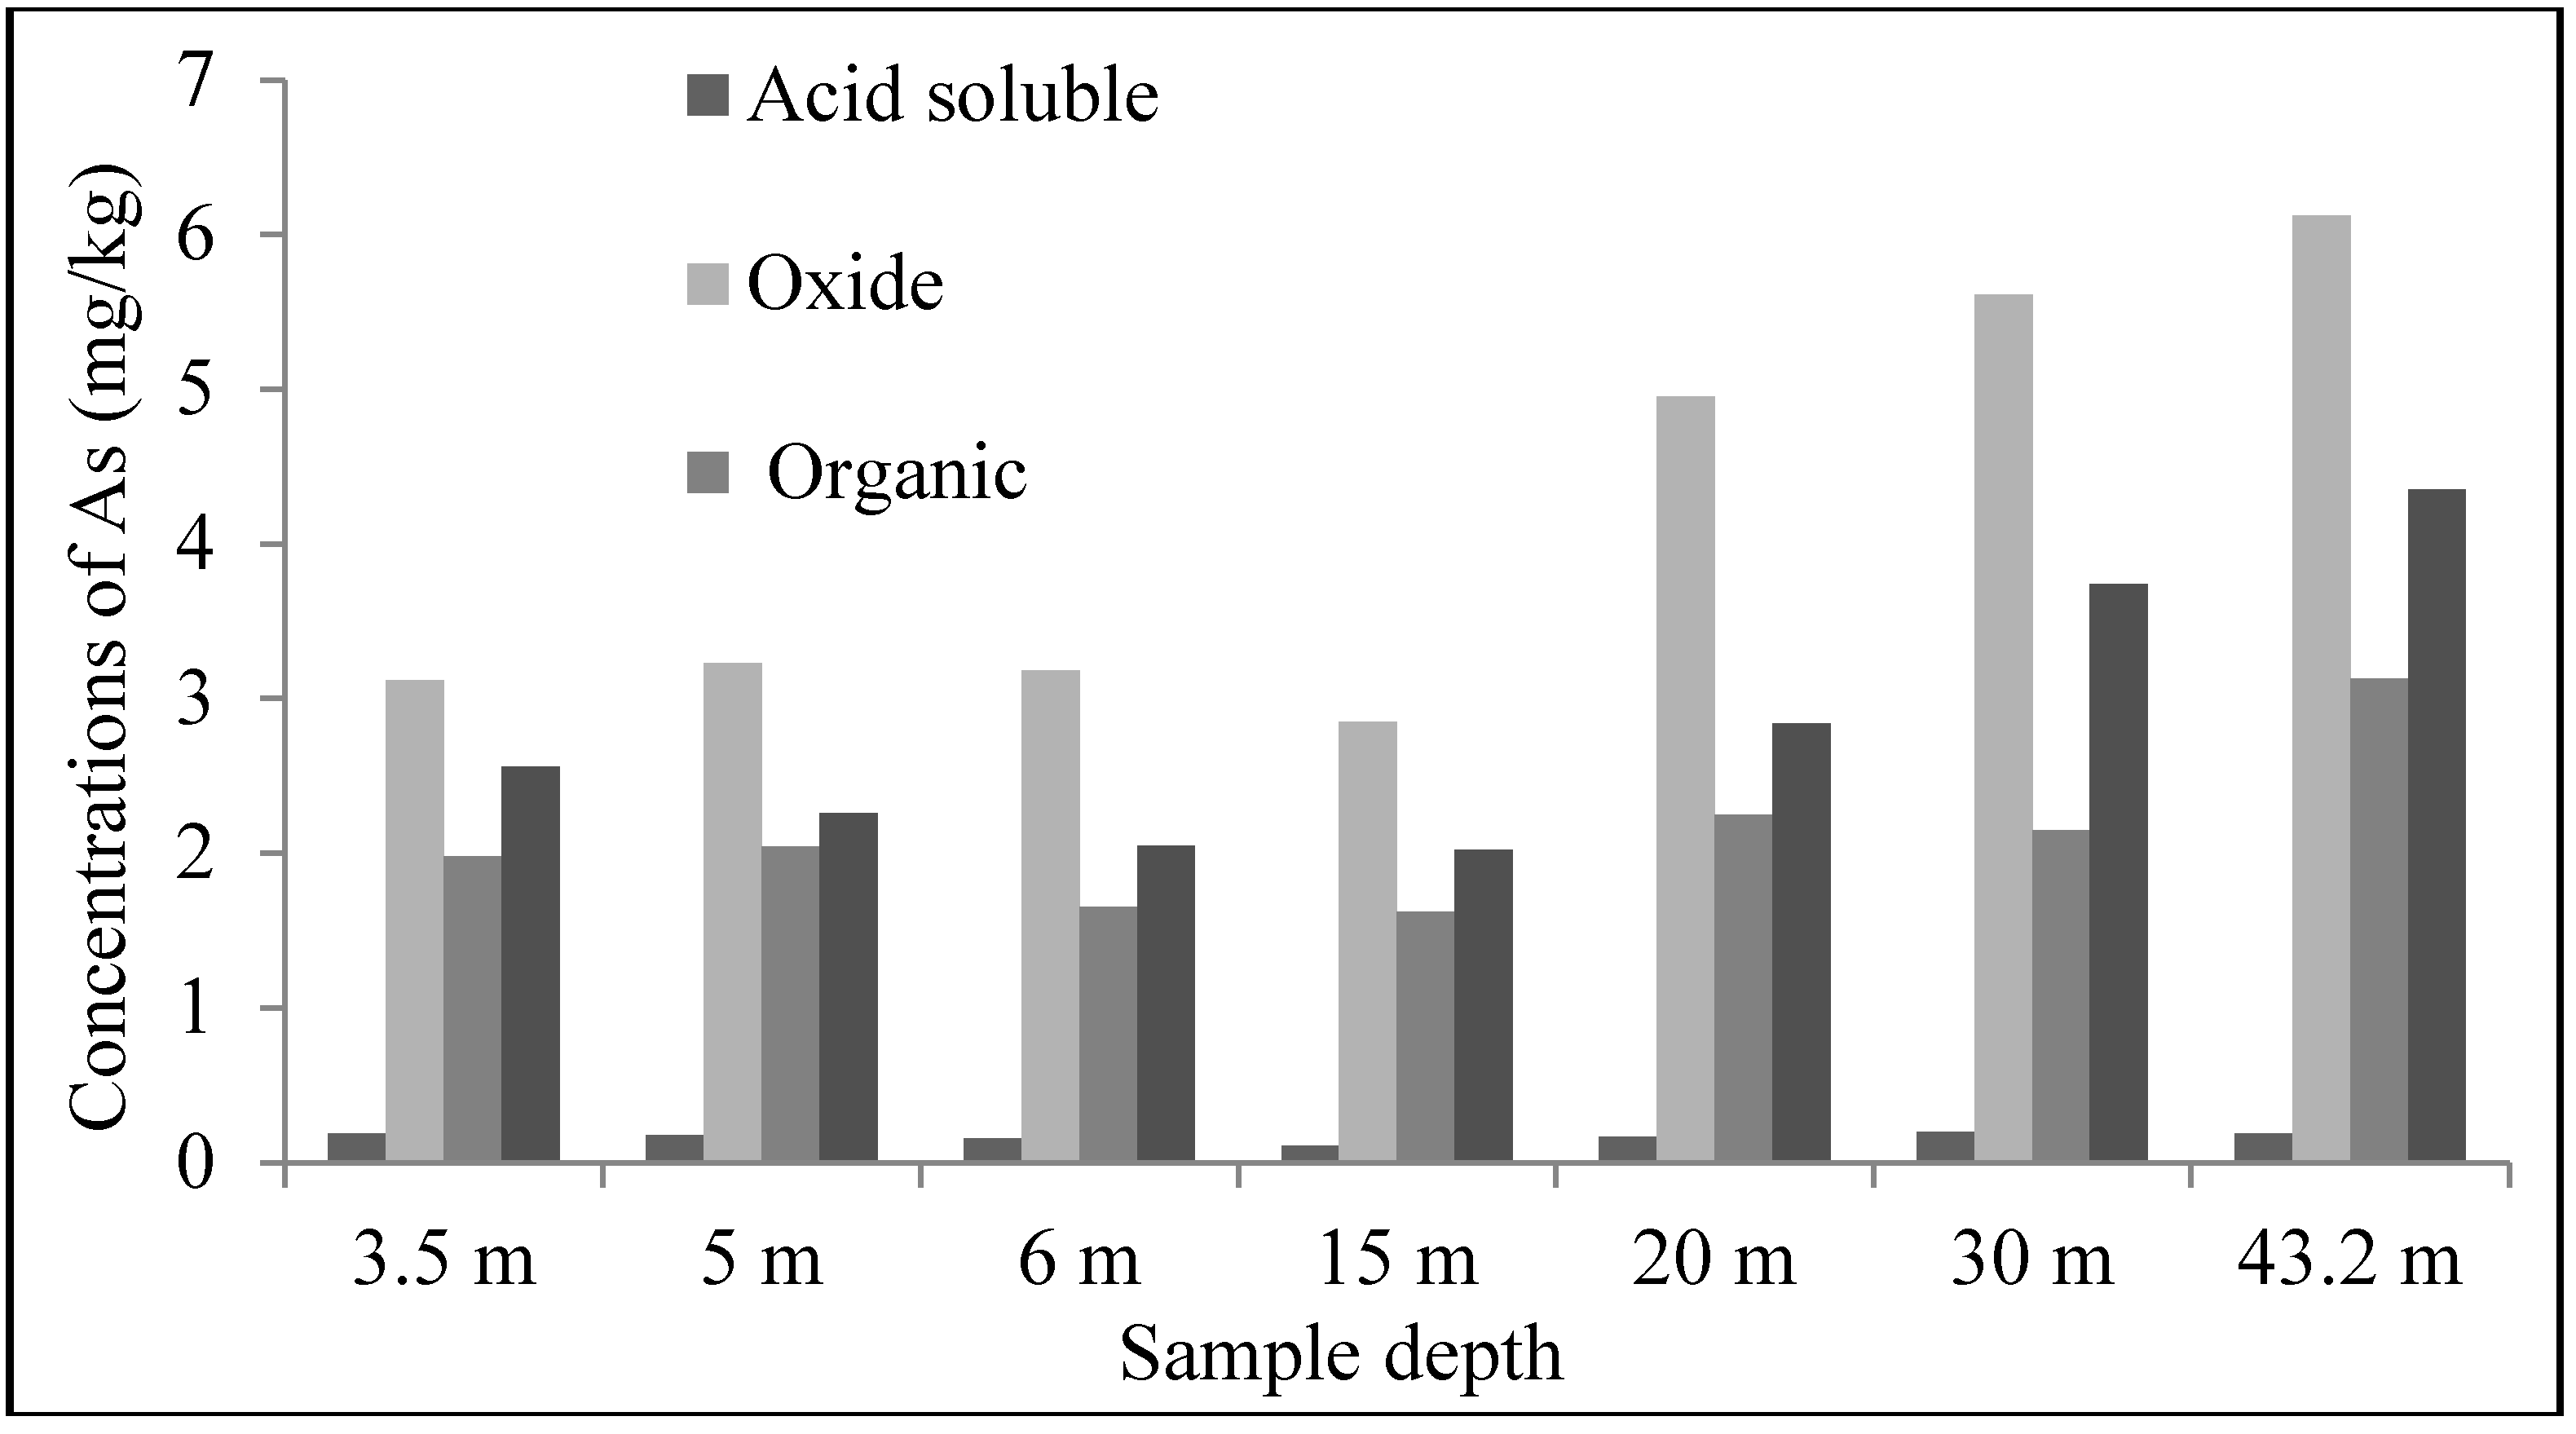
3.3. Sequential Extraction Procedures
4. Results and Discussion
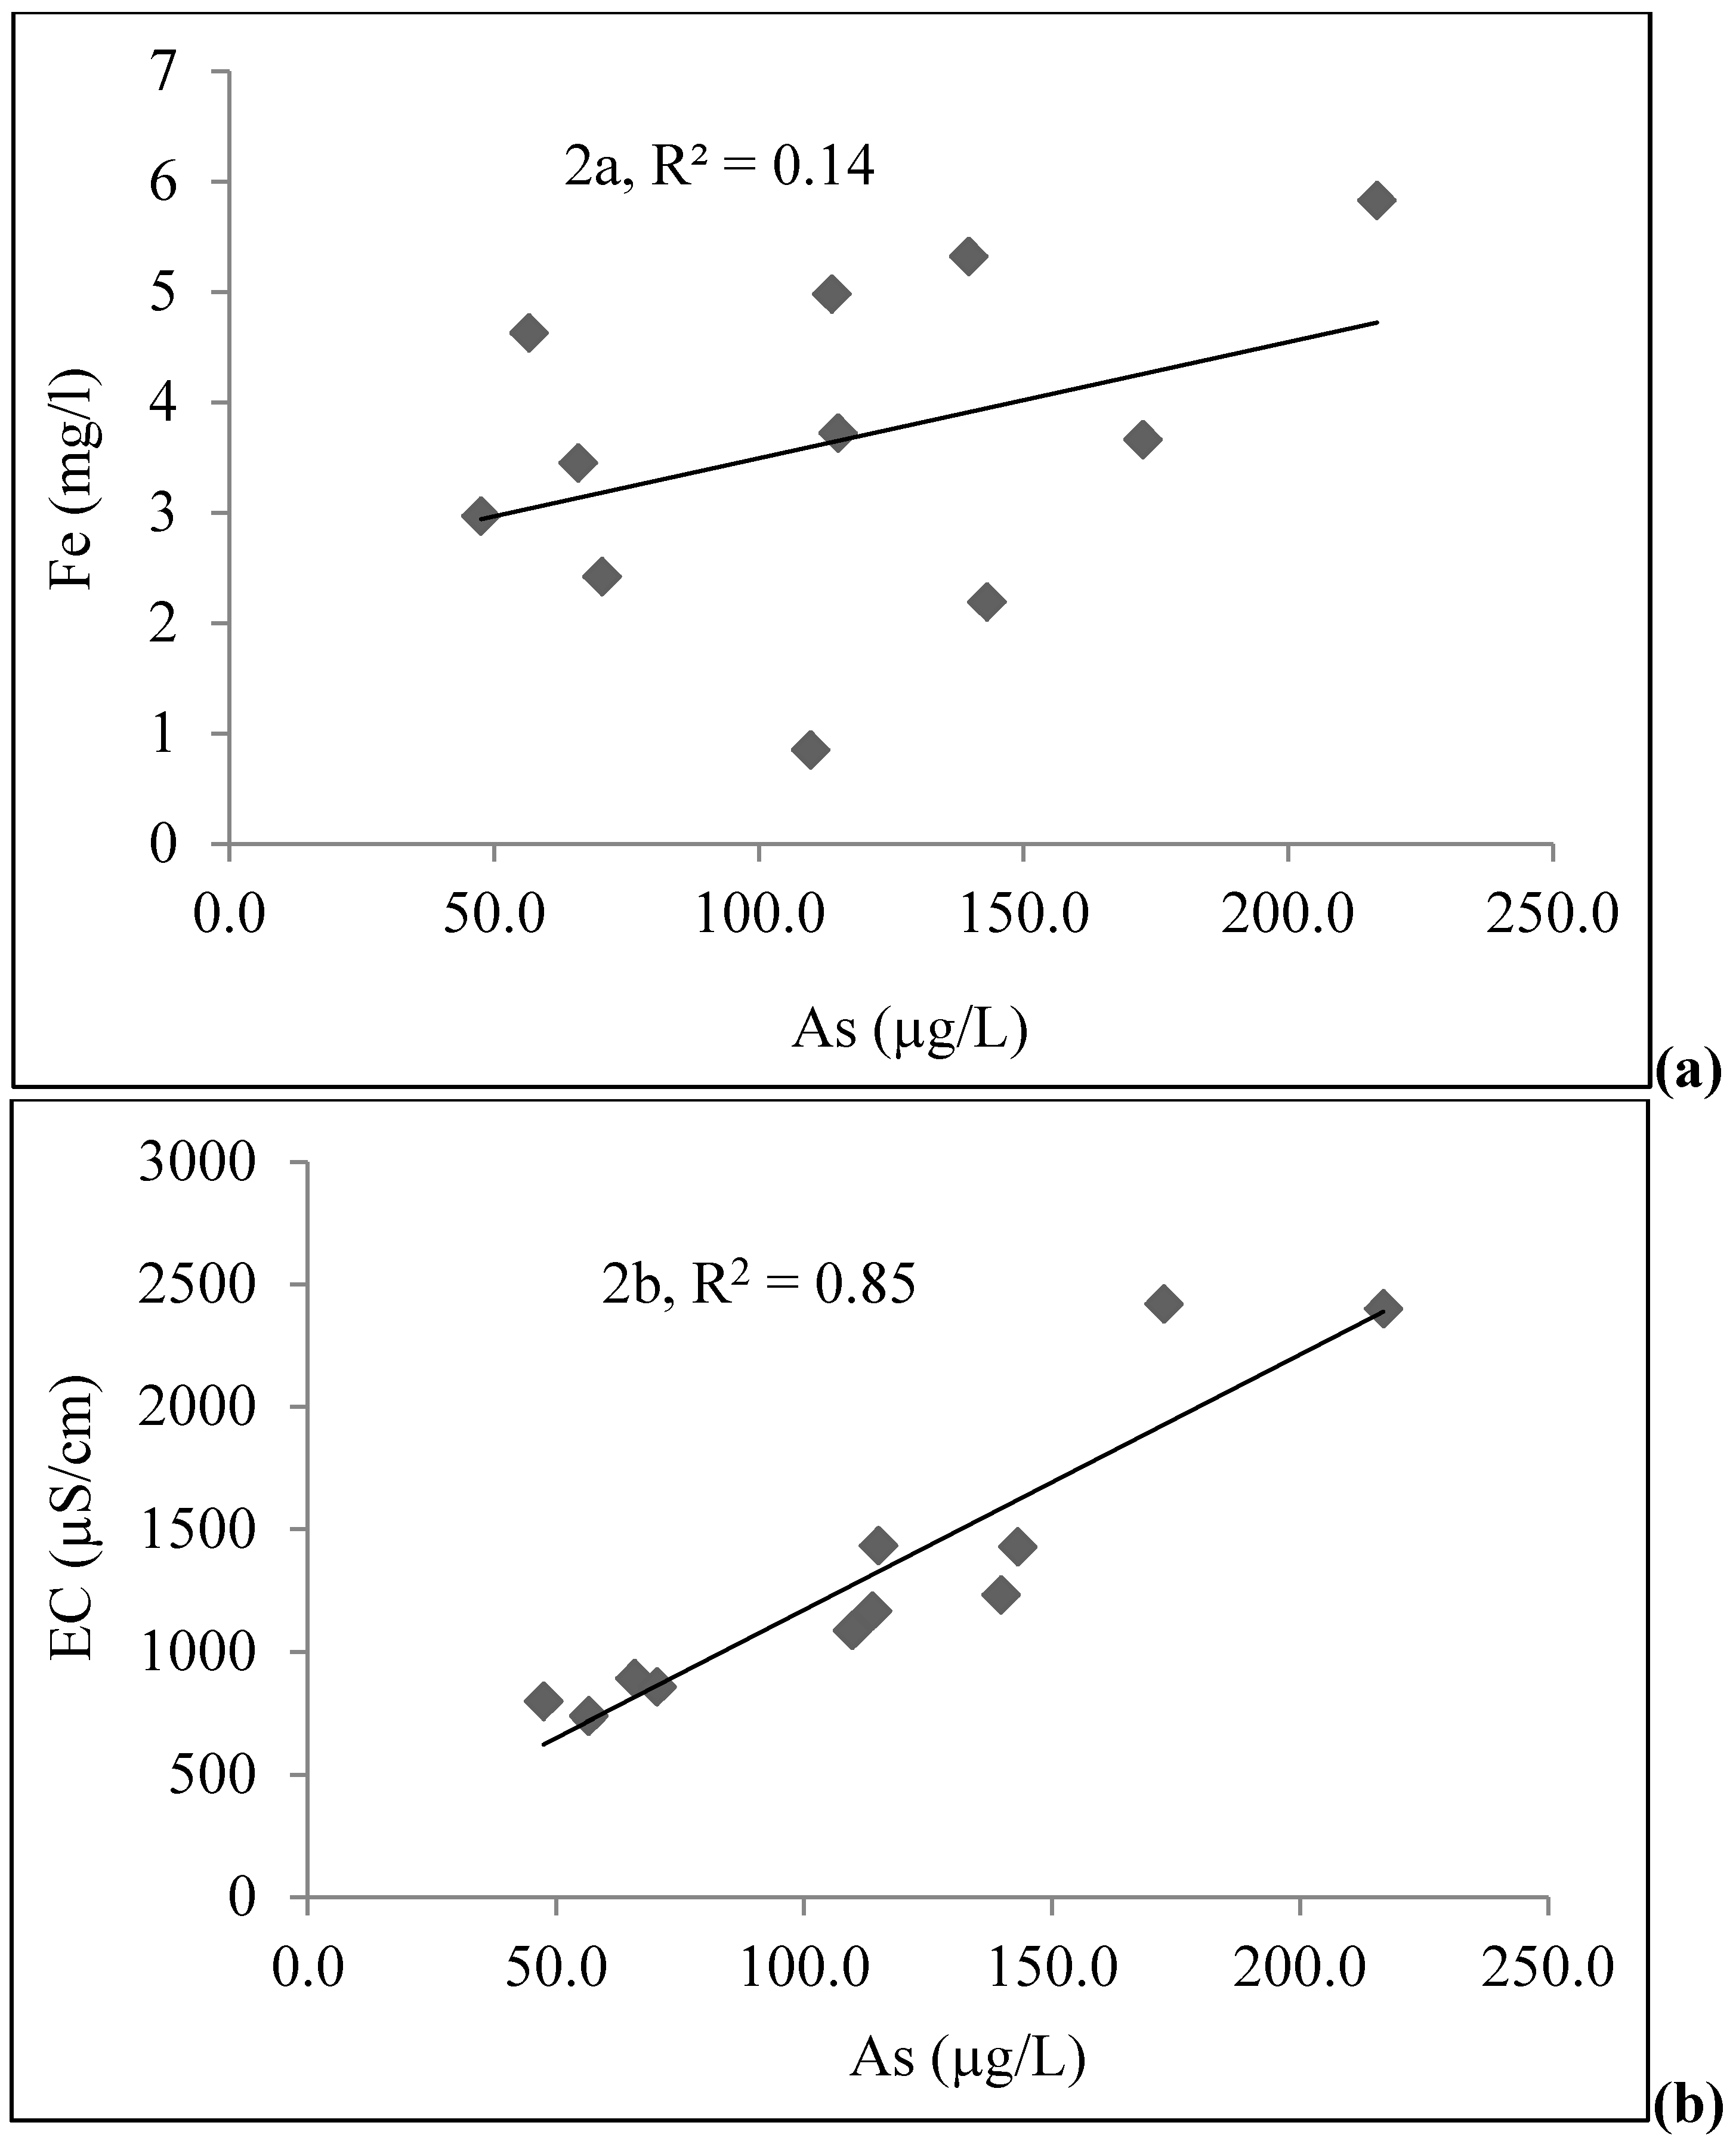
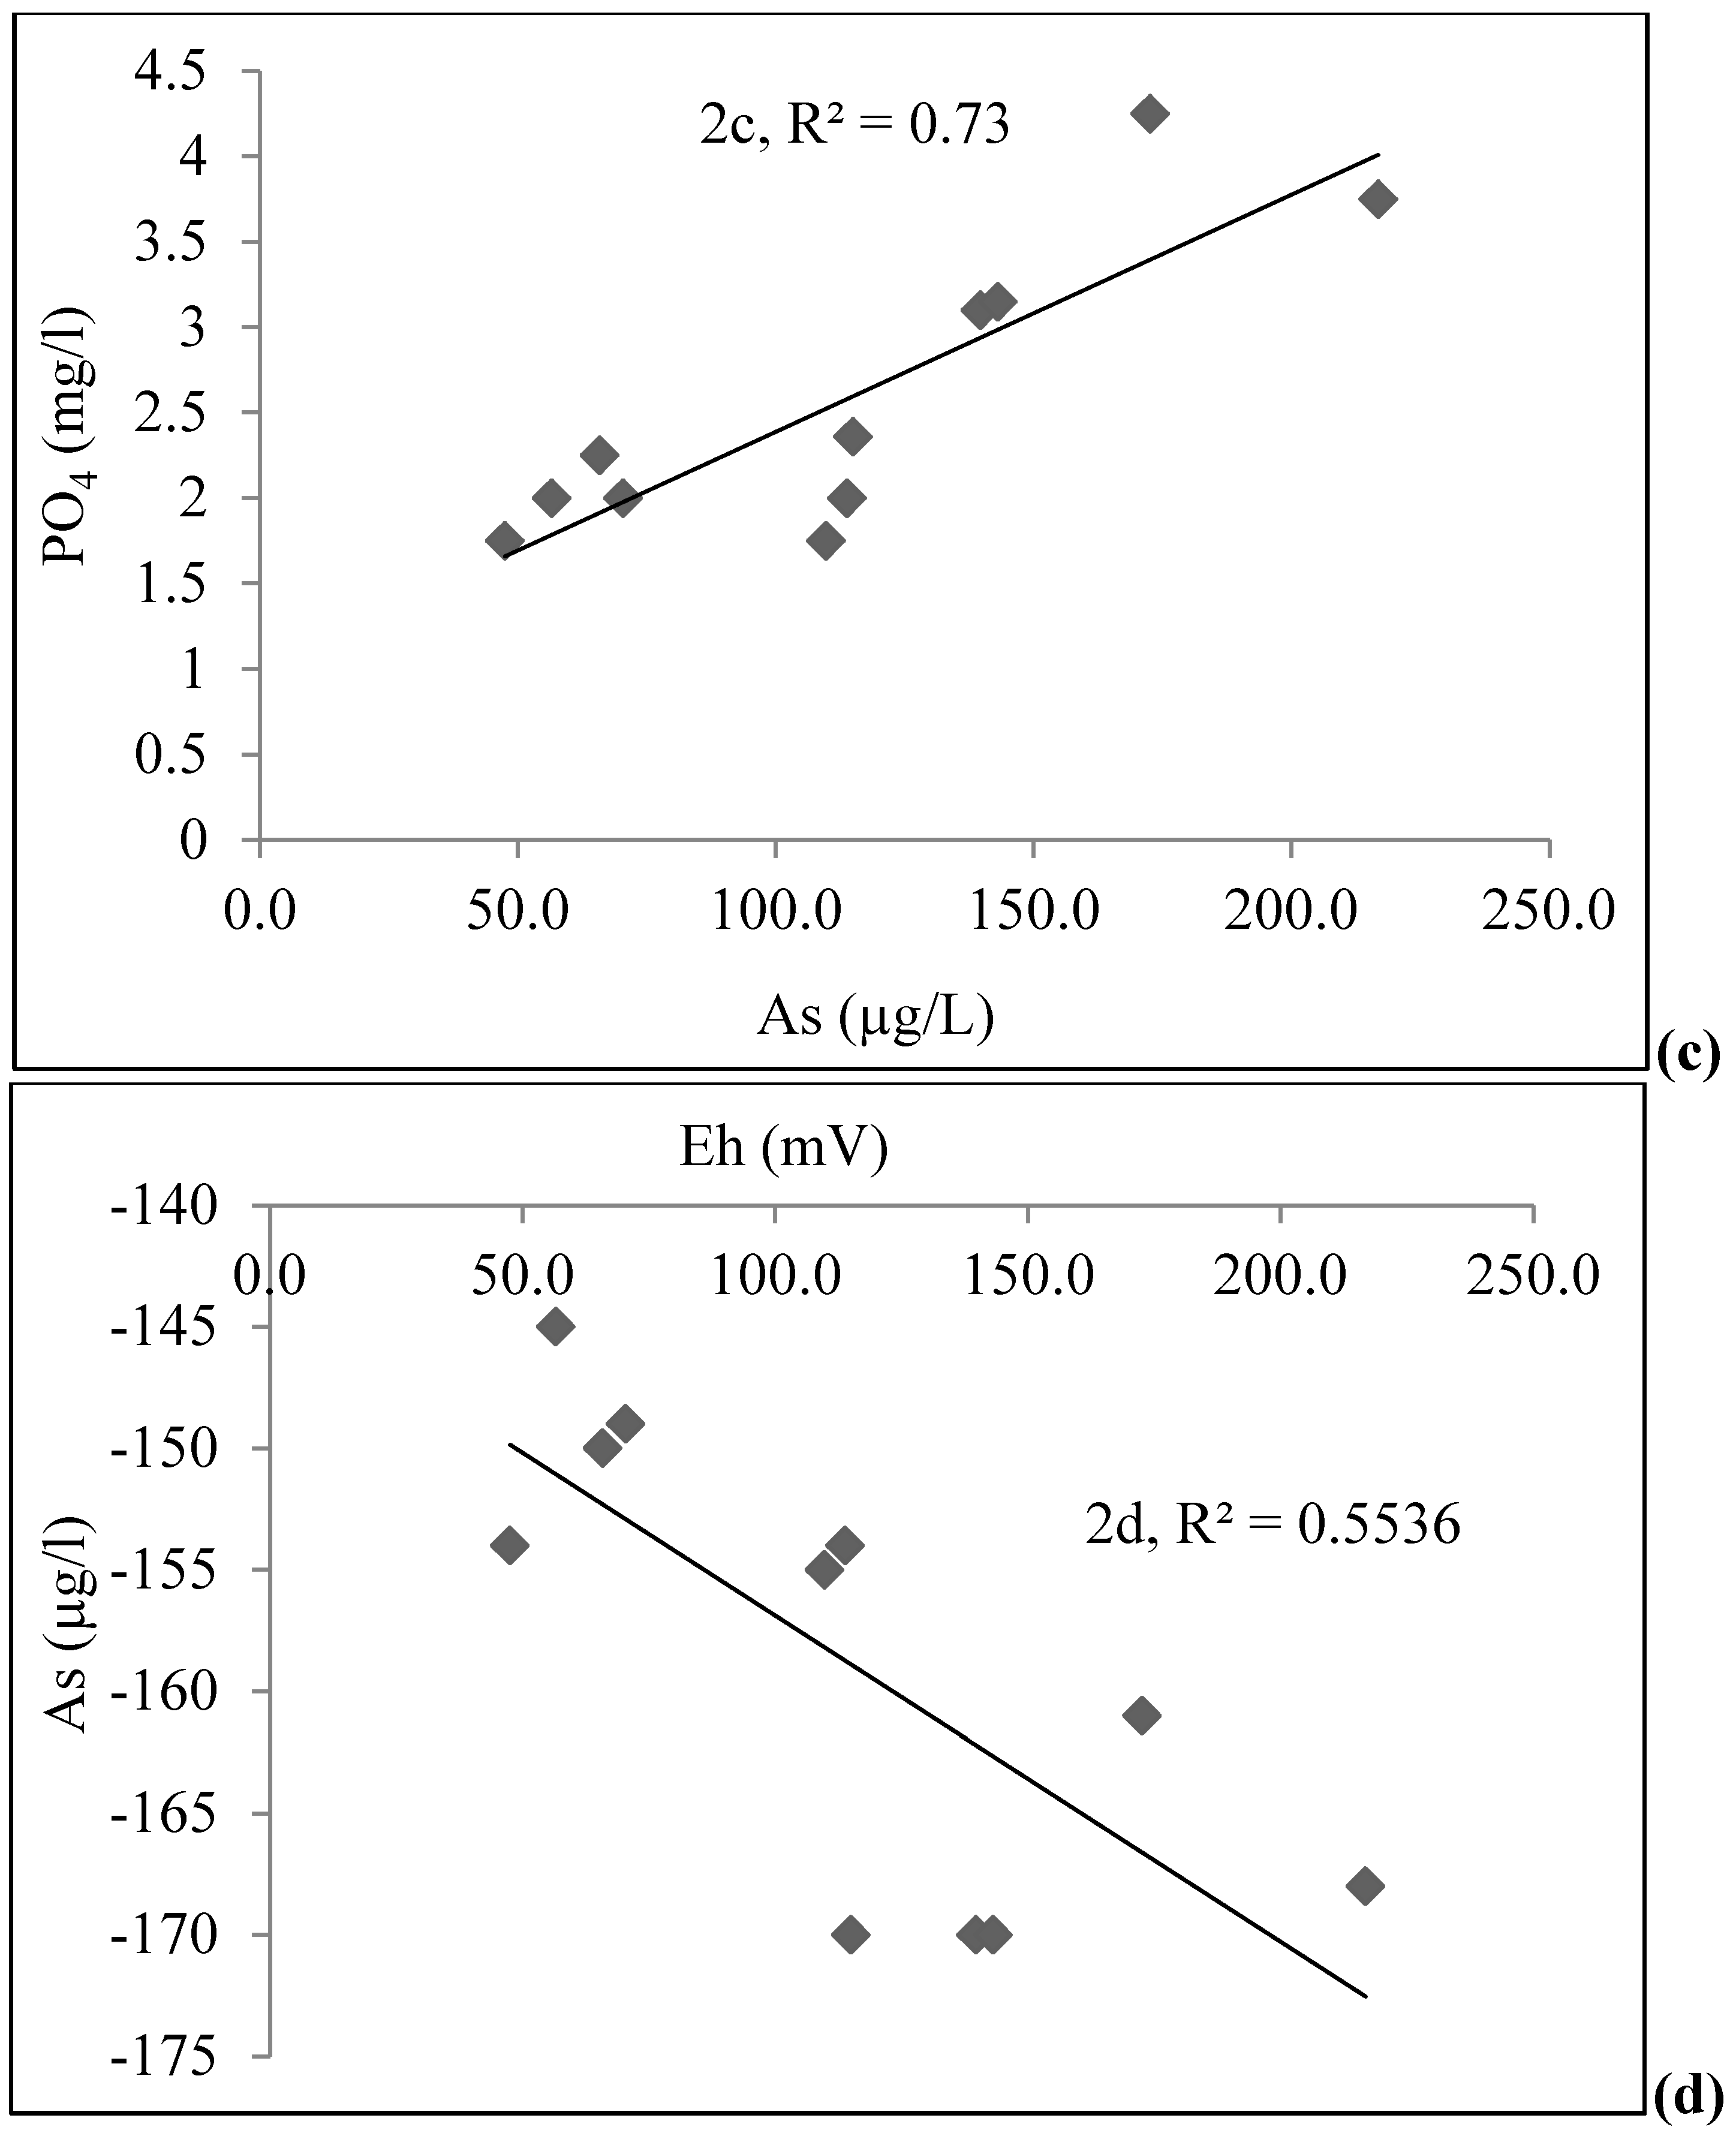
4.1. Groundwater Chemistry

| Depth (m) | As (µg/L) | Fe (mg/L) | PO43− (mg/L) | Age (yrs) | DO (mg/L) | Eh (mV) | pH | EC (µS/cm) | |
|---|---|---|---|---|---|---|---|---|---|
| STW | 18.29 | 216.8 | 5.83 | 3.75 | 15 | <0.1 | −168 | 7.1 | 2400 |
| 18.29 | 115.0 | 3.72 | 2.36 | 3 | <0.1 | −170 | 6.6 | 1433 | |
| 21.34 | 139.7 | 5.32 | 3.1 | 8 | <0.1 | −170 | 7.2 | 1232 | |
| 21.34 | 113.8 | 4.98 | 2.00 | 10 | <0.1 | −154 | 7.4 | 1166 | |
| 21.34 | 143.1 | 2.19 | 3.15 | 8 | 0.10 | −170 | 6.8 | 1428 | |
| 28.96 | 109.8 | 0.85 | 1.75 | 10–12 | 0.10 | −155 | 7.2 | 1087 | |
| 13.72 | 56.6 | 4.63 | 2.00 | 30 | <0.1 | −145 | 7.0 | 738 | |
| 21.34 | 65.9 | 3.45 | 2.25 | 15 | <0.1 | −150 | 7.1 | 891 | |
| 18.29 | 47.5 | 2.97 | 1.75 | 5 | 0.10 | −154 | 7.1 | 798 | |
| 12.19 | 70.4 | 2.42 | 2.00 | 9–10 | 0.11 | −149 | 6.7 | 857 | |
| 24.38 | 172.6 | 3.66 | 4.25 | 8 | <0.1 | −161 | 7.1 | 2420 | |
| DTW | 80.77 | 0.77 | 0.12 | <mdl | 0.5 | 0.8 | −13 | 6.8 | 825 |
| 85.34 | 0.5 | 0.14 | 0.20 | 1 | 1.0 | 11 | 6.8 | 933 | |
| 84.73 | 0.3 | 0.31 | 0.17 | 3 | 0.7 | −10 | 7.0 | 1217 | |
| 85.34 | 0.55 | 0.39 | 0.32 | 3 | 1.0 | −6 | 7.1 | 941 | |
| SW | pond | 0.4 | - | 0.125 | - | - | - | 6.9 | - |
| pond | 0.8 | - | 0.25 | - | - | - | 7.3 | - | |
| pond | 0.6 | - | 0.05 | - | - | - | 7.2 | - | |
| pond | 3.0 | - | 0.125 | - | - | - | 7.0 | - | |
| canal | 5.0 | - | 0.125 | - | - | - | 6.9 | - | |
| canal | 0.8 | - | 0.25 | - | - | - | 7.1 | - | |
| canal | 0.7 | - | 0.05 | - | - | - | 6.8 | - |

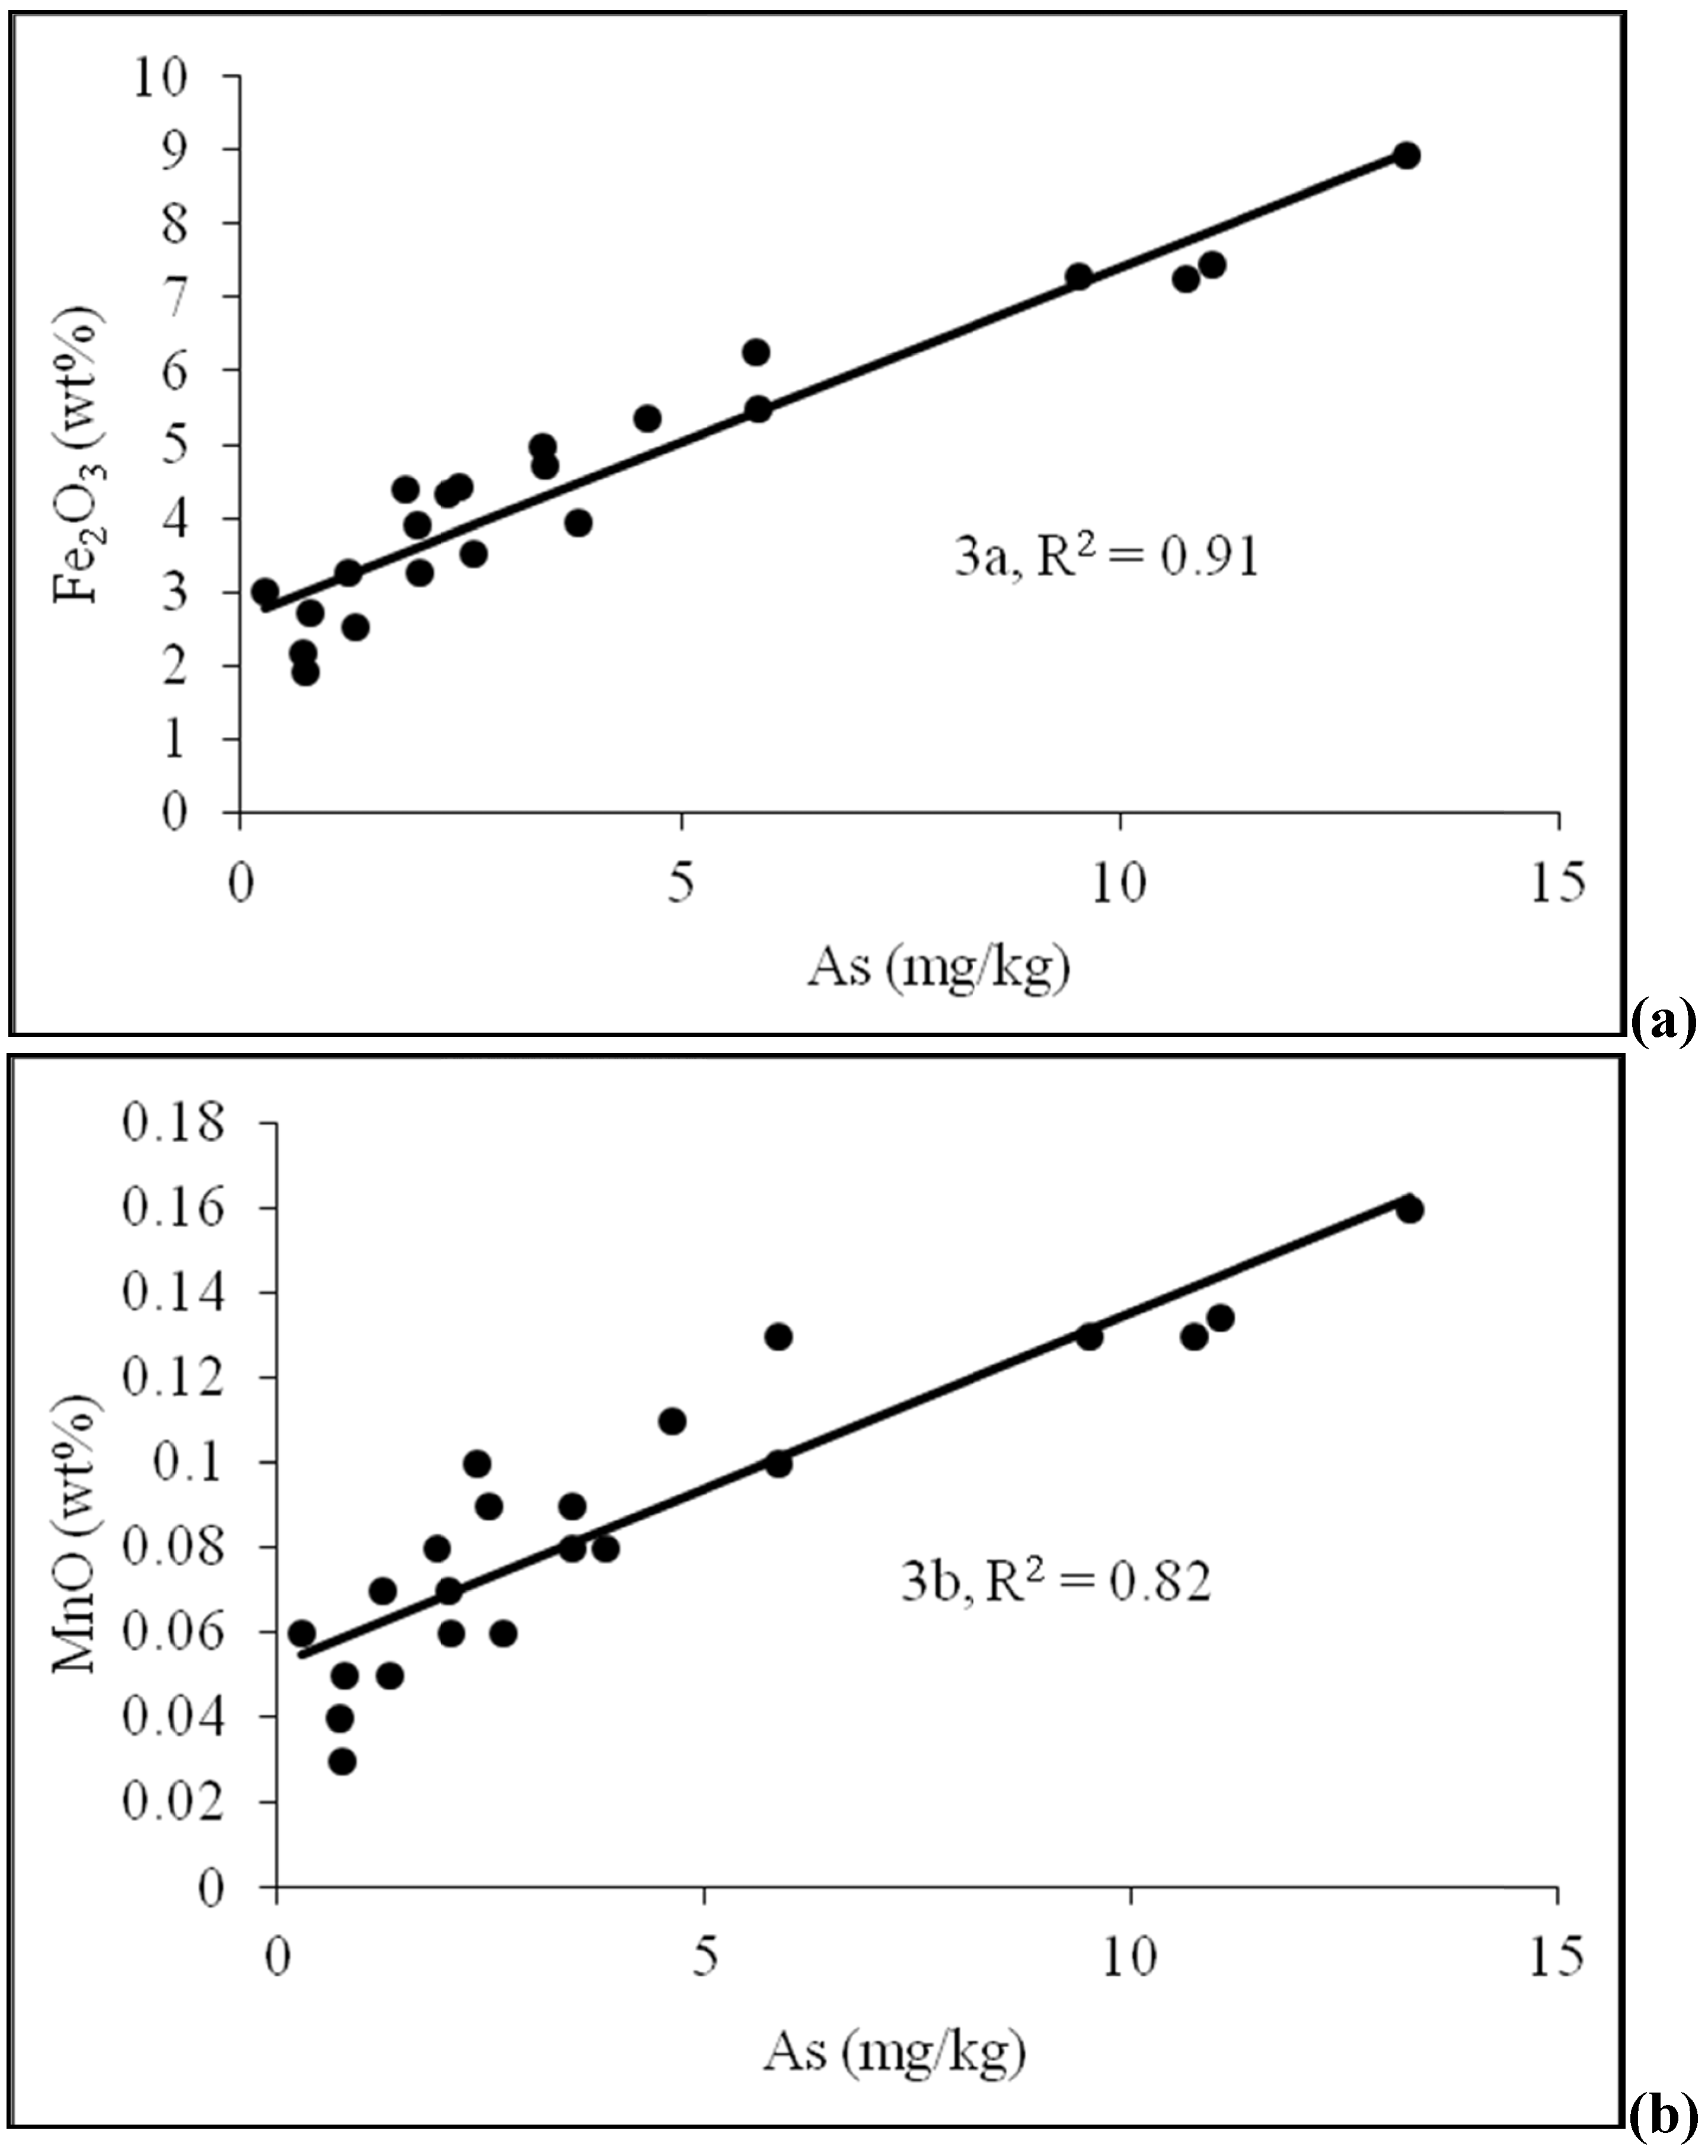
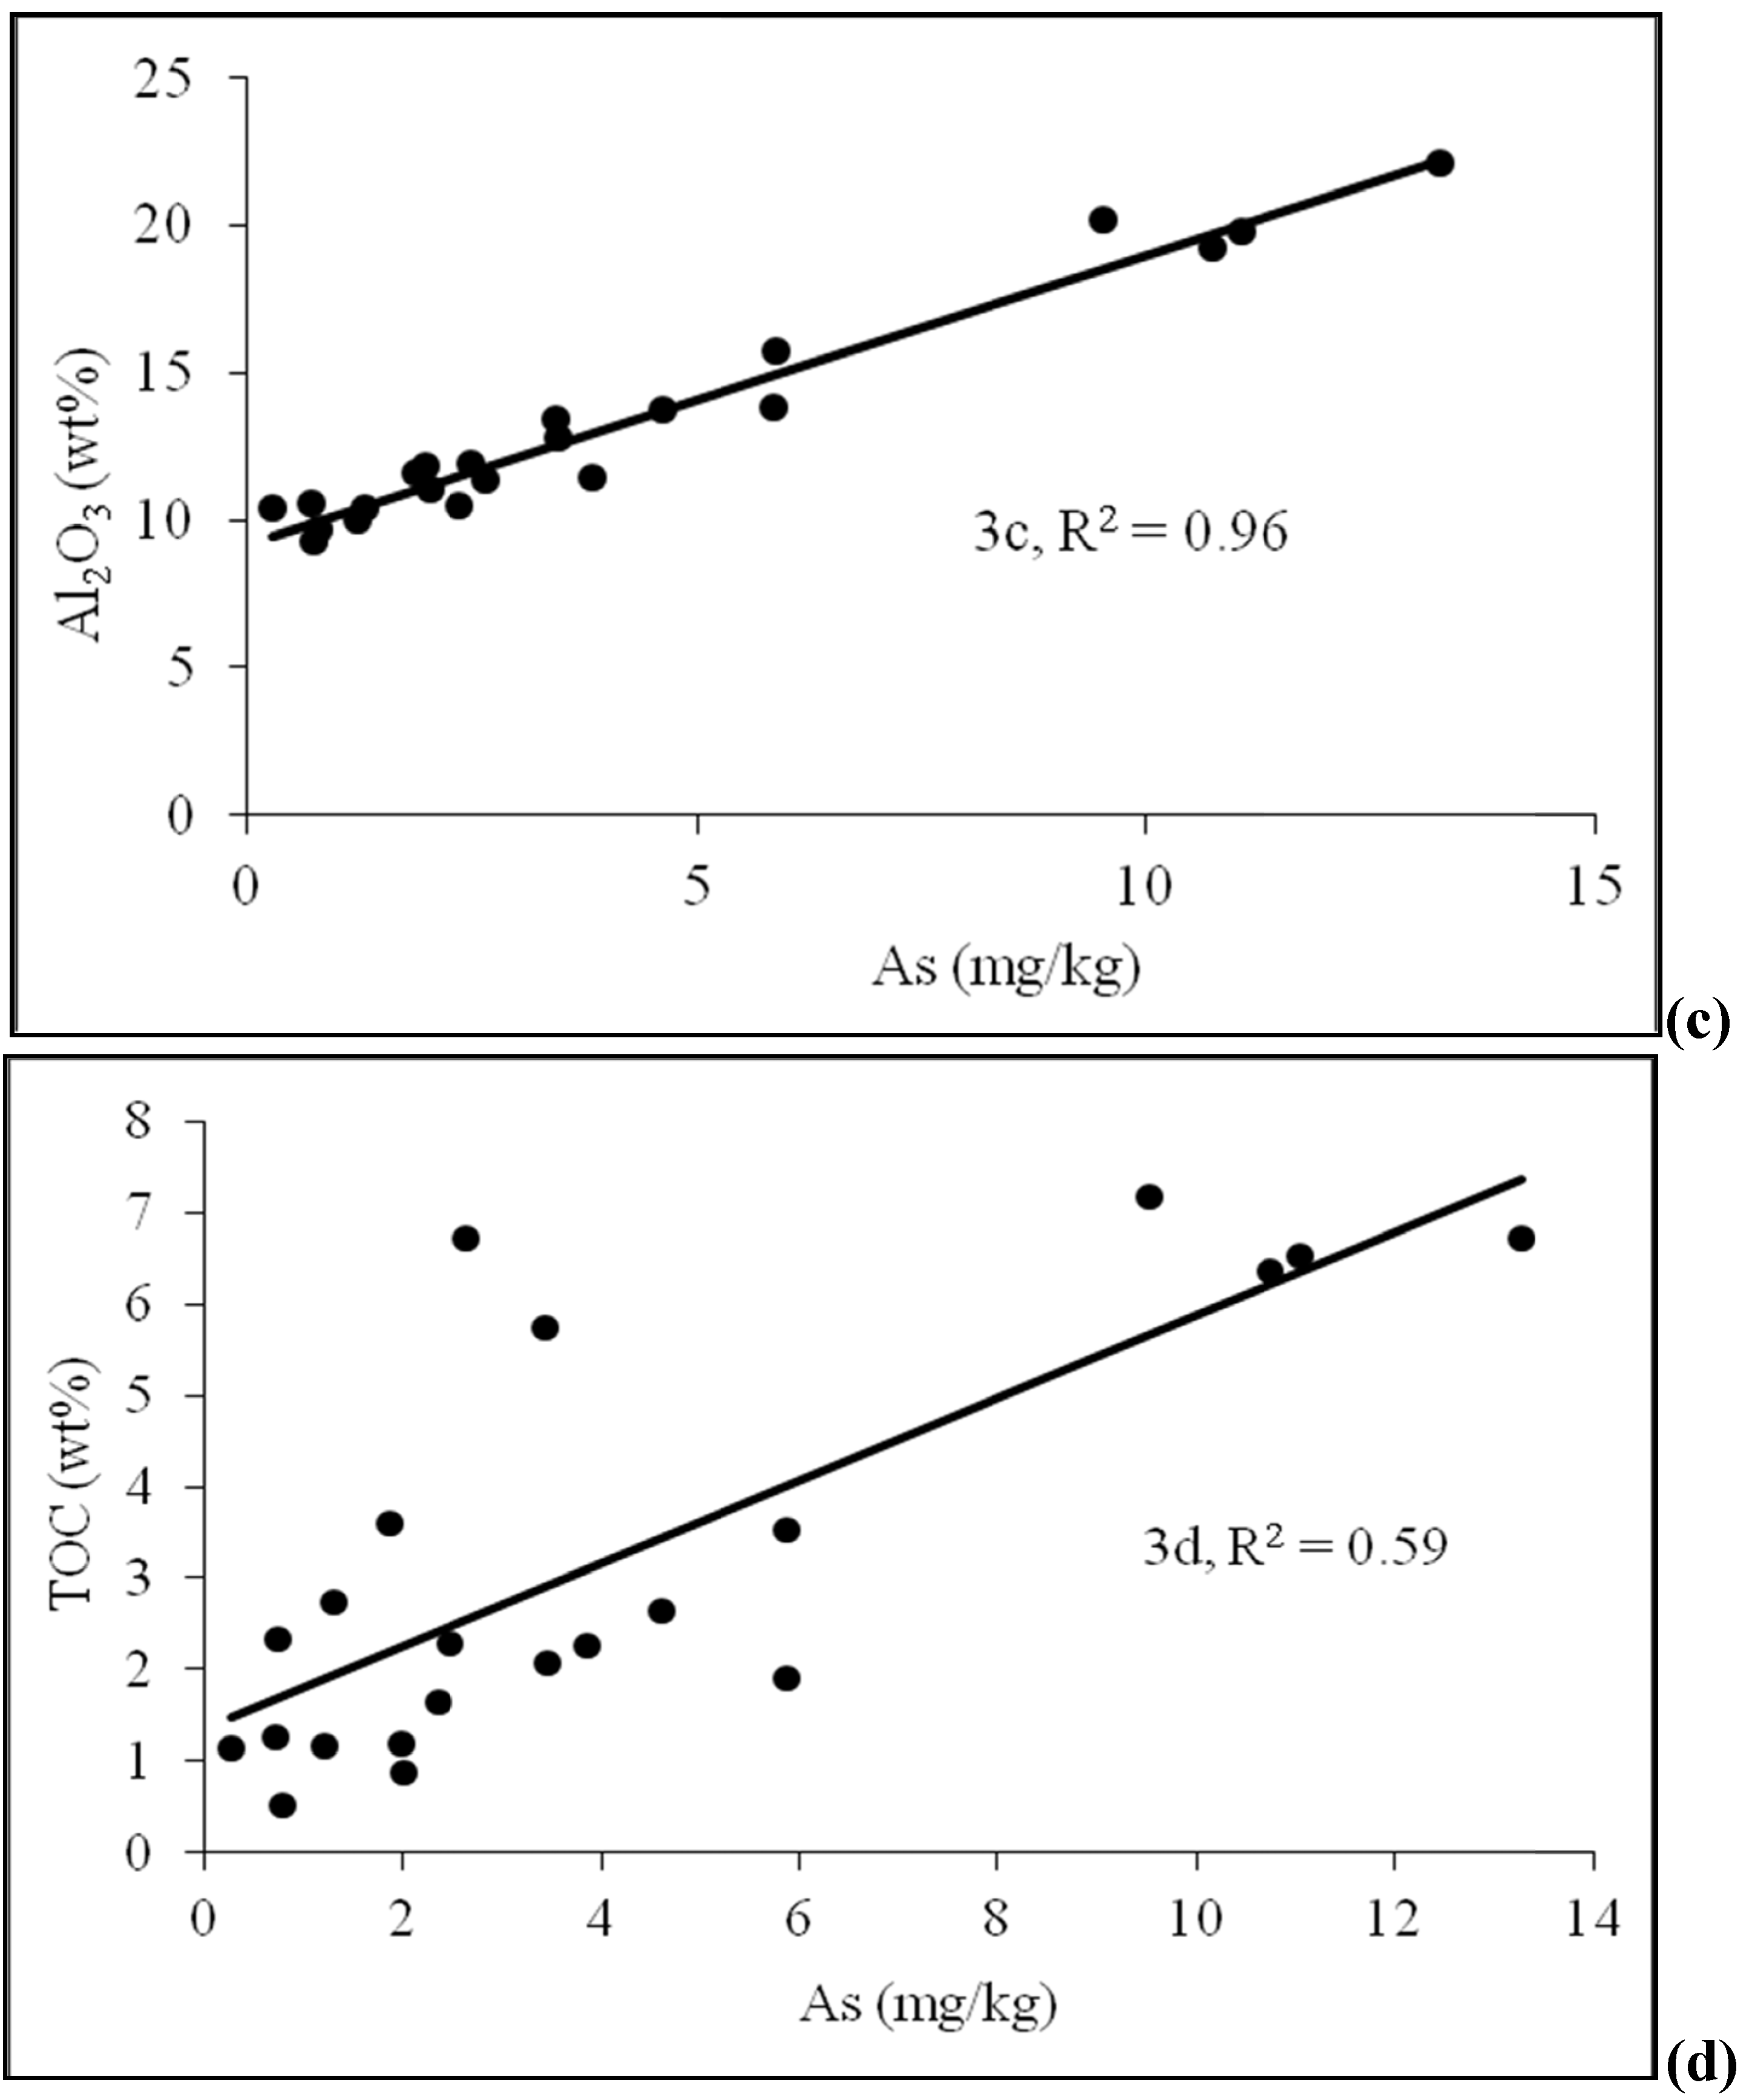
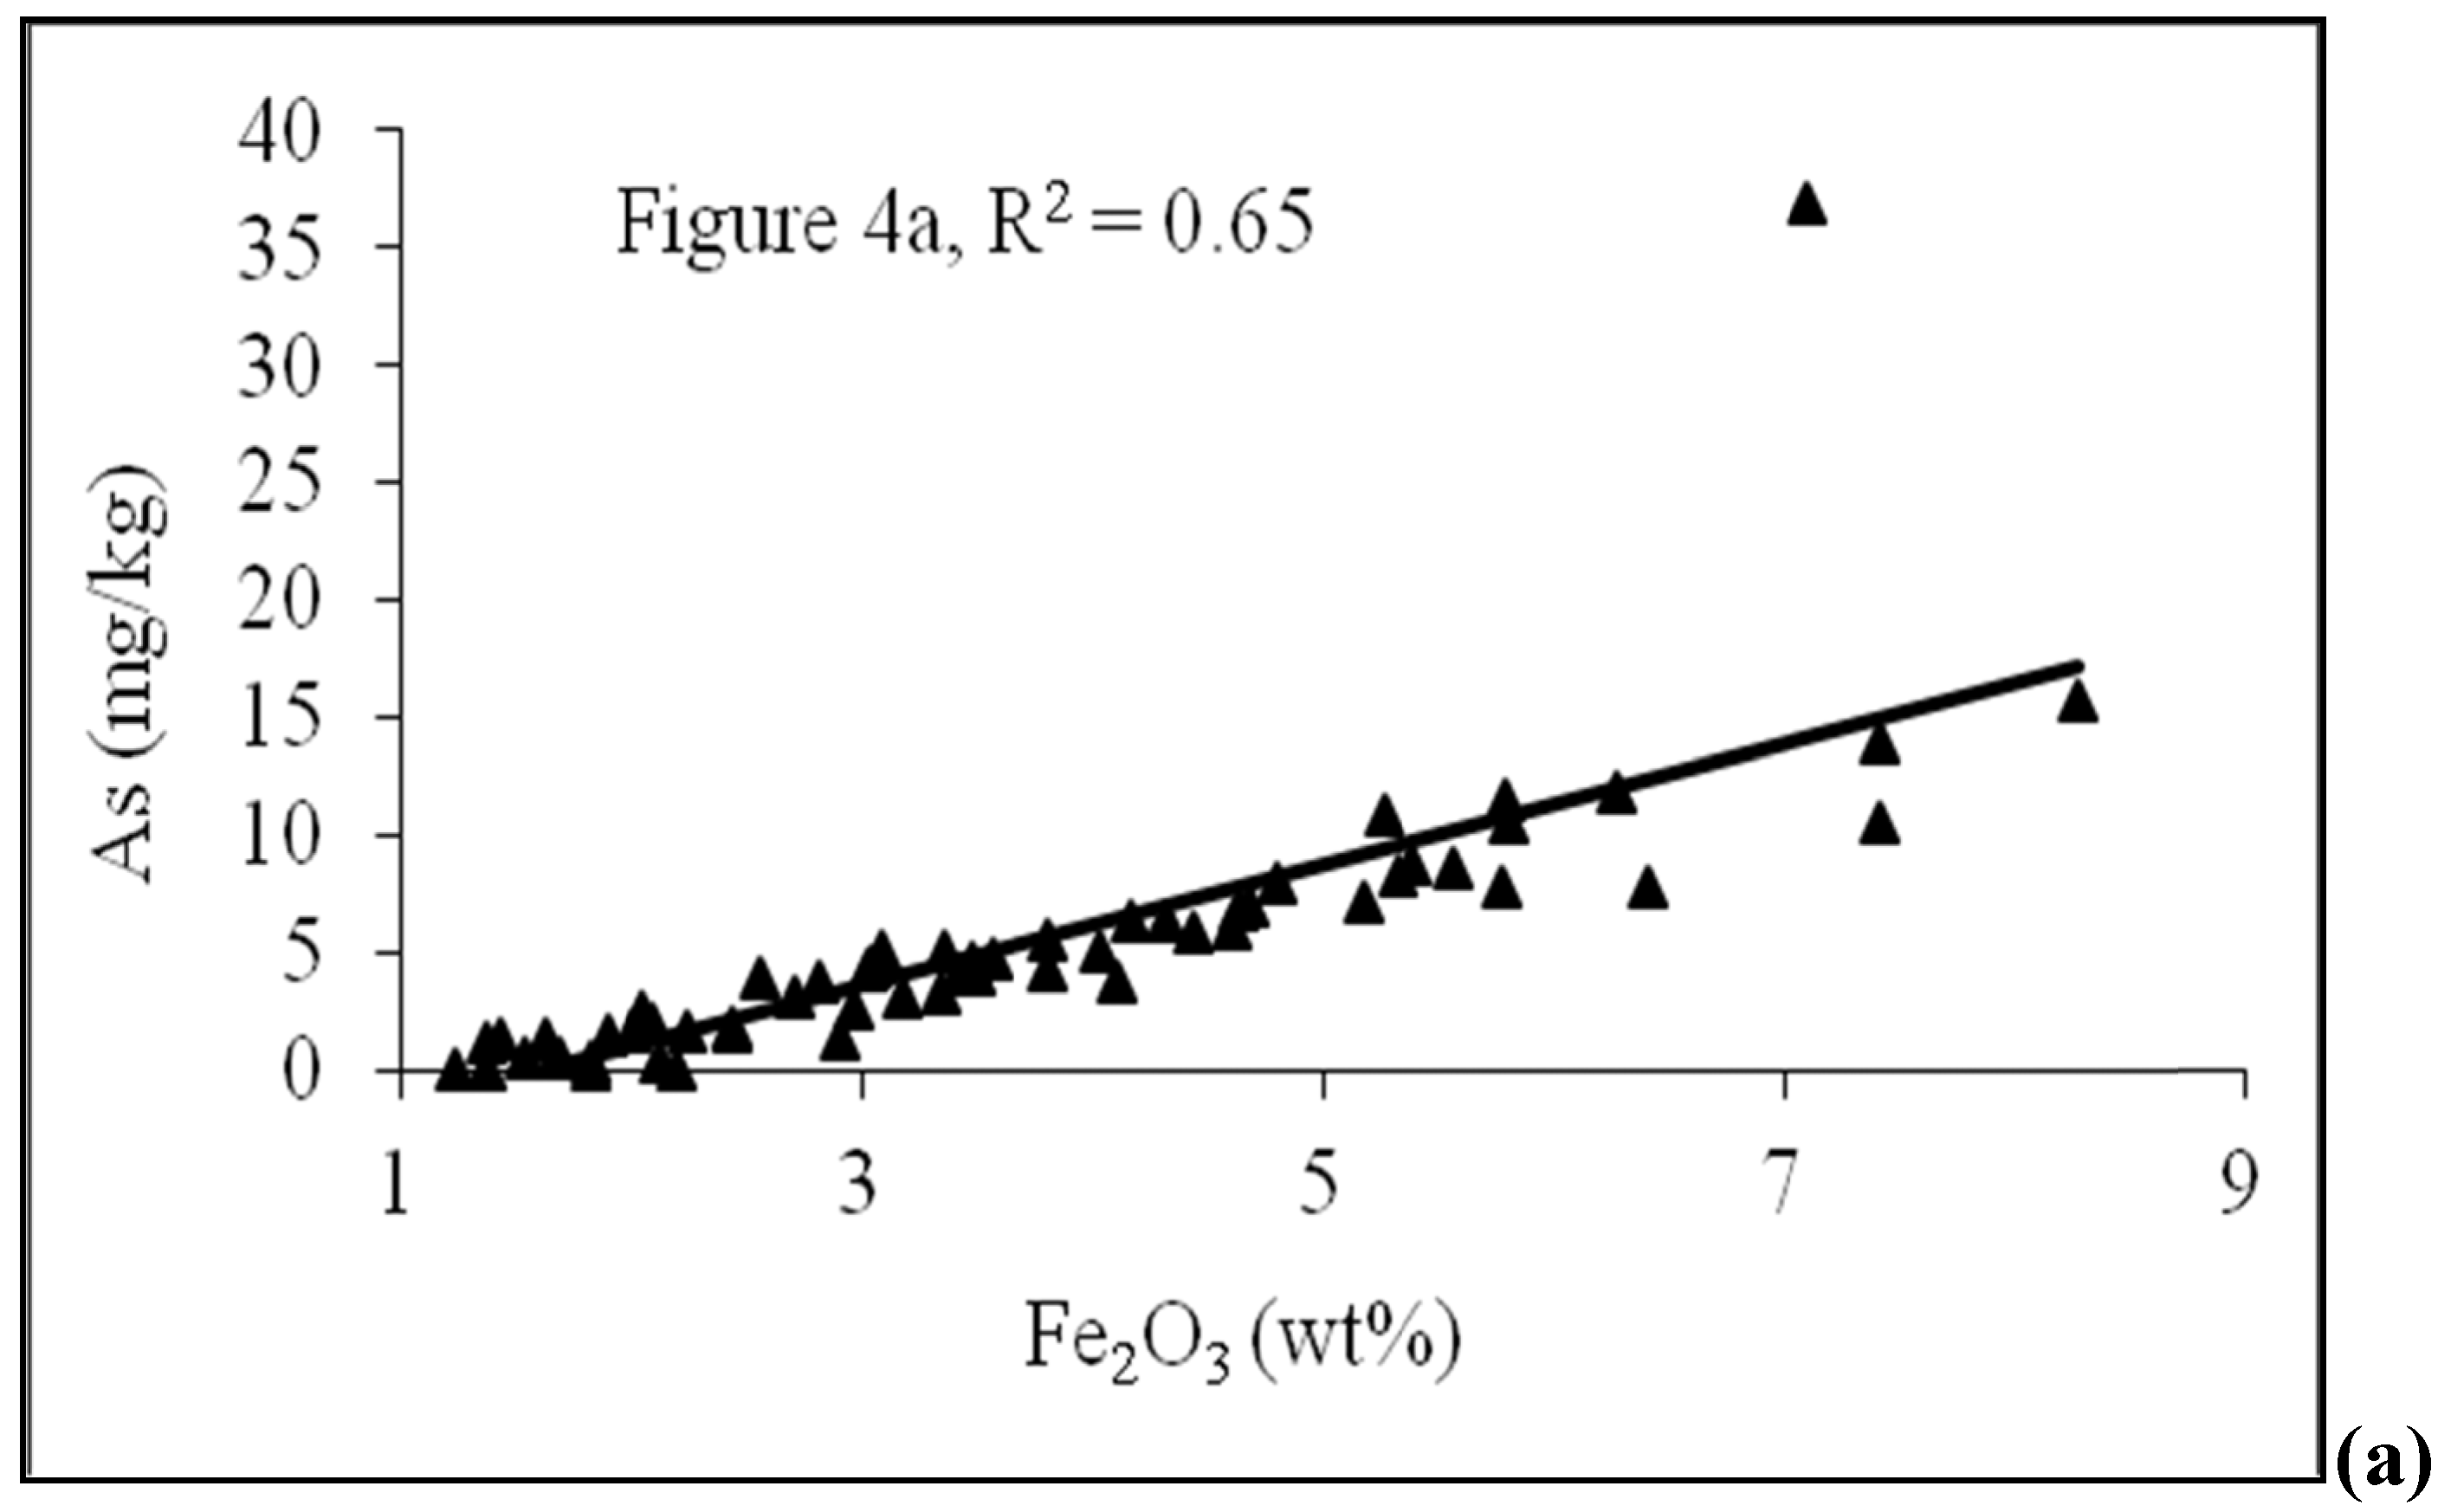
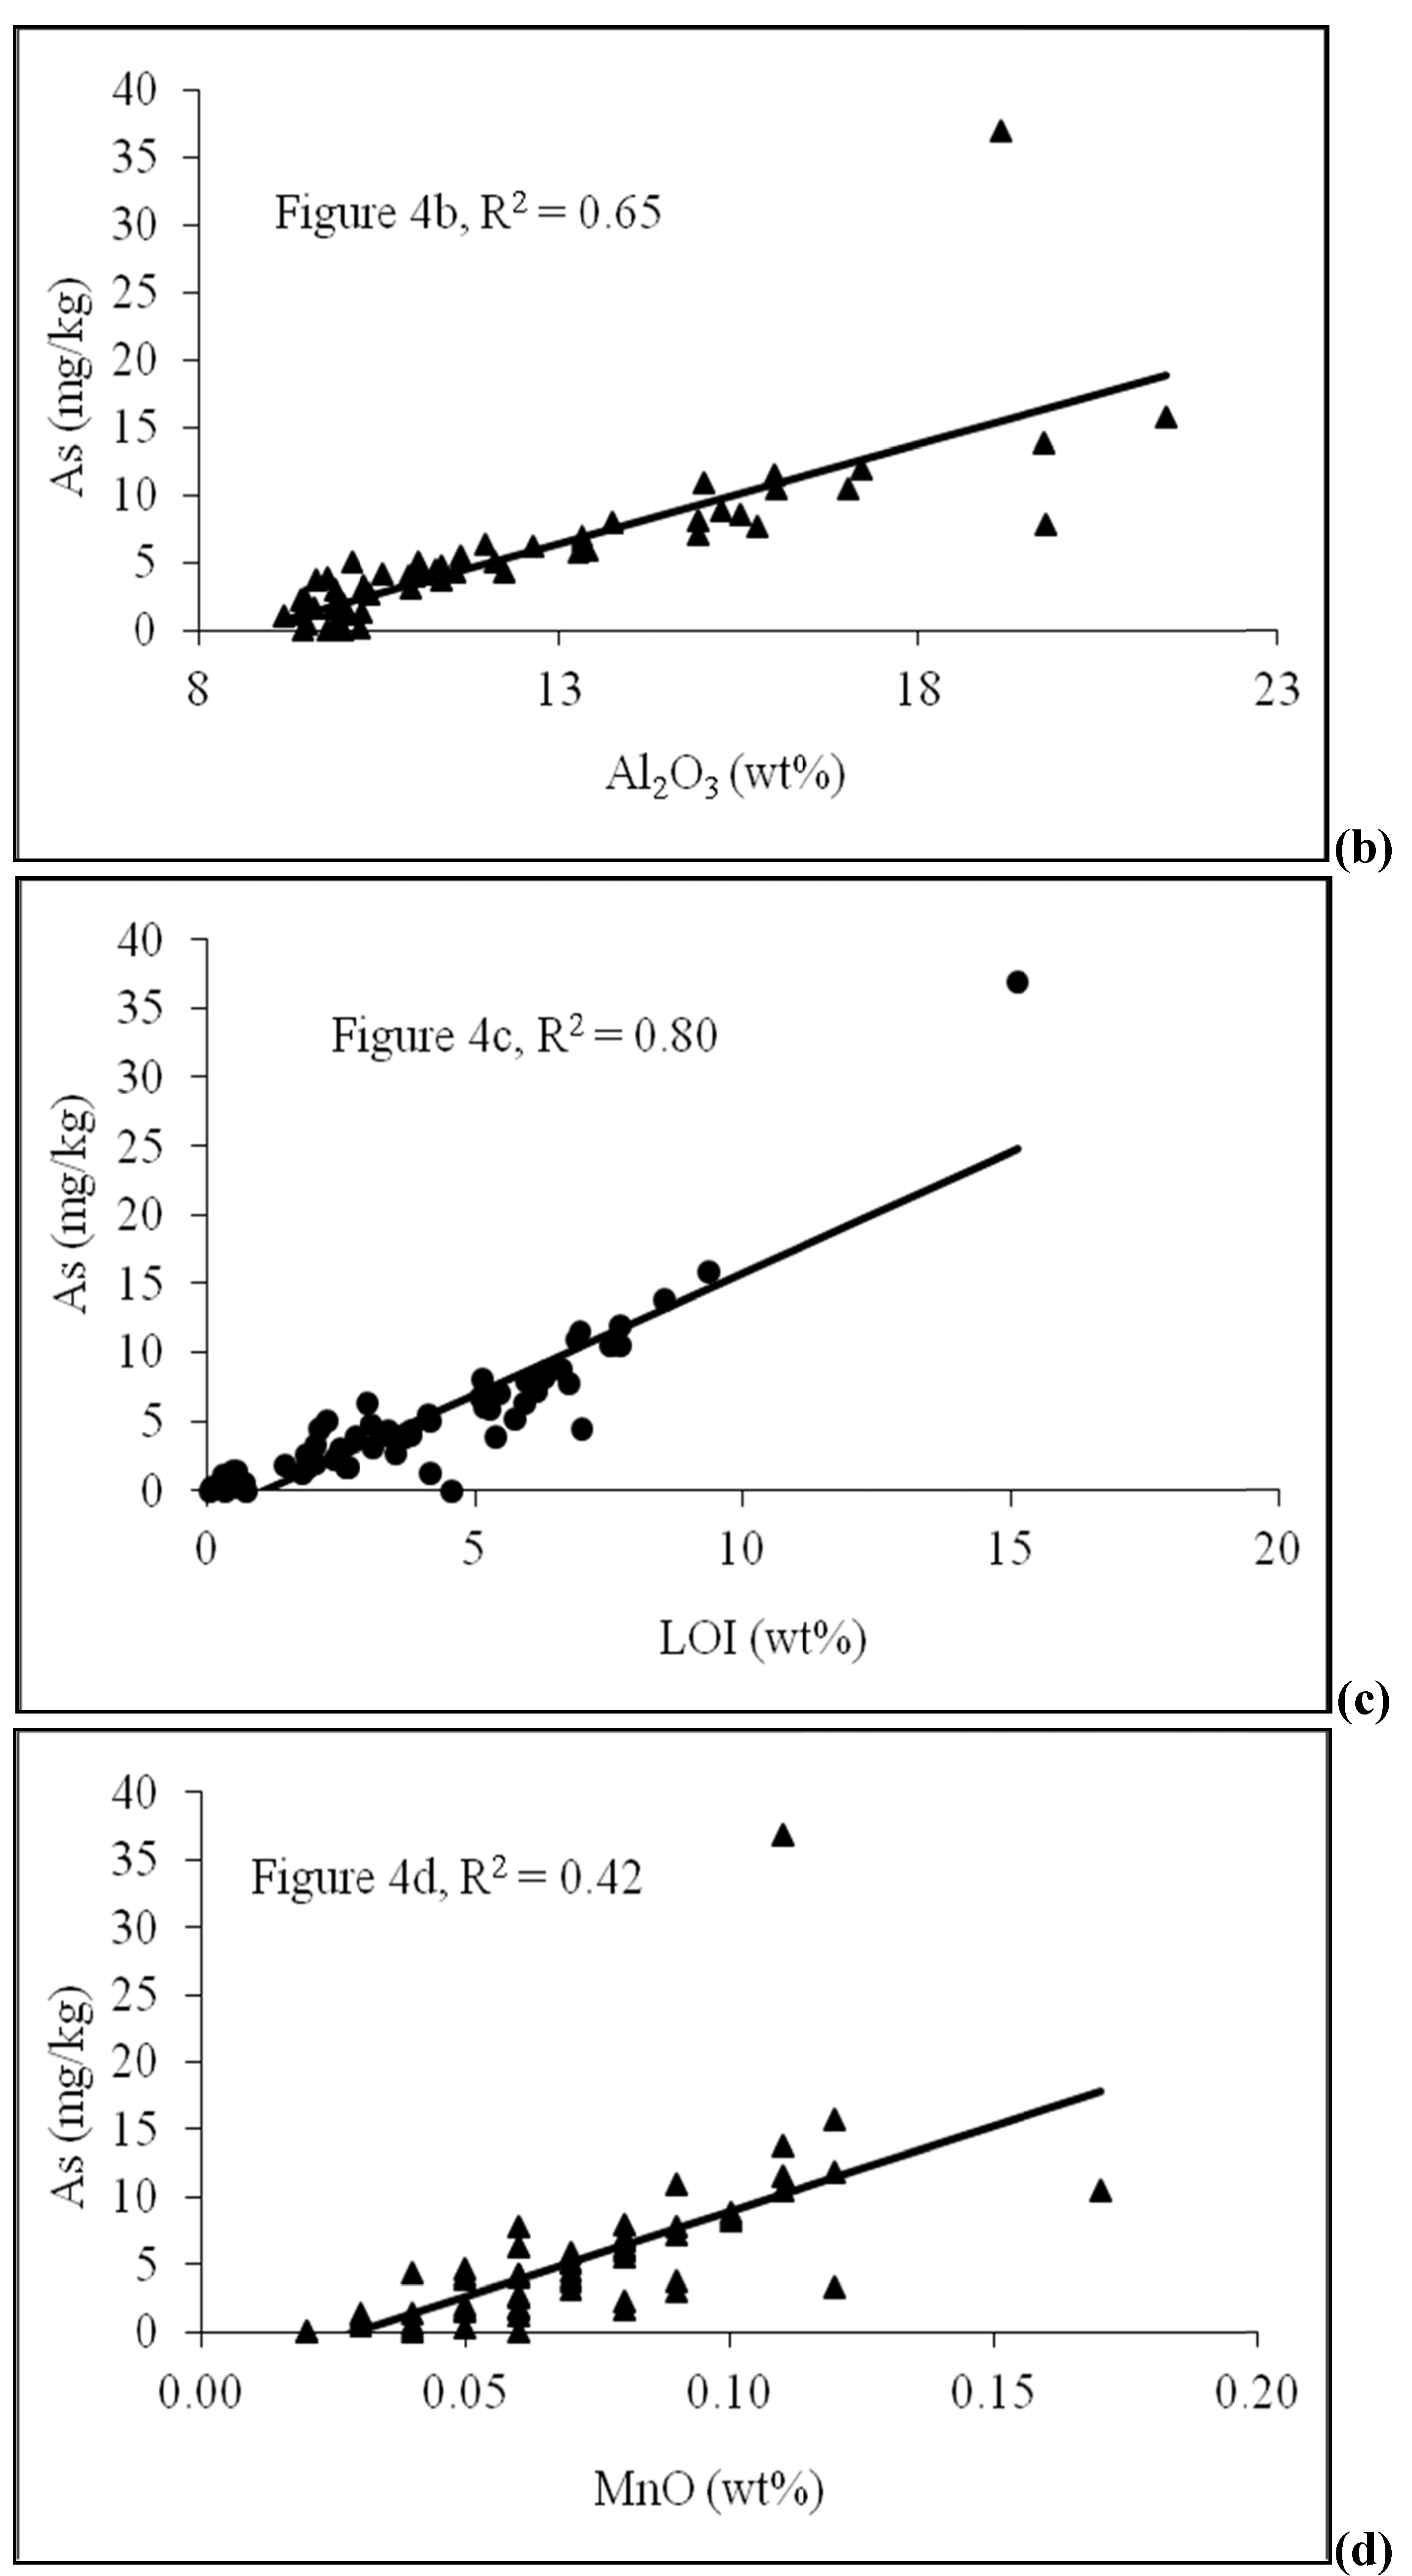
4.2. Sediment Characteristics
| Sample No. | Depth (m) | As (mg/kg) | Fe2O3 | MnO | Al2O3 | TOC | Lithology | pH | Moisture (%) | Grain size<0.125 mm | Grain size 0.125–<2 mm |
|---|---|---|---|---|---|---|---|---|---|---|---|
| (Wt %) | |||||||||||
| D-2 | 4.6 | 5.88 | 5.47 | 0.1 | 15.74 | 1.895 | Silty sand | 6.74 | 3.52 | 100 | 0 |
| D-4 | 7.6 | 5.87 | 6.25 | 0.13 | 13.8 | 3.528 | Silty sand | 6.03 | 4.76 | 88.16 | 11.84 |
| D-5 | 9.1 | 2.48 | 4.42 | 0.09 | 11.95 | 2.29 | Sand | 7.22 | 3.54 | 73.70 | 26.3 |
| D-6 | 10.7 | 3.44 | 4.97 | 0.09 | 13.44 | 5.733 | Silty sand | 6.55 | 4.24 | 94.74 | 5.26 |
| D-8 | 13.7 | 4.61 | 5.35 | 0.11 | 13.73 | 2.641 | Silty sand | 7.22 | 3.53 | 90.9 | 9.1 |
| D-9 | 15.2 | 0.78 | 2.72 | 0.05 | 9.69 | 0.513 | Sand | 7.23 | 3.57 | 45.04 | 54.96 |
| D-10 | 16.8 | 2.35 | 4.34 | 0.1 | 10.48 | 1.638 | Silty sand | 7.58 | 5.72 | 81.08 | 18.92 |
| D-11 | 18.3 | 0.72 | 2.18 | 0.04 | 10.57 | 1.247 | Sand | 7.42 | 4.65 | 60.82 | 39.18 |
| D-12 | 19.8 | 1.86 | 4.39 | 0.08 | 11.59 | 3.583 | Sand | 7.24 | 5.42 | 80.92 | 19.08 |
| D-13 | 21.3 | 1.99 | 3.9 | 0.07 | 11.82 | 1.181 | Sand | 7.37 | 5.62 | 80.66 | 19.34 |
| D-14 | 22.9 | 2.02 | 3.26 | 0.06 | 11.04 | 0.883 | Sand | 7.38 | 4.95 | 64 | 36 |
| D-15 | 25.0 | 3.45 | 4.71 | 0.08 | 12.81 | 2.068 | Silty sand | 7.25 | 5.21 | 80.18 | 19.82 |
| D-16 | 26.5 | 0.74 | 1.92 | 0.03 | 9.28 | 2.342 | Sand | 7.53 | 3.24 | 20.43 | 79.57 |
| D-17 | 28.0 | 2.65 | 3.51 | 0.06 | 11.4 | 6.726 | Sand | 6.90 | 3.70 | 27.03 | 72.97 |
| D-18 | 29.6 | 0.27 | 3.02 | 0.06 | 10.4 | 1.13 | Sand | 6.95 | 3.84 | 56.67 | 43.33 |
| D-19 | 31.1 | 10.74 | 7.24 | 0.13 | 19.22 | 6.37 | Silty sand | 6.90 | 5.26 | 100 | 0 |
| D-20 | 32.6 | 13.26 | 8.94 | 0.16 | 22.13 | 6.72 | Silty sand | 6.96 | 6.27 | 100 | 0 |
| D-21 | 34.1 | 1.30 | 2.53 | 0.05 | 10.37 | 2.742 | Sand | 6.72 | 3.37 | 62.96 | 37.04 |
| D-22 | 35.7 | 9.52 | 7.3 | 0.13 | 20.2 | 7.179 | Clayey silt | 7.12 | 5.65 | 100 | 0 |
| D-23 | 37.2 | 11.05 | 7.45 | 0.134 | 19.77 | 6.535 | Silty sand | 7.15 | 4.65 | 100 | 0 |
| D-24 | 38.7 | 1.22 | 3.27 | 0.07 | 10.03 | 1.162 | Sand | 6.94 | 3.34 | 54.35 | 45.65 |
| D-25 | 40.2 | 3.85 | 3.95 | 0.08 | 11.45 | 2.264 | Fine sand | 7.09 | 3.56 | 68.75 | 31.25 |
| P1 | upto25 | 2.8 | 3.89 | 0.06 | 12.89 | - | Silty mud | - | - | - | - |
| P2 | upto25 | 2.79 | 3.22 | 0.06 | 11.92 | - | Silty mud | - | - | - | - |
| P3 | upto25 | 3.73 | 5.37 | 0.1 | 14.49 | - | Silty mud | - | - | - | - |
| P4 | upto25 | 6.49 | 6.22 | 0.09 | 16.33 | - | Sandy mud | - | - | - | |
| Pad5 | upto25 | 3.93 | 5.46 | 0.1 | 15.11 | - | Sandy mud | - | - | - | |
| Pad6 | upto25 | 3.27 | 4.81 | 0.07 | 14.13 | - | Sandy mud | - | - | - | |
| P7 | upto25 | 5.28 | 5.78 | 0.1 | 16.25 | - | Silty clay | - | - | - | - |
| Pad8 | upto25 | 4.26 | 4.81 | 0.06 | 15.16 | - | Silty clay | - | - | - | - |
| P9 | upto25 | 3.21 | 5.28 | 0.07 | 15.45 | - | Silty clay | - | - | - | - |
| Pad10 | upto25 | 3.92 | 5.62 | 0.07 | 16.38 | - | Silty clay | - | - | - | - |


4.3. Scanning Electron Microscope (SEM)

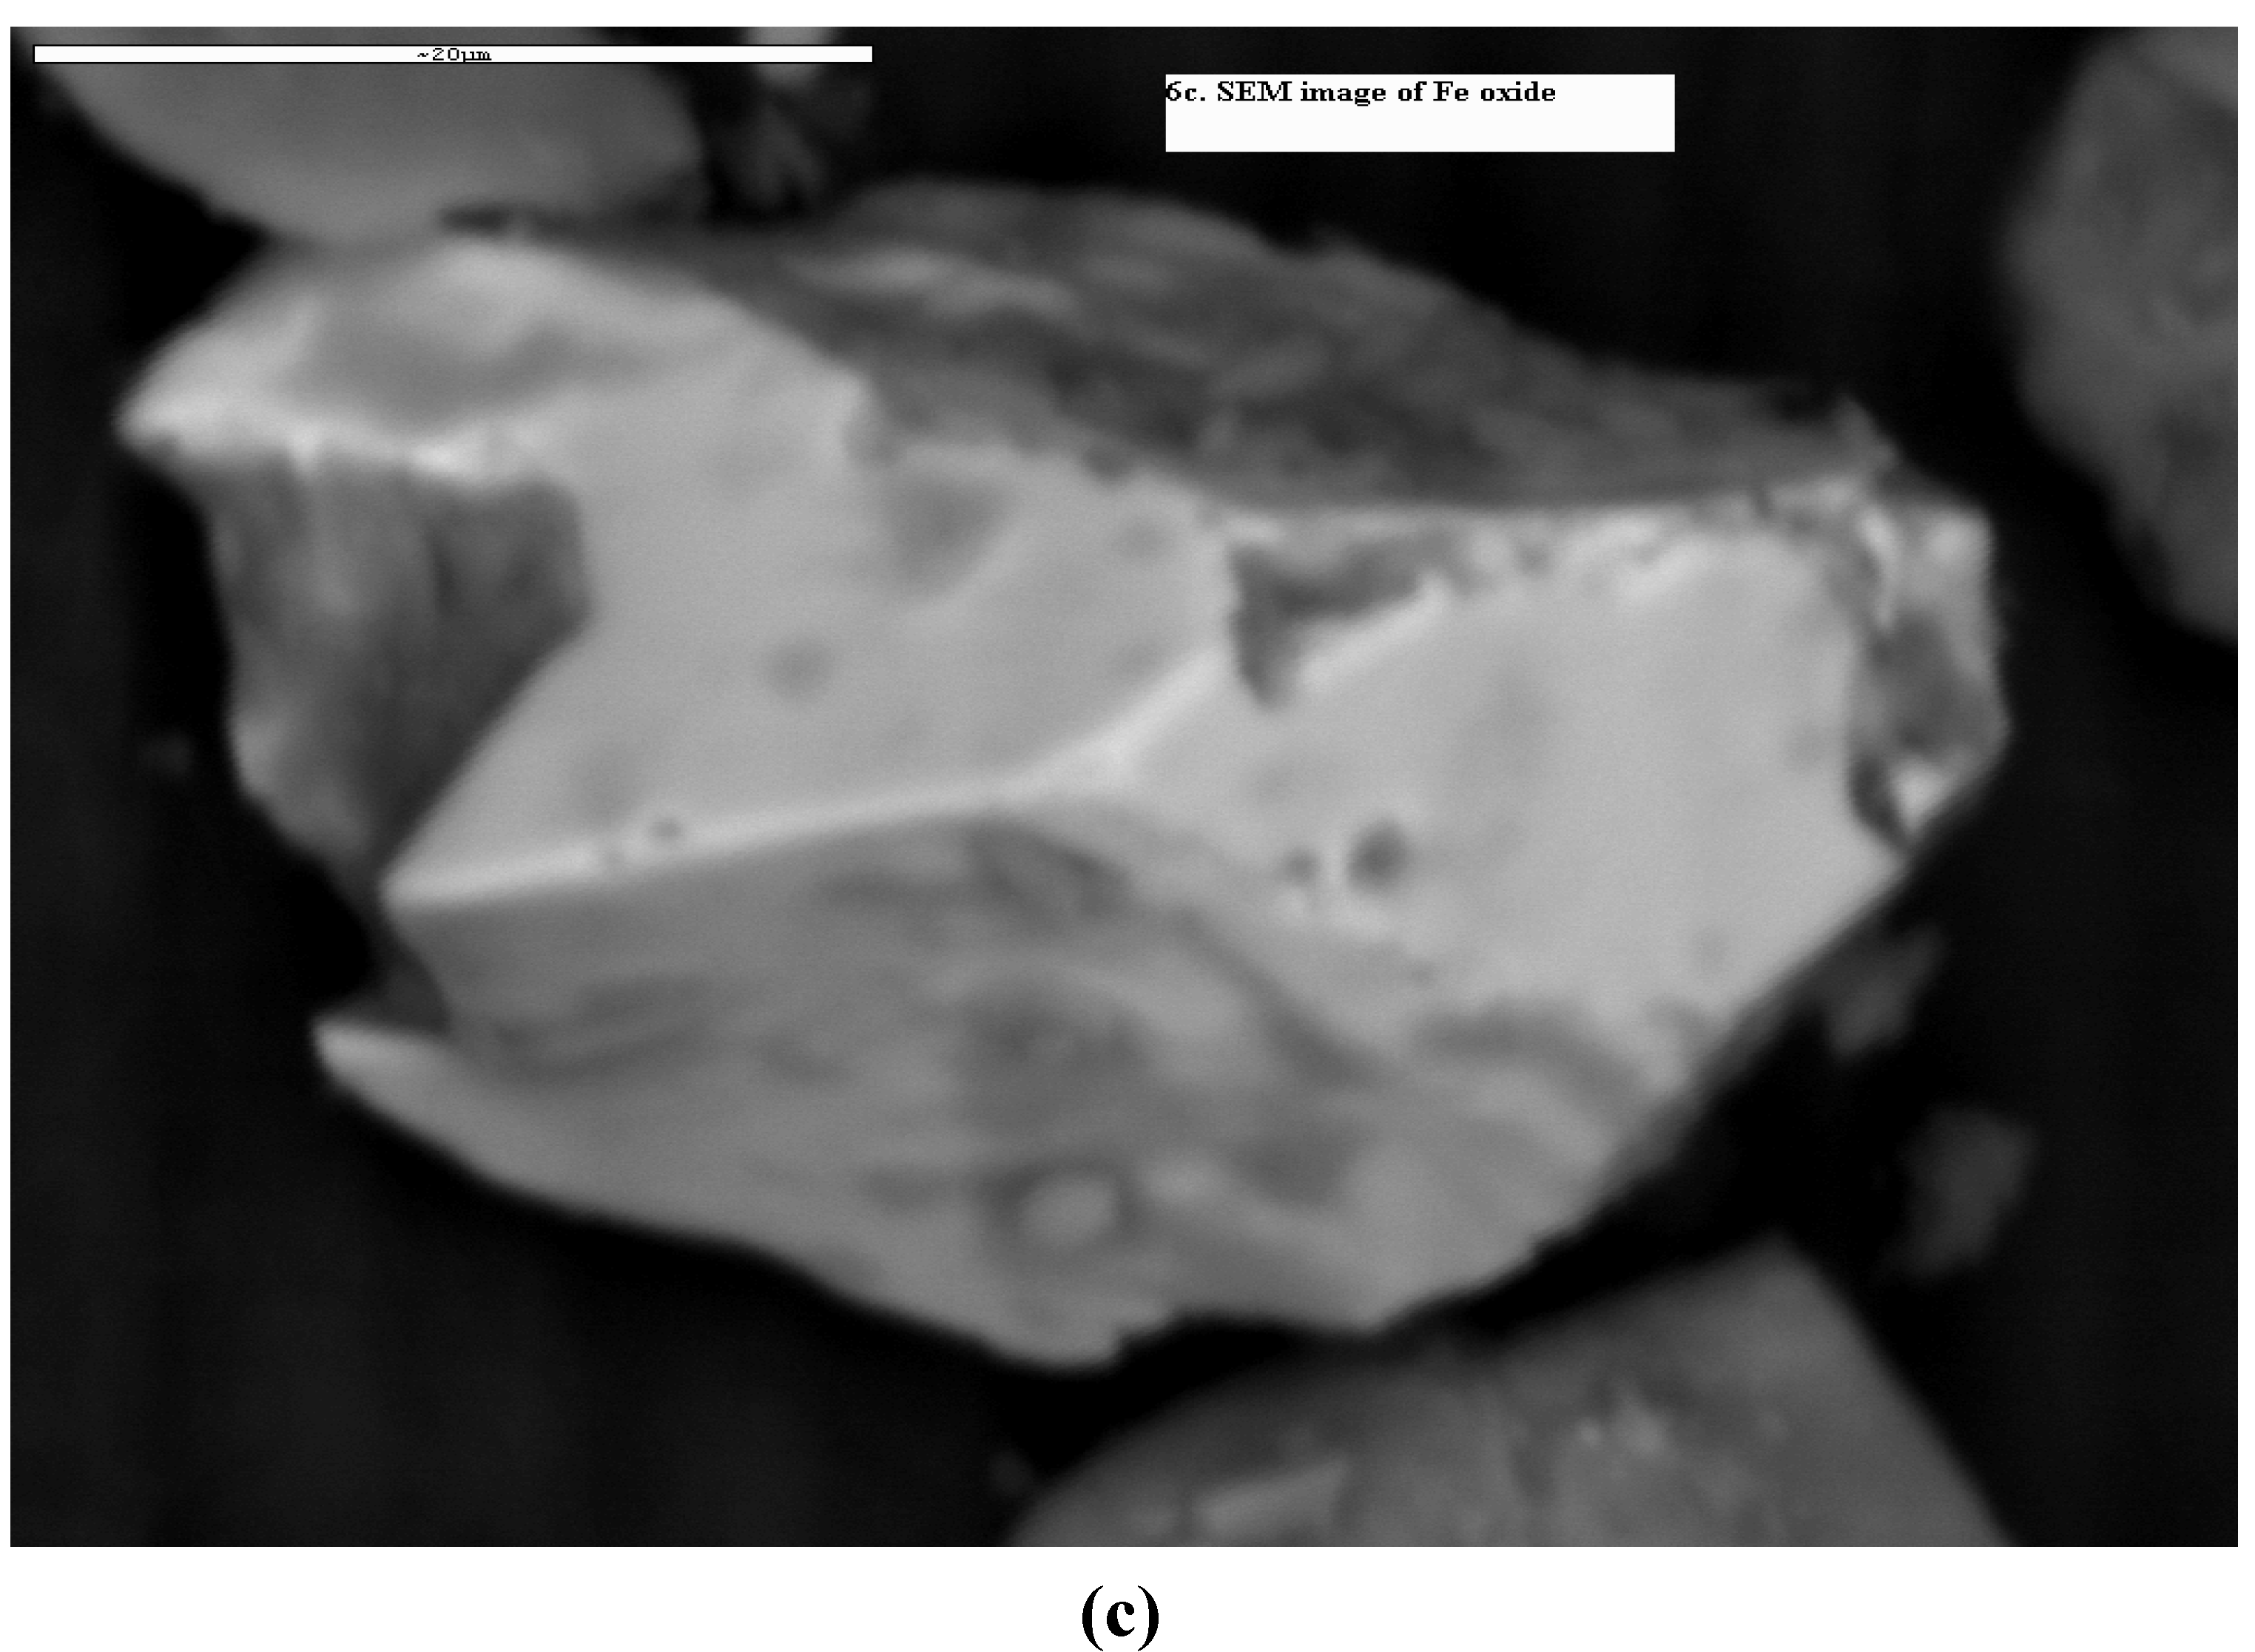
| Major elements | Elemental composition (%) | |||
|---|---|---|---|---|
| Biotite | Muscovite | Altered biotite-1 | Altered biotite-2 | |
| Mg | 3.02 | 0.41 | 6.00 | 4.73 |
| Al | 4.15 | 18.30 | 6.20 | 7.82 |
| Si | 10.70 | 21.24 | 14.29 | 14.20 |
| K | 3.91 | 8.64 | 2.36 | 1.08 |
| Ti | 1.59 | 0.21 | 0.56 | 0.87 |
| Fe | 15.23 | 1.01 | 21.53 | 18.41 |
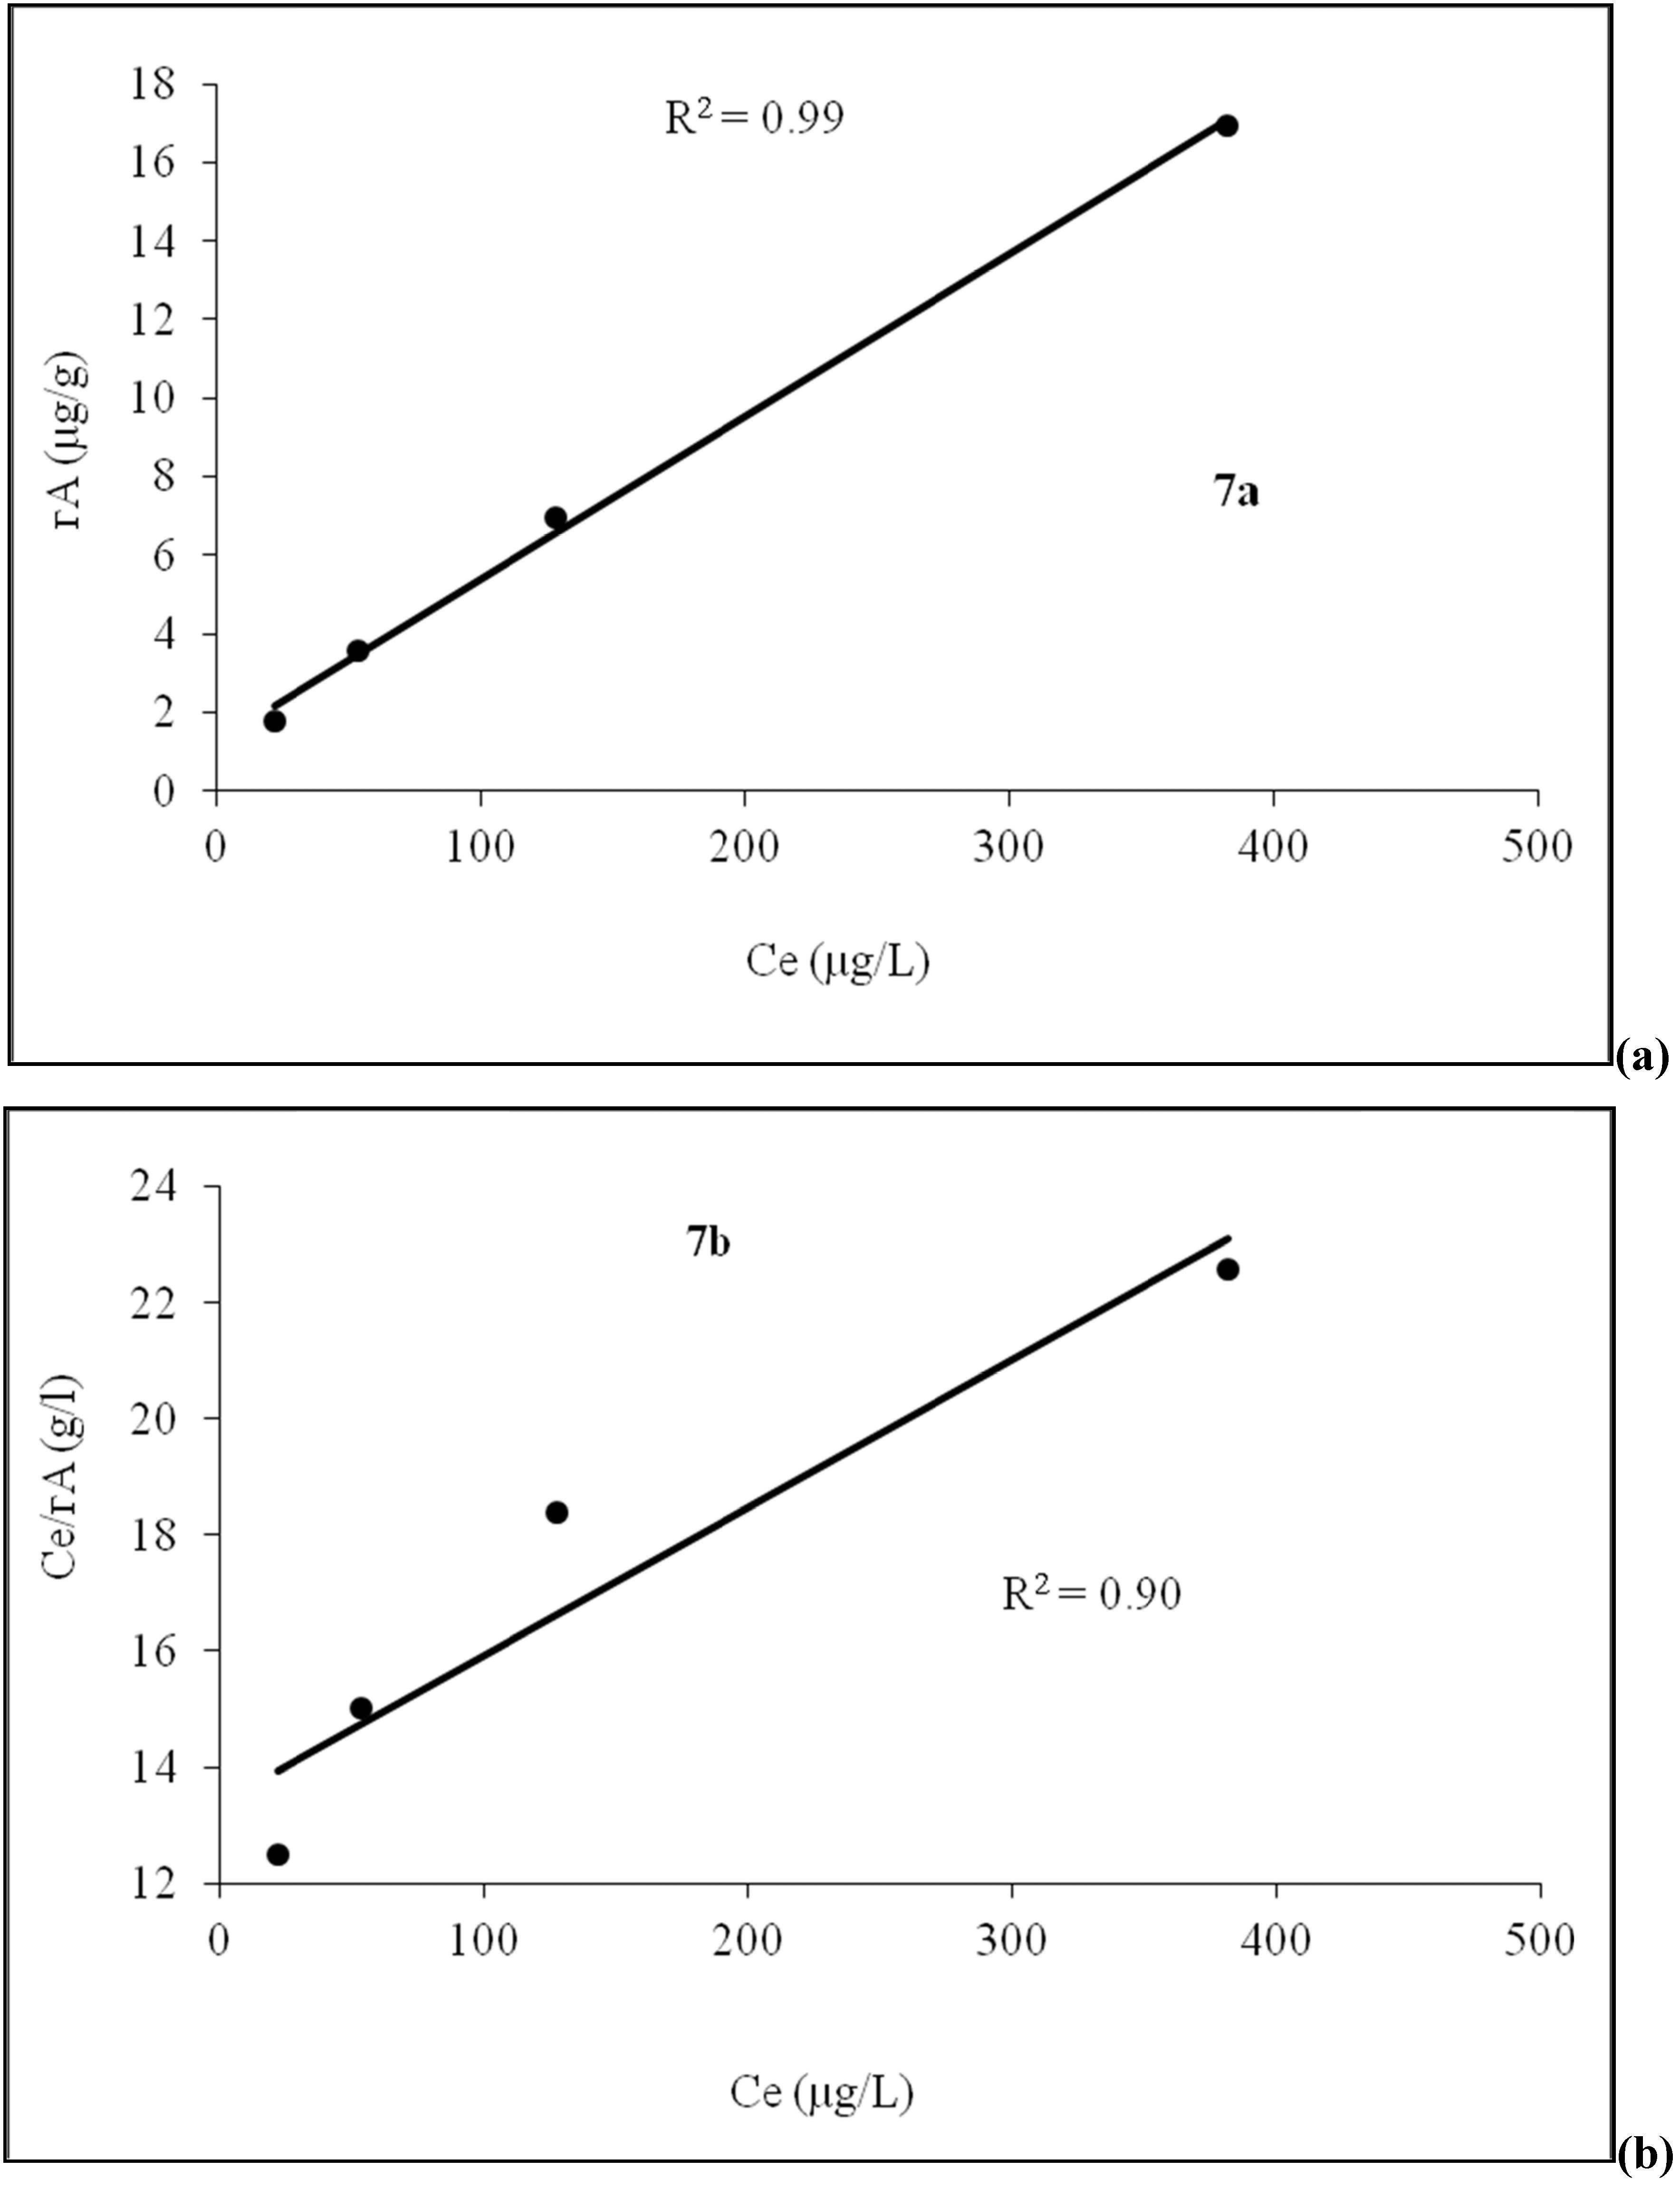
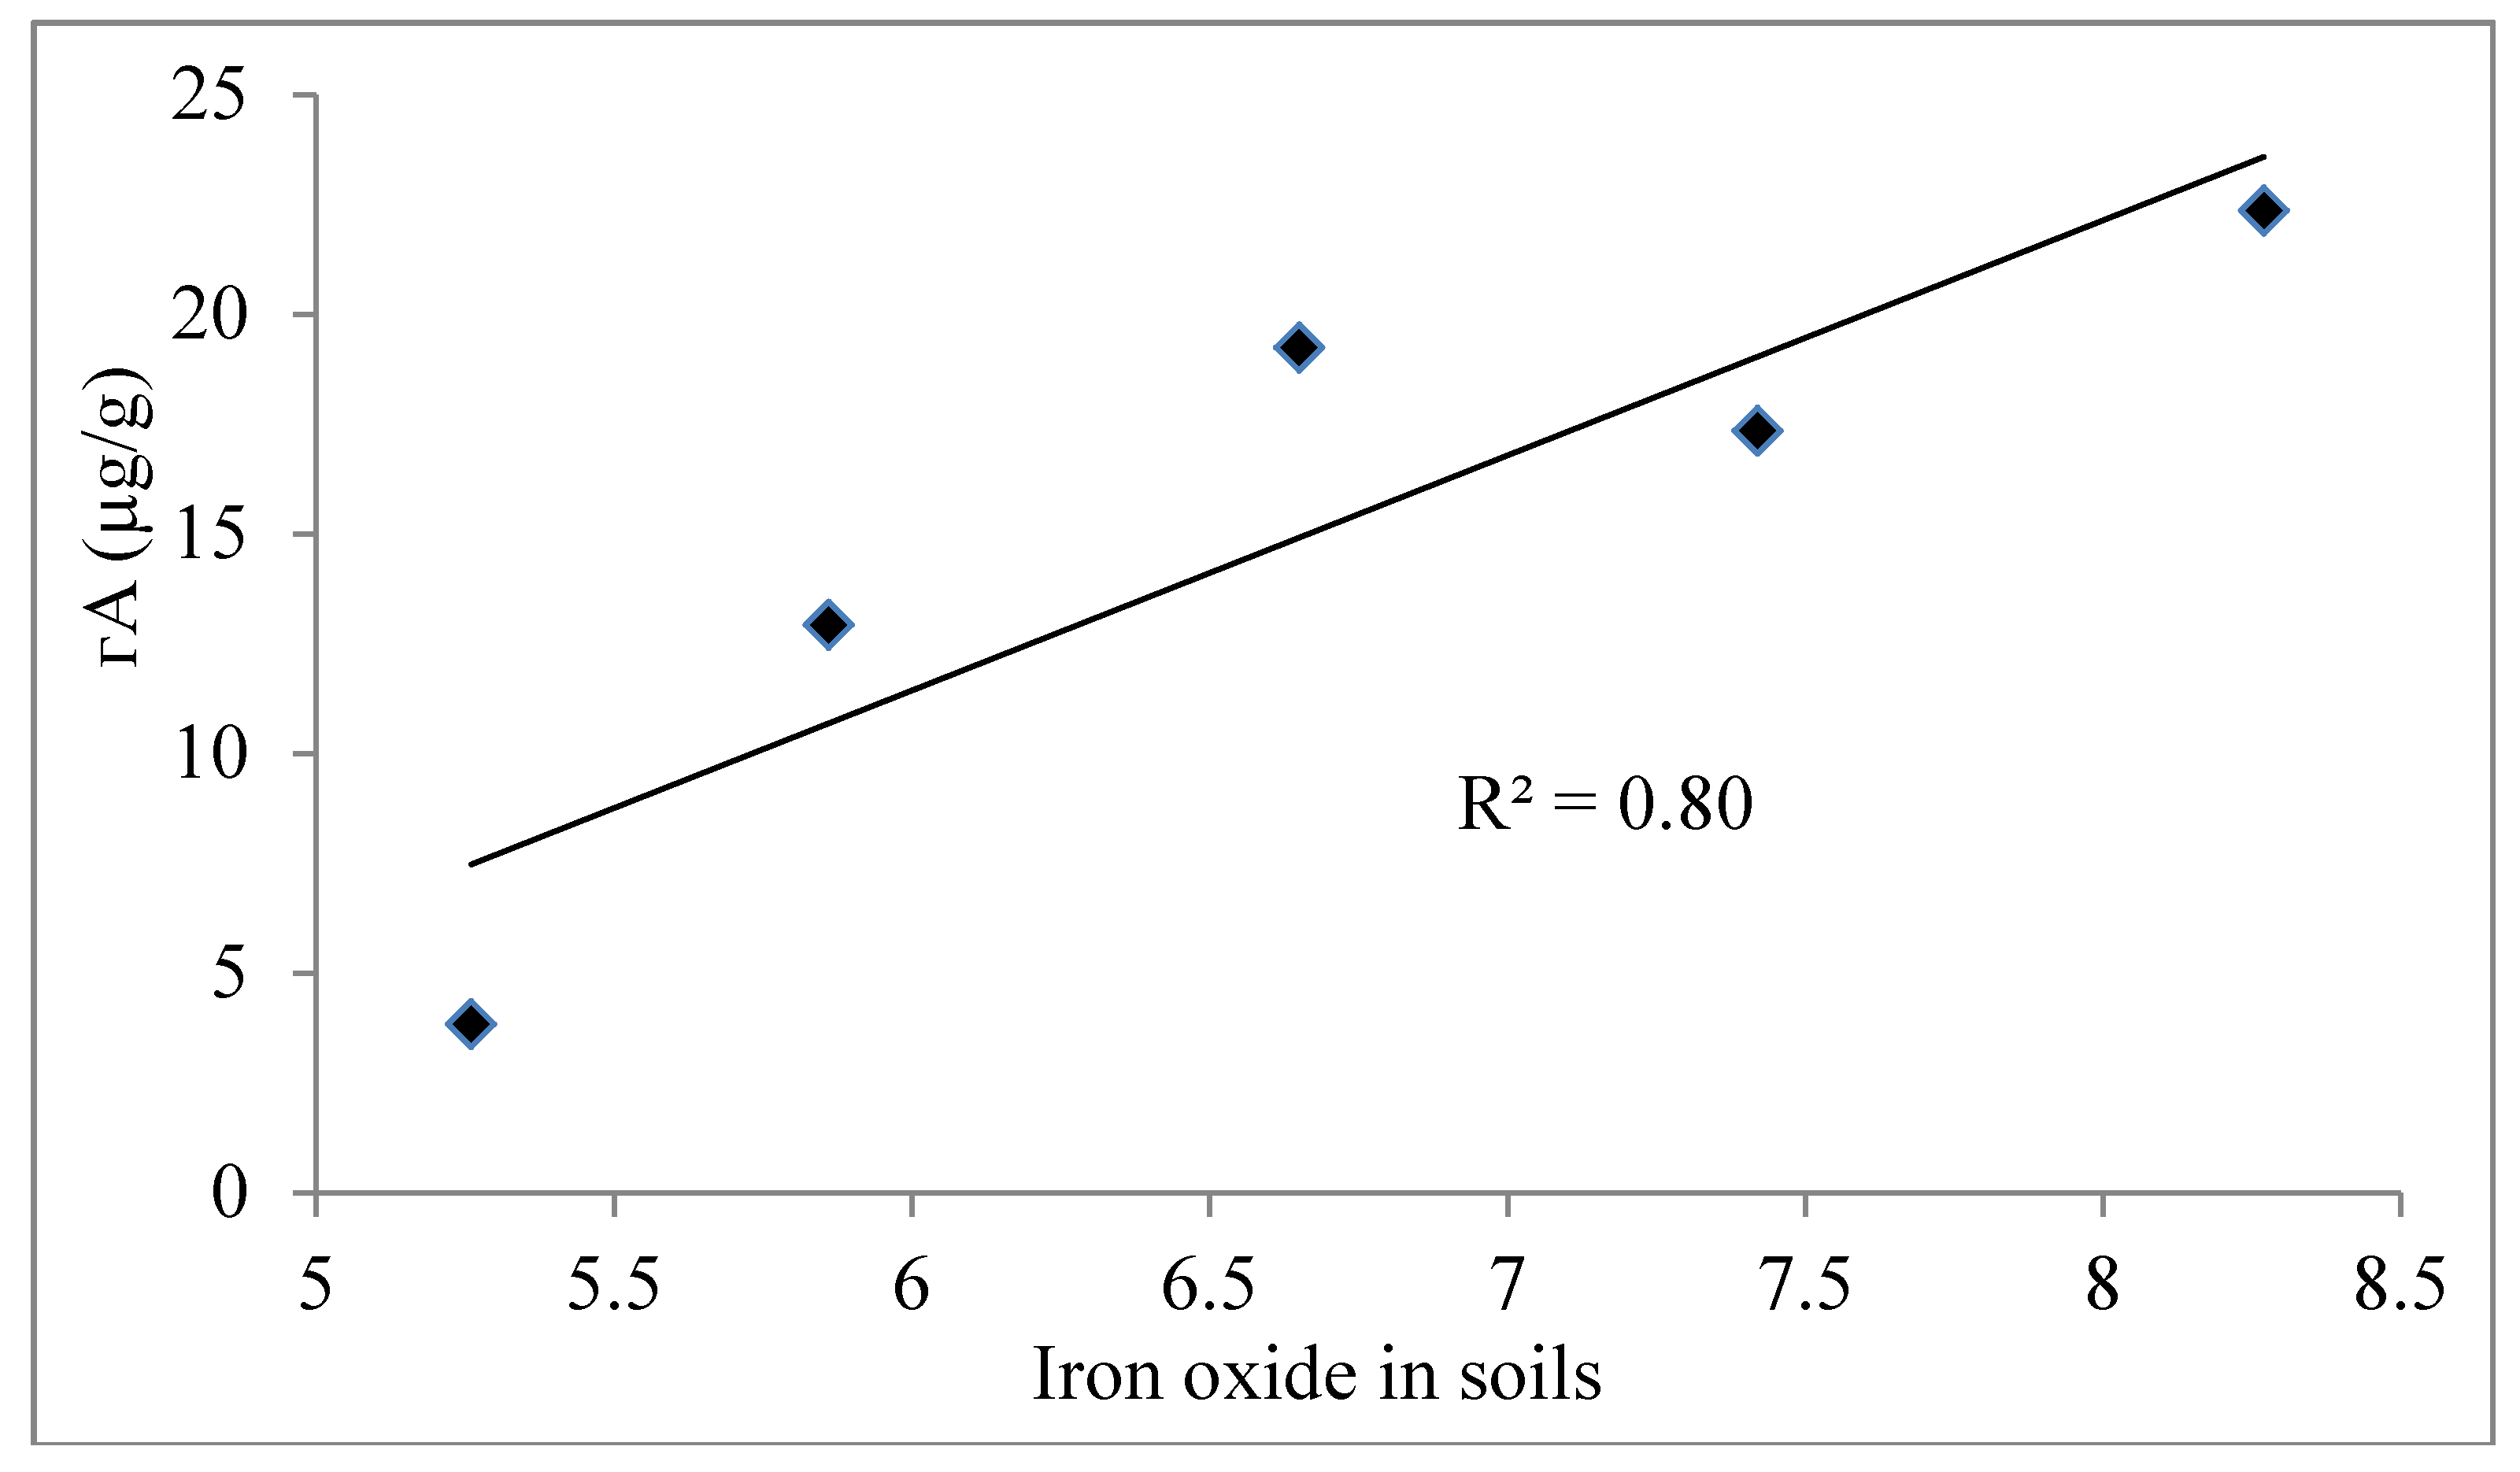
4.4. Adsorption Isotherm
4.5. Role of Agricultural Activity
4.6. Mechanism of Arsenic Mobilization
5. Conclusions
Acknowledgments
References
- Anawar, H.M.; Akai, J.; Khan, M.G.M.; Safiullah, S.; Tareq, S.M. Arsenic poisoning in groundwater: Health risk and geochemical sources in Bangladesh. Environ. Int. 2002, 27, 597–604. [Google Scholar] [CrossRef] [PubMed]
- Chakraborty, A.K.; Saha, K.C. Arsenical dermatosis from tube well water in West Bengal. Indian J. Med. Res. 1987, 85, 326–334. [Google Scholar] [PubMed]
- Chowdhury, U.K.; Biswas, B.K.; Chowdhury, T.R.; Samanta, G.; Mandal, B.K.; Basu, G.C.; Chanda, C.R.; Lodh, D.; Saha, K.C.; Mukherjee, S.K.; et al. Groundwater arsenic contamination in Bangladesh and West Bengal, India. Environ. Health Perspect. 2000, 108, 393–397. [Google Scholar] [CrossRef] [PubMed]
- Harvey, C.F.; Swartz, C.H.; Badruzzaman, A.B.M.; Keon-Blute, N.; Yu, W.; Ali, M.A.; Jay, J.; Beckie, R.; Niedan, V.; Brabander, D.; et al. Arsenic mobility and groundwater extraction in Bangladesh. Science 2002, 298, 1602–1606. [Google Scholar] [CrossRef] [PubMed]
- Nickson, R.; McArthur, J.; Burgess, W.; Ahmed, K.M.; Ravenscorft, P.; Rahman, M. Arsenic poisoning of Bangladesh groundwater. Nature 1998, 395, 338. [Google Scholar] [CrossRef] [PubMed]
- Van Geen, A.; Zheng, Y.; Versteeg, R.; Stute, M.; Horneman, A.; Dhar, R.; Steckler, M.; Gelman, A.; Small, C.; Ahsan, H.; et al. Spatial variability of arsenic in 6000 tube wells in a 25 km2 area of Bangladesh. Water Resou. Res. 2003, 39, 1140. [Google Scholar] [CrossRef]
- Smedley, P.L.; Zhang, M.; Zhang, G.; Luo, Z. Mobilisation of arsenic and other trace elements in fluviolacustrine aquifers of the Huhhot Basin, Inner Mongolia. Appl. Geochem. 2003, 18, 1453–1477. [Google Scholar] [CrossRef]
- Nickson, R.T.; McArthur, J.M.; Shrestha, B.R.; Kyaw-Myint, T.O.; Lowry, D. Arsenic and other drinking water quality issues, Muzaffargarh District, Pakistan. Appl. Geochem. 2005, 20, 55–68. [Google Scholar] [CrossRef]
- Gurung, J.K.; Ishiga, H.; Khadka, M.S.; Shrestha, N.R. The geochemical study of fluvio-lacustrine aquifers in the Kathmandu Basin (Nepal) and the implications for the mobilization of arsenic. Environ. Geol. 2007, 52, 503–517. [Google Scholar] [CrossRef]
- Polya, D.A.; Rowland, H.A.L.; Gault, A.G.; Diebe, N.H.; Jones, J.C.; Cooke, D.A. Geochemistry of arsenic-rich shallow groundwaters in Cambodia. Geochim. Cosmochim. Acta 2004, 68, A590. [Google Scholar]
- Polya, D.A.; Gault, A.G.; Diebe, N.; Feldmann, P.; Rosenboom, J.W.; Gilligan, E.; Fredericks, D.; Milton, A.H.; Sampson, M.; Rowland, H.A.L.; et al. Arsenic hazard in shallow Cambodian groundwaters. Mineral. Mag. 2005, 69, 807–823. [Google Scholar] [CrossRef]
- Berg, M.; Tran, H.C.; Nguyen, T.C.; Pham, H.V.; Schertenleib, R.; Giger, W. Arsenic contamination of groundwater and drinking water in Vietnam: A human health threat. Environ. Sci. Technol. 2001, 35, 2621–2626. [Google Scholar] [CrossRef] [PubMed]
- DPHE (Department of Public Health Engineering). Groundwater Studies for Arsenic Contamination in Bangladesh, Main Report, Rapid Investigation Phase; DPHE, Government of Bangladesh. Mott MacDonald and British Geological Survey, Mott MacDonald Ltd: London, UK, 1999.
- Anawar, H.M.; Akai, J; Komaki, K.; Terao, H.; Yoshioka, T.; Ishizuka, T.; Safiullah, S.; Kato, K. Geochemical occurrence of arsenic in groundwater of Bangladesh: Sources and mobilization processes. J. Geochem. Explor. 2003, 77, 109–131. [Google Scholar] [CrossRef]
- Swartz, C.H.; Blute, N.K.; Badruzzman, B.; Ali, A.; Brabander, D.; Jay, J.; Besancon, J.; Islam, S.; Hemond, H.F.; Harvey, C.F. Mobility of arsenic in a Bangladesh aquifer: Inferences from geochemical profiles leaching data, and mineralogical characterization. Geochim. Cosmochim. Acta 2004, 68, 4539–4557. [Google Scholar] [CrossRef]
- Das, D.; Samanta, C.; Mandal, B.K.; Chowdhury, T.R.; Chandra, C.R.; Chowdhury, P.P.; Basu, G.K.; Chakraborti, D. Arsenic in groundwater in 6 districts of West Bengal, India. Environ. Geochem. Health 1996, 18, 5–15. [Google Scholar] [CrossRef] [PubMed]
- Chakraborti, D.; Basu, G.K.; Biswas, B.K.; Chowdhury, U.K.; Rahman, M.M.; Paul, K.; Chowdhury, T.R.; Chanda, C.R.; Lodh, D.; Ray, S.L. Arsenic: Exposure and Health Effects; Chappell, W.R., Abernathy, C.O., Calderon, R.L., Eds.; Elsevier: New York, NY, USA, 2001; pp. 27–52. [Google Scholar]
- Bhattacharya, P.; Chatterjee, D.; Jacks, G. Occurrence of arsenic contaminated groundwater in alluvial aquifers from delta plains, eastern India: Options for safe drinking water supply. Int. J. Water Resour. Dev. 1997, 13, 79–92. [Google Scholar] [CrossRef]
- Nickson, R.T.; McArthur, J.M.; Ravenscorft, P.; Burgess, W.G.; Ahmed, K.M. Mechanism of arsenic release to groundwater, Bangladesh and West Bengal. Appl. Geochem. 2000, 395, 338–348. [Google Scholar]
- Zheng, Y.; Stute, M.; van Geen, A.; Gavrieli, I.; Dhar, R.; Simpson, H.J.; Schlosser, P.; Ahmed, K.M. Redox control of arsenic mobilization in Bangladesh groundwater. Appl. Geochem. 2004, 19, 201–214. [Google Scholar] [CrossRef]
- Akai, J.; Izumi, K.; Fukuhara, H.; Masuda, H.; Nakano, S.; Yoshimura, T.; Ohfuji, H.; Anawar, H.M.; Akai, K. Mineralogical and geomicrobiological investigations on groundwater arsenic enrichment in Bangladesh. Appl. Geochem. 2004, 19, 215–230. [Google Scholar] [CrossRef]
- Akai, J.; Kanekiyo, A.; Hishida, N.; Ogawa, M.; Naganuma, T.; Fukuhara, H.; Anawar, H.M. Biogeochemical characterization of bacterial assemblages in relation to release of arsenic from South East Asia (Bangladesh) sediments. Appl. Geochem. 2008, 23, 3177–3186. [Google Scholar] [CrossRef]
- Islam, F.S.; Gault, A.G.; Boothman, C.; Polya, D.A.; Charnock, J.M.; Chatterjee, D.; Lloyd, J.R. Role of metal-reducing bacteria in arsenic release from Bengal delta sediments. Nature 2004, 430, 68–71. [Google Scholar] [CrossRef] [PubMed]
- Van Geen, A.; Rose, J.; Thoral, S.; Garnier, J.M.; Zheng, Y.; Bottero, J.Y. Decoupling of As and Fe release to Bangladesh groundwater under reducing conditions. Part II: Evidence from sediment incubations. Geochim. Cosmochim. Acta 2004, 68, 3475–3486. [Google Scholar] [CrossRef]
- Zheng, Y.; van Geen, A.; Stute, M.; Dhar, R.; Mo, Z.; Cheng, Z.; Horneman, A.; Gavrieli, H.; Simpson, J.; Versteeg, R. Geochemical and hydrogeological contrasts between shallow and deeper aquifers in two villages of Araihazar, Bangladesh: Implications for deeper aquifers as drinking water sources. Geochim. Cosmochim. Acta 2005, 69, 5203–5218. [Google Scholar] [CrossRef]
- Sutton, N.B.; van der Kraan, G.M.; van Loosdrecht, M.C.M.; Bruining, G.M.J.; Schotting, R.J. Characterization of geochemical constituents and bacterial populations associated with As mobilization in deep and shallow tube wells in Bangladesh. Water Res. 2009, 43, 1720–1730. [Google Scholar] [CrossRef] [PubMed]
- Acharyya, S.K.; Chakraborty, P.; Lahiri, S.; Raymahashay, B.C.; Guha, S.; Bhowmik, A. Arsenic poisoning in the Ganges Delta. Nature 1999, 401, 545. [Google Scholar] [CrossRef] [PubMed]
- Acharyya, S.K.; Lahiri, S.; Raymahashay, B.C.; Bhowmik, A. Arsenic toxicity of groundwater in parts of the Bengal basin in India and Bangladesh: The role of Quaternary stratigraphy and Holocene sea-level fluctuation. Environ. Geol. 2000, 39, 1127–1137. [Google Scholar] [CrossRef]
- Chowdhury, T.R.; Basu, G.K.; Mandal, B.K.; Biswas, B.K.; Chowdhury, U.K.; Chanda, C.R.; Lodh, D.; Roy, S.L.; Saha, K.C.; Roy, S.; et al. Arsenic poisoning of Bangladesh groundwater. Nature 1999, 401, 545–547. [Google Scholar] [PubMed]
- Anawar, H.M.; Akai, J.; Yoshioka, T.; Konohira, E.; Lee, J.Y.; Fukuhara, H.; Garcia-Sanchez, A. Mobilization of arsenic in groundwater of Bangladesh: Evidence from incubation study. Environ. Geochem. Health 2006, 28, 553–565. [Google Scholar] [CrossRef] [PubMed]
- Brömssen, M.V.; Larsson, S.H.; Bhattacharya, P.; Hasan, M.A.; Ahmed, K.M.; Jakariya, M.; Sikder, M.A.; Sracek, O.; Bivén, A.; Doušová, B.; et al. Geochemical characterisation of shallow aquifer sediments of Matlab Upazila, Southeastern Bangladesh—Implications for targeting low-As aquifers. J. Contamin. Hydrol. 2008, 99, 137–149. [Google Scholar] [CrossRef]
- Polizzotto, M.L.; Harvey, C.F.; Li, G.; Badruzzman, B.; Ali, A.; Newville, M.; Sutton, S.; Fendorf, S. Solid-phases and desorption processes of arsenic within Bangladesh sediments. Chem. Geol. 2006, 228, 97–111. [Google Scholar] [CrossRef]
- Seddique, A.A.; Masuda, H.; Mitamura, M.; Shinoda, K.; Yamanaka, T.; Itai, T.; Maruoka, T.; Uesugi, K.; Ahmed, K.M.; Biswas, D.K. Arsenic release from biotite into a Holocene groundwater aquifer in Bangladesh. Appl. Geochem. 2008, 23, 2236–2248. [Google Scholar] [CrossRef]
- Itai, T.; Masuda, H.; Seddique, A.A.; Mitamura, M.; Maruoka, T.; Li, X.; Kusakabe, M.; Biswas, D.K.; Farooqi, A.; Yamanaka, T.; et al. Hydrological and geochemical constraints on the mechanism of formation of arsenic contaminated groundwater in Sonargaon, Bangladesh. Appl. Geochem. 2008, 23, 3155–3176. [Google Scholar] [CrossRef]
- Mitamura, M.; Masuda, H.; Itai, T.; Minowa, T.; Maruoka, T.; Ahmed, K.M.; Seddique, A.A.; Biswas, D.K.; Nakaya, S.; Uesugi, K.; et al. Geological structure of an arsenic contaminated aquifer at Sonargaon, Bangladesh. J. Geol. 2008, 116, 288–302. [Google Scholar] [CrossRef]
- Kinniburgh, D.G.; Smedley, P.L. Arsenic Contamination of Groundwater in Bangladesh. In DPHP, Govt. of Bangladesh and DFID (UK), British Geological Survey Technical Report WC/00/19, Final Report; BGS: Keyworth, UK, 2001; pp. 105–107. [Google Scholar]
- Umitsu, M. Late quaternary sedimentary environments and landforms in the Ganges delta. Sediment. Geol. 1993, 83, 177–186. [Google Scholar] [CrossRef]
- Saunders, J.A.; Lee, M.-K.; Shamsudduha, M.; Dhakal, P.; Uddin, A.; Chowdury, M.T.; Ahmed, K.M. Geochemistry and mineralogy of arsenic in (natural) anaerobic groundwaters. Appl. Geochem. 2008, 23, 3205–3214. [Google Scholar] [CrossRef]
- Hasan, K. Investigation of Saline Groundwater in Muradnagar Thana. Master thesis, Dhaka University, Dhaka, Bangladesh, 1994. [Google Scholar]
- McArthur, J.M.; Banerjee, D.M.; Hudson-Edwards, K.A.; Mishra, R.; Purohit, R.; Ravenscroft, P.; Cronin, A.; Howarth, R.J.; Chatterjee, A.; Talukder, T.; et al. Natural organic matter in sedimentary basins and its relation to arsenic in anoxic groundwater: The example of West Bengal and its worldwide implications. Appl. Geochem. 2004, 19, 1255–1293. [Google Scholar] [CrossRef]
- Kalbitz, K.; Wennrich, R. Mobilization of heavy metals and arsenic in polluted wetland soils and its dependence on dissolved organic matter. Sci. Total Environ. 1998, 209, 27–39. [Google Scholar] [CrossRef] [PubMed]
- Horneman, A.; van Geen, A.; Kent, D.V.; Mathe, P.E.; Zheng, Y.; Dhar, R.K.; O’Connell, S.; Hoque, M.A.; Aziz, Z.; Shamsudduha, M. Decoupling of As and Fe release to Bangladesh groundwater under reducing conditions. Part I: Evidence from sediment profiles. Geochim. Cosmochim. Acta 2004, 68, 3459–3473. [Google Scholar] [CrossRef]
- Pal, T.; Mukherjee, P.K.; Sengupta, S. Nature of arsenic pollutants in groundwater of Bengal basin—A case study from Baruipur area, West Bengal, India. Curr. Sci. 2002, 82, 554–561. [Google Scholar]
- Tareq, S.M.; Safiullah, S.; Anawar, H.M.; Rahman, M.M.; Ishazuka, T. Arsenic pollution in groundwater: A self-organizing complex geochemical process in the deltaic sedimentary environment, Bangladesh. Sci. Total Environ. 2003, 313, 213–226. [Google Scholar] [CrossRef] [PubMed]
- Ahmed, K.M.; Bhattacharya, P.; Hasan, M.A.; Akhter, S.H.; Alam, S.M.M.; Bhuyian, M.A.H.; Imam, M.B.; Khan, A.A.; Sracek, O. Arsenic enrichment in groundwater of the alluvial aquifers in Bangladesh: An overview. Appl. Geochem. 2004, 19, 181–200. [Google Scholar] [CrossRef]
- Rowland, H.A.L.; Gault, A.G.; Lythgoe, P.; Polya, D.A. Geochemistry of aquifer sediments and arsenic-rich groundwaters from Kendal Province, Cambodia. Appl. Geochem. 2008, 23, 3029–3046. [Google Scholar] [CrossRef]
- Anawar, H.M.; Mihaljevič, M. Comment on “Arsenic release from biotite into a Holocene groundwater aquifer in Bangladesh” by A.A. Seddique, H. Masuda, M. Mitamura, K. Shinoda, T. Yamanaka, T. Itai, T. Maruoka, K. Uesugi, K.M. Ahmed, D.K. Biswas. Appl. Geochem. 2009, 24, 483–485. [Google Scholar] [CrossRef]
- McKinley, J.P.; Zachara, J.M.; Liu, C.X.; Heald, S.C.; Prenitzer, B.I.; Kempshall, B.W. Microscale controls on the fate of contaminant uranium in the vadose zone, Hanford Site, Washington. Geochim. Cosmochim. Acta 2006, 70, 1873–1887. [Google Scholar] [CrossRef]
- McArthur, J.M.; Ravenscroft, P.; Safiullah, S.; Thirlwall, M.F. Arsenic in groundwater: Testing pollution mechanisms for sedimentary aquifers in Bangladesh. Water Resour. Res. 2001, 37, 109–117. [Google Scholar] [CrossRef]
- Shamsudduha, M.; Uddin, A.; Saunders, J.A.; Lee, M.-K. Quaternary stratigraphy, sediment characteristics and geochemistry of arsenic-contaminated alluvial aquifers in the Ganges-Brahmaputra floodplain in central Bangladesh. J. Contamin. Hydrol. 2008, 99, 112–136. [Google Scholar] [CrossRef]
- Rowland, H.A.L.; Polya, D.A.; Lloyd, J.R.; Pancost, R.D. Characterisation of organic matter in a shallow, reducing, arsenicrich aquifer, West Bengal. Org. Geochem. 2006, 37, 1101–1114. [Google Scholar] [CrossRef]
- Harvey, C.F.; Swartz, C.H.; Badruzzaman, A.B.M.; Keon-Blute, N.; Yu, W.; Ali, M.A.; Jay, J.; Beckie, R.; Niedan, V.; Brabander, D.; et al. Groundwater arsenic contamination on the Ganges Delta: Biogeochemistry, hydrology, human perturbations, and human suffering on a large scale. Comptes Rendus 2005, 337, 285–296. [Google Scholar] [CrossRef]
Appendix
| Depth (m) | Lithological facies | As (mg/kg) | pH | Moisture content (wt %) |
|---|---|---|---|---|
| 3.5 | Silty sand, yellowish | 7.99 | 8.27 | 5.16 |
| 5 | silty clay, brownish | 7.76 | 8.53 | 5.42 |
| 6 | clayey silt | 7.15 | 8.15 | 4.35 |
| 7 | Silty sand | 3.13 | 8.16 | 4.84 |
| 8 | Silty sand | 5.05 | 8.28 | 4.68 |
| 9 | Silty sand | 6.01 | 8.13 | 4.62 |
| 9.5 | clay | 10.48 | 8.09 | 5.34 |
| 10 | clayey silt | 8.57 | 8.02 | 3.70 |
| 11–12 | silt, trace sand & clay | 8.21 | 8.26 | 4.96 |
| 13 | very fine sand | 4.16 | 8.47 | 3.29 |
| 14 | Silty sand | 6.26 | 8.13 | 4.26 |
| 15 | Silty sand | 6.74 | 8.23 | 4.75 |
| 16 | Silty sand | 5.81 | 8.34 | 5.26 |
| 17 | Silty sand | 7.00 | 8.04 | 5.78 |
| 18 | very fine sand | 1.72 | 8.34 | 4.09 |
| 19 | clayey silt | 8.81 | 8.26 | 8.67 |
| 20 | clay | 10.48 | 8.26 | 6.59 |
| 21 | very fine sand | 4.03 | 8.48 | 4.26 |
| 22 | very fine sand, trace silt | 4.49 | 8.20 | 3.76 |
| 23 | very fine sand, trace silt | 5.11 | 8.19 | 4.61 |
| 24 | very fine sand | 4.03 | 8.38 | 4.35 |
| 25 | very fine sand, trace silt | 1.25 | 8.37 | 5.06 |
| 26 | very fine sand | 4.27 | 8.45 | 5.18 |
| 27.3 | very fine sand | 3.81 | 8.27 | 3.63 |
| 28 | very fine sand, trace silt | 5.48 | 8.43 | 4.39 |
| 29 | very fine sand, trace silt | 4.21 | 8.45 | 4.58 |
| 30 | clay | 11.89 | 8.12 | 6.36 |
| 31 | clayey silt | 11.47 | 8.19 | 5.67 |
| 32 | clayey silt | 10.89 | 8.24 | 3.75 |
| 33 | Sand, | 4.71 | 8.49 | 4.73 |
| 34 | Sand | 3.91 | 8.64 | 4.07 |
| 35 | Sand, brownish | 6.35 | 8.43 | 3.68 |
| 36 | Sand, yellowish | 5.03 | 8.35 | 3.97 |
| 37 | Fine to medium sand | 3.33 | 8.31 | 4.72 |
| 38 | Fine to medium sand | 1.63 | 8.49 | 5.27 |
| 39 | Fine to medium sand | 3.04 | 8.57 | 4.33 |
| 40 | Fine to medium sand | 2.49 | 8.62 | 5.47 |
| 41 | Fine to medium sand | 2.27 | 8.56 | 4.72 |
| 42 | Fine to medium sand | 1.29 | 8.54 | 4.61 |
| 43 | clay | 15.78 | 7.78 | 5.12 |
| 43.2 | clay | 13.85 | 7.84 | 4.25 |
| 44 | Fine to medium sand | 1.67 | 8.46 | 4.24 |
| 44.5 | clay | 36.87 | 7.58 | 4.37 |
| 45 | clay | 7.86 | 7.68 | 5.19 |
| 46 | Fine to medium sand | 1.96 | 8.59 | 5.12 |
| 47 | Sand | 3.79 | 8.45 | 3.24 |
| 48 | very fine sand | 2.66 | 8.19 | 4.22 |
| 49 | Fine to medium sand | 1.85 | 8.62 | 5.27 |
| 50 | Medium sand | 0.29 | 8.36 | 5.35 |
| 51 | Fine to medium sand | 1.34 | 8.28 | 4.93 |
| 52 | Fine to medium sand | bdl | 8.74 | 4.18 |
| 53 | Fine to medium sand | 0.57 | 8.46 | 4.38 |
| 54 | Fine to medium sand | 1.45 | 8.32 | 5.73 |
| 55 | Fine to medium sand | bdl | 8.21 | 4.36 |
| 56 | Fine to medium sand | bdl | 8.28 | 5.14 |
| 57 | Fine to medium sand | bdl | 8.26 | 4.72 |
| 58 | Fine to medium sand | 0.29 | 8.14 | 4.61 |
| 59 | Fine to medium sand | 0.44 | 8.23 | 5.12 |
| 60 | Fine to medium sand | 4.36 | 7.76 | 4.25 |
| 61 | Fine to medium sand | 1.09 | 8.52 | 4.72 |
| Depth (m) | SiO2 | TiO2 | Al2O3 | FeO | MnO | MgO | CaO | Na2O | K2O | P2O5 | LOI | Total | As (mg/kg) |
|---|---|---|---|---|---|---|---|---|---|---|---|---|---|
| (%) | |||||||||||||
| 3.5 | 67.75 | 0.70 | 11.82 | 4.28 | 0.07 | 2.27 | 3.49 | 1.12 | 2.60 | 0.12 | 5.54 | 99.76 | 7.99 |
| 5 | 63.17 | 0.77 | 13.47 | 5.09 | 0.08 | 2.65 | 3.96 | 0.98 | 2.88 | 0.12 | 7.14 | 100.3 | 7.76 |
| 6 | 64.80 | 0.74 | 12.91 | 4.63 | 0.08 | 2.51 | 3.73 | 1.07 | 2.84 | 0.11 | 6.53 | 99.95 | 7.15 |
| 7 | 74.33 | 0.55 | 9.83 | 2.99 | 0.06 | 1.44 | 3.00 | 1.25 | 2.29 | 0.24 | 3.50 | 99.48 | 3.13 |
| 8 | 71.06 | 0.62 | 10.52 | 3.65 | 0.07 | 1.82 | 3.16 | 1.18 | 2.33 | 0.14 | 4.57 | 99.12 | 5.05 |
| 9 | 67.8 | 0.68 | 11.73 | 4.19 | 0.07 | 2.12 | 3.50 | 1.13 | 2.52 | 0.12 | 5.59 | 99.48 | 6.01 |
| 9.5 | 59.6 | 0.79 | 14.81 | 6.64 | 0.15 | 2.49 | 3.16 | 0.84 | 2.96 | 0.15 | 8.13 | 99.74 | 10.48 |
| 10 | 63 | 0.76 | 13.44 | 4.98 | 0.09 | 2.51 | 3.65 | 1.05 | 2.89 | 0.12 | 6.73 | 99.21 | 8.57 |
| 12 | 63.6 | 0.74 | 12.96 | 4.77 | 0.09 | 2.47 | 4.04 | 1.03 | 2.80 | 0.12 | 6.67 | 99.30 | 8.21 |
| 13 | 75.2 | 0.53 | 9.35 | 2.81 | 0.05 | 1.42 | 2.90 | 1.25 | 2.15 | 0.17 | 3.67 | 99.53 | 4.16 |
| 14 | 68.9 | 0.65 | 10.85 | 3.72 | 0.07 | 1.91 | 3.50 | 1.14 | 2.38 | 0.17 | 6.31 | 99.62 | 6.26 |
| 15 | 67.2 | 0.65 | 11.40 | 4.11 | 0.07 | 2.10 | 3.47 | 1.14 | 2.54 | 0.12 | 5.50 | 98.29 | 6.74 |
| 16 | 66.7 | 0.71 | 12.76 | 4.44 | 0.07 | 2.41 | 3.71 | 1.30 | 2.79 | 0.12 | 5.67 | 100.63 | 5.81 |
| 17 | 67.6 | 0.69 | 11.79 | 4.30 | 0.07 | 2.17 | 3.41 | 1.15 | 2.58 | 0.13 | 5.87 | 99.74 | 7 |
| 18 | 77.1 | 0.48 | 8.78 | 2.35 | 0.05 | 1.26 | 3.02 | 1.34 | 1.97 | 0.13 | 3.02 | 99.45 | 1.72 |
| 19 | 63.5 | 0.75 | 13.26 | 4.83 | 0.09 | 2.47 | 3.93 | 1.01 | 2.87 | 0.12 | 7.00 | 99.79 | 8.81 |
| 20 | 62.3 | 0.77 | 13.80 | 5.16 | 0.10 | 2.57 | 4.10 | 0.97 | 2.96 | 0.13 | 7.93 | 100.79 | 10.48 |
| 21 | 74.3 | 0.57 | 9.82 | 3.21 | 0.06 | 1.58 | 2.82 | 1.22 | 2.28 | 0.17 | 3.75 | 99.81 | 4.03 |
| 22 | 73.9 | 0.63 | 10.24 | 3.30 | 0.07 | 1.59 | 3.16 | 1.28 | 2.34 | 0.31 | 2.50 | 99.36 | 4.49 |
| 23 | 71.8 | 0.61 | 9.54 | 3.03 | 0.06 | 1.51 | 3.24 | 1.26 | 2.14 | 0.21 | 6.14 | 99.56 | 5.11 |
| 24 | 73.1 | 0.63 | 9.92 | 3.29 | 0.06 | 1.60 | 3.00 | 1.26 | 2.25 | 0.19 | 4.20 | 99.46 | 4.03 |
| 25 | 75 | 0.55 | 9.00 | 2.73 | 0.06 | 1.38 | 3.06 | 1.24 | 2.01 | 0.16 | 4.57 | 99.74 | 1.25 |
| 26 | 73.2 | 0.56 | 10.37 | 3.57 | 0.06 | 1.68 | 2.58 | 1.24 | 2.49 | 0.16 | 3.77 | 99.67 | 4.27 |
| 27.3 | 70.3 | 0.58 | 10.18 | 3.85 | 0.06 | 1.78 | 2.96 | 1.24 | 2.41 | 0.16 | 5.78 | 99.28 | 3.81 |
| 28 | 71.3 | 0.62 | 10.31 | 3.53 | 0.07 | 1.72 | 3.28 | 1.22 | 2.38 | 0.17 | 4.53 | 99.10 | 5.48 |
| 29 | 73.2 | 0.59 | 9.78 | 3.21 | 0.06 | 1.59 | 3.08 | 1.24 | 2.23 | 0.18 | 4.22 | 99.37 | 4.21 |
| 30 | 59.4 | 0.83 | 14.97 | 5.62 | 0.11 | 2.75 | 3.83 | 0.85 | 3.08 | 0.13 | 8.12 | 99.71 | 11.89 |
| 31 | 61.5 | 0.80 | 14.00 | 5.23 | 0.10 | 2.63 | 3.94 | 0.92 | 2.98 | 0.13 | 7.37 | 99.64 | 11.47 |
| 32 | 63.2 | 0.76 | 13.11 | 4.75 | 0.08 | 2.49 | 3.82 | 1.06 | 2.80 | 0.12 | 7.31 | 99.48 | 10.89 |
| 33 | 73.6 | 0.47 | 10.33 | 3.38 | 0.05 | 1.68 | 2.60 | 1.30 | 2.50 | 0.09 | 3.45 | 99.43 | 4.71 |
| 34 | 77 | 0.40 | 8.84 | 2.43 | 0.05 | 1.25 | 2.79 | 1.29 | 2.07 | 0.15 | 3.16 | 99.4 | 3.91 |
| 35 | 71.9 | 0.52 | 11.00 | 4.13 | 0.06 | 1.95 | 2.14 | 1.25 | 2.71 | 0.09 | 3.39 | 99.1 | 6.35 |
| 36 | 76.5 | 0.54 | 9.33 | 2.98 | 0.07 | 1.35 | 2.57 | 1.25 | 2.06 | 0.16 | 2.63 | 99.5 | 5.03 |
| 37 | 77.1 | 0.45 | 9.44 | 3.22 | 0.11 | 1.16 | 2.63 | 1.28 | 1.94 | 0.13 | 2.42 | 99.86 | 3.33 |
| 38 | 78.8 | 0.36 | 9.13 | 2.18 | 0.06 | 0.97 | 2.30 | 1.38 | 2.11 | 0.13 | 2.30 | 99.70 | 1.63 |
| 39 | 77.4 | 0.40 | 8.98 | 2.58 | 0.08 | 1.01 | 2.64 | 1.30 | 1.93 | 0.14 | 2.89 | 99.38 | 3.04 |
| 40 | 81.1 | 0.29 | 8.86 | 2.01 | 0.06 | 0.82 | 2.12 | 1.43 | 2.03 | 0.09 | 2.26 | 101.0 | 2.49 |
| 41 | 78.9 | 0.30 | 8.63 | 1.99 | 0.07 | 0.84 | 2.64 | 1.36 | 2.00 | 0.11 | 2.79 | 99.67 | 2.27 |
| 42 | 82.5 | 0.22 | 9.06 | 1.45 | 0.04 | 0.64 | 1.66 | 1.57 | 2.32 | 0.06 | 2.16 | 101.67 | 1.29 |
| 43 | 54.1 | 0.89 | 18.66 | 7.37 | 0.10 | 3.00 | 1.91 | 0.55 | 3.39 | 0.14 | 9.76 | 99.9 | 15.78 |
| 43.2 | 56.8 | 0.86 | 17.13 | 6.59 | 0.10 | 2.88 | 2.38 | 0.69 | 3.36 | 0.12 | 8.93 | 99.81 | 13.85 |
| 44 | 78.5 | 0.25 | 9.05 | 1.92 | 0.08 | 0.74 | 2.72 | 1.42 | 2.20 | 0.09 | 3.00 | 99.94 | 1.67 |
| 44.5 | 46.5 | 0.55 | 15.24 | 5.80 | 0.09 | 2.50 | 9.09 | 0.60 | 3.25 | 0.11 | 15.54 | 99.26 | 36.87 |
| 45 | 60.1 | 0.78 | 17.69 | 5.88 | 0.05 | 2.53 | 1.04 | 0.82 | 3.73 | 0.10 | 6.36 | 99.04 | 7.86 |
| 46 | 78.3 | 0.32 | 9.20 | 2.02 | 0.04 | 1.03 | 2.16 | 1.49 | 2.18 | 0.09 | 2.42 | 99.28 | 1.96 |
| 47 | 75.3 | 0.45 | 8.70 | 2.67 | 0.09 | 1.34 | 3.44 | 1.26 | 1.86 | 0.18 | 4.12 | 99.4 | 3.79 |
| 48 | 74.8 | 0.46 | 9.38 | 2.82 | 0.06 | 1.45 | 2.79 | 1.25 | 2.18 | 0.16 | 3.94 | 99.29 | 2.66 |
| 49 | 79.4 | 0.32 | 9.27 | 2.38 | 0.06 | 0.94 | 2.15 | 1.49 | 2.00 | 0.06 | 1.85 | 100 | 1.85 |
| 50 | 81.6 | 0.28 | 9.17 | 1.79 | 0.04 | 0.63 | 1.57 | 1.63 | 2.17 | 0.05 | 0.51 | 99.4 | 0.29 |
| 51 | 81.9 | 0.23 | 9.75 | 1.63 | 0.03 | 0.67 | 1.42 | 1.67 | 2.52 | 0.06 | 0.96 | 101 | 1.34 |
| 52 | 80.4 | 0.28 | 9.31 | 1.79 | 0.04 | 0.78 | 1.95 | 1.63 | 2.18 | 0.07 | 1.14 | 99.6 | 0 |
| 53 | 80.4 | 0.25 | 9.15 | 1.63 | 0.04 | 0.71 | 1.86 | 1.67 | 2.11 | 0.05 | 1.09 | 99.0 | 0.57 |
| 54 | 80.7 | 0.26 | 9.15 | 1.82 | 0.05 | 0.71 | 1.77 | 1.60 | 2.03 | 0.05 | 0.89 | 99.1 | 1.45 |
| 55 | 81.6 | 0.19 | 9.32 | 1.34 | 0.02 | 0.48 | 1.22 | 1.72 | 2.36 | 0.04 | 0.76 | 99.02 | 0 |
| 56 | 81.5 | 0.18 | 8.68 | 1.19 | 0.02 | 0.40 | 1.11 | 1.56 | 2.25 | 0.04 | 4.98 | 101.9 | 0 |
| 57 | 81.5 | 0.35 | 8.99 | 2.13 | 0.05 | 0.59 | 1.59 | 1.54 | 2.05 | 0.04 | 0.45 | 99.32 | 0 |
| 58 | 80.2 | 0.35 | 9.58 | 2.09 | 0.05 | 0.64 | 1.55 | 1.61 | 2.21 | 0.05 | 0.91 | 99.3 | 0.29 |
| 59 | 83.6 | 0.25 | 9.40 | 1.61 | 0.03 | 0.54 | 1.29 | 1.55 | 2.21 | 0.04 | 0.87 | 101.4 | 0.44 |
| 60 | 73.3 | 0.47 | 10.42 | 2.70 | 0.03 | 0.70 | 1.01 | 0.98 | 2.08 | 0.06 | 7.41 | 99.17 | 4.36 |
| 61 | 83.5 | 0.21 | 8.79 | 1.39 | 0.03 | 0.45 | 1.25 | 1.49 | 2.15 | 0.04 | 0.71 | 100.1 | 1.09 |
© 2011 by the authors; licensee MDPI, Basel, Switzerland. This article is an open access article distributed under the terms and conditions of the Creative Commons Attribution license (http://creativecommons.org/licenses/by/3.0/).
Share and Cite
Anawar, H.M.; Akai, J.; Mihaljevič, M.; Sikder, A.M.; Ahmed, G.; Tareq, S.M.; Rahman, M.M. Arsenic Contamination in Groundwater of Bangladesh: Perspectives on Geochemical, Microbial and Anthropogenic Issues. Water 2011, 3, 1050-1076. https://doi.org/10.3390/w3041050
Anawar HM, Akai J, Mihaljevič M, Sikder AM, Ahmed G, Tareq SM, Rahman MM. Arsenic Contamination in Groundwater of Bangladesh: Perspectives on Geochemical, Microbial and Anthropogenic Issues. Water. 2011; 3(4):1050-1076. https://doi.org/10.3390/w3041050
Chicago/Turabian StyleAnawar, Hossain M., Junji Akai, Martin Mihaljevič, Arif M. Sikder, Golam Ahmed, Shafi M. Tareq, and Mohammad M. Rahman. 2011. "Arsenic Contamination in Groundwater of Bangladesh: Perspectives on Geochemical, Microbial and Anthropogenic Issues" Water 3, no. 4: 1050-1076. https://doi.org/10.3390/w3041050