Article

Spatiotemporal Absorption Features of Yellow Willow Water Usage on the Southern Edge of the Semi-Arid Hunshandak Sandland in China

1
Water Conservancy and Civil Engineering College, Inner Mongolia Agricultural University, Hohhot 010018, China
2
Centre for Management of Baotou Reservoir, Baotou 014017, China
3
Hohhot Sub-Center for Hydrology and Water Resources, Hohhot 010010, China
4
School of Materials Science and Engineering, Beihang University, Beijing 100191, China
*
Authors to whom correspondence should be addressed.
Water 2024, 16(6), 827; https://doi.org/10.3390/w16060827
Submission received: 18 February 2024 / Revised: 8 March 2024 / Accepted: 10 March 2024 / Published: 12 March 2024
(This article belongs to the Special Issue Water Environment Pollution and Control, Volume III)

Abstract

:
The improvement of water usage efficiency and productivity, as well as the development of effective water management plans, necessitates a comprehensive understanding of how water utilization patterns in different soil layers within arid and semi-arid climates impact the capacity of plant roots to absorb water. However, there is currently no knowledge regarding the water use strategies employed by artificial yellow willow. So, we conducted a study on the hydrogen and oxygen isotopic composition of rainfall in yellow willow (Salix gordejevii) from the semi-arid region located at the southern edge of the Hunshandak Sandland in China. This study utilized measured data on xylem water, groundwater, soil moisture, and rainfall. By employing a combination of the direct comparison method and the MixSIAR model, we investigated the water uptake strategies employed by yellow willow throughout its growing season. The findings revealed that the mean δ D was highest in precipitation and lowest in groundwater, whereas the mean δ18O was highest in stem water and lowest in groundwater. The δ D and δ18O fluctuated significantly in precipitation but were steady in groundwater. Because precipitation was significantly less than evaporation, the slope and intercept were lower for the local than global atmospheric precipitation line. Water availability steadily declined with increasing depth. Lower δ18O values were caused by precipitation diluting the soil water. The MixSIAR results indicated that the primary source in May, September, and October was utilized at 19%, 18%, and 18%, respectively. In contrast, the utilization rate of each source varied considerably in June, July, and August (the primary source was utilized at 19%, 18%, and 18%, respectively). Comparatively high rates of water absorption and utilization were observed in June (19% of the total water source), July (18%), and August (23%). Therefore, the vertical distribution of the root system and variations in the soil water content regulate water usage for the yellow willow. To prevent excessive water usage and promote ecosystem restoration with artificial yellow willow plantations in water-limited desert settings, policy makers should consider the patterns of plant water use and soil water availability. By selecting drought-adapted plant species and optimizing irrigation management, it is possible to reduce water wastage and ensure that water is used efficiently for revegetation and ecosystem restoration, avoiding overuse of water and maintaining the sustainability of revegetation in water-stressed desert areas.

1. Introduction

The study of water use characteristics and spatial use strategies of water resources in yellow willow has important ecological significance and practical value, which can provide a scientific basis for ecosystem management and protection, and promote the sustainable use of land resources and improvement of the ecological environment. Because of human activity and global climate change, arid and semi-arid ecosystems are expanding worldwide [1,2]. The sustainability of artificially restored ecosystems is impacted by soil water deficits in dry and semi-arid regions [3,4]. Soil desertification is increasing and water resources are steadily declining [5,6]. Restoring vegetation and using water resources sensibly in dry and semi-arid areas are essential for maintaining ecosystem integrity. To uncover the recharge relationship between water sources in planted forests and provide a theoretical framework for water management and ecohydrological research in arid and semi-arid ecosystems under the effects of climate change, a deeper understanding of the water use characteristics of planted vegetation is necessary [7].
Water use features in dry and semi-arid locations are determined by both plant and environmental traits, such as soil moisture capacity [8], root distribution [9], topography, soil texture [10,11], and water demand related to plant age [12]. A wide variety of plants may modify the main depth at which they absorb water depending on their root dispersion and soil water content [13,14]. When shallow soil water is in short supply during the dry season, Juniperus communis, for instance, can flexibly collect both groundwater and deep soil water [15]. The traits and behavior of the plant root system determine its capacity to transform primary water sources [16], particularly in dry spells when deep-rooted plants are better equipped to reach deeper water sources than shallow-rooted ones.
Due to differences in plant water demand and consumption, plants at different developmental stages display distinct water usage strategies [14,17,18]. Soil water usage can be influenced by changes in root dispersion, soil water availability, and transpiration rates. Many plants can change their main source of water according to season or life stage to lessen the effects of drought stress. However, little is known of the soil water–plant relationships and ecological adaptations of artificially planted plants in dry and semi-arid locations, or how these affect their water usage at different ages.
The extremely adaptive yellow willow (Salix gordejevii Y. L., Chang and Skvortzov) is a desert plant that can grow in dry, chilly, and low-fertility environments [14,19,20]. Consequently, yellow willow has been widely planted in the Hunshandak Sandland of China to retard desertification and wind erosion [21]. Yellow willow has become a major desert shrub thanks to years of active restoration, and has greatly reduced the effects of soil desertification. Unfortunately, the original yellow willow woods have greatly deteriorated due to neglect [22], and are threatened by drought [23]. In the Hunshandak region, soil moisture is a critical environmental factor affecting the survival and development of yellow willow plantations [24]. Therefore, it is essential to establish sensible water management plans based on the water usage patterns of artificial plants in revegetated desert environments. The term “natural yellow willow” refers to the species of willow that grows in its native environment, while “artificially planted yellow willow” denotes those cultivated through artificial planting or cultivation techniques. Natural yellow willow has high water absorption, cold resistance, and adaptability [25]. It is currently unknown how the artificial yellow willow differs from the natural yellow willow at different developmental phases in terms of water usage and main drivers. Therefore, to identify the potential causes of dieback in old-growth yellow willow plantations, seasonal variation in water usage patterns at different plant ages and the corresponding drivers need to be investigated.
This study investigated changes in yellow willow water usage patterns and the associated variables in the Hunshandak Sandland in 2022 using a combination of stable isotope methods and MixSIAR modeling [25]. This study sought to (1) determine if the water usage varied with the seasons and (2) describe the spatial strategies of water usage by yellow willow. Our findings can inform the development of suitable management strategies for sustainable ecosystem restoration and conservation of the few water resources in desert regions.

2. Materials and Methods
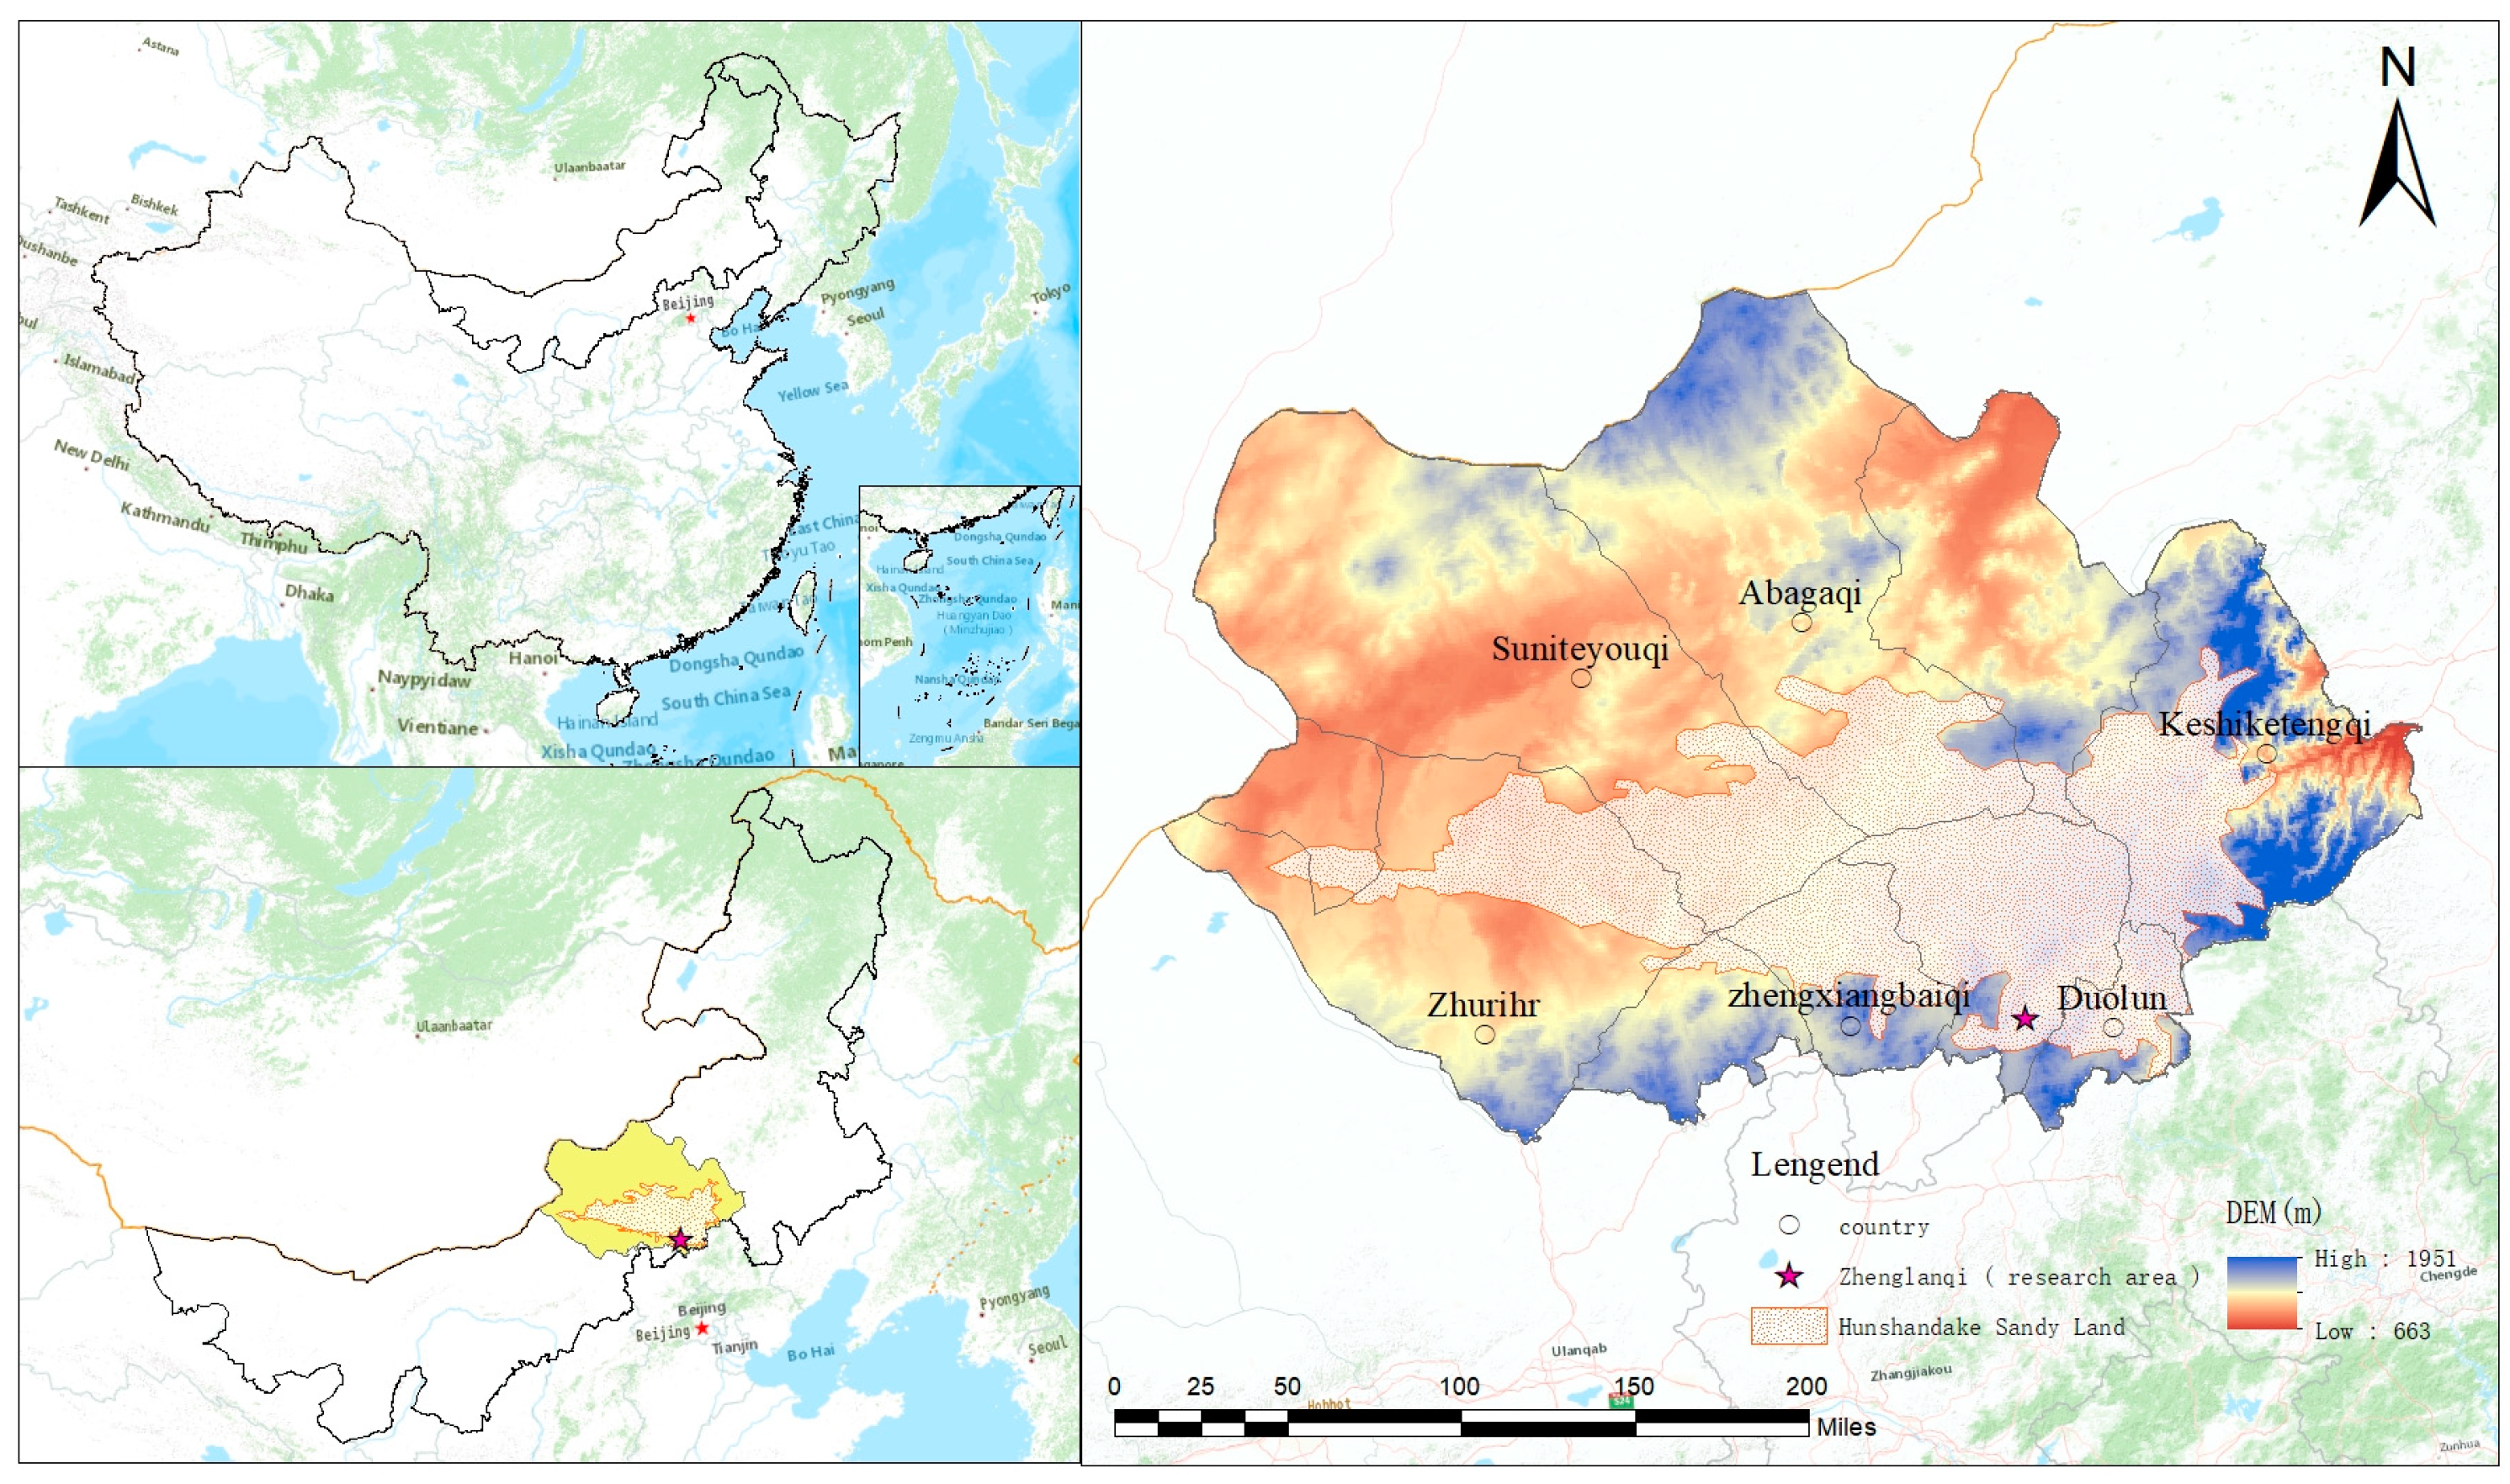
2.1. Study Area

The study locale was situated at Yucca Station, Zhenglan Banner, near the southernmost point of the Hunshandak Sandland, Xilingol League, Inner Mongolia Province of China (115°57′48″ E and 42°13′38″ N, Figure 1). This transitional area between the North China Plain and Inner Mongolia Plateau forms part of the mid-temperate zone and has a semi-arid continental monsoon climate. The four seasons are distinct, with significant variation in day–night temperatures, only a short period without frost, an uneven distribution of rainfall (60–70% occurs between June and September), and an average precipitation of ~360 mm. The average annual temperature is 1.5 °C, and 60% of the annual rainfall occurs in July and August. The Zhenglan Banner, which covers a considerable amount of area and has low vegetation cover and plant species diversity, is currently experiencing a serious degree of desertification, specifically due to the recent impacts of human activity and climate change [26].

2.2. Sample Collection and Treatment

Samples of yellow willow plants were collected from May to October 2022, on May 10, June 9, July 12, August 8, August 10, August 11, August 12, September 14, and October 13, 2022, respectively. August is the peak of the rainy season, so samples were additionally collected in August, before the rain (August 8) and after the rain (August 10–12), respectively. Therefore, collection was performed a total of 9 times: three similar and healthy yellow willow plants were collected each time, for a total of 27 yellow willow plant samples. Non-green leafy stems with a diameter of 3–5 mm were collected for each yellow willow plant, packed into glass vials (10 mL) with tightened lids, and the vials were sealed with Parafilm sealing film and refrigerated to prevent evaporation.
Samples of soils were also collected from May to October 2022, for which the collection times were the same as those of the yellow willow samples. Soil at the yellow willow stem base, next to the sunny side of the plant and next the shaded side of the plant, were collected at intervals of 1 m each (Figure 2). The sampling points (L1, L2, and L3) were selected based on the location of the three yellow willows relative to sunlight [27]. The sample points in the sun were named L1N1, L1N2, L2N1, L2N2, L3N1, and L3N2, while those in the shade were named L1B1, L1B2, L2B1, L2B2, L3B1, and LB2. Sampling sites on the sunny side were named L1N1, L1N2, L2N1, L2N2, L3N1, and L3N2, while those on the shady side were named L1B1, L1B2, L2B1, L2B2, L3B1, and L3B2 (Figure 2). The parallel sample points of the three yellow willows were averaged and the sampling collations were named LN2, LN1, L, LB1, and LB2, Using a soil-sampling auger, a 200 cm soil profile was drilled at L1, L2, and L3. In addition, a 100 cm soil profile (i.e., 0–10, 10–20, 20–40, 40–60, 60–80 cm, and 80–100 cm) was drilled at the sunny side (i.e., L1N1, L1N2, L2N1, L2N2, L3N1, and L3N2) and the shady side (i.e., L1N1, L1N2, L2N1, L2N2, L3N1, and L3N2), respectively.
The soil was collected using stratification. The soil sample layers (20–40, 40–60, 60–80, 80–120, 120–160, and 160–200 cm) were divided into two parts: one part measured the soil water isotope, and the other part of the soil sample was placed in a 50 mL plastic test tube, immediately sealed with Parafilm, and refrigerated; the remaining portion was used for water content analysis after being placed within an aluminum box. For soil water isotope measurements, samples of the three yellow willow trees were taken from each sunny and shady sampling point on a 100 cm soil profile in layers (10–20, 20–40, 40–60, 60–80, and 80–100) in 50 cm plastic test tubes. The tubes were immediately sealed with Parafilm and refrigerated.
Precipitation samples were collected at Yucca Station using two iron buckets covered with plastic funnels containing a ping-pong ball (to prevent water evaporation and fractionation) and then placed in 50 mL plastic test tubes. From May to October 2022, precipitation was collected every time it rained, and a total of 66 precipitation samples were collected.
During off-peak hours, we collected 30–50 mL of groundwater from a well adjacent to the willow forest using sampling bottles, with the water being pumped out for about 1 min to ensure that each water sample was representative of the groundwater quality [28]. All of the water samples were promptly sealed with Parafilm to prevent evaporation and water loss, and then promptly frozen in a refrigerator.
Moisture content was ascertained by weighing the portion of the soil samples gathered in the aluminum box [29]. After weighing the wet soil in the laboratory, the aluminum box was heated at 105 °C for 12 h, the samples were weighed again, and the water content was calculated.
An LI-2000 vacuum extraction device was first used to remove moisture from the soil and stems. We measured the δ D and δ18O values for the precipitation, plant water, soil water, and groundwater using a liquid water isotope analyzer (DLT-100, Los Gatos Resear, USA). The precision was within ±0.3‰ and ±0.1‰, respectively, which meets the requirements of measurement accuracy. Analyses were performed at room temperature to promote accuracy in the hydrogen–oxygen isotope ratios. The Vienna standard mean ocean water (V-SMOW) index was calculated to determine the 1000th variation of the stable isotope composition of hydrogen and oxygen, as follows:
δ = ( R s a m p l e / R s t a n d a r d 1 ) × 1000
where the ratios of heavy to light isotopes in the water sample and V-SMOW are denoted by Rsample and Rstandard, respectively. If δ < 0, the heavy isotope is depleted in comparison to the standard value; if δ > 0, the heavy isotope is enriched in the sample.
MixSIAR (version R-4.1.3 RStudio) is a software package for isotopic mixing modeling, specifically for estimating the proportionate contribution of each component in a mixture from stable isotope data. The contribution of various sources to the mixture was calculated using the Bayesian mixture model MixSIAR (version 3.1.13) [30] and Bayesian model identification [31]. MixSIAR accounts for uncertainties related to different isotopic compositions, numerous sources, and identification variables, as follows:
i j = k = 1 k P k S j k + C j k + ε i j ,
S j k ~ N ( µ j k , ω j k 2 ) ,
S j k ~ N ( λ j k , τ j k 2 ) ,   and
ε i j ~ N ( 0 , σ j 2 ) ,
where X i j represents the isotope value of mixture i (i = 1, 2, 3,..., N; j = 1, 2, 3,..., j); P k is the contribution ratio of source k ’s contribution; S j k is the j -isotope value of source k (k = 1, 2, 3,..., k); µ j k is the mean and ω j k 2 is the variance in normally distributed data; C j k sources a fractionation factor in j -isotopes; λ j k is the mean and τ j k 2 is the standard deviation; and ε i j is the residual error of the additional non-quantified variance of individual components, expressed as mean 0 and standard deviation σ j 2 .

2.3. Statistical Analysis

ArcGIS 10.8 was used to process DEM images of the study locale (https://www.gscloud.cn/, website archived on 10 June 2023). Data normality was tested at a 95% confidence level using SPSS 26 software [32]. δ D and δ18O estimate, rainfall, xylem moisture, and soil moisture fluctuations were assessed using a one-way analysis of variance (ANOVA). Spatiotemporal (depth) fluctuations in δ D and δ18O were assessed using the ANOVA. The association between δ D and δ18O estimates in each water source was investigated using Pearson’s correlation analysis. Data were processed using Excel software (2016); graphics were computed using ArcMap 10.8 and Origin 2019 software.

3. Results

3.1. Isotopic Characteristics of Different Water Sources

According to the estimated isotope values in different water sources from May to October 2022 (Table 1), the average δ D values were, in order, in the groundwater < soil water < stem water < precipitation, whereas the average δ18O values were in the groundwater < precipitation < soil water < stem water. The most stable and least variable were the groundwater estimates, as evidenced by the standard deviations of δ D and δ18O being in the orders groundwater < stem water < soil water < precipitation and groundwater < soil water < stem water < precipitation, respectively. The δ D and δ18O of the groundwater were the most stable and the variability was small. The precipitation exhibited a lack of stability and large variability.

3.2. Local Atmospheric Precipitation Characteristics

In May to October 2022, the atmospheric precipitation δ D estimate ranged from −119.69 ‰ to −17.66 ‰ (mean = −59.51‰), while the δ18O values varied between −13.01 ‰ and –3.42 ‰ (mean = −8.51‰) (Table 1). Based on the global atmospheric waterline equation proposed by Craig [33], the precipitation line (LMWL) equation in our study area was δ D = 7.50δ18O + 4.31 (Figure 3), for which the slope and intercept were smaller than the global atmospheric precipitation line, which is comparable to the northwest of the Hunshandak Sandland atmospheric precipitation line. This indicates strong evaporation and arid conditions in the western region.

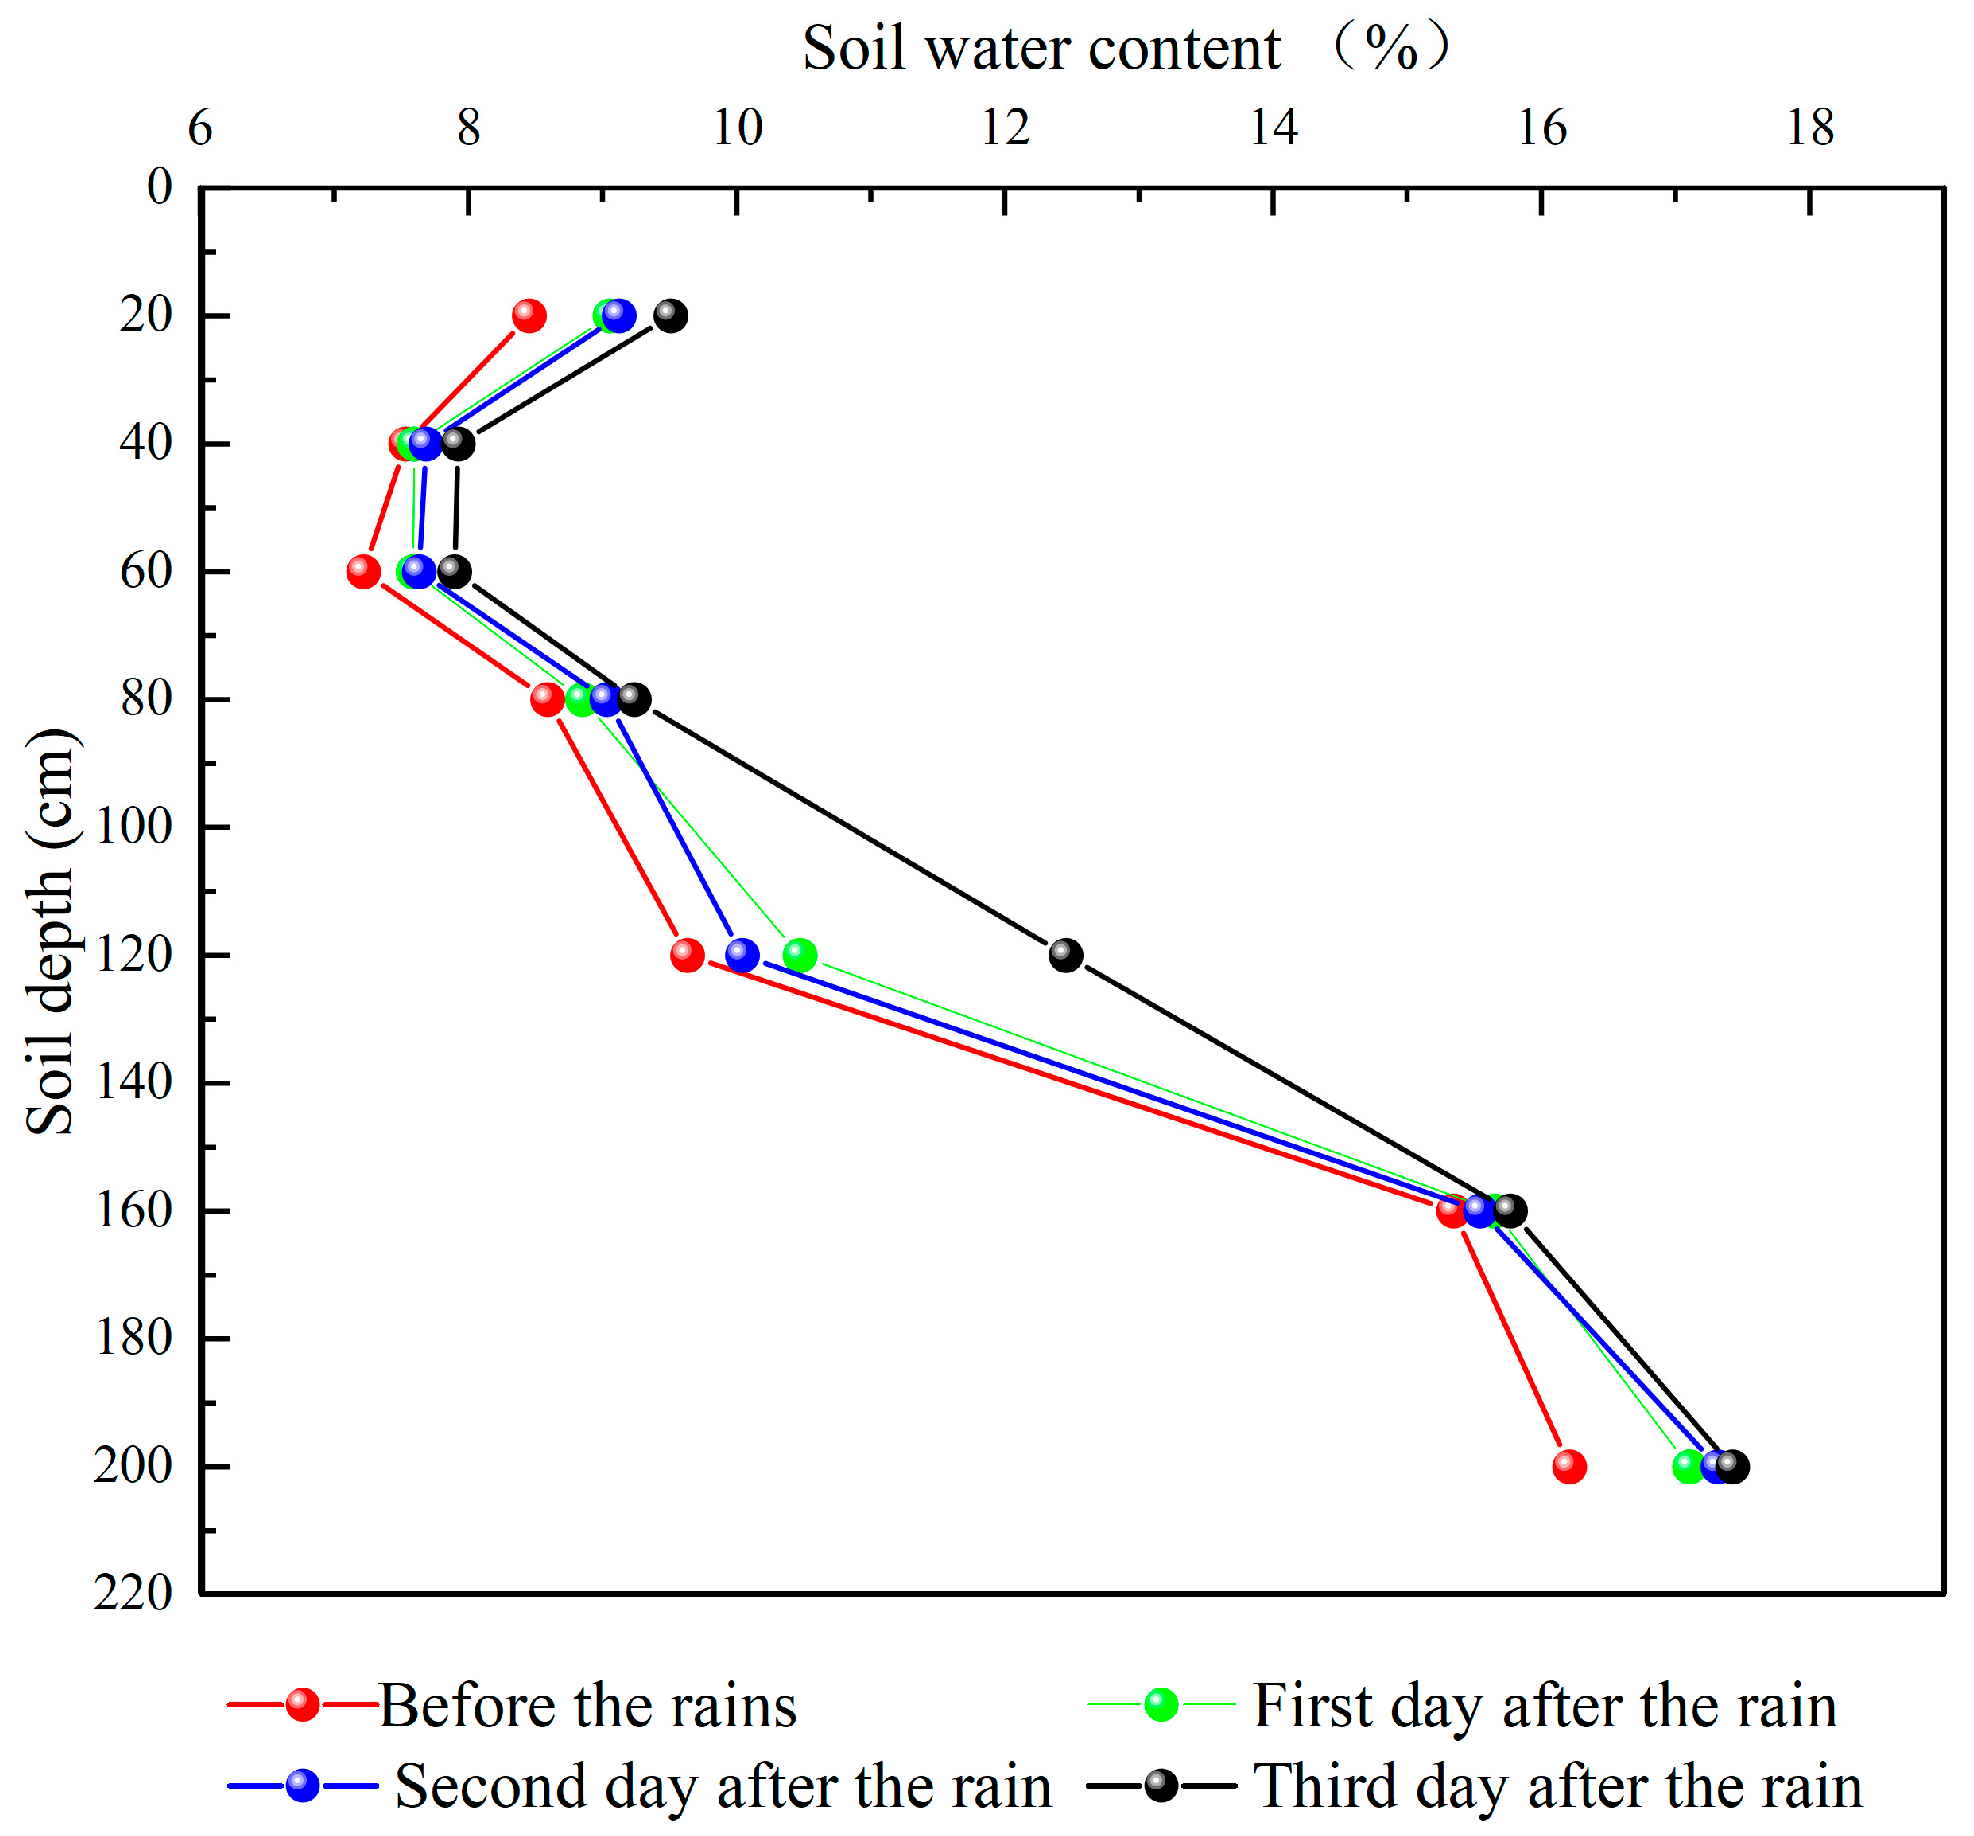
3.3. Variation in Soil Water Content between Seasons

Soil moisture is crucial in the hydrological cycle and may be used to monitor droughts in the study locale. Changes in soil moisture are impacted by evapotranspiration [34].
The soil water content increased from 5.26% to 16.69% with depth (Table 2). The topsoil layer, which is most impacted by precipitation, had more water in the 20–40 cm layer than in the 0–20 cm layer. July and August recorded more water in the 0–40 cm layer than the other months; May had the lowest percentage (5.34%), while July had the highest percentage (10.70%). The monthly pattern was constant at 0–40 cm. The monthly variation in water content was especially evident at 40–80 cm, while the content of water only varied between 10.30% and 12.64% in the 80–120 cm layer, and between 11.55% and 16.69% in the 160–200 cm layer.
Soil water samples were collected before and after a large rainfall event in July to assess the impact of rainfall on the soil water content (Figure 4). There was less water in all soil strata before the rain compared to after the rain. The soil water content at 0–40 cm did not change significantly on the second day following the rain. On the third day, the soil water content at the 40 to 120 cm depth increased significantly, while it was constant at the depth from 120 to 160 cm and higher below the 160 cm depth.

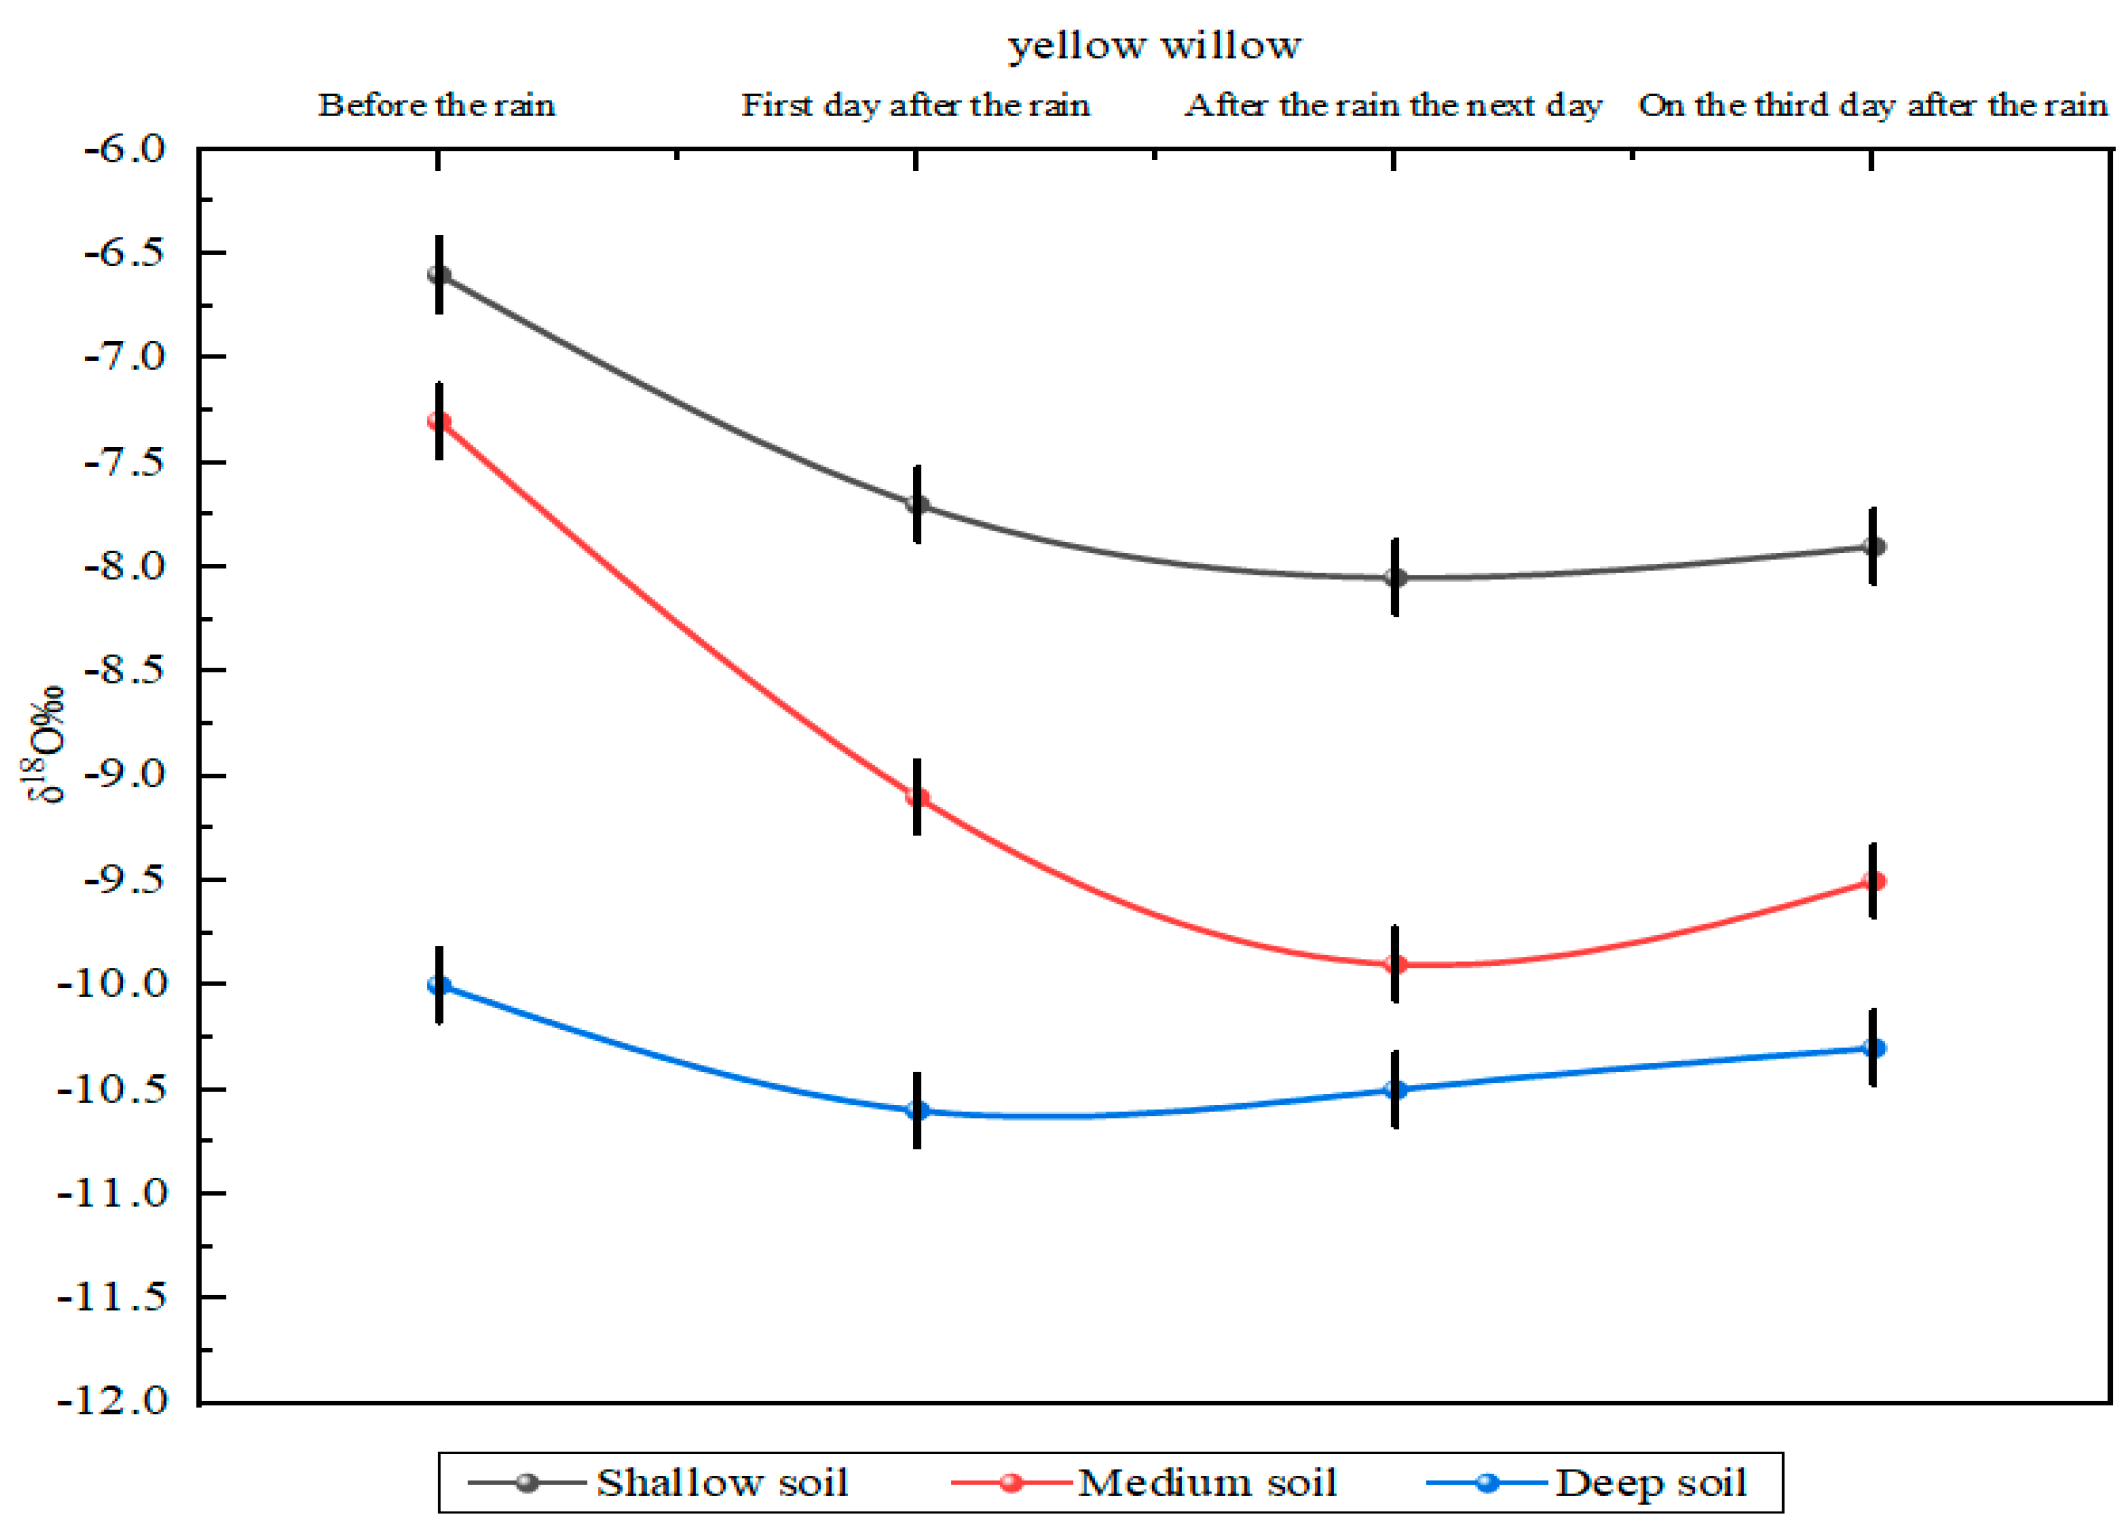
3.4. Effects of Precipitation on Soil Hydrogen and Oxygen Isotopes

Precipitation, the primary source of soil water recharge, affects the δ D and δ18O values of soil water at varying depths, which reflects the links between recharge and conversion amongst various water sources. Rainfall affected soil isotopes at all levels (Figure 5). After rainfall, soil water isotopes varied greatly in the shallow layers (from −8.20 to −7.01), while little changes were observed in the middle and deep layers (from −9.20 to −8.31 and −11.70 to −10.27, respectively); this suggests that precipitation is more likely to infiltrate shallow soils, leading to greater changes in the isotopic values of these soils. The shallow soil trough surfaced on the first day following the rain, with a δ18O value 1.2‰ lower than before the rain; this is due to the significant effect of precipitation on shallow soil water. On the second day following the rain, the trough returned to its pre-rain level. The δ18O value in the deep layer remained constant, while the trough in the middle layer emerged on the second day; this suggests a slight delay in replenishing the mesic soil, resulting in relatively late changes in isotopic values. There was also a slight delay in the recharge of the middle layer. The δ18O values were more sensitive to rainfall in the shallow and middle layers, which were typically in the following order: before rain > first day after rain > second day after rain > third day after rain. This suggests that shallow and mesopelagic δ18O values are more sensitive to precipitation. The infiltrated precipitation mixed with the initial soil water and moved downhill to replenish the 0–120 cm layer, and the isotopic composition of the soil water below the mesocosm is more stable, suggesting that this soil receives less rainfall. Soil below the middle layer showed less fluctuation in δ18O than the shallow soil, reflecting the recharge behavior of the soil. On the first day following the rain, the δ18O values decreased in the shallow soil water. The δ18O values in the middle soil layer decreased the day after the rain. The δ18O values of the deep soil layer remained relatively unchanged after precipitation, especially with mild precipitation, which tends to not reach deeper soils.

3.5. Determining the Main Water Sources in Artificially Planted Yellow Willow

The δ18O values in the stem water were compared with those of the soil and groundwater at various depths to determine whether plants source water from soil layers with the same isotopic composition [35].

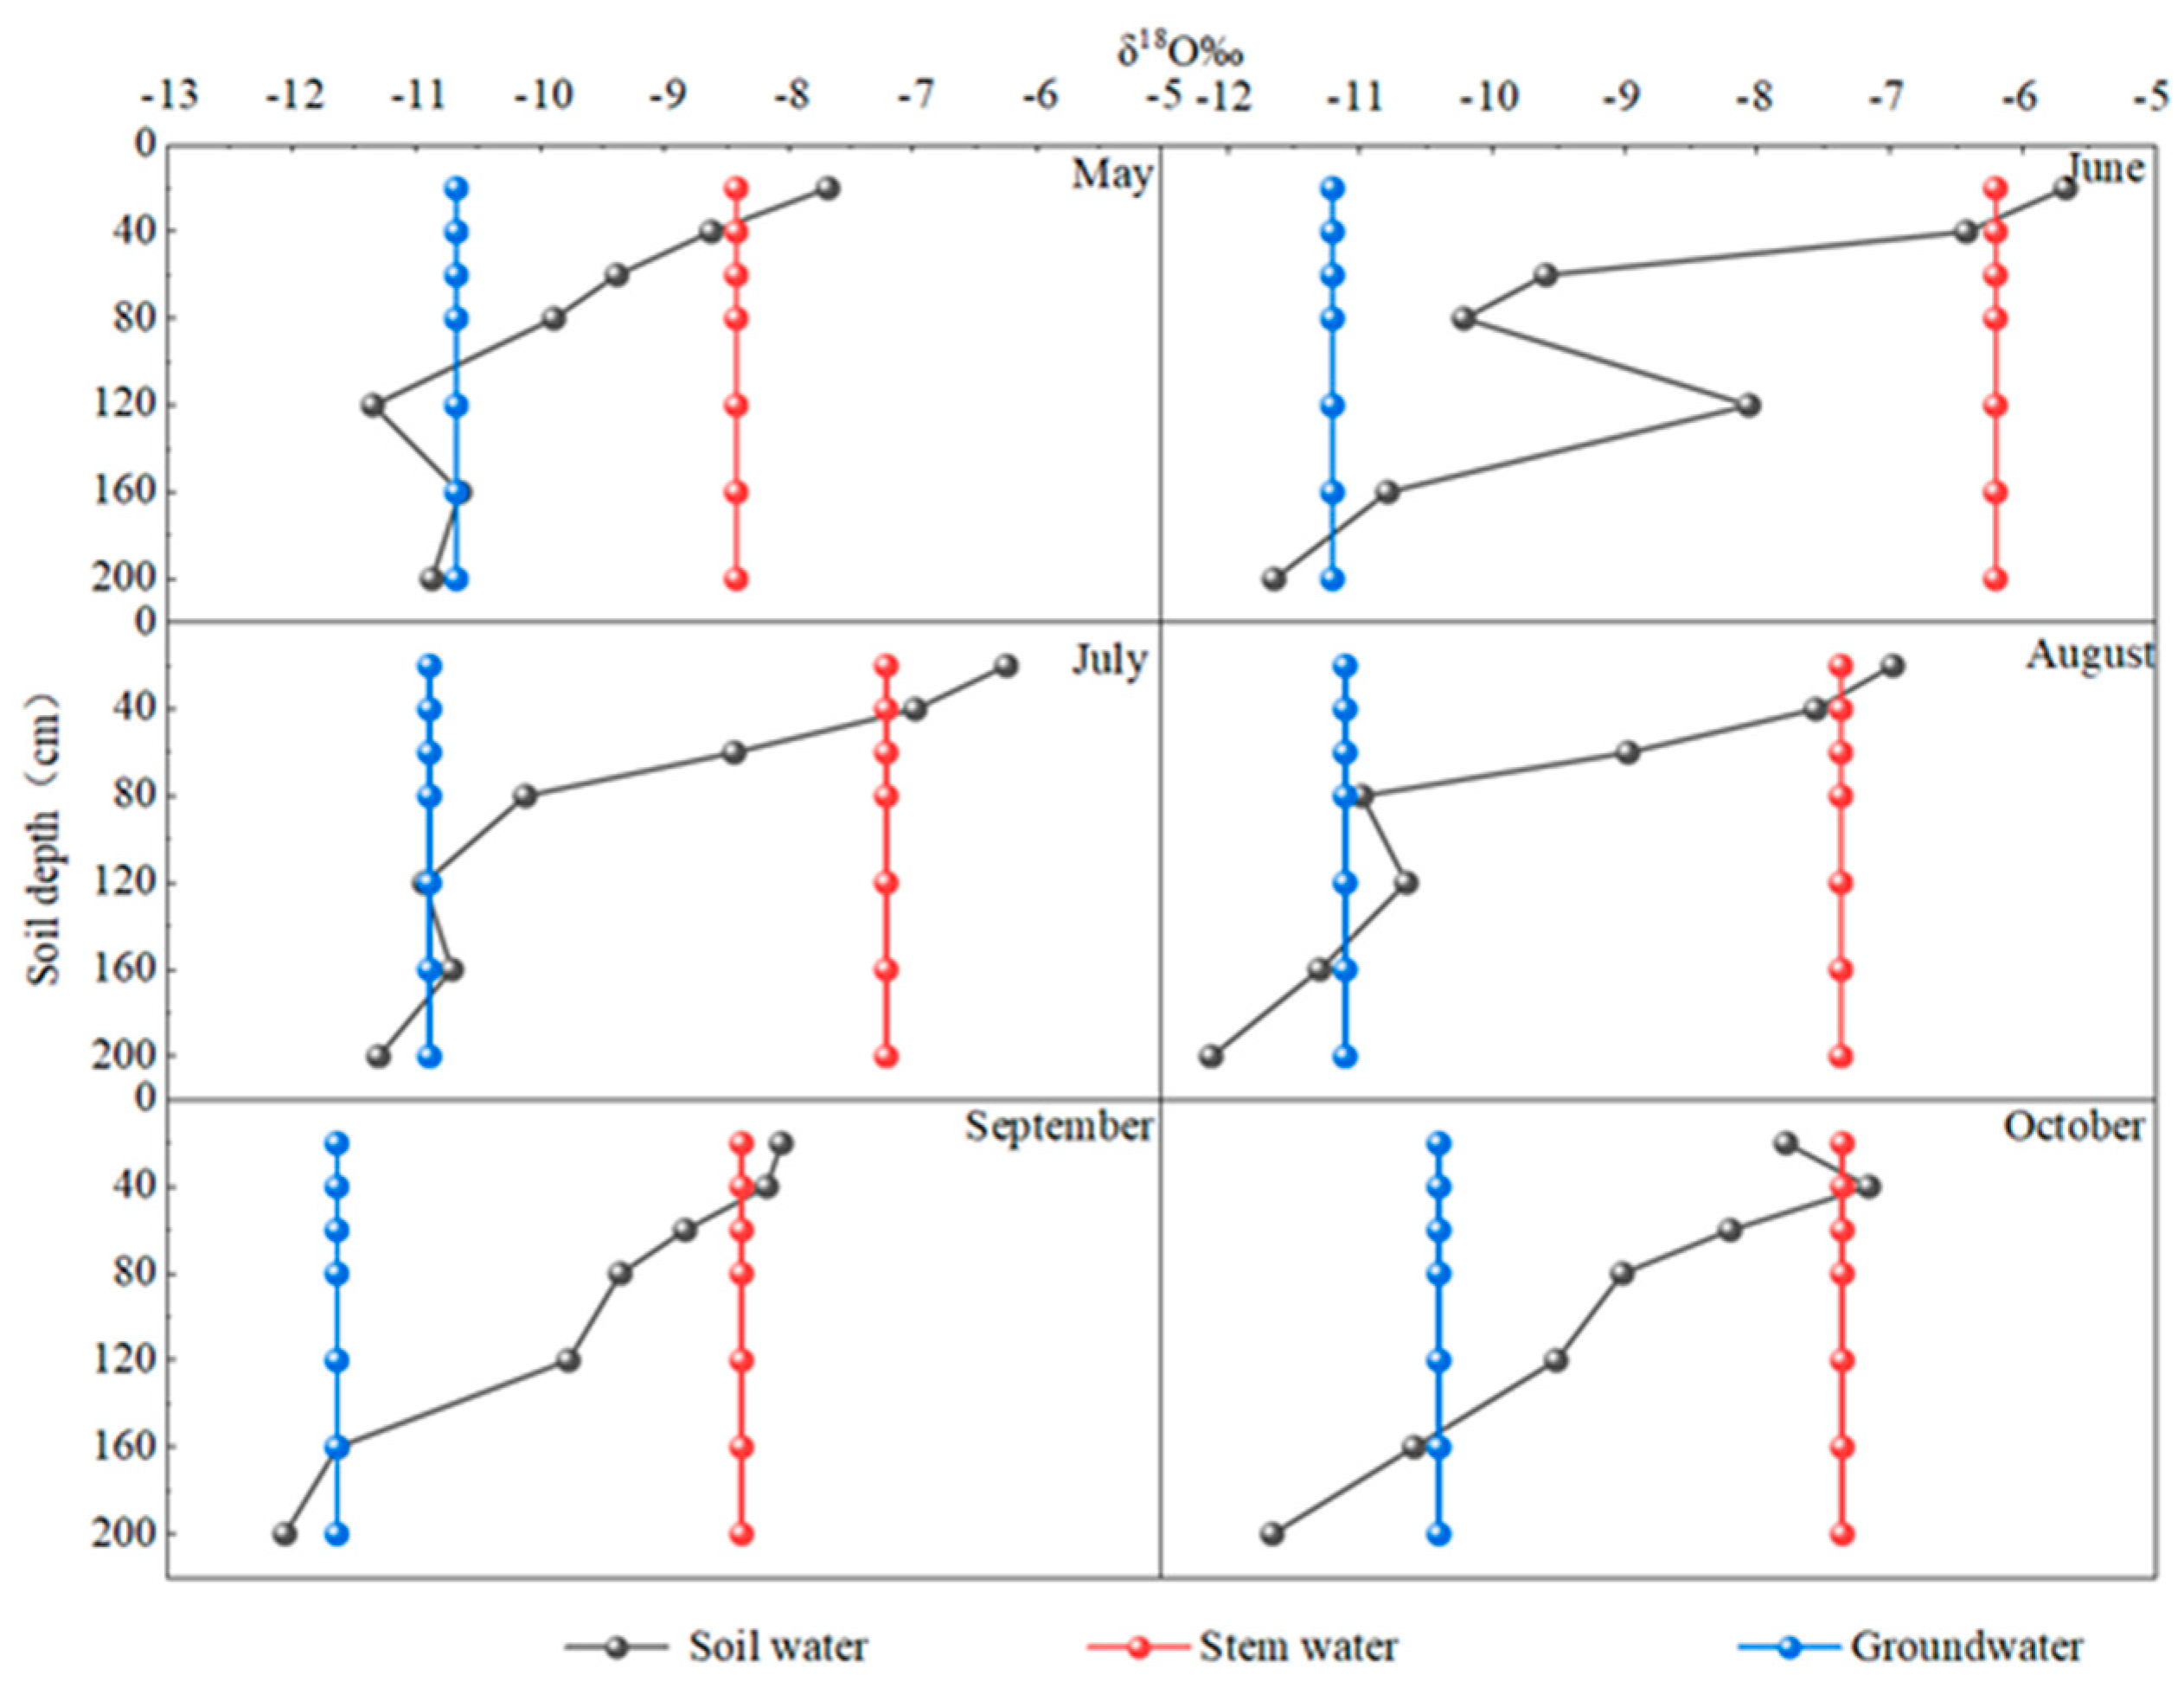
3.5.1. Vertical Variation in Soil Water Isotope

Based on the fluctuations in soil water with depth, we designated 0–40 cm as the shallow soil layer, 40–120 cm as the middle soil layer, and 120–200 cm as the deep layer. Because of the link between δ D and δ18O, we used δ18O to represent the average value of soil water isotopes in the vertical profile. We analyzed the vertical distribution of δ18O estimates (Figure 6) and found that the values generally decreased with depth; the shallow layer had the highest levels and greatest variation, suggesting that plants tend to use shallow water sources more than deep water sources. This helps us to better understand the water use strategies of plants as well as the water cycle of ecosystems. The deeper layers had lower levels of δ18O, with some variation. Less variance was seen in the middle-layer soil samples compared to the shallow-layer soil samples. We examined the water intake characteristics of yellow willow based on the differences in δ18O between water sources. From the intersections of the water lines, it is known that the yellow willow stems absorbed shallow soil water in May, June, July, and September, and that the yellow willow also absorbed middle-layer soil water and indirect shallow groundwater in May and July. The intersection between the δ18O values of the deep soil water and groundwater likely represents recharge through the groundwater [36]. Consequently, the yellow willow plants must have indirectly absorbed groundwater because their root system was primarily distributed in the 10–30 cm sand layer.
In August, the stem and soil water δ18O values intersected at 0–40 cm, while the soil and groundwater δ18O values intersected in the middle (80 cm) and deep soil layers (160 cm). Based on this trend, it is possible that the yellow willow plants used soil water at deeper depths (>160 cm) simultaneously with other sources. However, this simple analysis is insufficient to adequately assess water usage.
In October, the stem and soil water δ18O values intersected at 40–60 cm, indicating that plant growth depends on water in the middle soil layer during the transition from the wet to the dry season. The yellow willow required little water in its late growth stage; thus, the water stored in the middle soil layer during the wet season may sustain normal growth during the dry season. The soil water and groundwater convert each other for mutual benefit. The soil and groundwater δ18O values intersected at 190 cm. October had a predominantly dry climate with very little precipitation, which required the yellow willow plants to supplement their water from the deep soil layer.

3.5.2. Lateral Variation in Soil Water Isotope

The main and fibrous roots of adult yellow willow can absorb water at depths of up to 2 and 1 m, respectively. We analyzed the changes in isotope levels in the middle and shallow soil layers at LN1, LN2, L, LB1, and LB2. As in Section 3.5.1, δ18O was used to represent the average soil water isotopes in the vertical soil profile and analyze the transverse water absorption pattern (Figure 7).
The intersection of the stem water line and each water line in the figure shows that in May, the yellow willow plants absorbed shallow soil water at LN2-LN1, LN1-L, and LB1-LB2, absorbed intermediate soil water at LN1-L and LB1-LB1, and recharged indirectly through the groundwater. In June, the yellow willow absorbed shallow soil water at LN2-LN1, LN1-L, and L-LB1. In July, there was more precipitation, and the yellow willow absorbed shallow soil water not provided by precipitation at LN1-L and L-LB1. In August, the yellow willow absorbed shallow soil water at LN2-LN1 and L-LB1 and middle-layer soil water at LN1-L and L-LB1, indicating that precipitation in August replenished the middle- and shallow-layer soil water, thus promoting water supply in the middle soil for lateral capillary root uptake. In September, the yellow willow absorbed shallow soil water at LN1-L and LB1-LB2, indicating that shallow soil water was absorbed laterally. In October, the yellow willow absorbed shallow soil water at LN2-LN1 and L-LB1, and the δ18O values of the intermediate soil layer were comparable to the δ18O values near LN2. This indicates that shallow soil water was absorbed laterally between LN2-LN1 and L-LB1, and the intermediate soil layer received recharge from the shallow soil water.

3.6. Quantitative Analysis of Yellow Willow Moisture Sources

The utilization rate of water from different sources was determined using the Bayesian mixture model MixSIAR [24], which follows the principle of hydrogen and oxygen isotope mass conservation. In May, September, and October, the difference in water utilization to absorption was relatively small between sources. In June, July, and August, due to the relative lack of rainfall events, water uptake by the yellow willow root system was more complex and the differences in water use and uptake between water sources were relatively large (Figure 8). There were notable variations in water utilization rates in June, July, and August. The monthly rates of water absorption and utilization were highest along the lateral axis, with the greatest soil water contribution corresponding to the sunny side and the smallest soil water contribution coming from the shady side.
In May, the points beneath the yellow willow trees (L), the two points facing the sun (LN1 and LN2), and the two points facing the shade (LB1 and LB2) absorbed the greatest amount of water in the shallow soil layer in the lateral direction, followed by the middle and deep soil layers. Most water was absorbed from shallow soil near these points, with the middle layer (L 40–120 cm, and LN and LB 40–100 cm) contributing 8.4% to the L points. This was consistent with direct soil water uptake. The contribution rates of the LN1, L, and LB1 points in the shallow soil layer (0–40 cm) were 8.6%, 8.4%, and 8.4%, respectively.
In June, the rainfall decreased and the solar insolation intensity increased compared to those observed in May. The increase in irradiation exacerbated evapotranspiration and water demand on the sunny side of the plant. In June, the plants absorbed more shallow soil water vertically and more soil water at L and the sunny side of LN horizontally (16% and 17%, respectively). On average, the sunny side contributed more soil water each month than the shady side.
The marked increase in precipitation during July and August recharged the shallow soil water, decreased the intensity of evapotranspiration, and decreased the variation in water absorption on the sunny side of the yellow willow. Shallow soil water was primarily absorbed near L; points LN1, L, and LB1 made the largest contributions in July (all 16%) and August (20%, 23%, and 16%, respectively).
In September and October, precipitation was infrequent, middle-layer soil water contributions increased, and water was mostly absorbed from the middle and shallow soils. The sunny side (LN) had a higher lateral intensity of evaporation than the shaded side (LB), thereby increasing water demand. The sunny side contributed more soil water than the leeward shaded side.

4. Discussion

The biggest seasonal fluctuations in δ D and δ18O values were observed in the soil and xylem water, in that order. The local atmospheric precipitation line had a smaller slope and intercept than the global atmospheric precipitation line, suggesting that the level of precipitation was significantly less than the level of evapotranspiration. Falling precipitation is affected by strong evaporative fractionation, which enriches the precipitation with heavy isotopes [37,38]. In our study, soil water δ18O values decreased with soil depth [39] (Figure 5), which was caused by varying evaporation intensities between soil layers. The δ18O values exhibited larger seasonal variations in shallow soil water compared to deep soil water. Due to evaporation, the mean δ18O value of the shallow soil water was consistently higher in both wet and dry seasons compared to the peak rainy season. In the lower soil layers, the soil water content remained constant across months, indicating that precipitation primarily influenced the surface soil water content. During July and August, the water content of the 0–40 cm layer notably increased, likely due to precipitation infiltration during the rainy season and spring permafrost thawing, leading to rapid fluctuations in the 40–80 cm layer [40]. Deeper soil water, closer to the groundwater level (3–4 m), was refilled by rising capillary water, resulting in greater fluctuations in soil water content in the 160–200 cm layer compared to the 80–120 cm layer. The soil water content decreased immediately before rainfall and increased afterward. Specifically, the soil water content at 0–40 cm showed no immediate increase after rainfall, while significant increases were observed at 40–120 cm on the third day, remaining unchanged at 120–160 cm. This highlights the time required for rainfall to penetrate deeper soil layers (Figure 4). During their peak development phase, the plants absorbed shallow soil water and some deep soil water to support their growth. Finally, groundwater recharge may have impacted the total soil water content below 160 cm. During the dry and wet periods, notable changes in δ18O were observed across both different depths and timings. Small variations in δ18O values between soil strata in different yellow willow woods can be ascribed to the distinct durations of water retention in various textured soils: differences in soil water isotopic composition between stands can be mitigated by shorter water retention durations in homogenous sandy soils [32]. The δ18O values of stem water were lower in the wet than dry season (Figure 5), likely because increasing rainfall enriches light isotope levels in soil water. Although isotopic fractionation in the unsaturated zone or within plant tissues can bias isotope estimates between the xylem and water source, the isotopic composition of the stem water effectively reflects that of the water source [28].
Our vertical qualitative and quantitative analyses showed that soil water δ18O values generally decreased with depth, consistent with previous findings [27]. δ18O values and their variation were highest in the shallow layer. The deeper strata had the lowest water content and were more stable over time, while the estimates for the middle soil layer fell between these. Isotope enrichment occurs as a result of strong kinetic fractionation in shallow soil, where lighter water molecules (1H216O) evaporate and leave heavier water molecules (2H218O) [41,42]. As the depth increases, kinetic fractionation gradually decreases, the change in soil water content tends to stabilize, and the isotopic composition of soil water also stabilizes. Apart from the infiltration-related kinetic fractionation effect, it is also associated with the recharging of soil water through the downward migration of precipitation, which diminishes progressively as soil depth increases [43,44]. It was previously reported that the IsoSource model [45] can be used to quantitatively assess the water contribution rates between soil layers. The findings indicated that the utilization rate of shallow soil water in the range of 5 to 10 was mostly based on vertical shallow groundwater; however, this analysis did not account for the features of the lateral fibrous roots and main root system. In contrast, MixSIAR represents an optimized model that considers lateral water intake by yellow willow fibrous roots, which addresses the uncertainty and unpredictability in the isotopic composition of the source and plant water. We found that yellow willows used every water source more evenly and consistently in May, September, and October than in the other months. In contrast, June, July, and August saw significant variation in the amount of water absorbed and used from each water source. The temporal variation in water usage is associated with the seasonal changes in temperature, humidity, wind direction, sun radiation, and evaporation intensity. Evapotranspiration intensity had the greatest impact on yellow willow water intake and utilization. As expected, the evapotranspiration intensity was higher on the sunny side (LN) than on the leeward side (LB) of the yellow willows, while the sunny side contributed more soil moisture. Under the assumption that temperature, humidity, and wind speed are all equal, solar radiation increased the evaporation intensity. The increased evapotranspiration intensity and the lower water content of the soil increased the water uptake initiative of the yellow willow on the sunny side and exacerbated water demand on the sunny side [37,46,47,48].
This study has some limitations. The lack of isotope data with high temporal resolution along the soil–plant–atmosphere axis and the effects of isotope fractionation complicated our analysis of yellow willow water sources. To increase the accuracy of water source identification, future studies should examine the isotope fractionation mechanisms in yellow willow water sources [49], specifically the differences between various plant tissues and soil layers [50,51,52,53], and consider other models and/or data correction factors. To more precisely record short-term changes in the isotopic compositions of soil, plants, and atmospheric water, high-precision isotope analyzers should be employed with a higher sample frequency. Isotopic tests at various ages could elucidate the water usage dynamics throughout the plant’s lifetime. Isotopic tests could also identify the interactions between soil, plants, and the atmosphere and indicate how various plant organs participate in the absorption and transportation of water [54]. In particular, long-term monitoring is needed to describe the seasonal fluctuations in the water sources of yellow willow forests and inform the development of adaptive conservation policies in the Hunshandak Sandland.

5. Conclusions

We used the stable isotope method and MixSIAR model to qualitatively and quantitatively investigate the water use strategies of yellow willow trees along the southern margin of the Hunshandak Sandland. The following conclusions were made:
(1) The δ D estimates were in the following order: precipitation < stem water < soil water < groundwater. The order of the average δ18O values was as follows: precipitation < groundwater < soil water < stem water. Deep groundwater δ D and δ18O values were the most stable and least variable.
(2) Strong evaporative fractionation produced the precipitation line (LMWL) equation δ D = 7.50δ18O + 4.31. The slope and intercept of the local atmospheric precipitation line were less than those of the global atmospheric precipitation line.
(3) δ18O values decreased because of precipitation recharge into shallow soil, with the general trend being pre-rainfall > first day after rainfall > second day after rainfall > third day after rainfall. The shallow layer had the highest isotope levels, while the deep layer had the lowest levels.
(4) Qualitative analysis of the sources of water uptake by the yellow willow in the vertical direction showed that the yellow willow absorbed surface soil water in May, June, July, August and September, and mid-soil water in October, while the δ18O values in the deeper part of the soil in May to October overlapped with groundwater, which was indirectly absorbed by the yellow willow.
(5) The MixSAIR model demonstrated that water usage was evenly distributed across May, September, and October (19%, 18%, and 18%, respectively). In contrast, water usage varied more clearly in June, July, and August (19%, 18%, and 23%, respectively).

Author Contributions

M.J.: writing—original draft preparation, software, visualization, investigation. D.J.: conceptualization, funding acquisition. Q.M.: writing—review and editing. Y.H.: conceptualization. S.C.: investigation, data curation. T.L.: investigation. L.Y.: investigation, data curation. X.L.: conceptualization. W.F.: revising, editing, funding acquisition. All authors have read and agreed to the published version of the manuscript.

Funding

This work was supported by the National Natural Fund Project of Inner Mongolia Agricultural University (52169003) and the Science and Technology Major Project of Ordos City (ZD20232301).

Data Availability Statement

All data can be found in the article.

Conflicts of Interest

The authors declare that they have no known competing financial interests or personal relationships that could have appeared to influence the work reported in this paper.

References

  1. Thomas, D.S. (Ed.) Arid Zone Geomorphology: Process, Form, and Change in Drylands; John Wiley & Sons: Hoboken, NJ, USA, 2011. [Google Scholar]
  2. Huang, J.; Li, Y.; Fu, C.; Chen, F.; Fu, Q.; Dai, A.; Shinoda, M.; Ma, Z.; Guo, W.; Li, Z.; et al. Dryland climate change: Recent progress and challenges. Rev. Geophys. 2017, 55, 719–778. [Google Scholar] [CrossRef]
  3. Ungar, E.D.; Rotenberg, E.; Raz-Yaseef, N.; Cohen, S.; Yakir, D.; Schiller, G. Transpiration and annual water balance of Aleppo pine in a semiarid region: Implications for forest management. For. Ecol. Manag. 2013, 298, 39–51. [Google Scholar] [CrossRef]
  4. Dymond, S.F.; Bradford, J.B.; Bolstad, P.V.; Kolka, R.K.; Sebestyen, S.D.; De Sutter, T.M. Topographic, edaphic, and vegetative controls on plant-available water. Ecohydrology 2017, 10, e1897. [Google Scholar] [CrossRef]
  5. Haregeweyn, N.; Tsunekawa, A.; Nyssen, J.; Poesen, J.; Tsubo, M.; Tsegaye Meshesha, D.; Tegegne, F. Soil erosion and conservation in Ethiopia: A review. Prog. Phys. Geogr. 2015, 39, 750–774. [Google Scholar] [CrossRef]
  6. Huang, L.M.; Shao, M.A. Advances and perspectives on soil water research in China’s loess plateau. Earth-Sci. Rev. 2019, 199, 102962. [Google Scholar] [CrossRef]
  7. Harrison, J.L.; Blagden, M.; Green, M.B.; Salvucci, G.D.; Templer, P.H. Water sources for red maple trees in a northern hardwood forest under a changing climate. Ecohydrology 2020, 13, e2248. [Google Scholar] [CrossRef]
  8. Gow, L.J.; Barrett, D.J.; O’grady, A.P.; Renzullo, L.J.; Phinn, S.R. Subsurface water use strategies and physiological responses of subtropical eucalypt woodland vegetation under changing water availability conditions. Agric. For. Meteorol. 2018, 248, 348–360. [Google Scholar] [CrossRef]
  9. Wang, J.; Fu, B.J.; Lu, N.; Zhang, L. Seasonal variation in water uptake patterns of three plant species based on stable isotopes in the semi-arid loess plateau. Sci. Total Environ. 2017, 609, 27–37. [Google Scholar] [CrossRef]
  10. Nie, Y.P.; Chen, H.S.; Wang, K.L.; Yang, J. Water source utilization by woody plants growing on dolomite outcrops and nearby soils during dry seasons in the Karst Region of Southwest China. J. Hydrol. 2012, 420, 264–274. [Google Scholar] [CrossRef]
  11. Zhao, Y.; Wang, L. Insights into the isotopic mismatch between bulk soil water and Salix matsudana Koidz trunk water from root water stable isotope measurements. Hydrol. Earth Syst. Sci. 2021, 25, 3975–3989. [Google Scholar] [CrossRef]
  12. Huo, G.P.; Zhao, X.N.; Gao, X.D.; Wang, S.F.; Pan, Y.H. Seasonal water use patterns of rainfed jujube trees in stands of different ages under semiarid Plantations in China. Agric. Ecosyst. Environ. 2018, 265, 392–401. [Google Scholar] [CrossRef]
  13. Lanning, M.; Wang, L.; Benson, M.; Zhang, Q.; Novick, K.A. Canopy isotopic investigation reveals different water uptake dynamics of maples and oaks. Phytochemistry 2020, 175, 112389. [Google Scholar] [CrossRef]
  14. Pei, Y.W.; Huang, L.M.; Shao, M.A.; Zhang, Y.L.; Pan, Y.H. Water use pattern and transpiration of Mongolian pine plantations about stand age on northern Loess Plateau of China. Agric. For. Meteorol. 2023, 330, 109320. [Google Scholar] [CrossRef]
  15. McCole, A.A.; Stern, L.A. Seasonal water use patterns of Juniperus ashei on the Edwards Plateau, Texas, based on stable isotopes in water. J. Hydrol. 2007, 342, 238–248. [Google Scholar] [CrossRef]
  16. Chang, E.H.; Li, P.; Li, Z.B.; Xiao, L.; Feng, Z.H. Using water isotopes to analyze water uptake during vegetation succession on abandoned cropland on the Loess Plateau, China. Catena 2019, 181, 104095. [Google Scholar] [CrossRef]
  17. Wang, S.F.; An, J.; Zhao, X.N.; Gao, X.D.; Wu, P.T.; Huo, G.P.; Robinson, B.H. Age and climate-related water use patterns of apple trees on China’s Loess Plateau. J. Hydrol. 2020, 582, 124462. [Google Scholar] [CrossRef]
  18. Wang, J.; Fu, B.J.; Jiao, L.; Lu, N.; Li, J.Y.; Chen, W.L.; Wang, L.X. Age-related water use characteristics of Robinia pseudoacacia on the Loess Plateau. Agric. For. Meteorol. 2021, 301, 108344. [Google Scholar] [CrossRef]
  19. Jia, H.X.; Yang, H.F.; Sun, P.; Li, J.B.; Zhang, J.; Guo, Y.H.; Han, X.J.; Zhang, G.S.; Lu, M.Z.; Hu, J.J. De novo transcriptome assembly, development of esters markers, and population genetic analyses for the desert biomass willow, Salix psammophila. Sci. Rep. 2016, 6, 3. [Google Scholar]
  20. Wang, Y.; Meng, H.; Zhang, W.; Shao, W.; Zhang, G.; Ning, M.; Ge, G. Morphological characters and inflorescence distribution habits of Salix psammophila in Mu Us Sand Land. Acta Bot. Bor-Occid. Sin. 2009, 29, 775–780. (In Chinese) [Google Scholar]
  21. Hayat, M.; Zha, T.; Jia, X.; Iqbal, S.; Qian, D.; Bourque, C.P.A.; Khan, A.; Tian, Y.; Bai, Y.J.; Liu, P.; et al. A multiple-temporal scale analysis of biophysical control of sap flow in Salix psammophila growing in a semiarid shrubland ecosystem of northwest China. Agric. For. Meteorol. 2020, 288–289, 107985. [Google Scholar] [CrossRef]
  22. Yang, Z.P.; Li, X.Y.; Liu, L.Y.; Wu, J.J.; Hasi, E.; Sun, Y.L. Characteristics of streamflow for sand-fixed shrubs in the Mu Us sandy land, Northwest China. Chin. Sci. Bull. 2008, 53, 2214–2221. (In Chinese) [Google Scholar]
  23. Zhang, Z.Y.; Wang, W.K.; Gong, C.C.; Zhao, M.; Franssen, H.J.H.; Brunner, P. Salix psammophila afforestation can cause a decline in the water table, prevent groundwater recharge, and reduce effective infiltration. Sci. Total Environ. 2021, 780, 146336. [Google Scholar] [CrossRef] [PubMed]
  24. Huang, J.P.; Yu, H.P.; Dai, A.G.; Wei, Y.; Kang, L.T. Drylands face potential threat under global warming target. Nat. Clim. Chang. 2017, 7, 417–422. [Google Scholar] [CrossRef]
  25. Jing, J. The Coupling of Water Source and Consumption Based on the Hydrogen and Oxyger Stable Isotope of Natural Salix gordejevii in Otinday Sandland. Master’s Thesis, Inner Mongolia Agricultural University, Hohhot, China, 2016; pp. 14–18. [Google Scholar]
  26. Lang, Y.I.; Ying, S.U.N.; ShaoHua, Y.I.N.; Xiao, W.E.I. Construction of Ecological Security Pattern: Concept, framework, and prospect. Ecol. Environ. 2022, 31, 845. [Google Scholar]
  27. Zimmermann, U.; Münnich, K.O.; Roether, W.; Kreutz, W.; Schubach, K.; Siegel, O. Tracers determine the movement of soil moisture and evapotranspiration. Science 1966, 152, 346–347. [Google Scholar] [CrossRef]
  28. Yang, L.; Jia, D.; Gao, R.; Su, W.; Lu, F.; Wendu, R. Isotope characteristics of hydrogen and oxygen in different water bodies in the southern margin of the Hunshandak Sandy Land. Earth Environ. 2022, 50, 630–638. [Google Scholar] [CrossRef]
  29. Schmugge, T.J.; Jackson, T.J.; McKim, H.L. Survey of methods for soil moisture determination. Water Resour. Res. 1980, 16, 961–979. [Google Scholar] [CrossRef]
  30. He, S.; Li, P.; Su, F.; Wang, D.; Ren, X. Identification and apportionment of shallow groundwater nitrate pollution in Weining Plain, northwest China, using hydrochemical indices, nitrate stable isotopes, and the new Bayesian stable isotope mixing model (MixSIAR). Environ. Pollut. 2022, 298, 118852. [Google Scholar] [CrossRef]
  31. Davidson Egbi, C.; Anornu, G.; Ganyaglo, S.F.; Appiah-Adjei, E.K.; Dampare, S.B.; Li, S.-L. Nitrate contamination of groundwater in the Lower Volta River Basin of Ghana: Sources and related human health risks. EGU General Assembly Conference Abstracts. Ecotoxicol. Environ. Saf. 2019, 191, 110227. [Google Scholar]
  32. Pei, Y.; Huang, L.; Jia, X.; Tang, X.; Zhang, Y.; Pan, Y. Water sources used by artificial Salix psammophila in stands of different ages based on stable isotope analysis in northeastern Mu Us Sandy Land. Catena 2023, 226, 107087. [Google Scholar] [CrossRef]
  33. Craig, H. Isotopic variations in meteoric waters. Science 1961, 133, 1702–1703. [Google Scholar] [CrossRef] [PubMed]
  34. Lin, G.; Sternberg, L.S.L. Utilization of surface water by red mangrove (Rhizophora mangle L.): An isotopic study. Bull. Mar. Sci. 1994, 54, 94–102. [Google Scholar]
  35. Wang, H.; Li, G.; Xu, J.; Wang, W.; Jin, L. Advances in Research on Salt Tolerance Mechanism of Plants. Crops 2022, 38, 1–12. [Google Scholar] [CrossRef]
  36. Jiang, W.; Liu, B.; Deng, Y.; Li, Y.; Shu, L.; Wang, W. Simulation of surface water-groundwater interaction in the plain area of the Poyang Lake considering the change of water body area. Hydrogeol. Eng. Geol. 2023, 50, 95–104. [Google Scholar]
  37. Wu, Y.M.; Han, L.; Liu, K.Y.; Hu, X.; Fu, Z.Q.; Chen, L.X. Water source of Robinia pseudoacacia and Platycladus orientalis plantations under different soil moisture conditions in the Loess Plateau of Western Shanxi, China. Yingyong Shengtai Xuebao 2023, 34, 588–596. [Google Scholar] [PubMed]
  38. Sui, M.Z.; Gao, Q.; Xu, Q.; He, D.M.; Wang, L.; Wang, T. Characteristics of hydrogen and oxygen isotopes in precipitation and moisture sources in Gaoyou, Jiangsu Province, China. Yingyong Shengtai Xuebao 2019, 30, 1823–1832. [Google Scholar]
  39. Wang, Y.J.; Song, X.F.; Ma, Y.; Zhang, Y.H.; Zheng, F.D.; Yang, L.H.; Bu, H.M. Characterizing the hydrogen and oxygen isotopic compositions of different waters at reclaimed water irrigated district in the southeast suburb of Beijing. Geogr. Res. 2017, 36, 361–371. [Google Scholar]
  40. Chen, Y.; Jiang, L.; Liang, L.; Zhou, Z. Monitoring permafrost deformation in the upstream Heihe River, Qilian Mountain by using multi-temporal Sentinel-1 InSAR dataset. Chin. J. Geophys. 2019, 62, 2441–2454. [Google Scholar] [CrossRef]
  41. Bögelein, R.; Thomas, F.M.; Kahmen, A. Leaf water 18O and 2H enrichment along vertical canopy profiles in a broadleaved and a conifer forest tree. Plant Cell Environ. 2017, 40, 1086–1103. [Google Scholar] [CrossRef] [PubMed]
  42. Qiu, X.; Zhang, M.; Wang, S.; Argiriou, A.A.; Chen, R.; Meng, H.; Guo, R. Water stable isotopes in an alpine setting of the Northeastern Tibetan Plateau. Water 2019, 11, 770. [Google Scholar] [CrossRef]
  43. Che, C.; Zhang, M.; Argiriou, A.A.; Wang, S.; Du, Q.; Zhao, P.; Ma, Z. The stable isotopic composition of different water bodies at the soil–plant–atmosphere continuum (SPAC) of the western Loess Plateau, China. Water 2019, 11, 1742. [Google Scholar] [CrossRef]
  44. Benstead, J.P.; March, J.G.; Fry, B.; Ewel, K.C.; Pringle, C.M. Testing IsoSource: Stable isotope analysis of a tropical fishery with diverse organic matter sources. Ecology 2006, 87, 326–333. [Google Scholar] [CrossRef] [PubMed]
  45. Rong, Y.S.; Zhang, X.N.; Jiang, H.Y.; Bai, L.Y. Pan evaporation change and its impact on the water cycle over the upper reach of the Yangtze River. Chin. J. Geophys. 2012, 55, 2889–2897. [Google Scholar]
  46. Tian, F.; Miao, Q.; Shi, H.; Li, R.; Dou, X.; Duan, J.; Feng, W. SimulatingWater and Salt Migration through Soils with a Clay Layer and Subsurface Pipe Drainage System at Different Depths Using the DRAINMOD-S Model. Agronomy 2024, 14, 17. [Google Scholar] [CrossRef]
  47. Hou, C.; Miao, Q.; Shi, H.; Hu, Z.; Zhao, Y.; Yu, C.; Yan, Y.; Feng, W. Water and Salinity Variation along the Soil Profile and Groundwater Dynamics of a Fallow Cropland System in the Hetao Irrigation District, China. Water 2023, 15, 4098. [Google Scholar] [CrossRef]
  48. Feng, W.; Wang, T.; Yang, F.; Cen, R.; Liao, H.; Qu, Z. Effects of biochar on soil evaporation and moisture content and the associated mechanisms. Environ. Sci. Eur. 2023, 35, 66. [Google Scholar] [CrossRef]
  49. Cheng, S.; Manru, G.; Huairui, S. Advances in Research on Flavonoids in Ginkgo Biloba Leaf; Scientia Silvae: Beijing, China, 2000. [Google Scholar]
  50. Tian, F.; Miao, Q.; Shi, H.; Li, R.; Dou, X.; Duan, J.; Liu, J.; Feng, W. Study on Water and Salt Transport under Different Subsurface Pipe Arrangement Conditions in Severe Saline–Alkali Land in Hetao Irrigation District with DRAINMOD Model. Water 2023, 15, 3001. [Google Scholar] [CrossRef]
  51. Tian, F.; Shi, H.; Miao, Q.; Li, R.; Duan, J.; Dou, X.; Feng, W. Soil Water and Salt Transport in Severe Saline–Alkali Soil after Ditching under Subsurface Pipe Drainage Conditions. Agriculture 2023, 13, 2196. [Google Scholar] [CrossRef]
  52. Feng, Z.; Miao, Q.; Shi, H.; Feng, W.; Li, X.; Yan, J.; Liu, M.; Sun, W.; Dai, L.; Liu, J. Simulation of water balance and irrigation strategy of typical sand-layered farmland in the Hetao Irrigation District, China. Agric. Water Manag. 2023, 280, 108236. [Google Scholar] [CrossRef]
  53. Cen, R.; Feng, W.; Yang, F.; Wu, W.; Liao, H.; Qu, Z. Effect mechanism of biochar application on soil structure and organic matter in semi-arid areas. J. Environ. Manag. 2021, 286, 112198. [Google Scholar] [CrossRef]
  54. Feng, W.; Wang, T.; Zhu, Y.; Sun, F.; Giesy, J.P.; Wu, F. Chemical composition, sources, and ecological effect of organic phosphorus in water ecosystems: A review. Carbon Res. 2023, 2, 12. [Google Scholar] [CrossRef]
Figure 1. Overview of the study area on the southern edge of the Hunshandak Sandland.
Water 16 00827 g001
Figure 2. Design schematic of sample sites.
Water 16 00827 g002
Figure 3. Atmospheric precipitation in the Hunshandak Sandland.
Water 16 00827 g003
Figure 4. Characteristics of 2 m soil moisture content before and after rain.
Water 16 00827 g004
Figure 5. Soil water δ18O in different soil layers over time after precipitation.
Water 16 00827 g005
Figure 6. Variation in soil water δ18O with soil depth.
Water 16 00827 g006
Figure 7. Changes in soil water δ18O according to lateral sample location.
Water 16 00827 g007
Figure 8. Contributions of different soil water sources to water absorption.
Water 16 00827 g008
Table 1. Isotope estimates in different water sources (May to October 2022).
IsotopeEigenvaluePrecipitationSoil WaterStem WaterGroundwater
δ D (‰)MAX−12.16−65.4−57.12−77.98
MIN−134.26−91.33−78.02−83.43
AVG−65.06−76.35−66.86−80.21
SD279.358.751.83
δ18O (‰)MAX−0.932.518.42−10.68
MIN−17.86−11.84−7.55−11.64
AVG−9.31−8.59−1.4−10.98
SD3.452.143.050.28
Table 2. Soil moisture content across different soil depths and seasons (May to October 2022).
Soil Depth (cm)MayJuneJulyAugustSeptemberOctober
0–205.417.5210.709.048.867.70
20–405.345.507.857.687.376.98
40–605.266.036.167.587.126.19
60–809.4310.198.488.939.219.57
80–1209.6410.309.0710.6513.4310.93
120–16014.7916.0413.1215.4516.1715.78
160–20013.8214.3115.3016.6914.1511.55
Disclaimer/Publisher’s Note: The statements, opinions and data contained in all publications are solely those of the individual author(s) and contributor(s) and not of MDPI and/or the editor(s). MDPI and/or the editor(s) disclaim responsibility for any injury to people or property resulting from any ideas, methods, instructions or products referred to in the content.

