

Rainfall Runoff and Nitrogen Loss Characteristics on the Miyun Reservoir Slope
by
Na Wang
1,2,†,
Lei Wang
1,2,†,
Liang Jin
2,†,
Jiajun Wu
1,
Min Pang
1,2,
Dan Wei
2,
Yan Li
2,
Junqiang Wang
3,
Ting Xu
3,
Zhixin Yang
1,* and
Jianzhi Xie
1,* 1
College of Resources and Environmental Sciences, Agricultural University of Hebei, Baoding 071000, China
2
Institute of Plant Nutrition, Resources and Environment, Beijing Academy of Agricultural and Forestry Sciences, Beijing 100097, China
3
Qiqihar Branch of Heilongjiang Academy of Agricultural Sciences, Qiqihar 161000, China
*
Authors to whom correspondence should be addressed.
†
These authors contributed equally to this work.
Water 2024, 16(5), 786; https://doi.org/10.3390/w16050786
Submission received: 1 February 2024
/
Revised: 1 March 2024
/
Accepted: 4 March 2024
/
Published: 6 March 2024
(This article belongs to the Special Issue Effects of Hydrology on Soil Erosion and Soil Conservation)
Abstract
:Rainfall intensity and slope gradient are the main drivers of slope surface runoff and nitrogen loss. To explore the distribution of rainfall runoff and nitrogen loss on the Miyun Reservoir slopes, we used artificial indoor simulated rainfall experiments to determine the distribution characteristics and nitrogen migration paths of surface and subsurface runoff under different rainfall intensities and slope gradients. The initial runoff generation time of subsurface runoff lagged that of surface runoff, and the lag time under different rainfall intensity and slope conditions ranges from 3.97 to 12.62 min. Surface runoff rate increased with increasing rainfall intensity and slope gradient; compared with a rainfall intensity of 40 mm/h, at a slope of 15°, average surface runoff rate at 60 and 80 mm/h increased by 2.38 and 3.60 times, respectively. Meanwhile, the subsurface runoff rate trended upwards with increasing rainfall intensity, in the order 5 > 15 > 10°. It initially increased and then decreased with increasing slope gradient, in the order 5 > 10 > 15°. Total nitrogen (TN) loss concentration of surface runoff shows a decrease followed by a stabilization trend; the concentration of TN loss decreases with decreasing rainfall intensity, and the stabilization time becomes earlier and is most obvious in 5° slope conditions. TN loss concentration in subsurface runoff decreased with increasing rainfall intensity, i.e., 40 > 60 > 80 mm/h. The surface runoff rainfall coefficient was mainly affected by rainfall intensity, a correlation between αs and slope gradients S was not obvious, and the fitting effect was poor. The subsurface runoff rainfall coefficient was mainly affected by slope gradient, the R2 of all rainfall intensities was <0.60, and the fitting effect was poor. The main runoff loss pathway from the Miyun Reservoir slopes was surface runoff, which was more than 62.57%. At the same time, nitrogen loss was subsurface runoff, more than 51.14%. The proportion of surface runoff to total runoff increases with the increase of rainfall intensity and slope, with a minimum of 62.57%, and the proportion of nitrogen loss from subsurface runoff also decreases with increasing rainfall intensity but does not change with slope gradient. The order of different runoff modulus types was mixed runoff (surface and subsurface runoff occur simultaneously) > surface runoff > subsurface runoff. The surface and mixed runoff modulus increased significantly with increasing rain intensity under different rain intensities and slope gradients. Overall, rainfall intensity significantly affected slope surface runoff, and slope gradient significantly affected nitrogen loss.
1. Introduction
Soil erosion occurs ubiquitously around the world and is a shared environmental problem, although it is more severe in parts of China, the United States, Russia, Australia, India, and Europe [1]. China is deeply affected by soil erosion, with about 5.29 gt of soil lost or displaced annually. Human activities have accelerated soil erosion, resulting in the erosion rate being much greater than natural soil formation. This has led to problems such as cultivated field quality degradation, reduced crop yield, and ecological environment quality decline, which seriously threatens food security and ecosystem stability [2,3]. The water quality safety of Miyun Reservoir plays an important role in Beijing. Strengthening the protection of its water resources is vital for a safe urban and rural water supply, smooth city operation, peaceful citizens, peaceful lives and work, and the sustainable development of the economy and society. The Miyun Reservoir area terrain is undulating, and soils are thin and shallow [4]. Furthermore, the soils have weak fertilizer and water sorption capacity, which makes them particularly prone to soil erosion and nutrient loss, as well as eutrophication of the surrounding water bodies, which poses significant ecological risks. Soil nitrogen is the most important indicator of soil nutrient levels [5] and also the main factor causing eutrophication/pollution of water bodies [6]. However, there have been few studies on soil nitrogen loss from slopes in the Miyun Reservoir area, especially the temporal and spatial effects of surface and subsurface runoff on soil nitrogen loss processes and mechanisms. The pathways and processes of soil nitrogen loss under different rainfall intensities and slope gradients have not been adequately addressed.
Rainfall intensity is the main influencing factor of surface erosion, and generally, the surface erosion rate is directly proportional to the intensity of rainfall [7]. Deng et al. (2018) studied erosive weathered granite slopes and found that the proportion of total runoff that was subsurface was greater than slope surface runoff [8]. Simultaneously, with increased rainfall intensity, slope surface runoff also increased, and the interaction between raindrop impact and runoff aggravated the erosion process. Studies have noted that rainfall intensity has the greatest impact on slope surface runoff in the Miyun Reservoir area, accounting for 21.84% of the total. Initial runoff generation time is also advanced with increased rain intensity, and the two are clearly negatively correlated [9]. However, most researchers believe that the greater the slope gradient, the greater the runoff [10]. Tan et al. found that when the slope gradient increases, runoff velocity in the fine gullies generated by the slope accelerates, runoff erosion intensity increases, and runoff and sediment yield increases [11]. Others have suggested that the slope rainfall-bearing capacity decreases with increased slope gradient, so factors that promote increased runoff are canceled [12]. Additionally, it has been documented that slope surface runoff and sediment yield increase initially, then decrease, and then increase with increased slope gradient [13].
The migration of nutrients such as nitrogen and phosphorus carried by runoff sediment during soil erosion is the key cause of water eutrophication, which is an important ecological threat in China [14]. Soil nutrients from the slope field mainly enter the downstream water body through slope surface runoff, subsurface runoff, and erosion sediment. Deng et al. and Liu et al. found that the greater the rainfall intensity, the more nitrogen is lost in runoff [15,16]. Chen et al. showed that under the same rainfall intensity conditions, runoff and nitrogen loss are directly proportional to rainfall time [17]. In simulation experiments, Wu et al. found that slope surface and subsurface runoff TN loss increased with increased rainfall intensity or slope gradient. Subsurface runoff is the main source of TN loss from slopes, and the loss ratio can reach 91.26 to 99.61%. The proportion of TN loss in slope surface runoff to total TN loss on slopes increases with increasing rain intensity [18]. Qian et al.’s nitrogen loss study showed that in the early stage of runoff, nitrogen loss was significant and then gradually decreased and tended to be stable. Dissolved nitrogen was the main source of runoff at the beginning, and the proportion of insoluble nitrogen increased with rainfall extension [19]. Presently, research on nutrient transport through surface runoff is relatively common, but research on nutrient transport through subsurface runoff is relatively rare.
Therefore, this study selected the slope of Miyun Reservoir as the research object; using artificial rainfall simulation, we explored runoff and nitrogen loss characteristics under different rainfall intensities and slope gradients and analyzed the contribution of surface and subsurface runoff to soil nitrogen loss, clarified the impact mechanism of rainfall intensity and slope on runoff nitrogen loss. To provide some reference for the prevention and reduction of agricultural non-point source pollution and water eutrophication on the slope of Miyun Reservoir.
2. Materials and Methods
2.1. Test Equipment and Materials
The simulated rainfall equipment adopts the QYJY-502 model produced by China Xi’an Qingyuan Measurement and Control Technology Co., Ltd. (Qingyuan, China), with a rainfall height of 5 m and a rainfall adjustment accuracy of 7 mm/h. The simulated rainfall instrument has an effective rainfall area of 11 m × 8 m, a rainfall intensity variation range of 15–200 mm/h, and a rainfall uniformity coefficient > 0.80. The simulated rainfall equipment has been recalibrated before the experiment. The experimental soil box is a fixed variable slope steel box with a slope adjustment range of 0–30°. The length, width, and height of the soil box are 2.0 m × 0.5 m × 0.6 m in sequence. The middle and bottom of the steel trough are equipped with drainage holes for collecting subsurface runoff. The top of the steel trough has a triangular outlet for collecting surface runoff (Figure 1).
2.2. Test Soil
Test soil was collected from Taishitun Town (117°6′42.08″ E, 40°32′22.02″ N), Miyun District, Beijing (Figure 2). The climate type belonged to the warm temperate semi-humid monsoon climate. The average annual rainfall of multiple years was about 624 mm; June to August is the rainy season. The soil in trial areas mainly belongs to cinnamon soil. The soil type was sandy loam soil. The basic physiochemical properties of soil are shown in Table 1 [20]. To ensure the soil did not change, the sample and bag soil were placed at a depth of 50 cm with 5 cm intervals. Based on field measurements of soil bulk density at different depths, control the volume and quality of each layer of filled soil sample to ensure that the compactness and bulk density of the soil sample are close to the natural soil. Once it was close to natural soil bulk density, the artificial simulated rainfall test was carried out.
2.3. Experimental Design
The test was conducted from June to October 2022 at the Beijing Academy of Agriculture and Forestry Sciences simulation test base, Haidian District, Beijing, China. Based on field investigation results, the slope around Miyun Reservoir is mostly between 3° and 20°; experimental slopes (S) are set at 5°, 10°, and 15°. By analyzing the year-round rainfall data in Miyun District and based on the local rainfall intensity characteristics, the experimental rainfall intensity (I) is set to 40, 60, and 80 mm/h. Design combinations (paired with 5°, 10°, and 15° slopes and rainfall intensities of 40, 60, and 80) for a total of 9 trials. In all treatments, the soil was bare. To ensure test accuracy, each treatment was repeated 3 times. Before the experiment begins, rainfall intensity calibration should be carried out, and the experiment should start when the rainfall intensity and uniformity are greater than 90%. Accurately record the initial time of surface and subsurface runoff. Each rainfall time is 60 min, with a sampling interval of 5 min. Slope surface and subsurface runoff samples collected from each rainfall were brought back to the laboratory and allowed to stand at room temperature (25 °C) for 4 to 5 h for precipitation. After precipitation, the amount of sediment was measured, and the nutrient content of the supernatant was immediately determined. Finally, total nitrogen (TN) in runoff was detected by potassium persulfate oxidation–ultraviolet spectrophotometry, and all tests were completed within 48 h. Determination of soil particle size by sieving and settling method. The soil density is determined using the ring knife method, and the soil moisture content is determined using the drying method. The soil organ organic matter is determined using the dichromate volumetry–outside heating method; available phosphorous is determined using the sodium hydroxide melting–Mo-Sb colorimetry, and available potassium is determined by sodium hydroxide melting–flame photometry [21].
2.4. Data Acquisition and Analysis
Data is analyzed using Excel 16.0 for statistics and Origin 2022 for plotting. The least significant difference (LSD) method in the Statistical Package for the Social Sciences 19 (SPSS) was used to test for significant differences in TN loss from surface and subsurface runoff at p < 0.05. The following formula was used to calculate the contribution rate of each factor (PF) [22]:
where PF is the factor contribution rate (%); SSF is type III sum of squares; DOFF is the factor degrees of freedom; VEr is the sum of squares of the error; and SST is the sum of squares of the total dispersion. SSF, SST, DOFF, and VEr values were obtained directly from the analysis of variance using SPSS 19.0 software.
3. Results and Analysis
3.1. Influence of Rainfall Intensity and Slope on Surface Runoff
Due to the influence of topographic conditions, land use patterns, and other factors, initial runoff generation time will change, so understanding initial runoff generation time during rainfall is vital for calculating soil erosion rate [23]. For the same slope gradients, initial surface runoff generation time advanced with increased rain intensity, in the order 40 > 60 > 80 mm/h (Table 2). At a slope gradient of 5°, for example, initial surface runoff generation time declined by 3.4 min and 0.87 min with increased rainfall intensity. Other slopes also showed similar changes, but with the increase of slope gradient, showed a gradual decrease. Subsurface runoff exhibited the same trend as surface runoff. With increasing rainfall intensity under the same slope gradient, more rainfall infiltrates into the soil groove per unit of time, and the soil quickly reaches saturation, which is conducive to slope surface and subsurface runoff generation. Under the same rainfall intensity, the initial surface runoff generation time advances with increasing slope gradient, in the order 5 > 10 > 15°, and the initial surface runoff generation time decreases gradually with increasing rainfall intensity. The initial subsurface runoff generation time was consistent with that of surface runoff. However, the decrease in slope gradient was not obvious. The initial subsurface runoff generation time lagged behind surface runoff, which is because soil water content begins to produce subsurface runoff when it reaches saturation, and the lag time decreases with increasing rainfall intensity and slope gradient.
The surface runoff rate increased with increasing rain intensity (Figure 3). Compared with a rainfall intensity of 40 mm/h at a slope of 15°, the average surface runoff rate at 60 and 80 mm/h increased by 2.38 and 3.60 times, respectively. Under the same rainfall intensity, the surface runoff rate increased with increasing slope gradient. At 60 mm/h, for example, the average surface runoff of 5, 10, and 15° slopes was 2.90, 3.2, and 3.6 L, respectively. Subsurface runoff rate showed an upward trend with rainfall (Figure 2). Under the same rainfall intensity, the subsurface runoff rate was 5 > 15 > 10°; as the slope increases, it tends to rise first and then decrease, which indicates a critical slope between 5 and 10°. Under the same slope gradients, the subsurface runoff rate decreased with increasing rainfall intensity, in the order 5 > 10 > 15°.
There is a significant difference in surface runoff under different rainfall intensities (p < 0.05), and there is no significant difference in subsurface runoff at 5° and 10° under 60 mm/h and 80 mm/h. There are also significant differences in surface runoff between slopes under the same rainfall intensity (p < 0.05), while there was no significant difference in subsurface runoff at 40 mm/h and 60 mm/h at 5° and 10° slopes (p < 0.05) (Table 3).
3.2. Effects of Rainfall Intensity and Slope Gradient on Nitrogen Loss on Slopes
Surface runoff N loss concentration initially decreased and then tended to stabilize with time under different treatments, indicating that the initial rainfall period is critical for nitrogen loss from surface runoff (Figure 4). This is because surface runoff initially removes some particulate nitrogen that is easily washed away [24]. Thus, surface runoff TN concentration will be relatively high at the beginning and show a sharp downward trend. Then, runoff scours the nitrogen on the soil surface and takes it away, so surface runoff TN eventually tends to be stable under different rainfall intensities. The lower the rain intensity, the earlier the TN loss concentration tends to stabilize, and this was most obvious in 5° slope conditions because higher surface runoff means faster runoff rates, resulting in shorter contact time between runoff and soil and, thus, lower surface runoff TN concentration. Under the same slope gradients, increased rainfall intensity significantly increased surface runoff TN loss concentration, but under the same rainfall intensity, surface runoff TN loss concentration increases showed a variation pattern of 10° > 15° > 5°.
Under the same rainfall intensity, subsurface runoff TN loss concentration initially decreased and then stabilized after runoff occurrence on both 5 and 10° slope gradients, and all of them tended to be stable after 60 min of rainfall. When the slope gradient was 15°, subsurface runoff TN loss concentration under different rainfall intensities initially rose and then decreased in the early stage, and then rose slightly and stabilized in the mid to late stage. This is maybe because the greater the slope gradient, the more water in the soil can readily move, and the more contact with the soil particles, the easier it is to dissolve nitrogen fixed on the soil particle surfaces and be lost with water runoff so that subsurface runoff TN concentration is higher [24]. Under the same slope gradients, TN loss concentration in the subsurface runoff decreased with increased rainfall intensity, i.e., 40 > 60 > 80 mm/h. Under 40 and 60 mm/h, with extended rainfall, subsurface runoff gradually decreased, then increased, and finally stabilized. However, under 80 mm/h, TN concentration loss decreased with extended rainfall time. This is because subsurface runoff at the beginning was low; moreover, free TN concentration in the soil was higher, and the greater the rain intensity, the more subsurface runoff, causing a dilution effect and a decrease in subsurface runoff TN concentration with increasing rain intensity.
There is a significant difference in TN loss in surface runoff under different rainfall intensities (p < 0.05), while there was no significant difference in TN loss in subsurface runoff under a 5° slope (p < 0.05). Under the same rainfall conditions, there is a significant difference in TN loss in surface runoff between different slopes (p < 0.05), and there is a significant difference in TN loss in subsurface runoff among different slopes under 40 rain-fall intensity (p < 0.05) (Table 4).
3.3. Runoff Coefficients of Surface Runoff and Subsurface Runoff
At the same slope gradient, the surface runoff coefficient (αs) increased with increased rainfall intensity (Figure 5) and was linearly positively correlated with it (Table 5). Conversely, under the same rainfall intensity, as the slope increases, the subsurface runoff coefficient (αi) decreases and is linearly negatively correlated with rainfall intensity (Table 5). Under the same slope gradients, αi decreased with increasing rainfall intensity, in the order 5 > 10 > 15°.
The effects of rainfall intensity and slope gradient on runoff coefficients were complementary. A correlation between αs and slope gradients S was not obvious, and the fitting effect was poor (Table 5). At 40 and 60 mm/h, αs was 15 > 5 > 10°, but at 80 mm/h, it was 10 > 15 > 5°, and the correlation coefficient did not change. The fitting effect between αi and slope gradient S increased with increasing slope under different rainfall intensities, the R2 of all rainfall intensities was <0.60, and the fitting effect was poor, while the correlation coefficient decreased with increasing slope. The surface runoff coefficient αs was mainly affected by rainfall intensity, while the subsurface runoff coefficient αi was mainly affected by slope.
3.4. Slope Surface Runoff, Nitrogen Loss Distribution and Runoff Modulus
The slope remains unchanged, and the proportion of surface runoff in total runoff increased with increasing rainfall intensity (Table 6). As rainfall intensity increases, the effective precipitation per unit time also increases, which accelerates soil aggregate fragmentation, and the surface crust reduces the soil infiltration rate, increasing the proportion of surface runoff and decreasing the proportion of subsurface runoff. On different slope gradients, the proportion of surface runoff under the same rainfall intensity was basically the same, which is caused by low rainfall infiltration. The sum of surface runoff and subsurface runoff is the total runoff, so the proportion of subsurface runoff in total runoff is the opposite of surface runoff.
Under the same slope conditions, the proportion of nitrogen loss in subsurface runoff to total nitrogen loss decreased with increasing rainfall intensity (Table 7). This is because subsurface runoff is generated by infiltration and can dissolve and migrate nitrogen in the soil, while surface runoff can only take away nitrogen in the surface soil, which is easy to lose, but the total amount is limited. There was no obvious nitrogen loss pattern in subsurface runoff with slope at the same rainfall intensity, indicating that the critical slope gradient differed under different rainfall intensities.
Subsurface runoff generation lags behind that of surface runoff, but there is a period of time when they occur together, and total runoff in this period is called mixed runoff [25]. The order of different runoff modulus (runoff per unit area per unit time) types was mixed > surface > subsurface runoff (Figure 6). On different slope gradients at the same rainfall intensity, surface, subsurface, and mixed runoff moduli were basically the same. The mixed runoff modulus was the highest under different slope gradients and rain intensities, and it increased significantly with increasing rain intensity on the same slope gradients. The runoff modulus variation of surface and mixed runoff was similar. With increasing rainfall intensity, the subsurface runoff modulus initially decreased, then increased, but was lower than surface runoff.
3.5. Factors Influencing Slope Surface Runoff and Nitrogen Loss
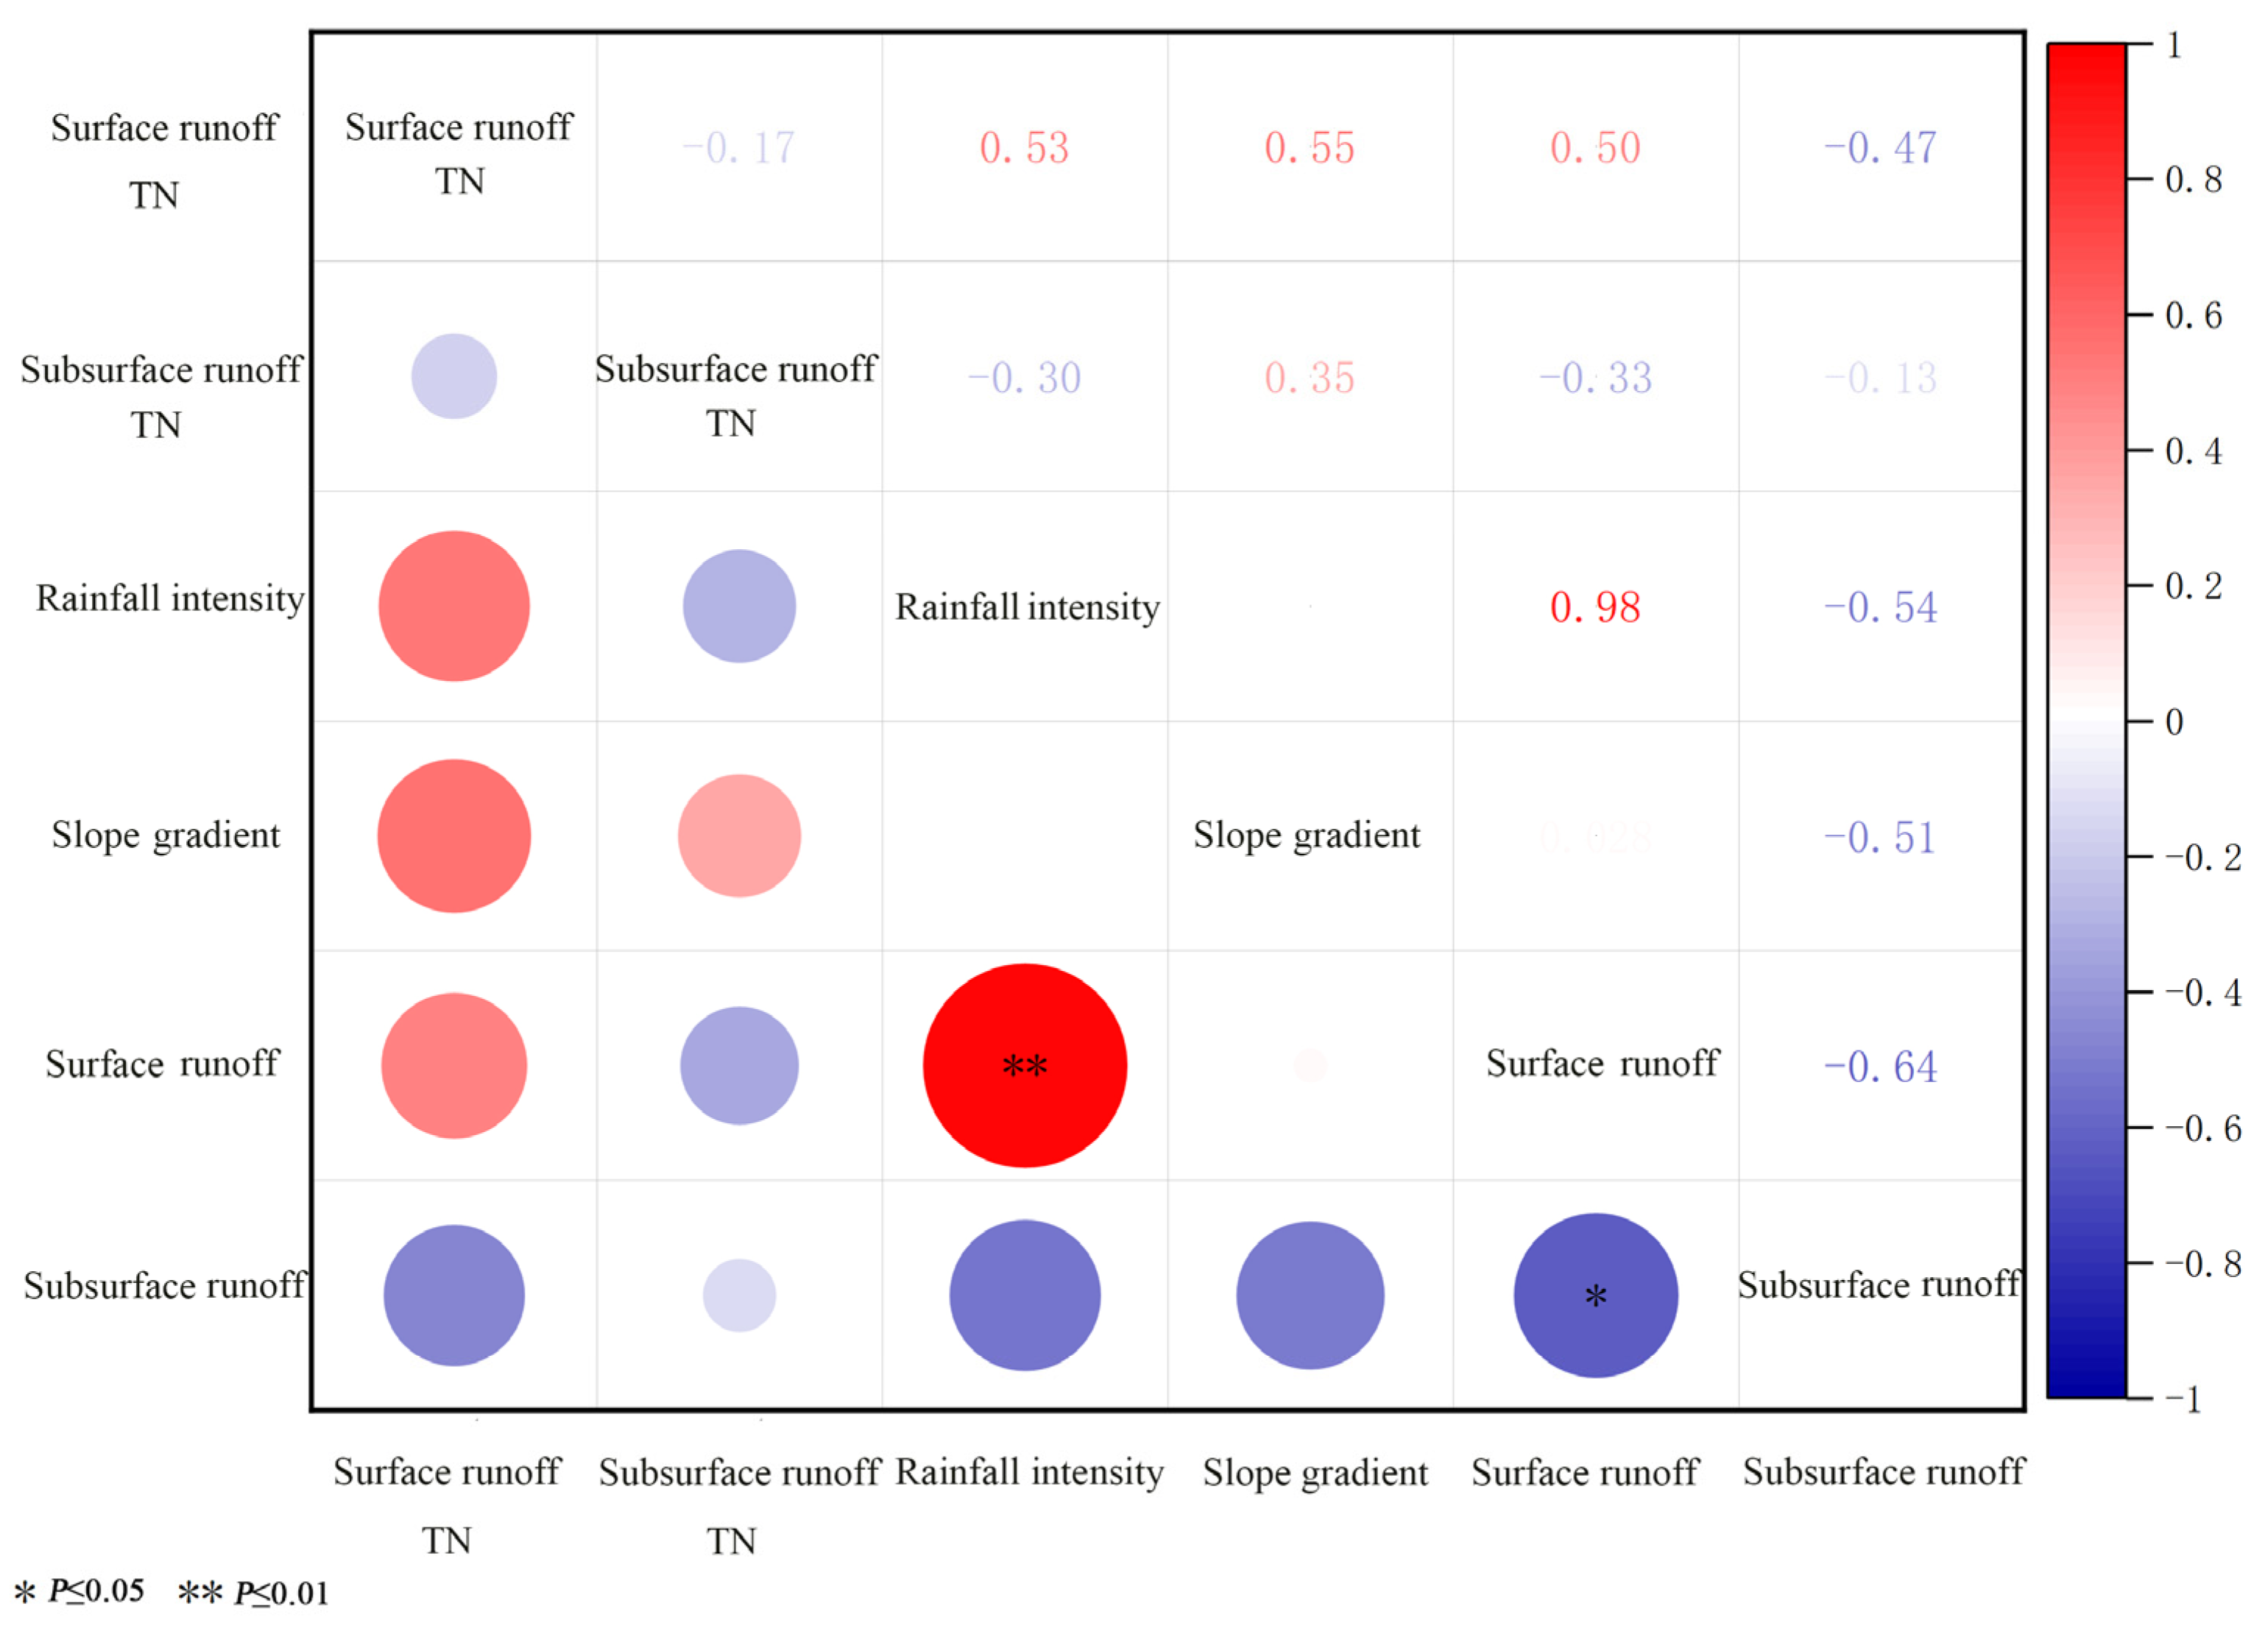
There is a highly significant positive correlation between rainfall intensity and surface runoff (p < 0.01). Rainfall is the primary generator of surface runoff, and rainfall intensity affects the amount of rainfall. When the underlying surface conditions are the same, slope surface runoff is greater with higher rainfall, and the slope gradient, as a topographic factor, cannot cause surface runoff; instead, it mainly affects runoff at the outlet in terms of slope-rainfall bearing capacity and soil infiltration rate. Slope gradient and rainfall intensity promote slope runoff and nitrogen loss.
To quantify the contribution rate of various factors to sediment production in slope surface runoff, we calculated the interaction between different influencing factors on nitrogen loss (Figure 7). Rainfall intensity and slope significantly affect runoff generation and nitrogen loss. Contribution rates to surface and subsurface runoff were in the order of rainfall intensity > rainfall intensity and slope gradient interactions > slope gradient (Table 8). Among them, the contribution of rainfall intensity was the highest, with surface runoff being 99.6% and subsurface runoff being 52.8%. Contribution rates to total nitrogen loss of surface flow were in the order of slope gradient > rainfall intensity > slope gradient and rainfall intensity interactions. The contribution rate of slope gradient was the highest, at 66.8%. Contribution rates to total nitrogen loss in subsurface runoff were in the order of rainfall intensity and slope gradient interactions > slope gradient > rainfall intensity. Interactions between rainfall intensity and slope gradient contributed the most, at 44.1%. Overall, rainfall intensity significantly affected slope surface runoff, and slope gradient significantly affected nitrogen loss.
4. Discussion
The main factors influencing soil erosion on the slopes of Miyun Reservoir are rainfall intensity and slope gradient. As rainfall intensity increased from light (40 mm/h) to moderate (60 mm/h) to extreme (80 mm/h), both surface and subsurface runoff increased. Compared with a rainfall intensity of 40 mm/h at a slope of 15°, the average surface runoff rate at 60 mm/h and 80 mm/h increased 2.38 and 3.60 times, respectively. This may be because during runoff, rainfall kinetic energy acts on the soil surface. The intensity of rainfall determines the runoff magnitude [26]. Therefore, the soil erosion rate increases with the increase in rainfall intensity [27]. The main form of runoff generation was surface runoff, with a proportion of surface runoff in total runoff of 75.77 to 96.16%.
Rainfall intensity remains unchanged; the surface runoff rate increased with increasing slope gradient, in the order 5 > 15 > 10°, and tended to initially rise and then decrease, indicating that there was a critical slope between 5 and 10°. This may be due to a decreasing slope gradient significantly increasing the time to reach the maximum surface runoff rate while reducing the surface runoff. When the slope gradient increases, part of the water is more permeable and flows down the slope by gravity. Consequently, surface runoff also increases with increasing slope gradient, while subsurface runoff decreases. Compared to slopes with high gradients, those with lower slope gradients better inhibit soil particle loss with runoff during rainfall [28]. Slope gradient is also the main influencing factor of soil erosion. As the slope increases, surface runoff increases, infiltration rate decreases, and surface erosion increases [29]. In this study, surface, subsurface, and mixed runoff modulus increased with slope gradient. However, the subsurface runoff, subsurface runoff rate, and subsurface runoff modulus decrease with increasing slope gradient. Low slope gradients better inhibit the downward loss of soil particles from runoff during rainfall [30]. Compared with single influencing factors, comprehensive interactions between rainfall intensity and slope gradient had a more obvious impact on the slope surface runoff mode. Furthermore, the need to comprehensively understand the interactions between influencing factors in the slope erosion process was demonstrated.
The main influencing factors of soil nitrogen loss are rainfall and runoff. In this study, runoff TN concentration fluctuated at the beginning of surface runoff and began to stabilize after 60 min. For example, on a 5° slope, the average TN loss in surface runoff under rainfall intensity of 80 mm/h was 1.28 times that of 60 mm/h, and in subsurface runoff was 1.03 times that of 60 mm/h rainfall. Therefore, rainfall intensity had a significant effect on soil nitrogen loss. On a 5° slope, below subsurface TN loss under 80 mm/h and 60 mm/h rainfall conditions was 1.53 and 1.92 times greater than on the surface. Therefore, subsurface runoff loss was greater than surface runoff loss, potentially making pollution of groundwater sources more serious, especially in areas with shallow soils and those with underground pores and fissures. Moreover, northern soils and those in rocky mountainous areas are looser, and their water is more prone to infiltration, which washes away the soil nitrogen. Therefore, in such areas, subsurface runoff often plays a decisive role in nitrogen loss. In practical application, the occurrence of subsurface runoff should be prevented or reduced, for example, by fertilizing to increase soil water-holding capacity. The nitrogen loss in karst areas of South China is mainly carried by groundwater runoff, and this experiment is consistent with this situation [31]. Gao et al. showed that the surface TN loss rate was greater when the rainfall intensity was ≥50 mm/h and was the main cause of TN loss [32].
Our results show that slope gradient and rainfall intensity can promote runoff, with rainfall intensity having the greatest impact on surface runoff, contributing 99.6%. The slope gradient contributed the most to total nitrogen loss from surface runoff, at 66.8%. The interaction between rainfall intensity and slope gradient contributed the most to total nitrogen loss in the subsurface runoff, at 44.1%. As rainfall intensity increases, raindrop erosion capacity increases, and soil particle dispersion increases. Increased rainfall intensity will increase runoff erosive forces and sediment-carrying capacity [33]. The slope gradient increases the slope rain-bearing area, which leads to increased runoff and flow velocity, and then water flow erosion capacity increases, which promotes slope surface erosion in the gullies. Compared with Li et al., who qualitatively studied the interaction between rainfall intensity, slope gradient, and slope length, we considered the quantitative contribution of rainfall intensity, slope gradient, and the interaction of various factors to runoff and sediment production [34]. Our approach may better reflect the relationship between the comprehensive effects of influencing factors and slope surface runoff and nitrogen loss.
The slope gradient in the Miyun reservoir area has an important impact on nitrogen loss, especially on steep slopes, which could be slowed down by reducing the slope gradient. However, we did not consider the underground migration of nutrients. Although the loss of underground nitrogen is higher than on the surface, due to its special geographical location, it is difficult to control the loss of underground nitrogen. Therefore, preventing and controlling groundwater pollution is of great significance for controlling non-point source pollution. Additionally, agricultural fertilizer use could be reduced [35], or alternatively, increasing vegetation cover would reduce nutrient loss on the slope surface [36]. This may help to mitigate the effects of rainfall on nitrogen and underground seepage in cultivated soils, thereby increasing yields and preventing pollution.
Although the effects of rainfall intensity and slope gradient on slope erosion in the Miyun Reservoir area were analyzed and a critical slope gradient determined, slope length was not considered. In the future, slope length characteristics will be added, and runoff and nutrient loss at critical slope lengths will be discussed. We only considered the contributions of rainfall intensity and slope gradient to erosion, but the contribution of one factor depended on changes in others, and these interactions need to be more fully addressed.
5. Conclusions
Initial runoff generation time gradually decreases with increasing rainfall intensity and slope gradient. Initial subsurface runoff generation time lags behind that of surface runoff but decreases with increasing rainfall intensity and slope gradient. Surface runoff rate increased with increasing rainfall intensity and slope gradient, and the subsurface runoff rate showed an upward trend with increasing rainfall intensity, initially increasing and then decreasing with increasing slope gradient. Surface runoff TN loss concentration initially decreased and then stabilized with time. Rainfall intensity has a significant effect on the change of TN loss concentration in surface runoff. The concentration of TN loss in the subsurface runoff decreased with increasing rainfall intensity.
The effects of rainfall intensity and slope gradient on surface and subsurface runoff coefficients were complementary. The main runoff loss path from slopes is surface runoff, and the main path of nitrogen loss is subsurface runoff. The order of different runoff modulus types was mixed > surface > subsurface runoff. Rainfall intensity significantly affected the slope subsurface, and slope gradient significantly affected nitrogen loss.
Author Contributions
Conceptualization, N.W. and L.W.; Methodology, J.X. and Z.Y.; Resources, D.W. and L.J.; Software, J.W. (Junqiang Wang) and M.P.; Supervision, Y.L.; Visualization, L.W.; Writing—Original Draft, N.W. and L.W.; Writing—Review and Editing, N.W., L.W., L.J., J.W. (Jiajun Wu), M.P., D.W., Y.L., J.W. (Junqiang Wang), T.X., Z.Y. and J.X. All authors have read and agreed to the published version of the manuscript.
Funding
This research was funded by the National Key R&D Plan (2022YFD1500200-1), the Science and Technology Capacity Improvement Project of Beijing Academy of Agricultural and Forestry Sciences (ZHS202304), the general program of NSFC (41977095), the Beijing Academy of Agricultural and Forestry Sciences Youth Fund (QNJJ202214), Research Business Fee Project of Heilongjiang Provincial Research Institute (CZKYF2023-1-B006), Outstanding Youth Fund Project of Heilongjiang Academy of Agricultural Sciences (2021JCQN004), Beijing Postdoctoral Fund, Postdoctoral Research Fund of Beijing Academy of Agricultural and Forestry Sciences (2020-ZZ-026), Beijing Academic Program.
Data Availability Statement
Data are contained within the article.
Acknowledgments
We appreciate and thank the anonymous reviewers for their helpful comments that led to an overall improvement of the manuscript. We also thank the Journal Editor Board for their help and patience throughout the review process.
Conflicts of Interest
The authors declare no conflict of interest.
References
- Deng, Y.; Tang, D.S.; Li, Y.Y.; Meng, C.; Liu, H.; Li, X.; Li, Q.; Wu, J. Influences of riparian landscape pattern on river phosphorus output in typical subtropical agroforestry mixed watershed. J. Soil Water Conserv. 2022, 36, 64–70. [Google Scholar]
- Chen, Z.F.; Gong, A.M.; Ning, D.W.; Zhang, L.; Wang, J.; Xiang, B. Characteristics of soil erosion and nutrient loss in Yunnan Province based on RUSLE model. J. Soil Water Conserv. 2021, 35, 7–14. [Google Scholar]
- Gao, Y.L.; Li, H.B. Influence of landscape pattern change on soil erosion in Han River Basin. Acta Ecol. Sin. 2021, 41, 2248–2260. [Google Scholar]
- Sun, R.H.; Sun, L.; Su, X.K.; Chen, L. Study on the coupling of landscape pattern and ecological process: Inheritance and innovation. Acta Ecol. Sin. 2021, 41, 415–421. [Google Scholar]
- Wang, L.; Li, Y.; Wu, J.; An, Z.; Suo, L.; Ding, J.; Li, S.; Wei, D.; Jin, L. Effects of the Rainfall Intensity and Slope Gradient on Soil Erosion and Nitrogen Loss on the Sloping Fields of Miyun Reservoir. Plants 2023, 12, 423. [Google Scholar] [CrossRef] [PubMed]
- Zheng, W.; Lan, R.; Zhangzhong, L.; Yang, L.; Gao, L.; Yu, J. A Hybrid Approach for Soil Total Nitrogen Anomaly Detection Integrating Machine Learning and Spatial Statistics. Agronomy 2023, 13, 2669. [Google Scholar] [CrossRef]
- Luo, L.X.; Gao, B.; Yan, X.Y.; Jiang, X.; Dun, C. Contribution of agricultural sources to water nitrogen pollution in the Taihu Lake Lake area: A case study of Yili River basin. J. Agro-Environ. Sci. 2015, 34, 2318–2326. [Google Scholar]
- Deng, L.; Zhang, L.; Fan, X.; Wu, Y.; Sun, T.; Fei, K. Characteristics of runoff and sediment yield under different rainfall intensities and slope gradients in erosive weathered granite area. Trans. Chin. Soc. Agric. Eng. 2018, 34, 143–150. [Google Scholar]
- Ge, J.; Yang, J.; Zhan, M.; Dai, S.; Sheng, J. Experimental Study on the Influence of Slope and Rainfall Intensity on Slope Erosion and Sediment Production Process. Water Resour. Power 2015, 33, 101–104. [Google Scholar]
- Zhang, X.Q.; Gu, L.B.; Zhang, K.L. Effects of slope on abortion and sediment production on slope in northwest Guizhou. J. Soil Water Conserv. 2015, 29, 18–22. [Google Scholar]
- Tan, Z.X.; Wang, Z.L.; Wang, S.; Liu, J. The erosion process of fine gullies on loess slopes. Sci. Soil Water Conserv. 2012, 10, 1–5. [Google Scholar]
- Wang, Y.Z.W. Improved interrill erosion prediction by considering the impact of the near-surface hydraulic gradient. Soil Tillage Res. 2020, 203, 104687. [Google Scholar] [CrossRef]
- Bai, L.; Shi, P.; Li, Z.; Li, P.; Wang, W.; Zhao, Z.; Dong, J. The synergistic effect of terraced fields and siltation dam slope and gully control measures on runoff and sediment production in the Loess Plateau. J. Agric. Eng. 2023, 39, 96–104. [Google Scholar]
- Shi, P.; Schulin, R. Erosion-induced losses of carbon, nitrogen, phosphorus and heavy metals from agricultural soils of contrasting organic matter management. Sci. Total Environ. 2018, 618, 210–218. [Google Scholar] [CrossRef] [PubMed]
- Deng, L.Z.; Fei, K.; Sun, T.Y.; Zhang, L.P.; Fan, X.J.; Ni, L. Characteristics of runoff processes and nitrogen loss via surface flow and interflow from weathered granite slopes of Southeast China. J. Mt. Sci. 2019, 16, 1048–1064. [Google Scholar] [CrossRef]
- Liu, J.; Ouyang, X.Q.; Shen, J.L.; Li, Y.; Sun, W.R.; Jiang, W.Q.; Wu, J.S. Nitrogen and phosphorus runoff losses were influenced by chemical fertilization but not by pesticide application in a double rice-cropping system in the Subtropical Hilly Region of China. Sci. Total Environ. 2020, 715, 136852. [Google Scholar] [CrossRef] [PubMed]
- Chen, G.; Elliott, J.A.; Lobb, D.A.; Flaten, D.N.; Braul, L.; Wilson, H.F. Changes in runoff chemistry and soil fertility after multiple years of cattle winter bale feeding on annual cropland on the Canadian prairies. Agric. Ecosyst. Environ. 2017, 240, 1–13. [Google Scholar] [CrossRef]
- Wu, Y.H.; Zhang, L.P.; Deng, L.Z.; Fan, X.J. Simulation of slope and rainfall intensity effects of slope nitrogen loss. J. Soil Water Conserv. 2018, 32, 27–33. [Google Scholar]
- Wang, J.; Chen, J.; Jin, Z.; Guo, J.; Yang, H.; Zeng, Y.; Liu, Y. Simultaneous removal of phosphate and ammonium nitrogen from agricultural runoff by amending soil in lakeside zone of Karst area, Southern China. Agric. Ecosyst. Environ. 2020, 289, 106745. [Google Scholar] [CrossRef]
- Wang, L.; Wu, J.; Xie, J.; Wei, D.; Li, Y.; Wang, J.; Xu, T.; Yang, Z.; Jin, L. Effects of Different Hedgerow Patterns on the Soil Physicochemical Properties, Erodibility, and Fractal Characteristics of Slope Farmland in the Miyun Reservoir Area. Plants 2022, 11, 2537. [Google Scholar] [CrossRef]
- Bao, S. Soil agrochemical analysis. China Agricultural Publishing. 2000.
- Villatoro, S.M.; Bissonnais, Y.L.; Moussa, R.; Rapidel, B. Temporal dynamics of runoff and soil loss on a plotscale under a coffee plantation on steep soil (Ultisol), Costa Rica. J. Hydrol. 2015, 523, 409–426. [Google Scholar] [CrossRef]
- Li, Y.; Jin, L.; Wu, J.; Shi, C.; Li, S.; Xie, J.; An, Z.; Suo, L.; Ding, J.; Wei, D.; et al. Laws Governing Nitrogen Loss and Its Numerical Simulation in the Sloping Farmland of the Miyun Reservoir. Plants 2023, 12, 2042. [Google Scholar] [CrossRef] [PubMed]
- Peng, X.; Dai, Q.; Ding, G.; Li, C. Role of underground leakage in soil, water and nutrient loss from a rock-mantled slope in the Karst rocky desertification area. J. Hydrol. 2019, 578, 124086. [Google Scholar] [CrossRef]
- Hoffman, A.R.; Polebitski, A.S.; Penn, M.R.; Busch, D.L. Long-term Variation in Agricultural Edge-of-Field Phosphorus Transport during Snowmelt, Rain, and Mixed Runoff Events. J. Environ. Qual. 2019, 48, 931–940. [Google Scholar] [CrossRef] [PubMed]
- Zhang, Y.; Wu, H.; Yao, M.; Zhou, J.; Wu, K.; Hu, M.; Shen, H.; Chen, D. Estimation of nitrogen runoff loss from croplands in the Yangtze River Basin: A meta-analysis. Environ. Pollut. 2021, 272, 116001. [Google Scholar] [CrossRef]
- Pan, C.; Ma, L.; Wainwright, J. Particle selectivity of sediment deposited over grass barriers and the effect of rainfall. Water Resour Res. 2016, 52, 7963–7979. [Google Scholar] [CrossRef]
- Yuan, Z.; Chu, Y.; Shen, Y. Simulation of surface runoff and sediment yield under different land-use in a Taihang Mountains watershed, North China. J. Soil Tillage Res. 2015, 153, 7–19. [Google Scholar] [CrossRef]
- Wu, L.; Peng, M.; Qiao, S.; Ma, X.Y. Effects of rainfall intensity and slope gradient on runoff and sediment yield characteristics of bare loess soil. Environ. Sci. Pollut. Res. Int. 2018, 25, 3480–3487. [Google Scholar] [CrossRef]
- Li, H.; He, R.; Hu, J.; Zhou, Y.; Xie, M.; Deng, W.; Wang, J.; Zhao, W.; Zhang, S.; Jiang, Y.; et al. Identifying conservation priority zones and their driving factors regarding regional ecosystem services. Environ. Dev. Sustain. 2023, 1–23. [Google Scholar] [CrossRef]
- Song, X.; Gao, Y.; Green, S.M.; Dungait, J.A.J.; Peng, T.; Quine, T.A.; Xiong, B.; Wen, X.; He, N. Nitrogen loss from Karst area in China in recent 50 years: An in-situ simulated rainfall experiment’s assessment. Ecol. Evol. 2017, 7, 10131–10142. [Google Scholar] [CrossRef]
- Gao, R.; Dai, Q.; Gan, Y.; Peng, X.; Yan, Y. The production processes and characteristics of nitrogen pollution in bare sloping farmland in a Karst region. Environ. Sci. Pollut. Res. 2019, 26, 26900–26911. [Google Scholar] [CrossRef]
- Yang, F. Research on Particles Detachment and Transport Processes of the Slope in Beijing Mountainous Area. Ph.D. Thesis, Beijing Forestry University, Beijing, China, 2016. [Google Scholar]
- Li, J.L.; Cai, Q.G.; Sun, L.Y. Analysis of interaction effects of rainfall intensity, slope degree and slope length on rill erosion. Sci. Soil Water Conserv. 2011, 9, 8–13. [Google Scholar]
- Fan, J.; Lu, X.; Gu, S.; Guo, X. Improving nutrient and water use efficiencies using water-drip irrigation and fertilization technology in Northeast China. Agric. Water Manag. 2020, 241, 106352. [Google Scholar] [CrossRef]
- Chengren, O.; Kaixian, W.; Bozhi, W. Characteristics of Flow Hydraulics and Soil Erosion in Maize and Potato Intercropping Systems. J. Soil Sci. Plant Nutr. 2023, 23, 5097–5108. [Google Scholar]
Figure 1.
Schematic diagram and physical diagram of experimental structure.
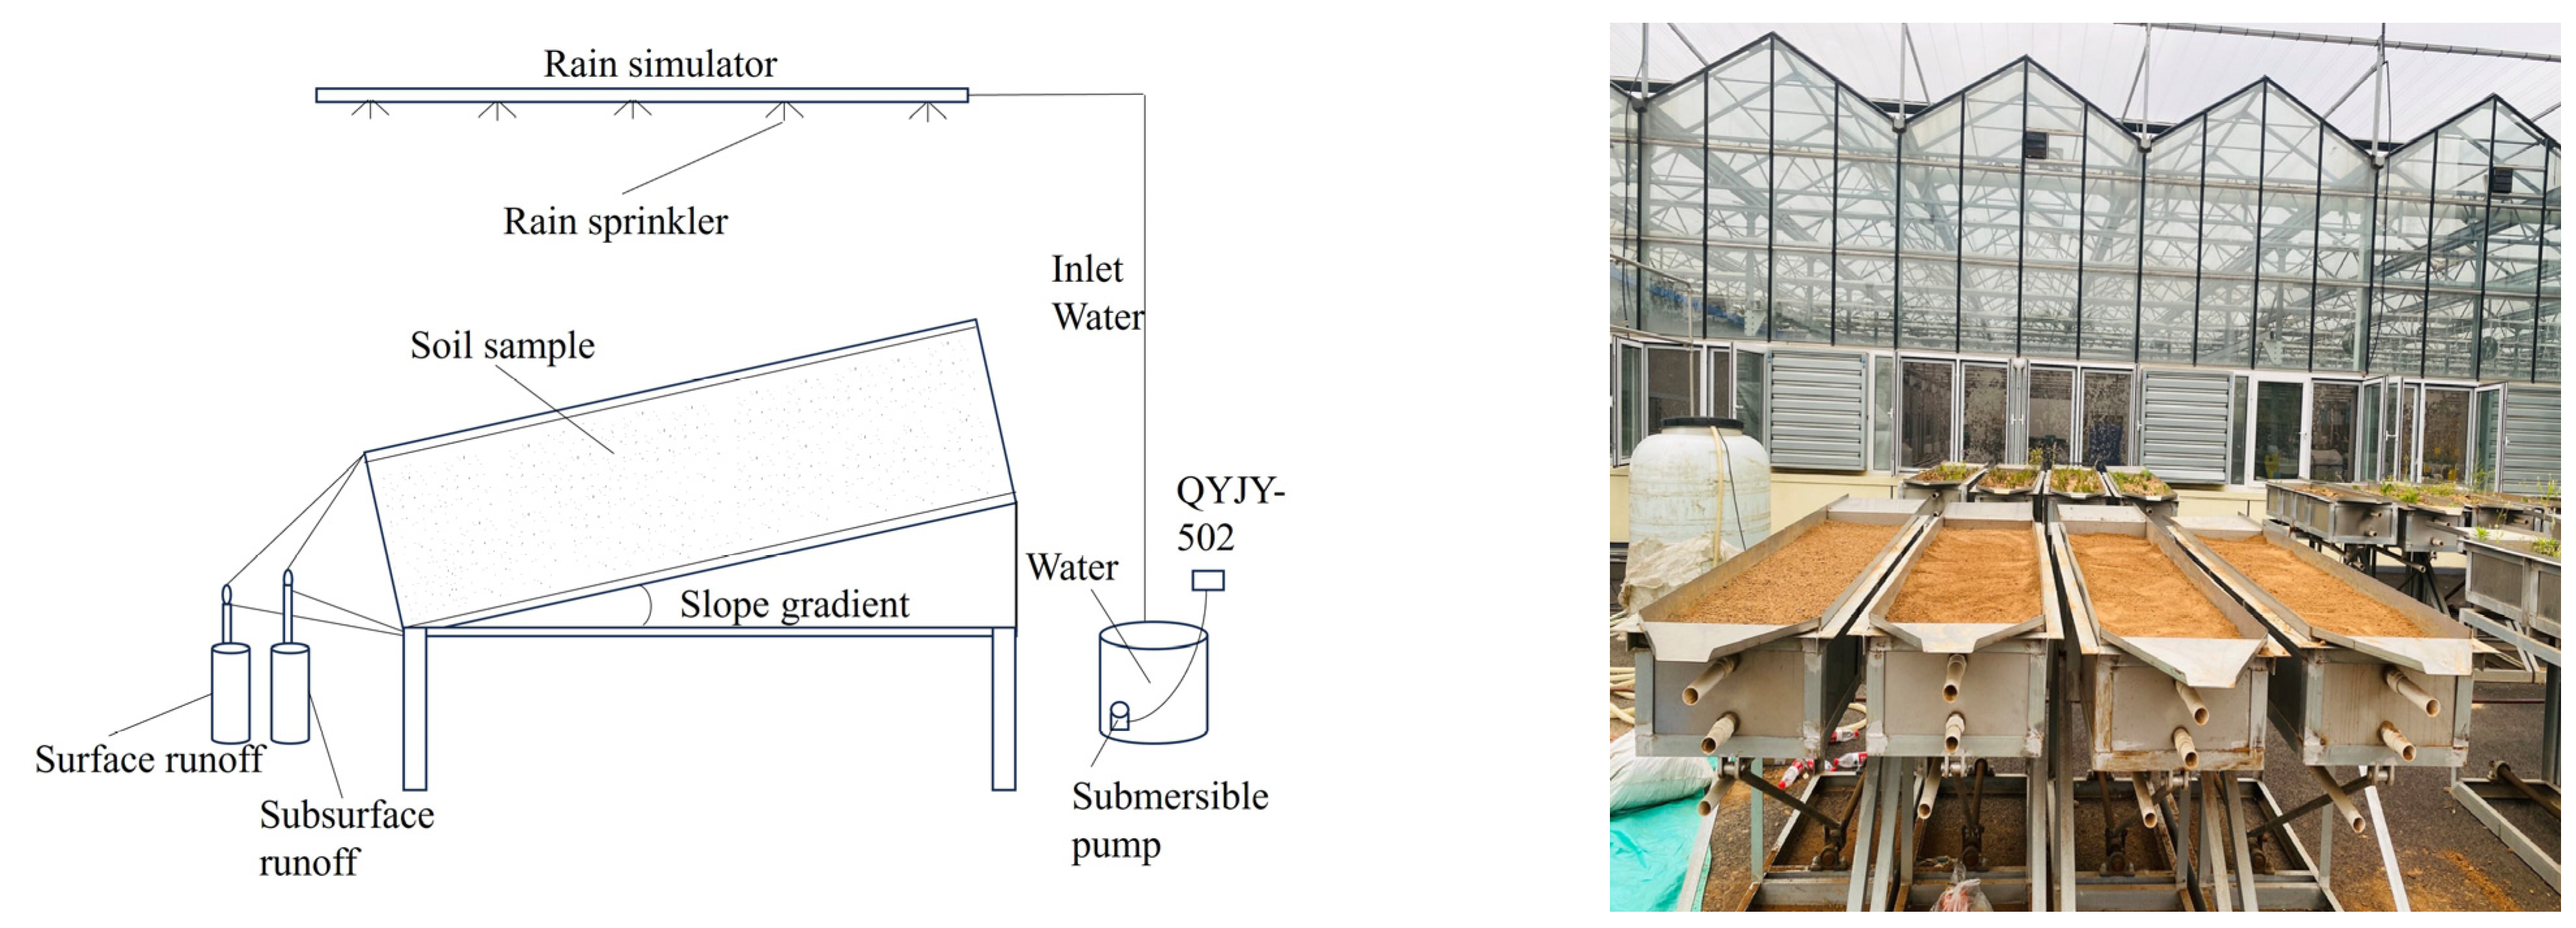
Figure 2.
Location of the study area.
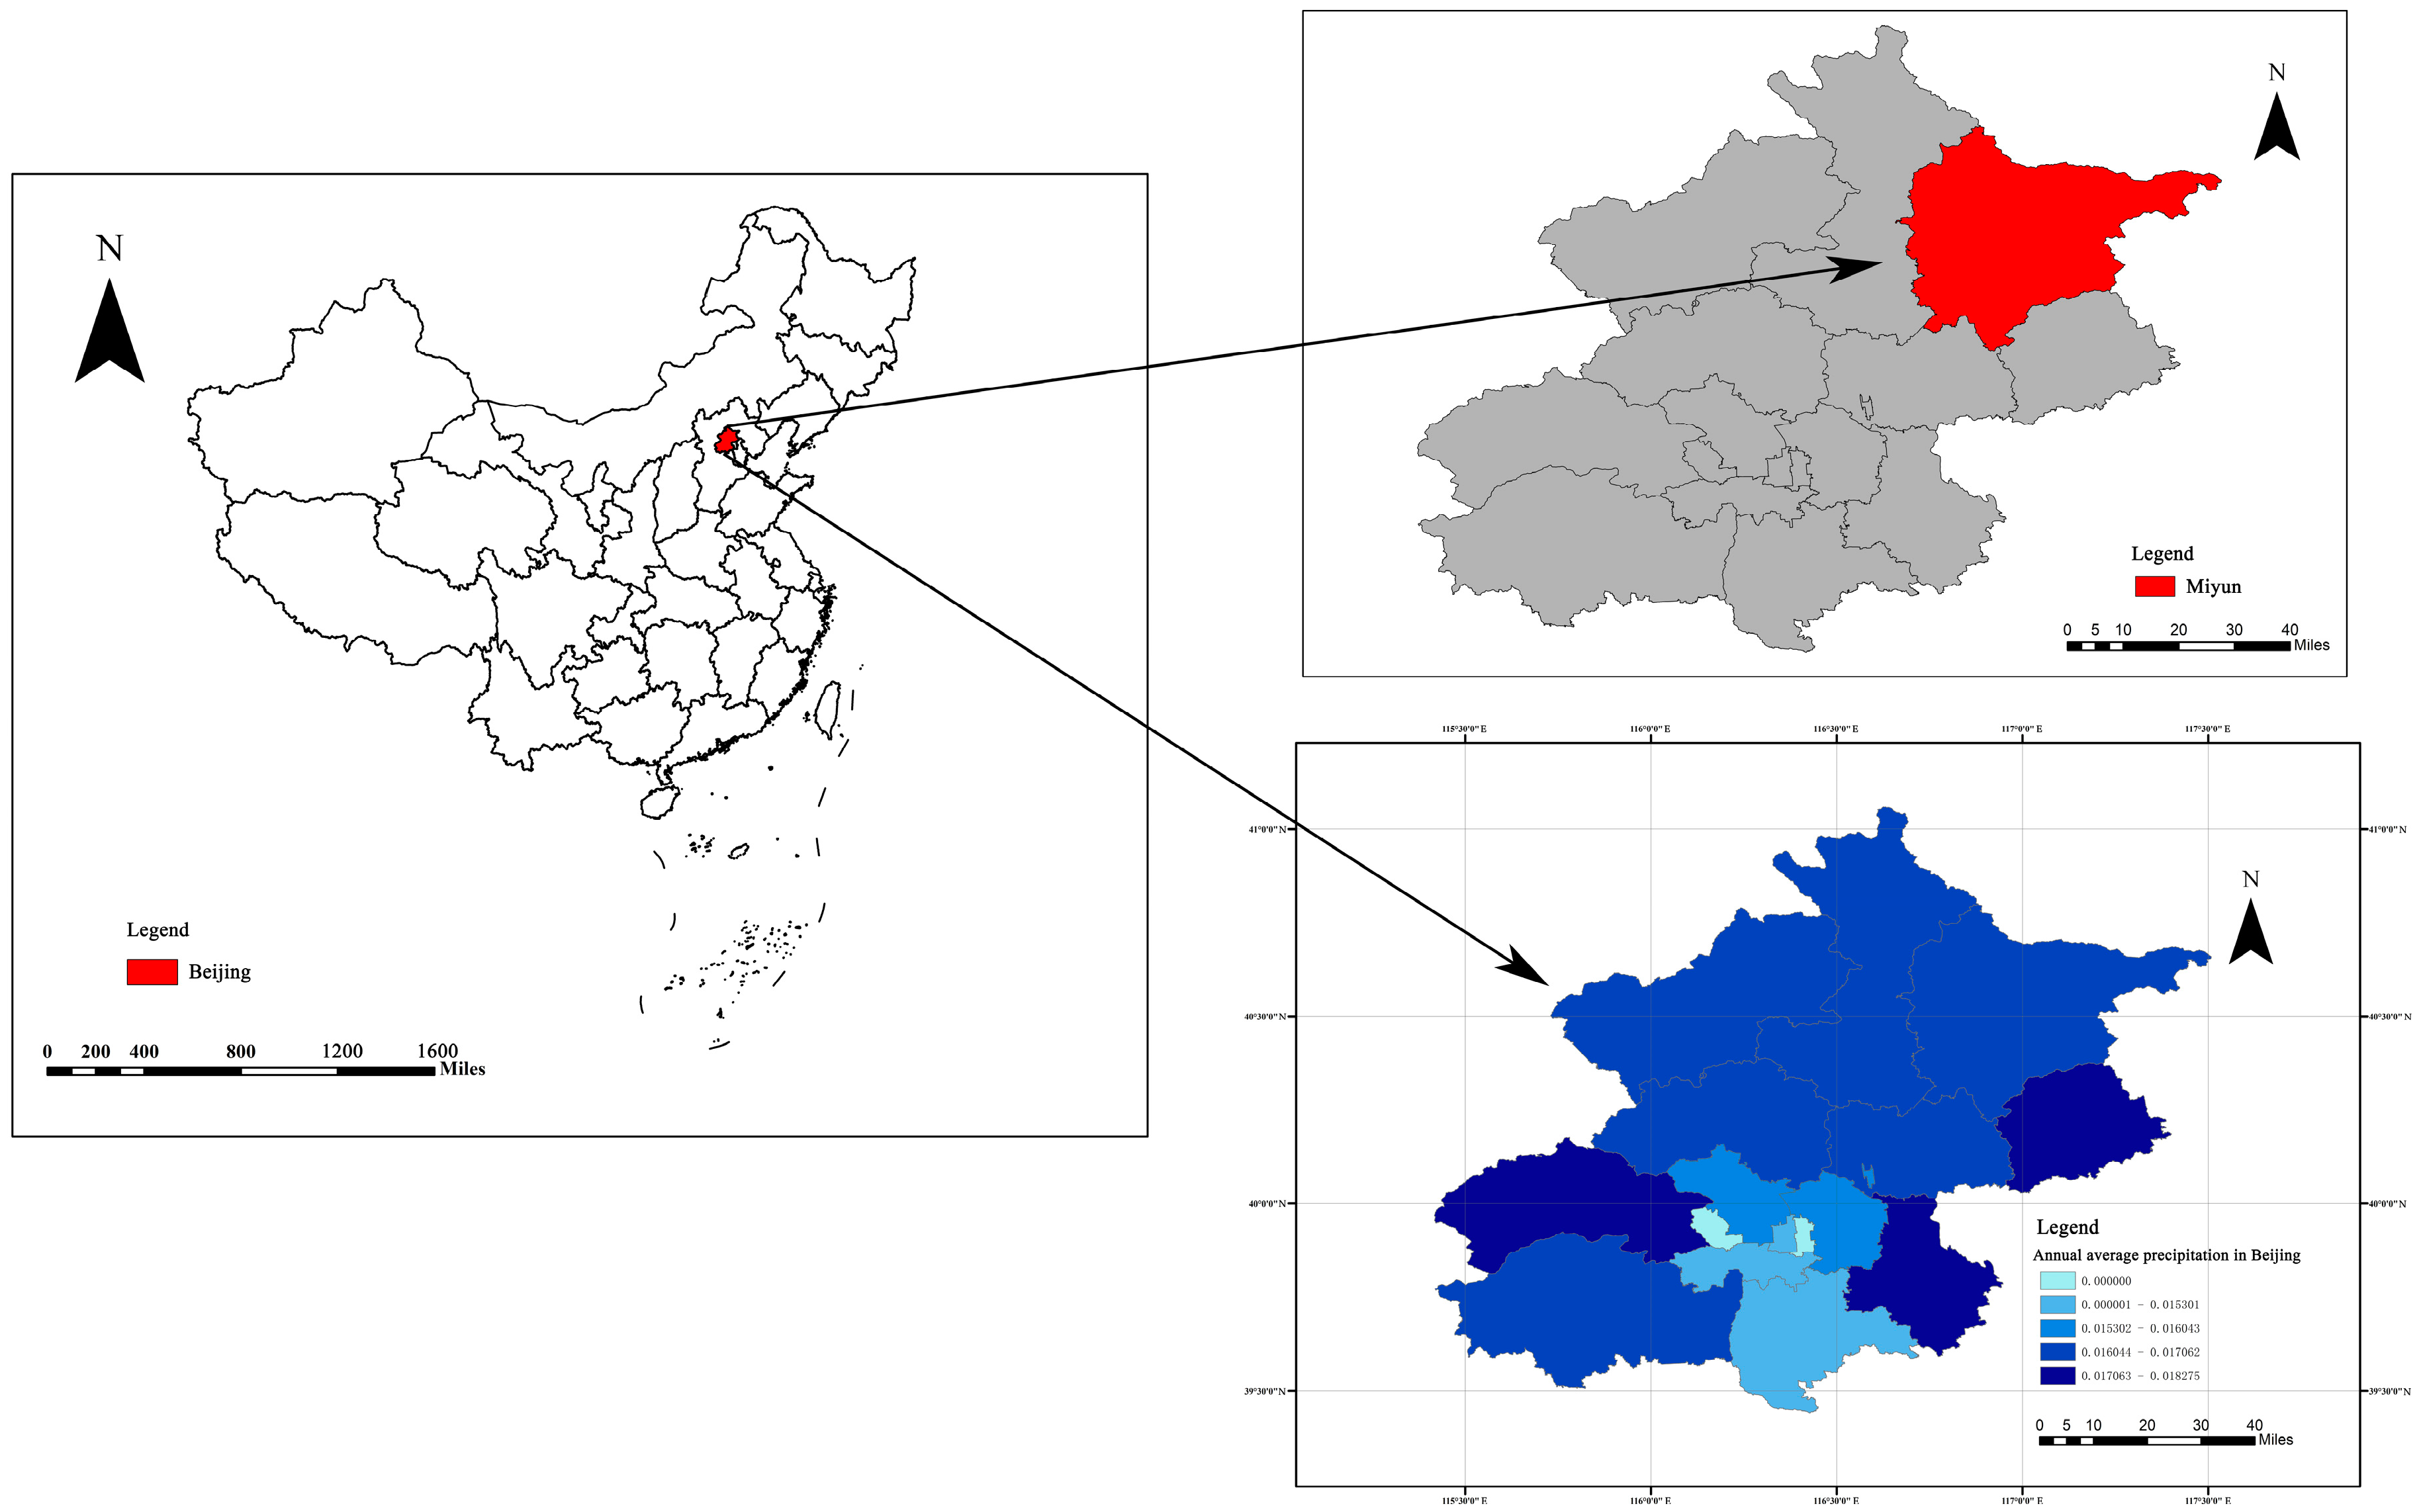
Figure 3.
Runoff rate under different slope gradient and rainfall intensity.

Figure 4.
Surface runoff and subsurface runoff TN loss under different slope gradient and rainfall intensity.
Figure 4.
Surface runoff and subsurface runoff TN loss under different slope gradient and rainfall intensity.
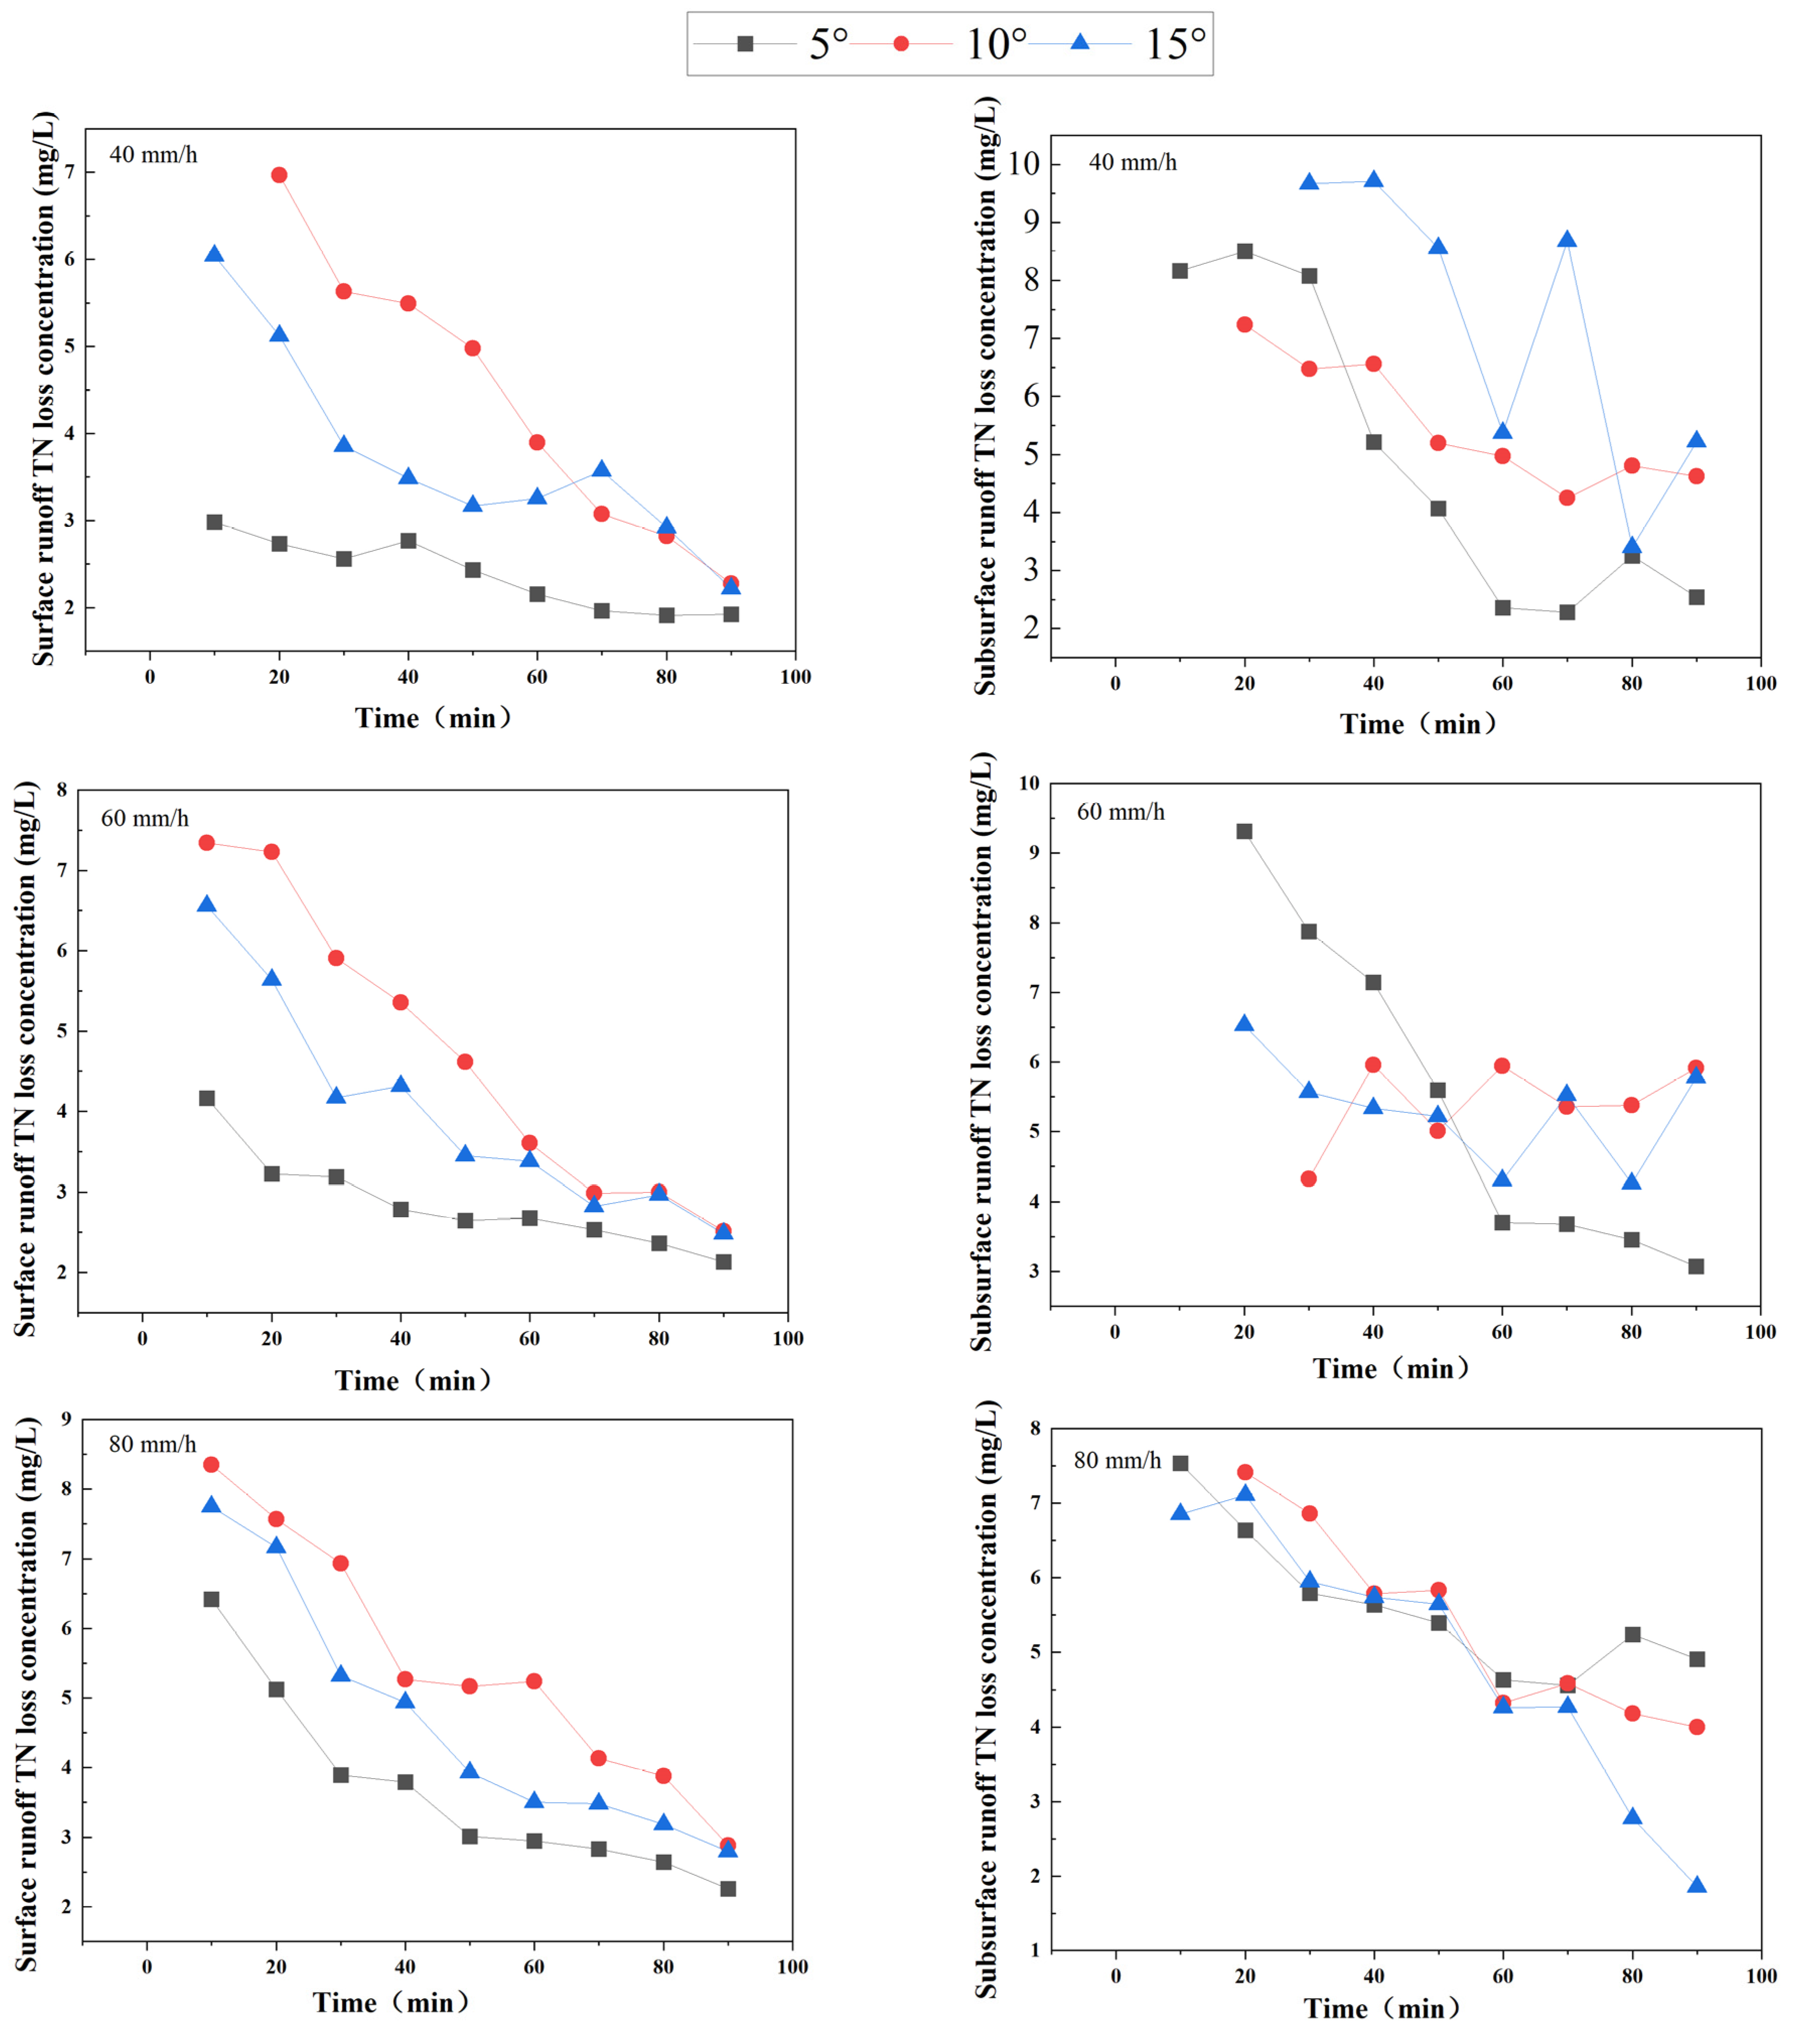
Figure 5.
Runoff coefficient under different slope gradients and rainfall intensity.
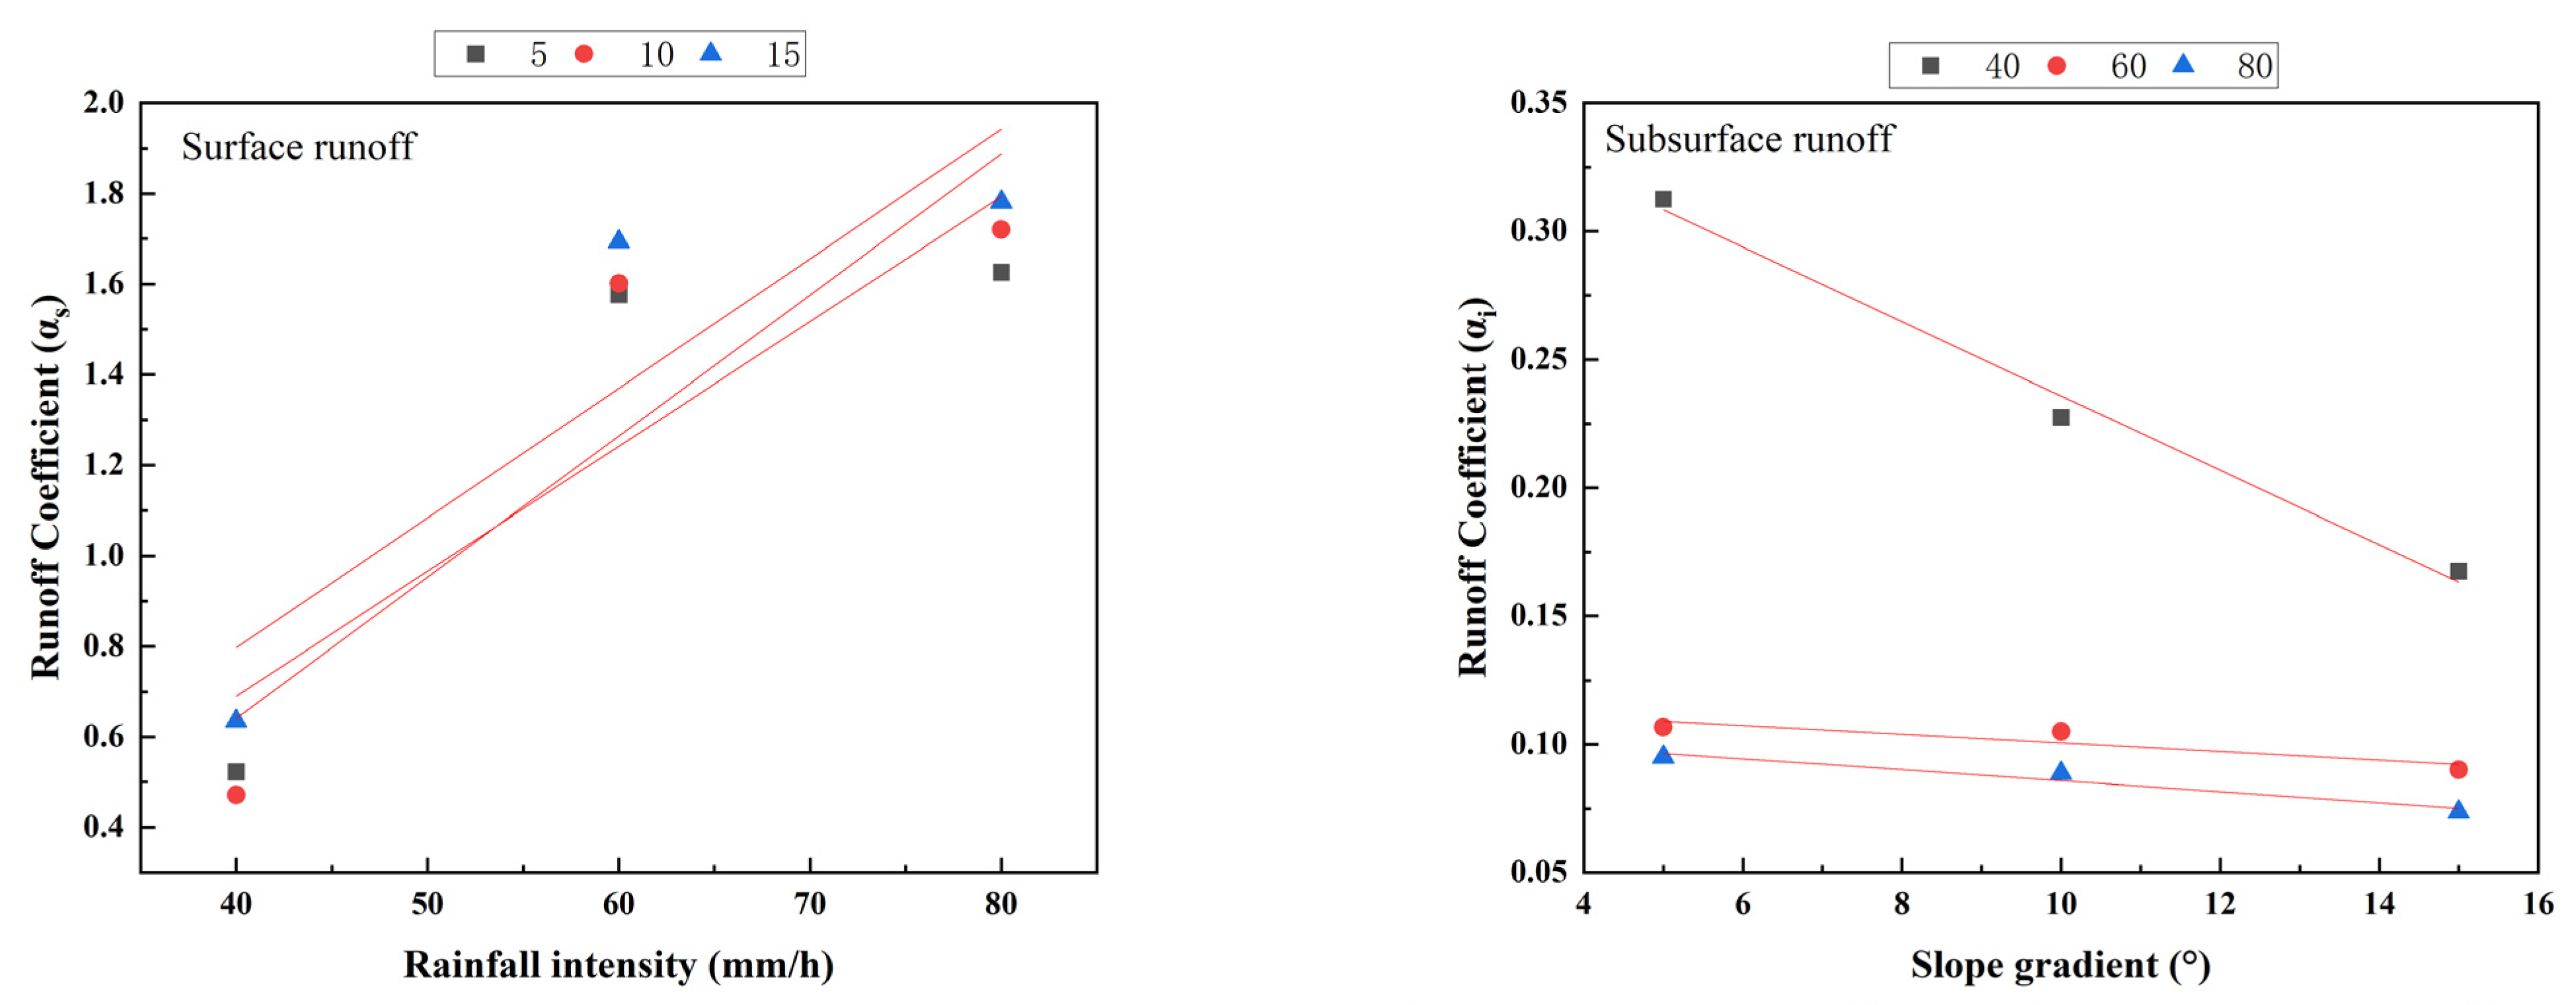
Figure 6.
Variation trend of Surface runoff, subsurface runoff, and mixed runoff modulus with rainfall intensity under different slopes.
Figure 6.
Variation trend of Surface runoff, subsurface runoff, and mixed runoff modulus with rainfall intensity under different slopes.
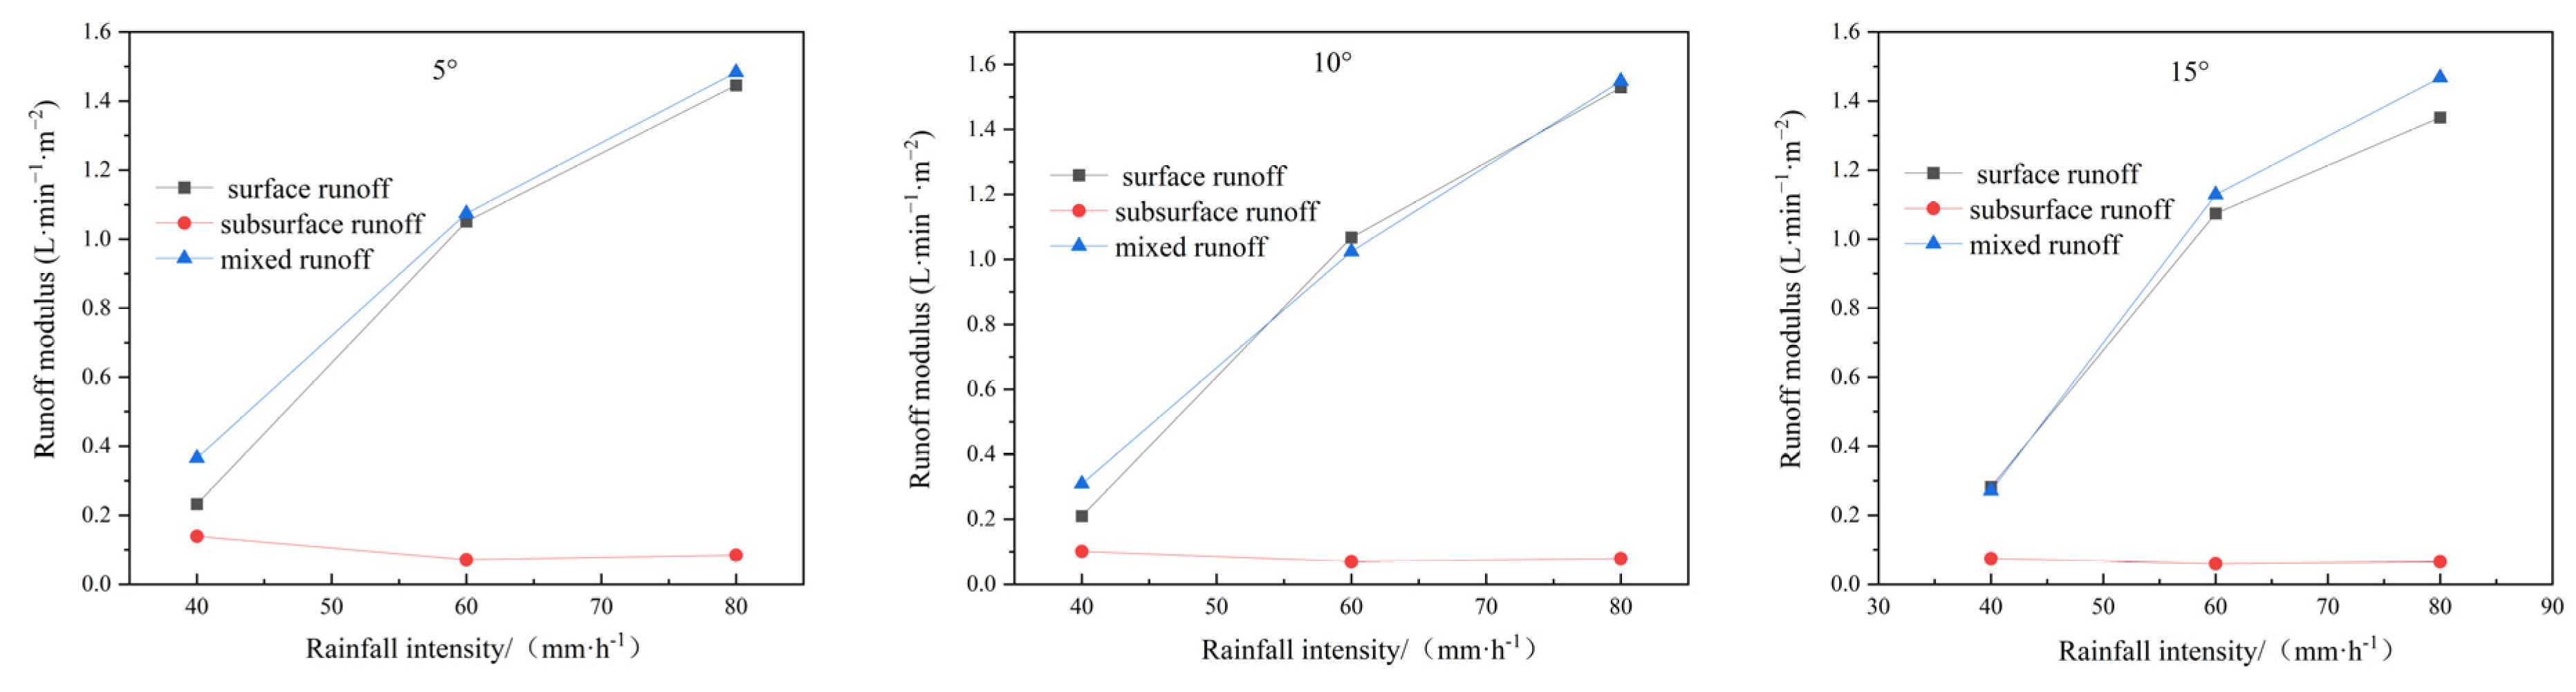
Figure 7.
Correlation between rainfall intensity, slope, slope runoff, and nitrogen loss.

Table 1.
The soil’s basic physiochemical properties.
| pH | Soil Organic Matter (g/kg) | TN (g/kg) | Available Phosphorous (mg/kg) | Available Potassium (mg/kg) | Sand Content (%) | Silt Content (%) | Clay Content (%) |
|---|---|---|---|---|---|---|---|
| 6.33 | 9.97 | 0.448 | 4.55 | 45.9 | 75.12 | 16.5 | 8.38 |
Table 2.
Initial surface and subsurface generation times of different treatments (rainfall intensities and slope gradients) (mins).
Table 2.
Initial surface and subsurface generation times of different treatments (rainfall intensities and slope gradients) (mins).
| Types of Runoff | Rainfall Intensity (mm/h) | Slope Gradient (°) | ||
|---|---|---|---|---|
| 5 | 10 | 15 | ||
| 40 | 6.23 | 4.76 | 3 | |
| Surface Runoff | 60 | 3.83 | 1.75 | 0.97 |
| 80 | 1.96 | 1.12 | 0.24 | |
| 40 | 18.85 | 14.42 | 10.79 | |
| Subsurface Runoff | 60 | 13.33 | 9.14 | 7.55 |
| 80 | 10.92 | 8.65 | 4.21 | |
| 40 | 12.62 | 9.66 | 7.79 | |
| Surface Runoff - Subsurface Runoff | 60 | 9.5 | 7.39 | 6.58 |
| 80 | 8.96 | 7.53 | 3.97 | |
Table 3.
Significant analysis of runoff under different slope gradient and rainfall intensity.
| Slope Gradient S/(°) | Surface Runoff (L) | Subsurface Runoff (L) | ||||
|---|---|---|---|---|---|---|
| 40 mm/h | 60 mm/h | 80 mm/h | 40 mm/h | 60 mm/h | 80 mm/h | |
| 5 | 22.43 ± 0.32 Cc | 52.3 ± 0.82 Bc | 87.2 ± 0.82 Ac | 7.17 ± 0.7 Bb | 8.27 ± 0.61 Ab | 11.37 ± 0.7 Ac |
| 10 | 25.93 ± 0.61 Cb | 58.4 ± 0.85 Bb | 93.37 ± 0.85 Ab | 6.3 ± 0.66 Bab | 7.3 ± 0.8 Bab | 9.63 ± 0.61 Ab |
| 15 | 27.77 ± 0.35 Ca | 65.1 ± 0.7 Ba | 98.3 ± 0.79 Aa | 5.77 ± 0.55 Ba | 6.67 ± 0.75 Aa | 7.4 ± 0.75 Aa |
Note: value = mean ± standard error (SE). Different capital letters in the same slope gradient denote significant differences between different rainfall intensities of the same slope gradient (p < 0.05). Different lowercase letters in the same column denote significant differences in different slope gradients of the same rainfall intensity (p < 0.05).
Table 4.
Significant analysis of runoff TN loss under different slope gradient and rainfall intensitys and rainfall intensities.
Table 4.
Significant analysis of runoff TN loss under different slope gradient and rainfall intensitys and rainfall intensities.
| Slope Gradient S/(°) | Surface Runoff TN Concentration (mg/L) | Subsurface Runoff TN Concentration (mg/L) | ||||
|---|---|---|---|---|---|---|
| 40 mm/h | 60 mm/h | 80 mm/h | 40 mm/h | 60 mm/h | 80 mm/h | |
| 5 | 22.41 ± 0.93 Cc | 25.14 ± 0.72 Bc | 32.76 ± 0.57 Ac | 22.23 ± 0.86 Cc | 43.44 ± 1.06 Ba | 50.29 ± 1.01 Aa |
| 10 | 35.16 ± 1.07 Ca | 43.35 ± 0.86 Ba | 50.05 ± 0.57 Aa | 36.31 ± 1.08 Ba | 37.46 ± 1.07 Bb | 42.81 ± 0.88 Ab |
| 15 | 33.06 ± 0.53 Cb | 36.01 ± 0.24 Bb | 42.63 ± 0.60 Ab | 32.45 ± 1.06 Bb | 42.33 ± 1.03 Aa | 43.41 ± 0.97 Ab |
Note: value = mean ± standard error (SE). Different capital letters in the same slope gradient denote significant differences between different rainfall intensities of the same slope gradient (p < 0.05). Different lowercase letters in the same column denote significant differences in different slope gradients of the same rainfall intensity (p < 0.05).
Table 5.
Fitting results of runoff coefficients for runoff f under different slope gradients and rainfall intensity.
Table 5.
Fitting results of runoff coefficients for runoff f under different slope gradients and rainfall intensity.
| Types of Runoff | Simulate Conditions | Fitted Equation | Fitting Degree R2 | |
|---|---|---|---|---|
| Surface Runoff | Slope Gradient S/(°) | 5 | α5 = 0.02759I − 0.41382 | 0.7836 |
| 10 | α10 = 0.03119I − 0.60653 | 0.8204 | ||
| 15 | α15 = 0.02866I − 0.34951 | 0.8072 | ||
| Subsurface Runoff | Raionfall Intensity I/(mm/h) | 40 | α5 = −0.0145S + 0.38083 | 0.9902 |
| 60 | α10 = −0.00167S + 0.11722 | 0.8242 | ||
| 80 | α15 = −0.00213S + 0.10708 | 0.9465 | ||
Table 6.
The proportion of surface runoff in total runoff (%).
| Rainfall Intensity/(mm/h) | 5° | 10° | 15° |
|---|---|---|---|
| 40 | 62.57 | 67.5 | 79.13 |
| 60 | 93.66 | 93.85 | 94.95 |
| 80 | 94.16 | 95.09 | 95.53 |
Table 7.
The proportion of nitrogen loss to total nitrogen loss in subsurface runoff (%).
| Rainfall Intensity/(mm/h) | 5° | 10° | 15° |
|---|---|---|---|
| 40 | 67.49 | 55.67 | 60.09 |
| 60 | 63.01 | 51.83 | 54.30 |
| 80 | 60.46 | 51.14 | 51.38 |
Table 8.
The contribution rate of factors influencing slope surface runoff and nitrogen loss (%).
| Factor | Surface Runoff | Subsurface Runoff | TN of Surface Runoff | TN of Subsurface Runoff |
|---|---|---|---|---|
| Rainfall Density | 99.6 | 52.8 | 30.2 | 21.4 |
| Slope Gradient | 0.1 | 26.9 | 66.8 | 37.5 |
| Rainfall Density × Slope Gradient | 0.3 | 20.3 | 3.0 | 41.1 |
Disclaimer/Publisher’s Note: The statements, opinions and data contained in all publications are solely those of the individual author(s) and contributor(s) and not of MDPI and/or the editor(s). MDPI and/or the editor(s) disclaim responsibility for any injury to people or property resulting from any ideas, methods, instructions or products referred to in the content. |
© 2024 by the authors. Licensee MDPI, Basel, Switzerland. This article is an open access article distributed under the terms and conditions of the Creative Commons Attribution (CC BY) license (https://creativecommons.org/licenses/by/4.0/).
Share and Cite
MDPI and ACS Style
Wang, N.; Wang, L.; Jin, L.; Wu, J.; Pang, M.; Wei, D.; Li, Y.; Wang, J.; Xu, T.; Yang, Z.; et al. Rainfall Runoff and Nitrogen Loss Characteristics on the Miyun Reservoir Slope. Water 2024, 16, 786. https://doi.org/10.3390/w16050786
AMA Style
Wang N, Wang L, Jin L, Wu J, Pang M, Wei D, Li Y, Wang J, Xu T, Yang Z, et al. Rainfall Runoff and Nitrogen Loss Characteristics on the Miyun Reservoir Slope. Water. 2024; 16(5):786. https://doi.org/10.3390/w16050786
Chicago/Turabian StyleWang, Na, Lei Wang, Liang Jin, Jiajun Wu, Min Pang, Dan Wei, Yan Li, Junqiang Wang, Ting Xu, Zhixin Yang, and et al. 2024. "Rainfall Runoff and Nitrogen Loss Characteristics on the Miyun Reservoir Slope" Water 16, no. 5: 786. https://doi.org/10.3390/w16050786
Note that from the first issue of 2016, this journal uses article numbers instead of page numbers. See further details here.