
Simulating Aquifer for Nitrate Ion Migration Processes in Soil
1
Analytical Chemistry and Environmental Engineering Department, Faculty of Chemical Engineering and Biotechnologies, National University of Science and Technology Politehnica Bucharest, Gheorghe Polizu Street, No. 1-7, 011061 Bucharest, Romania
2
Biotechnical Systems Engineering Department, Faculty of Biotechnical Systems Engineering, National University of Science and Technology Politehnica Bucharest, Spl. Independentei Street, No. 313, 060042 Bucharest, Romania
*
Authors to whom correspondence should be addressed.
Water 2024, 16(5), 783; https://doi.org/10.3390/w16050783
Submission received: 21 November 2023
/
Revised: 8 January 2024
/
Accepted: 4 February 2024
/
Published: 6 March 2024
(This article belongs to the Special Issue Water Treatment, Innovative Method of Management and Regional Prospect of Pollutants)
Abstract
:The objective of this study was to explore the removal of nitrate ions from groundwater by employing dynamic permeable reactive barriers (PRBs) with A400-nZVI. This research aimed to determine the parameters of the barrier and evaluate its overall capacity to retain nitrate ions during percolation with a potassium nitrate solution. The process involves obtaining zerovalent iron (nZVI) nanoparticles, which were synthesized and incorporated onto an anionic resin support material (A400) through the reduction reaction of ferrous ions with sodium borohydride (NaBH4). This is achieved by preparing a ferrous sulfate solution, contacting it with the ion exchange resin at various solid–liquid mass ratios and gradually adding sodium borohydride under continuous stirring in an oxygen-free environment to create the A400-nZVI barrier. The results of the study, focusing on the development of permeable reactive barriers composed of nano zero-valent iron and ion exchangers, highlight the significant potential of water treatment processes when appropriately sized. The research specifically assesses the effectiveness of NO3− removal by using the A400-nZVI permeable reactive barrier, conducting laboratory tests that simulate a naturally stratified aquifer with high nitrate contamination.
1. Introduction
Typically, natural nitrate levels in groundwater remain quite low, usually below 10 mg/L of NO₃−. However, human-induced factors such as agricultural practices, industrial activities, household effluents, and emissions from combustion engines are causing an increase in nitrate concentrations. The leaching of nitrates into soil and groundwater generally occurs at a slow pace, with a lag period of approximately 20 years between the initiation of pollution activities and the detection of pollutants in groundwater. Consequently, ongoing activities are anticipated to contribute to nitrate pollution for several decades. It is worth noting that, under high aquifer pressure, nitrate transport can be exceptionally rapid within the saturation zone. Nitrate concentrations exhibit variability, particularly under extreme climatic conditions [1,2].
The source of nitrate contamination is most often anthropogenic, especially industrial activities, the application of fertilizers in agriculture, as well as wastewater discharges. Nitrates in groundwater can come from various sources that can be grouped into two main categories: anthropogenic nitrate pollution and natural accumulation of nitrates, especially present in arid and semi-arid regions. Their pollution with nitrates especially takes place where agriculture is practiced in an intensive system by excessive fertilization of the crops or the cultivation area in the area where the soil layer is relatively thin. Other sources of nitrates in groundwater are irrigation, wastewater discharge, and heavy rains [1].
Although the law in the European Union allows for a maximum nitrate limit of 50 mg/L, doctors around the world find this figure far too permissive. They consider the value far too high, being a risk especially for infants and young children. Their recommendation is a maximum of 10 mg nitrates () per liter of water for water intended for the preparation of food for infants and young children [2].
Extensive research into the detrimental impacts of nitrates on human health and ecology has prompted the exploration of cost-effective and efficient techniques for nitrate removal. As a result, a variety of methods for eliminating nitrates have been developed.
In order to efficiently purify the water body and reduce the occurrence of eutrophication, phosphate recovery or removal has been developed so far.
There are several methods of nitrate removal, various separation techniques, including physical [2], chemical, and biological methods. For example, reverse osmosis is used, with the help of ion exchangers, electrolysis, and chemical and biological denitrification and adsorption processes.
Among these methods, many have drawbacks that are related to increased energy consumption, increased maintenance costs, and preliminary removal of hardness; and also, in cold periods, for biological methods, the efficiency is low.
However, adsorption is considered to be the most promising method among them for nitrate removal due to its ease of operation, high efficiency, and remarkable degradation capacity to remove nitrates [2]. The essence of adsorption is the physical and/or chemical interaction between the surface of the solid adsorbent and the target pollutant.
Permeable reactive barriers are some of the most promising technologies for passive groundwater treatment due to the efficiency of retaining different contaminants and the low price compared to other in situ technologies. The most economical and simplest method for removing nutrients from wastewater is based on the use of metals in the form of nanoparticles in combination with ion exchangers.
Nanoscale zerovalent iron (nZVI) has been extensively studied for the remediation of polluted aquifers, as it is effective in reducing nitrates in contaminated areas. However, zerovalent iron nanoparticles are prone to agglomeration; this leads to a reduction in the specific surface area, as well as a reduction in performance. In some cases, the release of nanoparticles into the environment can result in nanotoxicity, so it is recommended to stabilize them by incorporating them into support materials [3,4].
The application of nano zerovalent iron (nZVI) for remediating polluted groundwater or wastewater is hindered by issues such as instability, easy aggregation, and the challenge of separating nZVI from the treated solution [5,6]. To address these challenges, researchers have incorporated nZVI into solid porous materials like resin, bentonite, and zeolites in an attempt to eliminate various contaminants. The use of a supporting material extends the potential applications by preventing the agglomeration of nZVI [7,8].
Employing polymers containing quaternary ammonium groups as a support for nZVI offers several advantages. The uncharged functional groups enable both anionic and cationic contaminants to enter the polymer phase. Furthermore, the nitrogen-containing pyridine groups act as donor atoms, facilitating a robust chelation of ferric ions. This allows for the achievement of a high content of immobilized nZVI, and the release of iron ions into water can be prevented or alleviated due to the strong chelating properties of the functional groups.
Sizing and design of PRB—The projection of permeable reactive barriers must correspond to the characteristics of the contaminated areas, and the problems that may arise in the removal of contaminants must be taken into account. The thickness of the reactive layer along the barrier is adjusted for high concentration and for the contaminant that has a longer residence time [2].
The use of a thick wall throughout the system also includes the placement of reactive cells that results in a varied ratio of reactive medium to inert materials for walls mixed with gravel, sand, or other nonreactive materials. For an effective homogenization, it is necessary to cover the ascending part of the reactive cell with gravel.
The measurement of hydraulic conductivity can vary greatly depending on the area of contamination, so to design the correct thickness of the reactive area and to ensure safety, a very high conductivity must be used. Sizing for hydraulic systems is therefore the most important design aspect in the design of permeable reactive barriers.
Due to the fact that the barriers are heterogeneous, a safety factor must be included when sizing the reactive cell so that the changes are taken into account.
Several sources recommend that the permeability of the reactive medium be ten times higher than that of the aquifer because unexpected situations such as the sedimentation of fine particles and solid precipitation can occur that can reduce permeability [2].
If the permeability of the medium is higher than that of the aquifer, it will cause water to flow faster through the reactive medium than normal.
For in situ applications, nano zerovalent iron (nZVI) can be directly injected into contaminated sites either in the form of sludge/suspension or integrated into the structure of permeable reactive barriers (PRBs). In the design of a PRB, groundwater flows passively through an engineered nZVI wall, causing contaminants to precipitate, adsorb, or transform into nonpolluting compounds [9]. Alternatively, nZVI can be utilized in ex situ applications following its integration into a support material, i.e., either a solid support material or a hybrid. Moreover, the methods for effectively separating nZVI particles from contaminated areas remain challenging and economically unfavorable. Enhancing the incorporation of nZVI into large solid particles could facilitate its easy removal from the aqueous system. Commonly employed supports for integrating nZVI include granular activated carbon, resins, and zeolite [7,8].
In this study, nZVI was doped on an anion exchange resin (Purolite A400 is a strongly basic anion exchange resin, polystyrene–divinylbenzene gel type, with quaternary ammonium functional groups, in chloride form), and the resulting material was tested for the removal of nitrates in a dynamic regime.
2. Materials and Methods
2.1. Materials
Purolite A400 (strongly base anion resin with gel polystyrene crosslinked with divinylbenzene structure, containing quaternary ammonium functional groups, Cl− form) was purchased from Purolite Ltd. (Purolite S.R.L., Bucharest, Romania an affiliate of Purolite Corporation, Bala Cynwyd, PA, USA). Ferrous sulfate hexahydrate (FeSO4·6H2O) and sodium borohydride (NaBH4) were purchased from Chimopar (Chimopar TRADING SRL, Bucharest, Romania). Ethanol (C2H5OH) and sulfuric acid (H2SO4) were from Sigma Aldrich (Merck KGaA, Darmstadt, Germany). All the chemical compounds used were analytical grade. Distilled water was used for obtaining aqueous solutions.
2.2. Synthesis of the Polymeric Material
For the synthesis of the material, A400-nZVI, the anion exchanger A400 (Figure 1) was used as a support material in which nano zero-valent iron particles were immobilized in two steps.
First, Fe2+ ions were incorporated into the porous support via adsorption and/or ion exchange, using the functional groups of the porous support. Then, the adsorbed Fe2+ ions were reduced to Fe0 by exposing the porous support material to NaBH4 solution.
The polystyrenic gel (Purolite A400) containing zerovalent iron (nZVI) nanoparticles was obtained as follows: 45 g of Purolite A400 was added to 250 mL of FeSO4·6H2O (0.2 M). After 3 h of homogenization in an end-over-end shaker, at room temperature (24 ± 1.0 °C) and under nitrogen atmosphere, using a nitrogen gas bottle (BOC Linde Company, Distribution Linde Romania, Bucharest), the solution was filtered to separate the solid granules, which were then dried in the oven, under vacuum condition (MultiLab ML-LE 15/11, Distribution Laboratory and Analytical Equipment MultiLab Romania, Bucharest; IKA-Werke, Inc., Laboratory Equipment, Deutscland, Germany) at 30 °C for 6 h. After the obtaining stage, 250 mL of NaBH4 solution with a concentration of 0.4 M was introduced into a burette to which a round flask with three necks was connected, in which the dried granules were previously added. The mixture was stirred using an end-over-end shaker for 3 h, under a N2 atmosphere. The obtained mixture was kept at room temperature (24 ± 1.0 °C) for 3 h. The borohydride reduction of the ferrous ions is as follows [6,10,11,12]:
Fe+2 + 2BH−4 + 6H2O → Fe0 + 2B(OH)3 + 7H2 ↑
The nano zero-valent iron anion exchange resin (A400-nZVI) obtained was washed three times, using deoxygenated water, and stored in a round-bottomed flask; over where ethanol solution was added to the flask to prevent any further oxidation.
The schematic preparation of A400-nZVI is illustrated in Figure 1.
For the dynamic study, the anion exchange resin impregnated with internally dispersed nZVI was drained, washed, and immediately used as a permeable reactive barrier.
2.3. Procedure
The Dynamic Study
A solution of potassium nitrate (KNO3), with a concentration of 100 mg/L, was used as the aqueous phase; the flow was kept uniform at three flow rates throughout the experiments.
The soil columns used in the miscible displacement experiments of the potassium nitrate solution were obtained by manually introducing the air-dried sandy-type soil. The column used was cylindrical and made of glass, with an inner diameter of 3 cm and a total length of 50 cm, and the height of the soil layer is approximately 30 cm (Figure 2). In the middle of the soil column was a layer of several centimeters of adsorbent material type A400-nZVI. After filling the column, the soil was saturated with a 100 mg/L KNO3 solution, and the effluent was collected in fractions of 25 mL in continuous flow, with a flow rate of Q1 = 14 mL/min, Q2 = 16.8 mL/min, and Q3 = 28 mL/min. Under these conditions, the soil column was continuously fed and recirculated with a solution of constant concentration (the ion in the solution), and the reaction products were continuously collected in the effluent until the nitrate ion concentration in the effluent reached an acceptable limit value (Figure 2).
Synthetic aquifer groundwater with an initial nitrate concentration of 100 mg/L was pumped using a peristaltic pump, pumping upstream.
The downstream effluent was recirculated and pumped into the upstream reservoir. Recirculation of the contaminated water continued until the nitrate concentration in the effluent was reduced to an acceptable level. The nitrate reduction trend was monitored downstream.
The pH values increased rapidly during the reduction reaction from 3 to pH values below 9 in the first phase and then remained almost unchanged. The pH values in the solution after the reduction of are always higher than before the process, sustaining that the reduction reaction results in the release of ions in the solution. This is probably due to the consumption of H+ during the reactions.
2.4. Kinetics Studies
For the calculation of the sorption speed of N, a kinetic model of the first order was used [2]:
where C = the concentration of N in the effluent at time t (mg/L); C0 = the initial concentration of N in the feeding solution (mg/L); and k = the speed constant of the first order I (h−1); t = time (h). When the concentration in the effluent reaches half of the initial concentration (C/C0 = 0.5), the half-life t1/2 results [2]:
C = C0·e−kt
2.5. Calculation of Barrier Parameters
Hydraulic Conductivity
3. Results and Discussions
3.1. Characterization of Polymeric Materials
The polymeric materials, dried under vacuum condition, without and with zerovalent iron nanoparticles (A400 and A400-nZVI), were characterized using techniques such as scanning electron microscopy (SEM), Fourier-transform infrared spectroscopy (FTIR), EDAX spectrometer, thermogravimetric analysis (TGA), and X-ray diffraction (XRD). The polymeric material, A400-nZVI, was used for the removal of nitrate ions from simulated groundwater in order to demonstrate the adsorption capacity. The infrared spectra of the polymeric materials were registered on an FTIR spectrophotometer (Perkin ELMER, Ltd., London, UK) in the transmittance mode, equipped with a Golden Gate unit. Data were performed in the wavenumber range between 4000 and 650 cm−1, with a resolution of 4 cm−1. The phase composition analysis for polymeric materials was determined using an X-ray diffractometer (XRD) equipped with a copper target (X’Pert PRO, PANalytical Co., Rotterdam, The Netherland). The XRD experimental data were collected in the 2θ range between 10 and 90 degrees, with a counting time of 2 s per step.
3.1.1. SEM-EDAX
The surface morphology of the polymeric materials was performed through a scanning electron microscope (SEM) (Quanta 650 FEG, FEI Company, Hillsboro, OH, USA) that was equipped with an EDAX spectrometer (175.6 eV resolution) (Oxford Instruments, Hillsboro, OH, USA). The scanning electron microscopy (SEM) images (magnification of 5000×) and energy-dispersive X-ray spectroscopy (EDAX) spectra of polymeric materials, A400 and A400-nZVI, are indicated in Figure 3a,c.
The SEM image of resin-supported nZVI shows that the iron nanoparticles are uniformly deposited on the resin and confirms the successful attachment of nZVI on the resin (Figure 3c).
The SEM images (Figure 3e,f) clearly show that the Fe0 nanoparticles are presented and dispersed on the A400-nZVI surface.
EDAX analysis of the two forms of polymer resins in the figure showed that Fe0 was distributed on the surface of the resin, and the nanoparticles were discrete and dispersed on the surface, indicating that A400 represented a suitable surface for the dense and uniform deposition of nanoparticles of Fe0.
As suggested, the precharged nZVI particles will block some internal pores or reduce/narrow the pores. On the other hand, they could offer a more accessible surface and thus increase the specific surface.
The iron nanoparticles deposited on A400-nZVI did not aggregate (the unfavorable characteristic of magnetization and aggregation was eliminated), and the nZVI particles were also dispersed on the surface of the porous polymeric hosts.
It is shown in the SEM and EDAX images of A400 and A400-nZVI that A400 presented a typical porous structure. This result suggests that nZVI was uniformly immobilized/fixed in A400 resin (Figure 3a). Compared to A400, a more abundant pore structure was observed on the surface of A400-nZVI (Figure 3b), where the surface is very dense and compact.
3.1.2. FTIR
Figure 4 shows the FTIR spectrum of the spectra for A400 and A400-nZVI before and after contact with .
New peaks at 2322 cm−1 and 2231 cm−1 appeared in the spectrum of fresh A400-nZVI compared to A400-nZVI loaded with , which could be attributed to bending vibration of B–O, which was the residual compound after iron reduction using NaBH4 (Figure 4). Thus, the distribution of nZVI in A400-nZVI does not result from the distribution of ammonium groups in A400; instead, it is possibly related to NaBH4 diffusion into the polymer phases during the formation of nZVI [5].
The presence of a band at the wave number 2231 cm−1 is due to the –C≡N bond (stretching vibration) of the nitrile group; the group ![Water 16 00783 i001]() has no characteristic bands. The appearance of a peak at 2923 cm−1 may be due to the group —CH2– (acrylic) stretching vibration, asymmetric, C-H bond (reticulated resin).
has no characteristic bands. The appearance of a peak at 2923 cm−1 may be due to the group —CH2– (acrylic) stretching vibration, asymmetric, C-H bond (reticulated resin).
 has no characteristic bands. The appearance of a peak at 2923 cm−1 may be due to the group —CH2– (acrylic) stretching vibration, asymmetric, C-H bond (reticulated resin).
The peak at 1381.58 cm−1, 1379.55 cm−1, and 1336.61 cm−1 (O-H bending vibration) indicated the presence of surface hydroxyls on nZVI. After adsorption, a portion of hydroxyl groups reacted, and this peak moved to a lower wave number (1336.61 cm−1) and increased in intensity. The fact that the 1379 cm−1 and 1346 cm−1 peaks do not move to a higher but a lower wavenumber indicates that a reduction is occurring, and adsorbing is not taking place. No additional peaks appeared in the spectra loaded with compared to fresh A400-nZVI.
The bands at 827 cm−1 corresponded to Fe-O, Fe-O-Fe, and oxygen-iron stretching vibrations of Fe2O3 and Fe3O4 in the spectra, indicating that the nZVI particles were partially oxidized.
3.1.3. XRD Diffraction
The XRD analysis was performed to show that the nZVI particles were incorporated into the polymeric material A400 (Figure 5).
The XRD diffraction pattern for the A400-nZVI shows two peaks at 2θ = 44.83° and 82.35°, indicating the presence of nZVI on the A400-nZVI surface. After contacting A400-nZVI with nitrate solutions, the following compounds were identified: N2O at 2θ = 3.2° and 2.5°; Fe3O4 at 2θ = 14.1°, 36.5°, and 52.5°; FeO at 2θ = 36°, 41.8°, and 60.7°; and C8H6N2O6 at 2θ = 9.4°, 18.7°, and 27.9°. He et al. [16] identified crystal phases for nanoscale zerovalent iron/nickel supported on zeolite at 2θ = 44.8° and 69.0°. Their results indicate the existence of zerovalent iron on the zeolite surface. He et al. [16] identified crystal phases for nanoscale zerovalent iron/nickel supported on zeolite at 2θ = 44.8° and 69.0°. Their results indicate the existence of zerovalent iron on the zeolite surface [17].
3.2. Kinetics Evaluation
Experimental Determination of Curves in Dynamic Regime and Calculation of Kinetic Parameters of the Process
The experimental data are presented in the form of logistic curves under the specified working conditions as a variation in the N concentration in the effluent as a function of time for the three types of flow, i.e., Q1 = 14 mL/min, Q2 = 16.8 mL/min, and Q3 = 28 mL/min, denoted by P1, P2, and P3 (sample P1, P2, and P3 Table 1).
The experimental data on the basis of which the curves were drawn are presented in Table 1.
The experimental data shown in Table 1 are of the ionic and redox exchange process in the fixed layer for the three types of flow rates.
By testing the A400-nZVI barrier, a reduction of the nitrate concentration to a value close to 0 was achieved within 5 days, with effluent recirculation every day. For a more in-depth investigation of the nitrate reduction process in the column system, a graph was made showing the nitrate removal efficiency as a function of the number of effluent recirculations (Figure 6), which was reached in 5 days. It is noteworthy that the maximum nitrate reduction occurs during the sixteenth-to-seventeenth circulation (Cir16 to Cir17).
For the verification and interpretation of the data, a logistic mathematical model was used which represents an important tool widely used to solve several practical problems, both in the design phase and in the operation phase of the PRB, such as the following:
- -
- Determining the thickness of the reactive medium layer along the barrier;
- -
- Determination of the standing time of the water;
- -
- The evaluation of the economic potential as a result of the adequate design of the operating parameters, which cannot be modified during the remediation.
The logistic curve is a growth-limited curve that has the shape of an oblong S-shaped curve. It characterizes an evolution that starts from the lower asymptotic limit with the zero value and then finally reaches an upper limit. At first, the evolution proceeds slowly, similar to simple exponential growth. Then, the growth accelerates. Meanwhile, it passes through an inflection point, after which the growth slowly decreases; thus, the evolution asymptotically heads towards the upper limit (Figure 7).
It should be noted that the removal efficiency is progressive but not very accelerated at the beginning of the process. This fact can be attributed to two types of processes: the first type is the redox process, in which the iron in the Fe0 state reacts with nitrate ions; and as soon as the exchange positions are freed, the second type, the ion exchange process, appears simultaneously, which will contribute to accelerating the removal of the nitrate ion.
From the examination of the curves represented for the three samples in relation to the position of the experimental points, it is found that the removal kinetics of nitrate ions can be described mathematically precisely enough by logistic equation models.
During the tests, nitrite was not detected in most samples, and no accumulation was detected (Figure 8). This suggests that denitrification by the acceptor A400-nZVI was rapid, and nitrite ions were rapidly converted to ammonium after generation. The ammonium concentration was also not detected, and this can be attributed to adsorption by the ion exchange resin. However, considering the low regulatory limit of ammonium, it is important to monitor the concentration of this ion, especially in heavily contaminated sites.
Based on the data in Table 1 and using relations (1)–(2), the characteristic parameters of the first-order kinetic model, t1/2 and k, are calculated under dynamic conditions for the three types of flows (Table 2).
The cumulative mean percentage of nitrate removal observed for each run indicates that the half-life for nitrate degradation is about three days, and more than 90% of the NO3− has been degraded after about 5 days.
The rate of worsening of the remediation conditions of N-polluted groundwater will be all the more alert the longer the half-life of N is, and vice versa. The half-life t1/2 of the N content varies depending on the working conditions, regarding the variation of the infiltration rate and the precipitation regime.
3.3. Calculation of the Yield (η) of Nitrate Ion Removal
The removal efficiency (η) of the nitrate ion from the water is determined. A graph is drawn of the yield (η) of nitrate ion removal over time. A graph is drawn to express the formation of the nitrate and ammonium ions over time.
where Ci = the concentration of nitrate ions from the initial sample, mg/L; and Ci = the concentration of nitrate ions removed from the residual water, mg/L.
The highest removal efficiency (94.24%) is achieved when operating at a flow rate lower than Q1 = 14 mL/min; thus, the contact time is longer, and retention is better (Table 3).
3.4. Calculation of Barrier Parameters
3.4.1. Hydraulic Conductivity
To calculate the hydraulic conductivity (k), Darcy’s law is used Equation (3):
where is the hydraulic gradient, which equals 7; and L is the column length, which equals 100 cm.
It operates at three flow rates, i.e., Q1, Q2, and Q3, so we have to calculate three hydraulic conductivities:
Q from [ is converted to [
3.4.2. Flow Rate through the Section, or Filtration Rate
Flow rate through the section is calculated using Equation (5):
3.4.3. Barrier Permeability (K)
Barrier permeability (K) is calculated using Equation (6), where the average diameter of the particles, , is calculated based on the texture of the soil and the barrier and porosity φ = 0.4:
Contaminant removal with PRB occurs mainly in the zone of reactive media and, in some cases, down the gradient of the barrier, depending on the type of media used.
Some of the reactive media remove contaminants via direct contact, while other reactive media modify/involve biogeochemical processes in the treatment area, thus ensuring favorable conditions for the immobilization of contaminants or (bio)degradation. The primary objective of PRB, regardless of the design used, is to bring contaminants into the reactive zone, where they can be destroyed or immobilized.
The average resin diameter was ~1.2 mm. The size is related to the permeability of the media, this parameter being very important for the successful operation of a permeable reactive barrier (Table 4). The material selected should minimize the constraints on groundwater flow, and the particle size should not be excessively small. The permeability of the doped nZVI was higher than that of the aquifer (~10−3 cm/s). This suggests that the created material can be used as a reactive medium for permeable reactive barriers.
Design parameters must be carefully identified during the characterization phase, as there is a possibility that operating parameters cannot be changed during the remedial process; the wall must be sized correctly for any surface modification. The parameters must be designed to handle any toxic transformation product created [2].
From the current study, it is observed that the contact time of nitrate PRB must be longer, and the barrier must be thicker. As a recommendation, barriers with “continuous wall” require media to be spread throughout the area, while in the case of the “funnel-gate” system, the reactive medium is located only in the area of the gate, as this is more efficient.
Hydraulic conductivity measurements can vary greatly depending on the area of interest. Therefore, to correctly dimension the thickness of the reactive area and to ensure a safety margin, the highest hydraulic conductivity must be used.
Because barrier properties are heterogeneous, a safety factor should be included when sizing the reactor cell so that fluctuations are accounted for [2]. Some sources recommend that the permeability of the reactive medium be approximately ten times that of the aquifer because unexpected situations such as sedimentation of fine granular particles and solid precipitation can occur, which can significantly reduce the permeability over time [2]. An average permeability higher than that of the aquifer will cause water to flow faster through the medium than it normally would.
From the current study, it is observed that the contact time of the pollutant in the PRB must be longer, and the barrier must be thicker. The highest removal efficiency (94.24%) is achieved when operating at a flow rate lower than Q1 = 14 mL/min; thus, the contact time is longer, and the retention is better. From the point of view of permeability for the sandy soil used, the permeability is located between 2.6 × 10⁻⁹ and 1.4 × 10⁻⁷ cm2 [14], and the results for the permeability of the A400-nZVI barrier are 2.17 × 10⁻⁷, thus falling within the requirements of the permeability of a barrier.
3.5. Adsorption Mechanism
Nitrate is a stable and chemically unreactive species that occurs as part of the nitrate cycle. Nitrate (NO3−) is the most oxidized form of combined nitrogen for oxygenated systems (Equations (8) and (9)).
However, nitrate can be reduced by microbial and chemical processes to nitrite, ammonia, nitrogen oxides, and nitrogen gas under various environmental conditions (Equation (10):
Nitrate contamination of groundwater is governed by natural biogeochemical processes that control nitrate leaching into groundwater. In the root zone of the topsoil, nitrogen fixation and nitrification processes make nitrogen available to plants in the form of ammonium (NH4+) and nitrate. Nitrate reduction can occur through plant uptake, mineralization–immobilization processes, volatilization, runoff losses, and denitrification [6,17].
These processes, either independently or in combination, limit the flow of nitrate to groundwater. However, nitrate ions, unlike positively charged NH4+ (which is bound to negatively charged soil particles), are weakly bound and can percolate beyond root zones into the water table of the groundwater aquifer environment. Microbial denitrification is common in soils with more than 60% pore saturation, where oxygen for microbial respiration is limited. The microbial reduction of nitrate ion is a respiratory process that uses nitrate or nitrite as the terminal electron acceptor under conditions of limited oxygen supply.
The nZVI reaction is a nitrate reduction reaction to (nitrite), NH4+ (ammonium), and N2 (nitrogen). ZVI is oxidized to Fe (II) (Figure 9).
The core of the nZvi particle consists mainly of zerovalent iron and provides the power to reduce reactions with environmental contaminants. The coating is mostly iron oxides/hydroxides formed from the oxidation of zerovalent iron.
To date, ZVI applications have mainly focused on the electron-donating properties of ZVI. Under ambient conditions, ZVI is quite reactive in water and can serve as an excellent electron donor, making it a versatile remedial material [18,19].
There are problems with these reactions. First of all, under neutral conditions, the corrosion of nZVI produces iron oxides. These products provide a barrier layer on the nZVI particles, thus decreasing the reaction rate due to a decrease in mass transfer. The second aspect is represented by the main products of the reaction: nitrites and ammonium are also contaminants.
4. Conclusions
This paper proposes a method of depollution of wastewater contaminated with nitrates through adsorption processes by testing new materials used as adsorbents to remove nitrate ions so that the removal efficiency of these ions from wastewater is maximum. New adsorbents of the type A400-nZVI are considered.
The results of the conducted study and experiments reveal that the ion exchange material produced, doped with nano zero-valent iron, demonstrated highly effective nitrate removal. These materials, along with other types, can be introduced into the soil. On a laboratory scale, column tests, such as permeable reagent barriers, provide a viable method for assessment.
Testing the A400-nZVI barrier exhibited a significant reduction in nitrate concentration to nearly zero within 5 days, with daily effluent recirculation. To delve deeper into the nitrate reduction process within an aquifer, the nitrate removal efficiency was monitored in relation to the number of effluent recirculations, achieving optimal results by the seventeenth recirculation (Cir16 to Cir17).
The cumulative mean percentage of nitrate removal observed for each run indicates that the half-life for nitrate degradation is approximately three days, with over 90% of NO3- being degraded after about 5 days. Notably, the removal efficiency progresses steadily, with a less accelerated initial phase. This phenomenon can be attributed to two simultaneous processes: the redox processes involving the reaction of iron in the Fe0 state with nitrate ions; and the appearance of ion exchange processes as soon as exchange positions become available, contributing to the accelerated removal of nitrate ions.
During testing, nitrite was not detected in most samples, and no accumulation was detected. This suggests that denitrification by the acceptor A400-nZVI was rapid, and nitrite ions were rapidly converted to ammonium after generation. The ammonium concentration was also not detected, and this can be attributed to adsorption by the ion exchange resin.
Permeable reactive barrier technology appears to be a promising approach to effective groundwater remediation, even in complex cases where traditional pump and treat methods and/or microbiological techniques have proven unsuccessful.
Although the use of PRBs is limited to certain site conditions, where the application is feasible, they appear to be a good choice, with good acceptance by end users, especially in urban and built-up areas. The reasons for this situation can be seen, for example, in the low use of land; the low visibility; and there being no additional impact on the landscape by equipment such as containers, water tanks, pumps, noise produced by rolling machines, etc.
Author Contributions
Conceptualization, O.D.O. and C.M.; Investigation, O.D.O., C.M. and C.-I.C.-M.; Writing—original draft, O.D.O., C.M. and C.-I.C.-M. All authors have read and agreed to the published version of the manuscript.
Funding
This work was funded by University Politehnica of Bucharest, through the “National Grant” Program, UPB—GNaC 2018 ARUT. Identifier: UPB—GNaC 2018 ARUT, No. CH37-18-01, Code 32.
Data Availability Statement
Data are contained within the article.
Conflicts of Interest
The authors declare no conflict of interest.
References
- Havlin, J.L.; Tisdale, S.L.; Nelson, W.L.; Beaton, J.D. Soil Fertility and Fertilizers: An Introduction to Nutrient Management, 6th ed.; Pearson: Bloomington, MN, USA, 1999. [Google Scholar]
- Powell, R.M.; Blowes, D.W.; Gillham, R.W.; Schultz, D.; Sivavec, T.; Puls, R.; Vogan, J.L.; Powell, P.D.; Landis, R. Permeable Reactive Barrier Technologies for Contaminant Remediation, EPA/600/R-98/125; U.S. Environmental Protection Agency: Washington, DC, USA, 1998.
- Noubactep, C. Metallic iron for environmental remediation: A review of reviews. Water Res. 2015, 85, 114–123. [Google Scholar] [CrossRef] [PubMed]
- Noubactep, C. Comments on “Mechanism study of nitrate reduction by nano zero valent iron” by Hwang et al. [J. Hazard. Mater. (2010), doi:10.1016/jjhazmat.2010.10.078]. J. Hazard. Mater. 2011, 186, 946–947. [Google Scholar] [CrossRef] [PubMed]
- Chekli, L.; Bayatsarmadi, B.; Sekine, R.; Sarkar, B.; Shen, A.M.; Scheckel, K.G.; Skinner, W.; Naidu, R.; Shon, H.K.; Lombi, E.; et al. Analytical characterisation of nanoscale zero valent iron: A methodological review. Anal. Chim. Acta 2016, 903, 13–35. [Google Scholar] [CrossRef] [PubMed]
- Hwang, Y.-H.; Kim, D.-G.; Shin, H.-S. Mechanism study of nitrate reduction by nano zero valent iron. J. Hazard. Mater. 2011, 185, 1513–1521. [Google Scholar] [CrossRef] [PubMed]
- Jiang, Z.; Lva, L.; Zhang, W.; Du, Q.; Pan, B.; Yang, L.; Zhang, Q. Nitrate reduction using nanosized zero-valent iron supported by polystyrene resins: Role of surface functional groups. Water Res. 2011, 45, 2191–2198. [Google Scholar] [CrossRef] [PubMed]
- Jianga, Z.; Zhanga, S.; Pana, B.; Wangc, X.; Lva, L.; Zhanga, W.; Zhang, Q. A fabrication strategy for nanosized zero valent iron (nZVI)—Polymeric anion exchanger composites with tunable structure for nitrate reduction. J. Hazard. Mater. 2012, 233–234, 1–6. [Google Scholar] [CrossRef] [PubMed]
- Thiruvenkatachari, R.; Vigneswaran, S.; Naidu, R. Permeable reactive barrier for groundwater remediation. J. Ind. Eng. Chem. 2008, 14, 145–156. [Google Scholar] [CrossRef]
- Badmus, K.O.; Coetsee-Hugo, E.; Swart, H.; Petrik, L. Synthesis and characterisation of stable and efficient nano zero valent iron. Environ. Sci. Pollut. Res. 2018, 25, 23667–23684. [Google Scholar] [CrossRef] [PubMed]
- Demirbas, E.; Kobya, M.; Senturk, E.; Ozkan, T. Adsorption kinetics for the removal of chromium (VI) from aqueo*us solutions on the activated carbons prepared from agricultural wastes. Water SA 2004, 309, 533–539. [Google Scholar]
- Shi, J.; Yi, S.; He, H.; Long, C.; Li, A. Preparation of nanoscale zero-valent iron supported on chelating resin with nitrogen donor atoms for simultaneous reduction of Pb2+ and . Chem. Eng. J. 2013, 230, 166–171. [Google Scholar] [CrossRef]
- Dimache, A.N.; Iancu, I. General Elements of Hydraulics; Conspress: Bucureşti, Romainia, 2014; ISBN 978-973-100-357-3. [Google Scholar]
- Nield, D.A.; Bejan, A. Convection in Porous Media, 3rd ed.; Springer: Greer, SC, USA, 2006; ISBN 978-0387-29096-6/0-387-29096-6. [Google Scholar]
- Hossain, M.A.; Nakayama, A.; Pop, I. Conjugate free convection of non-Newtonian fluids about a vertical cylindrical fin in porous media. Heat Mass Transf. 1995, 30, 149–153. [Google Scholar] [CrossRef]
- He, Y.; Lin, H.; Dong, Y.; Li, B.; Wang, L.; Chu, S.; Luo, M.; Liu, J. Zeolite supported Fe/Ni bimetallic nanoparticles for simultaneous removal of nitrate and phosphate: Synergistic effect and mechanism. Chem. Eng. J. 2018, 347, 669–681. [Google Scholar] [CrossRef]
- Ali, S.W.; Mirza, M.L.; Bhatti, T.M. Removal of Cr(VI) using iron nanoparticles supported on porous cation-exchange resin. Hydrometallurgy 2015, 157, 82–89. [Google Scholar]
- Li, X.; Elliott, D.W.; Zhang, W. Zero-Valent Iron Nanoparticles for Abatement of Environmental Pollutants: Materials and Engineering Aspects. Crit. Rev. Solid State Mater. Sci. 2006, 31, 111–122. [Google Scholar]
- Shi, J.; Long, C.; Li, A. Selective reduction of nitrate into nitrogen using Fe–Pd bimetallic nanoparticle supported on chelating resin at near-neutral pH. Chem. Eng. J. 2016, 286, 408–415. [Google Scholar] [CrossRef]
Figure 1.
Experimental scheme for the synthesis of iron nanoparticles.

Figure 2.
Scheme of the experimental column for the dynamic study on the remediation of nitrate-contaminated groundwater, using a permeable reactive barrier: (A) feed vessel with synthetic water with nitrate content, (B) peristaltic pump, (C) column of soil with PRB–A400-nZVI, and (D) manometers, used to indicate the pressure difference, 1–3 valves.

Figure 3.
SEM images for (a) original resin A400, (b) A400-nZVI before reaction N, (c) A400-nZVI after reaction N, (d) EDAX original resin A400, (e) EDAX for A400-nZVI before reaction N, and (f) EDAX A400-nZVI after reaction N.
Figure 3.
SEM images for (a) original resin A400, (b) A400-nZVI before reaction N, (c) A400-nZVI after reaction N, (d) EDAX original resin A400, (e) EDAX for A400-nZVI before reaction N, and (f) EDAX A400-nZVI after reaction N.
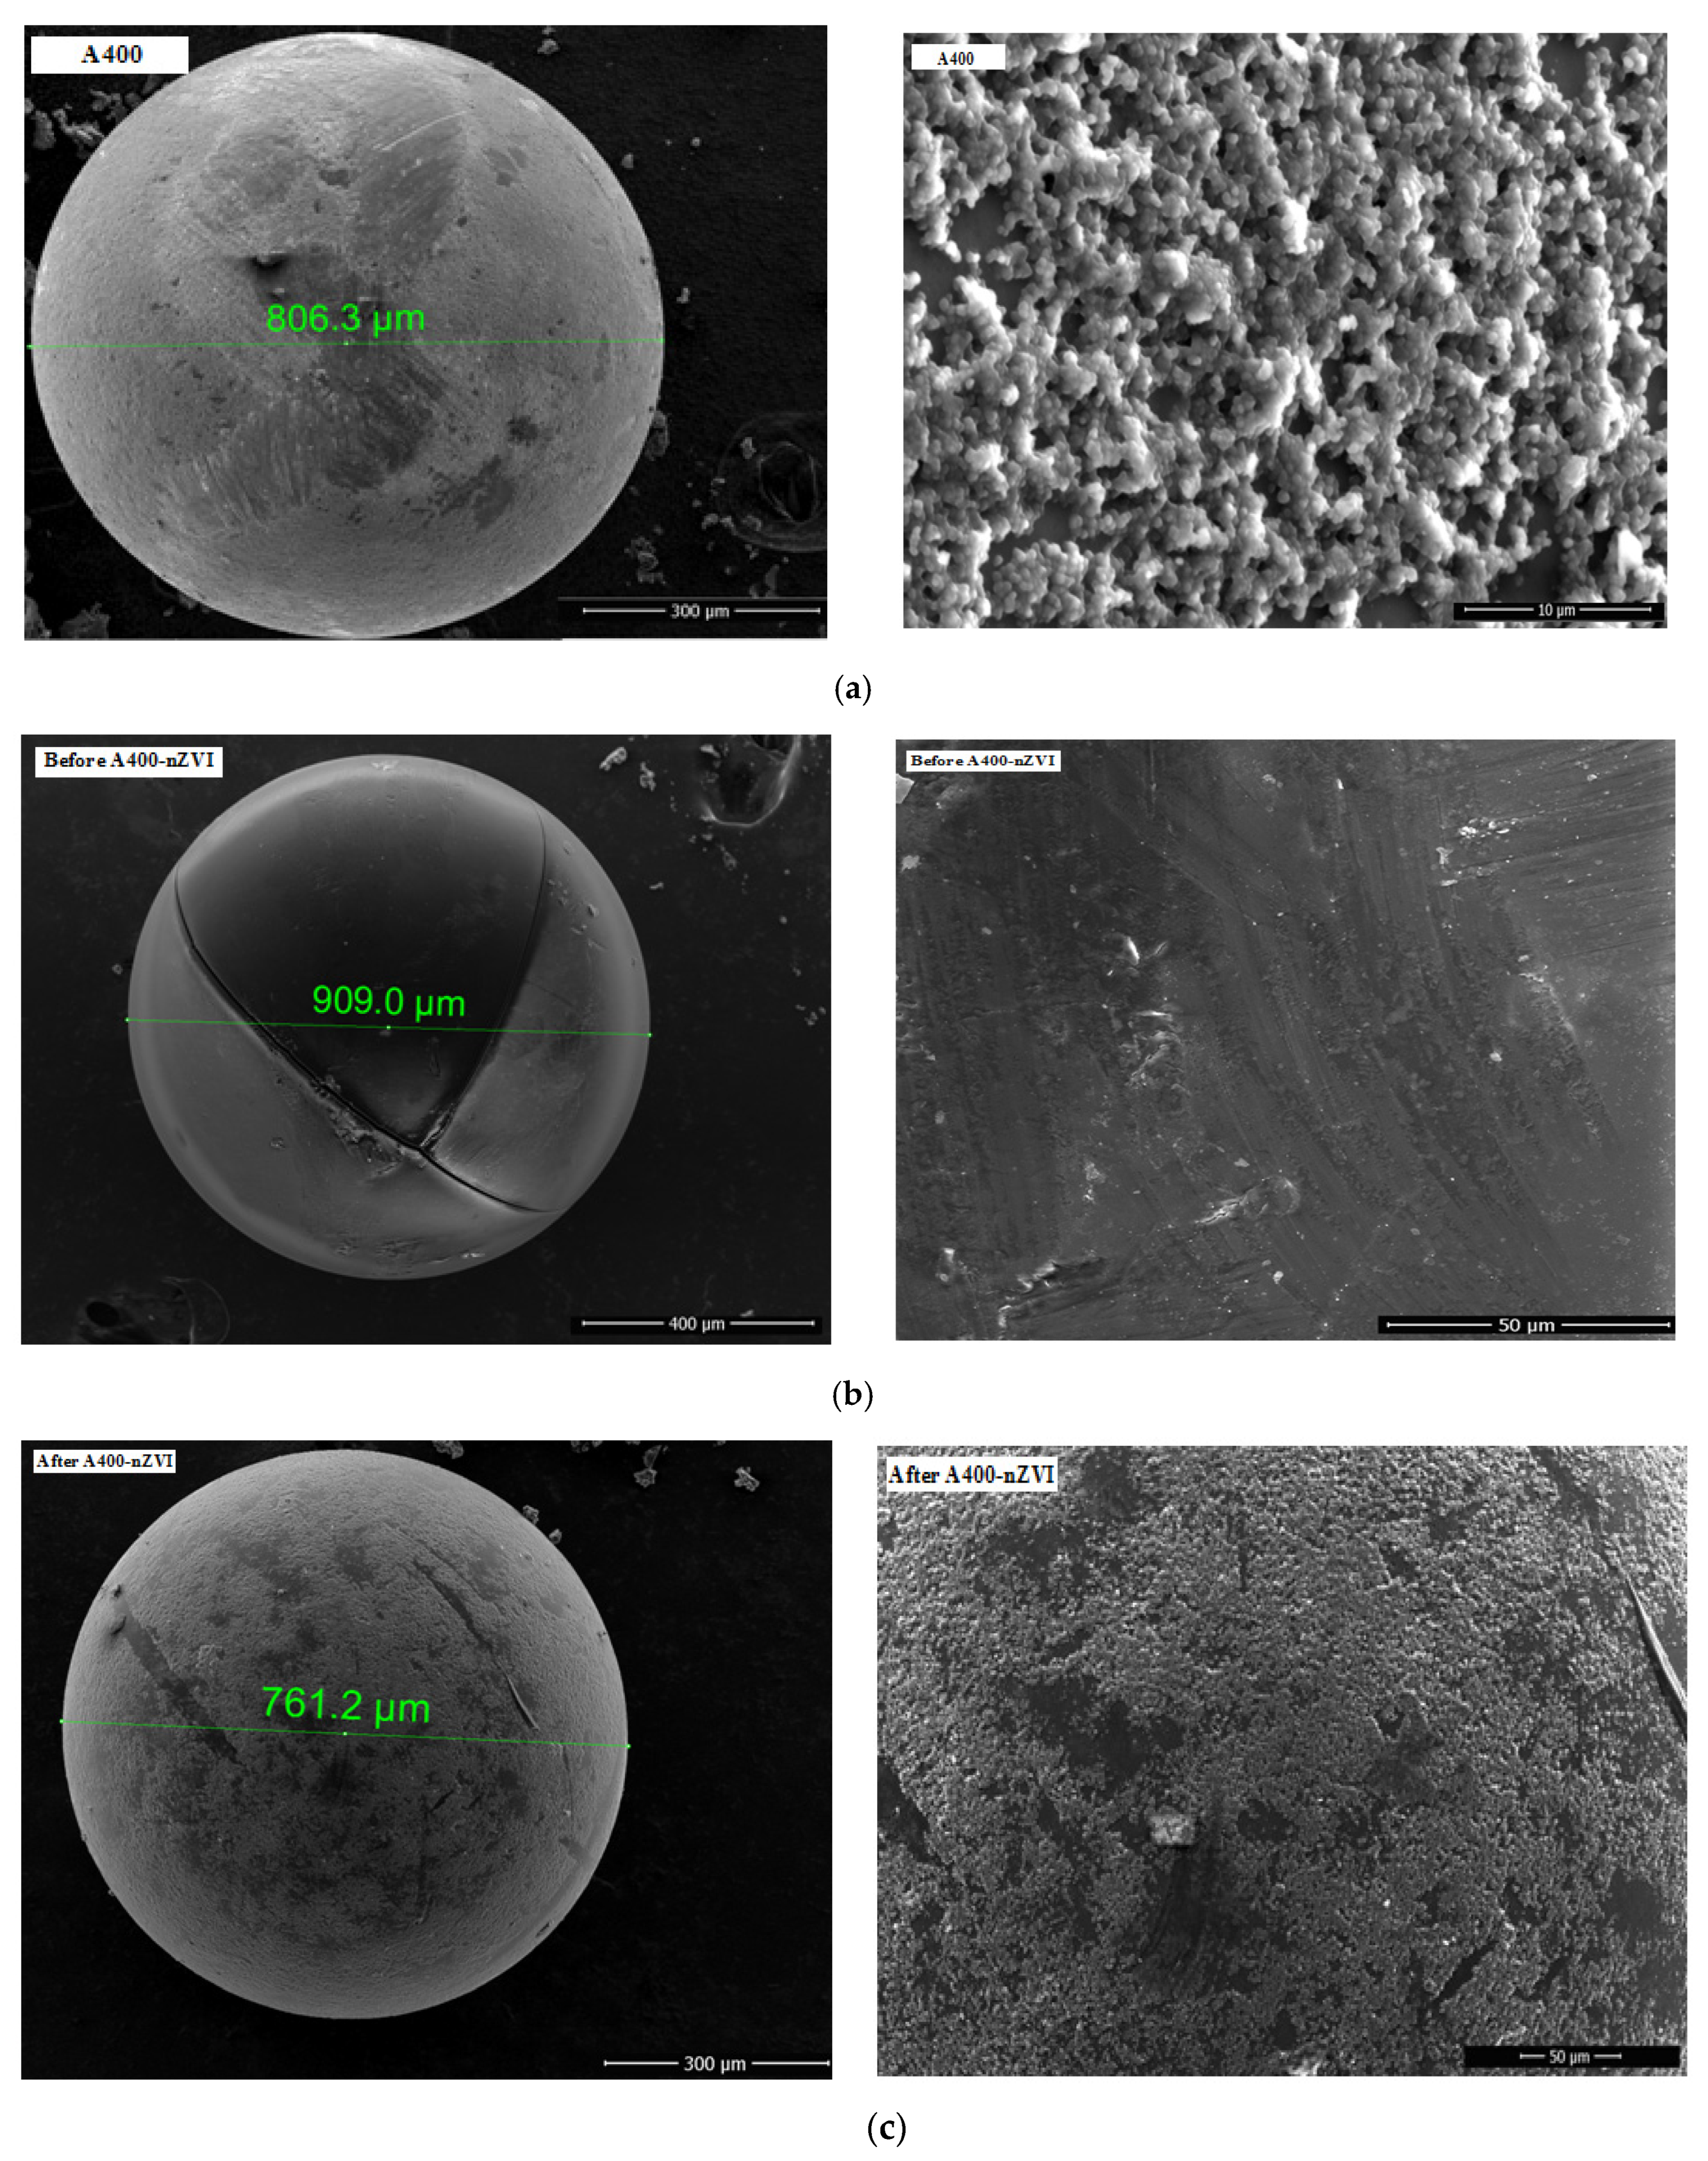

Figure 4.
The FTIR spectra of sample (a) A400, (b) A400-nZVI, and (c) A400-nZVI after reaction with .
Figure 4.
The FTIR spectra of sample (a) A400, (b) A400-nZVI, and (c) A400-nZVI after reaction with .

Figure 5.
XRD spectra of polymeric materials: (a) A400-nZVI and (b,c) A400-nZVI and after the reaction with nitrate ions.
Figure 5.
XRD spectra of polymeric materials: (a) A400-nZVI and (b,c) A400-nZVI and after the reaction with nitrate ions.

Figure 6.
Variation in nitrate concentration in samples after redox reaction associated with solution recirculation at three flow rates.
Figure 6.
Variation in nitrate concentration in samples after redox reaction associated with solution recirculation at three flow rates.
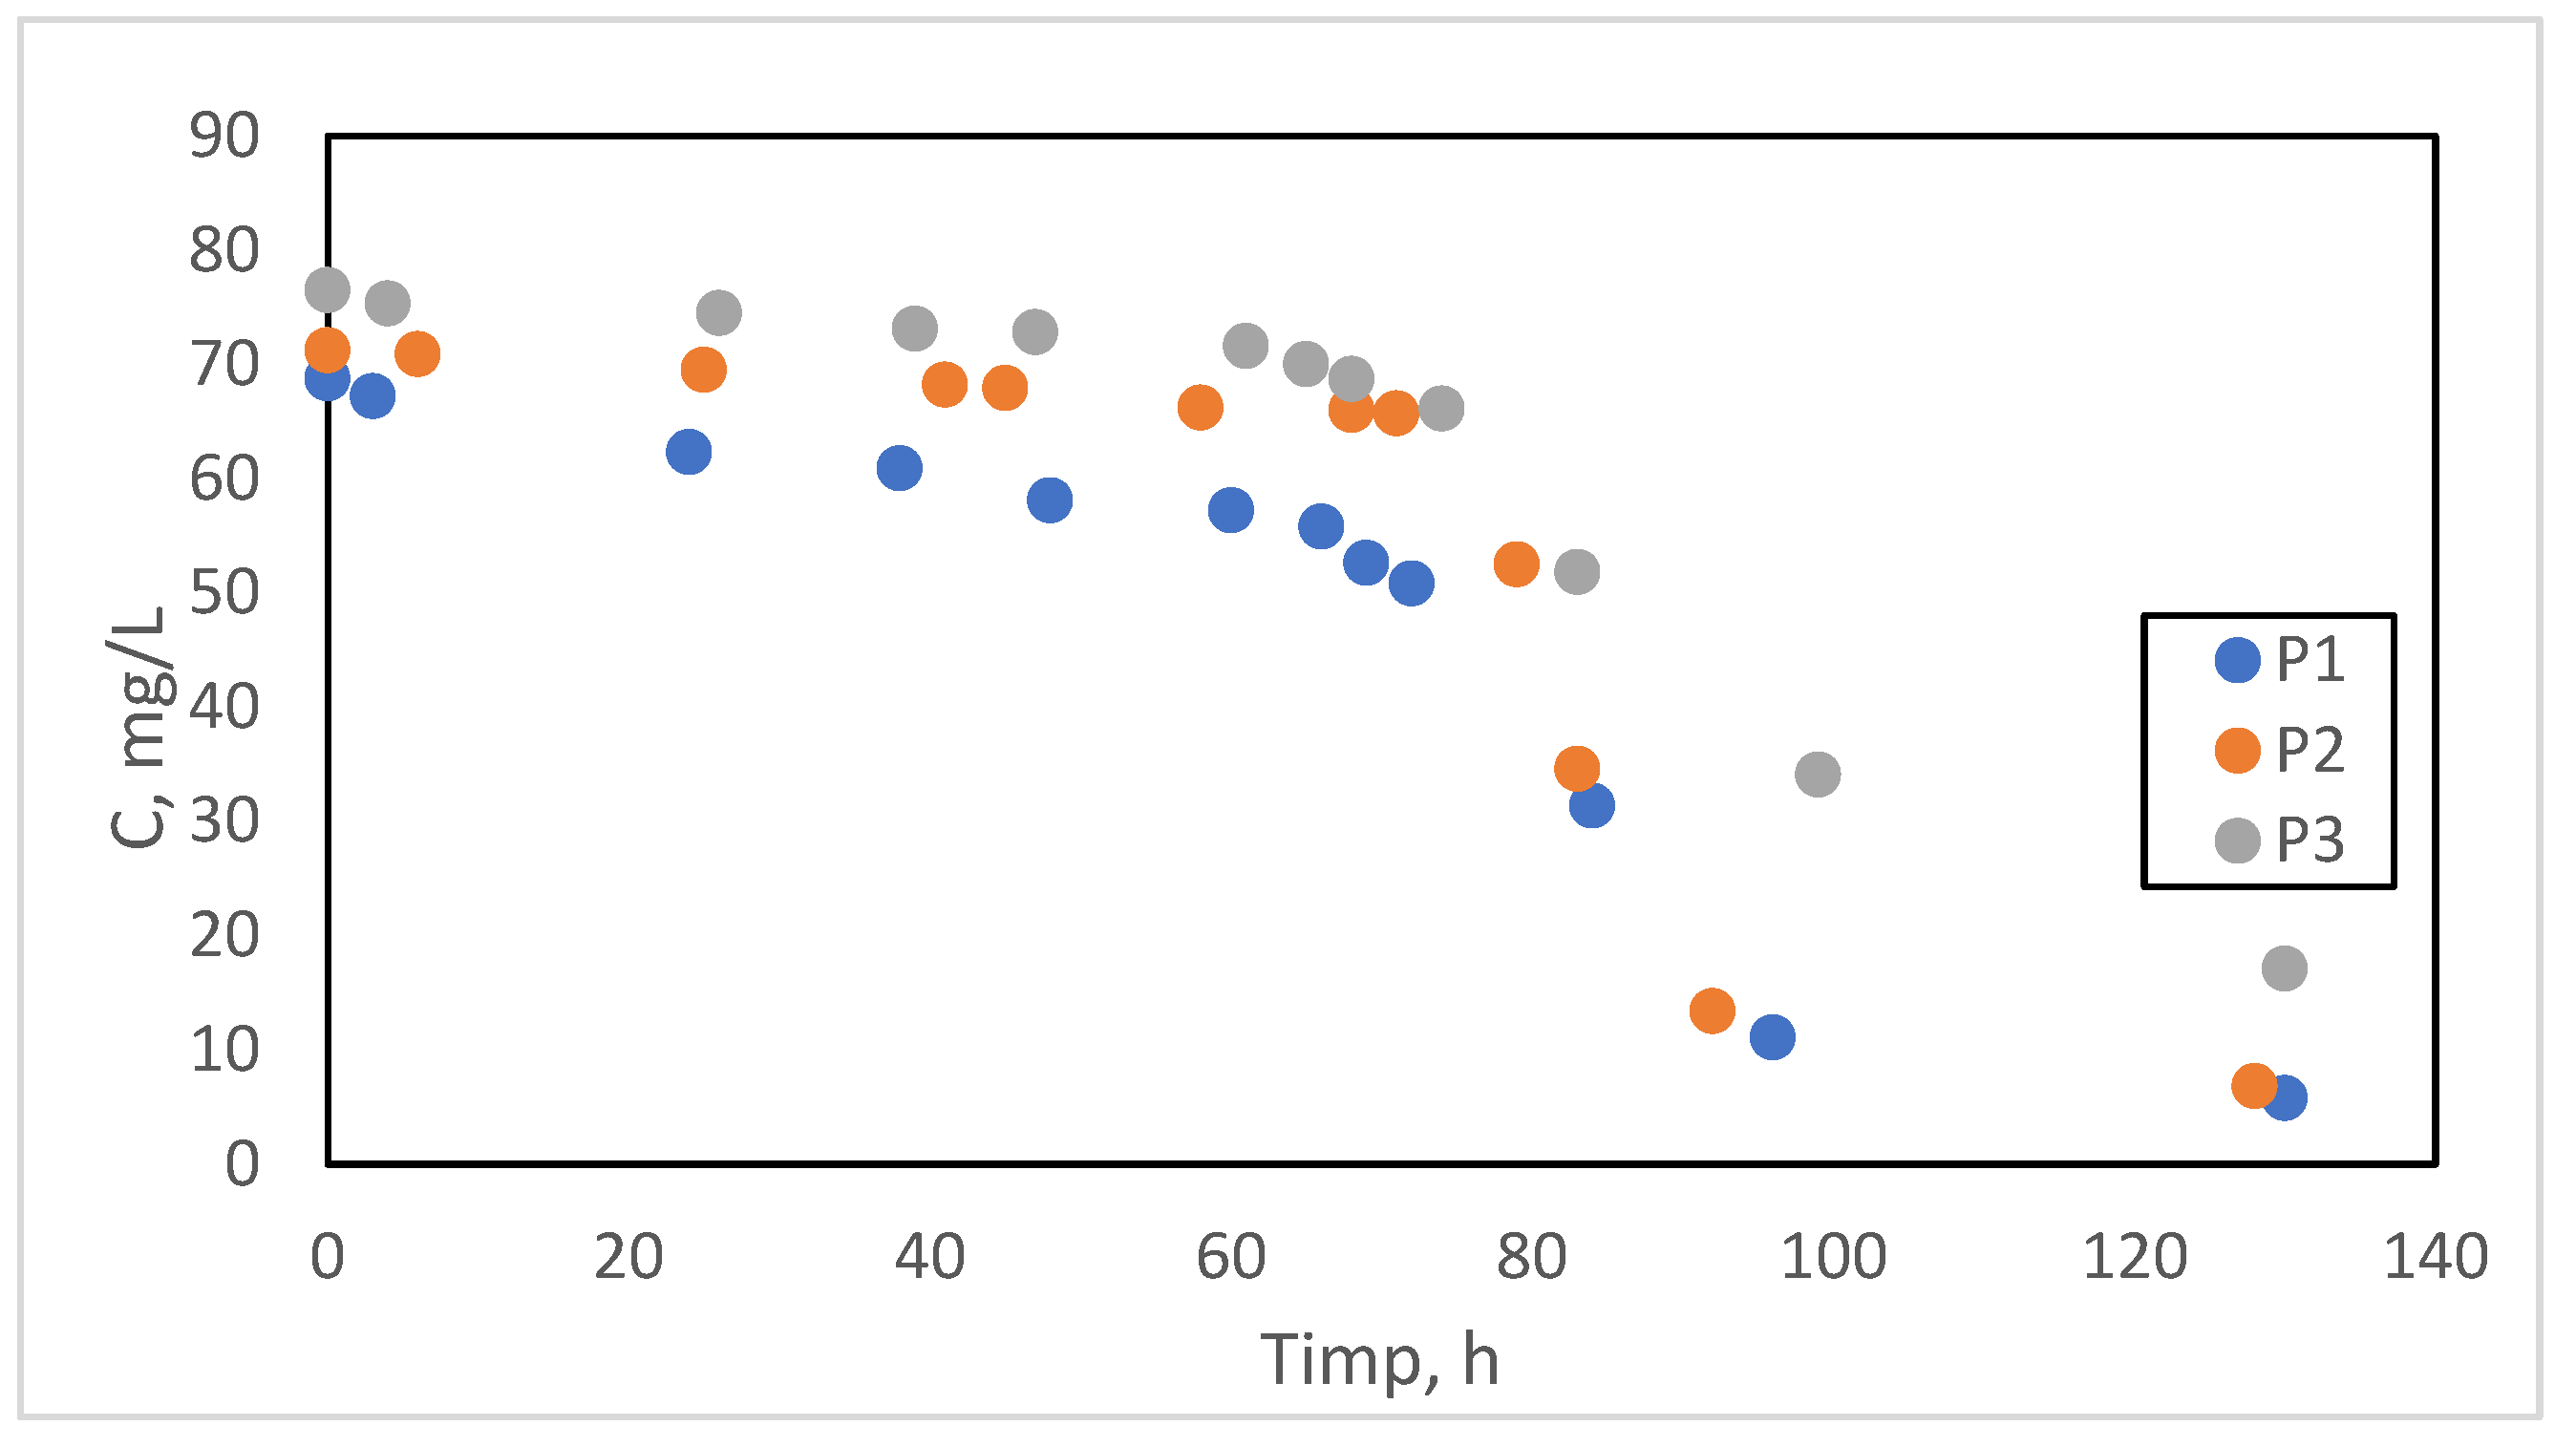
Figure 7.
Logistic curves compared to the experimental points for the three samples.

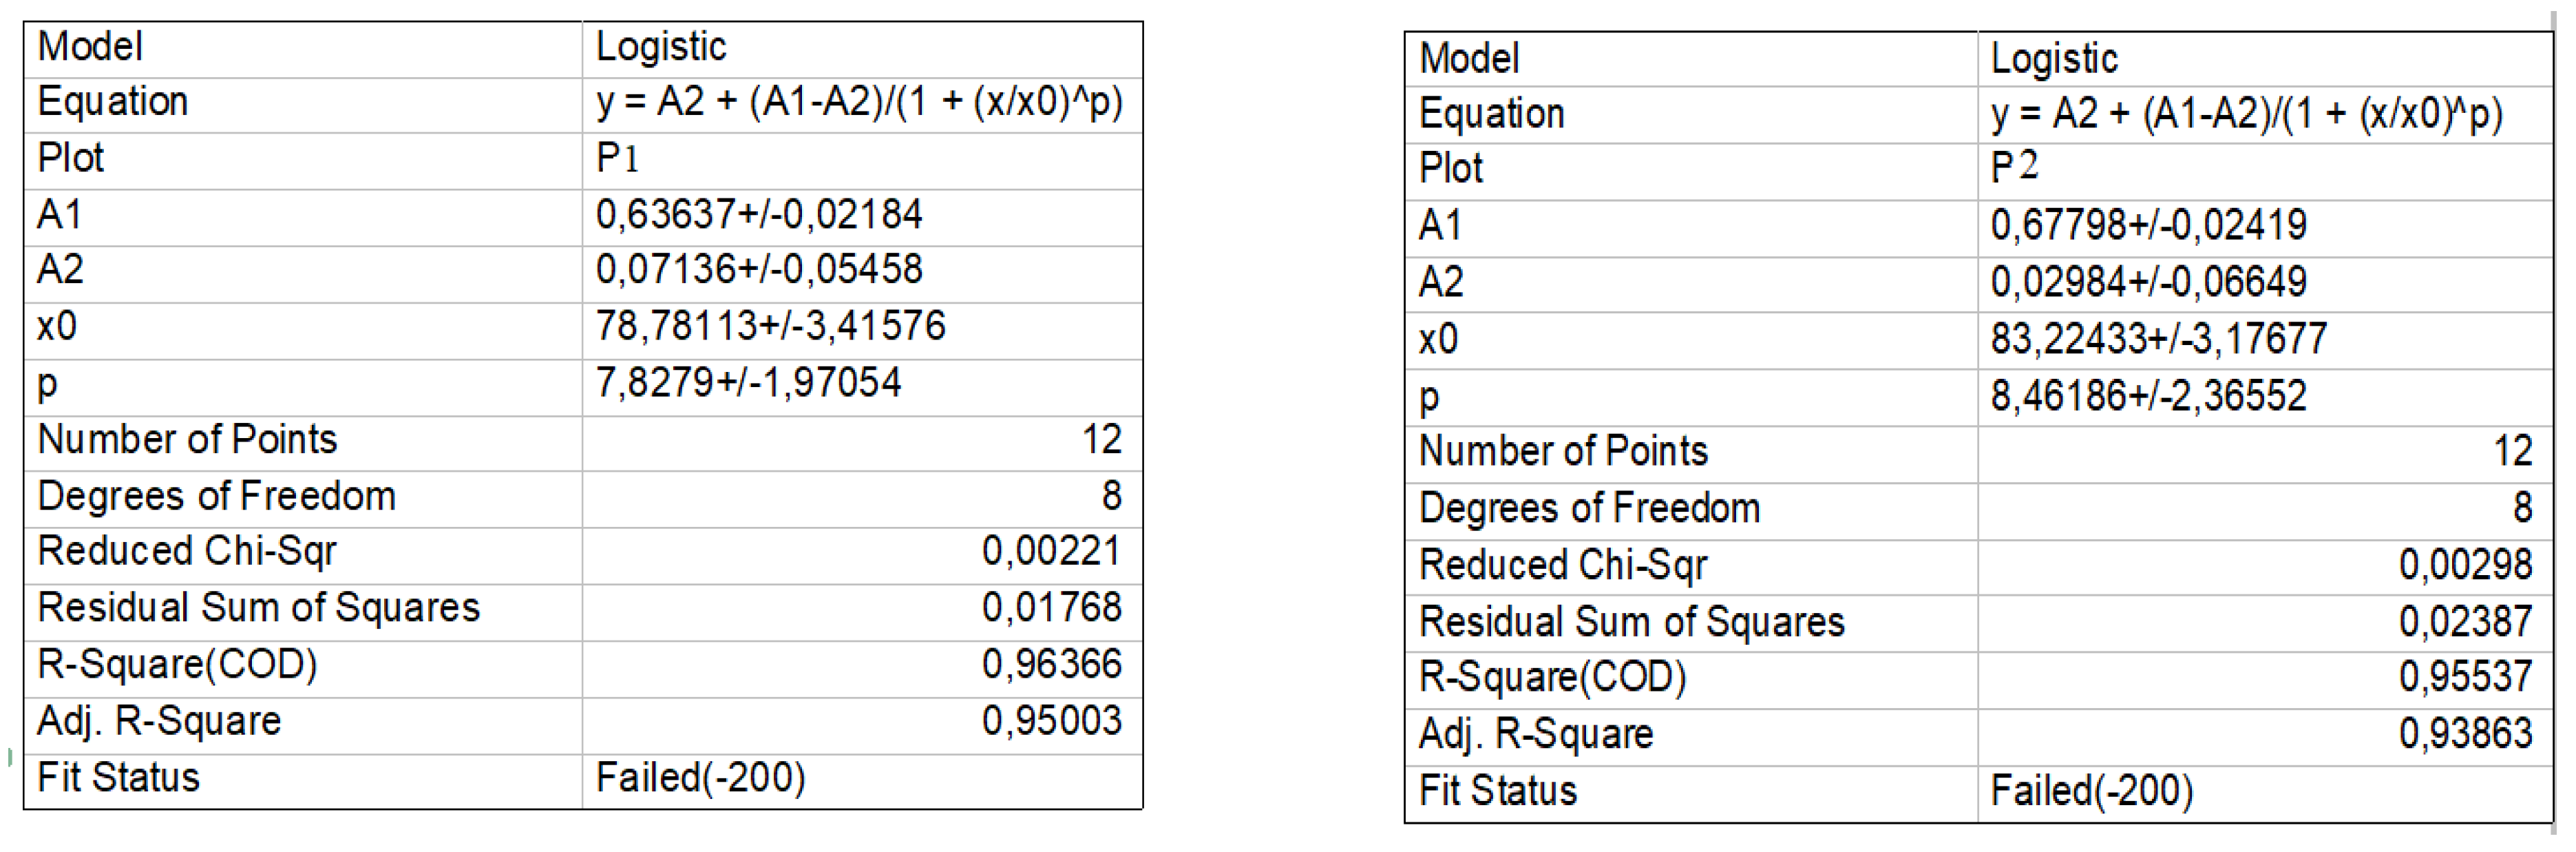
Figure 8.
Concentration profile for nitrate, nitrite, and ammonia for the nitrate ion for sample P1.
Figure 8.
Concentration profile for nitrate, nitrite, and ammonia for the nitrate ion for sample P1.
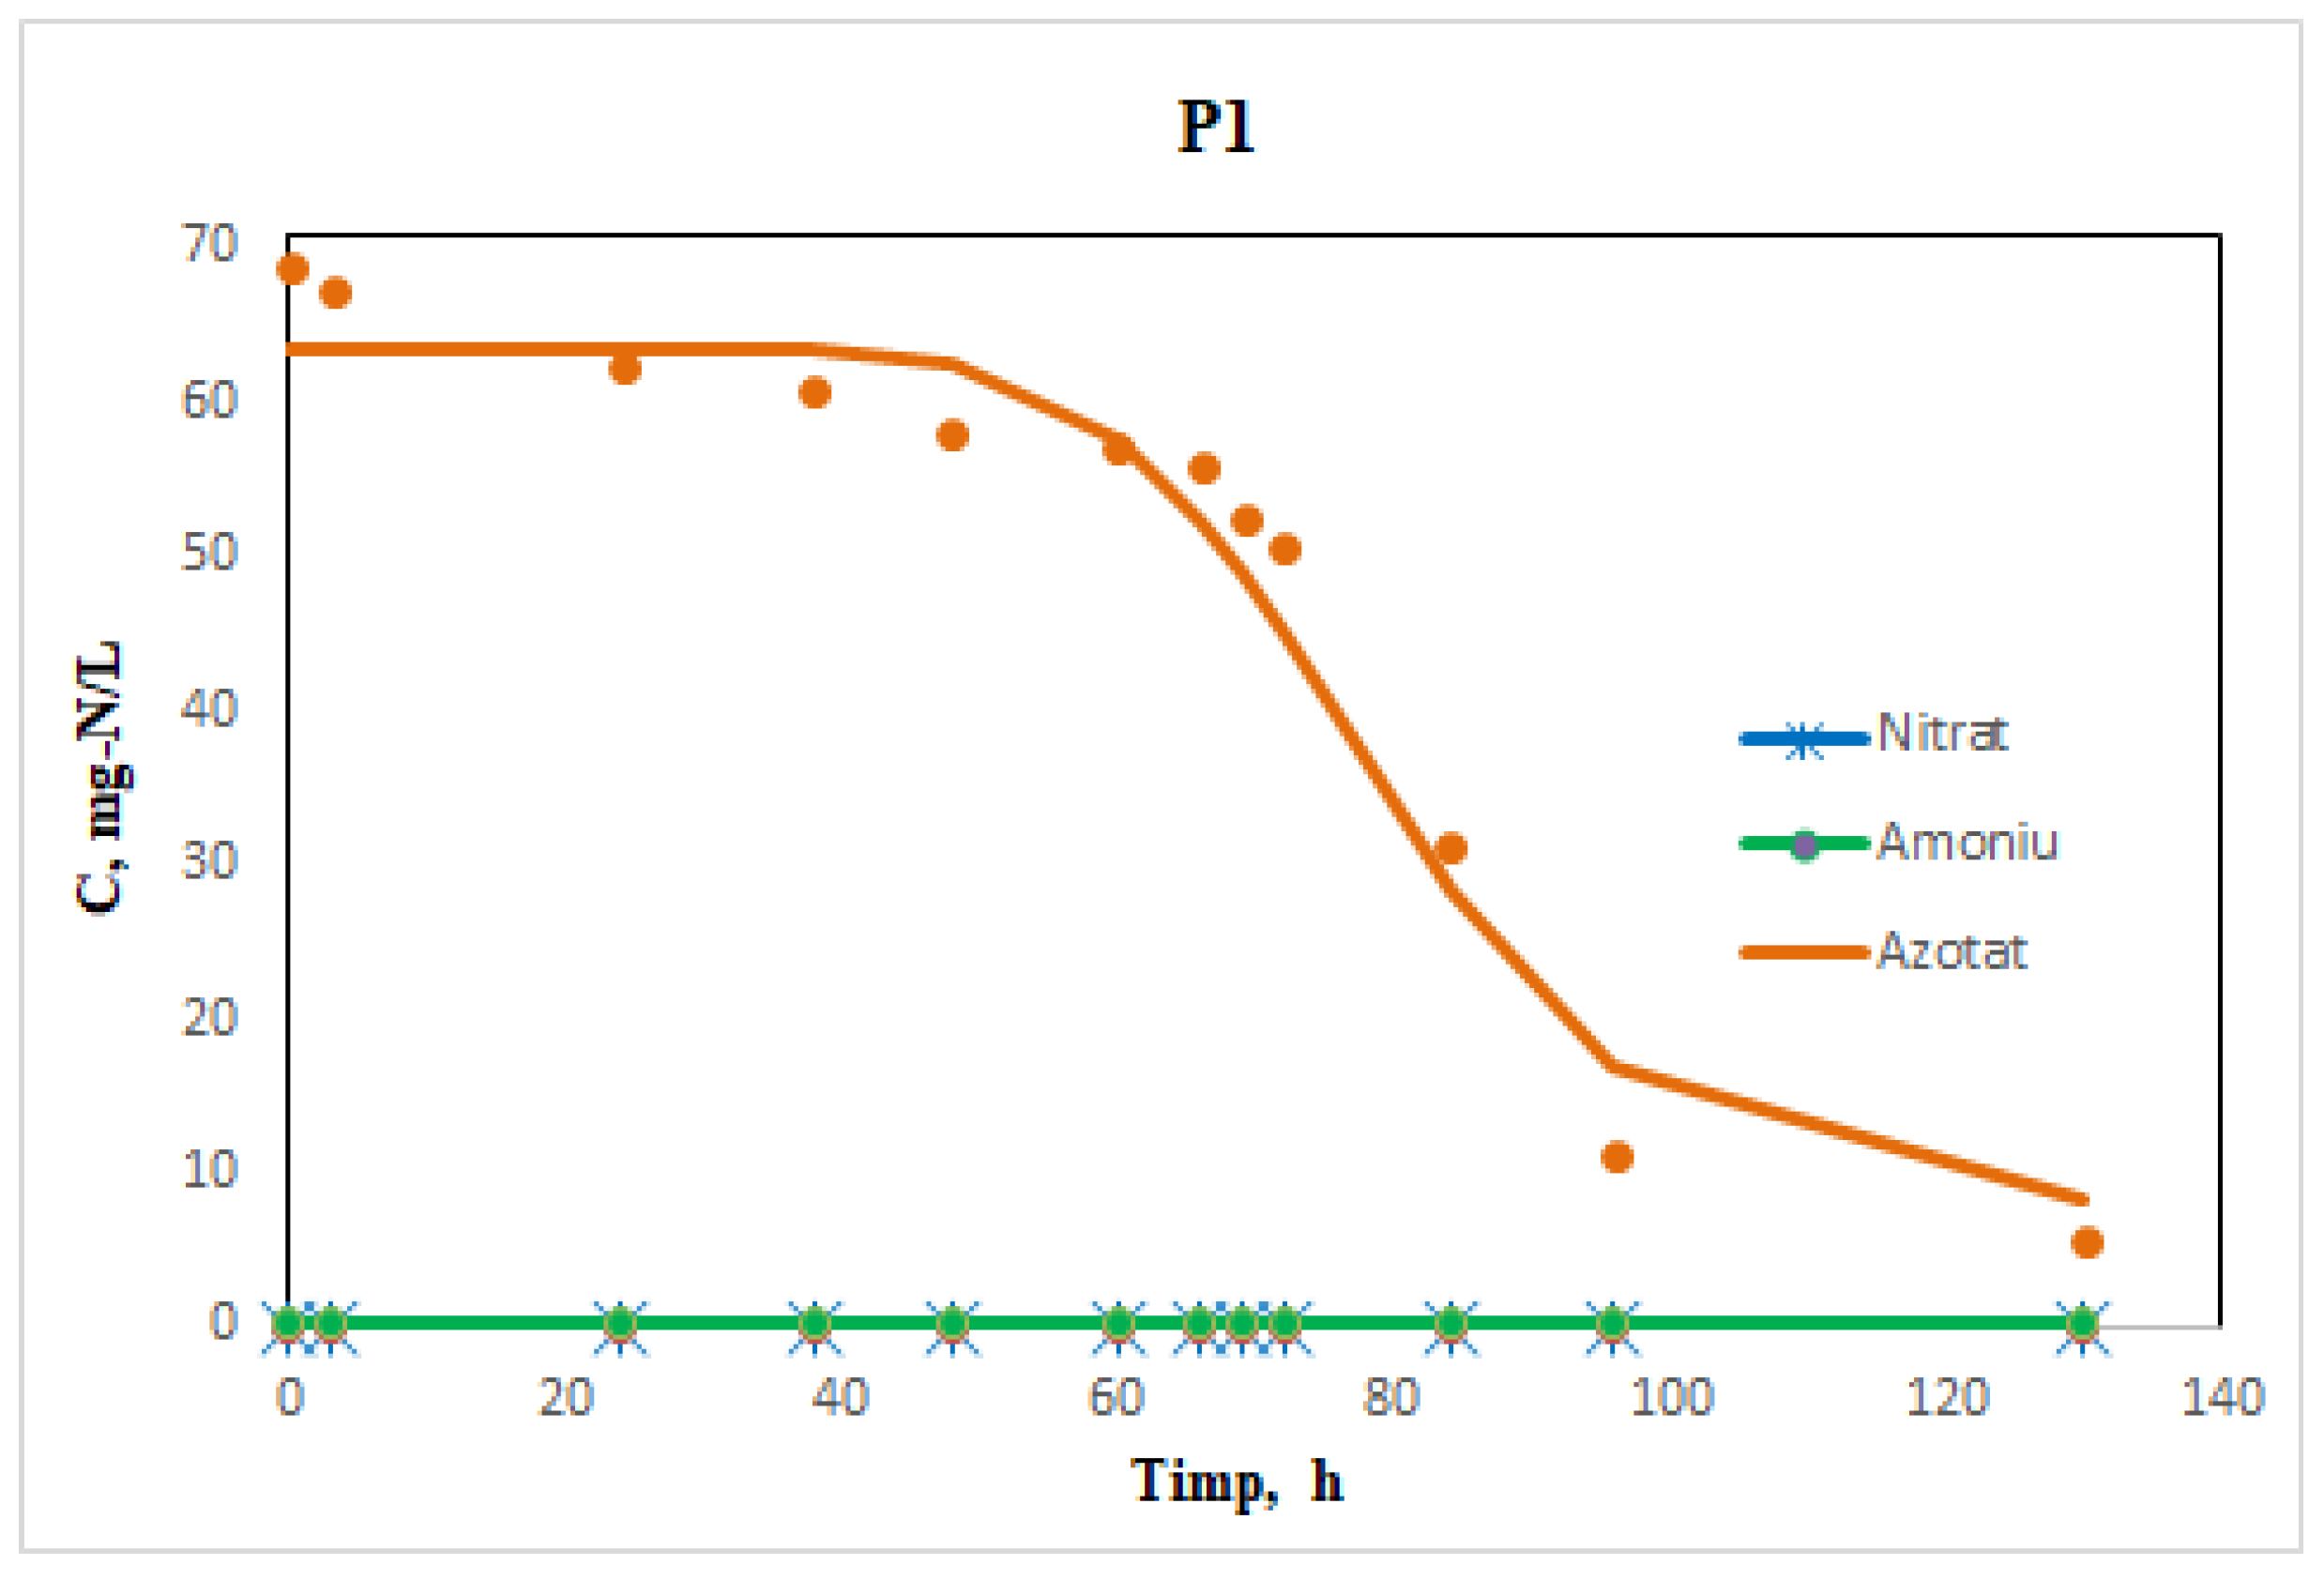
Figure 9.
Scheme of the nitrate reduction mechanism with nZVI.


Table 1.
Experimental data regarding the variation in the absolute concentration of ions as a function of time for the three types of flows, for C0 = 100 mg/L.
Table 1.
Experimental data regarding the variation in the absolute concentration of ions as a function of time for the three types of flows, for C0 = 100 mg/L.
| P1 | P2 | P3 | |||
|---|---|---|---|---|---|
| Time (h) | (mg/L) | Time (h) | (mg/L) | Time (h) | (mg/L) |
| 0 | 68.75 | 0 | 71.2 | 0 | 76.5 |
| 3 | 67.2 | 6 | 70.9 | 4 | 75.3 |
| 24 | 62.3 | 25 | 69.5 | 26 | 74.5 |
| 38 | 60.9 | 41 | 68.2 | 39 | 73.1 |
| 48 | 58.1 | 45 | 67.9 | 47 | 72.8 |
| 60 | 57.2 | 58 | 66.2 | 61 | 71.6 |
| 66 | 55.8 | 68 | 66.0 | 65 | 70 |
| 69 | 52.6 | 71 | 65.7 | 68 | 68.7 |
| 72 | 50.79 | 79 | 52.5 | 74 | 66.1 |
| 84 | 31.36 | 83 | 34.6 | 83 | 51.8 |
| 96 | 11.1 | 92 | 13.4 | 99 | 34.1 |
| 130 | 5.76 | 128 | 6.8 | 130 | 17.1 |
Table 2.
Parameters of the kinetic model.
| Proba | t1/2, (h) | k, (h−1) |
|---|---|---|
| P1 | 72 | 9.62 × 10⁻³ |
| P2 | 75.2 | 9.21 × 10⁻³ |
| P3 | 80.1 | 8.62 × 10⁻³ |
Table 3.
The removal efficiency (η) of the nitrate ion from synthetic water.
| η1, % | η2, % | η3, % |
|---|---|---|
| 31.5 | 28.8 | 23.5 |
| 32.8 | 30.6 | 25.5 |
| 37.7 | 31.8 | 27.2 |
| 39.1 | 33.9 | 29.9 |
| 41.9 | 35.3 | 31.3 |
| 42.8 | 37.6 | 33.1 |
| 44.2 | 38.9 | 34.3 |
| 47.4 | 42.6 | 36.5 |
| 49.21 | 47.5 | 43.7 |
| 68.64 | 65.4 | 48.2 |
| 88.9 | 86.6 | 65.9 |
| 94.24 | 93.2 | 82.9 |
Table 4.
PRB parameters.
| Q, m3/s | k, m⋅s−1 | v, m⋅s−1 | K, m2 |
|---|---|---|---|
| Q1 | 0.23 × 10⁻² | 1.64 × 10⁻⁴ | 2.17 × 10⁻⁷ |
| Q2 | 0.28 × 10⁻² | 1.97 × 10⁻⁴ | |
| Q3 | 0.47 × 10⁻² | 3.27 × 10⁻⁴ |
Disclaimer/Publisher’s Note: The statements, opinions and data contained in all publications are solely those of the individual author(s) and contributor(s) and not of MDPI and/or the editor(s). MDPI and/or the editor(s) disclaim responsibility for any injury to people or property resulting from any ideas, methods, instructions or products referred to in the content. |
© 2024 by the authors. Licensee MDPI, Basel, Switzerland. This article is an open access article distributed under the terms and conditions of the Creative Commons Attribution (CC BY) license (https://creativecommons.org/licenses/by/4.0/).
Share and Cite
MDPI and ACS Style
Orbuleţ, O.D.; Modrogan, C.; Covaliu-Mierla, C.-I. Simulating Aquifer for Nitrate Ion Migration Processes in Soil. Water 2024, 16, 783. https://doi.org/10.3390/w16050783
AMA Style
Orbuleţ OD, Modrogan C, Covaliu-Mierla C-I. Simulating Aquifer for Nitrate Ion Migration Processes in Soil. Water. 2024; 16(5):783. https://doi.org/10.3390/w16050783
Chicago/Turabian StyleOrbuleţ, Oanamari Daniela, Cristina Modrogan, and Cristina-Ileana Covaliu-Mierla. 2024. "Simulating Aquifer for Nitrate Ion Migration Processes in Soil" Water 16, no. 5: 783. https://doi.org/10.3390/w16050783
Note that from the first issue of 2016, this journal uses article numbers instead of page numbers. See further details here.