
Numerical Study of Pore Water Pressure in Frozen Soils during Moisture Migration
1
Department of Geocryology, Geological Faculty, Lomonosov Moscow State University, 119991 Moscow, Russia
2
State Key Laboratory of Geological Processes and Mineral Resources, China University of Geosciences, Wuhan 430078, China
*
Author to whom correspondence should be addressed.
Water 2024, 16(5), 776; https://doi.org/10.3390/w16050776
Submission received: 21 December 2023
/
Revised: 2 March 2024
/
Accepted: 4 March 2024
/
Published: 5 March 2024
(This article belongs to the Special Issue Advances in Water–Rock Interactions and Thermo-Hydro-Mechanical Processes)
Abstract
:Frost heaving in soils is a primary cause of engineering failures in cold regions. Although extensive experimental and numerical research has focused on the deformation caused by frost heaving, there is a notable lack of numerical investigations into the critical underlying factor: pore water pressure. This study aimed to experimentally determine changes in soil water content over time at various depths during unidirectional freezing and to model this process using a coupled hydrothermal approach. The agreement between experimental water content outcomes and numerical predictions validates the numerical method’s applicability. Furthermore, by applying the Gibbs free energy equation, we derived a novel equation for calculating the pore water pressure in saturated frozen soil. Utilizing this equation, we developed a numerical model to simulate pore water pressure and water movement in frozen soil, accounting for scenarios with and without ice lens formation and quantifying unfrozen water migration from unfrozen to frozen zones over time. Our findings reveal that pore water pressure decreases as freezing depth increases, reaching near zero at the freezing front. Notably, the presence of an ice lens significantly amplifies pore water pressure—approximately tenfold—compared to scenarios without an ice lens, aligning with existing experimental data. The model also indicates that the cold-end temperature sets the maximum pore water pressure value in freezing soil, with superior performance to Konrad’s model at lower temperatures in the absence of ice lenses. Additionally, as freezing progresses, the rate of water flow from the unfrozen region to the freezing fringe exhibits a fluctuating decline. This study successfully establishes a numerical model for pore water pressure and water flow in frozen soil, confirms its validity through experimental comparison, and introduces an improved formula for pore water pressure calculation, offering a more accurate reflection of the real-world phenomena than previous formulations.
1. Introduction
Freezing-induced swelling is a principal cause of construction-related issues in cold regions, primarily due to moisture migration and ice lens formation [1,2]. The increasing amount of construction of high-speed railways in these areas demands higher anti-freezing and expansion standards, emphasizing the importance of understanding moisture migration and ice lens mechanisms, which are directly linked to pore water pressure [3].
Soil freezing and swelling is a multifaceted, coupled hydrothermal force problem, comprising two primary components: water migration in soils and ice lens formation. The capillary model and the freezing fringe model are the two main types of models developed in the early stages for understanding soil freezing and swelling.
Early capillary models used capillary action as a driver of water migration. Beskow first suggested that the migration process of unfrozen water to the freezing front in saturated frozen soils is similar to that of water to the evaporation front during soil drying [4]. The Young–Laplace equation can be used to describe the contact relationship between pore water and pore gases in unfrozen soils, where capillary action dominates. Jackson and Chalmers subsequently investigated the connection between interfacial energy and the contact angle between soil particles, unfrozen water, and ice in frozen soils [5]. In addition, Koopmans developed the equation for differential pressure in frozen soils by experimentally investigating the contact interaction between pore ice and pore water [6]. Everett applied the Young–Laplace equation to investigate how ice crystals might damage the structure of pore walls from a thermodynamic perspective, focusing on the effects when a large pore is filled with ice [7]. Rempel contended, however, that in unsaturated, unfrozen soils, the gas phase pressure can be presumed to be homogeneous since the gas phase’s viscosity is significantly smaller than the liquid phase’s. In frozen soils, the freezing process results in unique driving forces for water migration because the ice phase has a much higher viscosity than the liquid phase. This difference stems from the distinct physical properties of the gas and ice phases [8]. The presence of a pre-thawed film of unfrozen water between soil particles and ice, driven by intermolecular forces within the water film, facilitates the migration of unfrozen water [9]. However, early capillary models failed to account for the formation of multiple lens-shaped ice bodies. Then, Miller analyzed the contact angle between frozen particles and the available experimental data to conclude that there exists a pore ice rich region between the ice lenses and the freezing front—the freezing fringe [10]—and, subsequently, the frozen fringe model became popular.
The first experimental confirmation of the freezing fringe’s existence was made by Beskow, Hoekstra, Loch, et al. in freeze-swelling experiments on chalky soils. They found that the formation temperature of ice lenses is much lower than that of pore ice, and the warmest lens is 0.2–0.4 cm away from the freezing front [11,12]. Miller pointed out that ice lens formation occurs when the pore water pressure is high enough and that this characterization is largely related to soil particle size; the smaller the grain size, the faster the freezing front advances and the higher the likelihood of an ice lenticular body forming [13,14]. Gilpin proposed that ice lenses form when the maximum ice pressure in the freezing fringe is greater than the critical separation pressure [15]. O’Neil defined the neutral pressure and considered the effective stress between soil particles as the difference between the total stress and the neutral stress. When the maximum neutral stress equals the external load, ice lens formation occurs. Then, D. Sheng simplified the models of Neil and Gilpin and proposed a new freezing model which has the advantage of fewer input parameters [16]. Konrad and Morgenstern noted that the freezing fringe’s permeability coefficient controls the development of new ice lenses [17]. Zhou et al. introduced the concept of the separation pore ratio as a method to determine the formation of ice lenses [18].
In 1973, Harlan proposed the first coupled hydrothermal model to explain frost heaving in frozen soil by examining the water and temperature fields in saturated frozen soils [19]. Thoms developed a closed set of equations for deformations, temperature, and stress in saturated frozen soil using equilibrium equations and the stress-ice partition condensation principle [20]. Employing the constrained porosity as a sub-condensation criterion, Lai et al. developed a closed system of equations on temperature and porosity to describe the coupled hydrothermal features of saturated frozen soils [21]. Geng Lin et al. used the numerical discrete method to solve these equations and constructed a one-dimensional frost swelling model for frozen soil [22]. To create a coupled hydrothermal model for saturated frozen soil using the porous medium theory, Liu Zhenzhen et al. used continuous media mechanics to obtain the effective stress equation for frozen soil [23,24].
Subsequently, Akagawa took experimental measurements of the total stress and pore water pressure within the freezing fringe, discovering a significant reduction in pore water pressure there [25]. Zhang Lianhai et al. conducted experimental observations of frozen soil columns with and without lens development. They found that frozen soil columns with lens formation had pore water pressures roughly ten times greater than those of comparable columns without lens formation [26].
Previous research on the coupled hydrothermal modeling of permafrost has predominantly concentrated on the deformation of frozen soil, yet such modeling is often complex and laden with numerous predefined parameters, failing to accurately capture the nuances of frozen soil pore water pressure. The significance of pore water pressure lies in its direct influence on ice lens formation, a key factor in frost heave within frozen soils. To address this, the present study introduces a numerical model for pore water pressure based on the hydrothermal coupling model, offering simplicity and enhancing the intuitive understanding of frozen soil pore water pressure characteristics and aiding ice lens prediction. Additionally, this study proposes a new formula for calculating pore water pressure which more accurately represents its actual characteristics when compared to traditional methodologies.
2. Controlled Differential Equation Solving
The essence of simulating the coupled hydrothermal process in frozen soil is to solve the coefficient partial differential equation.
2.1. Control Equations for Temperature Field and Water Splitting Field
Considering the two-dimensional hydrothermal coupling problem, according to Fourier’s law, the phase variable latent heat is treated as a heat source, and the differential equation for heat transfer in frozen soil is [27]:
Here, is the differential operator; is the transient temperature of the soil; is time (); is the volumetric water content; is the pore ice volume content; is the density of the soil; is the volumetric heat capacity (); is the thermal conductivity ()); and is latent heat of fusion.
The water migration pattern in frozen soil resembles that in unsaturated, unfrozen soil, particularly when accounting for the ice–water phase transition. According to Richard’s equation [28], and factoring in the pore ice being an impediment to the movement of unfrozen water [29], the differential equation for unsaturated water migration in frozen soil incorporates these considerations to model the process accurately.
is calculated by the following equation:
Here, is the soil permeability coefficient of unfrozen water (); is the unfrozen water content in the frozen soil (); is the specific water capacity, determined by the hysteresis model; and I is the impedance factor [29].
The effect of freeze-up deformation is based on the theory of linear elasticity, and the coefficient of freeze-up as a function of ice content is as follows [28,30]:
where is the mass fraction of ice content:
Here, is the density of the soil.
2.2. Pore Water Pressure Equation during Water Migration
The Gibbs free energy of the ice and water phases in frozen soil without external loading is equal when the equilibrium system reaches a new equilibrium due to a change in temperature.
The total stress of saturated frozen soil is expressed as [24,31]:
where is the total stress; is the effective pressure; is the pore water pressure; is the pore ice pressure; is the porosity; and is the saturation of unfrozen water.
Neil and Miller define the difference between the external load and the effective stress as the neutral pressure, and when the maximum neutral pressure is less than the external load, an ice lens is not produced [32]. As shown in Figure 1, at this time, at the frozen fringe, the pore water pressure is not high enough to produce an ice lens [12]. The frozen fringe satisfies the following boundary conditions:
Consequently, the pore ice pressure at the freezing fringe can be expressed as:
Equation (6) will be processed as:
where and are the densities of water and ice; is the volumetric water content; is the volumetric ice content; is the volume of water content under saturation conditions; is the latent heat of fusion; is the pore water pressure at the freezing fringe in the absence of an ice lens; is the initial freezing temperature of the soil in Celsius; and is the soil temperature in Celsius. The formula is like the one obtained by Zhou. J et al. [18].
According to Konrad’s segregation potential model, when there is no external load and no ice lens, the calculation equation of pore water pressure at the freezing fringe is as follows [33]:
where is the temperature of the water phase in degrees Celsius; is the temperature of the freezing point of pure water in degrees Kelvin; is the suction in the water phase; is the latent heat of fusion of water; is the specific volume of water; and is a constant.
As depicted in Figure 1, during the ice–water phase change, when the pore pressure exceeds the overlying load, tensile strength, or cohesion that constrains the ice partitioning of the soil, becomes evident, and ice partitioning begins to occur. When the warmest ice lens starts to form, the stresses on the soil particles and the ice lens are virtually equal.
The Clausius–Clapeyron equation is valid at the base of the ice lens. To repeat the derivation process above, the pore water pressure when there is an ice lens body is calculated as follows:
2.3. Water Flow Equation
According to Darcy’s Law, the volumetric water flow through the frozen fringe
is as depicted in Figure 2b. By using the thickness of the frozen fringe and the pore water pressure values at the interface above and below the frozen fringe, we can calculate the water flow within a given time interval.
where is the hydraulic conductivity of the soil; is the acceleration of gravity; and is the density of water. According to the literature, the thickness of the frozen fringe in this model is chosen as 4 mm, and the permeability coefficient of unfrozen water at the frozen fringe is [17].
3. Model Construction
Model and Experiment Parameters
The sample used for experiments was eluvial Paleogene kaolin clay from Gluhov etc., Ukraine (eP1). The physical parameters of the soil were determined in the laboratory following the strict guidelines in the standard for geotechnical test methods (Gost-5018-2015). The specific physical parameter indicators included [34]:
Grain size: 1–0.05 mm—0.5%; 0.05–0.002 mm—44.7%; and less than 0.002 mm—54.8%.
Particle density—2.64; soil density—1.2 ; and weight of moisture—0.46.
Specific heat capacity of soil —1.25; thermal conductivity of soil —1.55 ; and initial freezing temperature —−0.207 .
The rest of the conventional parameters of the model in Table 1 are available in the literature [28,30].
The confined unidirectional freezing experiments were carried out in the Laboratory of Permafrost Engineering at Moscow State University, and the test instrumentation consisted of a geotechnical freezing test chamber, a test mold, a thermistor temperature sensor, a displacement sensor, a data acquisition device, and an oven. The box contained a fan to circulate air and ensure even temperature distribution, and had a temperature control range spanning from −30 °C to 50 °C. The temperature ranges for the top and bottom plates were set from −40 °C to 60 °C, with a precise control accuracy of ±0.1 °C. The three temperature control systems operated independently for precise test temperature management. Alcohol was used as the circulating fluid to control the temperature of the top and bottom plates in the test mold. For this experiment, the initial water content of the samples was 45%, the cold-end temperature was set at −5 °C, the warm-end temperature at 0 °C, and the freezing duration was 120 h.
4. Numerical Simulation Results and Analysis
4.1. Temperature and Water Content Variation during Water Migration
The freezing fringe is a critical zone for phase change and water migration, characterized by the swift transition of pore water from liquid to solid states. This area’s boundary, known as the freezing front, demarcates the transition zone. For instance, at a cold-end temperature of −5 °C, as depicted in Figure 3, the freezing front progressively descends over time, with the descent rate diminishing as the duration of freezing extends. This observation is corroborated by experimental data, validating the accuracy and feasibility of the numerical simulation approach.
Further, as Figure 4 illustrates, within the frozen zone, the quantity of unfrozen water diminishes with prolonged freezing periods. Conversely, the overall water content within this zone experiences an increase, attributed to the migration of water. The process of soil water freezing, and the subsequent volumetric expansion, leads to an escalation in the pressure exerted by the unfrozen water within the pore spaces, resulting in the generation of positive pore water pressure. This pressure mechanism drives a portion of the unfrozen water to move from the unfrozen zone towards the freezing fringe. However, the presence of pore ice within the frozen zone acts as a barrier, hindering the movement of unfrozen water from the fringe to the broader freezing zone. Consequently, this dynamic results in a localized peak in water content near the freezing fringe within the frozen zone.
4.2. Pore Water Pressure Variation during Water Migration
As depicted in Figure 5, during the freezing process of the soil column, if an ice lens is not formed (i.e., when the value of pore water pressure does not reach the separation ice pressure), the pore water in the freezing zone gradually phases into ice, causing volume expansion and frost heave. Simultaneously, the pore water content in the unfrozen zone decreases, generating negative pore water pressure. With the increase in freezing depth, the pore water pressure value gradually decreases and reduces to zero at the freezing front. Meanwhile, the value of pore water pressure in the unfrozen zone remains constant at zero. This consistent difference in pore water pressure between the unfrozen zone and the freezing edge zone during the freezing process prompts the unfrozen water to continuously migrate from the unfrozen zone to the freezing zone.
After 10 h of freezing, the peak pore water pressure at a cold-end temperature of −5 °C reached −5.011 kpa, and after 40 h of freezing, it increased slightly to −5.016. This observation indicates a weak upward trend in the peak pore water pressure, accompanied by a downward trend of pore water pressure in the freezing fringe. Additionally, there is an acceleration in the rate of decline of the pore water pressure value at the freezing fringe with increased freezing time.
As shown in Figure 6, the peak frozen soil pore water pressure reaches −10.93 at a cold-end temperature of −10 °C and after a freezing time of 10 h. However, its peak value does not change after 40 h of freezing. This is attributed to the fact that, at a colder temperature, the unfrozen water at the frozen soil column’s surface will quickly freeze. Consequently, at the freezing fringe, the rate of decrease in pore water pressure is much higher than at a cold-end temperature of −5 °C.
When ice lenses develop under identical conditions of cold-end temperature and freezing duration, the pore water pressure at the freezing boundary and the soil column surface is observed to be approximately 12 times higher than in scenarios devoid of ice lens formation, aligning with extant experimental findings [26]. Furthermore, it has been determined that the peak pore water pressure maintains a direct correlation with the cold-end temperature, which can be attributed to the phenomenon where, upon setting the cold-end temperature, the pore water pressure’s maximum value remains largely invariant, irrespective of the freezing duration. As the depth of freezing extends, the pore water pressure value diminishes, eventually stabilizing at zero. These numerical insights regarding pore water pressure in frozen soils carry significant implications for forecasting ice lens emergence and evaluating frost heave-induced deformation in engineering contexts.
Furthermore, the Clausius–Clapeyron equation, which primarily describes the phase change equilibrium of a single substance, forms the basis of the Konrad model. This equation is applicable at temperatures from zero to a few degrees Celsius below the freezing point but does not accurately describe the situation at lower temperatures, according to current research and related experimental findings [35].
The outcomes of the numerical simulation calculations in this study align well with this conclusion. This is because the Konrad model makes a simple assumption that, when describing the stress equilibrium states of frozen soil pore water pressure and ice pressure, their values are equal. However, by deriving the stress balance equation of saturated frozen soil from the effective stress equation of unsaturated unfrozen soil, we can infer that a weighting factor x should exist before the value of pore water pressure can be established, although the value of x is still unknown. This study has concluded that the relative amounts of pore water and pore ice are related; the higher the temperature, the more pore water is present. At this point, it can be assumed that the pressures of pore water and pore ice are roughly equal.
The results of the model presented in this paper and those of the Konrad model calculations almost overlap at the freezing fringe, as illustrated in Figure 7. However, in the frozen region close to the top of the soil column, the temperature of the frozen soil is lower, and the amount of pore ice is higher. As a solid, pore ice exhibits some adsorption for pore water, which results in the actual pore water pressure value being lower than the results predicted by the Konrad model calculations. The calculation results of this paper are notably consistent with this characteristic and demonstrate that the calculation formula used in this paper aligns more closely with the actual pore water pressure.
4.3. Water Flow after Water Migration
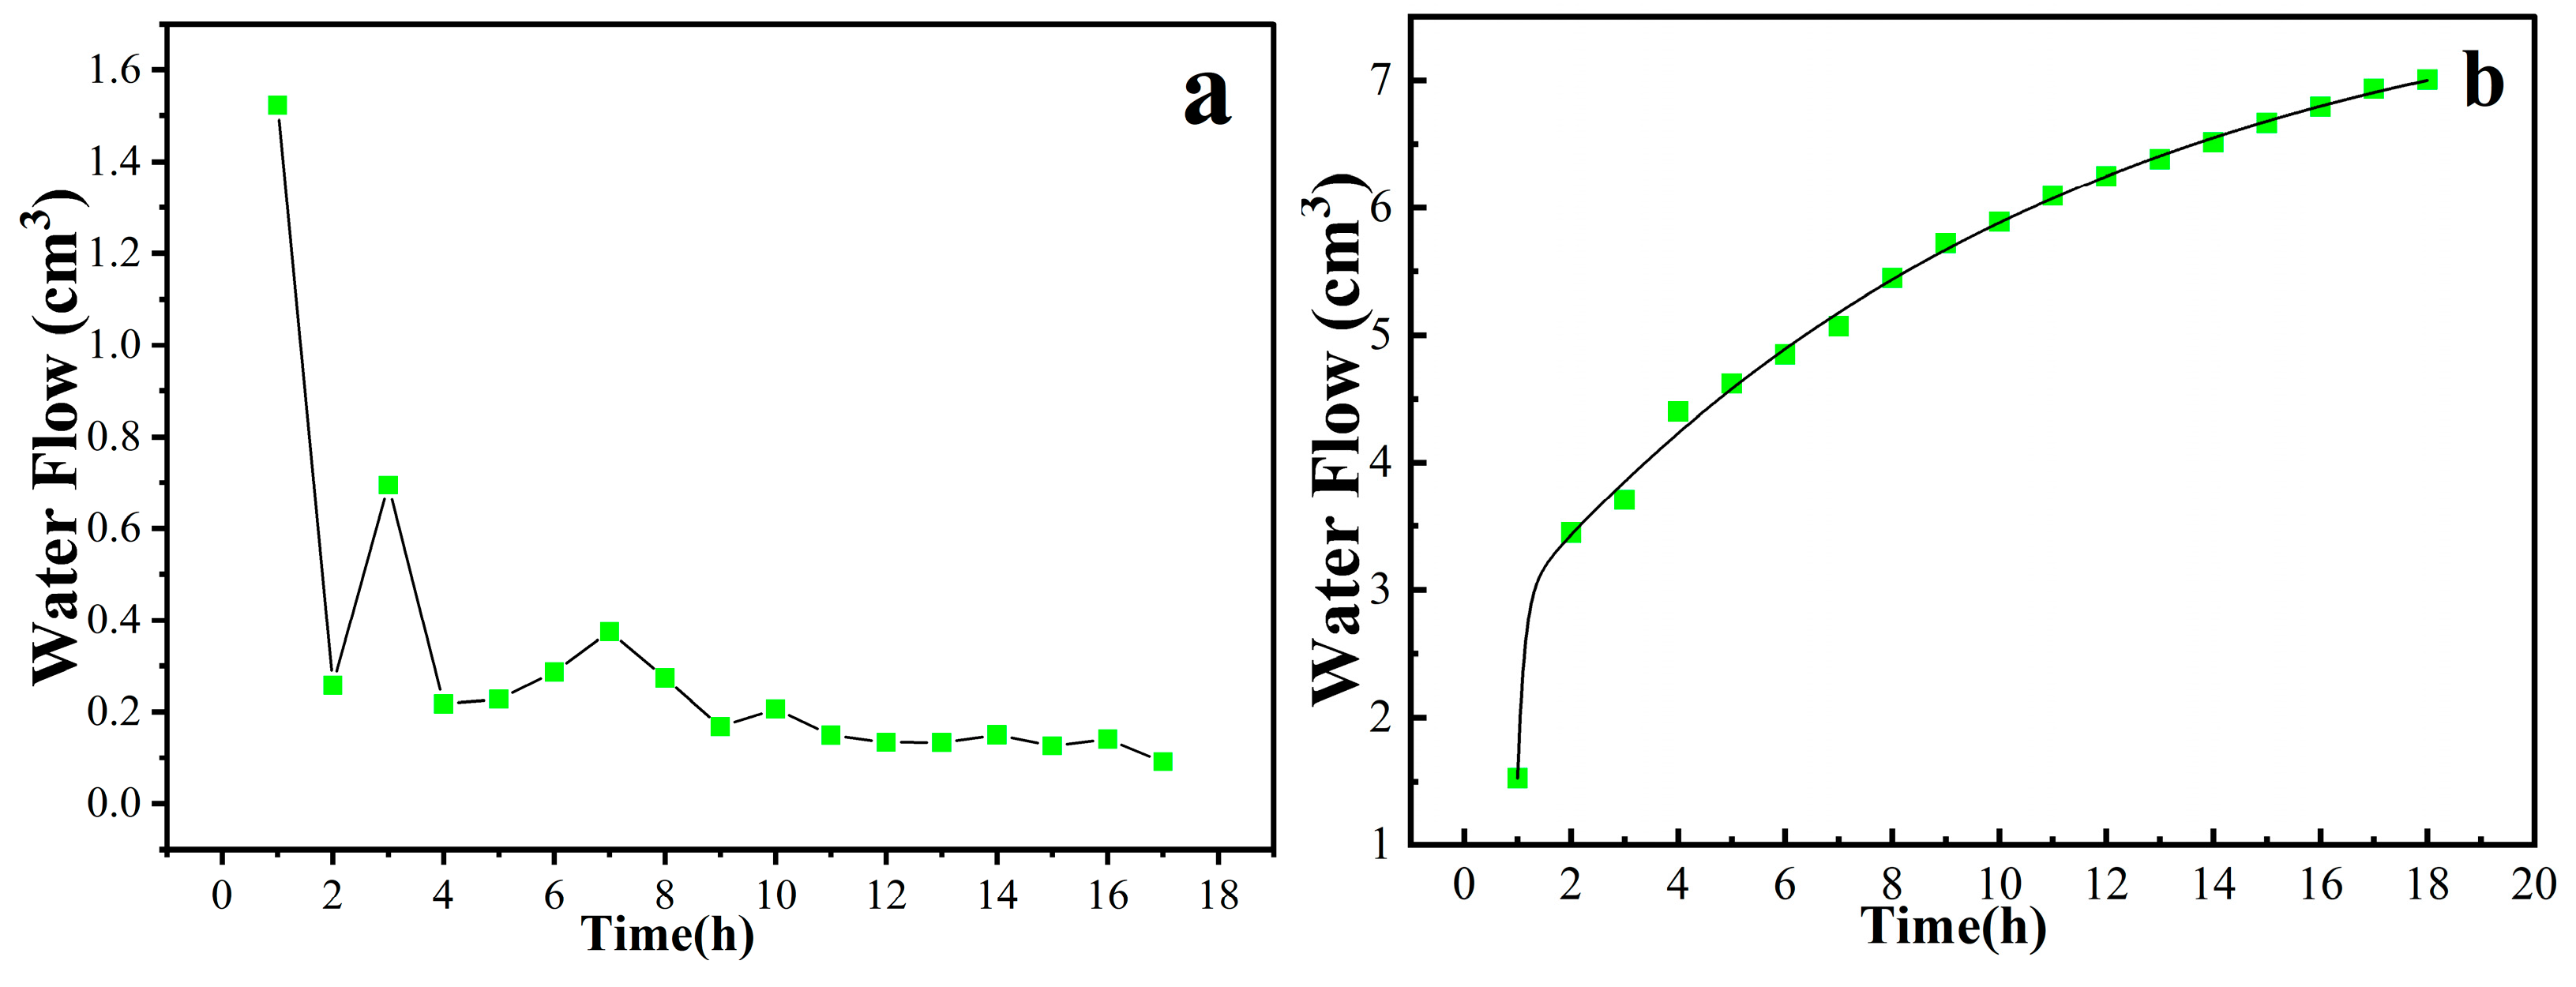
From Figure 8, it is evident that the migration of unfrozen water from the unfrozen area to the freezing edge generally shows a decreasing trend with the increase in freezing time. This trend is attributed to the fact that, as freezing time increases, the amount of unfrozen water near the freezing front in the unfrozen area decreases, leading to a reduced amount of migration per unit of time. Additionally, it is observed that the decrease in water migration exhibits periodic fluctuations. This is because, after the migration of pore water to the frozen region in the last period, the water in the lower part of the unfrozen region cannot be replenished to the area near the freezing front in a timely manner. As a result, there is a significant reduction in the volume of pore water migration in subsequent periods.
5. Conclusions
In this paper, a numerical simulation study of the pore water pressure and water flow in frozen soil is conducted based on the THM model, and a new pore water pressure calculation formula is introduced. The results of this study are consistent with previous experimental studies, providing a more convenient method for the future study and prediction of permafrost properties under limited experimental conditions. The numerical simulation study reveals some characteristics of permafrost pore water pressure and water flow.
The findings of this paper are more aligned with previous studies, highlighting that the Clausius–Clapeyron equation tends to overestimate the pore water pressure at lower temperatures. Additionally, the calculations corroborate previously reported experimental results indicating that permafrost pore water pressure with ice lenses is approximately ten times greater than that without ice lenses. It is also observed that the rate of temperature decrease with depth is significantly slower than the rate of pore water pressure decrease. Finally, as the freezing time increases, the water flow from the unfrozen region to the frozen edge per unit of time shows a tendency to fluctuate and decrease.
In the future, numerical simulation of pore water pressure in the presence of overlying load in the open system can be carried out based on this, and, at the same time, relevant experiments can be carried out to verify and improve findings, which is of practical significance for the prevention of freezing and expansion disasters in projects.
6. Discussions
In this research, the pore water pressure was meticulously examined utilizing a hydrothermal coupling model, leading to the refinement of a novel pore water pressure equation. The simulation outcomes, both in the presence and absence of ice lenses, are in harmony with prior experimental findings, showcasing an enhanced alignment with practical engineering scenarios when compared to traditional models.
However, the study is not without its limitations. For instance, the van Genuchten model parameters (a, m, n, residual water content , etc.) employed in the model were sourced from the existing literature, and the exact value for the weight coefficient x within the effective stress equation remains undetermined. The reliance on assumptions and estimated values for these parameters may impinge on the model’s accuracy. The precision of the numerical model could see improvement through the acquisition of van Genuchten model parameters via soil–water characteristic curve (SWCC) experiments conducted within the scope of this study. Moreover, the simplifications and assumptions underlying the numerical simulations may compromise the results, necessitating further experimental corroboration and enhancements. Additionally, the model encounters application constraints and fails to encapsulate the characteristics of pore water pressure under the influence of overburden load in actual project construction scenarios.
Author Contributions
Conceptualization, B.Z. and A.V.B.; methodology, B.Z. and A.V.B.; software, B.Z. and A.V.B.; validation, B.Z., J.H. and A.V.B.; formal analysis, B.Z. and A.V.B.; investigation, B.Z. and A.V.B.; resources, B.Z., J.H. and A.V.B.; data curation, B.Z.; writing—original draft preparation, B.Z.; writing—review and editing, B.Z. and A.V.B.; visualization, A.V.B.; supervision, A.V.B.; project administration, A.V.B.; funding acquisition, A.V.B. All authors have read and agreed to the published version of the manuscript.
Funding
This research received no external funding.
Data Availability Statement
Data is contained within the article.
Conflicts of Interest
The authors declare no conflict of interest.
Nomenclature
| specific heat capacity of soil | |
| specific heat capacity of water | |
| specific heat capacity of ice | |
| thermal conductivity of soil | |
| thermal conductivity of water | |
| thermal conductivity of ice | |
| latent heat of fusion | |
| density of ice | |
| density of water | |
| density of soil | |
| pore ice pressure | |
| saturated moisture volume content | |
| residual moisture content | |
| Initial freezing temperature of soil | |
| coefficient related to solid–liquid ratio | |
| Permeability coefficient of saturated soils | |
| VG model parameters | |
| VG model parameters | |
| VG model parameters | |
| Initial Saturation | |
| permeability coefficient | |
| unfrozen water content | |
| specific water volume | |
| volume water content | |
| volume ice content | |
| impedance factor | |
| diffusion coefficient | |
| thermal conductivity | |
| ice-to-liquid ratio | |
| pore water pressure | |
| upper boundary temperature | |
| parameter related to pore water pressure | |
| ice saturation |
References
- Ma, W.; Zhang, L.; Yang, C. Discussion of the applicability of the generalized Clausius-Clapeyron equation and the frozen fringe process. Earth-Sci. Rev. 2015, 142, 47–59. [Google Scholar] [CrossRef]
- Taber, S. Frost heaving. J. Geol. 1929, 37, 428–461. [Google Scholar] [CrossRef]
- Li, A.; Niu, Y.; Niu, F.J.; Liu, H. Research status of frost heaving properties and controlling measures of coarse grained soil. J. Glaciol. Geocryol. 2015, 37, 202–210. [Google Scholar]
- Miller, R.D. Freezing and heaving of saturated and unsaturated soils. Highw. Res. Rec. 1972, 393, 1–11. [Google Scholar]
- Beskow, G.; Osterberg, J.O. Soil Freezing and Frost Heaving with Special Application to Roads and Railroads: With Special Supplement for the English Translation of Progress from 1935 to 1946; Technological Institute, Northwestern University: Evanston, IL, USA, 1947. [Google Scholar]
- Jackson, K.A.; Chalmers, B. Freezing of Liquids in Porous Media with Special Reference to Frost Heave in Soils. J. Appl. Phys. 1958, 29, 1178–1181. [Google Scholar] [CrossRef]
- Koopmans, R.W.R.; Miller, R.D. Soil freezing and soil water characteristic curves. Soil Sci. Soc. Am. J. 1966, 30, 680–685. [Google Scholar] [CrossRef]
- Everett, D.H. The thermodynamics of frost damage to porous solids. Trans. Faraday Soc. 1961, 57, 1541–1551. [Google Scholar] [CrossRef]
- Rempel, A.W. Frost heave. J. Glaciol. 2010, 56, 1122–1128. [Google Scholar] [CrossRef]
- Rempel, A.W. Hydromechanical Processes in Freezing Soils. Vadose Zone J. 2012, 11, vzj2012.0045. [Google Scholar] [CrossRef]
- Hoekstra, P. Moisture movement in soils under temperature gradients with the cold-side temperature below freezing. Water Resour. Res. 1996, 2, 241–250. [Google Scholar] [CrossRef]
- Loch, J.P.G.; Kay, B.D. Water Redistribution in Partially Frozen, Saturated silt Under Several Temperature Gradients and Overburden Loads. Soil Sci. Soc. Am. J. 1978, 42, 400–406. [Google Scholar] [CrossRef]
- Miller, R.D. Lens initiation in secondary heaving. In Proceedings of the International Symposium on Frost Action in Soils, Lulea, Sweden, 16–18 February 1977. [Google Scholar]
- Miller, R.D. Frost heaving in non-colloidal soils. In Proceedings of the Third International Conference in Permafrost, Edmonton, ALB, Canada, 10–13 July 1978. [Google Scholar]
- Gilpin, R.R. A Model for prediction of ice lensing and frost heave soils. Water Resour. Res. 1980, 16, 918–930. [Google Scholar] [CrossRef]
- O’Neill, K.; Miller, R.D. Exploration of a rigid ice model of frost heave. Water Resour. Res. 1985, 21, 281–296. [Google Scholar] [CrossRef]
- Konrad, J.M.; Morgenstern, N.R. A mechanistic theory of ice lens formation in fine-grained soils. Can. Geotech. J. 1980, 17, 473–486. [Google Scholar] [CrossRef]
- Zhou, J.Z.; Li, D. Numerical analysis of coupled water, heat and stress in saturated freezing soil. Cold Reg. Sci. Technol. 2012, 72, 43–49. [Google Scholar] [CrossRef]
- Harlan, R.L. Analysis of Coupled Heat-Fluid Transport in Partially Frozen Soil. Water Resour. Res. 1973, 9, 1314–1323. [Google Scholar] [CrossRef]
- Thomas, H.R.; Cleall, P.; Li, Y.C.; Harris, C.; Kern-Luetschg, M. Modelling of cryogenic processes in permafrost and seasonally frozen soils. Geotechnique 2009, 29, 173–184. [Google Scholar] [CrossRef]
- Lai, Y.; Pei, W.; Zhang, M.; Zhou, J. Study on theory model of hydro-thermal-mechanical interaction process in saturated freezing silty soil. Int. J. Heat Mass Transf. 2014, 78, 805–819. [Google Scholar] [CrossRef]
- Geng, L.; Tang, L.; Cong, S.Y.; Ling, X.Z.; Lu, J. Three-dimensional analysis of geosynthetic-encased granular columns for liquefaction mitigation. Geosynth. Int. 2016, 24, 45–59. [Google Scholar] [CrossRef]
- Zhao, C.; Liu, Z.; Shi, P.; Li, J.; Cai, G.; Wei, C. Average soil skeleton stress for saturated soils and discussion on effective stress. Int. J. Geomech. 2016, 16, D4015006. [Google Scholar] [CrossRef]
- Liu, Z.; Cai, G.; Kong, X.; Li, J.; Zhao, C. A thermodynamics-based mathematical model for the frost heave of unsaturated freezing soils. Cold Reg. Sci. Technol. 2020, 178, 103125. [Google Scholar] [CrossRef]
- Akagawa, S.; Hiasa, S.; Kanie, S.; Huang, S.L. Pore water and effective pressure in the frozen fringe during soil freezing. In Proceedings of the Ninth International Conference on Permafrost, Fairbanks, AK, USA, 28 June–3 July 2008; pp. 13–18. [Google Scholar]
- Lian-Hai, Z.; Wei, M.; Ya-Jun, S. The modes and its implications of water accumulation near the freezing front during soil freezing with considering ice segregation. J. Glaciol. Geocryol. 2022, 44, 1–11. [Google Scholar]
- TAO Wenquan. Heat Transfer; Northwestern Polytechnical University Press: Xi’An, China, 2006. [Google Scholar]
- Lu, N.; Likos, W.J. Unsaturated Soil Mechanics; Higher Education Press: Beijing, China, 2012; pp. 269–287. [Google Scholar]
- Taylor, G.S.; Luthin, J.N. A model for coupled heat and moisture transfer during soil freezing. Can. Geotech. J. 1978, 15, 548–555. [Google Scholar] [CrossRef]
- Bai, Q.; Li, X.; Tian, Y.; Fang, J. Equations and numerical simulation for coupled water and heat transfer in frozen soil. Chin. J. Geotech. Eng. 2015, 37, 131–136. [Google Scholar]
- Chen, F.; Li, N.; Cheng, G. The theoretical frame of multi-phase porous medium for the freezing soil. Chin. J. Geotech. Eng. 2002, 24, 213–217. [Google Scholar]
- O’Neill, K. The physics of mathematical frost heave models: A review. Cold Reg. Sci. Technol. 1983, 6, 275–291. [Google Scholar] [CrossRef]
- Konrad, J.M.; Duquennoi, C. A model for water transport and ice Lensing in freezing soils. Water Resour. Res. 1993, 29, 3109–3124. [Google Scholar] [CrossRef]
- GB/T 50123-2019; Standard for Geotechnical Experimental Methods. China Planning Press: Beijing, China, 2019.
- Zeng, G.; Zhang, M.; Li, Z.; Yuan, H. Review of mechanical criterion for formation of ice lens in freezing soil. J. Glaciol. Geocryol. 2015, 37, 192–201. [Google Scholar]
Figure 1.
Microscopic schematic of soil (a) particle–ice–water and (b) particle–lens–water at the freezing fringe.
Figure 1.
Microscopic schematic of soil (a) particle–ice–water and (b) particle–lens–water at the freezing fringe.
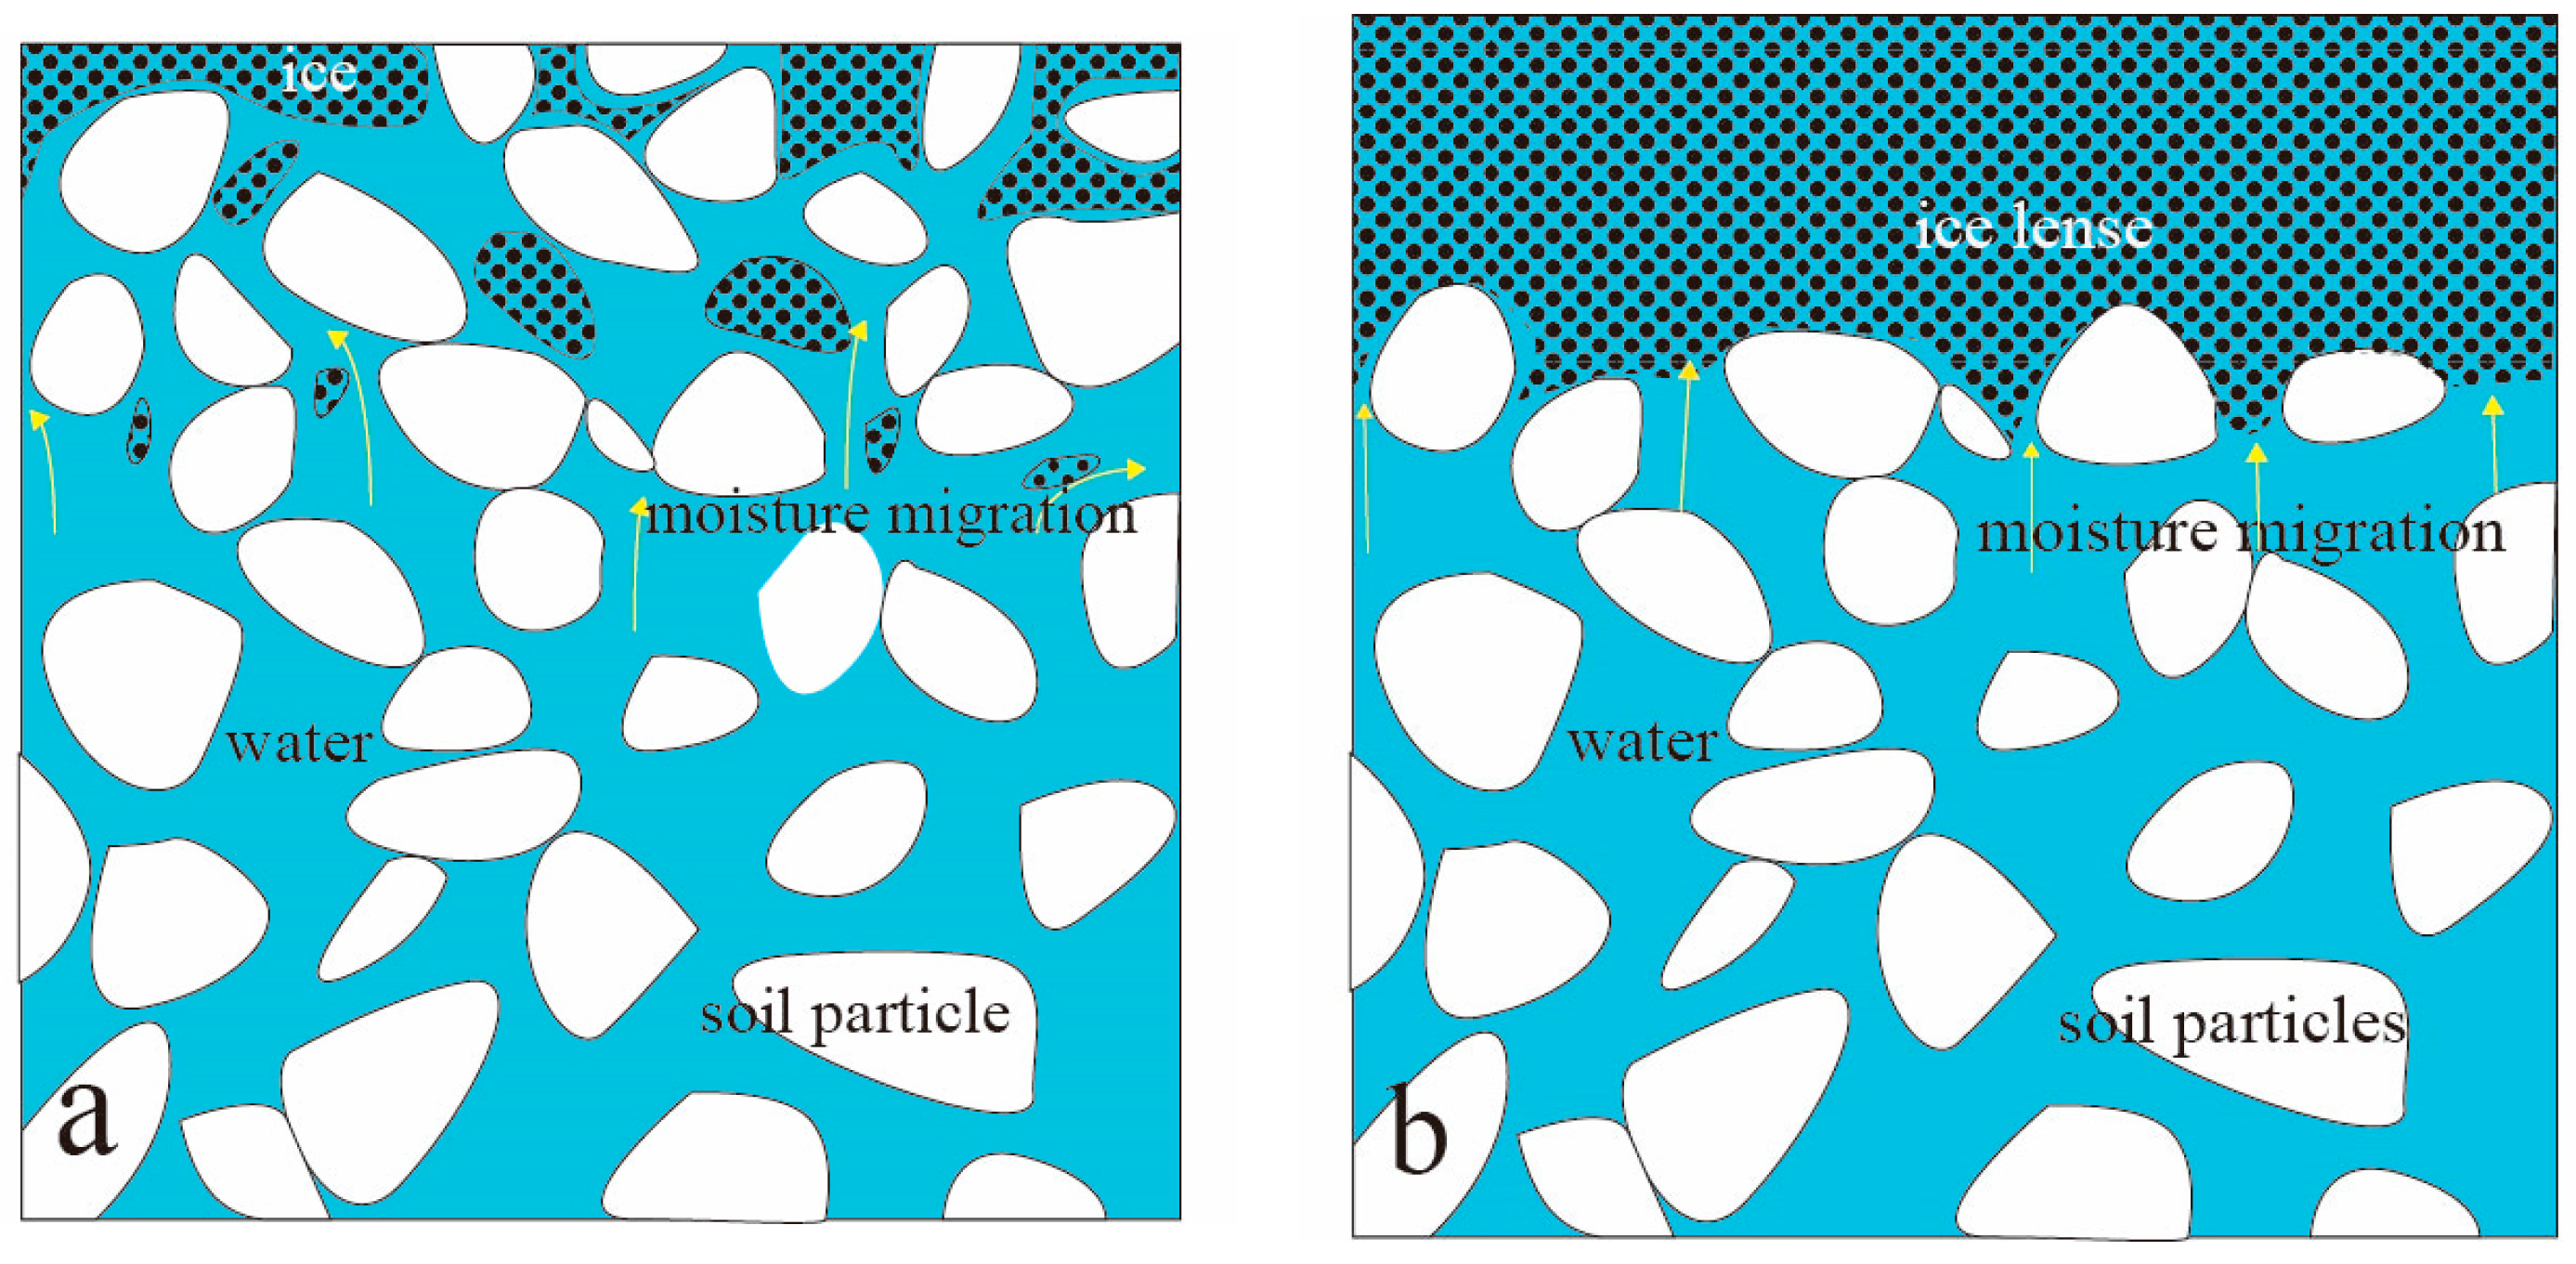
Figure 2.
(a)The schematic of a freezing soil column and (b) the diagram of the physical principle for calculating water flow.
Figure 2.
(a)The schematic of a freezing soil column and (b) the diagram of the physical principle for calculating water flow.
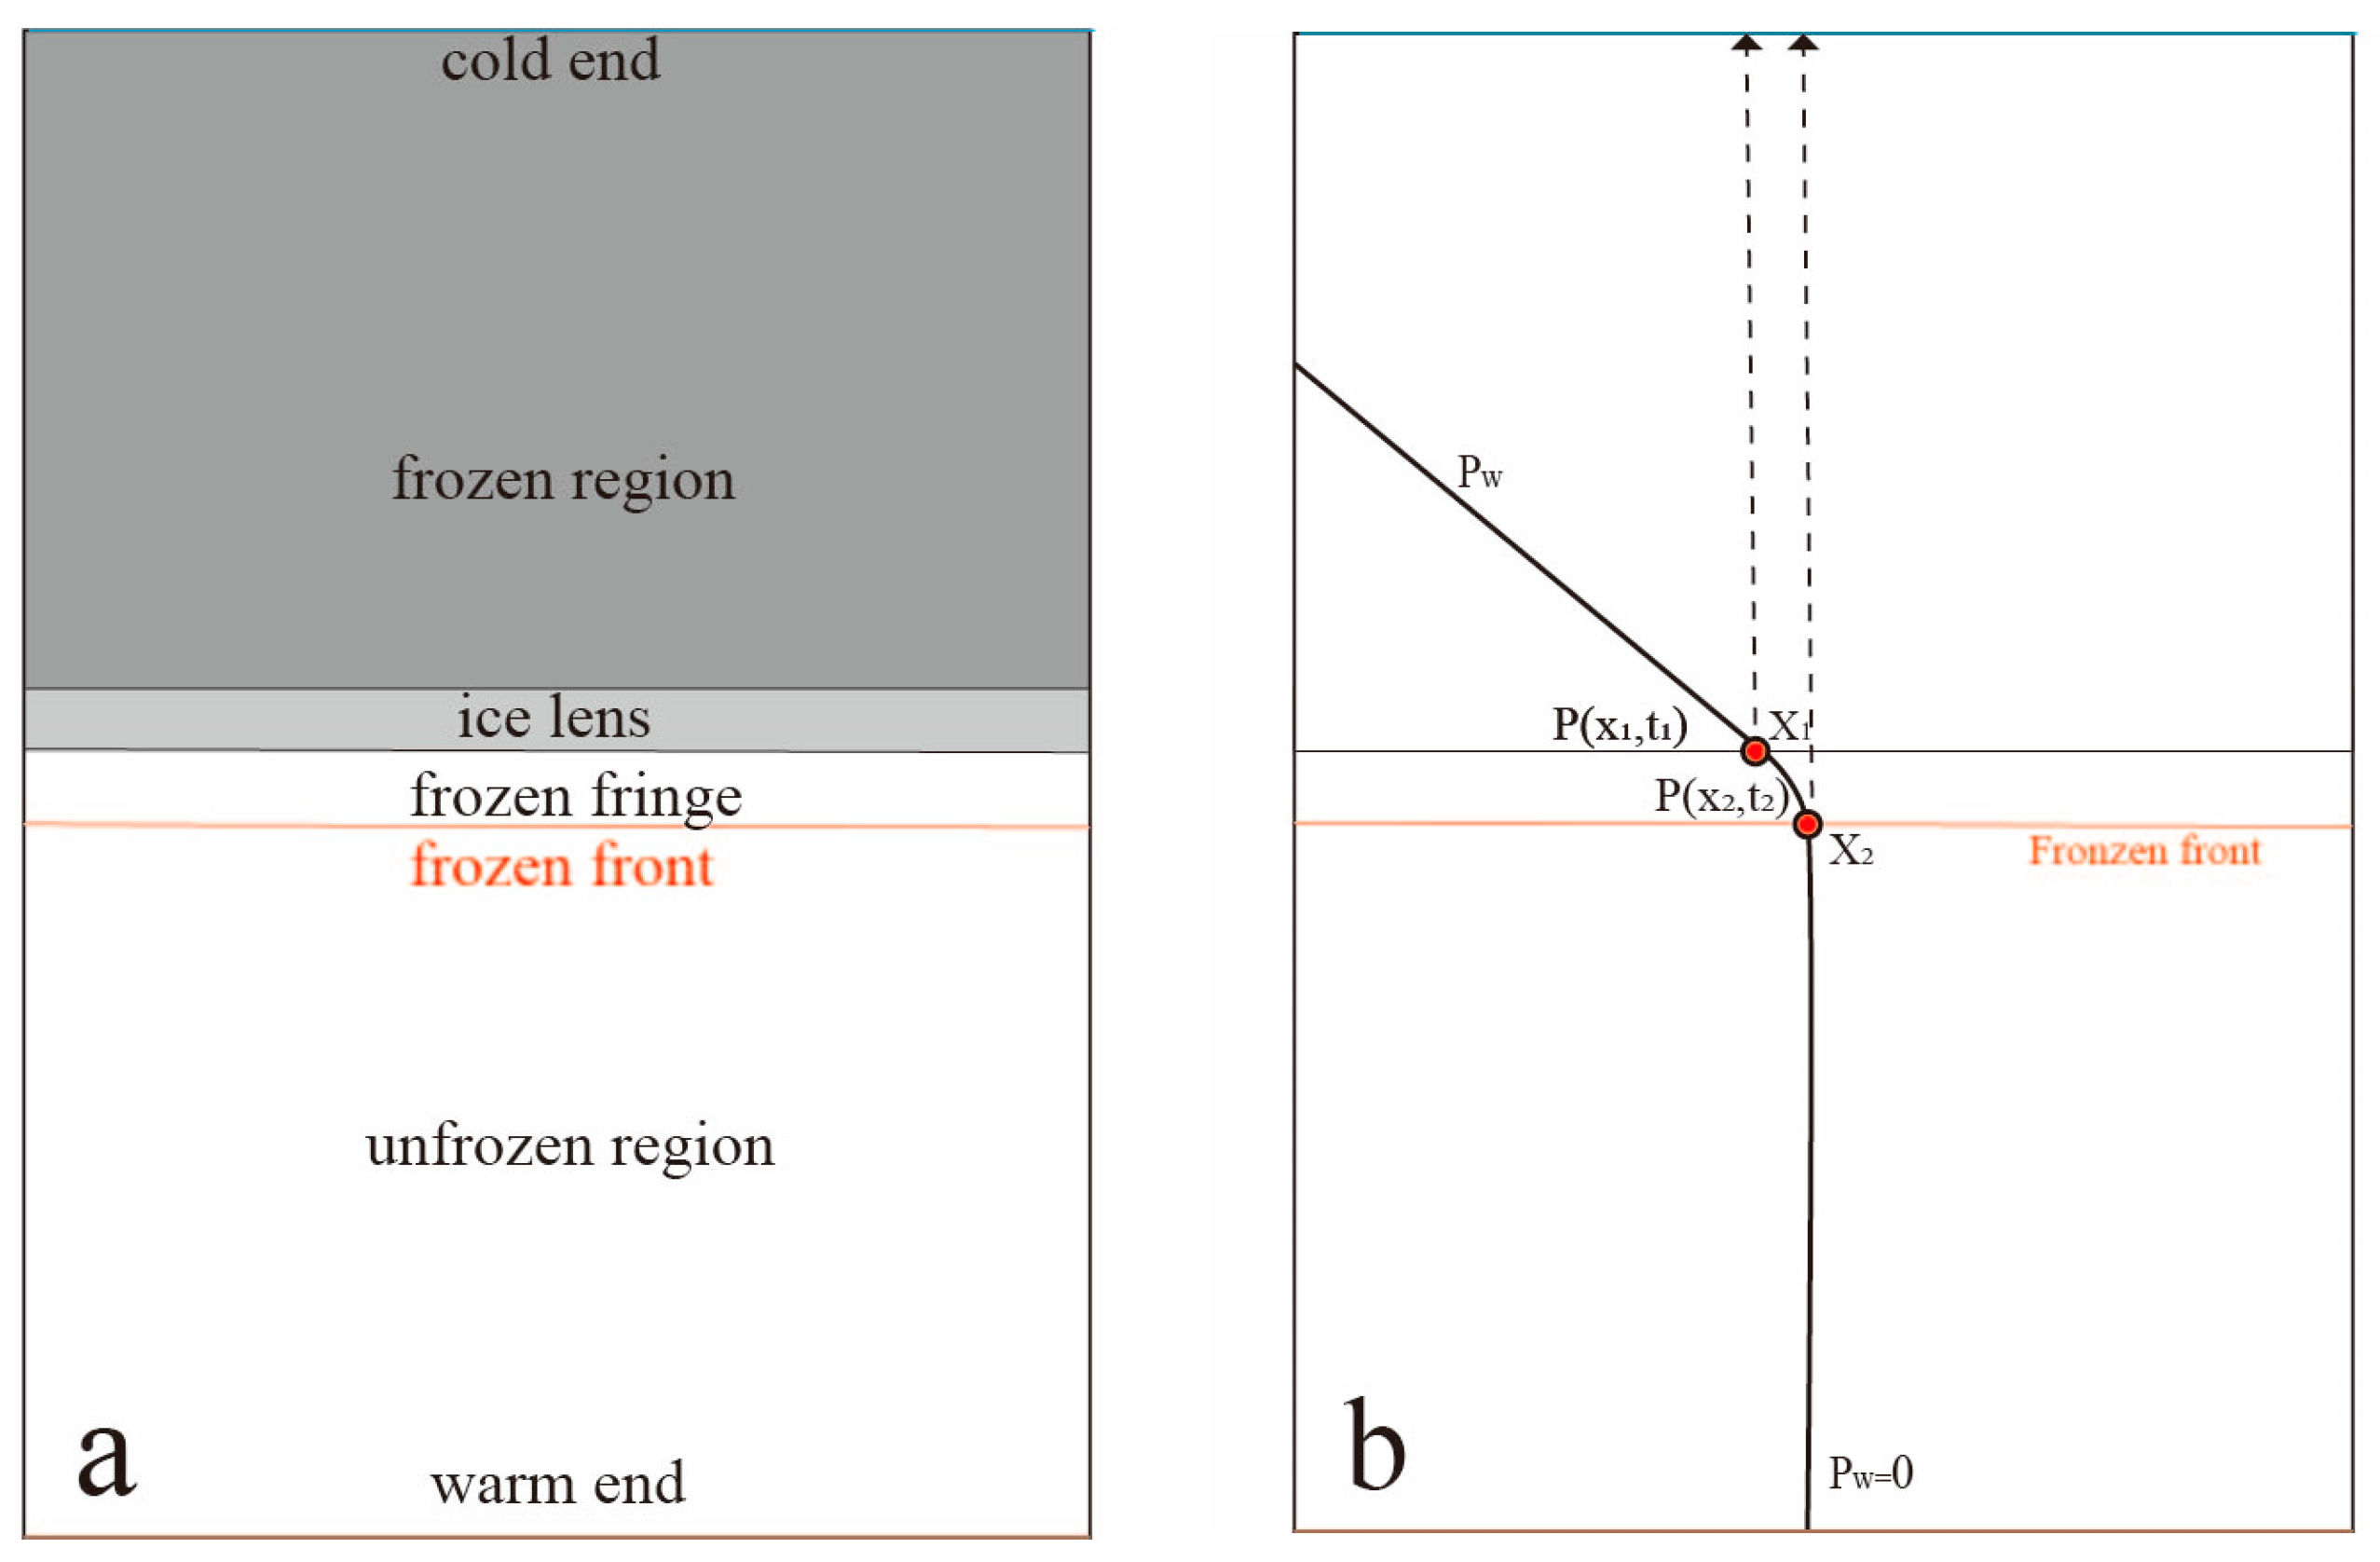
Figure 3.
Experimental and model depth variation in frost front with time.
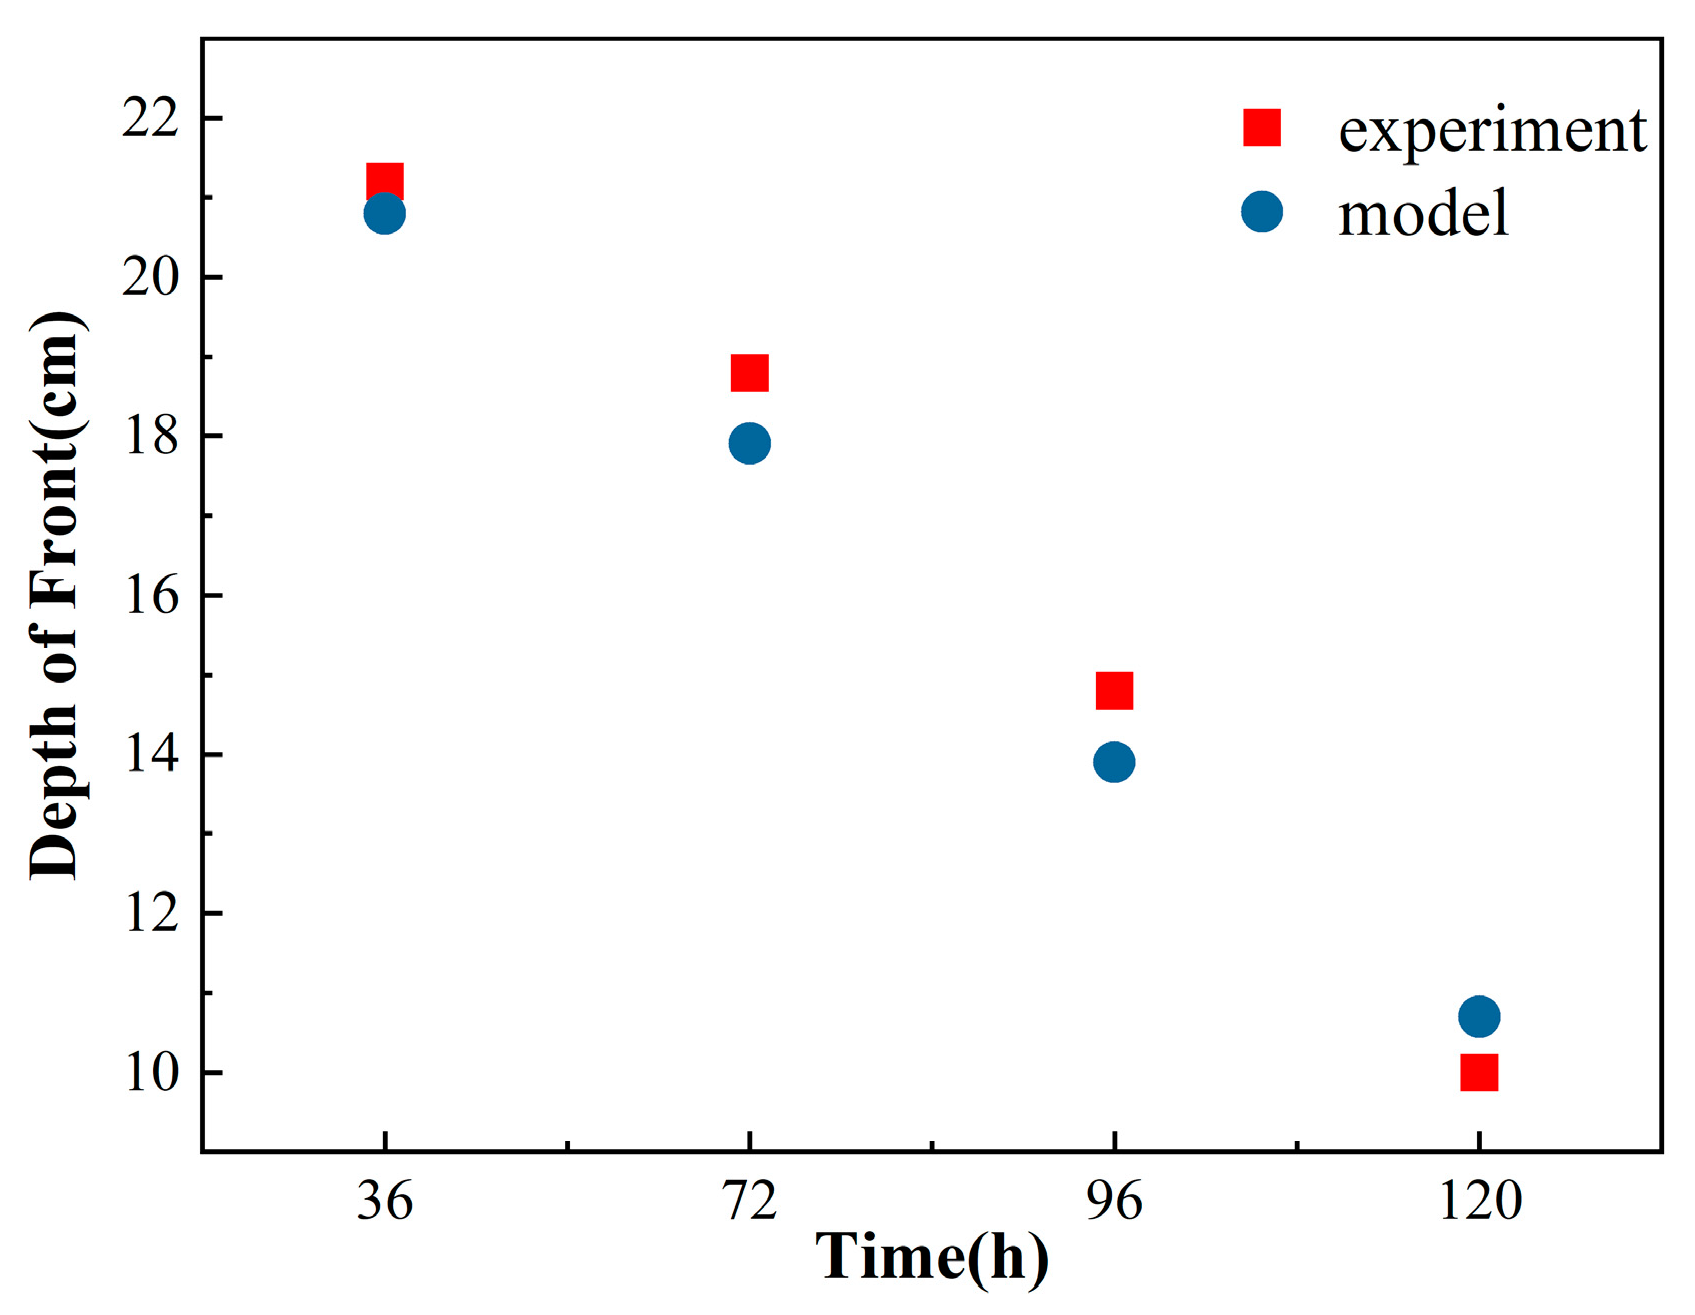
Figure 4.
Experimental and model water content variation with time at different heights. The freezing times are (a) 36 h, (b) 72 h, (c) 96 h, and (d) 120 h, respectively.
Figure 4.
Experimental and model water content variation with time at different heights. The freezing times are (a) 36 h, (b) 72 h, (c) 96 h, and (d) 120 h, respectively.

Figure 5.
Pore water pressure variation with time at different depths (temperature of cold end °C). (a) Frozen soil with ice lens and (b) frozen soil without ice lens.
Figure 5.
Pore water pressure variation with time at different depths (temperature of cold end °C). (a) Frozen soil with ice lens and (b) frozen soil without ice lens.

Figure 6.
Pore water pressure variation with time at different depths (temperature of cold end °C). (left) Frozen soil with ice lens and (right) frozen soil without ice lens.
Figure 6.
Pore water pressure variation with time at different depths (temperature of cold end °C). (left) Frozen soil with ice lens and (right) frozen soil without ice lens.
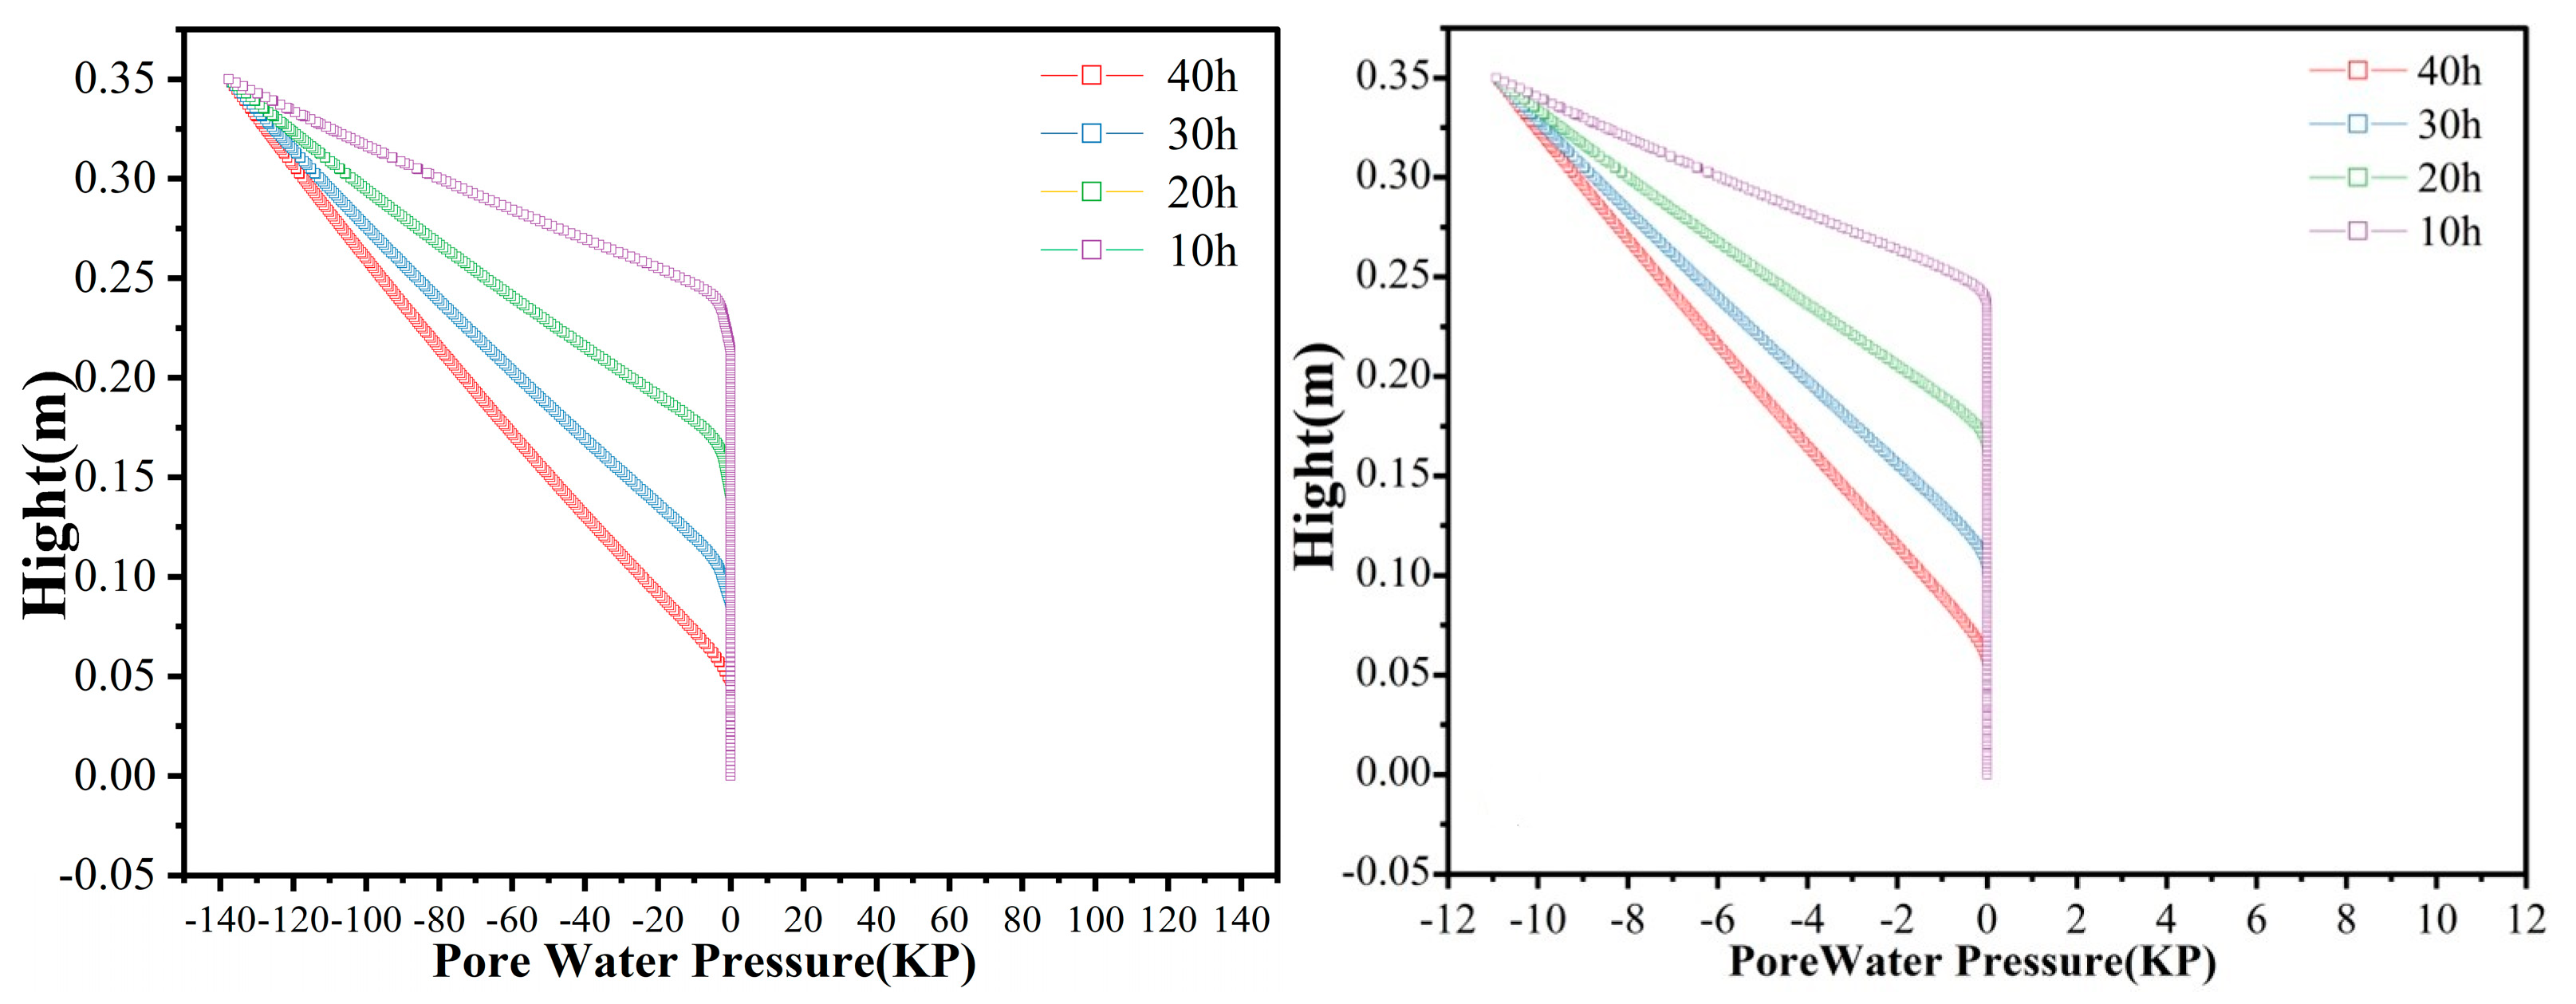
Figure 7.
Comparison of the results of this paper’s model with Konrad’s model (cold-end temperature °C and freezing time 20 h).
Figure 7.
Comparison of the results of this paper’s model with Konrad’s model (cold-end temperature °C and freezing time 20 h).

Figure 8.
Variation in water flow (a) per unit of time and (b) total water flow with time.

Table 1.
Conventional parameter values of the THM model.
| 2.59 | 0.22 | 0.5 | 0.22 | 0.02 |
Disclaimer/Publisher’s Note: The statements, opinions and data contained in all publications are solely those of the individual author(s) and contributor(s) and not of MDPI and/or the editor(s). MDPI and/or the editor(s) disclaim responsibility for any injury to people or property resulting from any ideas, methods, instructions or products referred to in the content. |
© 2024 by the authors. Licensee MDPI, Basel, Switzerland. This article is an open access article distributed under the terms and conditions of the Creative Commons Attribution (CC BY) license (https://creativecommons.org/licenses/by/4.0/).
Share and Cite
MDPI and ACS Style
Zhou, B.; Brouchkov, A.V.; Hu, J. Numerical Study of Pore Water Pressure in Frozen Soils during Moisture Migration. Water 2024, 16, 776. https://doi.org/10.3390/w16050776
AMA Style
Zhou B, Brouchkov AV, Hu J. Numerical Study of Pore Water Pressure in Frozen Soils during Moisture Migration. Water. 2024; 16(5):776. https://doi.org/10.3390/w16050776
Chicago/Turabian StyleZhou, Bicheng, Anatoly V. Brouchkov, and Jiabo Hu. 2024. "Numerical Study of Pore Water Pressure in Frozen Soils during Moisture Migration" Water 16, no. 5: 776. https://doi.org/10.3390/w16050776
Note that from the first issue of 2016, this journal uses article numbers instead of page numbers. See further details here.