Article

Landscape-Scale Mining and Water Management in a Hyper-Arid Catchment: The Cuajone Mine, Moquegua, Southern Peru

by
Morag Hunter
1,†,
D. H. Nimalika Perera
2,†,
Eustace P. G. Barnes
2,
Hugo V. Lepage
2,*,
Elias Escobedo-Pacheco
3,
Noorhayati Idros
2,
David Arvidsson-Shukur
2,
Peter J. Newton
2,
Luis de los Santos Valladares
2,
Patrick A. Byrne
4 and
Crispin H. W. Barnes
2
1
Earth Science Department, University of Cambridge, Downing Site, Cambridge CB2 3EQ, UK
2
Cavendish Laboratory, University of Cambridge, JJ Thomson Avenue, Cambridge CB3 0HE, UK
3
Escuela Profesional de Ingeniería Agroindustrial, Universidad Nacional de Moquegua, Calle Ancash s/n, Ciudad Universitaria, Moquegua 18001, Peru
4
Faculty of Science, Liverpool John Moores University, Liverpool L3 3AF, UK
*
Author to whom correspondence should be addressed.
These authors contributed equally to this work.
Water 2024, 16(5), 769; https://doi.org/10.3390/w16050769
Submission received: 23 January 2024 / Revised: 23 February 2024 / Accepted: 24 February 2024 / Published: 4 March 2024

Abstract

:
The expansion of copper mining on the hyper-arid pacific slope of Southern Peru has precipitated growing concern for scarce water resources in the region. Located in the headwaters of the Torata river, in the department of Moquegua, the Cuajone mine, owned by Southern Copper, provides a unique opportunity in a little-studied region to examine the relative impact of the landscape-scale mining on water resources in the region. Principal component and cluster analyses of the water chemistry data from 16 sites, collected over three seasons during 2017 and 2018, show distinct statistical groupings indicating that, above the settlement of Torata, water geochemistry is a function of chemical weathering processes acting upon underlying geological units, and confirming that the Cuajone mine does not significantly affect water quality in the Torata river. Impact mitigation strategies that firstly divert channel flow around the mine and secondly divert mine waste to the Toquepala river and tailings dam at Quebrada Honda remove the direct effects on the water quality in the Torata river for the foreseeable future. In the study area, our results further suggest that water quality has been more significantly impacted by urban effluents and agricultural runoff than the Cuajone mine. The increase in total dissolved solids in the waters of the lower catchment reflects the cumulative addition of dissolved ions through chemical weathering of the underlying geological units, supplemented by rapid recharge of surface waters contaminated by residues associated with agricultural and urban runoff through the porous alluvial aquifer. Concentrations in some of the major ions exceeded internationally recommended maxima for agricultural use, especially in the coastal region. Occasionally, arsenic and manganese contamination also reached unsafe levels for domestic consumption. In the lower catchment, below the Cuajone mine, data and multivariate analyses point to urban effluents and agricultural runoff rather than weathering of exposed rock units, natural or otherwise, as the main cause of contamination.

Graphical Abstract

1. Introduction

Developmental processes that impact water quality and availability in hyper-arid regions are of particular concern when undertaking environmental impact assessments for resource exploitation proposals [1]. A region may be defined as hyper-arid when the ratio between precipitation and maximum evapotranspiration (P/PE) is below 0.05 [2,3]. Determining the character of water chemistry and identifying the relative importance of both natural and anthropogenic factors in the contamination of water resources in such regions is a global priority, especially with predicted climate change impacts [4,5,6]. This is particularly important on the arid and mineral-rich western flank of the Andes, where two thirds of Peru’s population share less than 2% of the country’s water and where the world’s largest copper deposits reside [7,8,9,10]. Increasing pressure from mineral exploitation on water resources poses a serious challenge to the ecology of these regions and regularly produces social conflict [11,12]. Stakeholder engagement is essential for both mining corporations and statutory bodies to ensure that adverse social and environmental impacts are minimized and developmental benefits are maximized for local communities as well as the national economy [13]. A copper mine producing 50 kt/d requires 30,000 m3 per day of fresh water for processing. The Cuajone mine processes approximately 90 kt/d [14]. The projected nine-fold expansion of copper production in Southern Peru, already the second largest producer after Chile, can only accentuate these challenges. Since trace metals are a major factor in the toxicity of contaminated water [15,16], mapping their presence in potentially affected river systems and understanding their baseline geochemistry is an important preparatory challenge. The direct impacts of increased mining can be partly mitigated by re-routing rivers using canals and diverting waste water to tailings dams, but the increase in mining inevitably increases the human population in remote mineral-rich regions, with a concomitant increase in urban and agricultural development, both of which are often associated with contamination from trace metal and persistent residues [11,17,18,19].
In hyper-arid regions, superficial weathering regimes are dominated by geophysical processes, while subterranean weathering processes are primarily chemical and often play a dominant role in determining the geochemistry of water bodies [20,21]. Trace metal contamination in river systems is, in part, the product of natural acid rock drainage (ARD), in which the oxidation of sulfide-bearing minerals increases the acidity of runoff waters and enhances the further chemical breakdown of the underlying lithology. Hydrological systems dominated by acidic waters show increased trace metal mobilization and metal hydroxide precipitation [22]. The downstream eco-toxicity of these contaminants depends on their bio-availability and consequent accumulation in the food chain [23,24]. Polymetallic mining is a well-documented cause of increased ARD, where it is more commonly known as acid mine drainage (AMD). Sulfide minerals and ores, in which the dominant metal ion can be iron, zinc, copper or nickel, are commonly associated with AMD. Chalcopyrite (a copper–iron sulfide) is the most commonly mined copper-bearing ore, and it is frequently found alongside other sulfides, making copper mines particularly prone to AMD [11,18,25,26,27]. In geologically active regions, such as the Andes, ARD as a consequence of acidic epithermal waters entering the river catchment systems, produces elevated chemical weathering rates, increasing the addition of ions to river waters, the exact chemistry of which is dependent upon the geology of the source region [28]. The combination of geogenic and anthropogenic processes increases weathering processes at mine sites, especially in hyper-arid regions, such as those that exist in Southern Peru, making water resources less suitable for domestic consumption and agricultural irrigation. As such, water quality needs to be carefully monitored where mining is taking place [5,21].
Pesticide and fertilizer effluents and industrial and urban waste waters are also well-documented sources of trace metal contamination. Arsenic is used in herbicides and pesticides; cadmium in batteries and plastics; chromium in dyes and tanning processes; lead in batteries, wiring and cabling; mercury and manganese in pesticides and batteries; and zinc is found in pharmaceuticals, dyes and batteries. All of these elements can leach into the wider environment from agricultural and urban runoff. The uptake of trace metals depends upon soil characteristics, plant species and the metal concerned [18,29]. The trophic transfer of trace metals, even at low concentrations, is known to have mutagenic effects [30].
In addition to the more global anthropogenic and natural geogenic factors that contribute to the determination of water quality, there are factors specific to areas in which mining and catchment transfer projects have been developed [25,31]. The Torata river sub-catchment and lower reaches of the Moquegua river drainage basin represent a region in which both a landscape-scale mine and a regional-scale catchment transfer project could reasonably be thought to impact catchment dynamics, including water resource quality and availability (Figure 1). The exploitation of mineral resources increasingly necessitates environmental impact statements (EISs) with concomitant impact mitigation strategies which may become advisory or statutory obligations. Significant work has been undertaken to understand the impact of mining in this region, with a focus on community engagement and the development of integrated management strategies [12,32]. The development of landscape-scale mines increasingly requires such mitigation strategies to avoid the otherwise inevitable environmental consequences and political issues, although these may not be properly identified in many impact assessment processes [13,33,34,35,36]. The development of the Cuajone, Quellaveco and Toquepala mines in Southern Peru have all involved the implementation of significant impact mitigation, with both river channel and waste material diversion with a complex network of sealed and open channels, tunnels and existing river channels [14,32]. Waste materials from the Cuajone and Quellaveco mines do not enter the greater Moquegua river drainage basin but are transferred to the tailings dams at Quebrada Honda (17 28 19.52 S, 70 41 51.85 W) at 1135 m asl and Cortaderas 2 (17 12 02.49 S, 70 41 51.85 W) at 3086 m asl, all of which can be readily seen on satellite imagery. Additionally, a tunnel diverting Torata river channel flow to the north of the principal mine pit at Cuajone was constructed to ensure that the water quality of the headwaters is not affected by mine activity. Water scarcity in the region, combined with population growth and agricultural development, has increased the need for water resources and driven the development of the catchment transfer Pasto Grande project. This project transfers water from the headwaters of the Tambo river into the greater Moquegua river catchment in 262 km of open channels, tunnels and existing river channels, that include the Sajena, Torata and Moquegua rivers. The long-term impacts of this transfer on catchment ecology, hydrological dynamics and water chemistry have not been studied. Very few studies have been carried out on the impacts of catchment transfer projects, but they are widely considered to have drastic impacts on hydrological regimes, water chemistry, and aquatic biota [31]. The effect of the Pasto Grande project is the subject of further study.
As such, the Torata river was selected for several significant reasons: (i) the presence of the landscape-scale Cuajone copper mine, owned by Southern Copper, located in the headwaters, and the proposed expansion of mining in the region give the opportunity to look at the efficiency of water management measures associated with large-scale mining infrastructure; (ii) there is a global need for detailed studies of the controls on water chemistry in hyper-arid regions to guide resource management; (iii) the nature of the topography provides an ideal context in which to identify the sequential impacts of trace metal dispersion and concentration; (iv) the presence of two well-spaced urban settlements at 2200 m asl (Torata) and 1400 m asl (Moquegua), allowing the identification of distinct chemical signals; and (v) the presence of two distinct and well-separated agricultural areas associated with the above settlements (Figure 1).
The general aim of this paper is to establish the geogenic and anthropogenic determinants of water chemistry in the Torata river sub-catchment and lower Moquegua river, lying in a hyper-arid region in Southern Peru. The catchment is periodically affected by El Niño–Southern Oscillation (ENSO) events with Pacific-derived moisture and regional atmospheric instability producing heavy precipitation and catastrophic flooding in the Moquegua region as in 1998 [37] and more recently in 2016 [38].
Topographic conditions in the region provide an ideal transect from the high Andes to the Pacific coast with the Torata river and the lower Moquegua river crossing four distinct geological units, passing the landscape-scale Cuajone mine, the urban settlements of Torata and Moquegua, and two agricultural areas (Figure 1). A sample-sites network was established throughout the Torata river sub-catchment, above and below the Cuajone copper mine, and below the village of Torata and associated agricultural areas. Additionally, sites were adopted above and below the city of Moquegua and along the lower Moquegua river to the Pacific ocean. We describe the spatial and temporal variation in the chemistry of the river and its main tributaries, and use this to investigate the various contributors to the chemistry. Spatial patterns can be linked to processes specific to the upper, middle and lower catchments, particularly the underlying geology, any influence from mining and related acid–rock interactions, agriculture, and hydro-fluvial processes such as ground flow, surface runoff, distance from the ocean and elevation. Secondly, we discuss temporal patterns, linked to dry/wet seasons and El Niño and how these affect the baseline. Where the data allow, we have indicated qualitative source apportionment based on concentration data. In addition to the overall aim, we have, where the data allow, indicated qualitative source apportionment based on concentration data. In this, we have attempted to achieve four specific objectives: (1) to identify the impact of the Cuajone mine on the geochemistry of the Torata river; (2) to identify and describe the hydro-chemical impact of the rural settlement of Torata and associated agricultural lands on the Torata river; (3) to identify and describe the hydro-chemical impact of the urban settlement of Moquegua on the Moquegua river; and (4) to identify the the hydro-chemical impacts of the agricultural area lying along the lower Moquegua river valley.
Figure 1. Map of selected study site locations in the foothill and headwaters (site 0A, 40 km downstream from site 1 near Ilo, is not shown). Inset shows underlying geological units adapted from Decou et al. [39]. Geological lithologies coded by color: pink—Coastal Batholith (intrusive 145–155 Ma); buff—Moquegua Group (sedimentary 50–54 Ma); green—Cretaceous volcanics and Eocene intrusives; grey—Miocene to recent pyroclastic deposits. Study area shown in dashed box.
Water 16 00769 g001

2. Materials and Methods

2.1. Study Area

In the Peruvian Coastal Desert, the development of hyper-aridity evolved with the Andean orogenesis and consequent Pacific-slope rainshadow, together with the development of the Humboldt current and episodic El Niño phenomena [2]. As a consequence, the core Peruvian coastal desert region between 15° S and 30° S and from sea level to 3500 m asl is considered hyper-arid. It receives a mean annual precipitation of 3.5–4.5 mm. Today, the Pacific slope of the Andes supports a stable xeric environment, supporting little vegetation but which is affected by episodic catastrophic flooding [28,37,40,41]. The world’s largest supergene copper deposits are also located in this hyper-arid zone, stretching from Southern Peru to Northern Chile [42,43]. Currently, there are three landscape-scale copper mines in the region; the Cuajone mine, the newly developed Quellaveco mine, and the Toquepala mine. The study area focuses on the Torata river in the Moquegua drainage. This river rises in the headwater bofedales at 4590 m asl at Pampa Titijones and flows to the Cuajone copper mine at 3500 m asl before descending through the settlement of Torata, approximately 11 km below the mine at 2200 m asl. The channel then passes through a narrow canyon to join the Sajena river and, subsequently, the Moquegua river at 1290 m asl below the city of Moquegua. Thereafter, the river flows through a narrow, intensively farmed floodplain before reaching the Pacific Ocean at Ilo [5].

2.2. Study Sites

The sampling network was designed to cover the principal tributaries in the Torata subcatchment and lower Moquegua river catchment. Data discussed here are from 16 sites within the catchment, 11 along the Torata river, 4 lying at or below the confluence of the Torata river with the Moquegua and Sajena rivers, and 1 site close to the ocean (Figure 1). Precise GPS locations and elevations of the sites are given in Table 1. Site 0A is in the arid tropical zone, near Ilo on the coast. Site 1 is located in the upper tropics, 20 km below both the city of Moquegua and an extensive area of irrigated agriculture. Sites 1B, 1C and 1D are located at the confluence of the Sajena, Torata and Moquegua rivers. Site 1E lies above all urban development and records the quality of the upper Asana River. Site 2 lies above all agricultural influence from the Moquegua city district, emerging from a canyon that starts in the Torata district. Sites 3 and 4 lie below the small rural town of Torata, and sites 5 and 5B above Torata, with 5B located immediately beneath the Cuajone mine. Directly above the Cuajone mine are sites 16, 17 and 18, and finally, sites 19 and 20 represent the source bofedal (peat wetland) and spring, respectively.

2.3. Sample Seasons

Three field investigations were undertaken: January 2017 (denoted 17-R), July 2017 (denoted 17-D), and January 2018 (denoted 18-R). The 17-R sampling campaign followed directly after an El Niño episode in which there was considerable flooding in the lower catchment. Despite this, it did not rain during the 17-R visit. During 17-D, the weather was dry and had been dry since the 17-R visit. Visit 18-R was nominally during the wet season but data collection preceded the onset of rains in the headwaters, and as such, many of the rivers retained dry season characteristics. Field visits were arranged to collect water quality data in situ and water samples for later analysis. Prior to sample and data collection, all field equipment was calibrated at the Universidad Nacional Autonoma de Moquegua (UNAM) laboratories. Owing to weather conditions and logistical constraints, it was not possible to collect samples at all sites on all field visits.

2.3.1. Water Quality Parameters and River Data Collection

At each site, the following data were collected: GPS coordinates, atmospheric and water temperature, altitude, dissolved oxygen (DO mg/L and %), pH, conductivity, total dissolved solids (TDS), and oxygen reduction potential (ORP). A simple assessment of nearby land usage was noted.

2.3.2. Water Sample Collection

At each site, 1-liter composite samples were collected in pre-washed polyethylene bottles. Subsamples for mercury (Hg) analysis were preserved with sulfuric acid and potassium dichromate to pH < 2, and samples for cyanide ( C N ) analysis were preserved with sodium hydroxide to pH > 12. Samples for total metal analysis were decanted into 50 mL tubes and preserved to pH < 2 with HNO 3 (99.9% trace metal basis) in the UNAM laboratory. All samples were packed in cool boxes for transport and stored at 4 °C until analysis.

2.4. Analysis of Water Samples

Chemical analyses for 44 components including major cations, major anions, trace metals, nutrients and biological components (see Table 2) were conducted by Northumbrian Water Scientific Services (Newcastle, UK), Greenwich University (Kent, UK) and the University of Cambridge (Cambridge, UK) laboratories. Samples for metal analysis were treated with acid digestion at 105 °C and analyzed by ICP-MS (7500ce, Agilent, London, UK). The anions were measured using ion chromatography (Dionex IC with Ionpac analytical column, Thermo Scientific, Oxford, UK) and nitrates were measured using discrete automated colorimetry (Aquakem 600, Thermo Scientific, UK). Hg was measured using atomic florescence (Millenium Merlin, PS Analytical, Kent, UK, LOD: 0.003 μg/L) and total cyanide (CN) was measured using a segmented flow analyzer (Skalar, Breda, The Netherlands, LOD: 0.02 mg/L). Total phosphorous (TP) was measured by ICP-OES (iCap 6500, Thermo Scientific, UK), and total nitrogen (TN) was measured using chemiluminescence (Shimadzu TOC-V, Milton Keynes, UK). Chemical oxygen demand (COD) was measured by digestion followed by colorimetry (Merck COD cell test kit, Darmstadt, Germany, COD 5–80 mg/L). E. coli and coliform were quantified using multiple-tube fermentation techniques. All analytical methods were carried out according to EPA and ISO protocols in quality-controlled labs. All samples were analyzed in duplicate for precision, and certified reference standards and internal calibration were used for accuracy measurements [44].

2.5. Statistical Analysis

Cluster analysis (CA) and principal component analysis (PCA) were used to quantify the relative dominance of various physico-chemical components of the river water with the aim of discriminating the main controls over the river quality. These methods are widely used in the analysis of correlations in multivariate data [16,25]. Both CA and PCA were applied to the z-score normalized value of the measured parameters [45]. z-score normalization facilitates the discussion of correlations between parameters with vastly different magnitudes or amplitudes of fluctuations. CA provides a framework for creating subsets (clusters) of samples with high similarities. The internal structure of the data is ordered according to a dissimilarity measure, grouping similar samples. The analysis presented here uses Ward’s hierarchical agglomerative CA method, together with a Euclidean dissimilarity measure [16,46,47]. This method finds the two closest samples (the data points with the smallest sum of squares of Euclidean distance), producing a secondary pseudo-sample. It then iterates this procedure until all the samples have been grouped, recording the dissimilarity distances { d i } , where i indicates the ith link. In the CA dendrograms shown in this paper, the dissimilarity distance was reported as a fraction of the largest distance: d i / max { d i } . The cophenetic correlation coefficient (CCC) was used to measure how well the cluster dendrograms preserve the pairwise dissimilarity distances between original, un-clustered data [48]. A CCC of 100% corresponds to a dendrogram that perfectly preserves the original distances.
CA was employed in two ways in this study. Q-mode CA was used to find how the sample sites cluster with respect to the chemical parameters. This reveals spatial correlations of parameters over the set of sample sites. R-mode CA was used to find how the parameters cluster with respect to the sample sites. Clusters of similar parameters indicate that underlying factors affect them alike [49].
PCA is a methodology for the dimensional reduction in the number of parameters needed to describe a set of data [45,50]. The analysis begins with the calculation of the eigenvectors of the covariance matrix of the data, and the arrangement of them in descending order with respect to decreasing eigenvalues. If some eigenvalues are significantly larger (above some threshold) than the others, their corresponding eigenvectors are called “principal components”. By picking out the principal components with the largest eigenvalues, it is possible to describe the covariance of the data to a level given by the ratio between the sum of their eigenvalues and the sum of all the eigenvalues. In this paper, PCA was employed on clusters with similarly behaving parameters to understand the intra-cluster correlation.

2.6. Contextual Materials and Analyses

In addition to the above methodologies applied to our sample site data, we also refer to data collected under our longer-term campaign, and data collated from published papers and technical reports on water management in the region. This provides a useful context in which to fully understand both the geogenic and anthropogenic determinants of water quality and availability, while underlining the need for further studies.

3. Results

Water chemistry data from the three field seasons (17-R, 17-D and 18-R) are presented in Figure 2. Measured chemical parameters with their minimum and maximum values are in Table 2. The following sections discuss the temporal and spatial variations in river water chemistry during the three sampling campaigns.

3.1. Water Quality Parameters and Major Ion Composition

3.1.1. Headwater Sites above the Cuajone Mine (Sites 16, 17, 18, 19, 20)

These sites were neutral or slightly alkaline (pH 7.84 to 9.45) with most sites recording a pH suitable for aquatic life. Site 19 showed the most alkaline conditions with pH values up to 9.45 and water temperature readings ∼5 °C higher than ambient temperature. This site is a bofedal (Andean peat wetland) just below the source spring, site 20, and water was collected at midday in 17-R but early morning in 17-D. Both dissolved oxygen (DO) levels and pH at this site were higher at midday (12.4 mg/L and pH 9.45 in 17-R) than in the early morning (6.62 mg/L and pH 8.52 in 17-D) and, when taken together, are consistent with photosynthetic activity consuming CO 2 [51,52] and adding free oxygen to the water during daylight hours. However, vegetative growth was more evident during the warmer wetter season (17-R) than the drier colder season (17-D), as to be expected, and therefore increased photosynthesis in season 17-R may also have contributed to the higher pH and DO levels. Similarly, the high quantity of decomposing organic matter related to the rich floral composition of the bofedal explains why the highest COD measurements in the Torata river (17 mg/L) system were observed at this site.
The headwater sites have the lowest concentrations of major cations (Na+≳ Ca2+≫ Mg2+, K+) and anions ( SO 4 2 Cl > F , NO 3 ), with total concentrations in all ions increasing downstream (Figure 2) as expected. Na/Cl equivalent molar ratios at the headwater sites, Figure 3a, are significantly higher (10.6-3.4, 17-R, 14.4-5.3 17-D) when compared to sites downstream of the Cuajone mine (2.2-1.4 17-R, 2.7-1.9 17-D), with the highest Na/Cl ratios recorded at site 19 (the bofedal, 10.6 during 17-R) and site 18 (14.4, during 17-D). SO 4 /Cl equivalent molar ratios are also significantly higher in the headwater sites, with site 18 recording the highest values (13.45—17-R, 18.02—17-D). The Na/Cl equivalent molar ratio can be used as an indicator of ground water contributions to water bodies [53]. A high Na/Cl ratio is an indication of a significant contribution from mineral-rich ground water sources rather than precipitation, which usually has Na/Cl ratios between 0.8 and 1.0 [53,54]. The high Na/Cl and SO 4 /Cl ratios, when combined with the higher water temperature, are consistent with a geothermal contribution to source waters in these upper Torata sites (c.f. findings in [5].)
Following the El Niño, the bofedal, site 19, had the highest Fe and Al concentrations of the headwater sites (1.5 mg/L and 0.09 mg/L in 17-R respectively, Figure 4). This Fe concentration exceeds the safe limit of 1 mg/L for aquatic life [55]. Both the high pH and the organic processes driving reducing conditions in the waters of the bofedal encourage dissolution of iron, and aluminum solubility also increases with higher pH and in the presence of sulfate in the water.

3.1.2. Foothill Sites below the Cuajone Mine (Sites 5B, 5, 4, 3, 2, 1B, 1C, 1D, 1E)

pH measurements and field observations at sites below the Cuajone mine did not show evidence of AMD. pH values at sites 5 and 5B, below the Cuajone mine, ranged from 7.98 to 8.56, little different from site 16 above the mine where the pH ranged from 7.84 to 7.97. A healthy riparian eco-system dominates the valley at this altitude. This highly sensitive environmental indicator suggests that the water quality in this area is good. Foothill sites 2, 5, and 5B recorded elevated Al, Fe and Mn concentrations compared to other sites, and levels were particularly high at these sites and site 4 during 17-R, after the El Niño episode. Cretaceous (91–65 Ma) volcanic and sedimentary rocks, with Eocene intrusions (55–45 Ma), underlie the area (Figure 1) and represent the oldest geological units in the sample area. Chemical weathering leads to formation of clay minerals and insoluble oxides, which are relatively high in Al and Fe. Changes in the runoff rate will have elevated the amount of very fine particulate matter in the rivers, and the observed levels of iron and aluminum probably reflect this. The Asana river (sites 1B and 1E) also shows relatively higher concentrations of these elements than equivalent sites on the Torata and Sajena rivers. Figure 4 shows the spatial distribution of Al, Fe, and Mn along the Torata and Moquegua rivers for the three seasons. Interestingly, although Al and Mn levels were not detectable and Fe was only found in moderate concentrations (0.18–0.24 mg/L) above the Cuajone mine (sites 16–18), all three metals were found in higher concentrations below the mine (site 5: Al, Fe, and Mn at 2.0, 1.5 and 0.33 mg/L, respectively). USEPA guidelines stipulate that recoverable Al exceeding 0.087 mg/L (pH 6.5–9.0) and Fe exceeding 1 mg/L is unsuitable for aquatic life, and the secondary drinking water standards specify that Al, Fe, and Mn exceeding, 0.2, 0.3 and 0.05 mg/L, respectively, is undesirable in drinking water. Mn concentrations exceed the safe limits for irrigation use (0.2 mg/L). Although these metals are associated with both AMD and neutral mine drainage (NMD) [23,24,56,57,58], the concentrations detected were lower than those normally found under AMD or NMD conditions [59,60,61]. Under alternating flooding and draining conditions, such as those produced during an El Niño event and following dry seasons, changes in the pH of the water will greatly affect Al, Mn, and Fe solubility via influencing either reductive dissolution or carbonate formation [62]. Therefore, it seems that seasonal variability controls the concentrations recorded in the data and suggests that these metal concentrations probably derive from surface runoff, soil erosion and throughflow during the recent El Niño event [63,64,65,66]. Observed concentrations were thus considered to be the result of differential weathering of the underlying bedrock and trace metal mobilization during the episodic rainfall during the recent El Niño event rather than mine leachate.
The metal concentrations decrease downstream from site 5, and increase again at site 2 irrespective of the season (Figure 4). Such an increase in metal concentration could reflect evaporation as the river passes through the desert landscape; however, the concentrations of conservative ions such as Cl did not show a similar spike, pointing to other origins. Cation enrichment from atmospheric aerosols is a possibility. Regional high pressure and sinking air in the foothills concentrates atmospheric aerosols, which then settle out in the lower sections of the Moquegua, Sajena, and Torata rivers, possibly affecting the water chemistry. However, data from other studies [5] show that the river chemistry here is more significantly determined by contaminated groundwater. The aquifer is recharged by the filtration of surface waters through the porous alluvial deposits of the Moquegua valley floor. The chemistry of these surface waters south of the city provide numerous pollutants from agriculture and the city itself. Therefore, the elevated cations (and bicarbonate) in the river at this altitude are most likely due to recycled contaminated surface waters through the porous alluvial deposits.
The nitrate ( NO 3 ) concentration in water can be used to assess chemical addition to the river from local agriculture. We observed raised NO 3 concentrations, in the wet seasons 17-R and 18-R (0–16.64 mg/L and 0–7.9 mg/L), compared to the dry season 17-D (0–3.4 mg/L). The highest NO 3 concentrations were recorded at site 3, located in the agricultural area downstream of Torata. The concentration drops at site 2 after the river has passed through 8 km of desert canyon. Interestingly, the NO 3 concentration at site 1C in the farmland around Moquegua is similar to that at site 2 in both 17-D and 17R, possibly deriving from the greater emphasis on arable versus pastoral farming in this region. NO 3 concentrations are controlled by increased surface runoff and leaching during the wet season, and relative concentration is linked to land use, being elevated in areas used for arable farming.

3.1.3. Sites Downstream of Moquegua City (Sites 1 and 0A)

The lower stretches of the Moquegua/Osmore river below Moquegua city record slightly alkaline (site 1, pH 7.81–8.68) conditions during all seasons. Water composition at site 1 (20 km outside Moquegua and below an extensive area of more intensively farmed land) was dominated by Ca 2 + (180–250 mg/L), Na + (160–230 mg/L), SO 4 2 (370–470 mg/L) and Cl (260–360 mg/L). The concentrations of Na + , SO 4 2 and Cl were above or close to unsafe levels for drinking water (EPA and WHO standards, 200 mg/L, 250 mg/L respectively) for all seasons. The tributaries (sites 1B, 1C, 1D, 1E) feeding into the river above the confluence have lower concentrations and slightly more alkaline pH values (e.g., site 1B—9.09, site 1E—8.10). At sites 1C (Torata river) and 1D (Sajena river), above the confluence with the Sajena and Torata rivers, metal concentrations were below EPA and WHO safe limits set for drinking water, although relative concentrations are seasonally affected, and Moquegua sites 1B and 1E (Asana river) recorded lower cation and anion concentrations in all seasons. Mn concentrations at site 1, during both wet and dry seasons (0.65 mg/L and 0.11 mg/L, respectively), are also higher than those recorded from the tributaries (see Figure 4)—site 1B (0.064 mg/L), site 1D (<0.05 mg/L), and site 1C (<0.05 mg/L)—with the exception of data from 18-R, when Mn concentration was 0.12 mg/L at site 1D, showing a significantly elevated contribution of this metal from the Sajena river. These results suggest that water from the Torata, Sajena and Asana/Moquegua tributaries does not significantly contribute to the elevated cation and anion concentrations at sites 1 and 0A, and the data are consistent with an extraneous source for the elevated chemical levels measured at site 1.
Cl concentration was above that considered safe for aquatic life over long periods of time during all seasons (chronic, >230 mg/L) and for the irrigation of sensitive crops such as avocados [67], a common crop in the Moquegua region. The highest K + concentration (8.7–11.0 mg/L) for all study sites was also found at site 1. As a result of these high concentrations of cations and anions, specific electrical conductivity (EC, 2040–2711 μS/cm) and total dissolved solids (TDS, 1020–1833 ppm) at site 1 were close to or above the maximum limits set by the Peruvian water authority for agricultural use (category 3: 2500 μS/cm and 1800 ppm, respectively) [68]. EC and TDS values exceeded the safe limits for agriculture use in the dry season 17-D.
In general, cation and anion concentrations will gradually increase downstream along river systems due to accumulation from natural mineral weathering, evaporation and ground water discharge. However, the concentrations at site 1 were 2–3 times higher than those recorded at sites 1C and 2 in all seasons (Figure 2: line graphs), which suggests an additional process causing increased concentration. It is unlikely that evaporation alone (see Figure 5) could account for this dramatic increase, so it is likely to be a result of changes in natural mineral weathering or the composition of groundwater discharge. Softer, more friable sedimentary rocks of the Moquegua Group, which are more susceptible to physical and therefore chemical erosion, underlie the land between sites 1 and 2, in contrast to the more competent volcanic extrusive units found above Moquegua. Site 1 also lies downstream of the agricultural land below Moquegua. It is not possible to separate the relative influence of these two factors with the current data, but given the low precipitation rates (and therefore reduced weathering potential), such a dramatic increase in concentration probably reflects the influence of urban and agricultural activities in the lower valley (c.f. [69]).
SO 4 2 , Cl and K + were among the main contaminants at site 1, and they are commonly found in agricultural fertilizers, in the form of potassium sulfate ( K 2 SO 4 , 50% K and 17% S), potassium chloride (KCl, 60% K), and magnesium potassium sulfate (MgK( SO 4 ), 22% S) [72]. These anions may also derive from urban waste [73].
Site 1 also showed the highest NO 3 concentrations in the study site network (19.65 mg/L 17-R, 17.7 mg/L 18-R, 6.1 mg/L 17-D). NO 3 concentrations from the tributaries were much lower throughout the sampling campaign (site 1D, 2.2–2.4 mg/L; 1B and 1E 0-0.96–0-1.5 mg/L). NO 3 is highly soluble and commonly associated with the use of agricultural fertilizers and domestic waste [16]. To analyze the effect of the latter, samples from site 1 were further analyzed for E. coli and thermal coliform, which are good indicators of sewage contamination. Both E. coli and thermal coliform were found to be below detection levels (<1.8 MPN) indicating little or no domestic sewage enters the river above site 1. Commonly used nitrogen-based fertilizers in the Moquegua district [72] are urea (CO( NH 2 ) 2 , which has the highest nitrogen content (46% N), ammonium nitrate ( NH 4 NO 3 , 33% N), and ammonium sulfate (( NH 4 ) 2 SO 4 , 21% N). Another nitrogen-phosphoric fertilizer that is commonly used is monoammonium phosphate ( NH 4 H 2 PO 4 , 10% N and 48% P), also a source of highly soluble phosphate [72]. Similar increases in total nitrogen (TN) and total phosphate (TP) were observed at site 1 ( r 2 = 0.99 , p < 0.05 ), where aquatic plant growth was prolific. Correspondingly, an increase in Mn concentration at this site could also arise from agriculture since Mn is less readily complexed by organic ligands, resulting in high mobility in agriculture areas [74].
These data and the discussion above are consistent with urban effluent and agricultural runoff and leaching, especially during the wet season, being a major source of raised cationic and anionic concentrations at sites downstream of both the city of Moquegua and the associated downstream industrial agriculture area (c.f. [69]). However, Figure 2 shows that there are no significant correlations between the trace metals and cation–anion concentrations, suggesting that the actual system is complex with multivariate determination.

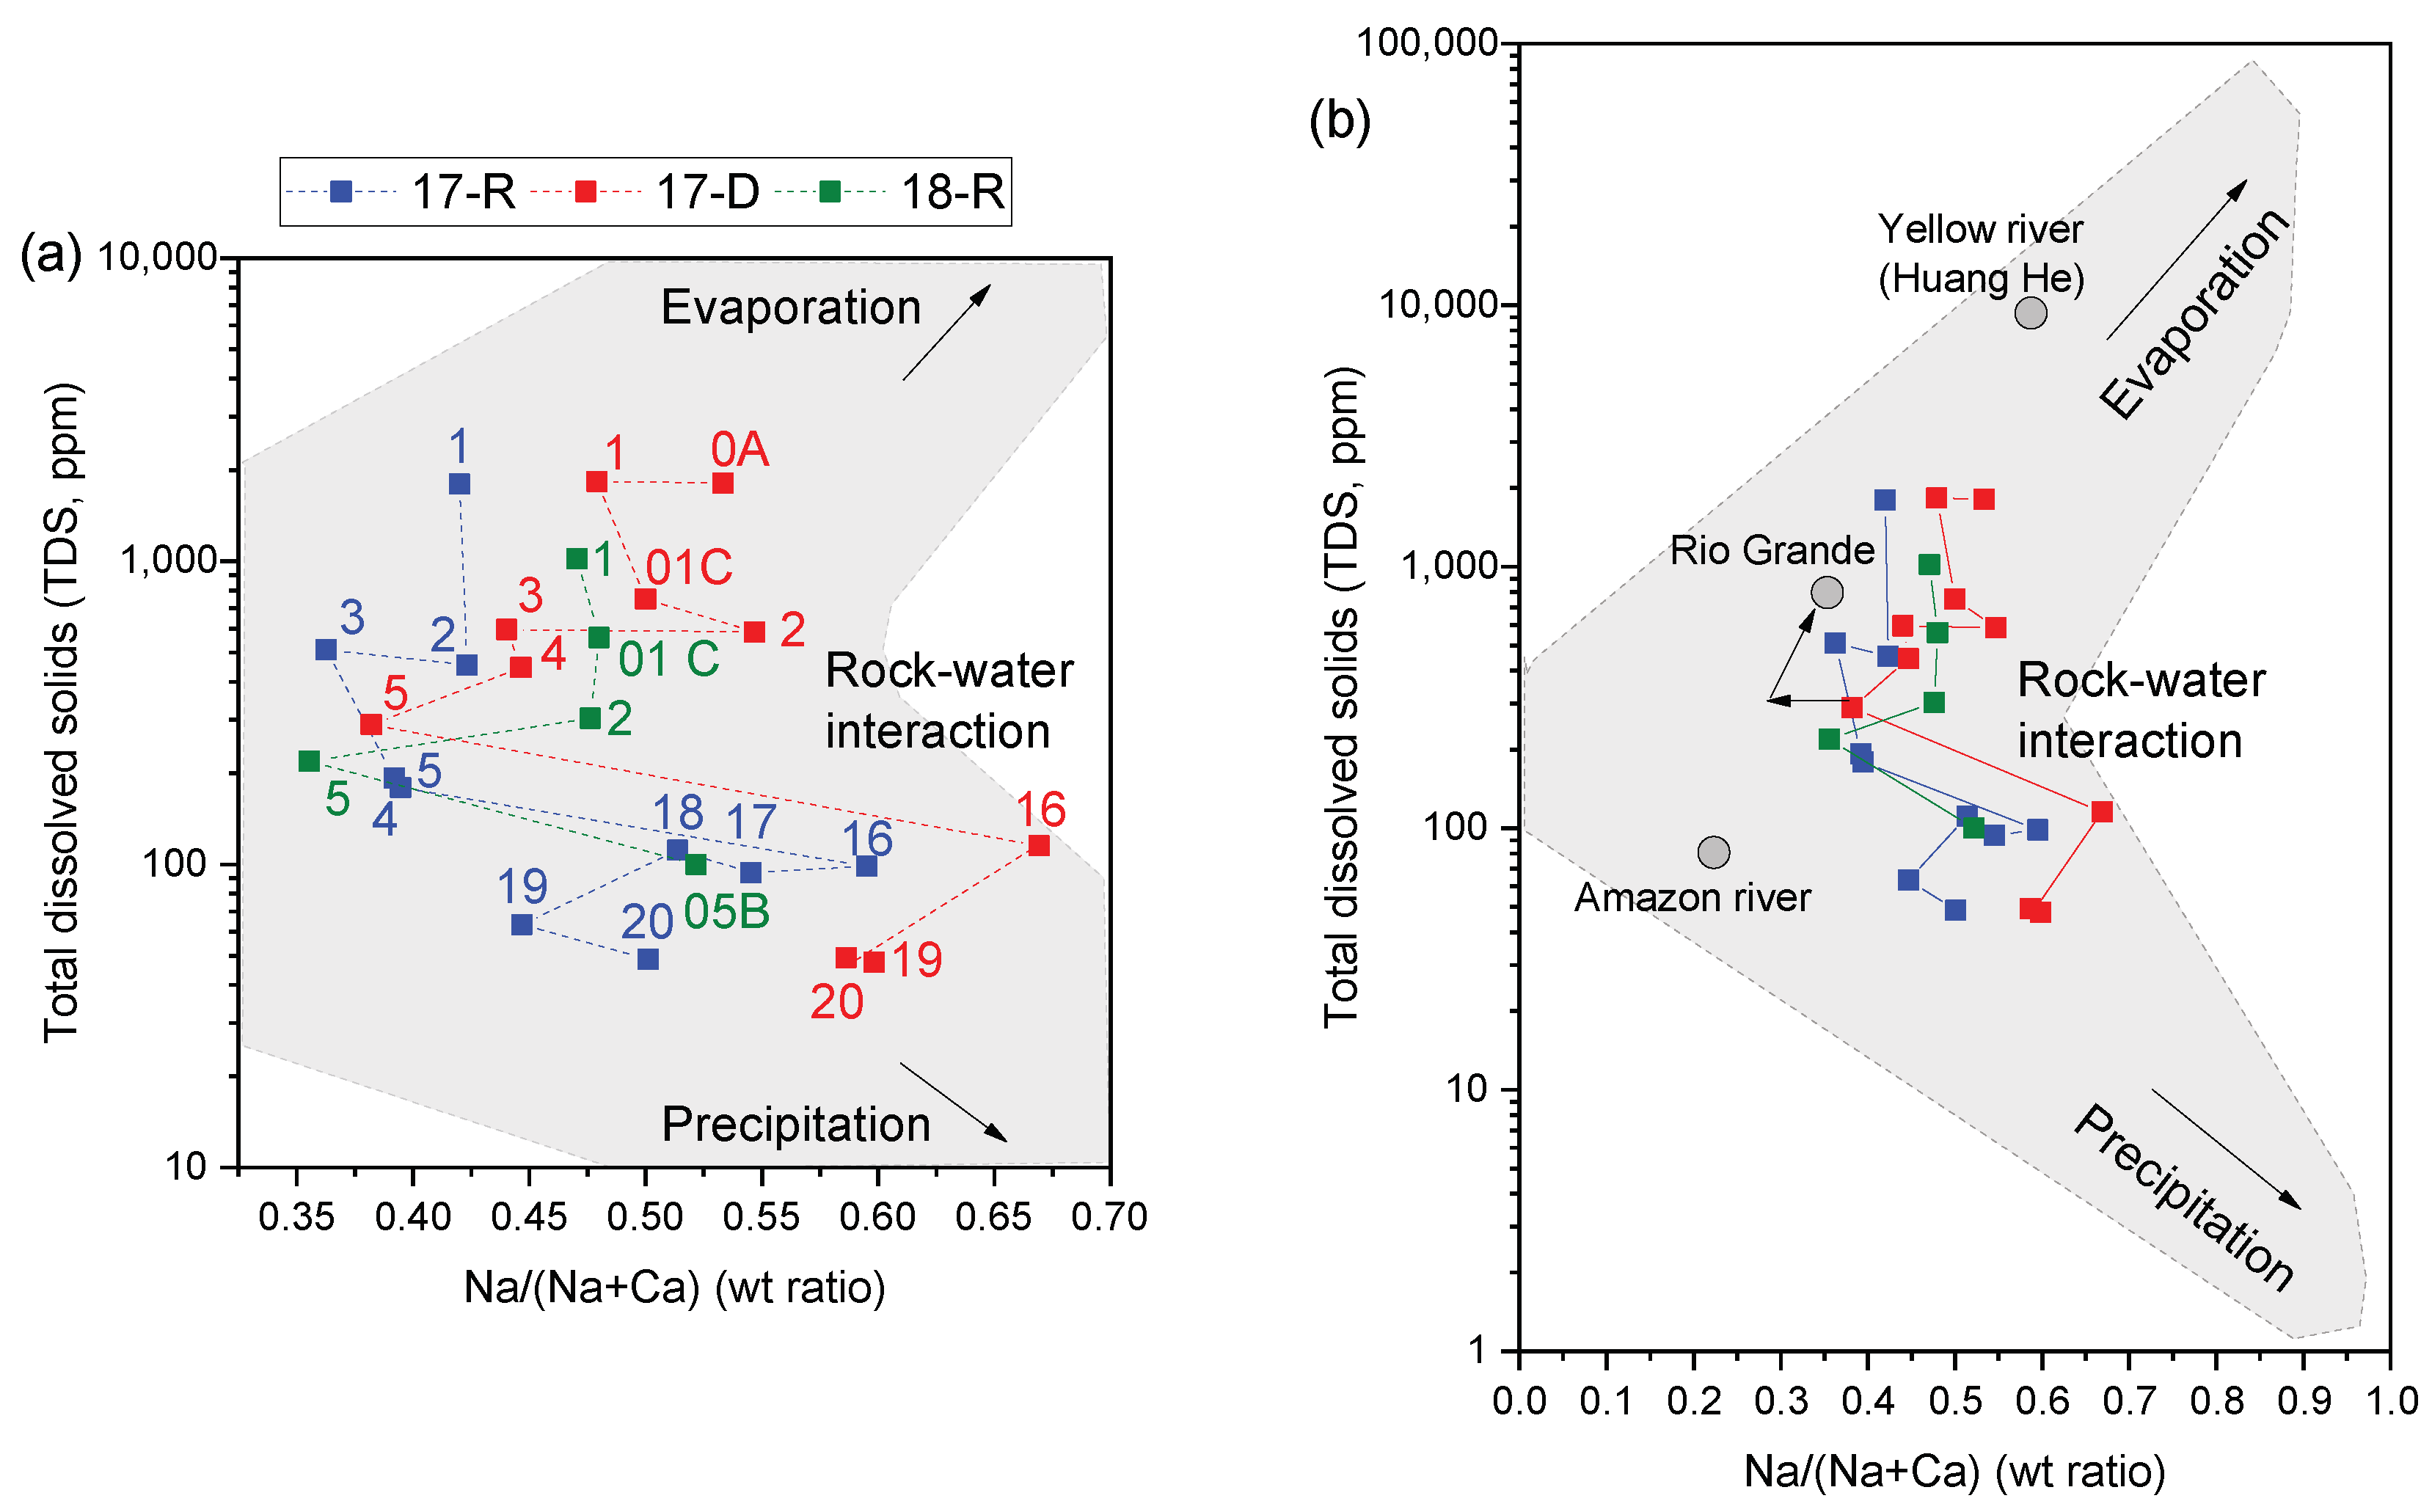
3.1.4. Endmember Controls on Water Chemistry in the Moquegua River Catchment

Water chemistry in rivers is controlled by precipitation, absorption, evaporation, crystallization and weathering. The Gibbs plot of TDS against the weight ratio of Na + /( Na + + Ca 2 + ) is a useful tool to identify these mechanisms in a river system [71,75,76]. The Gibbs plot for the Torata river sites is shown in Figure 5a. This shows that, irrespective of season, site 16 was the most Na-abundant (0.59–0.67 Na/Ca ratio), and site 5 was the most Ca-abundant (0.35–0.39 Na/Ca ratio), while the TDS remained between 98 and 115 mg/L at site 16 and 179–288 mg/L at site 5. This indicates a major change in water chemistry determinants between site 16 and site 5. The Gibbs plot confirms the dominance of precipitation and silicate weathering at headwater sites on water chemistry, and the change from Na abundance to Ca abundance reflects the change in the underlying geology between sites 16 and 5. TDS naturally increases downstream, and site 1 records concentration levels higher, by a factor of 1000, than the rest of the river system in all seasons. Evaporation becomes increasingly important in the lower parts of the river system, but the data indicate that both agricultural leachates and evaporation play significant roles in the chemistry of the lower catchment.

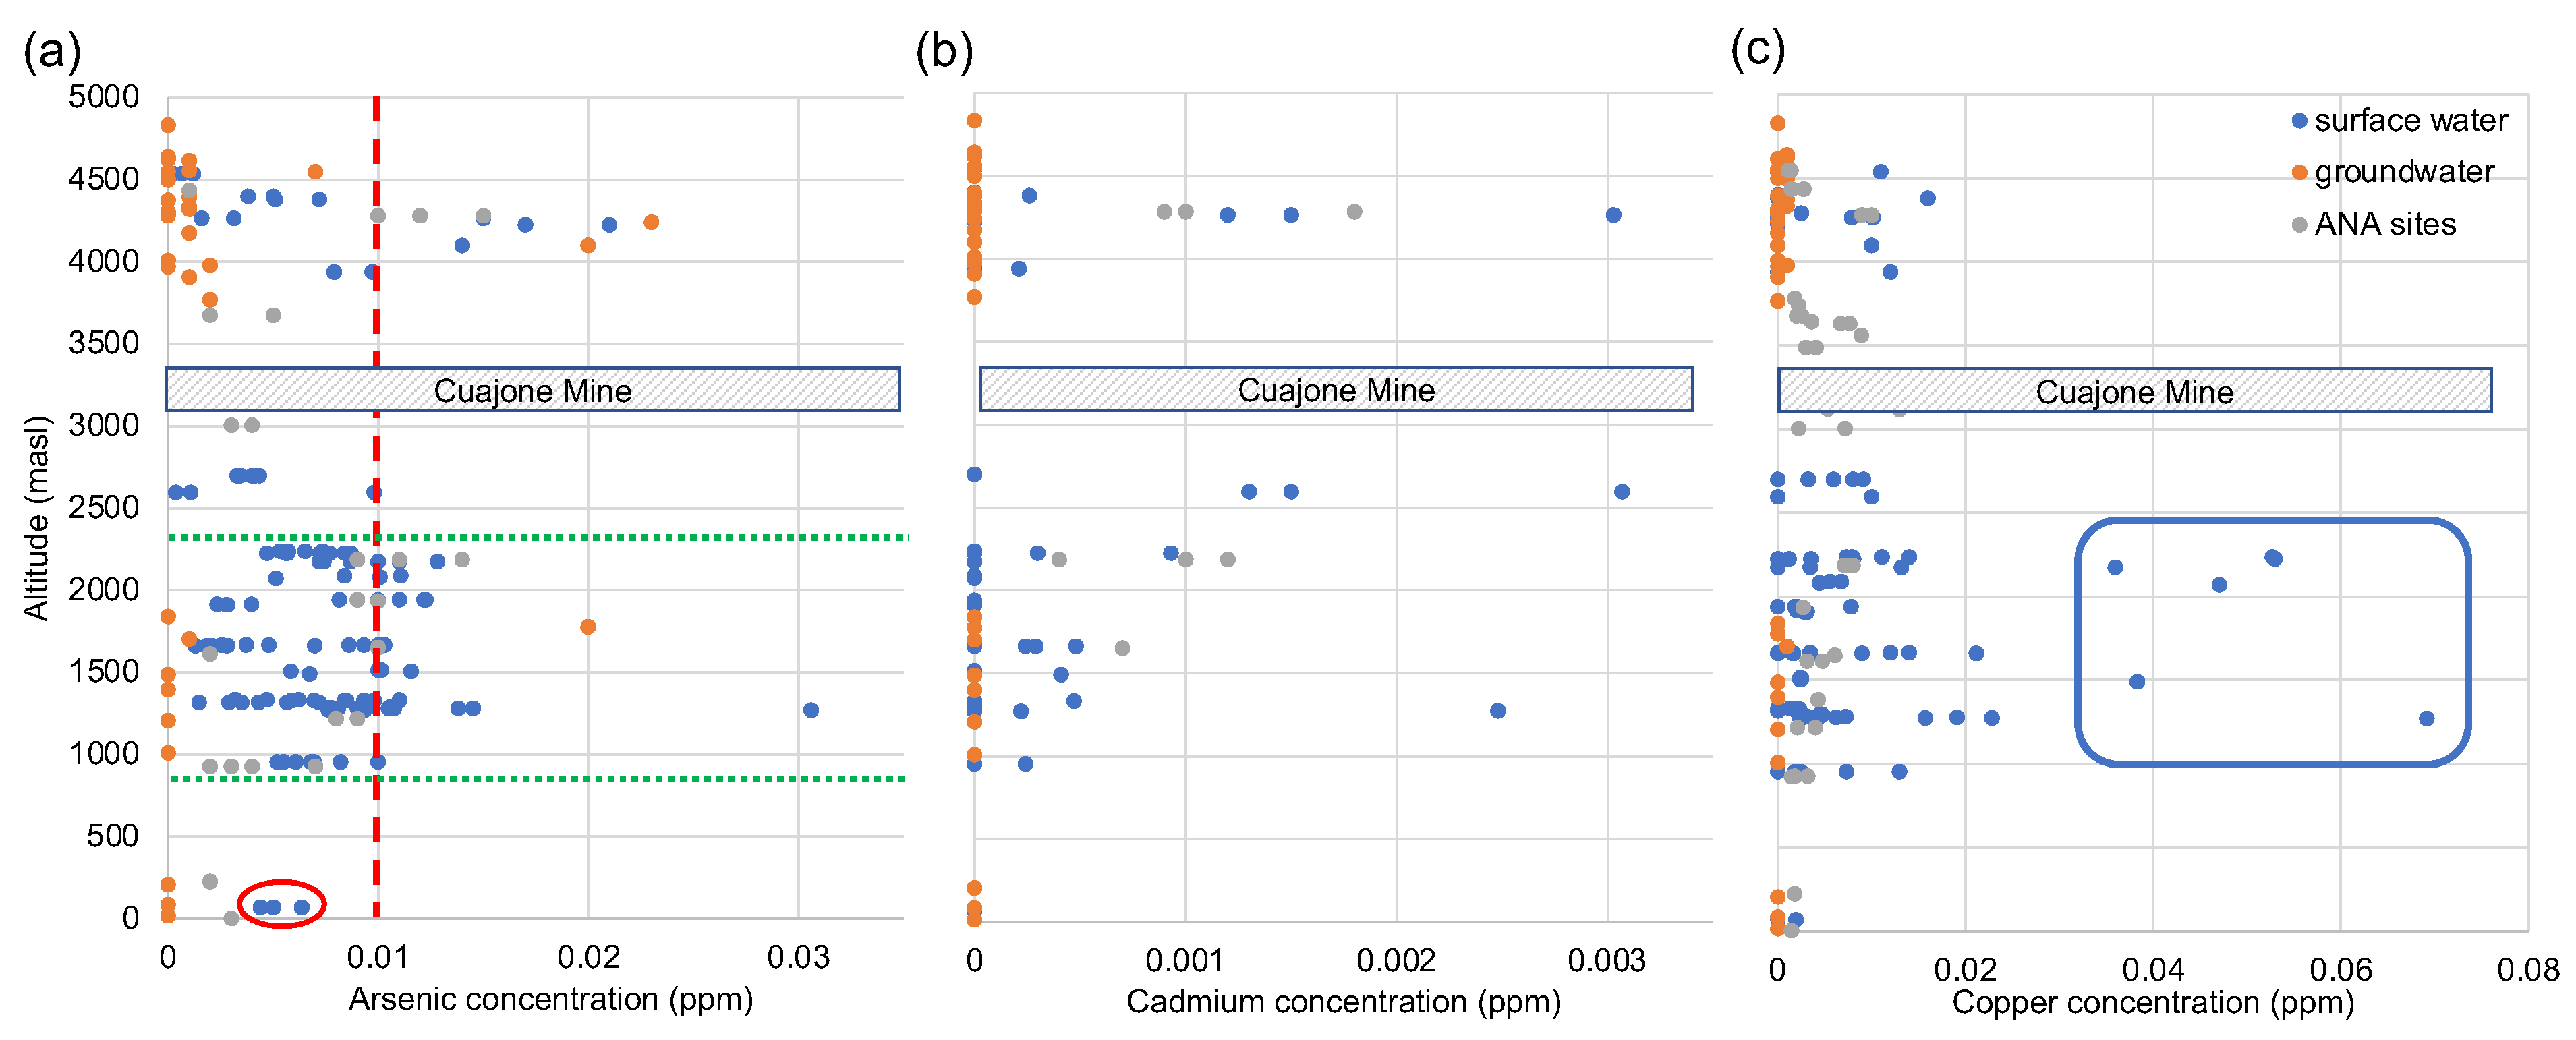
3.2. Trace Metals in the Moquegua River System

Total concentration of trace metals (Cd, Cu, Co, Cr, Pb, Li, Mo, Ni, Se, U, V, Zn) along the Torata and Moquegua rivers for each season are shown in Figure 2 (bar charts). Samples were analyzed for trace metals and other compounds associated with AMD and the natural geochemistry of the region (Table 2). Trace metals can have significant health impacts and are therefore of particular interest. Water analysis showed that Hg, Bi, Th, and Te concentrations in all water samples were below detection limits (<0.06, <2, <4 and <1 μg/L, respectively). The study also confirmed that cyanide (CN) remains below detection limits for all study sites (<20 μg/L). In all water samples, Be, Cd, Co, Cr, Cu, Li, Pb, Mo, Ni, Se, U, V and Zn concentrations were well below safe limits for drinking and irrigation purposes, established by USEPA, WHO, FAO and the Peruvian water authority [55,68,77,78]. Generally, the concentrations of trace metals increase downstream. In our study catchment Be, Co, Pb, Se, U and Zn were only detectable below the Cuajone mine.
For both wet and dry seasons, a notable increase in total trace metal (Cd, Cu, Co, Cr, Pb, Li, Mo, Ni, Se, U, V, and Zn) concentration was recorded below the Cuajone mine, with a 5-fold increase in the wet season and a 3.5-fold increase in the dry season measured between site 16 and site 5. The highest total metal concentration at site 5 was recorded after the El Niño episode (96 μg/L, 17-R). At site 5, significant levels of Li were recorded in 17-D and 18-R (33, 20 μg/L), while Cu was dominant in 17-R (53 μg/L: maximum recorded level in this study at any site, but still within safe limits). Pb was detected only at site 5 and site 4 in 17-R (2.9–3.9 μg/L). These trace metals occur naturally in river waters arising from typical Andean geological units, but their concentration is generally increased by AMD. However, apart from a slight peak at sites 4 and 5 after the El Niño episode in 17-R, trace metal concentrations are not dramatically elevated above site 2 but follow a natural concentration profile concurrent with the cations and anions.
Spatially, total trace metal concentration peaked below Moquegua at site 1 during 17-R and at site-2 during 17-D. Trace metals are used in a wide variety of agricultural chemicals and domestic goods and, as such, these peaks may derive from increased runoff and domestic waste in the lower valley, or increased weathering processes and the dominance of evaporation in the hyper-arid climes of the tropics. It is also true that trace metals can be easily transported by Fe, Mn and humic substances [64,79], which were found abundantly throughout the sample-site network. The trace metals data back up the conclusions from the major cations and anions above—that the dominant endmember in the lower catchment is agricultural and urban runoff.
It should be noted that the hardness of water, determined by Ca 2 + and Mg 2 + ion concentrations, has a major influence on the toxicity of trace metals [80,81]. Water samples from the Torata headwaters (sites 16–20) showed limited hardness (17–44 mg/L CaCO 3 ), while at lower elevations (sites 5 to 1C), water was permanently hard (75–378 mg/L CaCO 3 ). Irrespective of the season, below Moquegua, water became extremely hard (548–764 mg/L CaCO 3 ). Soft water (<17 mg/L CaCO 3 ) is generally associated with increased trace metal ecotoxicity [80,81,82]. High levels of water hardness in the region almost certainly reduce the bioavailability, and therefore ecotoxicity, of trace metals in the Moquegua region. The elevated hardness could be an artifact of hyper aridity.

3.3. Arsenic in the Torata and Lower Moquegua River System

Arsenic (As) concentrations are shown in Figure 6. The As levels along the Torata river were frequently above the recommended levels for human consumption and irrigated agriculture (10 μg As/L, WHO and USEPA standards). The highest As concentrations were recorded at upper Torata valley sites 17 and 18 (14–21 μg As/L), where aresenic containing sulfidic minerals deposited by epithermal and hydrothermal processes associated with the active arc are more prevalent. Site 1D along the Sajena river also recorded elevated As in 17-D (11 μg As/L). By contrast, the Asana river sites 1B and 1E showed consistently low concentrations of As (2.1–4.3 μg As/L) for both 17-D and 17-R seasons. The highest As concentration observed in the Moquegua river, below the confluence of the Sajena, Asana and Torata rivers, was at site 1 during 17-R (10 μg As/L), which followed extensive flooding, owing to the 2017 El Niño episode.
Throughout the Andes of Southern Peru, river catchments are known to contain geogenic As [83]. The high Andean sites in the study area (16–20) are underlain by relatively young volcanoclastic deposits that are undergoing low temperature hydrothermal alteration and localized sulfidization. Previous studies have reported that As is predominantly mobilized from such rocks and their weathering products [83]. Therefore, the elevated As levels found in the upper Torata sites are most likely to be geogenic in origin.
The dominant minerals found at the Cuajone Copper Mine are sulfides, chiefly, chalcopyrite ( CuFeS 2 ), chalcosine ( Cu 2 S), molybdenite (Mo S 2 ), and pyrite (Fe S 2 ), as well as arsenic-bearing minerals, including enargite ( Cu 3 As S 4 ) and tennantite ( Cu 12 As 4 S 13 ) [84]. These arsenic-bearing minerals, frequently associated with copper–porphyry deposits and generally marginal to the main orebody, develop during sulfide mineralization [84]. Mineralization is very localized, concentrated within a 3 km alternation halo, and does not extend significantly beyond this. It has been shown that the weathering of porphyry–Cu deposits and associated As-bearing minerals results in the dispersion of As into the groundwater and surface water bodies, depending on the redox state and pH of the system [85]. Site 5B sits just below the mine and does not show elevated levels of arsenic. However, sites further downstream show variably elevated arsenic levels depending on the season, consistent with remobilization via groundwater and periods of increased runoff and recharge through the shallow aquifer.
It is therefore likely that the pattern of arsenic concentrations observed, Figure 6, reflects both local geochemistry and groundwater dispersion.

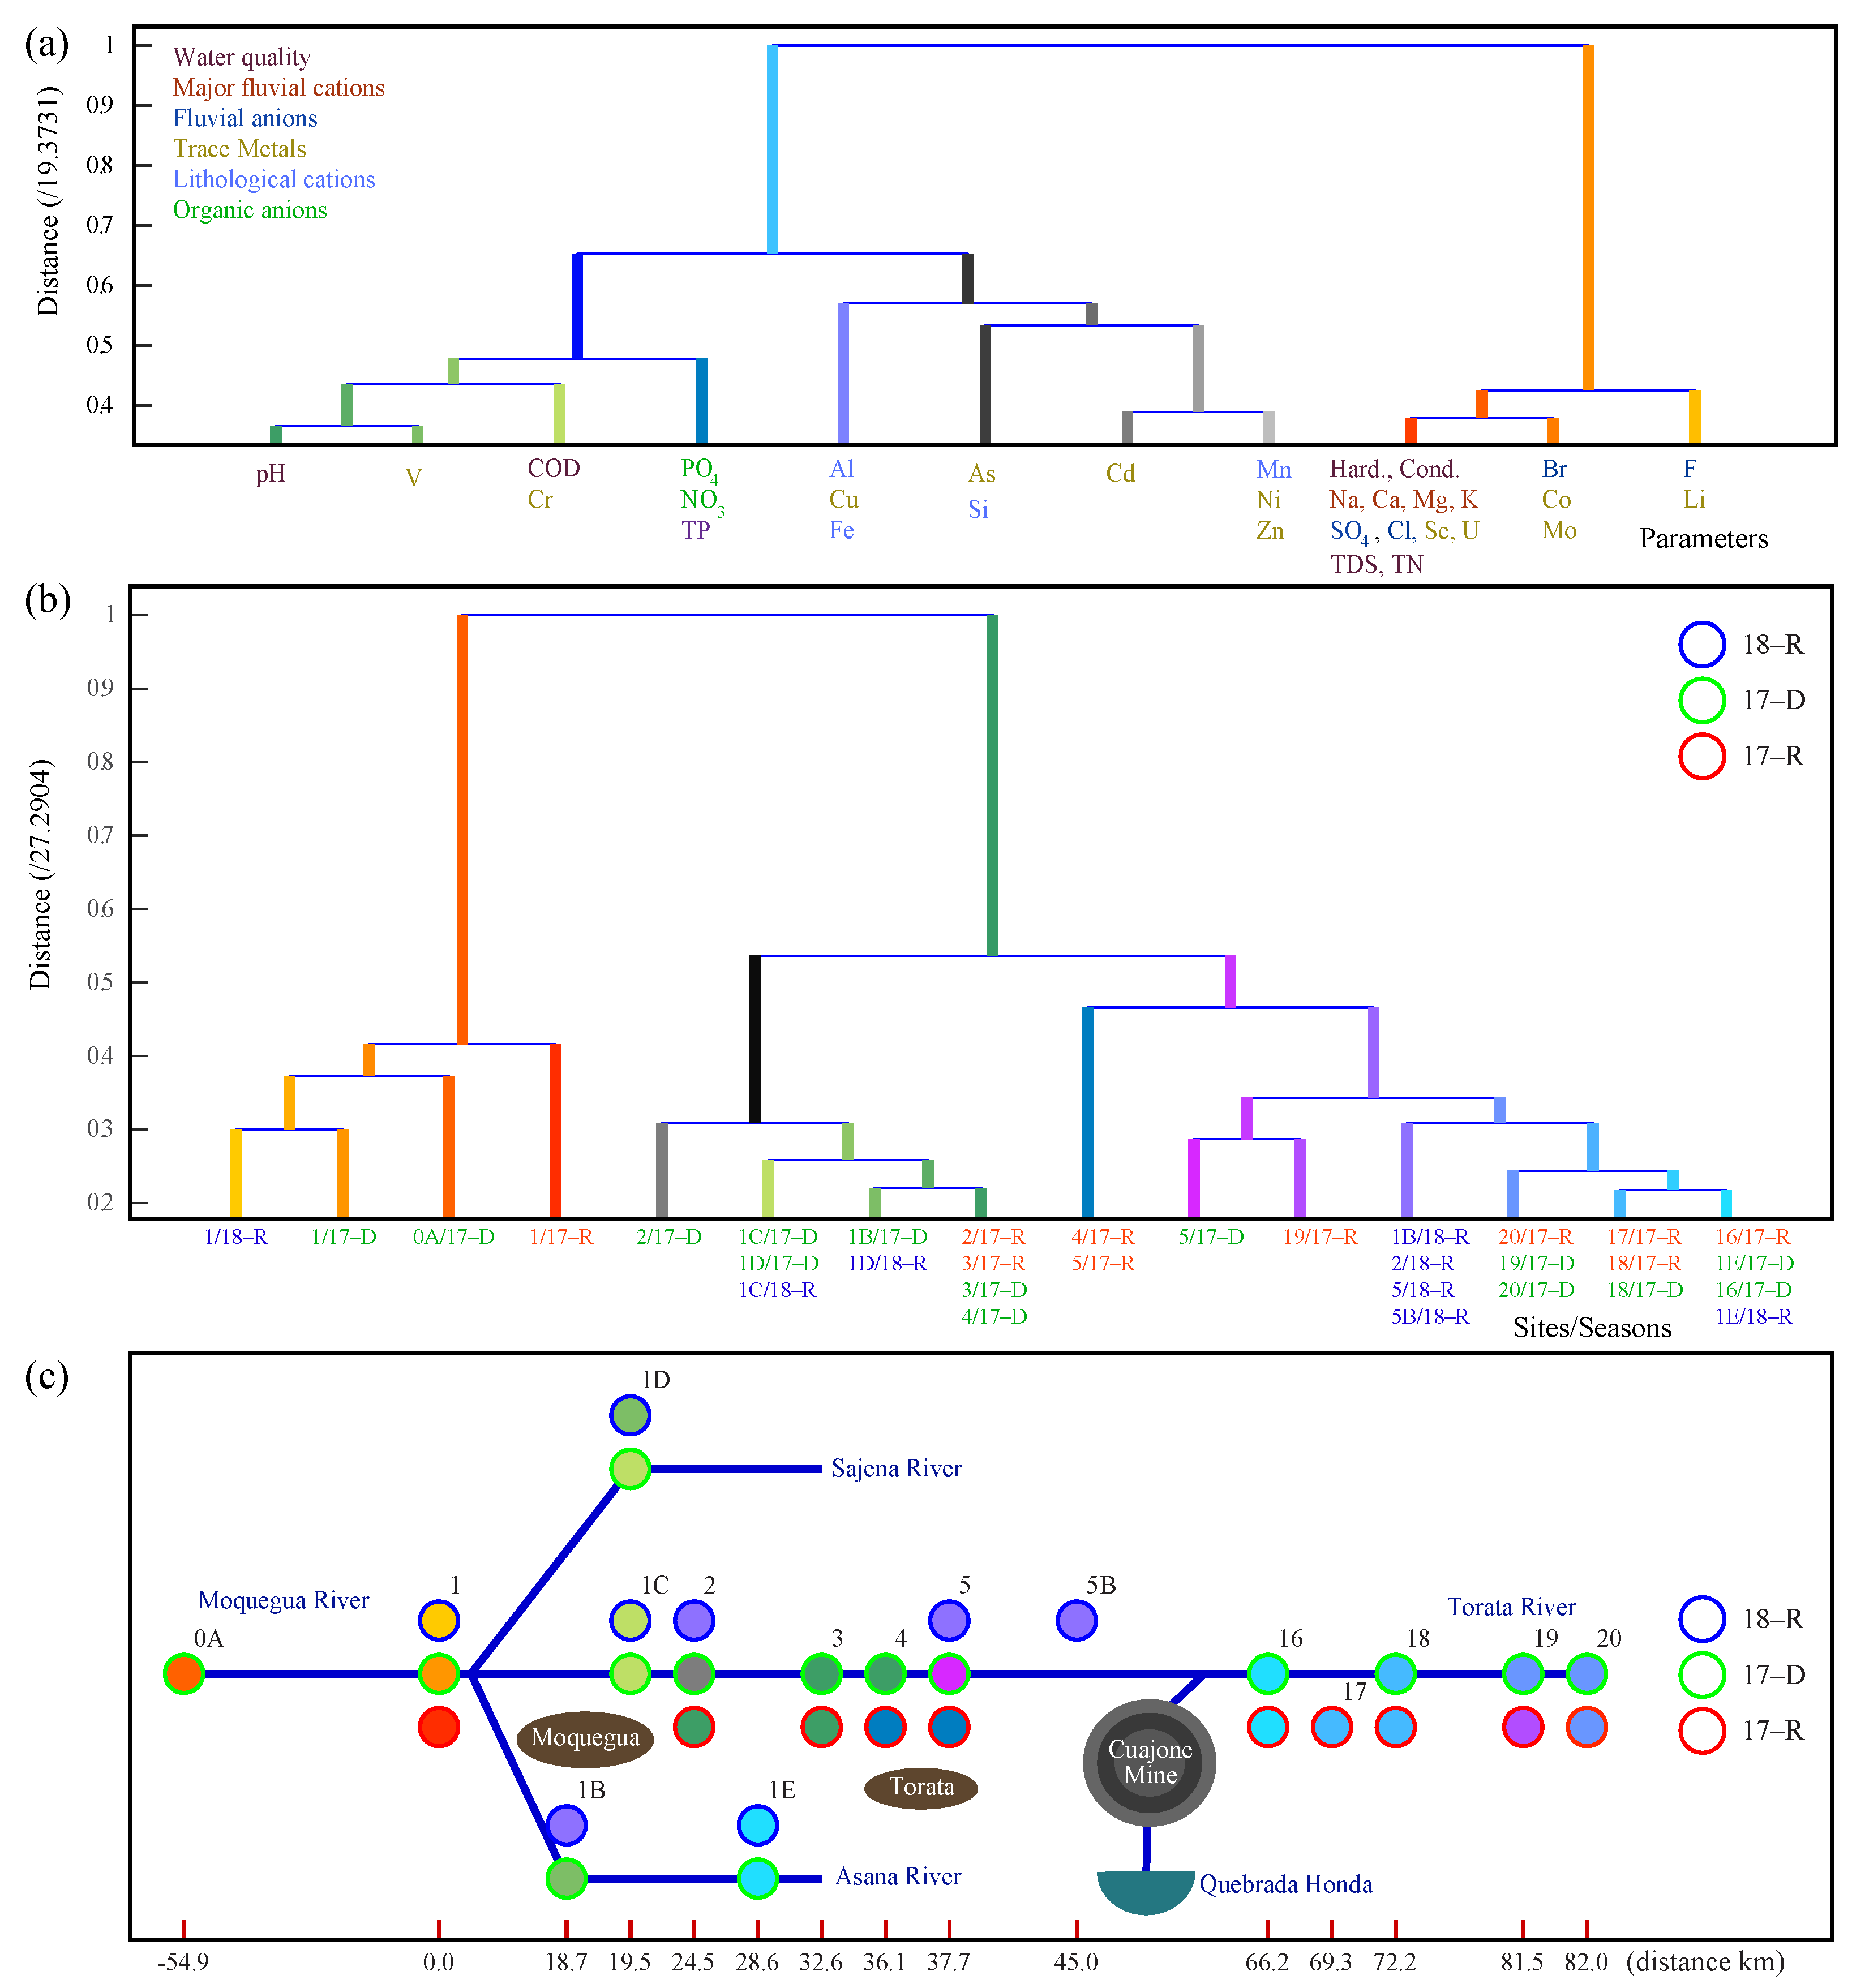
3.4. Multivariate Analysis of Water Parameters

Multivariate analysis was used to give an unbiased assessment of statistical correlations in our data. Correlations between water quality parameters and correlations between sites were analyzed using both CA and PCA. Our analysis took into account the 33 water quality parameters listed in Table 2. Parameters NO 2 , CN, Be, Bi, Te, Th, Hg, Pb were not included because their concentrations were below measurement accuracy. Parameters CO 3 and DO were omitted because the datasets were incomplete.
Figure 7a presents a dendrogram of an R-mode CA for all sites visited in 17-R, 17-D and 18-R. It shows how the parameters cluster according to sites. It was produced with a CCC of 82%. Parameters that have a similar distribution across the sites cluster. At the highest level, we see three clusters. The right cluster contains major ions and trace metals. These parameters arise from the natural water chemistry and dynamics in combination with the local geology. The left cluster contains nitrates, phosphates, trace metals, pH, and COD. These parameters are indicative of agricultural or biological impact. The central cluster contains Al, As, Fe, Si, Mn, and trace metals associated with the weathering of geological units with economic potential and/or urban effluent [86,87]. Peaks in these elements are also associated with periods of increased turbulence and greater suspended load (see above).
Figure 7b,c present a dendrogram from a Q-mode CA and corresponding Beck map (similar to a subway map with sites as stops) for the same 33 water quality parameters. They show how the sites cluster according to parameters. It was produced with a CCC of 84%. Sites with similar patterns of parameters cluster. At the highest level, we see three clusters; the left cluster contains the two lowland sites downstream of Moquegua city, 0A and 1, the central cluster contains foothill sites, and the right cluster mostly contains the highland sites, reinforcing the conclusion that the chemistry is controlled by geographical location and regional inputs.
PCA analysis carried out on the same data shows that 74% of the variance can be accounted for by the first four components. The first component PC1 accounts for 46% of the variance, PC2 accounts for 12%, PC3 accounts for 9%, and PC4 for 7%. Results are shown in Figure 8a—biplot of PC1 against PC2, and Figure 8b—PC1 against PC3. The parameter vectors in the biplots are colored to indicate which parameter cluster they belong to in Figure 7a. As can be seen in Figure 8, the right cluster (red, orange; those controlled by natural hydrological processes and underlying geology) aligns well with PC1, the central cluster (light blue, grey; those controlled by the suspended load and increased runoff) aligns with PC2, and the left cluster (green, blue; those controlled principally by anthropogenic activity) aligns with PC3. As and Si align with PC4. Colored circles are used in the biplot to indicate the site clusters from Figure 7b,c. The color of the outer rings indicates the season.

3.4.1. Headwater Sites

In general, the headwater sites 16–20 cluster with site 5 (and site 4 in 17-R) below the Cuajone mine. This precludes chemical addition to the river through mining activity. PC1 and PC2 are low for the headwater sites (in contrast to sites 4 and 5, see below), suggesting that the main controls on river chemistry up to this point are hydrological. Contribution from PC3 (chemicals associated with organics) is also low except for site 19, the bofedal, and this is interpreted as the naturally high levels of biogeochemical components in an Andean peatland. Data from the Asana and Sajena rivers were collected during 17-D, and site 1E on the Asana river also clusters with headwater sites, suggesting that this river has similar chemistry and dynamics to the Torata river to this point. In 18-R, headwater sites were inaccessible.

3.4.2. Foothill Sites

As mentioned above, sites 4 and 5 (5B) (between the mine and Torata) show strong alliance with the headwater sites but share some affinity with sites 2 and 3, below Torata. All four sites showed an average contribution from PC1 as expected from their location in the middle of the river system. During 17-R, sites (4, 5) showed some contribution from PC2, whereas the headwater sites and sites (2, 3) showed average values. Elevated contribution from PC2 is consistent with increased runoff, creating turbulent flow following El Niño. All foothill sites showed an average value for PC3. Samples collected from the confluence of the Torata with the Osana and Sajena rivers (sites 1B, 1C, and 1D) during 17-D cluster with the other foothill sites (2, 3, 4). These sites showed average values for PC1, PC2 and PC3, consistent with the season being dry and the hydrographic location of these sites. The specific chemistry of the tributary sites in this area is seasonally regulated; sometimes, sites share characteristics with the foothill sites and other times share characteristics with headwater sites. This is consistent with variable runoff rates in different seasons changing the exact chemical elements added to the river system at various sites. In general though, hydrographic processes determine the chemistry of the foothill sites (see Figure 5), and the multivariate analysis for these sites shows that the Cuajone mine had little or no effect on the river system over the observation period. The fact that this period included an El Niño episode shows that the measures to isolate the mine from the Torata river are effective.

3.4.3. Lowland Sites

The lowland sites (sites 1, 0) formed an isolated cluster irrespective of season. PC1 was high in all seasons, consistent with these sites being towards the lower reaches of a river running through a hyper-arid zone with high levels of evaporation. In addition, elemental concentrations were elevated by the accumulation of dissolved ions through the chemical weathering of all three geological zones, from several agricultural regions and the two main urban centers, Torata and Moquegua. In 17-R, PC2 was high, indicating elevated wash caused by the El Niño episode. In 17-D and 18-R, PC3 was high, consistent with the agricultural activities along the river at that time.

3.5. Analysis of ANA and INGEMMET Data

In Figure 9 and Figure 10, we present a collation of data for the Torata river system, including our surface water data, available survey data collected by ANA, the National Water Authority in Peru, from 2013 and 2014 [88,89,90] and groundwater analyzed by INGEMMET around the same time [5]. Figure 9 shows the downstream concentration of a selection of major ions (calcium, sodium, sulfate) plotted against altitude. The data show an increase in concentration from source to sink, consistent with the conservative behavior of the ions controlled predominantly by the cumulative addition of elements along the water course through weathering, and further concentration through evaporation. Points plotting to the right of the main cluster at just below 1000 m asl are surface waters affected by contaminated groundwater (c.f. conclusions drawn by INGEMET [5]). The Cuajone mine is marked by a grey box with diagonal lines. If the mine had a significant impact on the surface waters, we would expect to see a similar deviation of the surface waters to the right in the vicinity of the mine. In fact, the two grey data points at 1100 m asl are samples of runoff analyzed by ANA from the base of the tailing fan in 2013 and 2014. These data clearly show elevated concentrations of major ions. However, these elevated concentrations are not spatially distributed, and data gathered only a few hundred meters from the tailing fan show normal concentrations. The ions are quickly scavenged from the surface water through sorption and precipitation and do not travel far from the source.
Figure 10 shows the concentration of arsenic, cadmium and copper plotted against altitude. The concentration of these three trace elements in the water is a major concern for the people who live in the area. Data are not controlled by conservative processes as in the major ions but are more dispersed. Of note are the digressions to higher concentrations around 4250 m asl in all three elements. The higher altitude headwaters are underlain by young volcanic arc units, with very high permeability. There is extensive epithermal and hydrothermal activity associated with the active arc. This allows mobilization of these cations via natural acidic chemical weathering of the mantle derived volcanic material, and rapid recharge into the surface waters as a result of the highly porous nature of the lithology (c.f. findings by INGEMMET [5]). The riverine geochemistry at these high altitudes in Southern Peru and Northern Chile is composed of a mix of precipitation, surface water runoff and associated chemical weathering, and additional input from chemically enriched groundwaters via thermal springs. Typically, these waters increase not only the concentration of trace elements such as arsenic and boron but also the major anions such as chlorine and sulfate [91,92]. The Cuajone mine is once again represented by a grey box with dashed lines. There is no significant increase in concentration of any of the three trace metals at the altitude of the mine. In contrast, the green lines just below 2500 masl and 1000 m asl represent the start and end of the irrigated land between Torata and Moquegua. The data in all three plots are very dispersed in this region. Surface waters contaminated by the presence of the urban settlements and agricultural practices are rapidly mixed into the ground water through the porous alluvial valley fill at this altitude, and recharge leads to increased concentrations in surface waters downstream. The concentrations of cadmium and copper are below the guidelines for safe water throughout the river network, both for drinking and use in agriculture. The levels of arsenic are generally below the limits quoted by USEPA guidelines [77] except a few sites in the headwaters, where aggressive chemical weathering takes place, and also at times of elevated flow following heavy rains and/or flash floods in the agricultural plains.

4. Discussion

Hyper-arid regions rely largely on river systems as the principal source of water. Changes in both river water availability and chemistry therefore have a direct and immediate impact on dependent systems in such regions. This is particularly true in the Andean transect in this study, where the Moquegua river system passes through the hyper-arid Atacama Desert and is used for human consumption and agricultural and industrial use throughout its length.
The location of the Cuajone mine above Torata required that both channel and waste material diversion mitigation strategies are essential to avoid impacting water quality in heavily settled areas beneath the mine. To this end, a diversionary channel was constructed around the projected mine pit at the Cuajone mine. Additionally, the construction of tunnels and concrete-lined channels enables waste materials to be diverted to the tailings dams at Quebrada Honda and Cortaderas 2 (see Appendix A). The expansion of urban areas and the extension and modernization of agriculture in the region has necessitated the development of a regional irrigation project. The Pasto Grande catchment transfer project diverts water from the Tambo catchment, to the north, to sub-catchment tributaries in the greater Moquegua drainage basin. The catchment transfer project has significantly increased channel flow in the Sajena, Otora, Torata and Moquegua rivers and will undoubtedly add physico-chemical characteristics of the upper Tambo river to the Moquegua–Torata river system. Our data indicate a clear urban and agricultural signal in the lower parts of the Torata and Moquegua river sample sites, while data from Pasto Grande sample sites have not been analyzed to identify a clear signal from that source in the lower Moquegua drainage basin.
Water availability in the Moquegua river system arises from seasonal rains and geothermal sources. In the month prior to the 17-R investigation, an El Niño episode had led to catastrophic flooding and a temporary superabundance of turbid river flow. River courses were altered, farmland destroyed, and bridges and roads damaged. However, climatic conditions during the study period were generally dry, and the rivers had already returned to dry season flow rates during the sampling campaign. The same was observed for 17-D and 18-R. The cycles of flooding and drought in this region, which disrupt water availability and complicate water resource allocation, are irregular and therefore difficult to predict.
Irregular seasonality affecting water chemistry, through the erosion and concentration of trace metal containing silts, further complicates water resource allocation and treatment. Elevated concentrations of Al in drinking water is often considered to increase the risk of Alzheimer’s disease, with prolonged exposure leading to systematic toxicity and renal failure; increased Fe and Mn is associated with aesthetic problems such as the staining of laundry, and an unpleasant smell and taste [93,94]; and elevated As concentrations in drinking water is associated with skin, liver and kidney cancers [95,96]. Our data show that harmful hydro-chemistry, derived from elevated levels of Al, Fe, Mn, and As, is found to be highly variable across the sample site network and period of work. As such, the associated social and economic cost, while difficult to determine, will most likely be attributed to bio-accumulation over longer periods of time.
The study indicates multi-factoral determination of river chemistry at many sites, including, more significantly, seasonality. This has significant implications for the direct management of water resources in hyper-arid regions as well as pre-development stakeholder engagement to ensure effective social and environmental impact management [12]. These areas are particularly prone to episodic and localized precipitation patterns, as well as distinct seasonality, which may suffer increased climatic volatility in the future [97,98]. The data show increased mobilization of trace metals into the river system following episodes of more intense rainfall. These have a relatively short residence time and are scavenged from the water by sorption and precipitation, within a matter of months (17-R c.f. 17-D). However, the management of the purity of the water in the lower catchment requires consideration of agricultural practices and supervision of the disposal of anthropogenic waste, as these contaminated superficial waters are rapidly recycled into the river through the porous aquifer of the alluvial plain [5].
This study finds three distinct geochemical and anthropogenic determinants to the water chemistry of the Torata River system: natural hydrological factors, the addition of elements through channel flow volatility, and biogeochemical parameters associated with elevated organics, both natural and anthropogenic. Sites (16, 17, 18, 19, 20) fall within the arid temperate zone from 2800 to 4600 m asl and are all above the Cuajone mine. Water quality here is determined by geological conditions and weathering processes. Cation, anion, and trace metal levels were well below the safe limits for human consumption, with the exception of arsenic concentrations, which exceeded safe limits for human consumption at sites 17 and 18. This can be attributed to geochemical weathering processes, but the water chemistry also suggests that the river is fed by Na + - and SO 4 2 -rich ground waters, which can also be a source of As contamination [83]. Sites 3, 4, 5, and 5B fall within the arid sub-tropics from 1400 to 2800 m asl below the Cuajone Mine, town of Torata, and its associated agricultural areas. These sites showed moderate water quality with significant seasonal variation. While agricultural leachates are still detectable, naturally weathered contaminant loading is more prevalent. Increased surface runoff following El Niño, led to elevated Al, Fe and Mn in the water, where concentrations were recorded above recommended limits for domestic consumption and agricultural use. An increase in total trace metals Li, Cu, and Pb concentrations was also found below the Cuajone mine, but no indication of AMD was seen. Cation–anion composition at these sites showed water chemistry undergoing a transition between the Cuajone mine and Torata village, in which the water composition changes from Na-dominant to Ca-dominant. This reflects a change in dominance from precipitative to evaporative processes in determining the hydrochemistry of the river.
Sites 0A, 1, 1B, 1C, 1D, 1E, and 2 fall within a hot, hyper-arid desert extending from sea level to 1400 m asl. Sites 1B, 1C, 1D, 1E, and 2 show more chemical affinity with the sites in the arid subtropical zone, with water chemistry controlled though natural hydrological processes and a minor concentration of some elements during periods of high runoff. Sites-1 and 0A, below Moquegua, exhibited the worst water quality, irrespective of season. The data presented here are consistent with elevated levels of these chemicals from urban waste and agricultural leachates rather than natural weathering or hydrological processes. Significant levels of cations ( Ca 2 + , Na + , K + ) and anions ( SO 4 2 , Cl ) as well as high EC and TDS levels were recorded. Intermittently, trace metals and metalloids (Mn, As) exceeded the guideline values. The water quality in this section of the catchment did not meet strict criteria for safe domestic consumption and, on occasion, agricultural use.
The preceding discussion of chemical analyses and cluster analysis (CA) of site data show that the impact of the Cuajone mine is less significant than agricultural and urban activities in the contamination of this river system. Owing to the hyper-aridity in the region, the low weathering regime reduces the mobilization of soil minerals, and it is difficult to conclude that ARD occurs to any significant extent in this catchment, or that the surface water quality has been greatly affected. Direct contamination as a result of AMD from the mine itself is reduced by the bypass of the Torata river around the Cuajone mine through a system of canals and diversions, and an upstream dam that largely prevents flooding from affecting the lower catchment. However, although AMD from open pit mining may be controlled during operation periods, it can cause long-term environmental problems after closure [23], and it is therefore important to develop a strategy to maintain good control over the mine drainage and tailing disposal to protect this drainage basin long after mine closure.
The data show that the impact of agriculture and urban activities is more significant than mining in determining cation–anion concentrations in the hyper-arid river system in this study. These rivers, in combination with the local climate and alluvial soils, provide ideal conditions for the development of highly productive small- and medium-scale agriculture, which has been practiced for centuries [78]. The modernization of agriculture has led to the rapid increase in the use of pesticides and fertilizers, which in sensitive environments will have consequences for the quality of water resources and their value for domestic consumption and agricultural irrigation. Additionally, the use of river water and river channels to dispose of urban waste and industrial effluents is clearly deleterious to water quality and environmental integrity. The effective regulation of agrochemical use and tight control of urban and industrial effluent and sewage disposal in Peru will be key for the long-term environmental stability and management of a very scarce resource and, therefore, the long-term sustainability of development.
The desert micro-habitats in the region, although depauperate, have a high level of biological endemicity [99]. Hyper-arid environments are particularly sensitive to perturbation, and recuperation is slow. Thus, the impacts on biodiversity and ecological integrity from irregular water contamination are disproportionately high, making the monitoring of water quality and control of contamination all the more consequential in the region. The impact of elevated metal, metalloid, and anion concentrations in this river system on xeric ecologies is not yet known, and remains a research priority for the wider region. It is of note that the Peruvian National Water authority (ANA) monitors only 98 of the 159 river catchments identified in Peru. Only 60% of these monitored rivers meet nationally agreed environmental quality standards [68]. Given the scale of mining in the region and the volume of fresh water required for processing ores as described above, this study highlights the need for careful monitoring of water availability as well as quality, in a region of extreme water scarcity. As weathering processes under hyper-arid conditions are known to amplify the concentration of harmful geochemistry, monitoring temporal variability in water quality is also important. The effects of temporal variability and long-term volatility in channel flow on bioaccumulation and trophic transfer in the region’s xeric ecosystems are as yet unquantified but are critical to understanding the full anthropogenic impact.
In summary, this investigation indicates that the geochemistry of the Torata river subcatchment is substantially determined by the underlying geological units and, in combination with weathering processes, characteristic of conditions found from the high Puna, at 4500 m asl, to the lower coastal deserts. There does appear to be an indication of seasonal variation, perhaps linked to the episodic El Niño phenomena, reflecting the dominance of geogenic factors.
Our data show that the Cuajone mine did not affect water quality parameters in the Torata river, nor significantly alter the geochemistry of the river during the study period. We do not have data prior to the onset of mining at the site, and so cannot constrain any quantitative changes in the geological contribution to the river chemistry as a result of the mine, but the data are consistent with chemical weathering being the dominant control on the fluvial geochemistry, both above and below the mine site during the period of investigation. It seems, at least in the time period concerned, that mine activity has had no adverse effect on water qualities necessary for aquatic life.
Data indicate a clear signal from the rural settlement of Torata and associated agricultural lands beneath the Cuajone mine. A clear geochemical signal is also discernible below the city of Moquegua in the Moquegua river, and also below the confluence of the Sajena and Torata with the Moquegua river. The data are consistent with contamination by urban and agro-chemical usage in the built-up and agricultural areas lying below the city of Moquegua. This is the result of the rapid recharge of contaminated surface waters from the urban and agricultural areas through the highly porous alluvial fill in the Moquegua valley. Additionally, significant increases in organic matter and sulfates were identified at El Conde, 18 km below the city.

5. Conclusions

This study presents time-limited findings of research undertaken from 2015 to 2020 in the Torata and greater Moquegua river systems in Southern Peru and offers an insight into the determinants of water quality and availability in hyper-arid catchments in the region and, in furtherance of our understanding of geochemical dynamics in hyper-arid river systems, represents a unique case study. Our findings indicate the need for further investigations into both mine impact mitigation strategies and water resource exploitation, for both resource management and environmental integrity. In Southern Peru, this would involve investigating the wider environmental implications associated with landscape-scale mining, including impact mitigation strategies employed prior to, during, and long after mining operations cease, as well as the direct impacts of the mine activity on groundwater flow and storage, as well as headwater ecology in this hyper-arid region.

Author Contributions

Conceptualization, D.H.N.P., E.P.G.B., L.d.l.S.V. and C.H.W.B.; methodology, M.H., D.H.N.P., E.P.G.B., E.E.-P., P.J.N. and C.H.W.B.; software, D.A.-S. and C.H.W.B.; validation, M.H., D.H.N.P., E.P.G.B., P.J.N., P.A.B. and C.H.W.B.; formal analysis, M.H., D.H.N.P., E.P.G.B., P.A.B. and C.H.W.B.; investigation, M.H., D.H.N.P., E.P.G.B. and E.E.-P.; resources, D.H.N.P., E.E.-P., D.A.-S. and C.H.W.B.; data curation, M.H., D.H.N.P., E.E.-P. and C.H.W.B.; writing—original draft preparation, M.H., D.H.N.P., E.P.G.B. and C.H.W.B.; writing—review and editing, M.H., E.P.G.B., H.V.L., D.H.N.P., P.J.N., P.A.B. and C.H.W.B.; visualization, M.H., D.H.N.P., E.P.G.B., H.V.L., N.I. and C.H.W.B.; supervision, D.H.N.P., E.P.G.B., H.V.L. and C.H.W.B.; project administration, E.P.G.B., E.E.-P. and C.H.W.B.; funding acquisition, E.P.G.B., L.d.l.S.V. and C.H.W.B. All authors have read and agreed to the published version of the manuscript.

Funding

This research is supported through a collaborative agreement between the National University of Moquegua (UNAM) and the University of Cambridge (grant RG85120).

Data Availability Statement

All data are provided in Excel files and can be downloaded from www.repository.cam.ac.uk (accessed on 20 January 2024).

Acknowledgments

The authors acknowledge the valuable support of A. Quispe and W. Zeballos at UNAM; Himantha Cooray for his assistance in developing the Mathematica program for data analysis; John Forrest for his contribution in arranging fieldwork; and Julia Porturas for her administrative support.

Conflicts of Interest

The authors declare no conflicts of interest.

Abbreviations

The following abbreviations are used in this manuscript:
DOAJDirectory of Open Access Journals
ARDAcid rock drainage
AMDAcid mine drainage
EISEnvironmental impact statements
maslMeters above sea level
17-RJanuary 2017
17-DJuly 2017
18-RJanuary 2018
UNAMUniversidad Nacional Autonoma de Moquegua
GPSGlobal Positioning System
DODissolved oxygen
TDSTotal dissolved solids
ICP-MSInductively coupled plasma mass spectrometry
ICP-OESInductively coupled plasma - optical emission spectrometry
CNCyanide
TPTotal phosphorous
TNTotal nitrogen
CODChemical oxygen demand
ENSOEl Niño–Southern Oscillation
MaMillions of years
CACluster analysis
PCAPrincipal component analysis
PCPrincipal component
EPAEnvironmental Protection Agency
ISOInternational Organization for Standardization
CCCCophenetic correlation coefficient
ECElectrical conductivity
USEPAUnited States Environmental Protection Agency
WHOWorld Health Organization
FAOFood and Agriculture Organization of the United Nations

Appendix A. Waste Canal from the Cuajone Mine

Figure A1 shows the study area with mining activities outlined. The canal identified in yellow collects waste products from the Cuajone mine and carries them out to the Quebrada Honda tailings dam. These channels are made up of a series of tunnels, concrete-lined open channels, and existing natural river channels.
Figure A1. Black polygon: area of direct mining and mine related infrastructural impact. Red polygons: upper red polygon = Southern Copper Cuajone mine, middle red polygon = Anglo American Quellaveco mine, lower red polygon = Southern Copper Toquepala mine. Yellow lines: mine waste channels. Blue polygons: Cortaderas 2 and Quebrada Honda tailings dams. Purple line: railway line to Ilo smelter. Pink polygon: Ilo smelter. White lines: Pasto Grande project irrigation canals (tunnels, concrete-lined channels, and existing river channels). Green polygon: AH Pampa Sitana irrigation project.
Water 16 00769 g0a1

References

  1. Ling, H.; Zhang, P.; Xu, H.; Zhang, G. Determining the ecological water allocation in a hyper-arid catchment with increasing competition for water resources. Glob. Planet. Chang. 2016, 145, 143–152. [Google Scholar] [CrossRef]
  2. Houston, J.; Hartley, A.J. The central Andean west-slope rainshadow and its potential contribution to the origin of hyper-aridity in the Atacama Desert. Int. J. Climatol. A J. R. Meteorol. Soc. 2003, 23, 1453–1464. [Google Scholar] [CrossRef]
  3. Villalobos-Puma, E.; Flores-Rojas, J.L.; Martinez-Castro, D.; Morales, A.; Lavado-Casimiro, W.; Mosquera-Vásquez, K.; Silva, Y. Summertime precipitation extremes and the influence of atmospheric flows on the western slopes of the southern Andes of Perú. Int. J. Climatol. 2022, 42, 9909–9930. [Google Scholar] [CrossRef]
  4. Zarch, M.A.A.; Sivakumar, B.; Malekinezhad, H.; Sharma, A. Future aridity under conditions of global climate change. J. Hydrol. 2017, 554, 451–469. [Google Scholar] [CrossRef]
  5. Ng Cutipa, W.L.; Peña Laureano, F.; Acosta Pereira, H. Hidrogeología de la Cuenca del río Ilo-Moquegua (13172), Región Moquegua [Boletín–H 6]; Repositorio Ingemmet: Lima, Peru, 2019. [Google Scholar]
  6. Brêda, J.P.L.; de Paiva, R.C.D.; Siqueira, V.A.; Collischonn, W. Assessing climate change impact on flood discharge in South America and the influence of its main drivers. J. Hydrol. 2023, 619, 129284. [Google Scholar] [CrossRef]
  7. Clark, A.H.; Farrar, E.; Kontak, D.J.; Langridge, R.J.; Arenas F, M.J.; France, L.J.; McBride, S.L.; Woodman, P.L.; Wasteneys, H.A.; Sandeman, H.A.; et al. Geologic and geochronologic constraints on the metallogenic evolution of the Andes of southeastern Peru. Econ. Geol. 1990, 85, 1520–1583. [Google Scholar] [CrossRef]
  8. Fraser, B. Water wars come to the Andes. Sci. Am. 2009, 19, 1–3. [Google Scholar]
  9. Reich, M.; Palacios, C.; Vargas, G.; Luo, S.; Cameron, E.M.; Leybourne, M.I.; Parada, M.A.; Zúñiga, A.; You, C.F. Supergene enrichment of copper deposits since the onset of modern hyperaridity in the Atacama Desert, Chile. Miner. Depos. 2009, 44, 497–504. [Google Scholar] [CrossRef]
  10. Lepage, H.V.; Barnes, E.; Kor, E.; Hunter, M.; Barnes, C.H. Greening and Browning Trends on the Pacific Slope of Peru and Northern Chile. Remote Sens. 2023, 15, 3628. [Google Scholar] [CrossRef]
  11. Bebbington, A.; Williams, M. Water and mining conflicts in Peru. Mt. Res. Dev. 2008, 28, 190–195. [Google Scholar] [CrossRef]
  12. Saenz, C. Stakeholders, social and environmental impact management as key factors of the corporate social management in the mining industry: A Peruvian case study. Corp. Soc. Responsib. Environ. Manag. 2024, 31, 697–708. [Google Scholar] [CrossRef]
  13. Saenz, C. Enhancing community development management and the management of social and environmental impacts to get social license to operate in the mining industry: A Peruvian case study. Bus. Strategy Dev. 2023, 6, 873–884. [Google Scholar] [CrossRef]
  14. Wood Group USA Inc. Cuajone Operations Peru Technical Report Summary. 2023. Available online: https://minedocs.com/24/Cuajone-TR-12312022.pdf (accessed on 12 February 2024).
  15. Ali, M.M.; Ali, M.L.; Islam, M.S.; Rahman, M.Z. Preliminary assessment of heavy metals in water and sediment of Karnaphuli River, Bangladesh. Environ. Nanotechnol. Monit. Manag. 2016, 5, 27–35. [Google Scholar] [CrossRef]
  16. Varol, M.; Şen, B. Assessment of nutrient and heavy metal contamination in surface water and sediments of the upper Tigris River, Turkey. Catena 2012, 92, 1–10. [Google Scholar] [CrossRef]
  17. Budds, J.; Hinojosa, L. Restructuring and rescaling water governance in mining contexts: The co-production of waterscapes in Peru. Water Altern. 2012, 5, 119. [Google Scholar]
  18. Han, Y.S.; Youm, S.J.; Oh, C.; Cho, Y.C.; Ahn, J.S. Geochemical and eco-toxicological characteristics of stream water and its sediments affected by acid mine drainage. Catena 2017, 148, 52–59. [Google Scholar] [CrossRef]
  19. Tume, P.; González, E.; Reyes, F.; Fuentes, J.P.; Roca, N.; Bech, J.; Medina, G. Sources analysis and health risk assessment of trace elements in urban soils of Hualpen, Chile. Catena 2019, 175, 304–316. [Google Scholar] [CrossRef]
  20. Trudgill, S.T.; Goudie, A.S.; Viles, H.A. Weathering Processes and Forms; Geological Society: London, UK, 2022. [Google Scholar]
  21. Visitación-Bustamante, K.; Ramos-Fernandez, L.; Visitación-Figueroa, L. Characterization of the hydrochemistry in a high Andean sub-basin in the region of Moquegua, Peru. Tecnol. Y Cienc. Agua 2023, 14, 257–289. [Google Scholar] [CrossRef]
  22. Olías, M.; Nieto, J.M.; Pérez-López, R.; Cánovas, C.R.; Macías, F.; Sarmiento, A.M.; Galván, L. Controls on acid mine water composition from the Iberian Pyrite Belt (SW Spain). Catena 2016, 137, 12–23. [Google Scholar] [CrossRef]
  23. Akcil, A.; Koldas, S. Acid Mine Drainage (AMD): Causes, treatment and case studies. J. Clean. Prod. 2006, 14, 1139–1145. [Google Scholar] [CrossRef]
  24. Nordstrom, D.K.; Blowes, D.W.; Ptacek, C.J. Hydrogeochemistry and microbiology of mine drainage: An update. Appl. Geochem. 2015, 57, 3–16. [Google Scholar] [CrossRef]
  25. Rey, J.; Martínez, J.; Hidalgo, M.; Rojas, D. Heavy metal pollution in the Quaternary Garza basin: A multidisciplinary study of the environmental risks posed by mining (Linares, Southern Spain). Catena 2013, 110, 234–242. [Google Scholar] [CrossRef]
  26. Martin, C.W. Trace metal concentrations along tributary streams of historically mined areas, Lower Lahn and Dill River basins, central Germany. Catena 2019, 174, 174–183. [Google Scholar] [CrossRef]
  27. Punia, A. Role of temperature, wind, and precipitation in heavy metal contamination at copper mines: A review. Environ. Sci. Pollut. Res. 2021, 28, 4056–4072. [Google Scholar] [CrossRef]
  28. Sun, T.; Bao, H.; Reich, M.; Hemming, S.R. More than ten million years of hyper-aridity recorded in the Atacama Gravels. Geochim. Cosmochim. Acta 2018, 227, 123–132. [Google Scholar] [CrossRef]
  29. Colica, A.; Benvenuti, M.; Chiarantini, L.; Costagliola, P.; Lattanzi, P.; Rimondi, V.; Rinaldi, M. From point source to diffuse source of contaminants: The example of mercury dispersion in the Paglia River (Central Italy). Catena 2019, 172, 488–500. [Google Scholar] [CrossRef]
  30. Shaban, N.S.; Abdou, K.A.; Hassan, N.E.H.Y. Impact of toxic heavy metals and pesticide residues in herbal products. Beni-Suef Univ. J. Basic Appl. Sci. 2016, 5, 102–106. [Google Scholar] [CrossRef]
  31. Davies, B.R.; Thoms, M.; Meador, M. An assessment of the ecological impacts of inter-basin water transfers, and their threats to river basin integrity and conservation. Aquat. Conserv. Mar. Freshw. Ecosyst. 1992, 2, 325–349. [Google Scholar] [CrossRef]
  32. Li, F. Documenting accountability: Environmental impact assessment in a Peruvian mining project. PoLAR Political Leg. Anthropol. Rev. 2009, 32, 218–236. [Google Scholar] [CrossRef]
  33. Bebbington, A.J.; Bury, J.T. Institutional challenges for mining and sustainability in Peru. Proc. Natl. Acad. Sci. USA 2009, 106, 17296–17301. [Google Scholar] [CrossRef]
  34. Samimi Namin, F.; Shahriar, K.; Bascetin, A. Environmental impact assessment of mining activities. A new approach for mining methods selection. Gospod. Surowcami Miner. 2011, 27, 113–143. [Google Scholar]
  35. Gwimbi, P.; Nhamo, G. Benchmarking the effectiveness of mitigation measures to the quality of environmental impact statements: Lessons and insights from mines along the Great Dyke of Zimbabwe. Environ. Dev. Sustain. 2016, 18, 527–546. [Google Scholar] [CrossRef]
  36. Brodny, J.; Tutak, M. The use of artificial neural networks to analyze greenhouse gas and air pollutant emissions from the mining and quarrying sector in the European Union. Energies 2020, 13, 1925. [Google Scholar] [CrossRef]
  37. Magilligan, F.J.; Goldstein, P.S.; Fisher, G.B.; Bostick, B.C.; Manners, R.B. Late Quaternary hydroclimatology of a hyper-arid Andean watershed: Climate change, floods, and hydrologic responses to the El Niño-Southern Oscillation in the Atacama Desert. Geomorphology 2008, 101, 14–32. [Google Scholar] [CrossRef]
  38. Santoso, A.; Mcphaden, M.J.; Cai, W. The defining characteristics of ENSO extremes and the strong 2015/2016 El Niño. Rev. Geophys. 2017, 55, 1079–1129. [Google Scholar] [CrossRef]
  39. Decou, A.; Von Eynatten, H.; Mamani, M.; Sempere, T.; Wörner, G. Cenozoic forearc basin sediments in Southern Peru (15–18 S): Stratigraphic and heavy mineral constraints for Eocene to Miocene evolution of the Central Andes. Sediment. Geol. 2011, 237, 55–72. [Google Scholar] [CrossRef]
  40. Oerter, E.; Amundson, R.; Heimsath, A.; Jungers, M.; Chong, G.; Renne, P. Early to middle Miocene climate in the Atacama Desert of northern Chile. Palaeogeogr. Palaeoclimatol. Palaeoecol. 2016, 441, 890–900. [Google Scholar] [CrossRef]
  41. Poveda, G.; Espinoza, J.C.; Zuluaga, M.D.; Solman, S.A.; Garreaud, R.; Van Oevelen, P.J. High impact weather events in the Andes. Front. Earth Sci. 2020, 8, 162. [Google Scholar] [CrossRef]
  42. Clark, A.H.; Tosdal, R.M.; Farrar, E.; Plazolles V, A. Geomorphologic environment and age of supergene enrichment of the Cuajone, Quellaveco, and Toquepala porphyry copper deposits, southeastern Peru. Econ. Geol. 1990, 85, 1604–1628. [Google Scholar] [CrossRef]
  43. Masuno, R.K.; Barahona, H.P.A.; Bazán, E.F.; Zenteno, E.G.; Lizárraga, A.M.; Paucara, J.T. Evaluacion de Peligros de la Ciudad de Moquegua; INDECI: Arequipa, Peru, 2001. [Google Scholar]
  44. Clesceri, L.S. Standard Methods for Examination of Water and Wastewater; American Public Health Association: Washington, DC, USA, 1998; Volume 9. [Google Scholar]
  45. Otto, M. Multivariate methods. In Analytical Chemistry; Kellner, R., Mermet, J.M., Otto, M., Widmer, H.M., Eds.; Wiley-VCH: Weinheim, Germany, 1998. [Google Scholar]
  46. Ward, J.H., Jr. Hierarchical grouping to optimize an objective function. J. Am. Stat. Assoc. 1963, 58, 236–244. [Google Scholar] [CrossRef]
  47. Kazi, T.; Arain, M.; Jamali, M.K.; Jalbani, N.; Afridi, H.; Sarfraz, R.; Baig, J.; Shah, A.Q. Assessment of water quality of polluted lake using multivariate statistical techniques: A case study. Ecotoxicol. Environ. Saf. 2009, 72, 301–309. [Google Scholar] [CrossRef]
  48. Sokal, R.R.; Rohlf, F.J. The comparison of dendrograms by objective methods. Taxon 1962, 11, 33–40. [Google Scholar] [CrossRef]
  49. Bhuiyan, M.A.; Islam, M.; Dampare, S.B.; Parvez, L.; Suzuki, S. Evaluation of hazardous metal pollution in irrigation and drinking water systems in the vicinity of a coal mine area of northwestern Bangladesh. J. Hazard. Mater. 2010, 179, 1065–1077. [Google Scholar] [CrossRef]
  50. Jolliffe, I.; Lovric, M. International encyclopedia of statistical science. In Principa l Component Analysis; Springer: Berlin/Heidelberg, Germany, 2011; pp. 1094–1096. [Google Scholar]
  51. Wurts, W.A.; Durborow, R.M. Interactions of pH, Carbon Dioxide, Alkalinity and Hardness in Fish Ponds; SRAC Publication: Stoneville, MS, USA, 1992. [Google Scholar]
  52. Talling, J. The depletion of carbon dioxide from lake water by phytoplankton. J. Ecol. 1976, 64, 79–121. [Google Scholar] [CrossRef]
  53. Möller, D. The Na/Cl ratio in rainwater and the seasalt chloride cycle. Tellus B 1990, 42, 254–262. [Google Scholar] [CrossRef]
  54. Magaritz, M.; Nadler, A.; Koyumdjisky, H.; Dan, J. The use of Na/Cl ratios to trace solute sources in a semiarid zone. Water Resour. Res. 1981, 17, 602–608. [Google Scholar] [CrossRef]
  55. Gorchev, H.G.; Ozolins, G. WHO Guidelines for Drinking-Water Quality; WHO Chronicle: Washington, DC, USA, 1984; Volume 38. [Google Scholar]
  56. Johnson, D.B.; Hallberg, K.B. Acid mine drainage remediation options: A review. Sci. Total Environ. 2005, 338, 3–14. [Google Scholar] [CrossRef]
  57. Kalin, M.; Fyson, A.; Wheeler, W.N. The chemistry of conventional and alternative treatment systems for the neutralization of acid mine drainage. Sci. Total Environ. 2006, 366, 395–408. [Google Scholar] [CrossRef]
  58. Sheoran, A.; Sheoran, V. Heavy metal removal mechanism of acid mine drainage in wetlands: A critical review. Miner. Eng. 2006, 19, 105–116. [Google Scholar] [CrossRef]
  59. Rösner, U. Effects of historical mining activities on surface water and groundwater-an example from northwest Arizona. Environ. Geol. 1998, 33, 224–230. [Google Scholar] [CrossRef]
  60. Hudson-Edwards, K.A.; Schell, C.; Macklin, M.G. Mineralogy and geochemistry of alluvium contaminated by metal mining in the Rio Tinto area, southwest Spain. Appl. Geochem. 1999, 14, 1015–1030. [Google Scholar] [CrossRef]
  61. Miller, J.; Hudson-Edwards, K.; Lechler, P.; Preston, D.; Macklin, M. Heavy metal contamination of water, soil and produce within riverine communities of the Rıo Pilcomayo basin, Bolivia. Sci. Total Environ. 2004, 320, 189–209. [Google Scholar] [CrossRef]
  62. Pan, Y.; Koopmans, G.F.; Bonten, L.T.; Song, J.; Luo, Y.; Temminghoff, E.J.; Comans, R.N. Influence of pH on the redox chemistry of metal (hydr) oxides and organic matter in paddy soils. J. Soils Sediments 2014, 14, 1713–1726. [Google Scholar] [CrossRef]
  63. Canfield, D.E. The geochemistry of river particulates from the continental USA: Major elements. Geochim. Cosmochim. Acta 1997, 61, 3349–3365. [Google Scholar] [CrossRef]
  64. Tipping, E.; Rey-Castro, C.; Bryan, S.E.; Hamilton-Taylor, J. Al (III) and Fe (III) binding by humic substances in freshwaters, and implications for trace metal speciation. Geochim. Cosmochim. Acta 2002, 66, 3211–3224. [Google Scholar] [CrossRef]
  65. Viers, J.; Dupré, B.; Gaillardet, J. Chemical composition of suspended sediments in World Rivers: New insights from a new database. Sci. Total Environ. 2009, 407, 853–868. [Google Scholar] [CrossRef]
  66. McPhaden, M.J.; Santoso, A.; Cai, W. Introduction to El Niño Southern Oscillation in a changing climate. In El Niño Southern Oscillation in a Changing Climate; American Geophysical Union: Washington, DC, USA, 2020; pp. 1–19. [Google Scholar]
  67. Ayers, R.S.; Westcot, D.W. Water Quality for Agriculture; Food and Agriculture Organization of the United Nations Rome: Rome, Italy, 1985; Volume 29. [Google Scholar]
  68. ANA. Modifican los Estándares Nacionales de Calidad Ambiental para Agua y establecen disposiciones complementarias para su aplicación. In Decreto Supremo, 015–2015–MINAM; Ministerio del Ambiente: Lima, Peru, 2015. [Google Scholar]
  69. Poshtegal, M.K.; Mirbagheri, S.A. The heavy metals pollution index and water quality monitoring of the Zarrineh river, Iran. Environ. Eng. Geosci. 2019, 25, 179–188. [Google Scholar] [CrossRef]
  70. Harrison, R.M.; De Mora, S.J. Introductory Chemistry for the Environmental Sciences; Cambridge University Press: Cambridge, UK, 1996; Volume 7. [Google Scholar]
  71. Xiao, J.; Jin, Z.D.; Zhang, F.; Wang, J. Solute geochemistry and its sources of the groundwaters in the Qinghai Lake catchment, NW China. J. Asian Earth Sci. 2012, 52, 21–30. [Google Scholar] [CrossRef]
  72. MINAGRI Peru. Boletín Estadístico de Medios de Producción Agropecuarios. Available online: https://www.midagri.gob.pe/portal/boletin-estadistico-de-medios-de-produccion-agropecuarios (accessed on 20 January 2024).
  73. Borrok, D.M.; Engle, M.A. The role of climate in increasing salt loads in dryland rivers. J. Arid Environ. 2014, 111, 7–13. [Google Scholar] [CrossRef]
  74. LaZerte, B.D.; Burling, K. Manganese speciation in dilute waters of the Precambrian Shield, Canada. Water Res. 1990, 24, 1097–1101. [Google Scholar] [CrossRef]
  75. Gibbs, R.J. Mechanisms controlling world water chemistry. Science 1970, 170, 1088–1090. [Google Scholar] [CrossRef]
  76. Kumar, S.K.; Rammohan, V.; Sahayam, J.D.; Jeevanandam, M. Assessment of groundwater quality and hydrogeochemistry of Manimuktha River basin, Tamil Nadu, India. Environ. Monit. Assess. 2009, 159, 341–351. [Google Scholar] [CrossRef]
  77. US EPA. National Primary Drinking Water Regulations; Technical Fact; 2019. Available online: https://www.epa.gov/ground-water-and-drinking-water/national-primary-drinking-water-regulations (accessed on 20 January 2024).
  78. Vera Delgado, J. The socio-cultural, institutional and gender aspects of the water transfer-agribusiness model for food and water security. Lessons learned from Peru. Food Secur. 2015, 7, 1187–1197. [Google Scholar] [CrossRef]
  79. Tessier, A.; Fortin, D.; Belzile, N.; DeVitre, R.; Leppard, G. Metal sorption to diagenetic iron and manganese oxyhydroxides and associated organic matter: Narrowing the gap between field and laboratory measurements. Geochim. Cosmochim. Acta 1996, 60, 387–404. [Google Scholar] [CrossRef]
  80. Pagenkopf, G.K. Gill surface interaction model for trace-metal toxicity to fishes: Role of complexation, pH, and water hardness. Environ. Sci. Technol. 1983, 17, 342–347. [Google Scholar] [CrossRef]
  81. Pascoe, D.; Evans, S.A.; Woodworth, J. Heavy metal toxicity to fish and the influence of water hardness. Arch. Environ. Contam. Toxicol. 1986, 15, 481–487. [Google Scholar] [CrossRef]
  82. Zitko, V.; Carson, W. Mechanism of the effects of water hardness on the lethality of heavy metals to fish. Chemosphere 1976, 5, 299–303. [Google Scholar] [CrossRef]
  83. Bundschuh, J.; Litter, M.I.; Parvez, F.; Román-Ross, G.; Nicolli, H.B.; Jean, J.S.; Liu, C.W.; López, D.; Armienta, M.A.; Guilherme, L.R.; et al. One century of arsenic exposure in Latin America: A review of history and occurrence from 14 countries. Sci. Total Environ. 2012, 429, 2–35. [Google Scholar] [CrossRef]
  84. Schwartz, M.O. Arsenic in porphyry copper deposits: Economic geology of a polluting element. Int. Geol. Rev. 1995, 37, 9–25. [Google Scholar] [CrossRef]
  85. Leybourne, M.I.; Cameron, E.M. Source, transport, and fate of rhenium, selenium, molybdenum, arsenic, and copper in groundwater associated with porphyry–Cu deposits, Atacama Desert, Chile. Chem. Geol. 2008, 247, 208–228. [Google Scholar] [CrossRef]
  86. Byrne, P.; Reid, I.; Wood, P.J. Sediment geochemistry of streams draining abandoned lead/zinc mines in central Wales: The Afon Twymyn. J. Soils Sediments 2010, 10, 683–697. [Google Scholar] [CrossRef]
  87. Byrne, P.; Taylor, K.G.; Hudson-Edwards, K.A.; Barrett, J.E. Speciation and potential long-term behaviour of chromium in urban sediment particulates. J. Soils Sediments 2017, 17, 2666–2676. [Google Scholar] [CrossRef]
  88. de agua Moquegua, A.L. Informe del Tercer 1. Monitoreo Participativo de Calidad de Agua Superficial de la Cuenca Moquegua-Ilo. 2013. Available online: https://hdl.handle.net/20.500.12543/2771 (accessed on 20 January 2024).
  89. de agua Moquegua, A.L. Informe del Cuarto Monitoreo Participativo de Calidad de Agua Superficial de la Cuenca MOQUEGUA-Ilo. 2014. Available online: https://hdl.handle.net/20.500.12543/2830 (accessed on 20 January 2024).
  90. de agua Moquegua, A.L. Quinto Monitoreo Participativo de Calidad de Agua Superficial de la Cuenca Moquegua-Ilo. 2014. Available online: https://hdl.handle.net/20.500.12543/2834 (accessed on 20 January 2024).
  91. Pincetti-Zúniga, G.; Richards, L.; Daniele, L.; Boyce, A.; Polya, D. Hydrochemical characterization, spatial distribution, and geochemical controls on arsenic and boron in waters from arid Arica and Parinacota, northern Chile. Sci. Total Environ. 2022, 806, 150206. [Google Scholar] [CrossRef]
  92. Yin, S.; Yang, L.; Wen, Q.; Wei, B. Temporal variation and mechanism of the geogenic arsenic concentrations in global groundwater. Appl. Geochem. 2022, 146, 105475. [Google Scholar] [CrossRef]
  93. Forbes, W.F.; Hill, G.B. Is exposure to aluminum a risk factor for the development of Alzheimer disease?—Yes. Arch. Neurol. 1998, 55, 740–741. [Google Scholar] [CrossRef]
  94. Flaten, T.P. Aluminium as a risk factor in Alzheimer’s disease, with emphasis on drinking water. Brain Res. Bull. 2001, 55, 187–196. [Google Scholar] [CrossRef]
  95. Smith, A.H.; Hopenhayn-Rich, C.; Bates, M.N.; Goeden, H.M.; Hertz-Picciotto, I.; Duggan, H.M.; Wood, R.; Kosnett, M.J.; Smith, M.T. Cancer risks from arsenic in drinking water. Environ. Health Perspect. 1992, 97, 259–267. [Google Scholar] [CrossRef]
  96. Davis, M.A.; Signes-Pastor, A.J.; Argos, M.; Slaughter, F.; Pendergrast, C.; Punshon, T.; Gossai, A.; Ahsan, H.; Karagas, M.R. Assessment of human dietary exposure to arsenic through rice. Sci. Total Environ. 2017, 586, 1237–1244. [Google Scholar] [CrossRef]
  97. Insel, N.; Poulsen, C.J.; Ehlers, T.A. Influence of the Andes Mountains on South American moisture transport, convection, and precipitation. Clim. Dyn. 2010, 35, 1477–1492. [Google Scholar] [CrossRef]
  98. Taylor, M.P.; Kesterton, R.G. Heavy metal contamination of an arid river environment: Gruben River, Namibia. Geomorphology 2002, 42, 311–327. [Google Scholar] [CrossRef]
  99. Arakaki, M.; Cano, A. Floral composition of the Ilo-Moquegua and Lomas de Ilo river basin, Moquegua, Peru. Peruv. J. Biol. 2003, 10, 5–19. [Google Scholar] [CrossRef]
Figure 2. Spatial and temporal variation in cations ( Na + , Ca 2 + , Mg 2 + , K + ), anions ( SO 4 2 , Cl , F , NO 3 ) and total trace metals (Cd, Cu, Co, Cr, Li, Pb, Mo, Ni, Se, U, V, and Zn) in water samples from Moquegua river sites plotted against distance upstream from site 1 in km. (a) January 2017 (17-R), (b) July 2017 (17-D) and (c) January 2018 (18-R). Site numbers are given in the labels.
Water 16 00769 g002
Figure 3. (a) Na/Cl equivalent molar ratio and (b) SO4/Cl equivalent molar ratio for Moquegua river system.
Water 16 00769 g003
Figure 4. Al, Fe, and Mn concentrations and pH, showing elevated wet season metal concentrations in the Torata river below the Cuajone mine. Distance is measured upstream from site 1. Red shaded regions show the concentration levels above the safe limits for aquatic life. The Cuajone mine is located between site 5B and site 16 (vertical shaded region). Error bars represent standard deviation of measurement fluctuation. Labels represent site numbers.
Water 16 00769 g004
Figure 5. (a) Gibbs plot for the Moquegua river showing changes in water chemistry along the river and (b) compared with other major rivers, Hauang He river, China and Amazon river, rio Grande, AB, USA, and Amazon river, South America. Data from [70,71].
Water 16 00769 g005
Figure 6. Arsenic concentrations in samples from Torata and Moquegua river site. Error bars show the standard deviations of measurement. Red-shaded regions show the concentration levels above the safe limits for potable use. The Cuajone mine is located between site 5B and site 16 (vertical shaded region).
Water 16 00769 g006
Figure 7. (a) Dendrogram showing the Euclidean dissimilarity between the 33 measured water parameters taking 17 Torata–Moquegua sample sites and seasons 17-R, 17-D, and 18-R into account. (b) Dendrogram showing the largest dissimilarity between the 17 Torata–Moquegua sample sites in different seasons (identified by the code [SITE]/[YEAR]–[SEASON]), taking 33 measured water parameters into account. (c) Beck map showing the spatial distribution of site clusters. The color map is the same as in (b). The color of the outer ring of each circle identifies the season using the key on the right.
Water 16 00769 g007
Figure 8. PCA biplots using 33 water parameters measured at 17 Torata–Moquegua sample sites in the three seasons 17-R, 17-D and 18-R. The colors of the parameter vectors are taken from Figure 7a. The colors for site points are taken from Figure 7b,c. (a) PC1 vs. PC2, (b) PC1 vs. PC3. Dashed lines at ±0.2 indicate the qualitative boundary used to indicate where components become significant at a site.
Water 16 00769 g008
Figure 9. Combined data sources from field work, ANA data and INGEMMET groundwater reports [5,88,89,90]. Concentration of major ions (a) calcium, (b) sodium, and (c) sulphate in the Torata river system.
Water 16 00769 g009
Figure 10. Combined data sources from field work, ANA data and INGEMMET groundwater report [5,88,89,90]. Concentration of trace elements in the Torata river system. The red dashed line in panel (a) indicates the safe limit for arsenic. The safety limits for cadmium and copper concentrations do not appear in panels (b,c), as they are above every data point. The green dotted lines in panel (a) delimit the area of intensive agricultural land ranging from above Torata to below Moquegua. The red circle in panel (a) identifies data taken at Site O. The blue box in panel (c) outlines data that were taken after a flash flood event.
Water 16 00769 g010
Table 1. Selected study sites including, approximate GPS coordinates, elevation above sea level, and distance from site 1.
SiteSite NameGPS CoordinatesAltitude
(m asl)
Distance from Site 1 (km)
Sites on Moquegua river (Osmore)
0ALower Moquegua valley—El Algarrobal17 37.705 S71 17.579 W6845.8
1Middle Moquegua valley—El Conde17 20.089 S70 59.889 W9550
Sites on Torata river
1CAbove Sajena–Torata river confluence17 10.720 S70 57.037 W133019.5
2Puente Estuquina—beginning of agriculture area17 09.015 S70 55.01 W149524.5
3Puente Coplay—end of agriculture area17 05.807 S70 52.726 W194132.6
4Puente Canilay—downstream of Torata settlement17 05.183 S70 51.4303 W217536.1
5Fire station—beginning of agriculture area and upstream of Torata settlement17 04.353 S70 50.248 W222537.7
5BMiddle Torata valley—the highest downstream of Cuajone mine17 03.546 S70 47.704 W270045
16Upper Torata valley—Lowest upstream of Cuajone mine16 59.019 S70 36.392 W393966.2
17Upper Torata valley—Middle16 58.360 S70 35.004 W410069.3
18Upper Torata valley—Highest16 57.454 S70 33.672 W422572.2
19Bofedale.at Torata river16 57.120 S70 29.698 W438081.5
20Torata river source16 57.324 S70 29.677 W440082
Sites on Moquegua river (Asana river)
1BBelow Moquegua city.17 11.205 S70 57.193 W131818.7
1EAbove Moquegua and Samegua.17 09.737 S70 52.343 W166228.6
Sites on Sajena/Otora river (Huaracane river)
1DBefore Sajena–Torata confluence17 10.690 S70 57.052 W144019.5
Table 2. Water parameters and their minimum and maximum values measured during the study: CN—cyanide; TP—total phosphorus; TN—total nitrogen; Cond—electrical conductivity; TDS—total dissolved solids; Temp—temperature; DO—dissolved oxygen; COD—chemical oxygen demand; Hard.—water hardness. Other symbols take their usual meanings.
ParameterMin–MaxParameterMin–MaxParameterMin–Max
SO 4 (mg/L)11–490 HCO 3 (mg/L)13.4–350K (mg/L)2.1–11
NO 2 (mg/L)0–0.486Hard. (mg/L CaCO 3 )17.3–764.3Li (μg/L)0–170
NO 3 (mg/L)0–19.65Al (mg/L)0–2.0Mg (mg/L)1.8–36
PO 4 (mg/L)0–0.57As (μg/L)2.1–21.0Mn (mg/L)0–0.65
CO 3 (mg/L)0–0Be (μg/L)0–0.4Mo (μg/L)0.56–8.3
CN Total (mg/L)0–0Bi (mg/L)0–0Na (mg/L)4.9–240
TP (mg/L as P)0–0.41Br (mg/L)0–0.82Ni (μg/L)0–26
TN (mg/L)0–8.1Ca (mg/L)4.5–251.8Pb (μg/L)0–3.9
pH7.63–9.45Cd (μg/L)0–0.93Se (μg/L)0–4.8
Cond. (mS/cm)95.4–2711.4Cl (mg/L)0–360.3Si (mg/L)2.5–25
TDS (mg/L)0–1833Cr (μg/L)0–3.4Te (mg/L)0–0
Temp. (°C)3.8–29.2Co (μg/L)0–4Th (μg/L)0–0.029
DO (mg/L)0–12.4Cu (μg/L)0–53.0U (μg/L)0–13
COD0–27.85F (mg/L)0–0.49V (μg/L)1.9–11
Fe (mg/L)0–1.5Zn (μg/L)0–55.0
Hg (mg/L)0–0
Disclaimer/Publisher’s Note: The statements, opinions and data contained in all publications are solely those of the individual author(s) and contributor(s) and not of MDPI and/or the editor(s). MDPI and/or the editor(s) disclaim responsibility for any injury to people or property resulting from any ideas, methods, instructions or products referred to in the content.

