
Groundwater Hydrochemistry and Recharge Process Impacted by Human Activities in an Oasis–Desert in Central Asia
by
 and
and
Yuan Yao
1, 
Chenwei Tu
1,
Gaojia Hu
1,
Yuhan Zhang
1,
Hanyuan Cao
1,
Wanrui Wang
1,2,* and
Weihua Wang
3,* 1
College of Geography and Remote Sensing Sciences, Xinjiang University, Urumqi 830017, China
2
Xinjiang Key Laboratory of Oasis Ecology, Xinjiang University, Urumqi 830017, China
3
State Key Laboratory of Desert and Oasis Ecology, Xinjiang Institute of Ecology and Geography, Chinese Academy of Sciences, Urumqi 830011, China
*
Authors to whom correspondence should be addressed.
Water 2024, 16(5), 763; https://doi.org/10.3390/w16050763
Submission received: 25 January 2024
/
Revised: 22 February 2024
/
Accepted: 29 February 2024
/
Published: 3 March 2024
(This article belongs to the Special Issue The Interrelationship between Climate Change, Human Activities and Hydrological Processes, Volume II)
Abstract
:Intense anthropogenic activities in arid regions remarkably affect groundwater by causing phreatic decline and water environmental deterioration. A systematic understanding of groundwater hydrochemical evolution and recharge is critical to regional water, ecological and agricultural security in arid regions, but is not well known in arid oasis–deserts. This research identified groundwater recharge processes and assessed the impact of anthropogenic activities on groundwater hydrochemical evolution in a representative oasis–desert in Central Asia using stable isotopic indicators (δ2H and δ18O) and hydrochemical data. Results indicated that the normalized difference vegetation index (NDVI) and cultivated land area exhibited a significant increasing trend during 2000 to 2020. Stable water isotopes and the ionic composition of both groundwater and surface water exhibited obviously spatial heterogeneity and seasonal variation. Generally, the spatial distribution pattern of major dissolved ions for shallow groundwater was consistent and increased along the groundwater flow direction from midstream to downstream. Surface water and groundwater were both characterized by higher δ18O and total dissolved solids (TDS) in the non-flood season than those in the flood season. Shallow groundwater had a larger seasonal variation in δ18O and TDS than other water components. Groundwater level in monitored wells generally presented a decreasing trend from 2018 to 2021, accompanied by a decrease in phreatic water TDS and NDVI in the desert area. Gypsum dissolution and weathering of silicate and halite had an important role in forming groundwater hydrochemistry. Anthropogenic activities significantly affected groundwater hydrochemistry and recharge. Shallow groundwater received its primary recharge from surface water and lateral groundwater flow, constituting 73% and 27% of the total recharge, respectively. Agricultural activities and groundwater overexploitation were the main factors for variations in groundwater level and quality in the oasis area, and directly affected groundwater and natural vegetation in the desert area. The results would be helpful to deeply understand groundwater hydrochemical evolution and cycling, and beneficial for groundwater efficient utilization and desert ecosystem restoration in the arid areas.
1. Introduction
Groundwater is a crucial freshwater resource, and exerts a pivotal influence on the ecosystem and economic-socio development in arid areas owing to low rainfall, deficient surface water, and high evaporation, particularly in arid oasis–desert areas [1,2,3]. Since the 1990s, as a result of the swift progression of agriculture and society in arid regions, the scarcity of surface water in the typical arid inland of the Tarim River Basin could hardly meet normal living and production needs; thus, groundwater has emerged as a significant water source for regional supply [3,4]. Groundwater level and quality were influenced by numerous natural and human factors, especially the intensification of anthropogenic activities [5,6,7]. Over 20 percent of irrigation areas are encountering groundwater environment degradation globally [8]. The augmented replenishment of groundwater recharge from irrigation water infiltration failed to fully offset the excessive extraction of groundwater in some irrigation areas [9]. This has led to groundwater level continuously decreasing and water quality deterioration [10]. Sustainable groundwater utilization is the basis of agricultural production and economic development in arid areas [11]. The hydrochemical properties of groundwater serve as the principal manifestation of the groundwater environment [10]. Therefore, assessing the groundwater hydrochemical characteristics and recharge process impacted by anthropogenic activities in arid areas is critical to efficient groundwater management and groundwater-dependent ecosystem security [9].
Understanding the groundwater hydrochemical evolution process is of utmost importance in gaining a comprehensive knowledge of groundwater recharge and discharge [12]. Previous research in arid regions investigated the groundwater hydrochemical characteristics and evolution, quality and health risks, storage, recharge and discharge, hydraulic connection, and their influencing factors (e.g., climate variability, groundwater exploitation, land use change, agricultural activities) [13,14,15,16,17,18]. The groundwater hydrochemical evolution process in arid regions is complex, controlled by natural conditions (e.g., hydrodynamic condition, evaporation, water–rock interactions, flushing and mixing, dissolution and precipitation, and cation exchange) and anthropogenic activities (e.g., irrigation water quality and fertilization) [11,19,20,21]. Yang et al. [22] found that irrigation could alter the water, nitrogen, and carbon budgets in the cropland area of the arid endorheic river basin. Zhang et al. [3] reported that the large-scale replacement of land cover types would affect the processes of rainfall distribution, evapotranspiration, field water composition and infiltration, thus influencing soil water infiltration and the replenishment of groundwater. Ullah et al. [13] observed a close association between land cover types and groundwater nitrate contamination. Along the groundwater flow direction, groundwater hydrochemical characteristics, salinity and quality evolve regularly, exhibiting an ordered spatio-temporal distribution [23]. However, the impacts of human activities (e.g., long-term agricultural irrigation) on groundwater hydrochemical evolution and recharge are poorly comprehended in arid areas, especially in the oasis–desert of the Tarim River Basin.
At present, the methods for assessing groundwater recharge mainly included the direct measurement method, numerical modeling method, water balance method, and isotope tracer techniques based on in situ measurement data, GRACE data and remote sensing data [3,24,25]. Various researchers applied the stable isotope technique to study the spatial-temporal variations, environmental effects and impact factors of hydrogen–oxygen stable isotope values in different water bodies [25,26,27]. The stable isotope technique could also provide an important method for recognizing the replenishment origins of water bodies and reflecting water circulation mechanisms [28,29]. The concentration of stable natural tracers is not influenced by hydrogeochemical reactions and behaves conservatively [30]. Hence, the stable isotope technique is particularly useful to investigate groundwater sources and cycling processes in arid areas with scarce hydrological monitoring data [25].
Situated in the arid area of Central Asia, the Tarim River Basin is China’s most extensive inland river basin, and is also an important area for the development of the “Silk Road Economic Belt” [31]. The Tarim River Basin underwent profound changes in groundwater hydrological process under the changing environment, which challenge regional water resource and ecological security [32]. In light of the “grain-increasing and water-saving” initiative, and alongside the rising demand for irrigation water and advancements in irrigation technology, the influence of agricultural practices on groundwater in the Tarim River Basin has intensified in recent decades [11,32]. This has had a fundamental influence on regional groundwater management [33]. The plain of Dina River serves as a prototypical oasis–desert within the Tarim River Basin, where irrigated agriculture development has reshaped the groundwater hydrological processes and exacerbated regional eco-environmental problems in recent years [11]. However, this region still lacks quantitative research of groundwater recharge and the systematic analysis of the influencing factors of groundwater hydrochemical evolution.
Here, we examined the groundwater hydrochemistry and recharge process under the influence of anthropogenic activities in the Dina River Basin’s oasis–desert area using hydrochemical and stable isotopic data of 105 water samples. The primary objectives of this study were: (i) to examine the variations in climate, vegetation, and land cover in the basin, (ii) to analyze the variability features of groundwater hydrochemistry and level, (iii) to identify the recharge sources and recharge process of groundwater, and (iv) to assess the influence of anthropogenic activities on groundwater hydrochemical evolution. The findings contribute to a comprehensive understanding of groundwater hydrochemical process in arid areas, and are helpful for establishing sustainable use of groundwater resources and groundwater environment protection in the context of rapid irrigation agriculture development.
2. Materials and Methods
2.1. Study Area
The plain of the Dina River is situated in the midstream and downstream of the Dina River Basin, covering a total expanse of 7.76 × 10³ km2. The Dina River Basin, situated in the southern Tianshan Mountains and northern Tarim Basin, comprises four tributaries namely the Dina River, Yeyungou River, Cedaya River, and Yangxia River (Figure 1). The region experiences a temperate arid continental climate characterized by an annual average precipitation of 65.4 mm, an average air temperature of 11.2 °C, and evaporation ranging between 1766 and 2450 mm [11]. Precipitation displays an obviously seasonal dynamic, and more than 70% of it occurs from May to September. The annual streamflow into the plain is 5.24 × 10⁸ m3, with the flood season occurring between May and September [11]. Rainfall and meltwater are the dominant sources of streamflow. More than 90% of the streamflow was used for agricultural irrigation over the last 30 years, which has caused the dried-up river in the plain, with only minimal flood discharging during the flood season.
Our study area was a piedmont plain, and the lithology of geological strata was primarily overlaid with quaternary unconsolidated sediments. The sediments comprised pebbly sandstone, pebbly gravel, silty fine sandstone and interstratified fine sandstone in the vertical profiles, and sandstone was the dominant rock type [34]. Soil particle size primarily comprised fine sand and medium–fine sand, and the aquifer structure was loose, with strong hydraulic conductivity [35]. The primary soils were aeolian sand soil, irrigation silt soil, rock soil, swamp soil, and brown desert soil. Overall, the landscape characteristics were the gobi in the mountain pass, the oasis in the middle reaches, and the desert in the lower reaches. Correspondingly, from the mountain pass to the lower reaches, the soil particles became finer, and the groundwater level depth became smaller, which affected the formation of landscape pattern. Soil salinization was serious in the plain, which directly affected local ecological and agricultural security. Furthermore, the main land cover types in the Dina River Basin’s oasis–desert area were cultivated land, grassland, and bare land in 2020, accounting for 17.18%, 18.84%, and 62.85%, respectively. The plain was primarily cultivated with cotton and wheat, while the artificial economic forests were predominantly composed of pear, apricot, red date, and walnut trees. The dominated natural plants include Phragmites communis, Tamarix spp., and Halostachys capsica [11].
2.2. Data Collection
Water samples were gathered from April 2019 to September 2020 within the plain of the Dina River Basin in the non-flood season (April and November) and flood season (August and September) (Figure 1c). Water samples from the surface were gathered from the river, reservoir, and channel, which were collected with a sample bottle at a 5 cm depth below water surface. Groundwater samples were collected from boreholes and pumped wells, including irrigation wells, industrial wells, and domestic wells, throughout the sampling period. The collection and preservation of groundwater samples were strictly proceeded in accordance with the “Chinese technical specifications for the environmental monitoring of groundwater (HJ164-2020)”. Based on hydrogeological characteristics, the groundwater samples were categorized into three groups: shallow groundwater (with well depths less than 20 m), middle groundwater (with well depths ranging between 20 m and 100 m), and deep groundwater (with well depths exceeding 100 m) [36]. A cumulative number of 105 water samples were procured, comprising 43 surface water samples, 5 deep groundwater samples, 32 middle groundwater samples, and 25 shallow groundwater samples. The water samples were sifted using a 0.22 μm filter and then securely enclosed in 100 mL polyethylene bottles with parafilm. These samples were subsequently stored in a refrigerator until they were ready for measurement.
Stable water isotopes (δ2H and δ18O) and hydrochemical components of water samples were assayed at the State Key Laboratory of Desert and Oasis Ecology, Xinjiang Institute of Ecology and Geography (XIEG), Chinese Academy of Sciences (CAS). The concentrations of Cl−, SO42−, Na+, K+, Ca2+ and Mg2+ in the samples were measured using an ion chromatograph (Dionex-320, Thermo Fisher Scientific, Massachusetts, USA), and CO32− and HCO3− were determined using the titration method. TDS (total dissolved solids) and EC (electrical conductivity) values of samples were assayed in situ using a multi-parameter meter (YSI ProPlus, YSI Incorporated, Yellow Springs, OH, USA). All hydrochemistry results of water samples were within the acceptable range of ion charge balance error (ICBE). δ18O and δ2H of samples were analyzed using a liquid water isotope analyzer (LGR DLT-100, Los Gatos Research Inc., California, USA), and reported relative to the Vienna Standard Mean Ocean Water (VSMOW) in per mil (δ, ‰).
Daily groundwater level data of 6 monitoring wells (D1–D6) in the downstream of Dina River from August 2018 to December 2021 were collected from the XIEG, CAS (Figure 1c). The groundwater level was monitored automatically and recorded using a Telemetering Stage Recorder (XH17-S1, Xinhe Puhua Technology Co. Ltd., Beijing, China) every 4 h. Moreover, water samples were gathered from the 6 monitoring wells in different seasons for stable isotopic and hydrochemical analyses. Furthermore, from the National Earth System Science Data Center, National Science & Technology Infrastructure of China (http://www.geodata.cn, accessed on 1 September 2023), we acquired the yearly gridded dataset of air temperature and precipitation within the study area, spanning from 2000 to 2020, at a spatial resolution of 1 km [37]. Normalized difference vegetation index (NDVI) data in the Dina River Basin from 2000 to 2021 were obtained from the MOD13Q1 product by NASA (National Aeronautics and Space Administration), with a temporal resolution of 16 days and a spatial resolution of 250 m. The yearly LULC (land use and land cover) data in the Dina River Basin from 2000 to 2020 were sourced from the ESA CCI LC products (spanning 2000 to 2015) and the C3S Global Land Cover products (covering 2016 to 2020), both with a spatial resolution of 300 m. Annual LULC data in 2021 were derived from the European Space Agency (ESA) WorldCover 2021 products, with a spatial resolution of 10 m [38].
2.3. End-Member Mixing Analysis Method
In this study, the end-member mixing analysis method (EMMA) based on stable water isotopes is applied to analyze the contributing proportions from lateral groundwater flow and surface water to shallow groundwater in the plain of the Dina River Basin, which has been extensively utilized to assess the possible origins of surface water or groundwater [29,39]. The formulas are given as Equations (1)–(4):
where , and are the concentration of stable water isotope for groundwater, surface water and lateral groundwater flow, respectively; , and are the amount of groundwater, surface water and lateral groundwater flow, respectively; is the contributing proportion of surface water; is the contributing proportion of lateral groundwater flow.
2.4. Statistical Analysis
In our research, the statistical analysis of data was conducted using MATLAB (ver. R2018a), Origin (ver. 2021), ArcGIS (ver. 10.5), SPSS (ver. 22.0), and Microsoft Excel (ver. 2016), with a statistical significance level of 5%. Pearson’s correlation analysis was applied to evaluate the relationship between the hydrochemical components of water samples. The hydrogeochemical data were interpolated into 250 m grid data using the IDW method (inverse distance weighting). The IDW method is intuitive and especially valuable for dealing with scattered data, which could ensure reliable interpolation [13].
The Sen’s slope method was applied to assess the trend and magnitude of precipitation, air temperature and NDVI in the Dina River Basin, which has been widely applied to hydrometeorological data variation [11,40]. It can be calculated by Equation (5):
where is the Sen’s slope; and are the sequential values corresponding to times and , respectively, , n is the length of the series. shows that the series display a decreasing trend, while shows that the series display an increasing trend.
3. Results
3.1. Variations of Climate, Vegetation and Land Cover
Figure 2 shows the annual averages of air temperature, NDVI, precipitation, and cultivated land area in the Dina River Basin from 2000 to 2020. The annual average air temperature and precipitation exhibited some large fluctuations, but with no obvious variation trend during this period (Figure 2a,b). In addition, the NDVI and cultivated land area both displayed a notable upward trend from 2000 to 2020, which increased by 0.07 (0.15 for 2000 and 0.22 for 2020) and 244.5 km2 (863.5 km2 for 2000 and 1108.0 km2 for 2020), respectively (Figure 2c,d). This indicated that the increase in vegetation area in our study area was primarily attributed to the increase in cultivated land area by the oasis expanding, while it had a weak relation with regional air temperature and precipitation. In the plain area of the Dina River Basin, the majority of the increase in cultivated land area was converted from bare land and grassland over the past 20 years [11].
Figure 3 exhibits the fluctuation trends of air temperature, precipitation, and NDVI within the Dina River Basin during 2000 to 2020. The variation amplitudes and trends of air temperature, precipitation, and NDVI showed obvious spatial heterogeneity. As shown in Figure 3a, air temperature in the basin displayed a slight decreasing trend over the period (a rate of −0.013 °C/10a), and the variation in the mountain was obviously larger than that in the plain. Moreover, the annual precipitation in the entire basin displayed a slight upward trend during 2000 to 2020, with a rate of 15.76 mm/10a (Figure 3b). Obviously, compared with the plain area, precipitation in the mountainous area showed a larger increasing rate. Additionally, the annual average NDVI in the basin exhibited a substantial upward trend between 2000 and 2020, with an average increase rate of approximately 0.024 per decade (Figure 3c). During this period, the NDVI in the mountainous region showed an upward trend, probably due to the influence of precipitation and temperature. NDVI in the scattered areas on the edge of the oasis exhibited a downward trend, mainly distributed in grassland, suggesting vegetation degradation within the zone of transition from desert to oasis [32]. Contrarily, the NDVI in the oasis exhibited an increasing trend, and the largest increasing rate occurred in cultivated land, indicating that the expansion of cultivated land significantly enhanced vegetation greenness [41].
The spatial distributions of the NDVI and LULC for 2021 were prepared for the Dina River Basin (Figure 4). The NDVI across the Dina River Basin showed a noticeable spatial distribution (Figure 4a). NDVI values were comparatively high in the north, middle, and southwest of the basin, whereas they were low in the edge, middle, and southeast of the basin. Overall, vegetation cover was lower in the desert region, while it was higher in the oasis region and mountainous region. As shown in Figure 4b, the cultivated land was primarily concentrated in the central and southwestern regions of the basin, whereas the grassland was predominantly located in the northern, central, and southwestern areas. Forest was mainly distributed in the north of the basin (natural forest) and on the edge of cultivated land (artificial forest). Bare land was primarily located on the periphery of grassland and cultivated land. Obviously, the dominant land cover type was bare land in 2021, covering 67.8% of the Dina River Basin. Grassland was the second most dominant land cover type (16.3% in 2021), followed by cultivated land (9.6% in 2021) and forest (5.3% in 2021). The marked increase in cultivated land area in the last few decades (7.1% for 2000 and 9.6% for 2021) resulted in a high water demand for agricultural irrigation [34].
3.2. Stable Water Isotopes
Stable water isotopes (δ2H and δ18O) differed among various water components in the study area (Figure 5). Overall, surface water exhibited greater isotopic enrichment compared to groundwater in our study area. The most enriched δ2H and δ18O were found in surface water (δ2H = −47.75‰, δ18O = −7.89‰), whereas the most depleted δ2H and δ18O were observed in deep groundwater (δ2H = −58.26‰, δ18O = −9.26‰). δ2H and δ18O values of surface water ranged from −59.04‰ to −35.64‰ and −9.45‰ to −3.64‰, respectively, which was more depleted than the rain stable isotopes in Luntai county (δ2H = −45.2‰, δ18O = −7.0‰; Wang et al. [42]). Furthermore, a great fluctuation in δ2H and δ18O was displayed in shallow groundwater across the plain (Figure 5), probably due to intense evaporation and various recharge sources in the oasis–desert region [11]. δ2H values of shallow groundwater varied between −69.67‰ and −44.44‰, with an arithmetic mean value of −53.40‰, while δ18O values varied between −10.33‰ and −4.86‰, with an arithmetic mean value of −8.23‰. δ18O values of middle groundwater had a markable range of −11.24‰ to −7.69‰, with an arithmetic mean value of −9.07‰. Evidently, the δ18O value of the middle groundwater ranged between the shallow groundwater and deep groundwater, indicating the recharge of upper phreatic water to confined water [34]. However, δ2H and δ18O values of deep groundwater differed significantly from other water components, which exhibited small fluctuations. The differences of δ2H and δ18O for various groundwater indicated that shallow, middle, and deep groundwater could be recharged by different sources [43].
Figure 6c displays the seasonal variation in δ18O values for water samples in the study area. The δ18O values of surface water and groundwater displayed remarkable seasonal variation in the plain of Dina River Basin, probably attributable to the temporal fluctuations in temperature, precipitation, water source, and even human activities in the plain [29]. Generally, surface water and groundwater were both characterized by higher δ18O values in the non-flood season compared with those in the flood season, indicating the massive recharge from runoff with more negative isotopes in the flood season [43]. Furthermore, the average δ18O values of shallow groundwater were less than those of surface water during both flood and non-flood seasons, yet they were greater than those of middle groundwater. The seasonal variation in δ18O for surface water was smaller than that for shallow groundwater, but larger than that for middle groundwater, possibly due to different recharge sources, evaporation, and mixing processes among various seasons [36]. However, the disparity in seasonal fluctuation for the mean δ18O value was not obvious among surface water, shallow groundwater, and middle groundwater, indicating the close relationship among surface water, phreatic water, and confined water [33]. Furthermore, there was no seasonal variation in the deep groundwater δ18O in the plain.
3.3. Dissolved Ions
Surface water pH was noted to exhibit a slightly alkaline nature, averaging at 7.9. Ca2+ concentration (141.2 mg/L) prevailed as the primary cation in surface water, followed by Na+ (104.6 mg/L), Mg2+ (44.8 mg/L), and K+ (2.4 mg/L). By contrast, SO42− concentration (295.6 mg/L) prevailed as the primary anion in surface water, succeeded by HCO3− (155.3 mg/L) and Cl− (151.4 mg/L). The mean TDS value of surface water was observed to be 982.8 mg/L, which was lower than the groundwater (9025.5 mg/L). In addition, TDS values of groundwater in different aquifers over the plain showed significant fluctuations, with the TDS ranging from 476.0 to 39,770.0 mg/L (Figure 7 and Figure 8). Shallow groundwater had the highest TDS, with mean values of 21,337.9 mg/L and 7253.6 mg/L for TDS and Cl−, respectively. Middle groundwater exhibited higher TDS and Cl− (TDS = 965.0 mg/L, Cl− = 165.4 mg/L) than the deep groundwater (TDS = 751.2 mg/L, Cl− = 110.4 mg/L). Moreover, the alkalinity of middle groundwater (pH = 8.0) was greater than the shallow groundwater (pH = 7.7), whereas the temperature of middle groundwater (11.6 °C) was cooler than the shallow groundwater (14.1 °C). Furthermore, surface water belonged to the Ca-SO4 hydrochemical type, while shallow, middle, and deep groundwater were Na-Mg-Cl-SO4, SO4-Cl-Na-Ca, and HCO3-Cl-Ca-Na hydrochemical types, respectively.
The spatial distributions of ion concentrations for surface water differed significantly among the major dissolved ions in the Dina River Basin’s oasis–desert area (Figure 7). The ion concentrations of surface water in the plain exhibited obvious spatial heterogeneity, and varied among the water sampling sites. The highest values of Na+ + K+, Ca2+, Cl−, and SO42− for surface water mainly occurred in the southwest region, while the lowest values were mainly in the northeast region. In contrast, the northwest region of the surface water exhibited the lowest concentrations of Mg2+ and HCO3−, whereas the highest concentrations were dispersed throughout the central area. Generally, the spatial distribution pattern of Na+ and Cl− values for surface water was consistent, while the spatial distribution pattern of Ca2+ and SO42− values was consistent (Figure 7). As depicted in Figure 8, the ion concentrations of shallow groundwater in the Dina River Basin plain displayed evident spatial variability. The spatial distribution pattern of dissolved ions in shallow groundwater, excluding HCO3−, remained consistent. In general, the concentrations of the primary dissolved ions in shallow groundwater rose along the direction of groundwater flow, moving from midstream towards downstream in the designated study area. (Figure 8). The concentration of Cl− in shallow groundwater varied between 38.1 and 16,016.3 mg/L, with significantly higher levels observed in the southern region compared to the northern part. This was probably attributed to intense phreatic water evaporation, agricultural drainage of salt water, and dissolved soil salinity by irrigation water infiltrating into the phreatic aquifer in the oasis–desert region [34].
Figure 6 exhibits the seasonal variations in TDS and Cl− concentrations in the water samples gathered from the study region. The seasonal variations in TDS and Cl− values for surface water and groundwater were significant in the plain of the Dina River Basin (Figure 6a,b), mainly due to different precipitation, air temperature, and water sources among various seasons [11]. Generally, the Cl− and TDS levels in surface water and shallow groundwater during the non-flood season were greater than those in the flood season in the plain. This was primarily attributed to significant replenishment from rainfall and runoff, which had lower ion concentrations during the flood season [29]. In contrast, middle groundwater had higher values of Cl− and TDS in the flood season than those in the non-flood season. Furthermore, in the flood season, the mean Cl− and TDS of middle groundwater were less than those for shallow groundwater, but greater than those for surface water. However, in the non-flood season, the mean Cl− and TDS of surface water were less than those for shallow groundwater, but greater than those for middle groundwater (Figure 6a,b). The seasonal variation in Cl− and TDS for surface water was smaller than that for shallow groundwater, but larger than that for middle groundwater, indicating the close relationship between surface water and phreatic water.
3.4. Groundwater Level
Figure 9 exhibits the variation characteristics of the monthly mean DGL (depth to groundwater level), NDVI, δ18O, and TDS of groundwater for the six monitoring wells (D1–D6) from 2018 to 2021 in our study area. Overall, NDVI, groundwater level and hydrochemistry showed obvious spatio-temporal variation, and differed obviously between the monitoring wells, maybe due to the different underlying surface conditions, vegetation coverage, lithology, and hydrogeological conditions [31]. Except for the D5 well, the DGL of the other monitored wells presented an increasing trend from 2018 to 2021, while the variation in precipitation during the same period was not obvious (about 70 mm for annual precipitation) [35]. This indicated that the effect of rainfall on groundwater was weak in the desert area. The largest increase in DGL occurred in the D6 well (0.83 m), and the smallest increase in the DGL was in the D4 well (0.02 m). On the contrary, the DGL of the D5 well exhibited a downward trend from 2018 to 2021, and the average annual DGL decreased by 0.10 m (Figure 9). The DGL was the largest in the D2 well (12.14 m), and was the smallest in the D1 and D6 wells (5.31 m for D1, and 5.12 m for D6). Furthermore, the fluctuation range of intra-annual DGL variation was relatively small for the D1, D4, and D6 wells, while it was relatively large for the D2, D3, and D5 wells. For the D2, D3, and D5 wells, the maximum DGL generally occurred in September, while the minimum DGL occurred in April or May. However, the groundwater level in the monitoring wells did not display a rising trend after precipitation (daily precipitation ≤ 27 mm) [35]. This suggested that the infiltration of agricultural drainage and irrigation water in the oasis region could laterally replenish the groundwater in the desert area, with an obvious time lag [11,36].
As shown in Figure 9, the temporal variation in vegetation cover was correlated to the groundwater level in the desert area, and the NDVI generally decreased with the decrease in water level. In general, the greater the groundwater level decrease (0.82 m for D1, and 0.83 for D6), the greater the NDVI decrease (−0.021 for D1, and −0.014 for D6). The TDS was larger in the D2, D3 and D4 wells, while it was the smallest in the D5 well (Figure 9). Overall, the TDS of groundwater in the monitored wells exhibited a decreasing trend from 2018 to 2021, with the smallest decrease in the D5 well and the largest decrease in the D2, D3, D4, and D6 wells. That is, the decrease in groundwater level in the desert area coincided with a reduction in TDS in the phreatic aquifer, suggesting that the evaporation of phreatic water significantly affected phreatic water quality in desert area [32]. Furthermore, the stable isotope values of groundwater varied among the monitoring wells, and exhibited obvious temporal variation, indicating the different effects of evaporation and water sources on shallow groundwater [43].
4. Discussion
4.1. Influence of Human Activities on Groundwater Hydrochemistry
Natural factors are important factors affecting groundwater hydrochemistry [36]. The natural mechanisms of major hydrochemical compositions can be deduced from the mixing diagrams of Na-normalized ratios, which serve to ascertain the sources and determining factors of major hydrochemistry in surface water and groundwater [44]. The mixing diagrams of Na-normalized ratios showed that most surface water samples were plotted between the silicate and carbonate end-members (Figure 10), suggesting that the samples were probably in the environments with gypsum/anhydrite and halite [44]. By contrast, a majority of middle groundwater and deep groundwater samples were adjacent to silicate end-members (Figure 10), suggesting the dominance of silicate weathering. Shallow groundwater was dominated by silicate weathering and evaporate dissolution, due to the complex lithology in the region [19]. The Na+/Cl− molar ratio in shallow groundwater in the plain of Dina River Basin was close to one, suggesting that silicate weathering and evaporate dissolution (e.g., halite dissolution) were the effective processes of releasing Na+ into shallow groundwater [44,45]. Hence, hydrogeological characteristics can exert a notable influence on the hydrochemical composition of streamflow and groundwater [46]. The soil salinization in the plain of Dina River Basin is serious, which significantly affects the hydrochemistry of soil moisture and phreatic water [11].
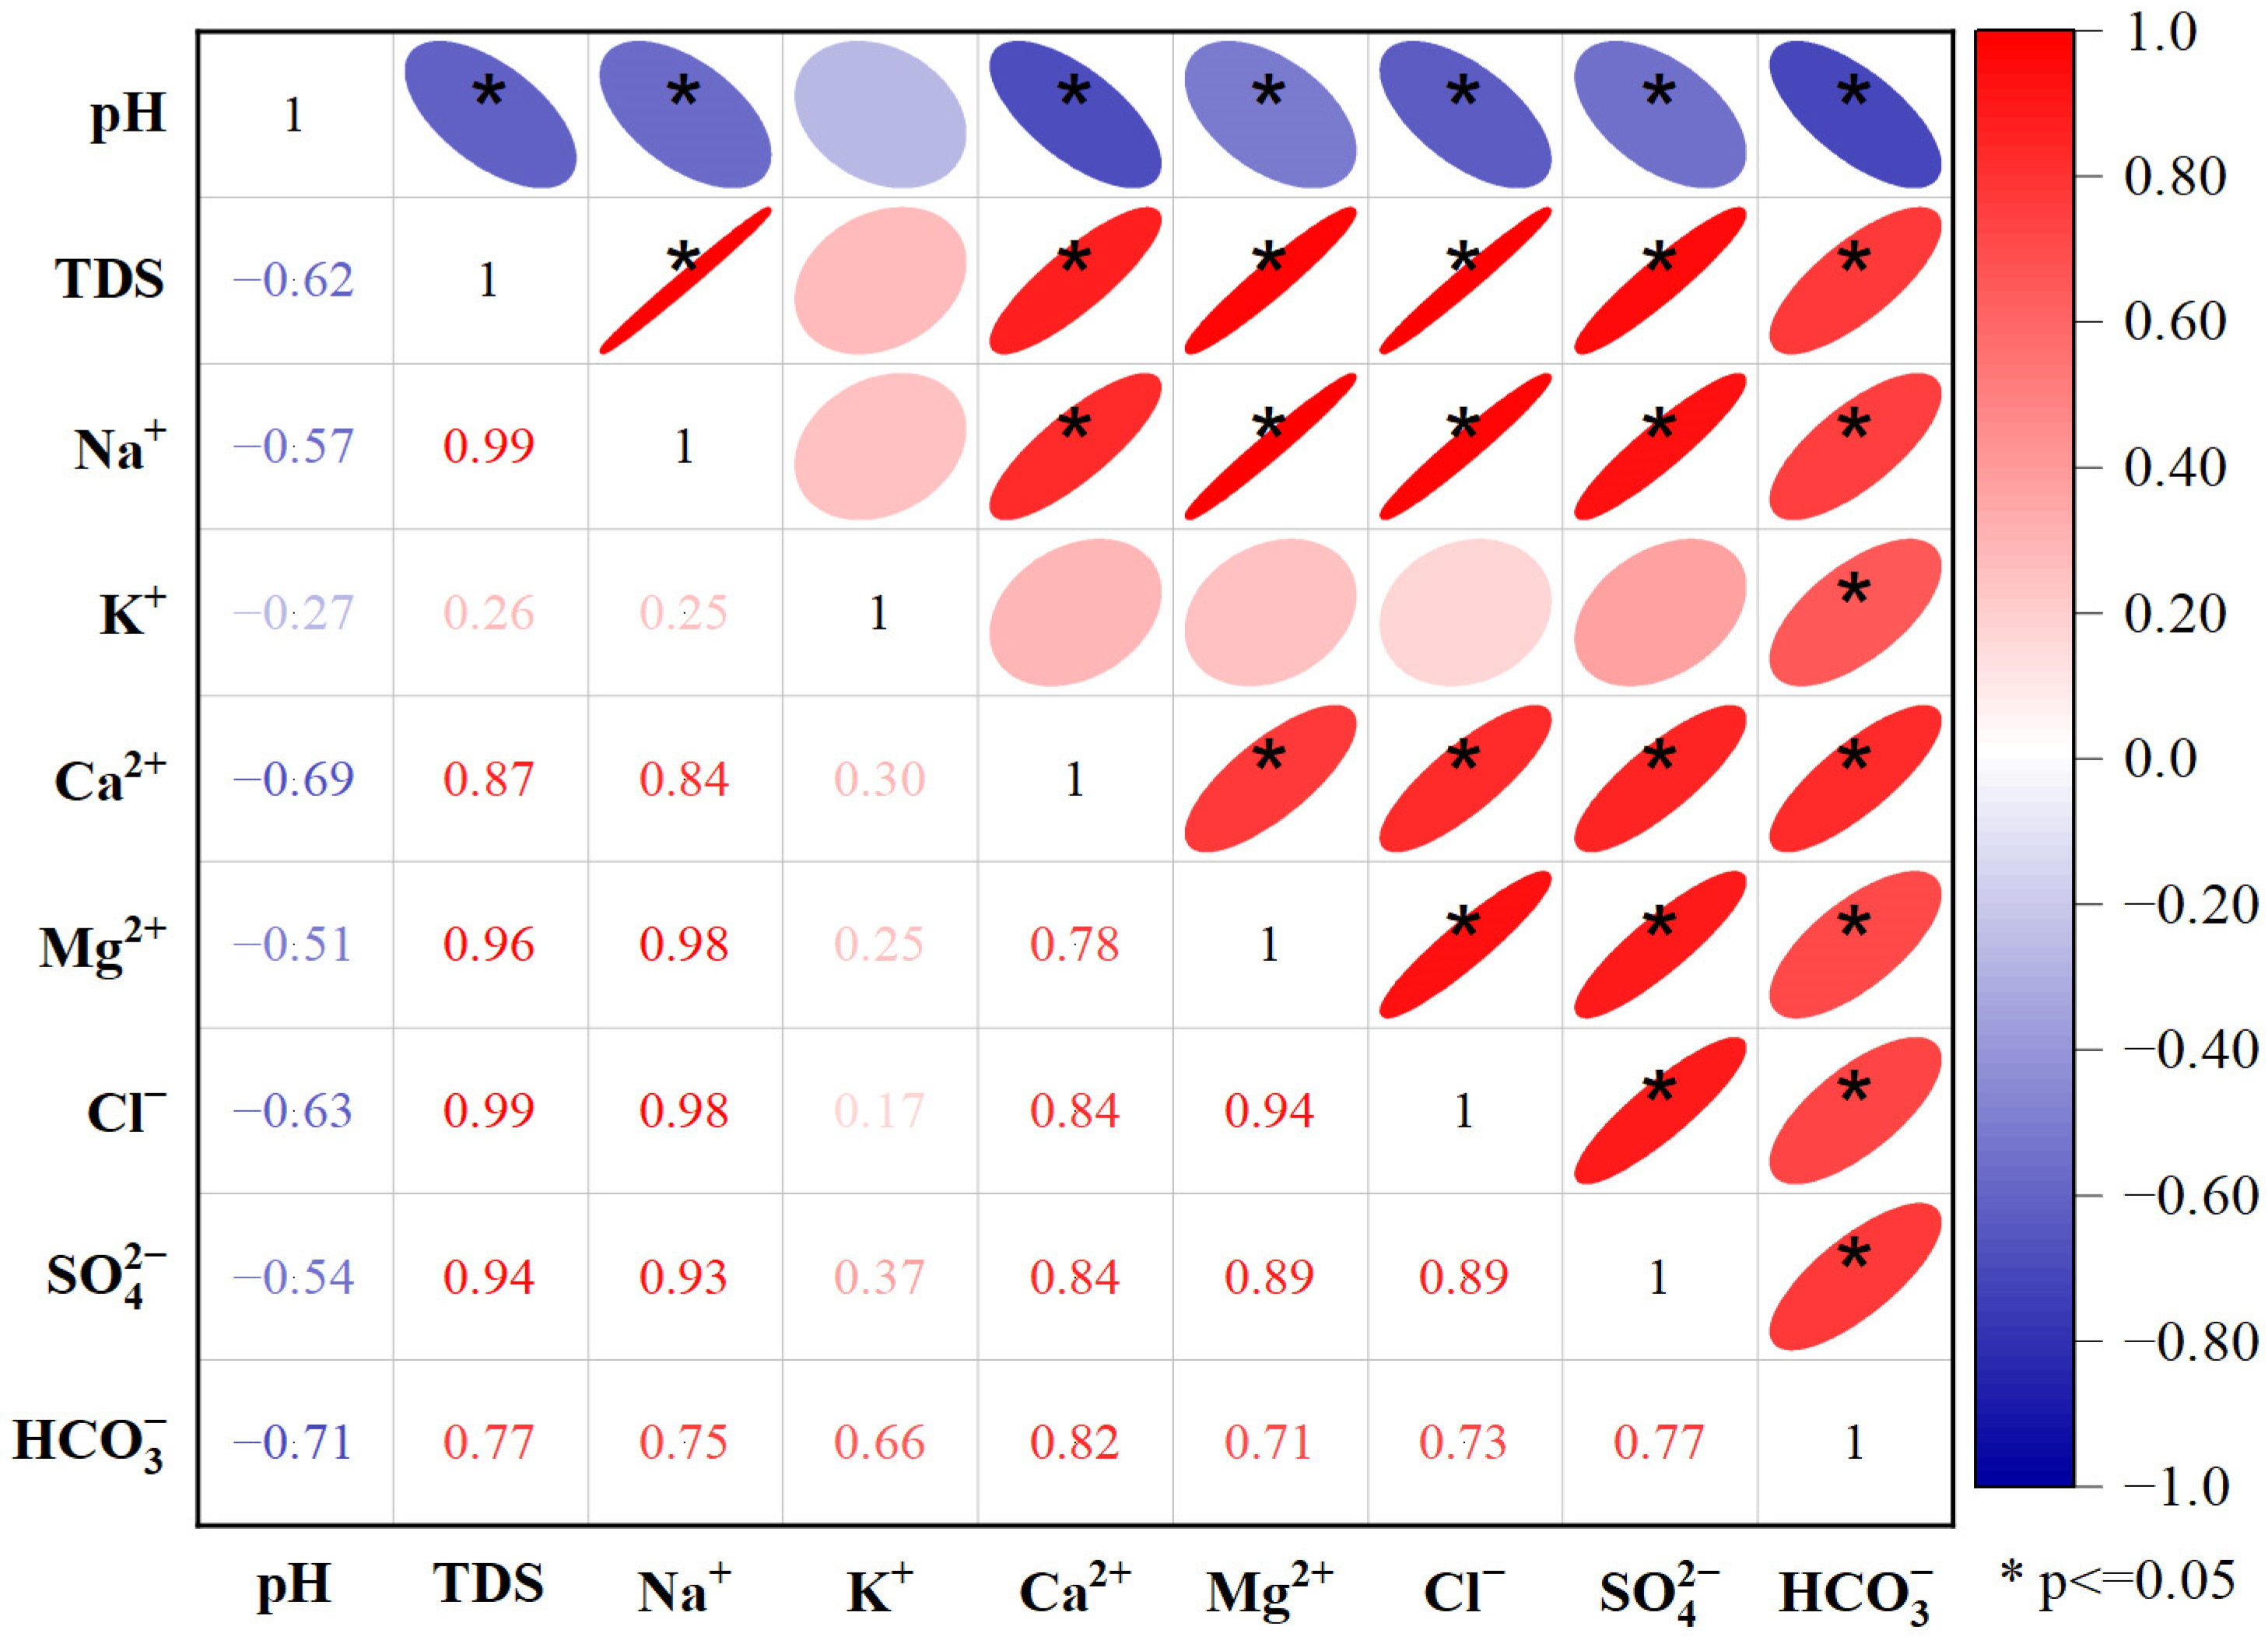
Correlations between hydrochemical parameters serve as an effective means for examining the primary hydrochemical processes that govern hydrochemical traits [47]. Pearson’s correlation analysis was utilized to investigate the relationship among hydrochemical parameters in groundwater (Figure 11). Most of the hydrochemical parameters were significantly correlated with each other. Cl− was significantly related with Na+ and HCO3− (correlation coefficients of 0.98 and 0.73, respectively), indicating that the weathering of silicate and halite was a key process regulating groundwater chemistry in the region [48]. Similarly, Ca2+ exhibited a significant correlation with SO42− (correlation coefficients of 0.84), suggesting that SO42− was sourced from gypsum dissolution [36,48]. TDS serves as an indicator of groundwater salinity, arising from the combined contribution of all dissolved ions. In this region, TDS was significantly correlated with Na+, Ca2+, Mg2+, Cl−, and SO42− (Figure 11), suggesting the importance of gypsum dissolution and the weathering of silicate and halite in forming groundwater hydrochemistry in our study area [33].
We further investigated the influences of anthropogenic activities on the hydrochemical compositions and water level of groundwater. It was generally known that a larger amount of groundwater exploitation could result in a decrease in the groundwater level in arid regions [32]. Agricultural irrigation activities had a notable impact on the local groundwater level and quality [31]. In recent years, the irrigation method change and efficient water-saving irrigation promotion have notably decreased the depth and volume of recharge from irrigated water infiltration [49]. Groundwater overexploitation caused by the increase in population and cultivated land area could not be balanced with the amount of irrigation infiltration, leading to a persistent drop in groundwater level in some regions [11,32]. In the Tarim River Basin, the efficient water-saving irrigation area could account for about 41.7% of the total irrigation area, and the amount of groundwater exploitation was about 92.3 × 10⁸ m3 (data from the Water Resources Bulletin of Xinjiang Uygur Autonomous Region, China). Meanwhile, the concentrations of dissolved ions in groundwater also changed (Figure 7 and Figure 8). Due to serious soil salinization and the influence of agricultural drainage systems, the salinity of shallow groundwater was high, and shallow groundwater in some regions would not be suitable for agricultural irrigation [11]. Wang et al. [11] observed that phreatic water in some regions of the Wei-Ku Oasis in Tarim Basin was unsuitable for irrigation because of exceptionally high salinity. Furthermore, the variation in groundwater level and quality in the oasis could directly affect the natural vegetation. Desert vegetation was heavily dependent on groundwater due to the scarcity of surface water, and the decline in the groundwater level in oases could lead to the degradation of desert vegetation in arid inland areas [32]. It was found that in the desert areas of the northern Tarim Basin, there existed an inverse relationship between the depth of the groundwater level and the coverage of natural desert vegetation (NDVI) [35]. Li et al. [50] reported that the aboveground biomass of grassland plant communities in the lower Tarim River was highest when the groundwater depth was less than 3 m and groundwater salt was no more than 5.0 g/L. Therefore, the rational utilization of groundwater resources is very important to regional ecological and food security [11]. The above research results could provide knowledge support for groundwater resource management and groundwater environment protection in arid areas worldwide.
4.2. Groundwater Recharge Sources and Recharge Process
Identifying the recharge sources of groundwater and quantitatively evaluating their corresponding contributions are necessary to sustainable groundwater resources management [43]. The enriched δ2H and δ18O values in the shallow groundwater in the plain of the Dian River Basin resembled those of surface water, suggesting a strong hydraulic linkage between surface water and shallow groundwater [29]. The flat terrain across the plain and the high permeability of the soil and aquifer permitted the downward percolation of surface water into the shallow aquifer, including from the canal, riverbank, reservoir, and irrigation [36]. Furthermore, there is little rain in the plain, while the local evaporation is very strong, and soil water content is low due to the extreme arid environment [32]. Thus, the recharge from precipitation to groundwater is very weak, and could be ignored in our study area [29]. Hence, the potential recharge sources of shallow groundwater in the plain comprised surface water infiltration, confined water, and lateral groundwater flow.
The end-member mixing analysis method (EMMA; Equations (1)–(4)) was utilized to identify the dominant sources and to estimate the contribution ratio of each recharge source to shallow groundwater in the plain. Our findings revealed that approximately 73% of shallow groundwater was replenished by surface water, while 27% originated from lateral groundwater flow in the plain of the Dina River Basin (δ18O as the tracer). This indicated that local surface water infiltration was the primary source of shallow groundwater, with lateral groundwater flow from the mountains playing a significant role in replenishing shallow groundwater in the arid oasis–desert region [29]. This was similar to the research found by Guo et al. [43] in the downstream of the Heihe River Basin; 87% of the shallow groundwater was from river water infiltration. Surface water infiltration mainly included the infiltration from the riverbank, reservoir, canal, and irrigation water. More than 90% of the streamflow was directly diverted from mountain into irrigation districts for agricultural irrigation, causing the dried-up river in the plain over the last decades [11]. Moreover, the plain of the Dina River Basin was dominated by agriculture, and the limited streamflow could not meet the demand of irrigation water, leading to groundwater becoming an important source of agricultural irrigation [32]. Thus, the irrigation water infiltration from streamflow and groundwater pumping was an important recharge source of shallow groundwater in the plain. In the Tarim River Basin, 89.1% of groundwater exploitation was utilized by agriculture irrigation in 2016 (about 43.07 × 10⁸ m3) [35].
As above, the stable isotopic and hydrochemical signatures of water as well as shallow groundwater recharge sources provided a perspective on the groundwater recharge process influenced by human activities in the oasis–desert area [29,43]. Over the past three decades, advancement in water and land resource utilization has resulted in substantial modifications of the groundwater recharge process in arid regions due to human activities [26]. As water resource utilization in arid regions has improved, the timing, location, and pattern of recharge from surface water to groundwater have undergone changes [11]. The frequency and amount of groundwater recharge by irrigation water increased during the growing season due to the increase in irrigation intensity, resulting in the irrigation return water being one of dominant sources of shallow groundwater. Meanwhile, the supply of natural river seepage to groundwater was significantly reduced due to the dried-up river in the middle and lower reaches, and was mainly from the flood discharge during flood season. The increase in temperature and extreme precipitation events in the Southern Tianshan Mountains in recent years has caused an increase in groundwater recharge by mountain floods [51]. The leakage of mountain reservoirs and plain reservoirs is also one of the sources of groundwater. Additionally, water exchange between different aquifers is more frequent. Deep confined water is extracted for agricultural irrigation, which in turn could infiltrate downward into phreatic aquifers. The cone of depression, formed due to a precipitous drop in groundwater levels in certain areas, leads to the seepage of phreatic water into confined water, thereby inducing an interaction between saline and freshwater within the aquifers [31]. The above results could provide reference for deeply understanding the groundwater recharge process and hydrochemical evolution in other arid areas with a similar landscape in the world.
5. Conclusions
A combined application of isotopic indicators and the EMMA method was performed to identify the recharge sources and recharge process of groundwater, and to assess the influence of human activities on groundwater hydrochemical evolution in the oasis–desert of the Dina River Basin. The following conclusions could be drawn:
- (i)
- During 2000 to 2020, the NDVI and cultivated land area both exhibited a significant increasing trend, while the variation trend of air temperature and precipitation was not obvious, indicating the important effect of cultivated land area increase on vegetation cover.
- (ii)
- Stable water isotopes and dissolved ions of groundwater and surface water exhibited obviously spatial heterogeneity and seasonal variation. Except for HCO3−, the spatial distribution pattern of major dissolved ions for shallow groundwater was consistent, increasing along the groundwater flow direction from midstream to downstream. Surface water and groundwater were both characterized by higher δ18O and TDS in the non-flood season than those in the flood season, due to the massive recharge from runoff in the flood season. The seasonal variation in δ18O and TDS was the largest in shallow groundwater, followed by surface water and middle groundwater.
- (iii)
- DGL showed obvious spatio-temporal variation, and differed obviously among the monitoring wells. Except for the D5 well, the groundwater level in the monitored wells presented a decreasing trend from 2018 to 2021, accompanied by a decrease in TDS in phreatic aquifer. The NDVI in the desert area generally decreased with the decrease in groundwater level. Generally, the greater the groundwater level decrease in the desert area, the greater the NDVI decrease.
- (iv)
- Gypsum dissolution and weathering of silicate and halite had an important role in forming groundwater hydrochemistry in the region. Human activities significantly affected the hydrochemical evolution and recharge process of groundwater in the plain of the Dina River Basin. Shallow groundwater was mainly recharged by surface water and lateral groundwater flow, accounting for 73% and 27%, respectively, indicating the dominant role of local surface water. Agricultural activities and groundwater overexploitation were the main factors for the variations in the groundwater level and quality in the oasis area, which could directly affect groundwater and natural vegetation in the desert area. Hence, attention should be paid to the importance of the effect of anthropogenic activities on groundwater level and quality in the efficient utilization of groundwater resources.
Author Contributions
Conceptualization, Y.Y., W.W. (Wanrui Wang) and W.W. (Weihua Wang); data curation, Y.Y., C.T., G.H., Y.Z., and H.C.; investigation, Y.Y., C.T., G.H., Y.Z. and H.C.; methodology, W.W. (Wanrui Wang); supervision, W.W. (Wanrui Wang) and W.W. (Weihua Wang); writing—original draft preparation, Y.Y. and W.W. (Wanrui Wang); funding, W.W. (Wanrui Wang) and W.W. (Weihua Wang). All authors have read and agreed to the published version of the manuscript.
Funding
This study was jointly funded by the Natural Science Foundation of Xinjiang Uygur Autonomous Region (2022D01C677), Tianshan Innovative Team Project (2022TSYCTD0001), National Natural Science Foundation of China (42001041), Talent Program “Tianchi Talent (Young Doctor)” in Xinjiang Uygur Autonomous Region (51052300504), Xinjiang Key Laboratory of Water Cycle and Utilization in Arid Zone (XJYS0907-2023-13), and the Youth Innovation Promotion Association of CAS (2021440).
Data Availability Statement
Data cannot be made publicly available; readers should contact the corresponding author for details.
Acknowledgments
We would like to thank the Excellent Postdoctoral Researchers Project of Xinjiang Uygur Autonomous Region, China. We also greatly appreciate the editor and four anonymous reviewers for their constructive suggestions on the manuscript.
Conflicts of Interest
The authors declare that they have no known competing financial interests or personal relationships that could have appeared to influence the work reported in this paper.
References
- Lezzaik, K.; Milewski, A.; Mullen, J. The groundwater risk index: Development and application in the Middle East and North Africa region. Sci. Total Environ. 2018, 628, 1149–1164. [Google Scholar] [CrossRef] [PubMed]
- Jasechko, S.; Seybold, H.; Perrone, D.; Fan, Y.; Kirchner, J.W. Widespread potential loss of streamflow into underlying aquifers across the USA. Nature 2021, 591, 391–395. [Google Scholar] [CrossRef] [PubMed]
- Zhang, J.; Jing, H.H.; Dong, K.B.; Jin, Z.X.; Ma, J.Q. The effect of drip irrigation under mulch on groundwater infiltration and recharge in a semi-arid agricultural region in China. Water Supply. 2022, 22, 4043–4054. [Google Scholar] [CrossRef]
- Zhong, Y.; Zhong, M.; Feng, W.; Zhang, Z.; Shen, Y.; Wu, D. Groundwater depletion in the West Liaohe River Basin, China and its implications revealed by GRACE and in situ measurements. Remote Sens. 2018, 10, 493. [Google Scholar] [CrossRef]
- Tonkul, S.; Baba, A.; Şimşek, C.; Durukan, S.; Demirkesen, A.C.; Tayfur, G. Groundwater recharge estimation using HYDRUS 1D model in Alaşehir sub-basin of Gediz Basin in Turkey. Environ. Monit. Assess. 2019, 191, 610. [Google Scholar] [CrossRef] [PubMed]
- Khmila, K.; Trabelsi, R.; Zouari, K.; Kumar, U.S. Application of geochemical and isotopic tracers for the evaluation of groundwater quality in the irrigated area of the Sbiba plain (Central West Tunisia). Agric. Ecosyst. Environ. 2021, 313, 107298. [Google Scholar] [CrossRef]
- Rehman, N.; Ali, W.; Muhammad, S.; Tepe, Y. Evaluation of drinking and irrigation water quality, and potential risks indices in the Dera Ismail Khan district, Pakistan. Kuwait J. Sci. 2024, 51, 100150. [Google Scholar] [CrossRef]
- Mao, W.; Zhu, Y.; Wu, J.; Ye, M.; Yang, J. Modelling the salt accumulation and leaching processes in arid agricultural areas with a new mass balance model. J. Hydrol. 2020, 591, 125329. [Google Scholar] [CrossRef]
- Han, D.; Currell, M.J.; Cao, G.; Hall, B. Alterations to groundwater recharge due to anthropogenic landscape change. J. Hydrol. 2017, 554, 545–557. [Google Scholar] [CrossRef]
- Feng, S.; Liu, Z.; Han, Y.; Wang, L.; Hu, Z.; Qi, M. Effect of groundwater depression cone on the hydrochemical evolution process in the People’s Victory Canal irrigation area, China. Processes 2022, 10, 2563. [Google Scholar] [CrossRef]
- Wang, W.H.; Chen, Y.N.; Wang, W.R.; Zhu, C.G.; Chen, Y.P.; Liu, X.G.; Zhang, T.J. Water quality and interaction between groundwater and surface water impacted by agricultural activities in an oasis-desert region. J. Hydrol. 2023, 617, 128937. [Google Scholar] [CrossRef]
- Jia, H.; Qian, H.; Zheng, L.; Feng, W.; Wang, H.; Gao, Y. Alterations to groundwater chemistry due to modern water transfer for irrigation over decades. Sci. Total. Environ. 2020, 717, 137170. [Google Scholar] [CrossRef] [PubMed]
- Ullah, A.; Ali, W.; Muhammad, S.; Ijaz, J.; Amir, F.; Iqbal, S. Comprehensive evaluation of hydro-chemical processes, suitability, health risks, and sources of groundwater contamination using compositional data analysis, Nizampur basin, Pakistan. Groundw. Sustain. Dev. 2023, 23, 101021. [Google Scholar] [CrossRef]
- Smerdon, B.D. A synopsis of climate change effects on groundwater recharge. J. Hydrol. 2017, 555, 125–128. [Google Scholar] [CrossRef]
- Sultan, M.; Sturchio, N.C.; Alsefry, S.; Emil, M.K.; Ahmed, M.; Abdelmohsen, K.; AbuAbdullah, M.M.; Yan, E.; Save, H.; Alharbi, T.; et al. Assessment of age, origin, and sustainability of fossil aquifers: A geochemical and remote sensing-based approach. J. Hydrol. 2019, 576, 325–341. [Google Scholar] [CrossRef]
- Su, Z.M.; Wu, J.H.; He, X.D.; Elumalai, V. Temporal changes of groundwater quality within the groundwater depression cone and prediction of confined groundwater salinity using Grey Markov model in Yinchuan area of Northwest China. Expo. Health 2020, 12, 447–468. [Google Scholar] [CrossRef]
- Omar, M.E.D.M.; Moussa, A.M.A.; Hinkelmann, R. Impacts of climate change on water quantity, water salinity, food security, and socioeconomy in Egypt. Water Sci. Eng. 2021, 14, 17–27. [Google Scholar] [CrossRef]
- Singh, A. Groundwater recharge assessment and long-term simulation for managing the threat of salinization of irrigated lands. J. Hydrol. 2022, 609, 127775. [Google Scholar] [CrossRef]
- Pant, R.R.; Zhang, F.; Rehman, F.U.; Wang, G.; Ye, M.; Zeng, C.; Tang, H. Spatiotemporal variations of hydrogeochemistry and its controlling factors in the Gandaki River Basin. Central Himalaya Nepal. Sci. Total Environ. 2018, 622–623, 770–782. [Google Scholar] [CrossRef]
- Cao, T.; Han, D.; Song, X.; Trolle, D. Subsurface hydrological processes and groundwater residence time in a coastal alluvium aquifer: Evidence from environmental tracers (delta 18O, delta 2H, CFCs, 3H) combined with hydrochemistry. Sci. Total Environ. 2020, 743, 140684. [Google Scholar] [CrossRef]
- Guo, X.J.; Wang, W.H.; Wang, J.S.; Wang, W. Hydrochemical characteristics and evolution pattern of groundwater system in Baiyangdian wetland. North Chian Plain. Acta Geol. Sin. 2022, 96, 656–672. [Google Scholar]
- Yang, S.; Chen, K.W.; Zhu, B.W.; Tian, Y.; Zeng, Z.Z.; Liu, M.; Zheng, C.M. How does irrigation alter the water, carbon, and nitrogen budgets in a large endorheic river basin? J. Hydrol. 2022, 613, 128317. [Google Scholar] [CrossRef]
- Sun, H.Y.; Mao, Q.G.; Wei, X.F.; Zhang, H.Q.; Xi, Y.Z. Hydrogeochemical characteristics and formation evolutionary mechanism of the groundwater system in the Hami basin. Geol. China 2018, 45, 1128–1141. [Google Scholar]
- Ahmed, M.; Chen, Y.; Khalil, M.M. Isotopic composition of groundwater resources in arid environments. J. Hydrol. 2022, 609, 127773. [Google Scholar] [CrossRef]
- Zhang, B.J.; Li, Z.X.; Feng, Q.; Zhang, B.T.; Gui, J. A review of isotope ecohydrology in the cold regions of Western China. Sci. Total Environ. 2023, 857, 159438. [Google Scholar]
- Gui, J.; Li, Z.X.; Feng, Q.; Zhang, B.J.; Xue, J.; Gao, W.D.; Li, Y.C.; Liang, P.F.; Nan, F.S. Water resources significance of moisture recycling in the transition zone between Tibetan Plateau and arid region by stable isotope tracing. J. Hydrol. 2022, 605, 127350. [Google Scholar]
- Yang, N.; Wang, G.C. Spatial variation of water stable isotopes of multiple rivers in southeastern Qaidam Basin, northeast Qinghai-Tibetan Plateau: Insights into hydrologic cycle. J. Hydrol. 2024, 628, 130464. [Google Scholar] [CrossRef]
- Tian, L.D.; Cai, Z.Y.; Shao, L.L.; Wang, D.; Liu, F. Review on the study of climatic significance of precipitation isotope in Asian monsoon region. Quat. Sci. 2021, 41, 856–863. (In Chinese) [Google Scholar]
- Wang, W.R.; Chen, Y.N.; Chen, Y.P.; Wang, W.H.; Zhang, T.J.; Qin, J.X. Groundwater dynamic influenced by intense anthropogenic activities in a dried-up river oasis of Central Asia. Hydrol. Res. 2022, 53, 532–546. [Google Scholar] [CrossRef]
- Richards, L.A.; Magnone, D.; Boyce, A.J.; Casanueva-Marenco, M.J.; van Dongen, B.E.; Ballentine, C.J.; Polya, D.A. Delineating sources of groundwater recharge in an arsenic affected Holocene aquifer in Cambodia using stable isotope based mixing models. J. Hydrol. 2018, 557, 321–333. [Google Scholar] [CrossRef]
- Wang, W.; Chen, Y.; Wang, W.; Jiang, J.; Cai, M.; Xu, Y. Evolution characteristics of groundwater and its response to climate and land-cover changes in the oasis of dried-up river in Tarim Basin. J. Hydrol. 2021, 594, 125644. [Google Scholar] [CrossRef]
- Chen, Y.N.; Wubuli, W.M.E.J.; Abula, A.K.R.M.; Cheng, Y.; Chen, Y.P.; Hao, X.M.; Wang, Y. Monitoring and analysis of ecological benefits of water conveyance in the lower reaches of Tarim River in recent 20 years. Arid Land Geogr. 2021, 44, 605–611. (In Chinese) [Google Scholar]
- Zeng, Y.Y.; Zhou, J.L.; Nai, W.H.; Li, L.; Tan, P.F. Hydrogeochemical processes of groundwater formation in the Kashgar River Basin, Xinjiang. Arid Zone Res. 2020, 37, 541–550. (In Chinese) [Google Scholar]
- Wang, W.R.; Chen, Y.P.; Wang, W.H.; Yang, Y.H.; Hou, Y.F.; Zhang, S.; Zhu, Z.Y. Assessing the influences of land use change on groundwater hydrochemistry in an oasis-desert region of central Asia. Water 2022, 14, 651. [Google Scholar] [CrossRef]
- Wang, W.R.; Chen, Y.N.; Wang, W.H.; Chen, Y.P.; Hou, Y.F. Groundwater level dynamic impacted by land-cover change in the desert regions of Tarim Basin, Central Asia. Water 2023, 15, 3601. [Google Scholar] [CrossRef]
- Wang, P.; Yu, J.J.; Zhang, Y.C.; Liu, C.M. Groundwater recharge and hydrogeochemical evolution in the Ejina Basin, northwest China. J. Hydrol. 2013, 476, 72–86. [Google Scholar] [CrossRef]
- Peng, S.; Ding, Y.; Liu, W.; Li, Z. 1 km monthly temperature and precipitation dataset for China from 1901 to 2017. Earth Syst. Sci. Data 2019, 11, 1931–1946. [Google Scholar] [CrossRef]
- Zanaga, D.; Van De Kerchove, R.; Daems, D.; De Keersmaecker, W.; Brockmann, C.; Kirches, G.; Wevers, J.; Cartus, O.; Santoro, M.; Fritz, S.; et al. ESA WorldCover 10 m 2021 v200. 2022. Available online: https://zenodo.org/records/7254221 (accessed on 2 February 2023).
- Sklash, M.G.; Farvolden, R.N. The role of groundwater in storm runoff. J. Hydrol. 1979, 43, 45–65. [Google Scholar] [CrossRef]
- Sen, P.K. Estimates of the regression coefficient based on Kendall’s tau. J. Am. Stat. Assoc. 1968, 63, 1379–1389. [Google Scholar] [CrossRef]
- Yao, J.Q.; Chen, Y.N.; Guan, X.F.; Zhao, Y.; Chen, J.; Mao, W.Y. Recent climate and hydrological changes in a mountain–basin system in Xinjiang, China. Earth-Sci. Rev. 2022, 226, 103957. [Google Scholar] [CrossRef]
- Wang, S.; Zhang, M.; Hughes, C.E.; Zhu, X.; Dong, L.; Ren, Z.; Chen, F. Factors controlling stable isotope composition of precipitation in arid conditions: An observation network in the Tianshan Mountains, central Asia. Tellus B. 2016, 68, 26206. [Google Scholar] [CrossRef]
- Guo, X.Y.; Feng, Q.; Si, J.H.; Xi, H.Y.; Zhao, Y.; Deo, R.C. Partitioning groundwater recharge sources in multiple aquifers system within a desert oasis environment: Implications for water resources management in endorheic basins. J. Hydrol. 2019, 579, 124212. [Google Scholar] [CrossRef]
- Wu, H.W.; Wu, J.L.; Li, J.; Fu, C.S. Spatial variations of hydrochemistry and stable isotopes in mountainous river water from the Central Asian headwaters of the Tajikistan Pamirs. Catena 2020, 193, 104639. [Google Scholar] [CrossRef]
- Barzegar, R.; Asghari Moghaddam, A.; Tziritis, E. Assessing the hydrogeochemistry and water quality of the Aji-Chay River, northwest of Iran. Environ. Earth Sci. 2016, 75, 1486. [Google Scholar] [CrossRef]
- Hale, V.C.; McDonnell, J.J. Effect of bedrock permeability on stream base flow mean transit time scaling relations: 1. A multiscale catchment intercomparison. Water Resour. Res. 2016, 52, 1358–1374. [Google Scholar] [CrossRef]
- Singh, C.K.; Kumar, A.; Shashtri, S.; Kumar, A.; Kumar, P.; Mallick, J. Multivariate statistical analysis and geochemical modeling for geochemical assessment of groundwater of Delhi, India. J. Geochem. Explor. 2017, 175, 59–71. [Google Scholar] [CrossRef]
- Li, P.Y.; Tian, R.; Liu, R. Solute geochemistry and multivariate analysis of water quality in the Guohua Phosphorite Mine, Guizhou Province, China. Expo. Health 2019, 11, 81–94. [Google Scholar] [CrossRef]
- Porhemmat, J.; Nakhaei, M.; Dadgar, M.A. Investigating the effects of irrigation methods on potential groundwater recharge: A case study of semiarid regions in Iran. J. Hydrol. 2018, 565, 455–466. [Google Scholar] [CrossRef]
- Li, W.H.; Zhou, H.H.; Yang, X.M.; Ding, H. Temporal and spatial distribution characteristics of aboveground biomass of grassland plant communities in an arid area. Acta Prataculturae Sin. 2010, 19, 186–195. (In Chinese) [Google Scholar]
- Fang, G.H.; Li, Z.; Yang, J.; Chen, Y.N.; Duan, W.L.; Amory, C.; Wang, Y.Q. Changes in flooding in the alpine catchments of the Tarim River Basin, Central Asia. J. Flood Risk Manag. 2023, 16, e12869. [Google Scholar] [CrossRef]
Figure 1.
Situations of the Tarim Basin (a) and Dina River Basin (b), distributions of water sampling points and groundwater observation wells in the study area ((c); modified from Wang et al. [11]).
Figure 1.
Situations of the Tarim Basin (a) and Dina River Basin (b), distributions of water sampling points and groundwater observation wells in the study area ((c); modified from Wang et al. [11]).

Figure 2.
Inter-annual fluctuations in annual mean air temperature (a), precipitation (b), NDVI (c), and cultivated land area (d) in the Dina River Basin from 2000 to 2020.
Figure 2.
Inter-annual fluctuations in annual mean air temperature (a), precipitation (b), NDVI (c), and cultivated land area (d) in the Dina River Basin from 2000 to 2020.
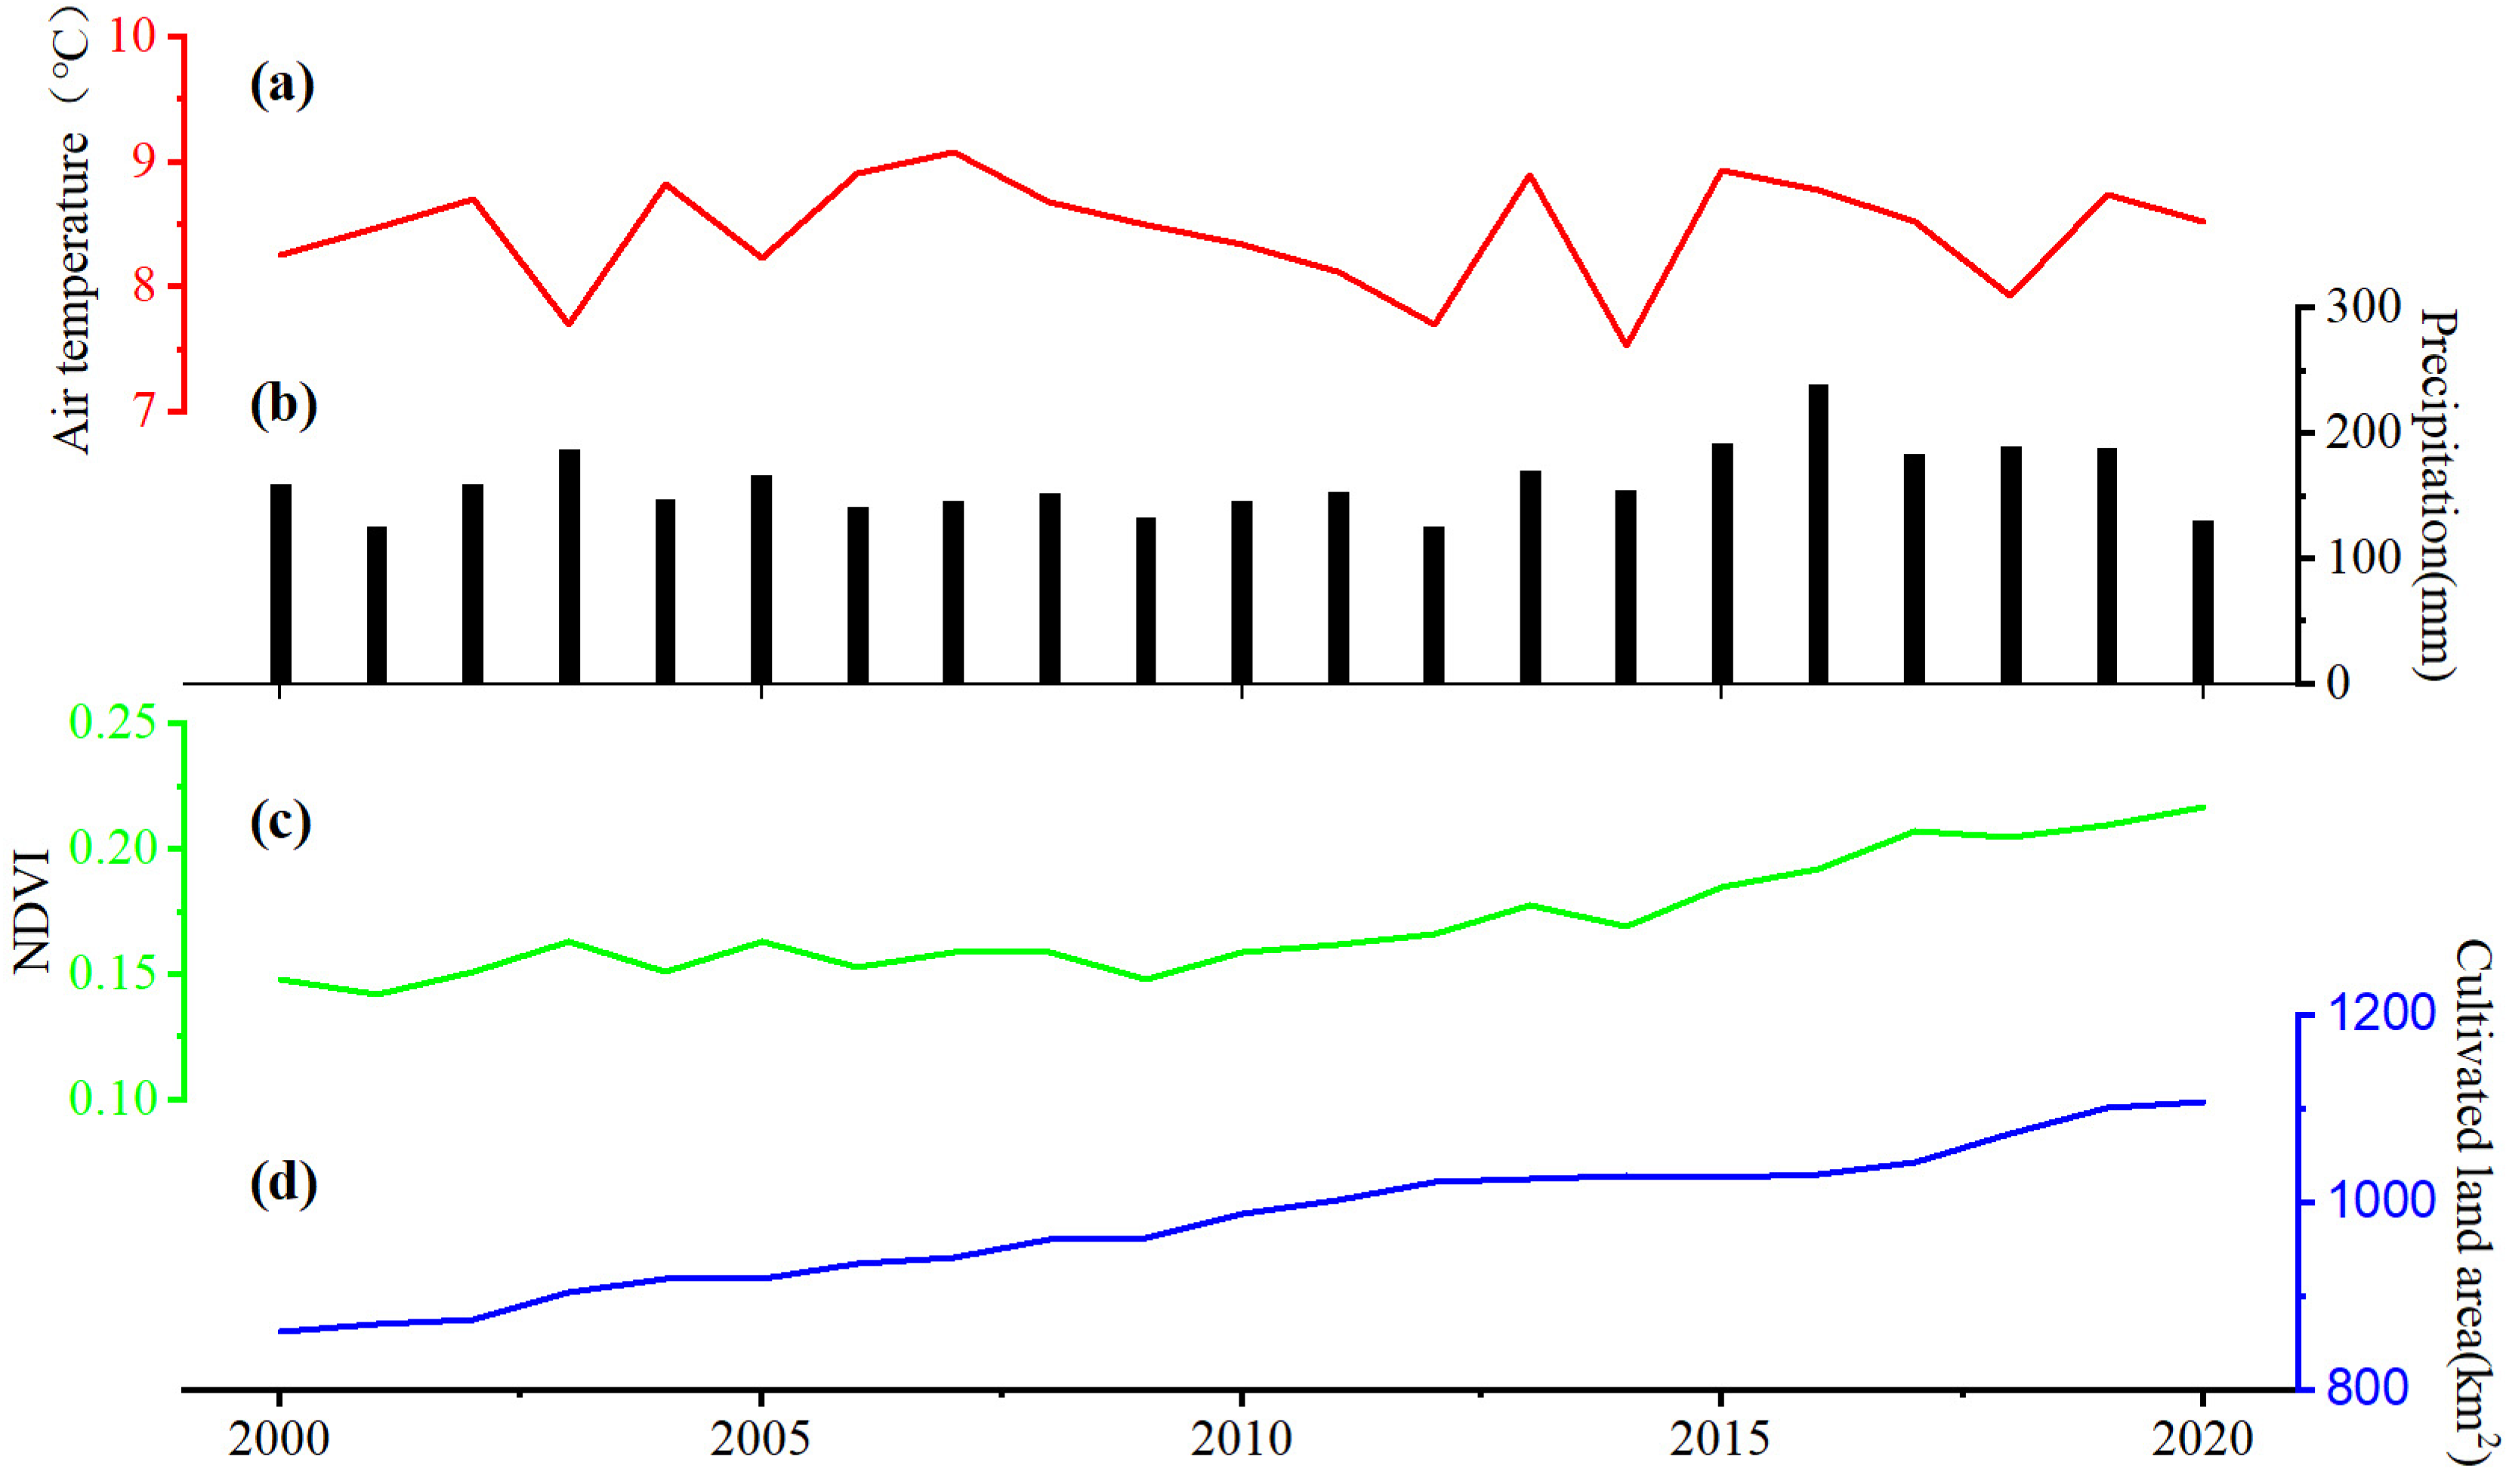
Figure 3.
Sen’s slope tested variation trends of air temperature (a), precipitation (b) and NDVI (c) in the Dina River Basin during 2000 to 2020.
Figure 3.
Sen’s slope tested variation trends of air temperature (a), precipitation (b) and NDVI (c) in the Dina River Basin during 2000 to 2020.

Figure 4.
Distributions of annual mean NDVI (a) and LULC (b) in the Dina River Basin for 2021. NDVI: normalized difference vegetation index; LULC: land use and land cover.
Figure 4.
Distributions of annual mean NDVI (a) and LULC (b) in the Dina River Basin for 2021. NDVI: normalized difference vegetation index; LULC: land use and land cover.
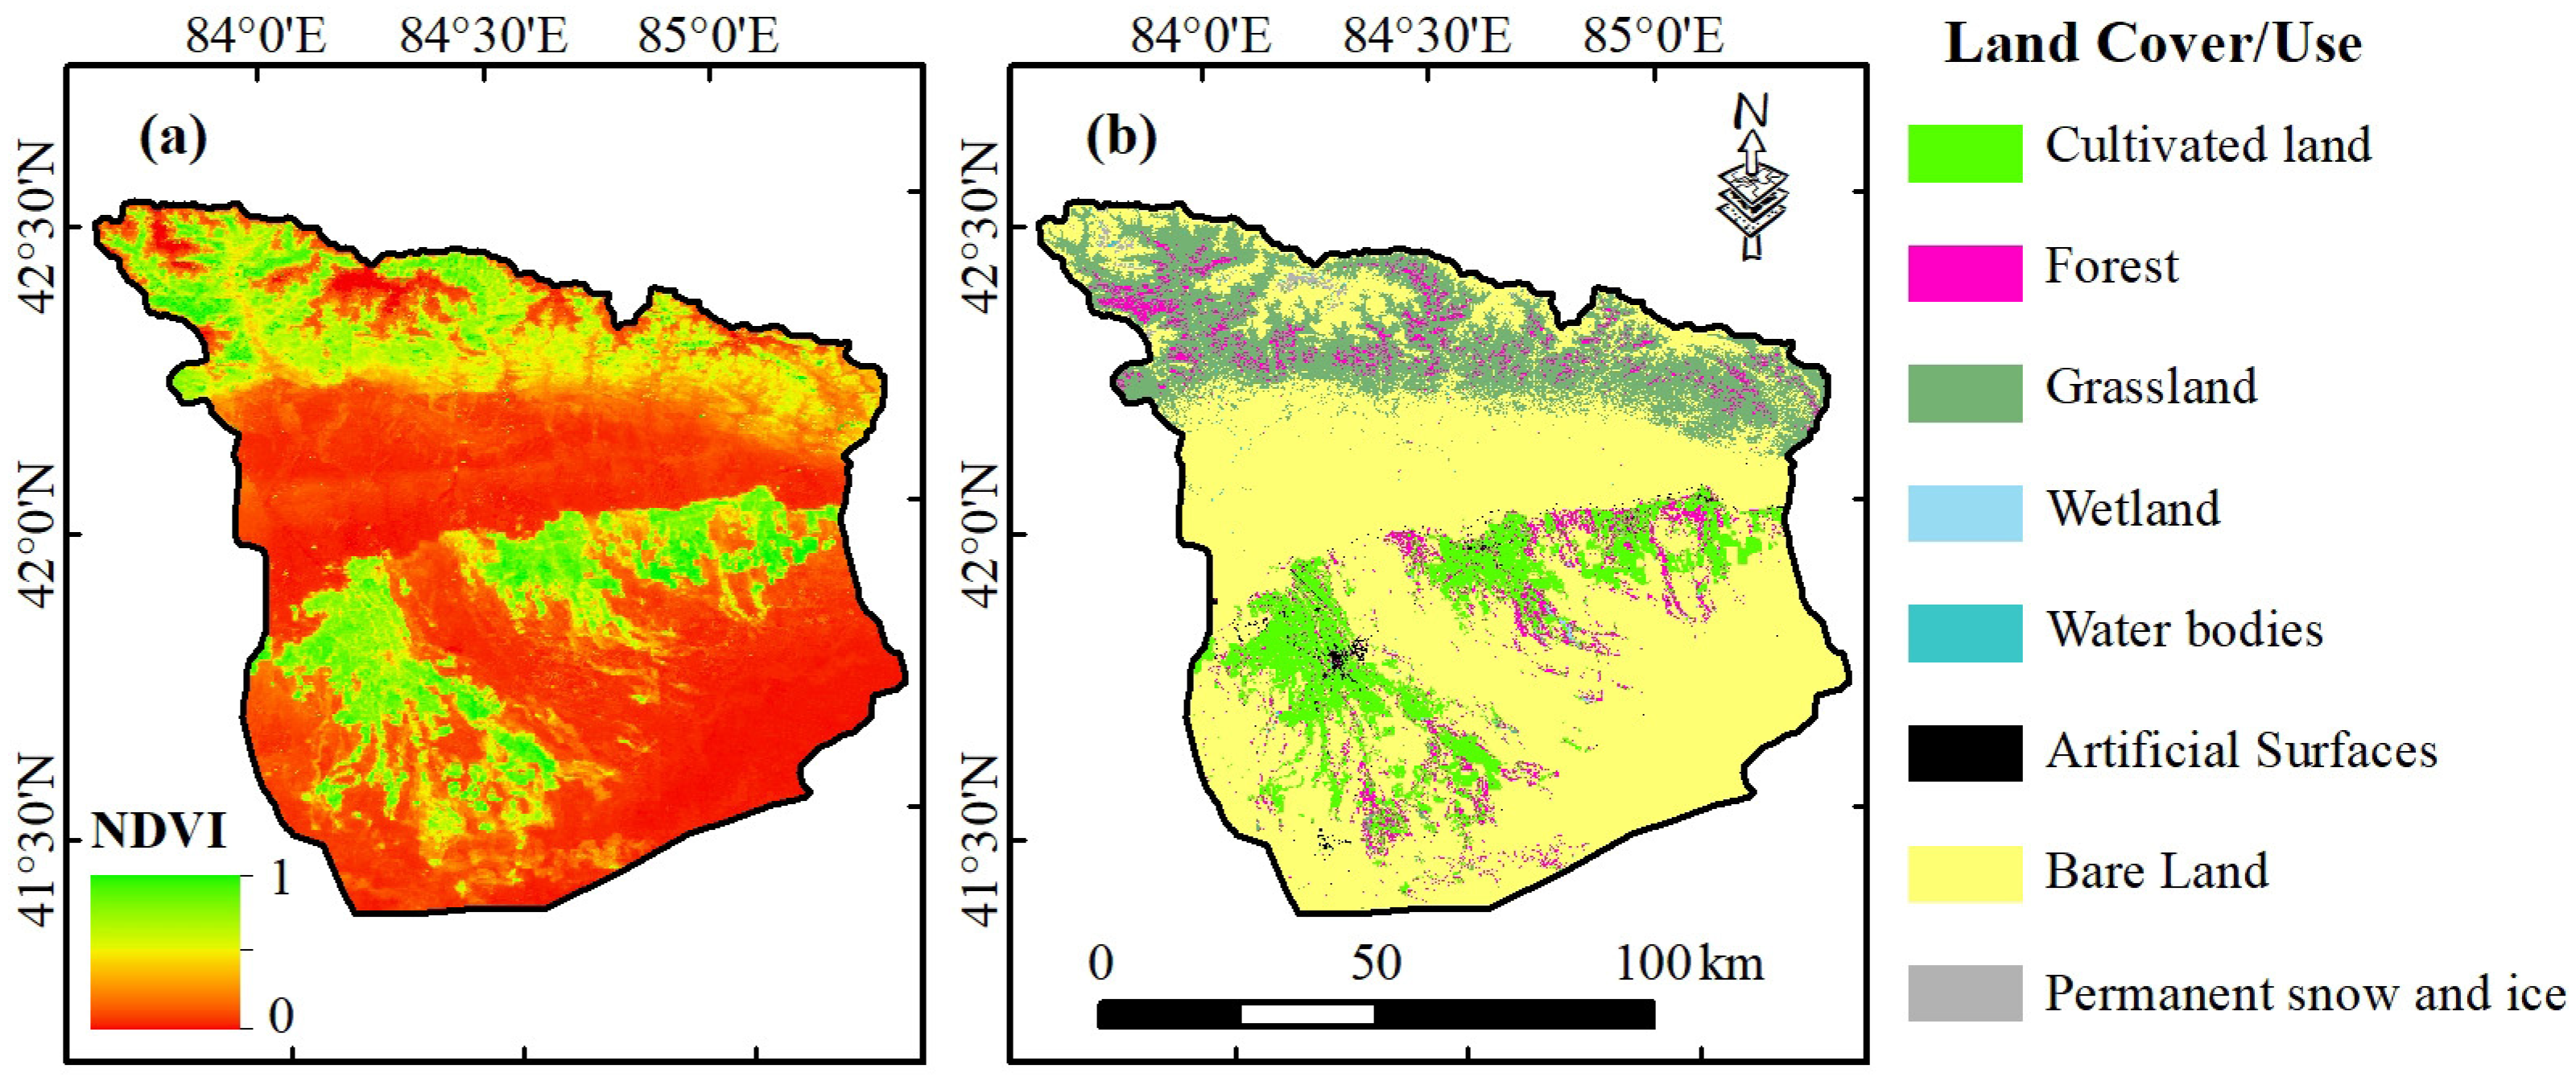
Figure 5.
δ2H vs. δ18O for surface water and groundwater in the oasis–desert region of the Dina River Basin. The isotopic data of precipitation were from Wang et al. [42] for Luntai county. GMWL, global meteoric water line.
Figure 5.
δ2H vs. δ18O for surface water and groundwater in the oasis–desert region of the Dina River Basin. The isotopic data of precipitation were from Wang et al. [42] for Luntai county. GMWL, global meteoric water line.
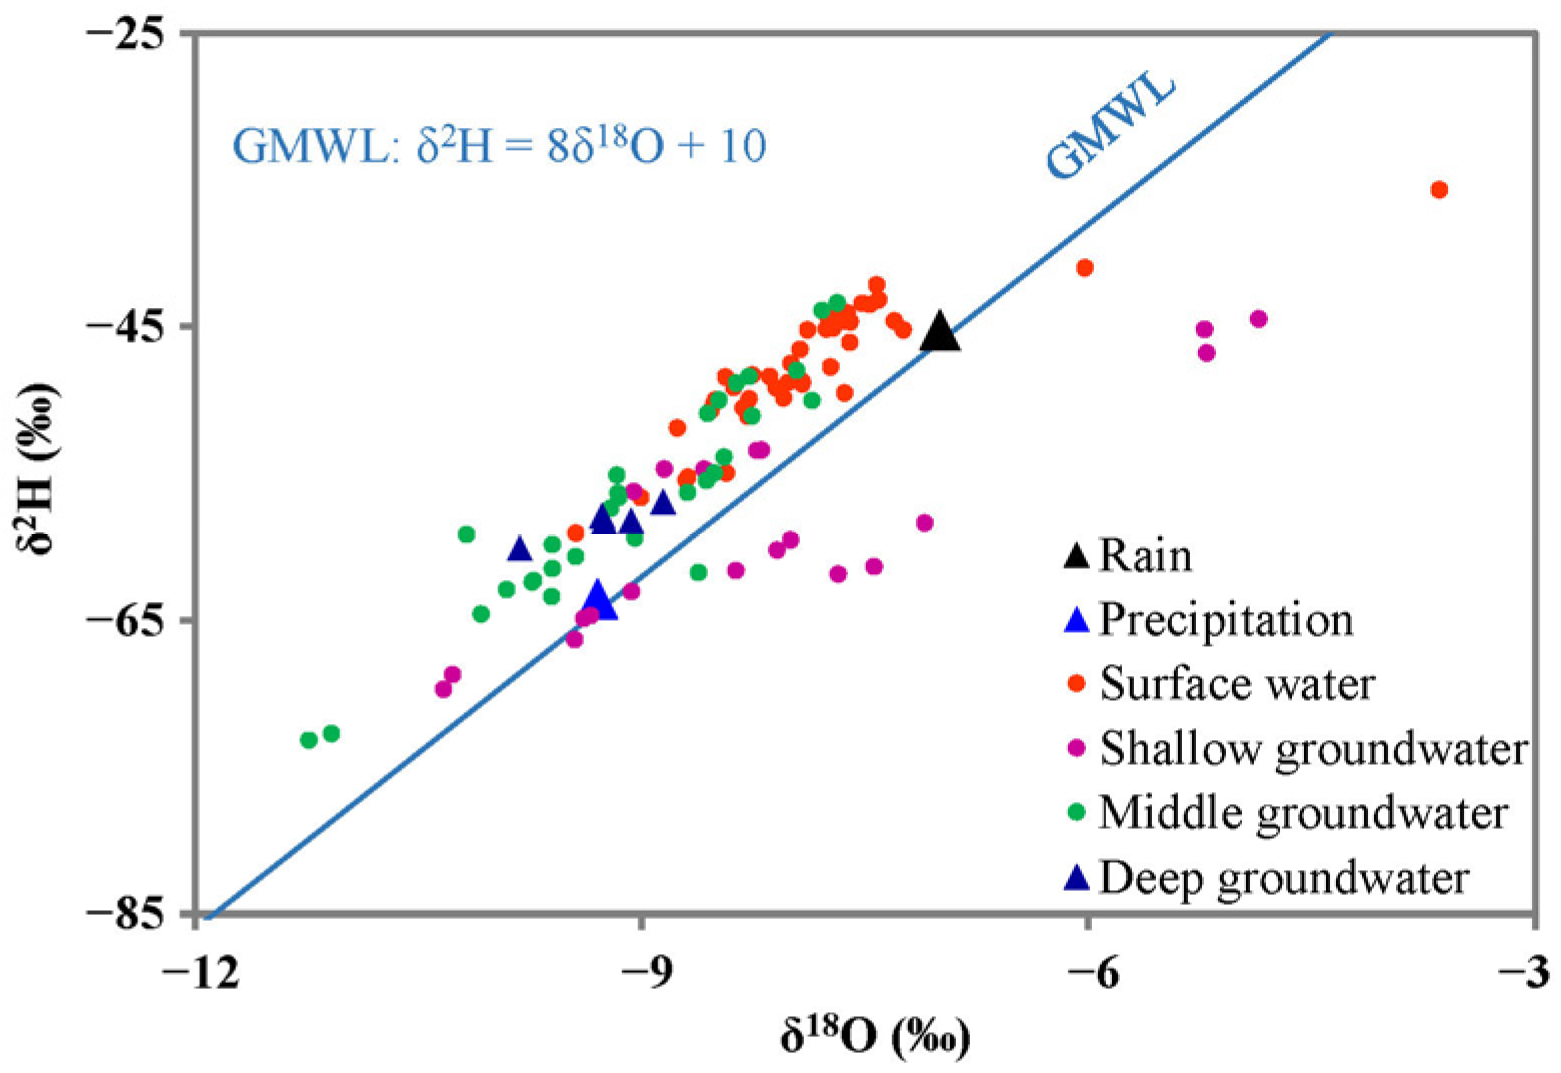
Figure 6.
Variations in TDS (a), Cl− (b) and δ18O (c) for surface water and groundwater in flood season and non-flood season.
Figure 6.
Variations in TDS (a), Cl− (b) and δ18O (c) for surface water and groundwater in flood season and non-flood season.
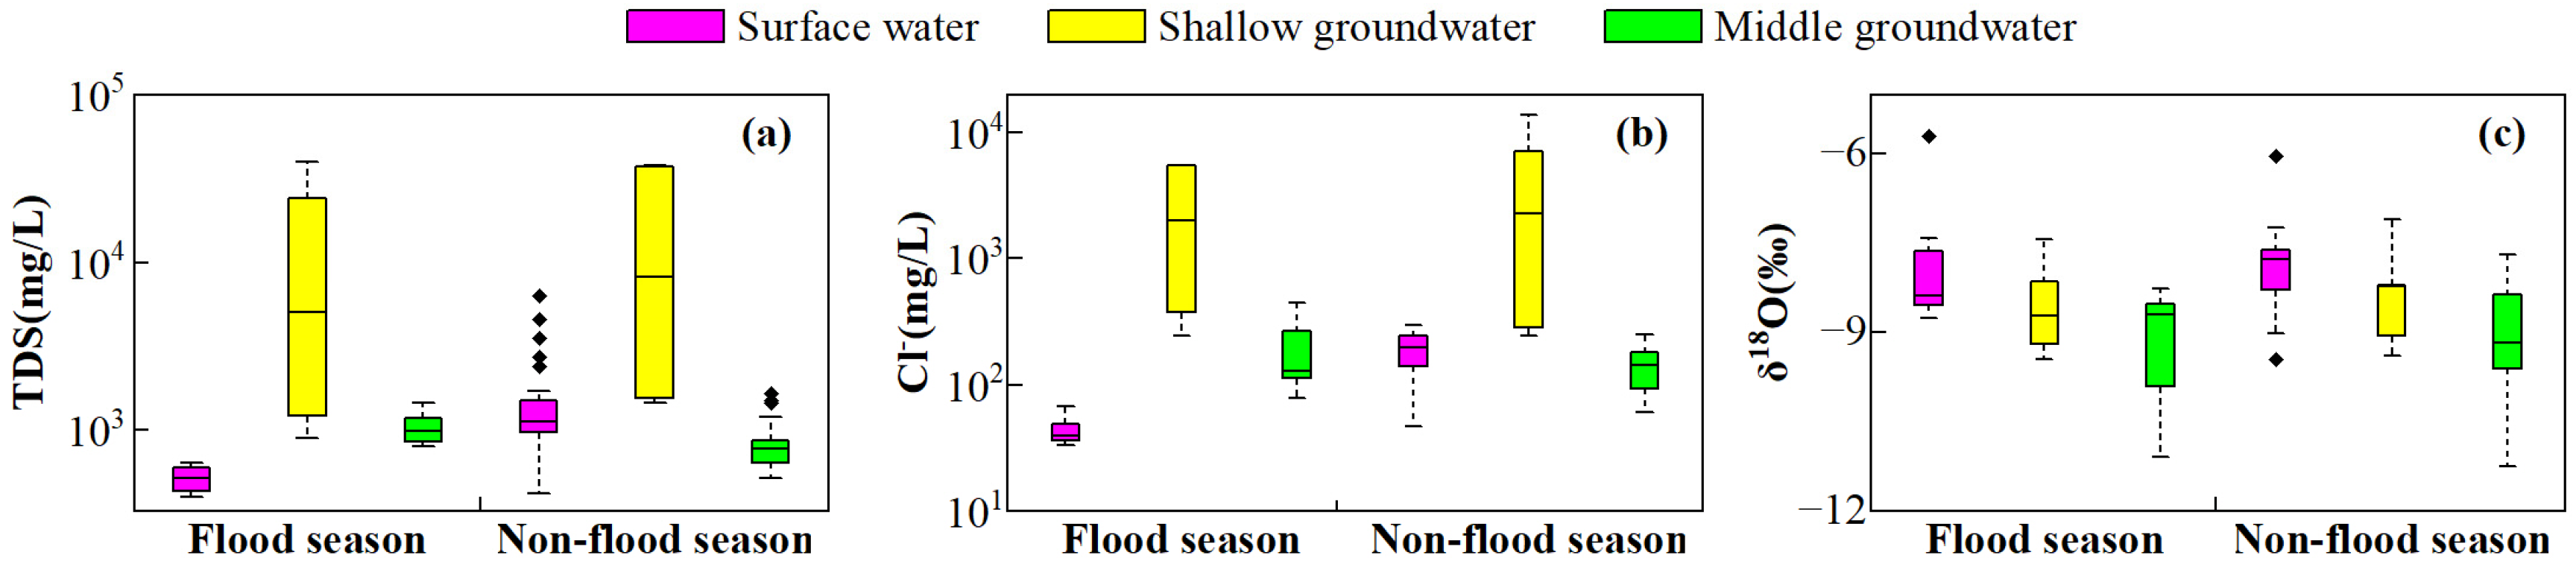
Figure 7.
Spatial distributions of Na+ + K+ (a), Ca2+ (b), Mg2+ (c), Cl− (d), SO42− (e), and HCO3− (f) for surface water in the Dina River Basin’s oasis–desert area.
Figure 7.
Spatial distributions of Na+ + K+ (a), Ca2+ (b), Mg2+ (c), Cl− (d), SO42− (e), and HCO3− (f) for surface water in the Dina River Basin’s oasis–desert area.
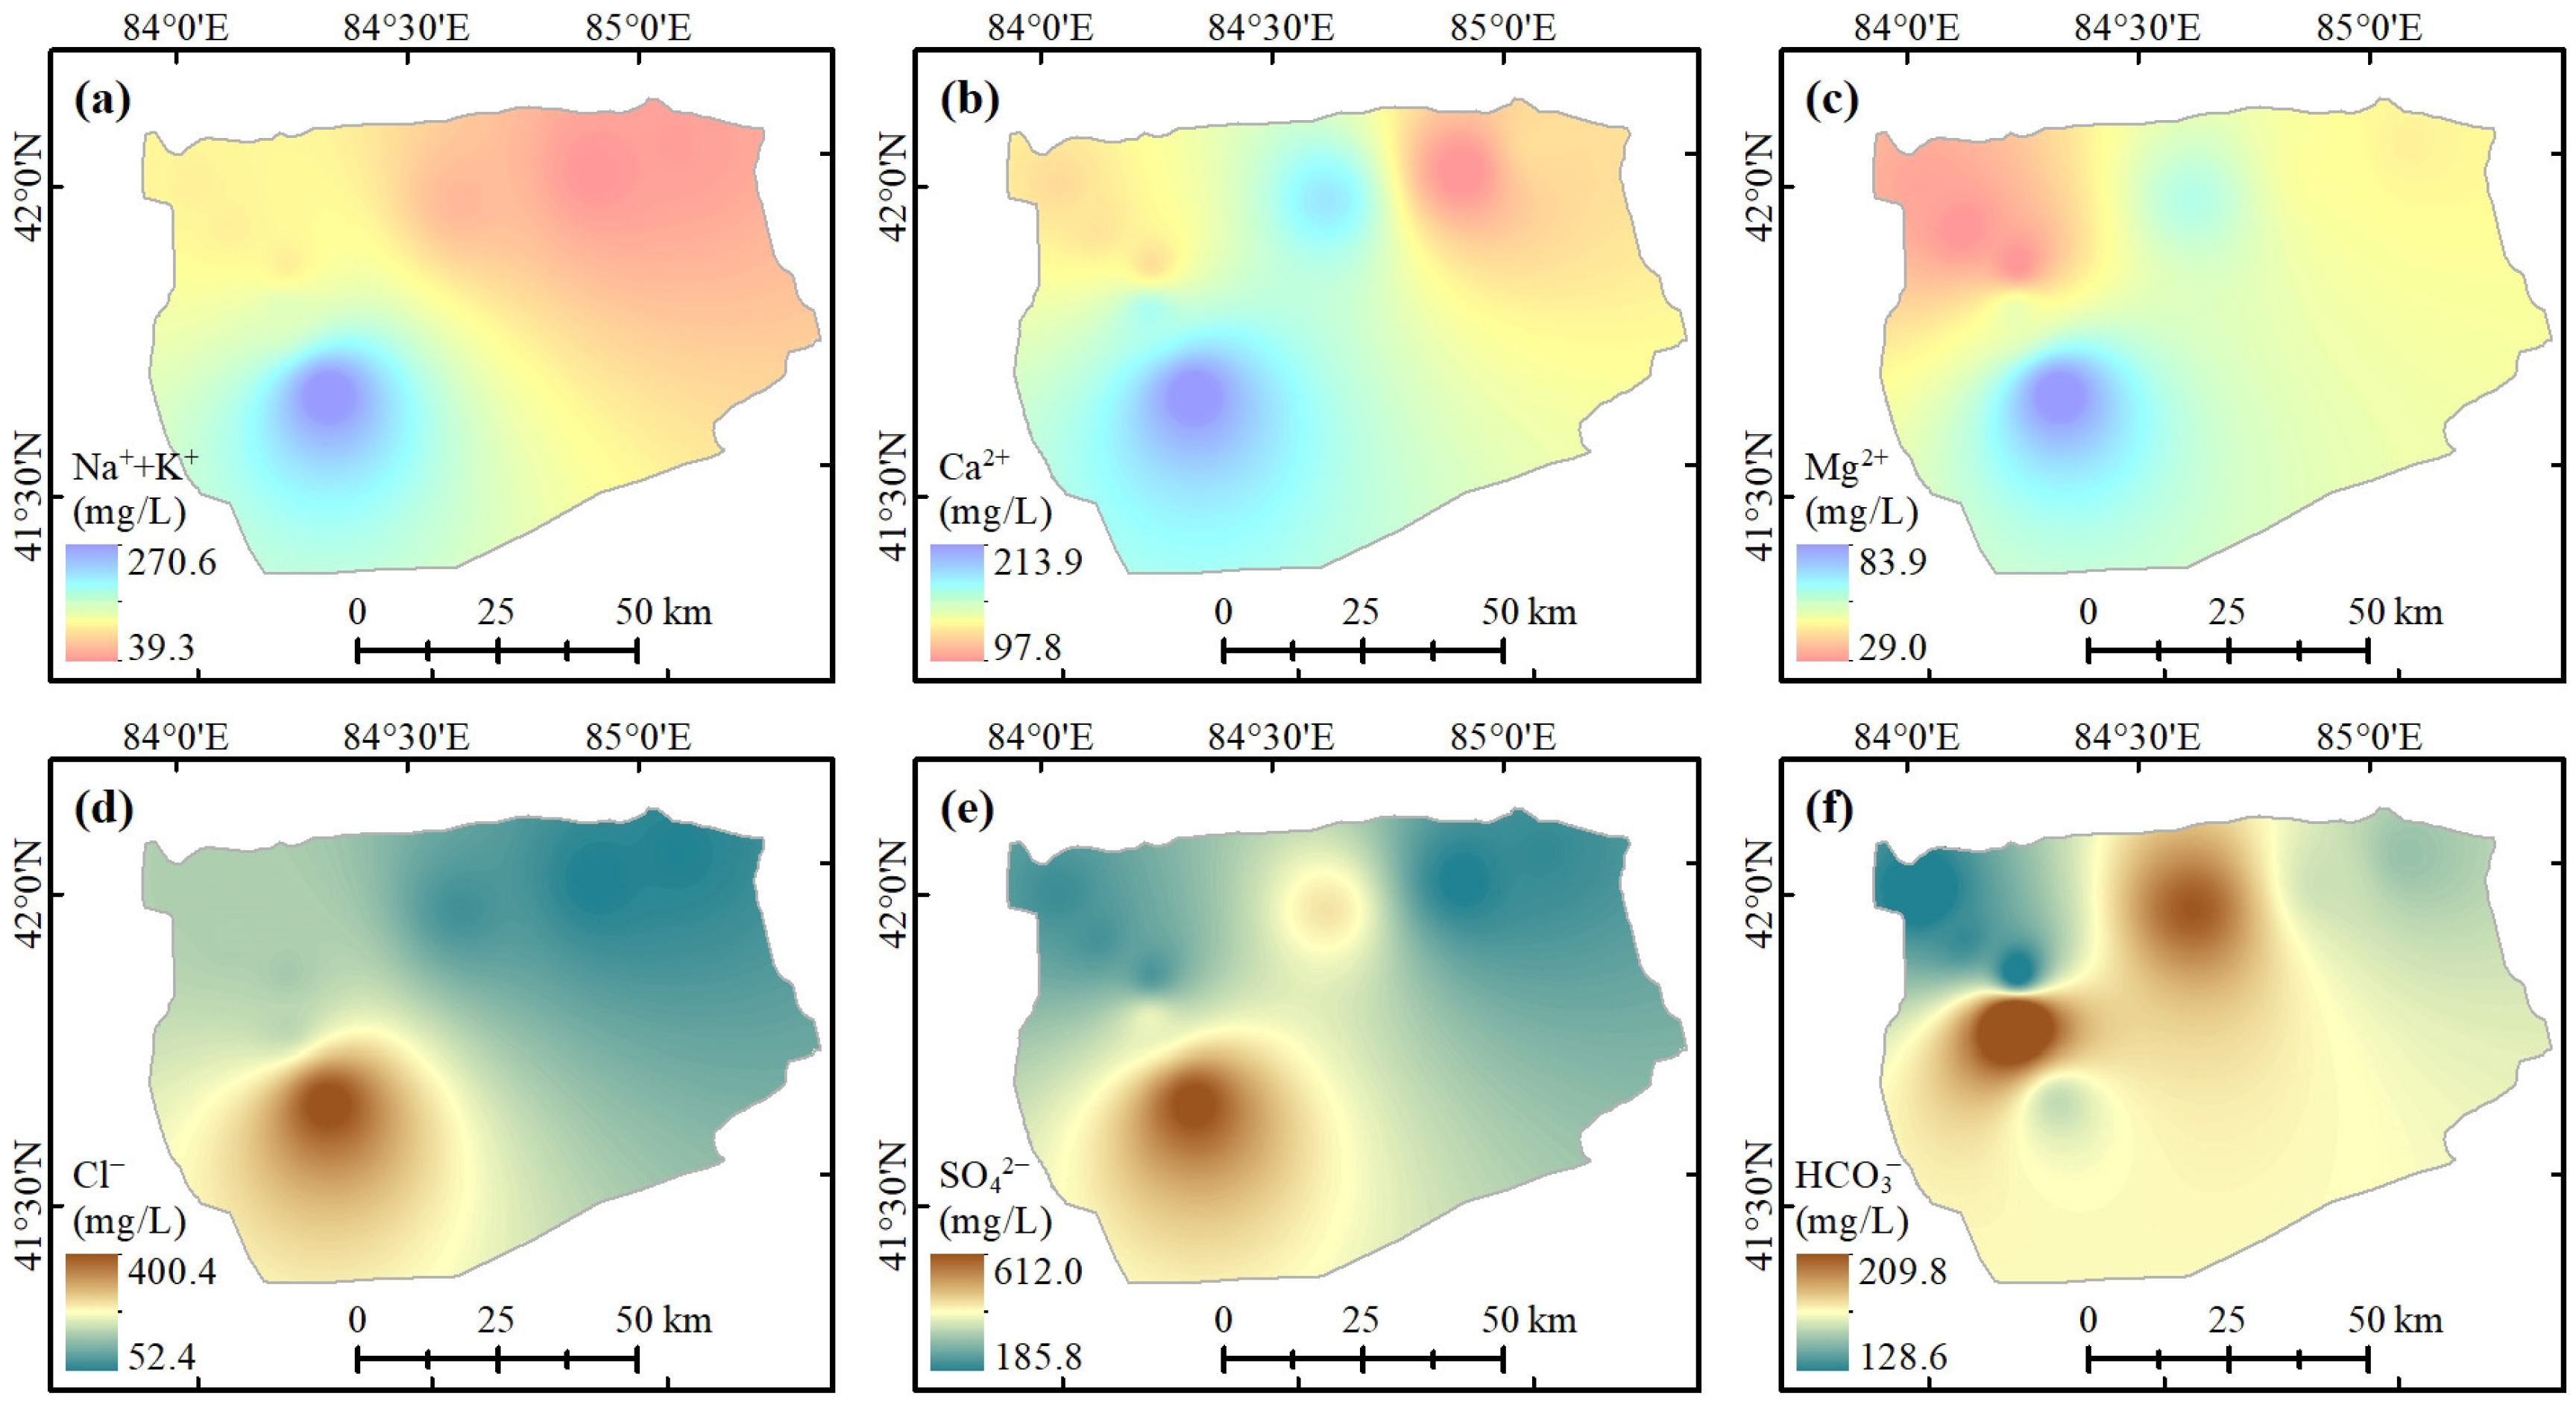
Figure 8.
Spatial distributions of Na+ + K+ (a), Ca2+ (b), Mg2+ (c), Cl− (d), SO42− (e), and HCO3− (f) for shallow groundwater in the Dina River Basin’s oasis–desert area.
Figure 8.
Spatial distributions of Na+ + K+ (a), Ca2+ (b), Mg2+ (c), Cl− (d), SO42− (e), and HCO3− (f) for shallow groundwater in the Dina River Basin’s oasis–desert area.
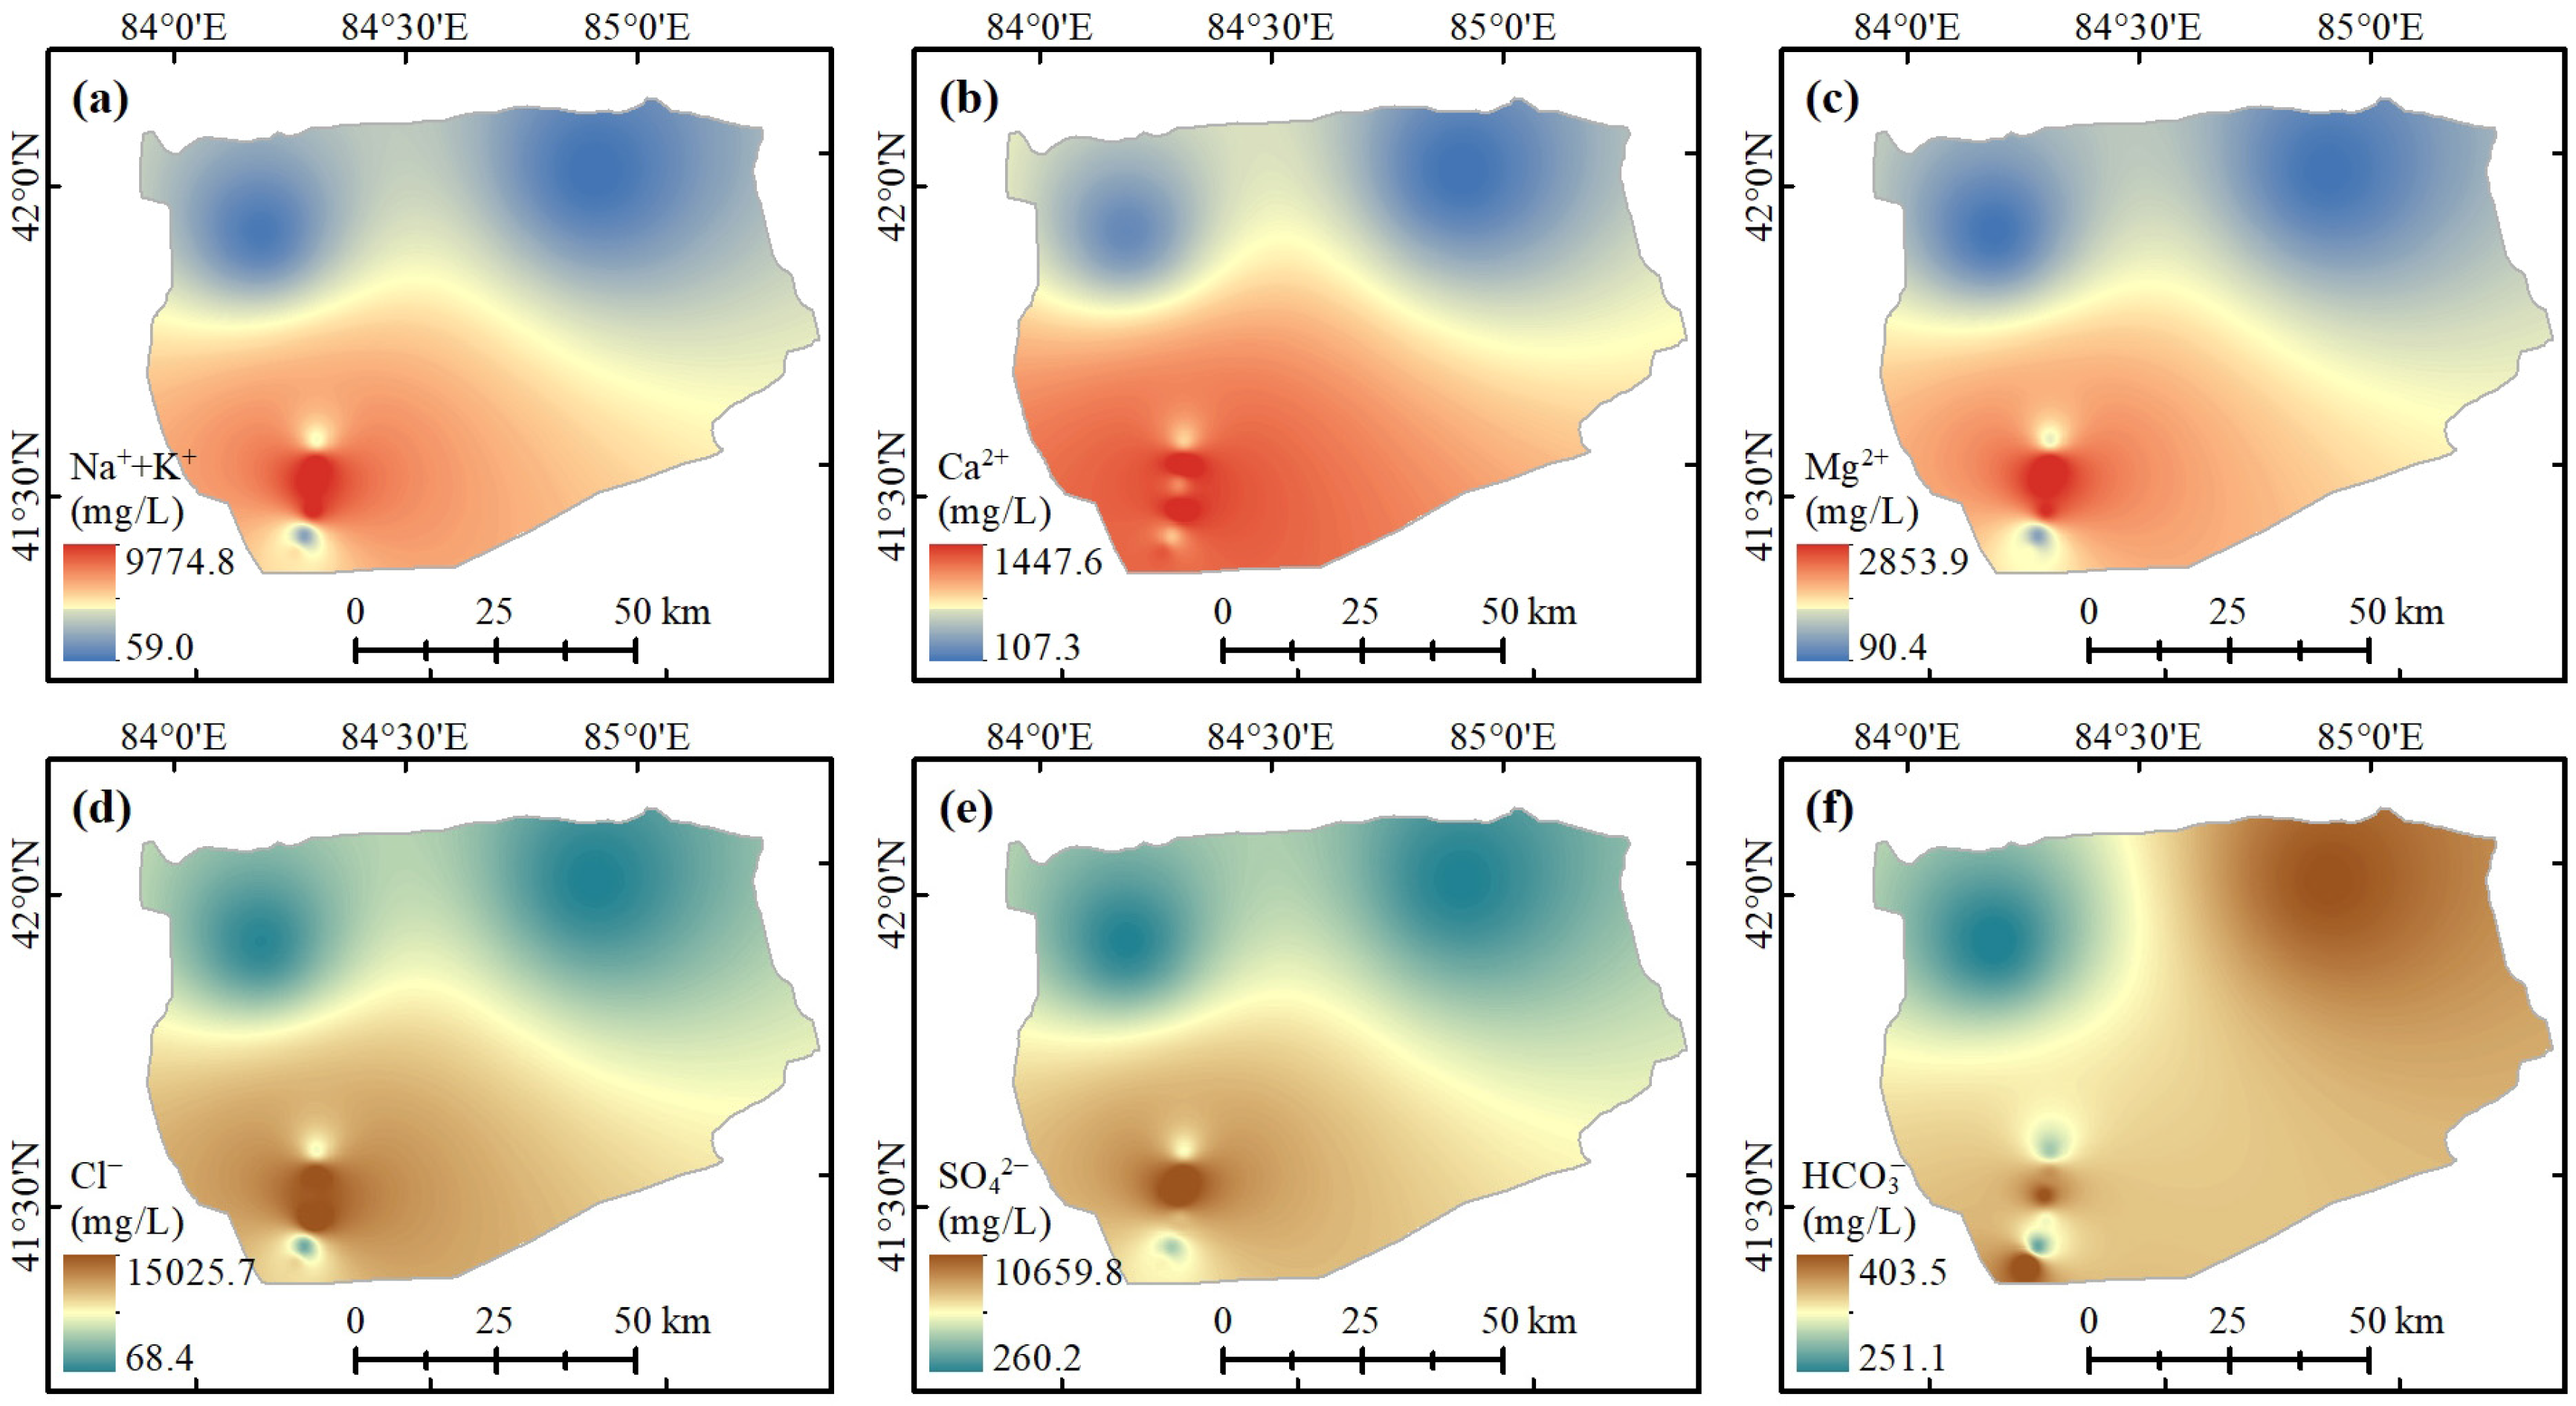
Figure 9.
Variation characteristics of the monthly mean DGL, NDVI, and the δ18O and TDS values of groundwater for the 6 monitoring wells (D1–D6) from 2018 to 2021.
Figure 9.
Variation characteristics of the monthly mean DGL, NDVI, and the δ18O and TDS values of groundwater for the 6 monitoring wells (D1–D6) from 2018 to 2021.
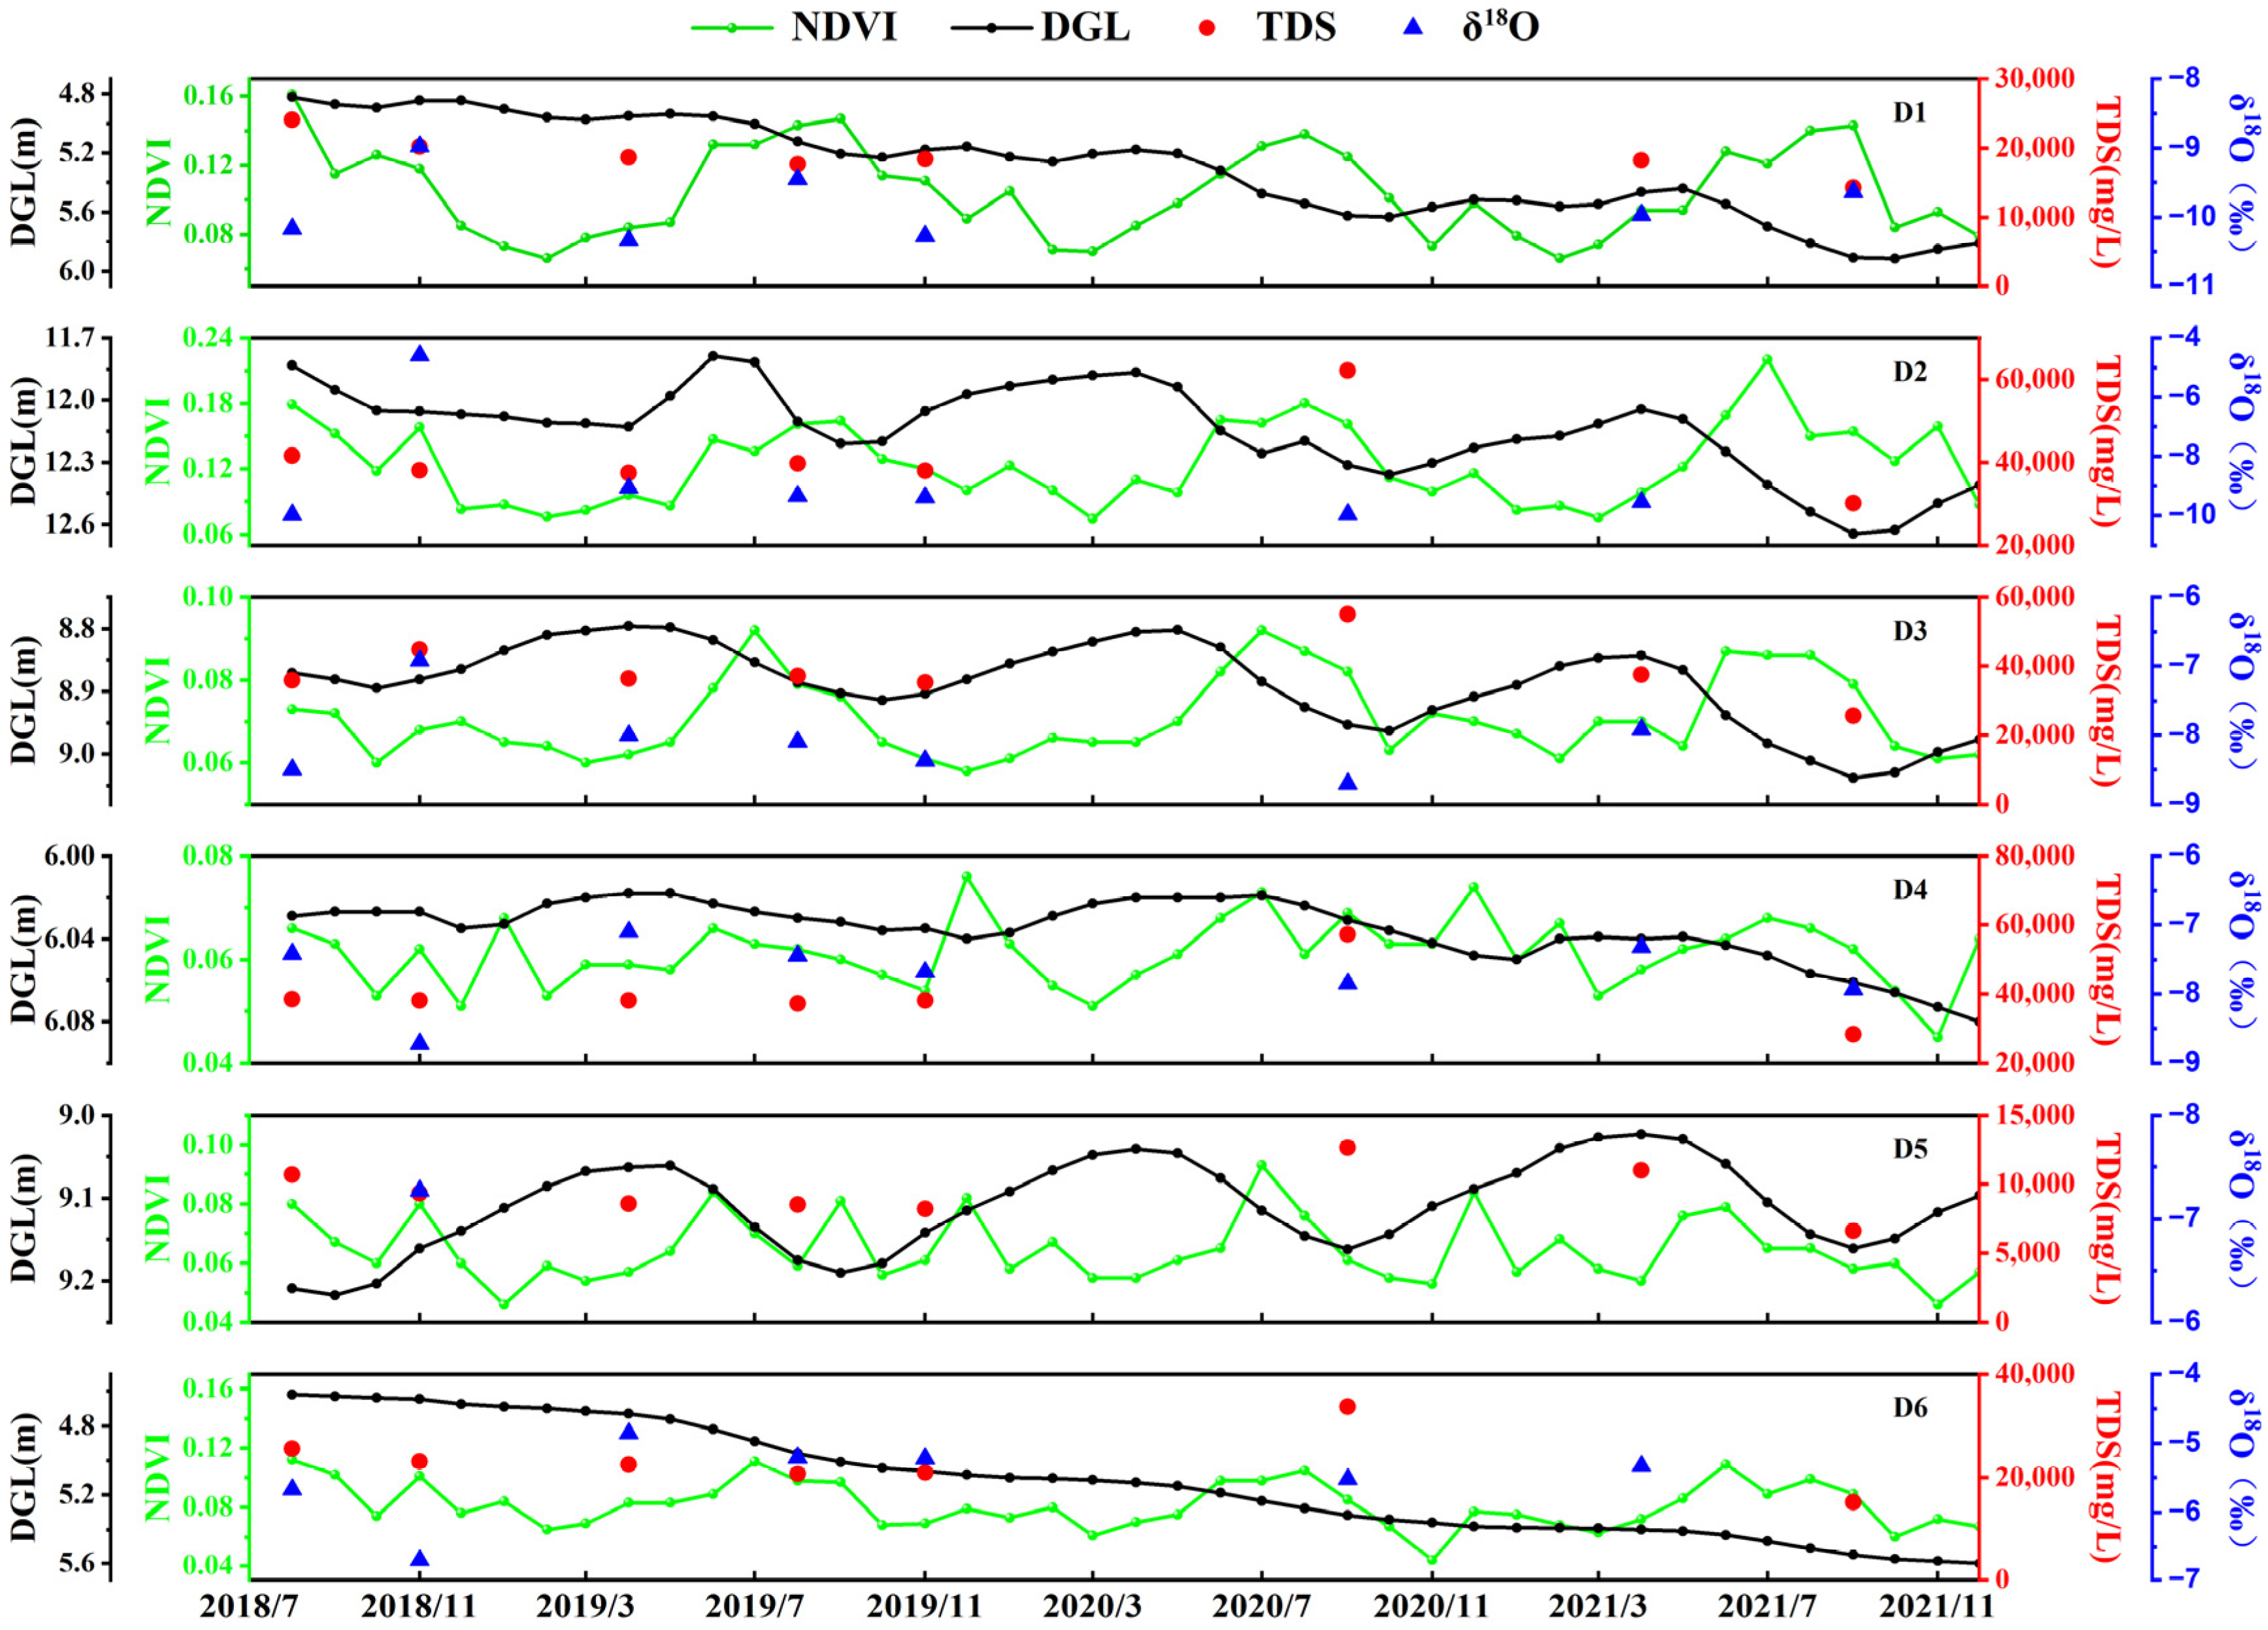
Figure 10.
Mixing diagrams of Na-normalized ratios in surface water and groundwater in the oasis–desert area of the Dina River Basin: (a) Ca2+/Na+ versus Mg2+/Na+, and (b) Ca2+/Na+ versus HCO3−/Na+.
Figure 10.
Mixing diagrams of Na-normalized ratios in surface water and groundwater in the oasis–desert area of the Dina River Basin: (a) Ca2+/Na+ versus Mg2+/Na+, and (b) Ca2+/Na+ versus HCO3−/Na+.
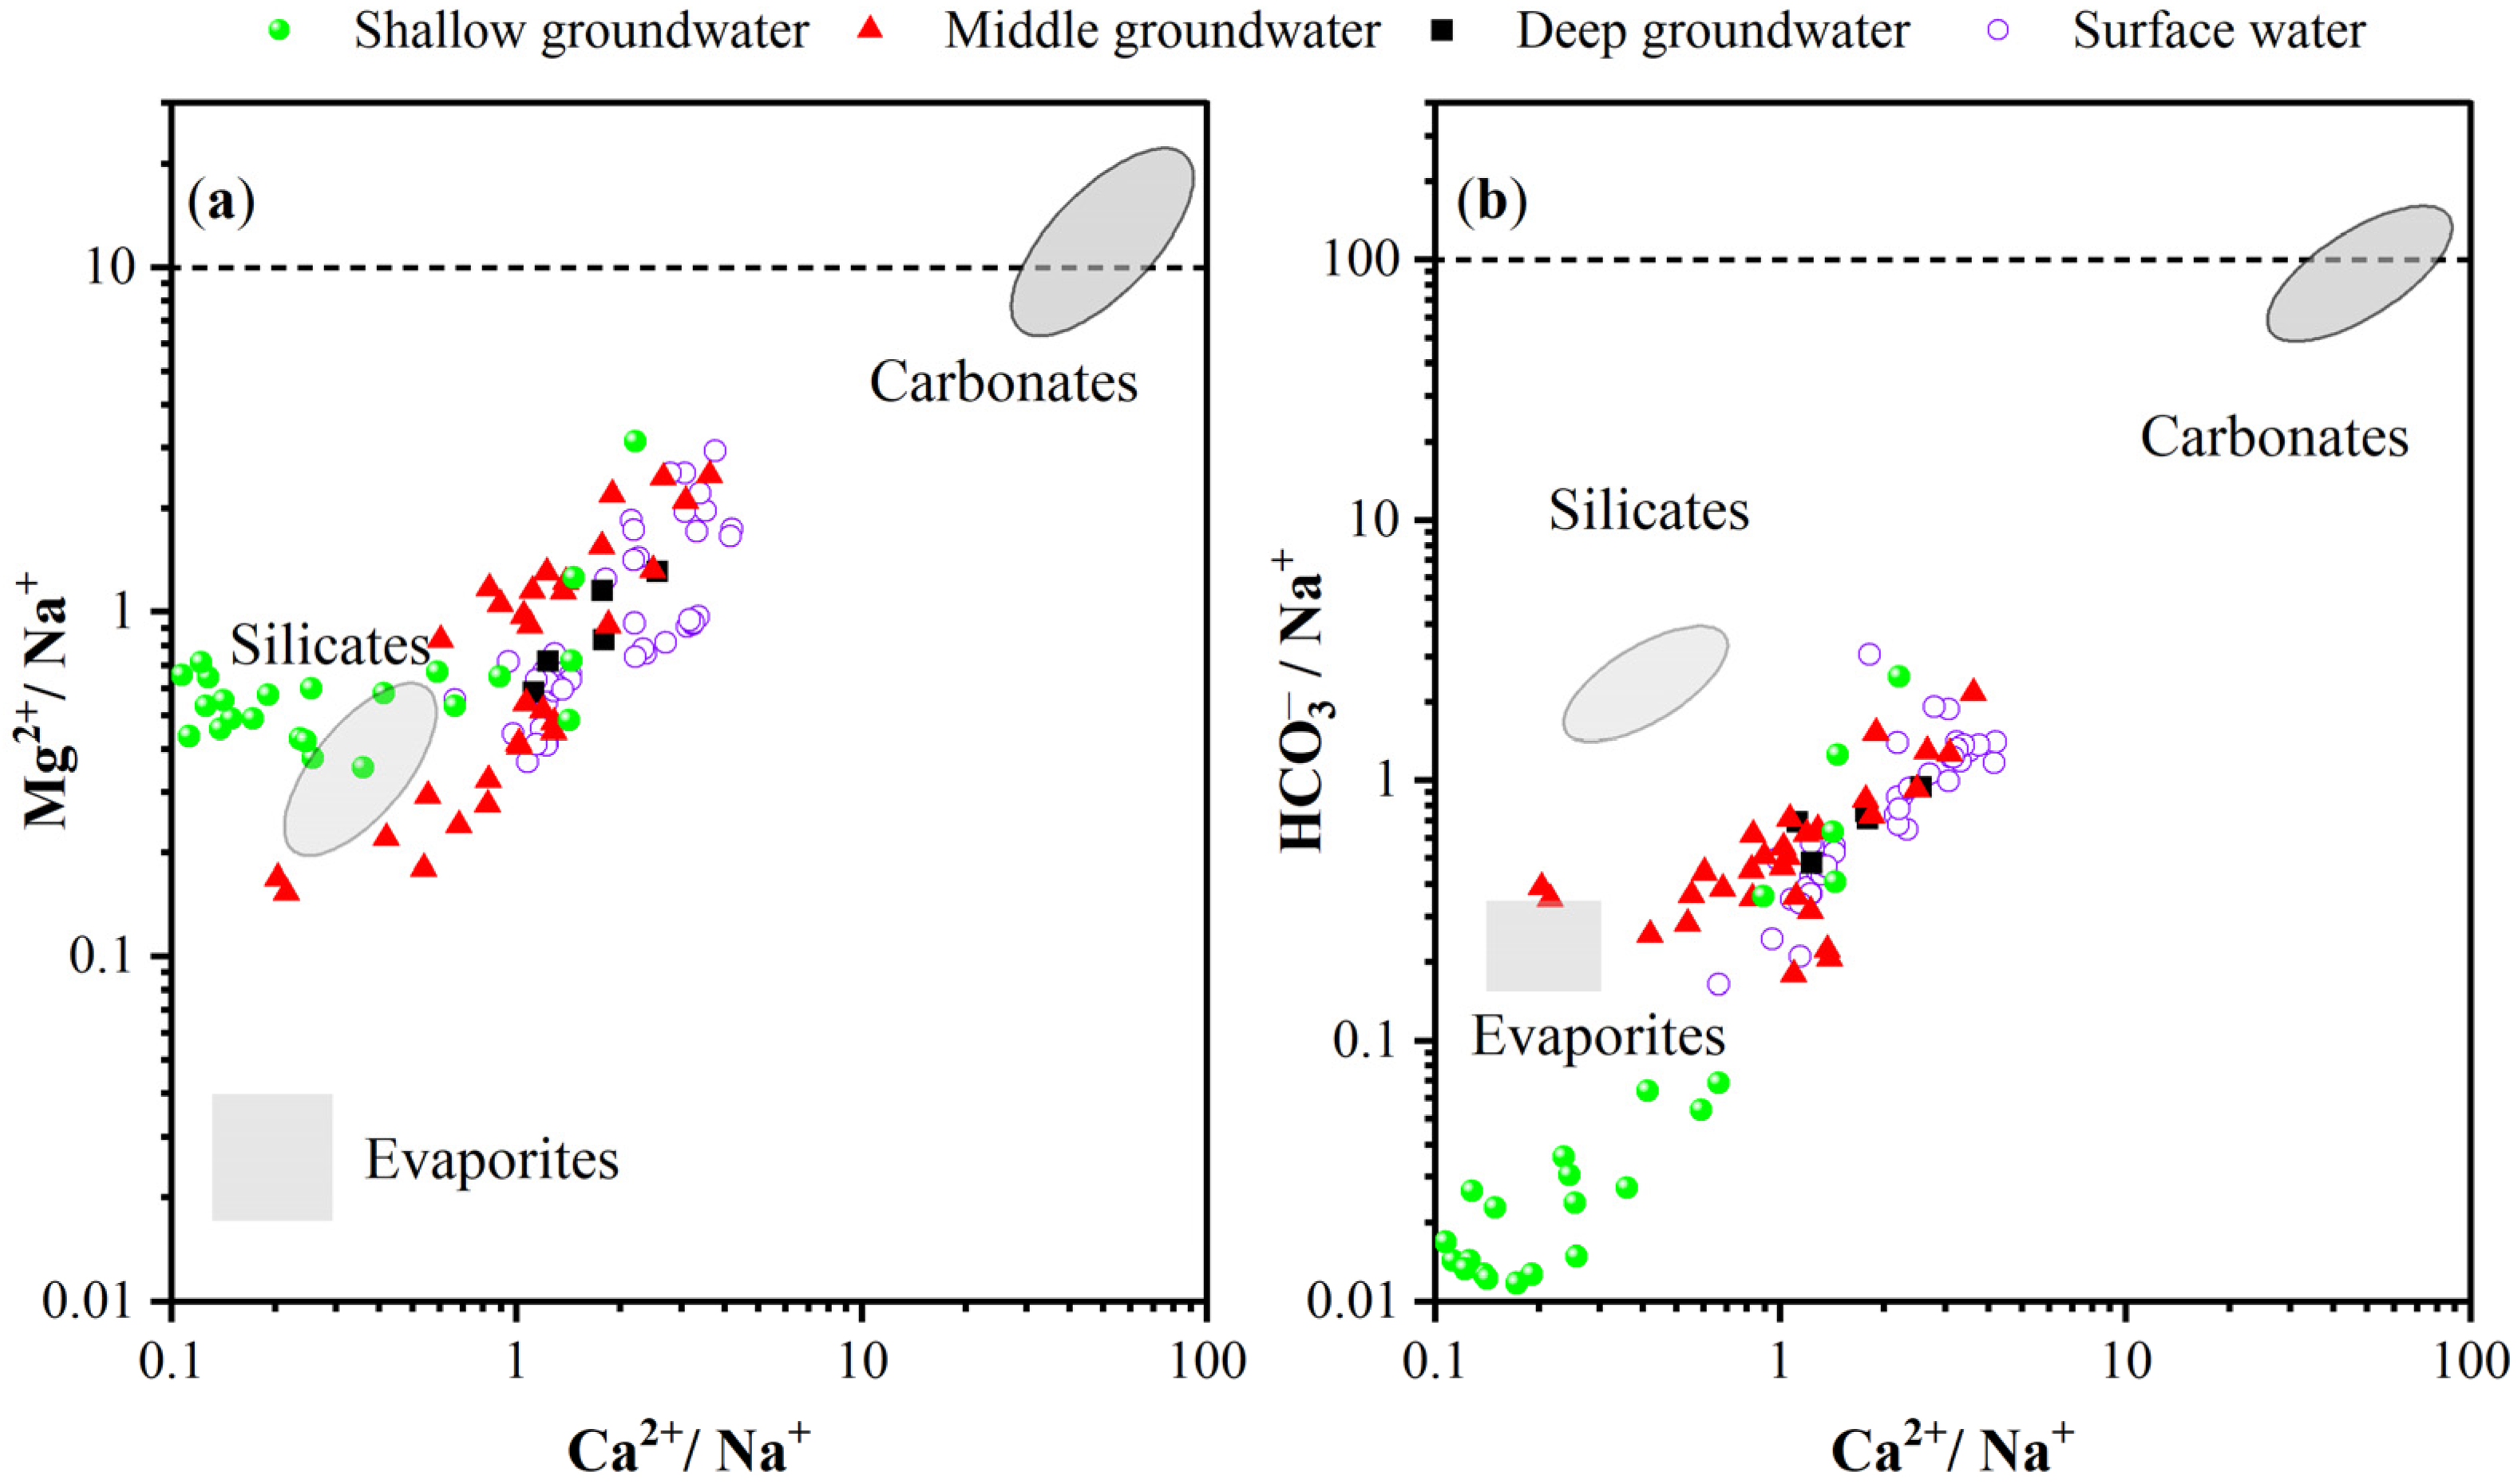
Figure 11.
Pearson’s correlation coefficients between hydrochemical parameters for groundwater samples in the Dina River Basin’s oasis–desert area. * Correlation was significant at the 0.05 level (p ≤ 0.05).
Figure 11.
Pearson’s correlation coefficients between hydrochemical parameters for groundwater samples in the Dina River Basin’s oasis–desert area. * Correlation was significant at the 0.05 level (p ≤ 0.05).
Disclaimer/Publisher’s Note: The statements, opinions and data contained in all publications are solely those of the individual author(s) and contributor(s) and not of MDPI and/or the editor(s). MDPI and/or the editor(s) disclaim responsibility for any injury to people or property resulting from any ideas, methods, instructions or products referred to in the content. |
© 2024 by the authors. Licensee MDPI, Basel, Switzerland. This article is an open access article distributed under the terms and conditions of the Creative Commons Attribution (CC BY) license (https://creativecommons.org/licenses/by/4.0/).
Share and Cite
MDPI and ACS Style
Yao, Y.; Tu, C.; Hu, G.; Zhang, Y.; Cao, H.; Wang, W.; Wang, W. Groundwater Hydrochemistry and Recharge Process Impacted by Human Activities in an Oasis–Desert in Central Asia. Water 2024, 16, 763. https://doi.org/10.3390/w16050763
AMA Style
Yao Y, Tu C, Hu G, Zhang Y, Cao H, Wang W, Wang W. Groundwater Hydrochemistry and Recharge Process Impacted by Human Activities in an Oasis–Desert in Central Asia. Water. 2024; 16(5):763. https://doi.org/10.3390/w16050763
Chicago/Turabian StyleYao, Yuan, Chenwei Tu, Gaojia Hu, Yuhan Zhang, Hanyuan Cao, Wanrui Wang, and Weihua Wang. 2024. "Groundwater Hydrochemistry and Recharge Process Impacted by Human Activities in an Oasis–Desert in Central Asia" Water 16, no. 5: 763. https://doi.org/10.3390/w16050763
Note that from the first issue of 2016, this journal uses article numbers instead of page numbers. See further details here.