
Comprehensive Risk Assessment Framework for Flash Floods in China
1
Research Center on Flood and Drought Disaster Reduction of the Ministry of Water Resources, China Institute of Water Resources and Hydropower Research, Beijing 100038, China
2
School of Water Resources and Environment, China University of Geosciences (Beijing), Beijing 100083, China
3
Beijing China Institute of Water Resources and Hydropower Research Corporation, Beijing 100044, China
4
School of Geographic and Environmental Sciences, Tianjin Normal University, Tianjin 300387, China
*
Author to whom correspondence should be addressed.
†
Co-first author: Yu Li.
Water 2024, 16(4), 616; https://doi.org/10.3390/w16040616
Submission received: 11 December 2023
/
Revised: 14 January 2024
/
Accepted: 19 January 2024
/
Published: 19 February 2024
(This article belongs to the Special Issue Advances in Flood and Drought Disaster Forecasting and Early Warnings through Integrating Hydrological and Hydrodynamic Models)
Abstract
:Accurately assessing the risk of flash floods is a fundamental prerequisite for defending against flash flood disasters. The existing methods for assessing flash flood risk are constrained by unclear key factors and challenges in elucidating disaster mechanisms, resulting in less-than-ideal early warning effectiveness. This article is based on official statistics of flash flood disaster data from 2017 to 2021. It selects eight categories of driving factors influencing flash floods, such as rainfall, underlying surface conditions, and human activities. Subsequently, a geographical detector is utilized to analyze the explanatory power of each driving factor in flash flood disasters, quantifying the contribution of each factor to the initiation of flash flood; the flash flood potential index (FFPI) was introduced to assess the risk of flash flood disasters in China, leading to the construction of a comprehensive assessment framework for flash flood risk. The results indicate that (1) Flash floods are generally triggered by multiple factors, with rainfall being the most influential factor, directly causing flash floods. Soil type is the second most influential factor, and the combined effects of multiple factors intensify the risk of flash floods. (2) The southeastern, southern, and southwestern regions of China are considered high-risk areas for flash floods, with a high danger level, whereas the northwestern, northern, and northeastern plain regions exhibit a lower danger level. The above research results provide reference and guidance for the prevention and control of flash flood disasters.
1. Introduction
Flash floods are surface runoff events in mountainous watersheds caused by short-duration heavy rainfall. These events are characterized by their suddenness, destructiveness, and rapid rise and fall in surface runoff, often triggering disasters such as landslides and debris flows. In recent years, the frequency of extreme weather events worldwide has increased significantly [1]. Coupled with rapid population growth and extensive urbanization, the interaction of factors such as precipitation, underlying surface conditions, and human activities has contributed to floods, which are among the high-frequency natural disasters. Both the affected populations and economic losses caused by floods rank among the highest globally. For instance, in April 2022, South Africa experienced floods and landslides caused by heavy rainfall, resulting in over 500 fatalities. On 8 August 2023, severe flooding in Beijing led to the death or disappearance of more than 50 people. In late October 2023, flooding in Kenya claimed the lives of 154 people [2]. To address flash flood disasters, international organizations such as the World Meteorological Organization (WMO), the Global Water Partnership (GWP), the International Association of Hydrological Sciences (IAHS), the International Association for Hydro-Environment Engineering and Research (IAHR), and the National Oceanic and Atmospheric Administration (NOAA) have increased their attention and research efforts on flash flood disasters. China has established a comprehensive defense system against flash flood disasters, combining professional prevention with community-based monitoring and defense [3]. This system has achieved significant success in practical defense. However, due to the complexity of flash flood disasters, involving various hydrological processes and nonlinearities, unclear disaster mechanisms, numerous influencing factors, and limited available data, the key technology research on flash flood risk assessment is still in its early stages and technological exploration. Taking into account the lack of a universally recognized scientific method for flash flood risk assessment in existing domestic and international research, this study focuses on the driving factors of flash flood disasters in China and conducts a risk assessment to understand the regional differences in the flash flood occurrence. Taking into account the lack of universally recognized scientific methods for assessing flash flood risks in existing domestic and international research, this study focuses on investigating the driving factors of flash flood disasters in China. It conducts a risk assessment to understand regional differences in flash flood occurrence. The goal is to provide theoretical references and insights from an adaptive perspective for flash flood prevention in China.
In recent years, domestic and international research on flash flood disasters has primarily focused on three aspects: First is research on flash flood warnings based on hydrological models [4,5]. Ngoc et al. [6] proposed combining the particle swarm optimization algorithm with deep learning to enhance the performance of segmenting flash floods from satellite images, thereby optimizing flood warning systems. Surwase et al. [7] employed multiple segmentation and Otsu’s threshold segmentation techniques to validate flood footprints, thereby improving warning accuracy. Liu et al. [8], after analyzing the impact of sediment on disaster risk, integrated watershed sediment yield models and monitoring technologies, selecting different warning indicators and thresholds for runoff and sediment risks. The second aspect is the analysis of disaster distribution characteristics and causes [9,10,11]. Zhang et al. [12], based on the results of historical investigations into flash flood disasters, analyzed the spatial variation patterns of flash floods in Chongqing. They utilized a geodetector to categorize the changes in flash flood disasters into three stages. Chen et al. [13] discovered that the mid-lower reaches of low hills and plains are more prone to flash flood disasters than the upstream mountainous areas. The third aspect primarily involves flash flood risk assessment and risk zoning [14,15,16]. This is mainly based on factors such as precipitation, elevation, slope, etc., with quantification of their contributions to flash flood risk. Sanyal et al. [17] proposed a comprehensive multi-factor index using GIS to create flood risk maps. Bhatt et al. [18] utilized satellite data, coupled with ArcGIS 10.8 technology, to systematically identify high-risk flash flood areas. Moiaddadi [19] introduced a flood risk probability index, validated its effectiveness along highways, and obtained a flood risk map based on vulnerability weights. Tang et al. [20] conducted an analysis and overlay evaluation of flash flood impact factors, resulting in a flash flood risk zoning map. Huang et al. [21], by constructing a flash flood risk assessment model, identified high-risk aggregation areas in the study area. Yang et al. [22] found that the coefficient of variation analysis indicates that with the occurrence of landslides, the frequency distribution of slope becomes more dispersed, while aspect and TWI become more concentrated. Zhou et al. [23] proposed a method that combines transient rainfall infiltration and the transient rainfall infiltration and grid-based regional slope stability (TRIGRS) model, along with the rapid mass movement simulation (RAMMS) model, to achieve hourly disaster prediction. Ma et al. [24] verified that ecological vulnerability in mining areas is a key factor in exploring the development characteristics and destructive mechanisms of various surface disasters. Liu et al. [25] conducted a detailed analysis of the precursors and causes of the recent Yahuokou landslide, and explored the current application status of time-series InSAR methods in landslide investigations. Wang et al. [26] investigated the spatiotemporal deformation before and after the landslide damage in the Four Gates Village of the Yellow River in 2018. They verified that both spatial deformations before and after the damage followed a progressive failure pattern. Evidently, the current focus of research is on integrating the impact factors of flash floods and different analysis methods for flash flood risk assessment.
The geographic information system (GIS) is widely applied in flash flood disaster risk assessment. Muhammad et al. [27] used geographic spatial models and the analytic hierarchy process to assess flash flood susceptibility and delineate flash flood risk zones. Hafedh [28], employing the GIS and hydrological models, simulated flood processes, revealing low to extremely high risks for floods with recurrence periods of 5, 50, and 100 years. Hewaidy [29] utilized the GIS to investigate topographical parameters, identifying high-risk zones in the study area. In China, Fang et al. [30] and Lin et al. [31] both used the GIS to study flash flood disaster risks, exploring and analyzing regions prone to frequent flash floods with severe losses. Geodetector models are mainly used to detect the importance of influencing factors and their interaction patterns, and are widely applied in economic [32], population [33], and agricultural [34] research. This model is gradually being utilized to explore the driving factors of flash flood disasters. Huang et al. [35] quantitatively analyzed the impact of various triggering factors on flash flood disasters and, using a geodetector, verified that rainfall is the direct trigger and conditioning factor for flash floods, while terrain and landforms provide the material basis and potential conditions. Li et al. [36] used a geodetector to explore the probability of flash flood disasters, finding that the maximum 6 h and 24 h rainfall in a 100-year event had the greatest impact. Yu et al. [37] revealed the driving factors of flash flood disasters at different scales and conducted a flash flood risk assessment based on a comprehensive weighting method. He et al. [38] summarized the current status of flash flood defense construction in China, investigating the characteristics of flash floods induced by heavy rainfall under the new defense situation. Liu [39] revealed the spatiotemporal evolution pattern of flash flood disasters in China since its founding, detecting the driving factors influencing the spatial distribution of historical flash flood disasters. Chen et al. [40] used a hybrid clustering method with neural networks to formulate a flash flood zoning plan for China and evaluated it using a geodetector. Bin et al. [41] studied flash flood disaster driving factors using methods such as the Mann–Kendall test and a geodetector, discovering that elevation and land use were the most critical factors, showing an upward trend over time. Clearly, flood risk assessment methods have experienced rapid development with their dependence on modern information technology.
Research on flash flood disaster risk assessment primarily focuses on exploring the probability of flash floods at the provincial or watershed scale. The weights of flash flood factors often use the analytic hierarchy process, but due to the subjective nature of this method, it significantly affects the accuracy of flash flood risk probability. Using a geodetector to calculate indicator weights can effectively address this issue. Meanwhile, the flash flood potential index (FFPI) is an established method for the operational application of flash flood risk assessment. Therefore, based on flash flood events in China from 2017 to 2021, this study first identified the influencing factors triggering flash floods. Subsequently, a geodetector was employed to explore the relationships between various factors and flash flood disasters, obtaining the weights of each influencing factor. Building upon this, this study introduced the flash flood potential index (FFPI) and constructed a comprehensive risk assessment framework for flash floods. The aim was to provide a certain reference for research on the prevention of flash floods.
2. Study Area and Materials
2.1. The Study Area
China is located in the eastern part of the Eurasian Plate, with the Bohai Sea to the east and extending deeply into the interior of the Eurasian continent to the northwest. The land area is approximately 9.6 million square kilometers. Due to its vast latitudinal span, China experiences three main climate zones: temperate, subtropical, and tropical. The terrain generally slopes from east to west in a three-tiered distribution, with mountains, plateaus, and hills covering about 67% of the land area, while basins and plains account for approximately 33%. In some regions, significant elevation variations make them prone to flash floods. China exhibits distinct and diverse climate characteristics, characterized by high temperatures and abundant rainfall during the summer months, with precipitation concentrated mainly from April to September. In contrast, winter is cold and experiences less rainfall. Influenced by monsoons, precipitation tends to be concentrated and intense, increasing the frequency of flash floods.
Flash floods have a widespread impact, with a dense distribution in the northern, central, and southwestern regions. They are particularly concentrated in the northwest of Xinjiang, the central-eastern part of Inner Mongolia, the eastern part of Qinghai, and the central-southern part of Ningxia. Flash flood disasters are also widely distributed in Yunnan Province and Sichuan Province, with a significant number of occurrences in Chongqing, Hubei, etc. Overall, the distribution of flash floods shows a pattern of fewer occurrences in the west, more in the east, fewer in the north, and more in the south. In terms of topography, these disasters are mainly concentrated on the second-tier terraces in China. There is also a certain number of flash floods distributed in the transitional zones between terraces, exhibiting a belt-shaped and patchy distribution pattern according to the topography and terrain. For specific details, please refer to Figure 1. The red triangles represent individual flash flood events and they are geolocated on the map based on the latitude and longitude of the occurrence of flash flood disasters. This mapping process was conducted using ArcGIS.
2.2. Basic Data
This study initially categorizes factors influencing flash floods into natural and social factors. Eight specific factors, including precipitation, elevation, terrain type, population density, etc., are selected for analysis, as detailed in Table 1. ArcGIS is employed for preprocessing the foundational data. This involves rasterization, projection transformation, and resampling to obtain raster layers with the same coordinate system, specifically WGS_1984_UTM_Zone_49N. Precipitation data are sourced from the National Tibetan Plateau Data Center, while flash flood data are obtained from authoritative sources such as the “China Water and Drought Disaster Bulletin” and direct disaster reports. Other data are sourced from the Resource and Environment Science and Data Center. Due to the study period being from 2017 to 2021, the selected data are concentrated within this timeframe.
3. Comprehensive Risk Assessment Framework for Flash Floods in China
3.1. Building Approach for the Risk Assessment Framework of Flash Flood Disasters
This article is based on the official and authoritative statistics of historical flash flood disasters, conducting research to identify eight factors influencing flash floods, namely, rainfall, elevation, slope, landform, soil, land use, vegetation, and population density. Firstly, the occurrence locations of flash flood disasters are overlaid with influencing factors, and the natural break method in ArcGIS is used to classify these factors. Subsequently, a geodetector is employed to quantitatively analyze each factor, determining their explanatory power for flash floods, which serves as the basis for calculating the weights of influencing factors. Secondly, considering the significant impact of local topography and watershed conditions on flash floods, slope, soil, vegetation, and land use types are selected as indicators for the flash flood potential index (FFPI) model. After overlay operations, the distribution of the FFPI in China is obtained. Finally, combining precipitation, elevation, landform, and population density with FFPI risk probability distribution, a comprehensive index for flash flood risk probability is constructed. Through spatial weighted overlay calculations, the comprehensive risk assessment framework for flash floods in China is proposed. The specific process is illustrated in Figure 2.
The framework includes the following main methods.
3.2. Geodetector
A geodetector is a set of statistical methods designed to detect spatial variations and reveal the driving forces behind them [42]. The fundamental idea of a geodetector is that different influencing factors lead to different outcomes for a particular event. Changes in these factors can result in the phenomenon occurring. By studying the patterns of factor variations, one can explore the relationship between the factors and the phenomenon. Moreover, these factors have explanatory power regarding the occurrence and changes in the phenomenon. One of the advantages of a geodetector is its ability to detect both numerical and qualitative data. It not only examines the explanatory power of individual factors for a specific phenomenon but also explores the results of interactions between pairs of factors. A geodetector is primarily classified into four types: differentiation and factor detection, interaction detection, risk zone detection, and ecological detection. In this study, the first two detection methods are mainly adopted. Simultaneously, in addressing the extent to which influencing factors can explain the spatial variation in flash floods, the q-value measure is utilized, expressed as follows:
where q represents the explanatory power of the factor for flash flood disasters, h = 1, 2, …, L denotes the partition of factor X, and and N represent the number of units in partition h and the total number of units, respectively. and are the variances of partition h and flash flood risk, respectively. The range of q is [0, 1], with a higher value indicating a stronger explanatory power of the factor for the distribution of flash floods.
3.3. Flash Flood Potential Index
The flash flood potential index (FFPI) is the flash flood risk assessment index established by the California–Nevada River Forecast Center (CNRFC) in the United States. It is a widely used established method in flash flood early warning [43]. Soil type, slope, vegetation coverage, and land use type are taken as factors for calculating the FFPI index. The relative values of each factor (usually ranging from 1 to 10) are determined to represent the likelihood of flash flood occurrence. A higher relative value indicates a greater impact on the occurrence of flash flood disasters. The calculation is expressed by the following formula:
where represents the FFPI value for each causative factor, and corresponds to the weight of each causative factor.
3.4. Composite Index Method
The composite index method (CIM) is a basic and straightforward comprehensive evaluation method. Its fundamental idea involves transforming various indicators of different natures and units into weighted composite indices for comparison and evaluation [44,45]. In this paper, CIM is applied after constructing the FFPI model, integrating it with precipitation, elevation, landform, and population density for comprehensive calculations, resulting in the generation of a probability distribution map of flash flood risk. The calculation formula is as follows:
where is the risk index of the ith factor; j represents various evaluation factors; is the assigned value of the evaluation factor in the ith evaluation unit; is the weight of the jth evaluation factor; P is the number of evaluation factors.
4. Results and Analysis
4.1. Analysis of Flash Flood Disaster Drivers Based on the Geodetector
The occurrence of flash flood disasters is the result of the combined influence of multiple factors, with precipitation being an indispensable condition. Unique topography and soil conditions create a conducive environment. Additionally, factors such as vegetation cover, land use patterns, and human activities can also have a certain impact on the formation of flash floods. Therefore, this study categorizes factors influencing flash flood disasters into three aspects: precipitation, underlying surface, and human activities. Eight influencing factors, namely, precipitation, elevation, slope, landform, soil, vegetation, land use, and population density, are selected for the analysis. Using a combination of ArcGIS and a geodetector, this study aims to analyze the contributions of each factor to the initiation of flash floods, thereby assessing the risk of flash flood disasters.
4.1.1. Drivers of Flash Flood Disasters
- ①
- Precipitation Factor
Precipitation is one of the primary causes triggering flash flood disasters. Heavy rainfall can result in elevated peak flow, thereby inducing flash floods. Moreover, intense rainfall can lead to increased surface runoff and groundwater levels, amplifying the flash flood risk. The spatial relationship between the precipitation factor and the distribution of flash flood disasters is illustrated in Figure 3a. Spatially, the average annual precipitation in China gradually decreases from the southeast coastal areas to the northwest inland regions. Overall, flash floods are more prevalent in the southern regions, with relatively fewer occurrences in the northwest inland areas. Compared to regions with lower precipitation, areas with higher precipitation experience a higher frequency of flash flood disasters.
- ②
- Underlying Surface Factor
Elevation and slope are important factors triggering flash floods. In general, areas with lower elevations tend to accumulate precipitation, forming depressions or low-lying areas. In regions where there is a significant difference in elevation within a certain area, it can lead to large river gradients or steep slopes, thereby triggering flash floods. Steeper slopes can cause rainfall to rapidly flow downhill, leading to the convergence of water flow and triggering flash flood disasters. As seen in Figure 3b,c, flash flood disasters are less frequent in low-altitude areas, such as the northern regions. The southern regions are susceptible to flooding disasters, possibly due to their location in the middle and lower reaches of major rivers such as the Yellow River and the Yangtze River, experience abundant precipitation and, coupled with undulating terrain, are more prone to flash flood disasters. Both mid-altitude and high-altitude areas experience flash floods. Additionally, the distribution of flash flood disasters has a linear pattern, mainly occurring in transition zones with significant differences in elevation. While an increase in slope generally increases the probability of flash flood disasters, the relationship between slope and the density of flash flood disaster distribution is not very pronounced.
Different landform types represent varying surface relief conditions. As observed in Figure 3d, flash flood disasters mainly occur in hilly and mountainous areas, while they are less frequent in plain areas. Clearly, topographical factors are to some extent associated with the distribution of flash flood disasters and serve as crucial geographical conditions in the formation of flash flood disasters. Soil also has a certain impact on flash flood disasters. Different soil types, due to varying permeability, can affect the retention and drainage of rainfall, thereby leading to the occurrence of flash flood disasters. Figure 3e depicts the distribution of soil types and flash flood disasters. Soil classification was conducted using the traditional ‘Soil Genesis Classification’ system. Regions with primary soils and ferruginous soils experience more flash flood disasters. This is mainly because areas with primary soils generally have sparse vegetation, severe soil erosion, and weak soil water retention capacity, and are thus prone to flash floods. In regions with ferruginous soils, strong soil leaching leads to large rainfall amounts, inducing flash flood disasters.
Vegetation primarily stabilizes soil in place through roots, branches, and leaves, intercepting rainwater and reducing the speed and erosive force of runoff. Figure 3f shows the distribution of the vegetation factor and flash flood disasters. Apparently, the impact of vegetation cover on flash flood disasters is complex. Flash flood disasters mainly occur in areas with a normalized vegetation index ranging from 0.2 to 0.8. In areas with an index below 0.2 or above 0.8, flash floods are less frequent. This may be attributed to the arid climate and low precipitation in areas with sparse vegetation. In areas with dense vegetation, water retention capacity is strong, providing effective interception against floods, and disasters are less likely to occur. Land use patterns affect the underlying surface. As seen in Figure 3g, flash flood disasters mainly occur in grassland areas on hills. For forested areas, occurrences are more frequent in the southern regions, especially in the southwest. Residential land and unused land generally experience minimal flash flood disasters.
- ③
- Human Activity Factor
Human activities have become a significant factor influencing flash flood disasters. Population growth and land development disrupt existing soil and water conservation measures, leading to increased surface exposure, reduced vegetation, and intensified soil erosion, and subsequently triggering flash floods. From Figure 3h, based primarily on land resources and their utilization characteristics, the land is classified into arable land, forest land, grassland, water area, construction land, and unused land. It can be observed that areas with lower population density experience fewer flash flood disasters. However, the region with the highest population density is not necessarily a concentrated area of disaster occurrences. It is possible that areas with high population density, often located in urban settings, and situated farther away from rivers, may be less prone to experiencing flood disasters. On the other hand, areas with low population density, commonly found in rural and mountainous regions, are more susceptible to flash flood disasters.
4.1.2. Single-Factor Driving Force Analysis
ArcGIS was used to reclassify various factors. After overlaying the disaster points, the distribution relationship between each factor and the disaster was obtained. The reclassified results were corresponded to the disaster points and exported, obtaining the level of each factor corresponding to each disaster. These were then used as the X variable in the geodetector, with the distribution of disaster points considered as the Y variable for analysis.
Table 2 presents the results of the single-factor driving force analysis. The p-values for each indicator are all less than 0.1, indicating that each factor to some extent induces flash flood disasters. The explanatory power of each factor, ranked by numerical value from highest to lowest, is as follows: precipitation (0.363) > soil (0.268) > slope (0.221) > NDVI (0.201) > landform (0.195) > elevation (0.191) > population density (0.185) > land use (0.106). Obviously, precipitation has the highest explanatory power, followed by soil, suggesting that flash flood disasters are greatly influenced by precipitation and soil type, with high explanatory powers.
In mountainous areas of China, the soil is formed by the weathering of rocks, with poor permeability and difficulty for groundwater to penetrate. When heavy rainfall occurs, surface runoff quickly converges, resulting in a large runoff volume, which easily triggers flash flood disasters. Slope affects the speed and direction of rainwater runoff. In areas with steep slopes, especially during heavy rainfall, water can carry surface soil down the slope under the force of gravity, making areas with steeper slopes more prone to flash flood disasters. Vegetation cover also affects the spatial distribution of flash flood disasters. In areas with sparse vegetation, where the ground is exposed and water retention capacity is low, rapid surface runoff is more likely, leading to flash flood disasters. Conversely, in areas with dense vegetation cover, vegetation intercepts the rainfall, reducing the erosive force on the surface. These findings highlight the complex interplay of various factors influencing flash flood disasters, with precipitation, soil type, and slope being particularly significant in the mountainous regions of China.
4.1.3. Multi-Factor Driving Force Interaction Detection Analysis
The outbreak of flash flood disasters is influenced by multiple factors. This study further explores the impact of multiple factors. Compared to the explanatory power of single factors, the combination of two factors has a stronger explanatory power for the occurrence and distribution of flash flood disasters. The effects after the interaction of two factors can be categorized into synergistic effects and nonlinear synergistic effects. A synergistic effect refers to a phenomenon where the explanatory power of the interaction between two factors is greater than the maximum of their individual explanatory powers but less than the sum of their explanatory powers. Nonlinear synergy specifically indicates that the explanatory power of two factors interacting is greater than the sum of their individual explanatory powers. After detection, the results of the interaction of flash flood disaster driving factors (Table 3) and the interactions (Table 4) were obtained. The interactions of precipitation ∩ elevation, precipitation ∩ soil, and soil ∩ vegetation show nonlinear synergistic effects, while precipitation ∩ slope, precipitation ∩ landform, and precipitation ∩ land use exhibit synergistic effects.
From the interaction results, the interaction explanatory power of precipitation ∩ soil is the highest, at 0.64. This indicates that the interaction has a stronger explanatory power for the occurrence of flash flood disasters. Comparing the results of pairwise interactions between other factors, precipitation shows a relatively high explanatory power in interactions with other factors. Therefore, precipitation is identified as the primary factor influencing the occurrence of flash flood disasters.
4.2. Flash Flood Risk Assessment
4.2.1. Distribution of Flash Flood Potential Index (FFPI)
The flash flood potential index (FFPI) is a potential risk assessment model based on geographical and topographical factors. In this study, four indicators, slope, soil texture, vegetation index, and land use, were selected and confirmed to predict flash flood disasters. Based on the contribution of each indicator, a potential flash flood index was assigned to each grid data, ranging from 1 to 10. The relative values (1–10) for each influencing factor represent the likelihood of a flash flood occurrence, with higher values indicating a greater contribution to the occurrence of flash floods, and a value of 1 indicating the least impact. Similarly, a value of 10 represents the greatest impact on the occurrence of flash floods.
Before mapping, the data needed to be classified. Regarding slope, it is classified into levels at intervals of 5 degrees. At the same time, it is essential to consider that extremely steep areas or cliffs may not be the main locations for the occurrence of flash floods. Therefore, areas with steeper slopes have smaller relative values. For soil, the infiltration rate depends on the soil’s pore structure and arrangement. Soils primarily composed of clay tend to have relatively lower permeability, making them more prone to flash floods. Therefore, clayey soils have higher relative values. Regarding land use types, including forests, grasslands, cultivated land, urban and rural areas, and places with high population and industrial density, such as cities, generally incur greater losses from flash floods. Hence, a higher FFPI was assigned. The specific FFPI for each indicator is detailed in Table 5.
For determining the weight values of the FFPI index, the geodetector involves calculating the results of single-factor driving forces and using them as a basis for division. Subsequently, quantitative correlations are computed. The weights are assigned based on the magnitude of the explanatory power, where a larger explanatory power corresponds to a greater weight. The weight values for each indicator are presented in Table 6. It can be observed that the weight order of the indicators is as follows: precipitation > soil type > slope > vegetation factor > landform type > elevation > population density > land use type. This suggests that the occurrence of flash flood disasters is primarily influenced by precipitation and soil type.
After spatially overlaying the classified values of the four indicators related to the FFPI, along with their corresponding weights, the FFPI distribution was obtained (Figure 4). It can be observed that under the influence of slope and soil characteristics, the southwest and southern regions are more likely to have a higher potential occurrence of flash floods. Under the influence of vegetation, the likelihood of flash floods is greater in the northwest. Meanwhile, with the impact of land use types, the southwest region exhibits a higher potential for the occurrence of flash floods. Subsequently, this study employs the ArcGIS spatial analysis tool to weight and combine the FFPI of slopes, soil types, vegetation indices, and land use types. This process yields a map depicting the potential distribution of mountain floods in the study area (Figure 5). The map represents the conditions of the disaster-prone environment, where higher values indicate a greater likelihood of flash floods. It can be observed that the overall values for the western and southwestern regions of China are relatively high, while those for the eastern and northeastern regions are lower. Therefore, the likelihood of flash flood occurrence decreases gradually from west to east, with the southern and southwestern regions being more susceptible to flash flood disasters.
4.2.2. Flash Flood Risk Analysis
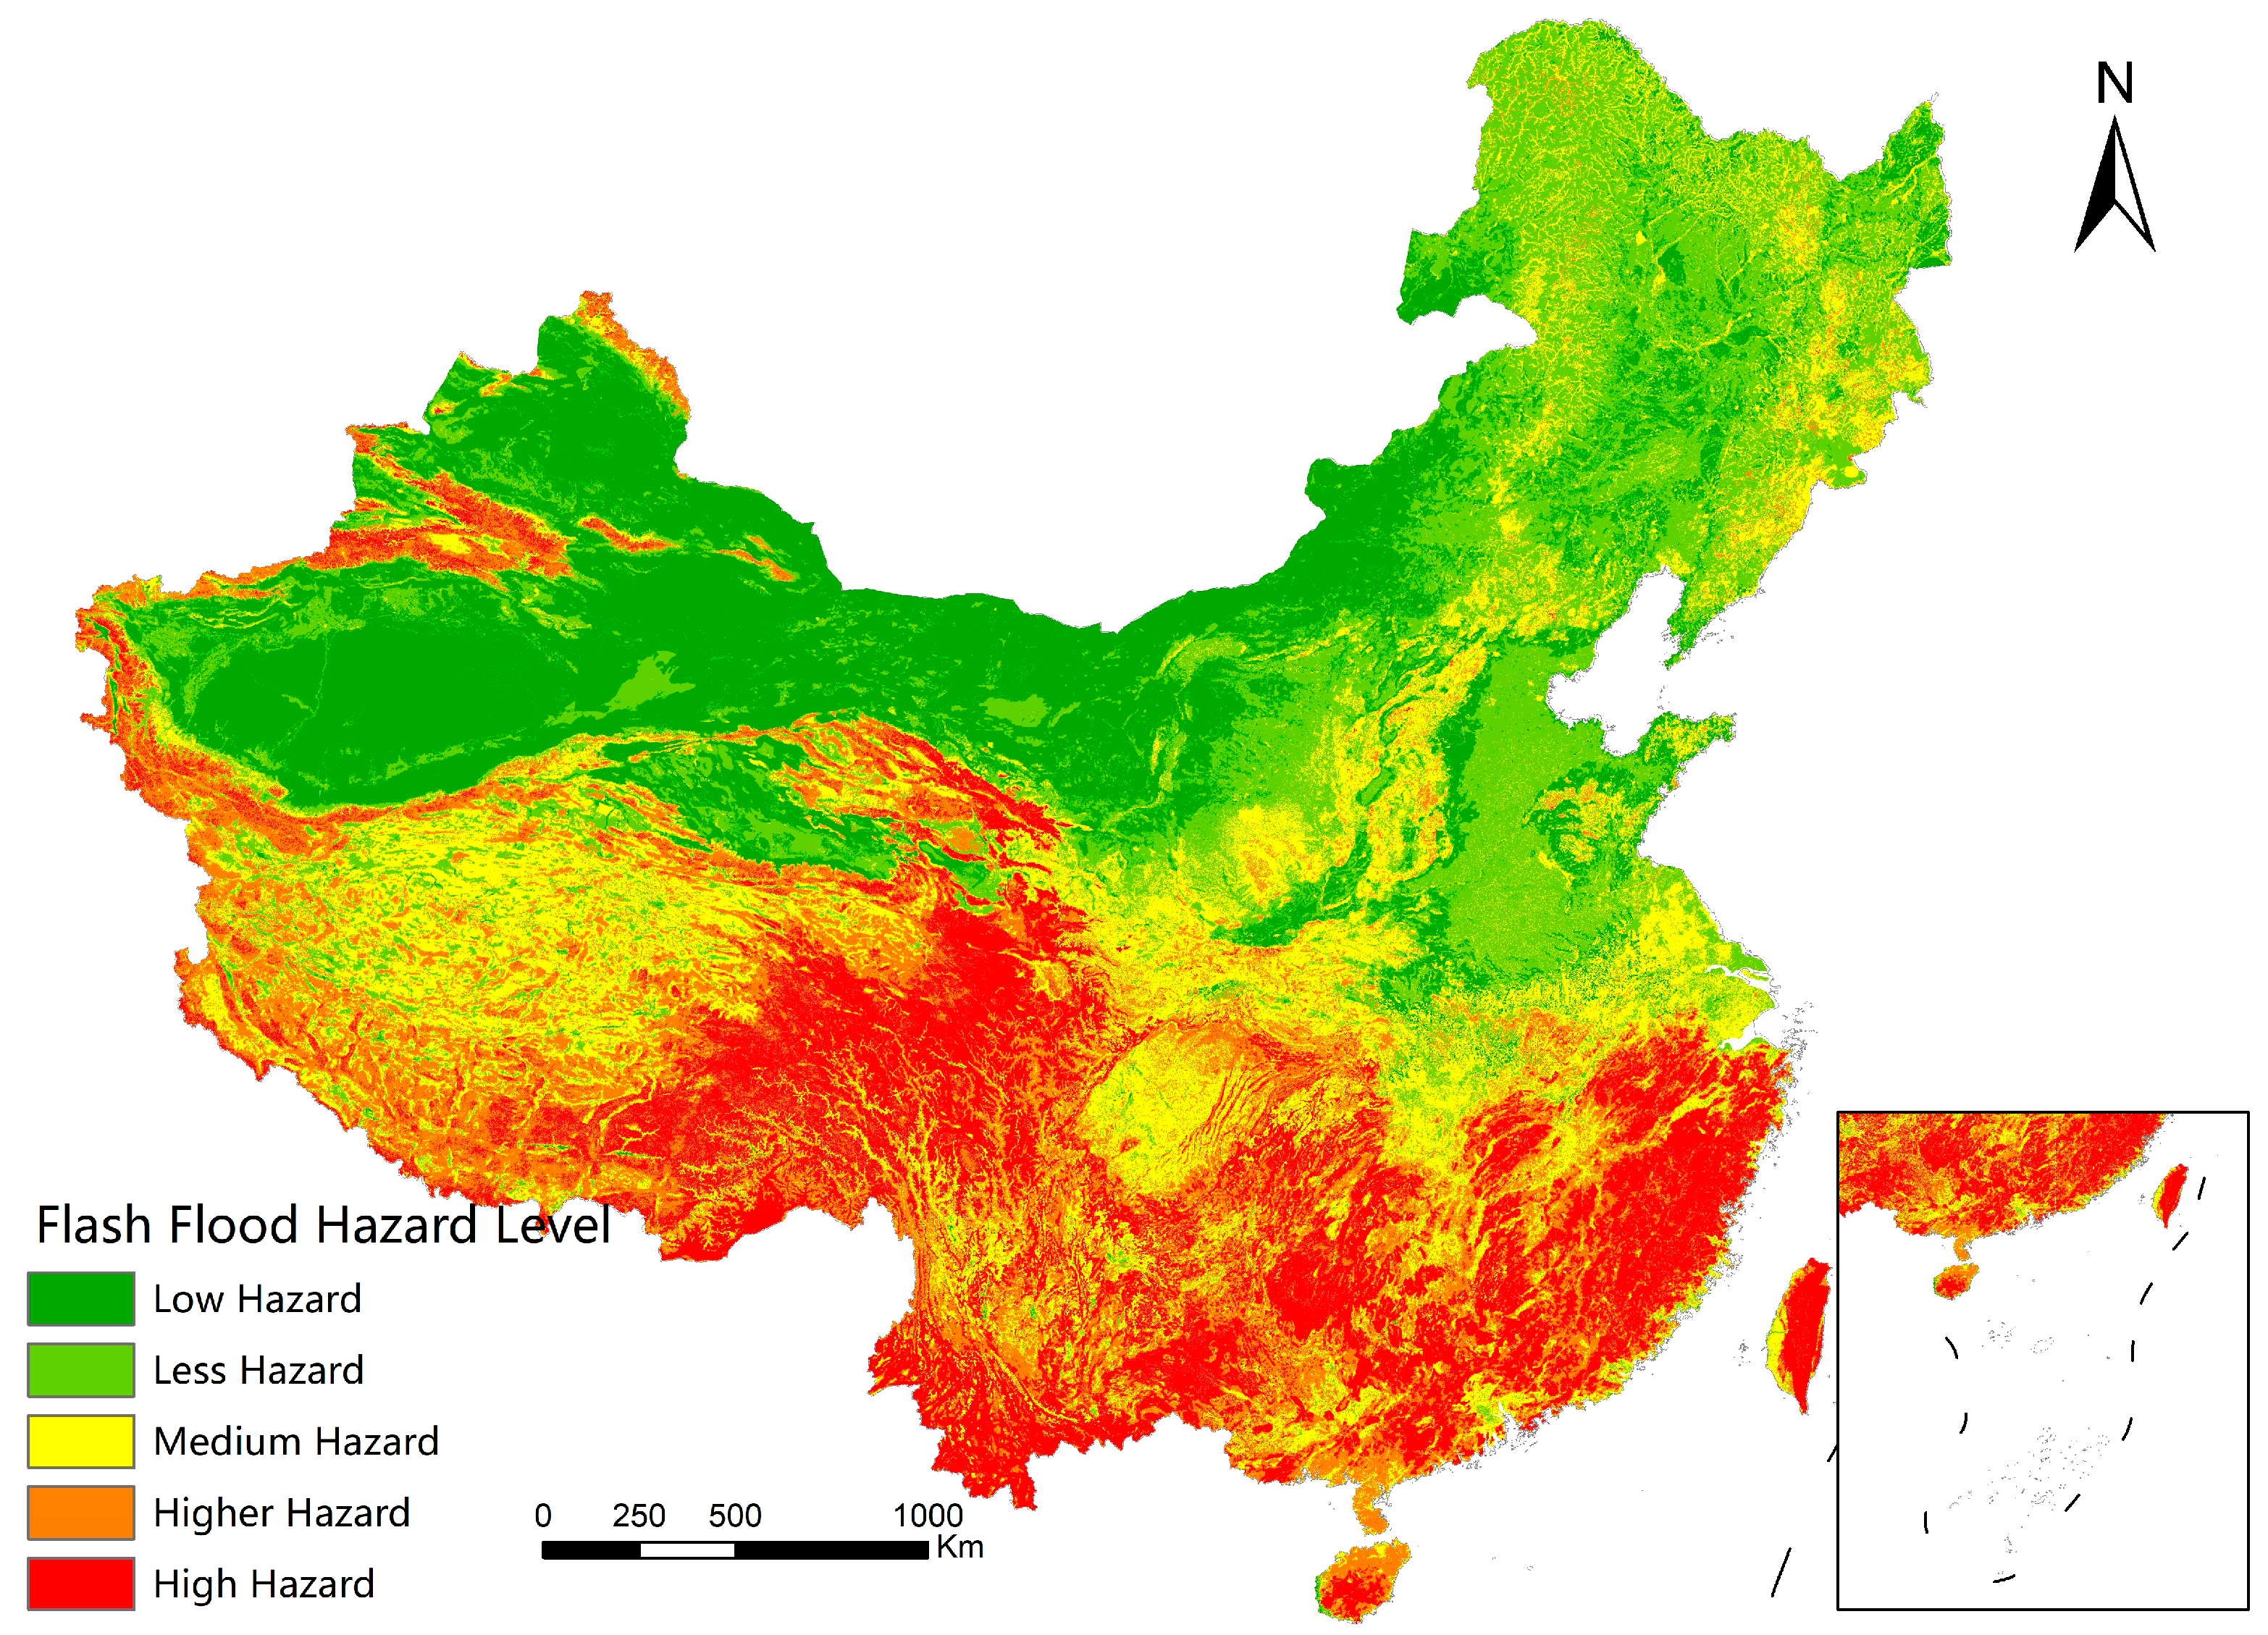
A comprehensive evaluation of the flash flood risk is carried out through the construction of the FFPI, which integrates factors such as rainfall, elevation, landform, and population density in the assessment system for flash flood disasters. The disaster risk is then assessed using a comprehensive index. Following the FFPI allocation method, relative values (1–10) are assigned to the other four factors. Weighted calculations are then performed using the weight values for each factor. By combining the natural breakpoint method, the resulting risk is classified into five categories: low risk, relatively low risk, moderate risk, relatively high risk, and high risk. The probability distribution of flash flood risk is presented in Figure 6.
Evidently, the distribution of flash flood risk aligns with the general distribution of historical flash floods from 2017 to 2021. Overall, the southwestern, central, and southeastern regions exhibit higher risk levels, while the northwestern and northern plain areas (such as north China) and northeastern regions have lower risk levels. This is primarily due to regions with higher rainfall and greater rainfall intensity being more prone to flash floods. The topographical variations also contribute to the occurrence of flash flood disasters. Therefore, in areas with significant elevation differences and abundant rainfall, the risk of flash floods is greater. In summary, the risk distribution map obtained generally corresponds to the actual occurrence of flash floods.
5. Conclusions
Under the influence of extreme climates, flash floods occur frequently, resulting in significant economic losses and casualties. This study quantifies and identifies key influencing factors, conducting an in-depth investigation into the probability distribution of flash flood risks. The main conclusions are as follows:
(1) After examining the contributions of various factors triggering flash floods, among them, precipitation is a fundamental factor with the greatest impact on flash floods. Subsurface factors such as soil and slope serve as material conditions and potential criteria for triggering flash floods. Human activities also exacerbate the occurrence of flash floods. The mutual explanatory power between these two groups of factors surpasses the explanatory power of individual factors.
(2) After obtaining the probability distribution of flash flood risks in China, the southern and southwestern regions of China were identified as high-risk areas, while the risk levels in the northwest and northeast regions were relatively low. This is consistent with the observed distribution of flash flood disasters from 2017 to 2021.
This study mainly uses the explanatory power of the geographical detectors to calculate factor weights; most current studies obtain weights through expert scoring or the analytic hierarchy process, which are greatly affected by human factors. Therefore, this method avoids the influence of human subjective judgment. However, since the input data cover a limited time range, there are also potential errors in predicting actual situation.
Considering the uncertainties and vulnerabilities associated with flash flood disasters, future research will refine the factors influencing these disasters, focusing on issues such as improving the accuracy of input data. The goal is to provide valuable references for the risk management of flash floods in China.
Author Contributions
Software, L.Z.; Data curation, Z.Z. and Y.W.; Writing—original draft, Q.L. and Y.L.; Writing—review & editing, M.M. All authors have read and agreed to the published version of the manuscript.
Funding
This research was supported by the National Key R&D Program of China (2023YFC3006705), Key Technologies for Rapid Identification and Dynamic Warning of Flood Risk in Small and Medium sized Reservoirs under Guangxi Key R&D Program (Guike AB19245054), the Special Project of Technology Achievement Transformation Fund of China Institute of Water Resources and Hydropower Research (ZS1003A012021), the National Natural Science Foundation of China (42371086, 42101086) and the Open Fund of the China Institute of Water Resources and Hydropower Research (IWHR-SKL-KF202310).
Data Availability Statement
The data presented in this study are openly available in National Tibetan Plateau Data Center at https://data.tpdc.ac.cn/home, Resource and Environment Science and Data Center at https://www.resdc.cn.
Conflicts of Interest
Lingyun Zhao was employed by Beijing China Institute of Water Resources and Hydropower Research Corporation. The remaining authors declare that the research was conducted in the absence of any commercial or financial relationships that could be construed as a potential conflict of interest.
References
- Huang, D. Frequent Occurrence of Extreme Weather and Climate Events: Fundamental Patterns and Scientific Responses. Natl. Gov. 2023, 17, 46–52. [Google Scholar] [CrossRef] [PubMed]
- Global Disaster Data Platform. Available online: https://www.gddat.cn/newGlobalWeb/#/home (accessed on 5 January 2024).
- Sun, D. Construction of China’s Flash Flood Disaster Monitoring and Early Warning System. China Flood Drought Manag. 2019, 29, 4–5. [Google Scholar]
- Li, J.; Wang, L.; Wang, J.; Deng, P.; Zhao, T. Research on flash flood warning technology based on dynamic critical rainfall. J. Nat. Disasters 2023, 32, 235–242. [Google Scholar]
- Cheng, D.; Liu, R.; Zhai, X.; Zhao, Y.; Liu, X. Real-time dynamic analysis of flash flood warning indicators based on a Chinese mountainous hydrological model. J. China Inst. Water Resour. Hydropower Res. 2023, 21, 444–454, (In English & Chinese). [Google Scholar]
- Ngoc, T.D.; Manh, T.T.; Le Hoang, S.; Thi, N.T.; Long, G.N.; Huy, T.P.; Van, H.V. Novel Approach Combining Particle Swarm Optimization and Deep Learning for Flash Flood Detection from Satellite Images. Mathematics 2021, 9, 2846. [Google Scholar]
- Surwase, T.; Manjusree, P.; Prakash, S.; Kuntla, S. Development of algorithms for evaluating performance of flood simulation models with satellite-derived flood. H2Open J. 2020, 3, 222–235. [Google Scholar] [CrossRef]
- Liu, H.; Guo, C.; Yuan, Y.; Jin, Z.; Yi, Y. Dynamic risk assessment and warning of flash floods based on sediment-runoff. China Flood Drought Manag. 2022, 32, 20–26. [Google Scholar]
- Tian, J.; Liu, R.; Li, R.; Liu, H. Application and prospect of meteorological and hydrological coupling forecasting technology in flash flood defense. China Flood Drought Manag. 2020, 30, 54–57+112. [Google Scholar]
- Yang, F.; Kang, Y.; Wang, Q.; Ma, M.; Liu, R. Analysis of spatial and temporal characteristics and inducing factors of mountain floods in Guangdong Province. Water Resour. Power 2023, 41, 81–84. [Google Scholar]
- Wang, Z.; Wang, H. Cause analysis and defense measures of flash flood disasters in Chengde City. Hebei Water Resour. 2023, 8, 25–26. [Google Scholar]
- Zhang, Q.; Lu, Y.; Yan, T.; Xie, Q.; Zhao, C.; Hu, Y. Spatiotemporal evolution characteristics and influencing factors analysis of flash flood disasters in Chongqing City. J. Yangtze River Sci. Res. Inst. 2023, 40, 80–87+117. [Google Scholar]
- Chen, L.; Li, S.; Fu, J.; Zhang, S. Analysis of characteristics and countermeasures of flash flood disasters in Zhangshu City watershed. Tech. Superv. Water Resour. 2022, 138–141. [Google Scholar]
- Shi, K.; Chen, Y.; Zhang, X.; Ma, Q.; Ren, L. Research on zoning of flash flood risk in Jiangxi Province based on graph clustering neural network. Acta Geogr. Sin. 2023, 39, 7–15. [Google Scholar]
- Wang, N.; Zhang, X.; Gu, L.; Yu, X.; Zhang, Y. Research on flash flood risk assessment in Fangshan District of Beijing. Water Resour. Power 2022, 40, 85–89. [Google Scholar]
- Yan, C. Research on risk zoning of flash flood disasters in Deqing County based on GIS. Gansu Water Resour. Hydropower Technol. 2020, 56, 21–25. [Google Scholar]
- Sanyal, J.; Lu, X. GIS-based flood risk mapping at different administrative scales: A case study in Gangetic West Bengal, India. Singap. J. Trop. Geogr. 2010, 27, 207–220. [Google Scholar] [CrossRef]
- Bhatt, G.D.; Sinha, K.; Deka, P.K.; Kumar, A. Flood Risk and Risk Assessment in Chamoli District, Uttarakhand Using Satellite Remote Sensing and GIS Techniques. Int. J. Innov. Res. Sci. Eng. Technol. 2014, 3, 15348–15356. [Google Scholar] [CrossRef]
- Mojaddadi, H.; Pradhan, B.; Nampak, H.; Ahmad, N.; Ghazali, A.H. Ensemble machine-learning-based geospatial approach for flood risk assessment using multi-sensor remote-sensing data and GIS. Geomat. Nat. Hazards Risk 2017, 8, 1080–1102. [Google Scholar] [CrossRef]
- Tang, C.; Zhu, J. GIS-based risk zoning of flash flood disasters. Acta Geogr. Sin. 2005, 1, 87–94. [Google Scholar]
- Huang, G.; Xian, Z.; Cheng, G.; Chen, Z.; Zhou, X. Flash flood risk assessment in Yao’an watershed, Qingyuan City based on GIS. Water Resour. Power 2015, 33, 43–47. [Google Scholar]
- Dong, Y.; Hai, J.; Hu, S.; Pei, Y.; Wang, X.; Long, Y.; Cao, M. Influence of successive landslides on topographic changes revealed by multitemporal high-resolution UAS-based DEM. Catena 2021, 202, 105229. [Google Scholar]
- Zhou, W.; Qiu, H.; Wang, L.; Pei, Y.; Tang, B.; Ma, S.; Yang, D.; Cao, M. Combining rainfall-induced shallow landslides and subsequent debris flows for hazard chain prediction. Catena 2022, 213, 106199. [Google Scholar] [CrossRef]
- Ma, S.; Qiu, H.; Yang, D.; Wang, J.; Zhu, Y.; Tang, B.; Sun, K.; Cao, M. Surface multi-hazard effect of underground coal mining. Landslides 2022, 20, 39–52. [Google Scholar] [CrossRef]
- Liu, Z.; Qiu, H.; Zhu, Y.; Liu, Y.; Yang, D.; Ma, S.; Zhang, J.; Wang, Y.; Wang, L.; Tang, B. Efficient Identification and Monitoring of Landslides by Time-Series InSAR Combining Single- and Multi-Look Phases. Remote Sens. 2022, 14, 1026. [Google Scholar] [CrossRef]
- Wang, L.; Qiu, H.; Zhou, W.; Zhu, Y.; Liu, Z.; Ma, S.; Yang, D.; Tang, B. The Post-Failure Spatiotemporal Deformation of Certain Translational Landslides May Follow the Pre-Failure Pattern. Remote Sens. 2022, 14, 2333. [Google Scholar] [CrossRef]
- Muhammad, M.; Linlin, L.; Mushahid, A.M.; Mohamed, E.S.; Li, Q.; Abdulrahman, A. Prediction of flash flood susceptibility using integrating analytic hierarchy process (AHP) and frequency ratio (FR) algorithms. Front. Environ. Sci. 2023, 10, 1037547. [Google Scholar]
- Hafedh, H.M.; Mohammed, S.A. Flash Flood Risk Assessment Due to a Possible Dam Break in Urban Arid Environment, the New Um Al-Khair Dam Case Study, Jeddah, Saudi Arabia. Sustainability 2023, 15, 1074. [Google Scholar] [CrossRef]
- Hewaidy, A.G.A.H.; El Hassan, M.A.; Salama, A.; Ahmed, R. Flash Flood Risk Assessment of Wadi Degla Basin Protected Area, East of Maadi, Cairo, Egypt Based on Morphometric Analysis Using GIS Techniques. Hydrology 2021, 9, 66–73. [Google Scholar] [CrossRef]
- Fang, X.; Wang, K.; Ren, L.; Zhang, X.; Feng, L. Flash flood risk assessment and zoning in Jiangxi Province based on GIS. J. Catastrophol. 2017, 32, 111–116. [Google Scholar]
- Lin, B. Research on risk zoning evaluation of flash flood disasters in Guangdong Province based on AHP-GIS. Guangdong Water Resour. Hydropower 2022, 2, 21–27. [Google Scholar]
- Wang, B.; Tian, J.; Cheng, L.; Hao, F.; Han, H.; Wang, S. Spatial differentiation of China’s digital economy and its influencing factors. Sci. Geogr. Sin. 2018, 38, 859–868. [Google Scholar]
- Lv, C.; Lan, X.; Sun, W. Relationship between population spatial pattern changes and natural factors in Beijing based on geographical detector method. J. Nat. Resour. 2017, 32, 1385–1397. [Google Scholar]
- Yang, Q.; Wang, J.; Li, C.; Liu, X. Spatial differentiation and driving factors of total factor productivity of China’s agricultural green production. J. Quant. Tech. Econ. 2019, 36, 21–37. [Google Scholar]
- Huang, Y. Analysis of Driving Factors of Flash Flood Disasters and Risk Assessment in Shaanxi Province. Master’s Thesis, Xi’an University of Technology, Xi’an, China, 30 June 2021. [Google Scholar]
- Li, H.; Wan, Q. Preliminary study on the selection of rainfall index for flash flood risk analysis in small watersheds. J. Geo-Inf. Sci. 2017, 19, 425–435. [Google Scholar]
- Yu, M. Analysis of Driving Factors and Risk Assessment of Flash Flood Disasters at Different Spatial Scales in the Guanzhong Area. Master’s Thesis, Xi’an University of Technology, Xi’an, China, 30 June 2023. [Google Scholar]
- He, B.; Ma, M.; Li, Q.; Liu, L.; Wang, X. Analysis of the current situation and characteristics of mountain flood disasters prevention and control in China. China Rural Water Hydropower 2021, 5, 133–138+144. [Google Scholar]
- Liu, Y.; Yang, Z.; Huang, Y.; Liu, C. Spatiotemporal pattern and driving factors analysis of flash flood events in China since the founding of the People’s Republic. Sci. Sin. Earth Sci. 2019, 49, 408–420. [Google Scholar]
- Chen, Y.; Xu, C.; Zhang, X.; Zhang, R.; Ma, Q.; Liu, C.; Ren, L.; Shi, K. Research on zoning of flash flood risk in China. Acta Geogr. Sin. 2023, 78, 1059–1073. [Google Scholar]
- Bin, L.; Yang, W.; Xu, K. Driving Force Exploration for Flash Flood Based on Mann–Kendall Test and Geographical Detector: A Case Study of Hainan Island, China. Sustainability 2023, 15, 12517. [Google Scholar] [CrossRef]
- Wang, J.; Xu, C. Geographical detector: Principles and prospects. Acta Geogr. Sin. 2017, 72, 116–134. [Google Scholar]
- Xu, H.; Cao, Y.; Zeng, Z. Flash flood risk warning method based on FFPI. J. Catastrophol. 2020, 35, 90–95. [Google Scholar]
- Niu, Q.; Xiong, C.; Lei, J.; Wang, H.; Liu, B.; Zhang, R. Risk assessment of flash flood disasters in Longnan area, Gansu Province based on FFPI model. J. Nat. Disasters 2023, 32, 36–47. [Google Scholar]
- Jia, P.; Li, X.; Wang, J. Comparison of several typical comprehensive evaluation methods. China Hosp. Stat. 2008, 15, 351–353. [Google Scholar]
Figure 1.
2017–2021 flash flood disaster distribution in China.

Figure 2.
Research approach.
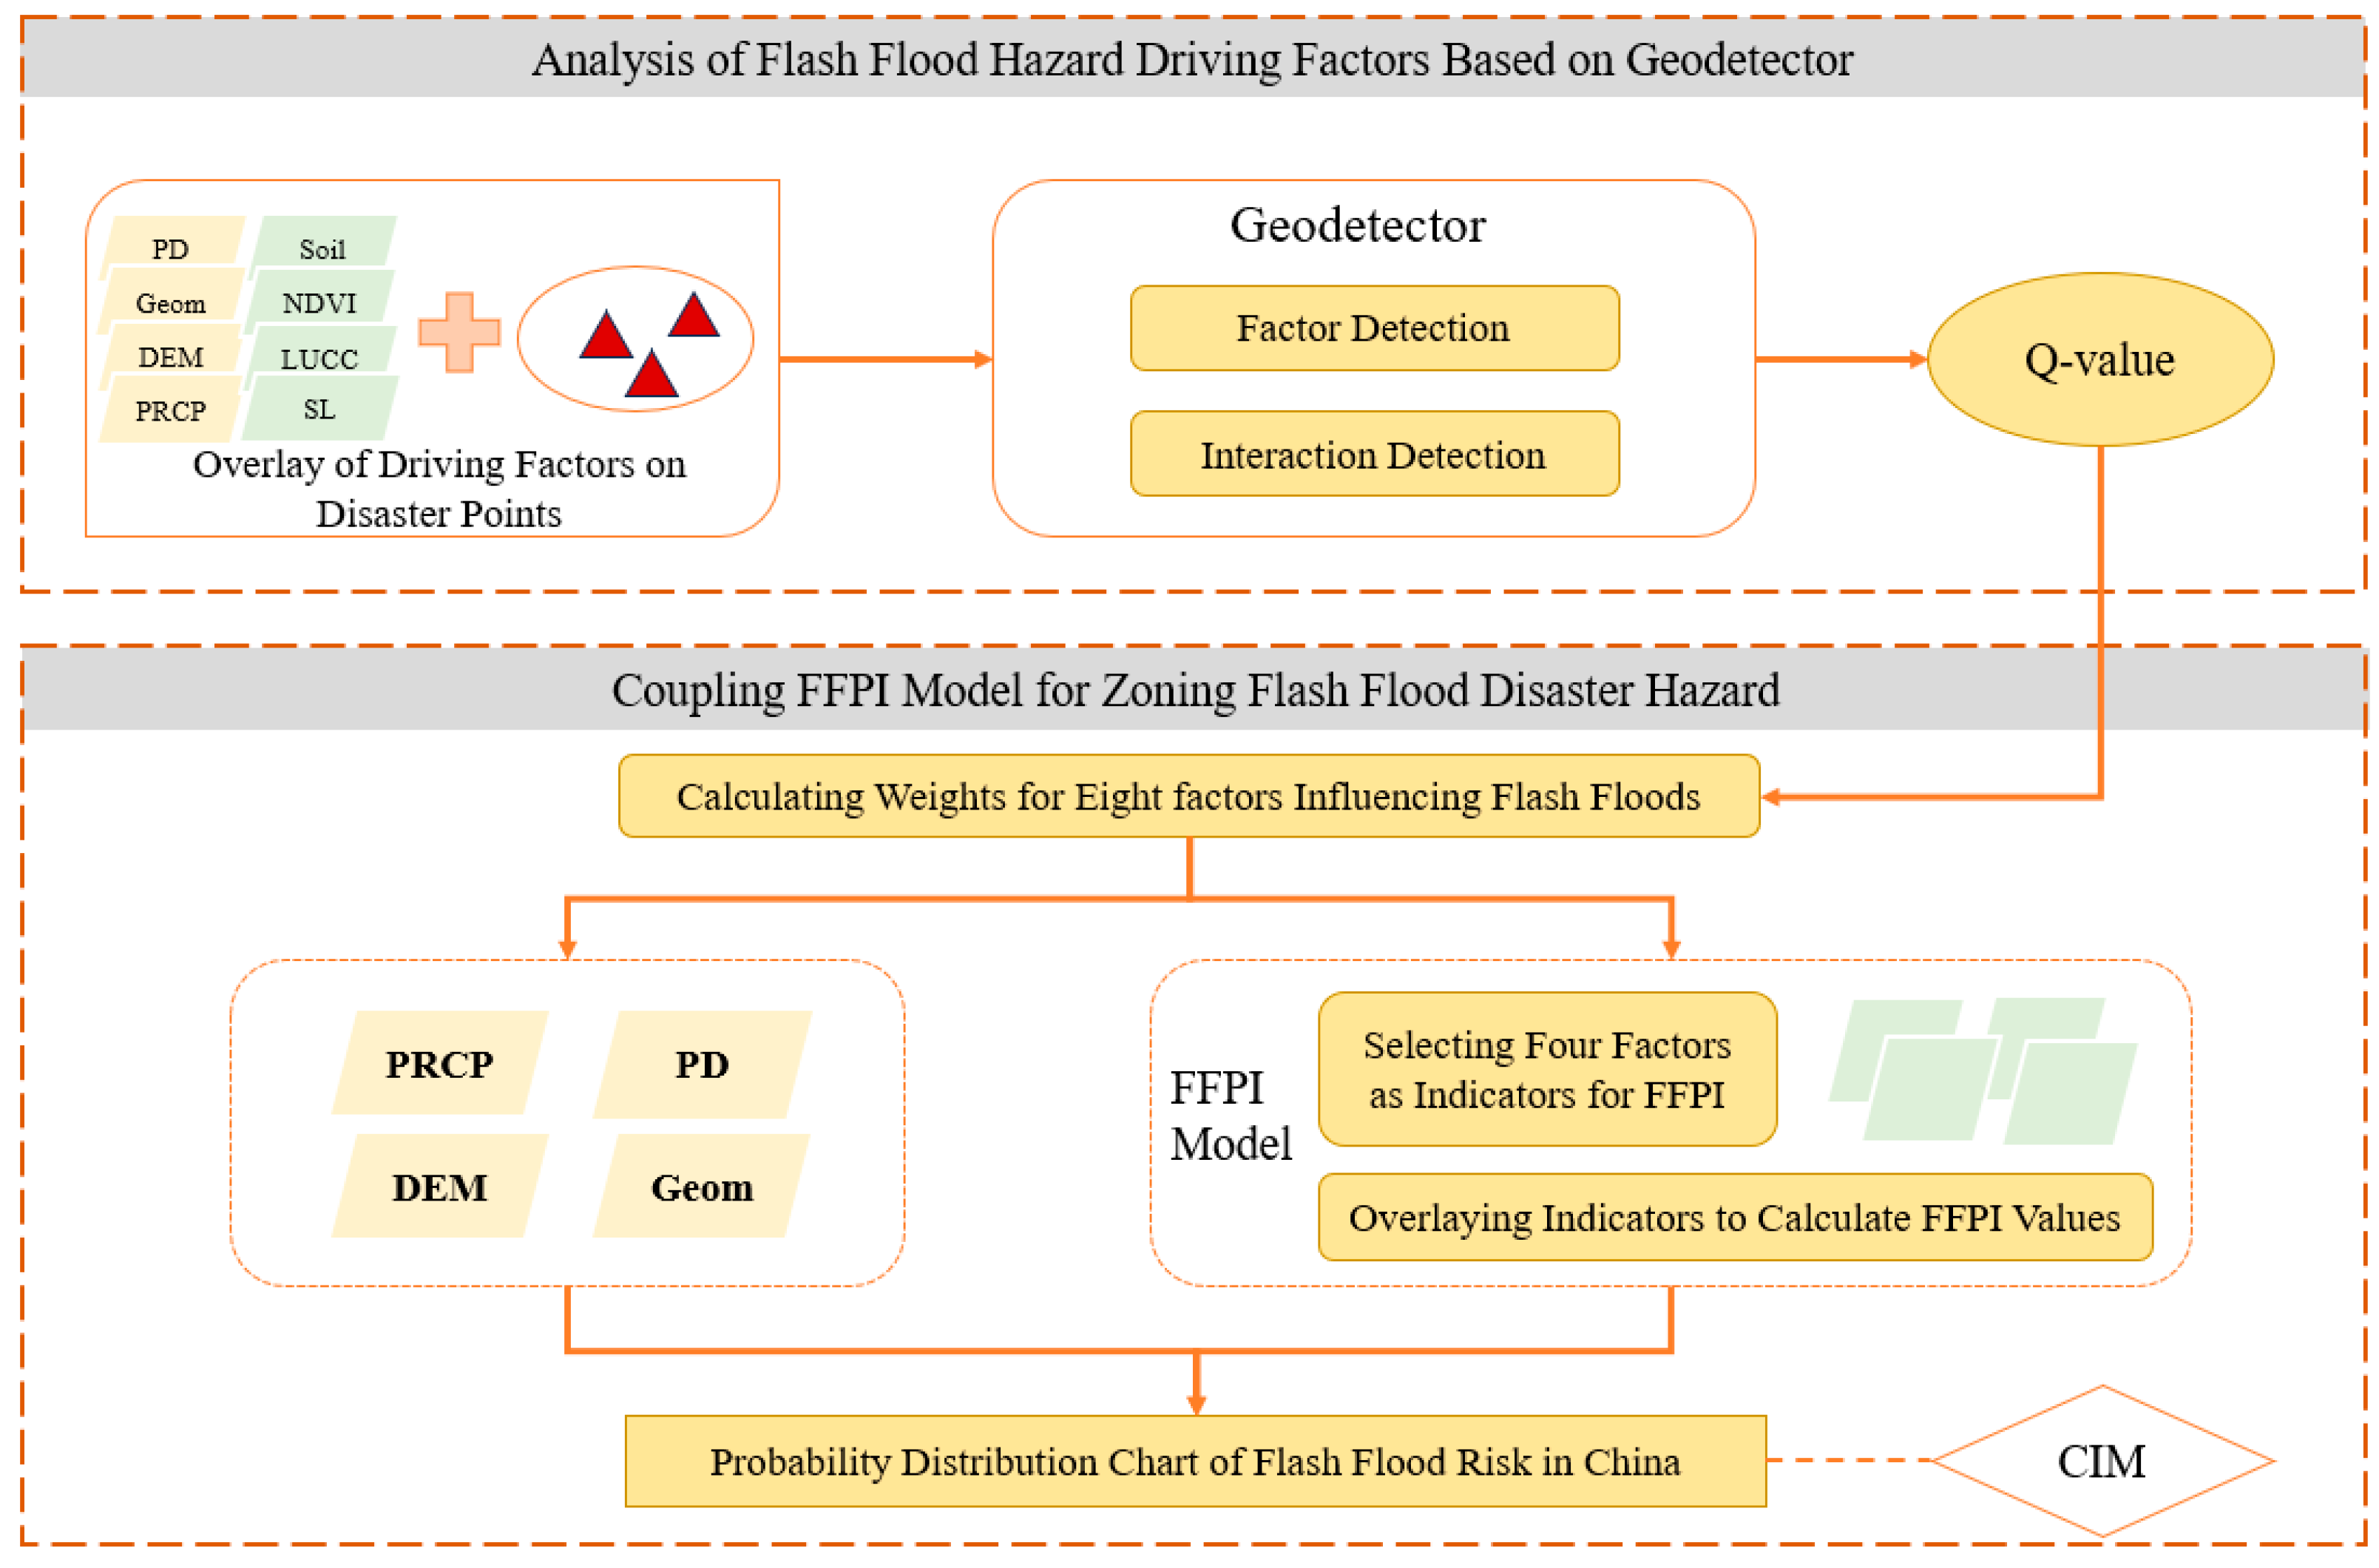
Figure 3.
Distribution map of flash flood risk drivers. (a–h) represent the distribution maps of rainfall, elevation, slope, landform, soil, vegetation, land use, and population density factors, overlaid with the disaster points. Note: The black triangle represents a flash flood event.
Figure 3.
Distribution map of flash flood risk drivers. (a–h) represent the distribution maps of rainfall, elevation, slope, landform, soil, vegetation, land use, and population density factors, overlaid with the disaster points. Note: The black triangle represents a flash flood event.

Figure 4.
Flash flood driving factor. (a–d) represent FFPI values corresponding to slope, soil, vegetation, and land use, respectively.
Figure 4.
Flash flood driving factor. (a–d) represent FFPI values corresponding to slope, soil, vegetation, and land use, respectively.
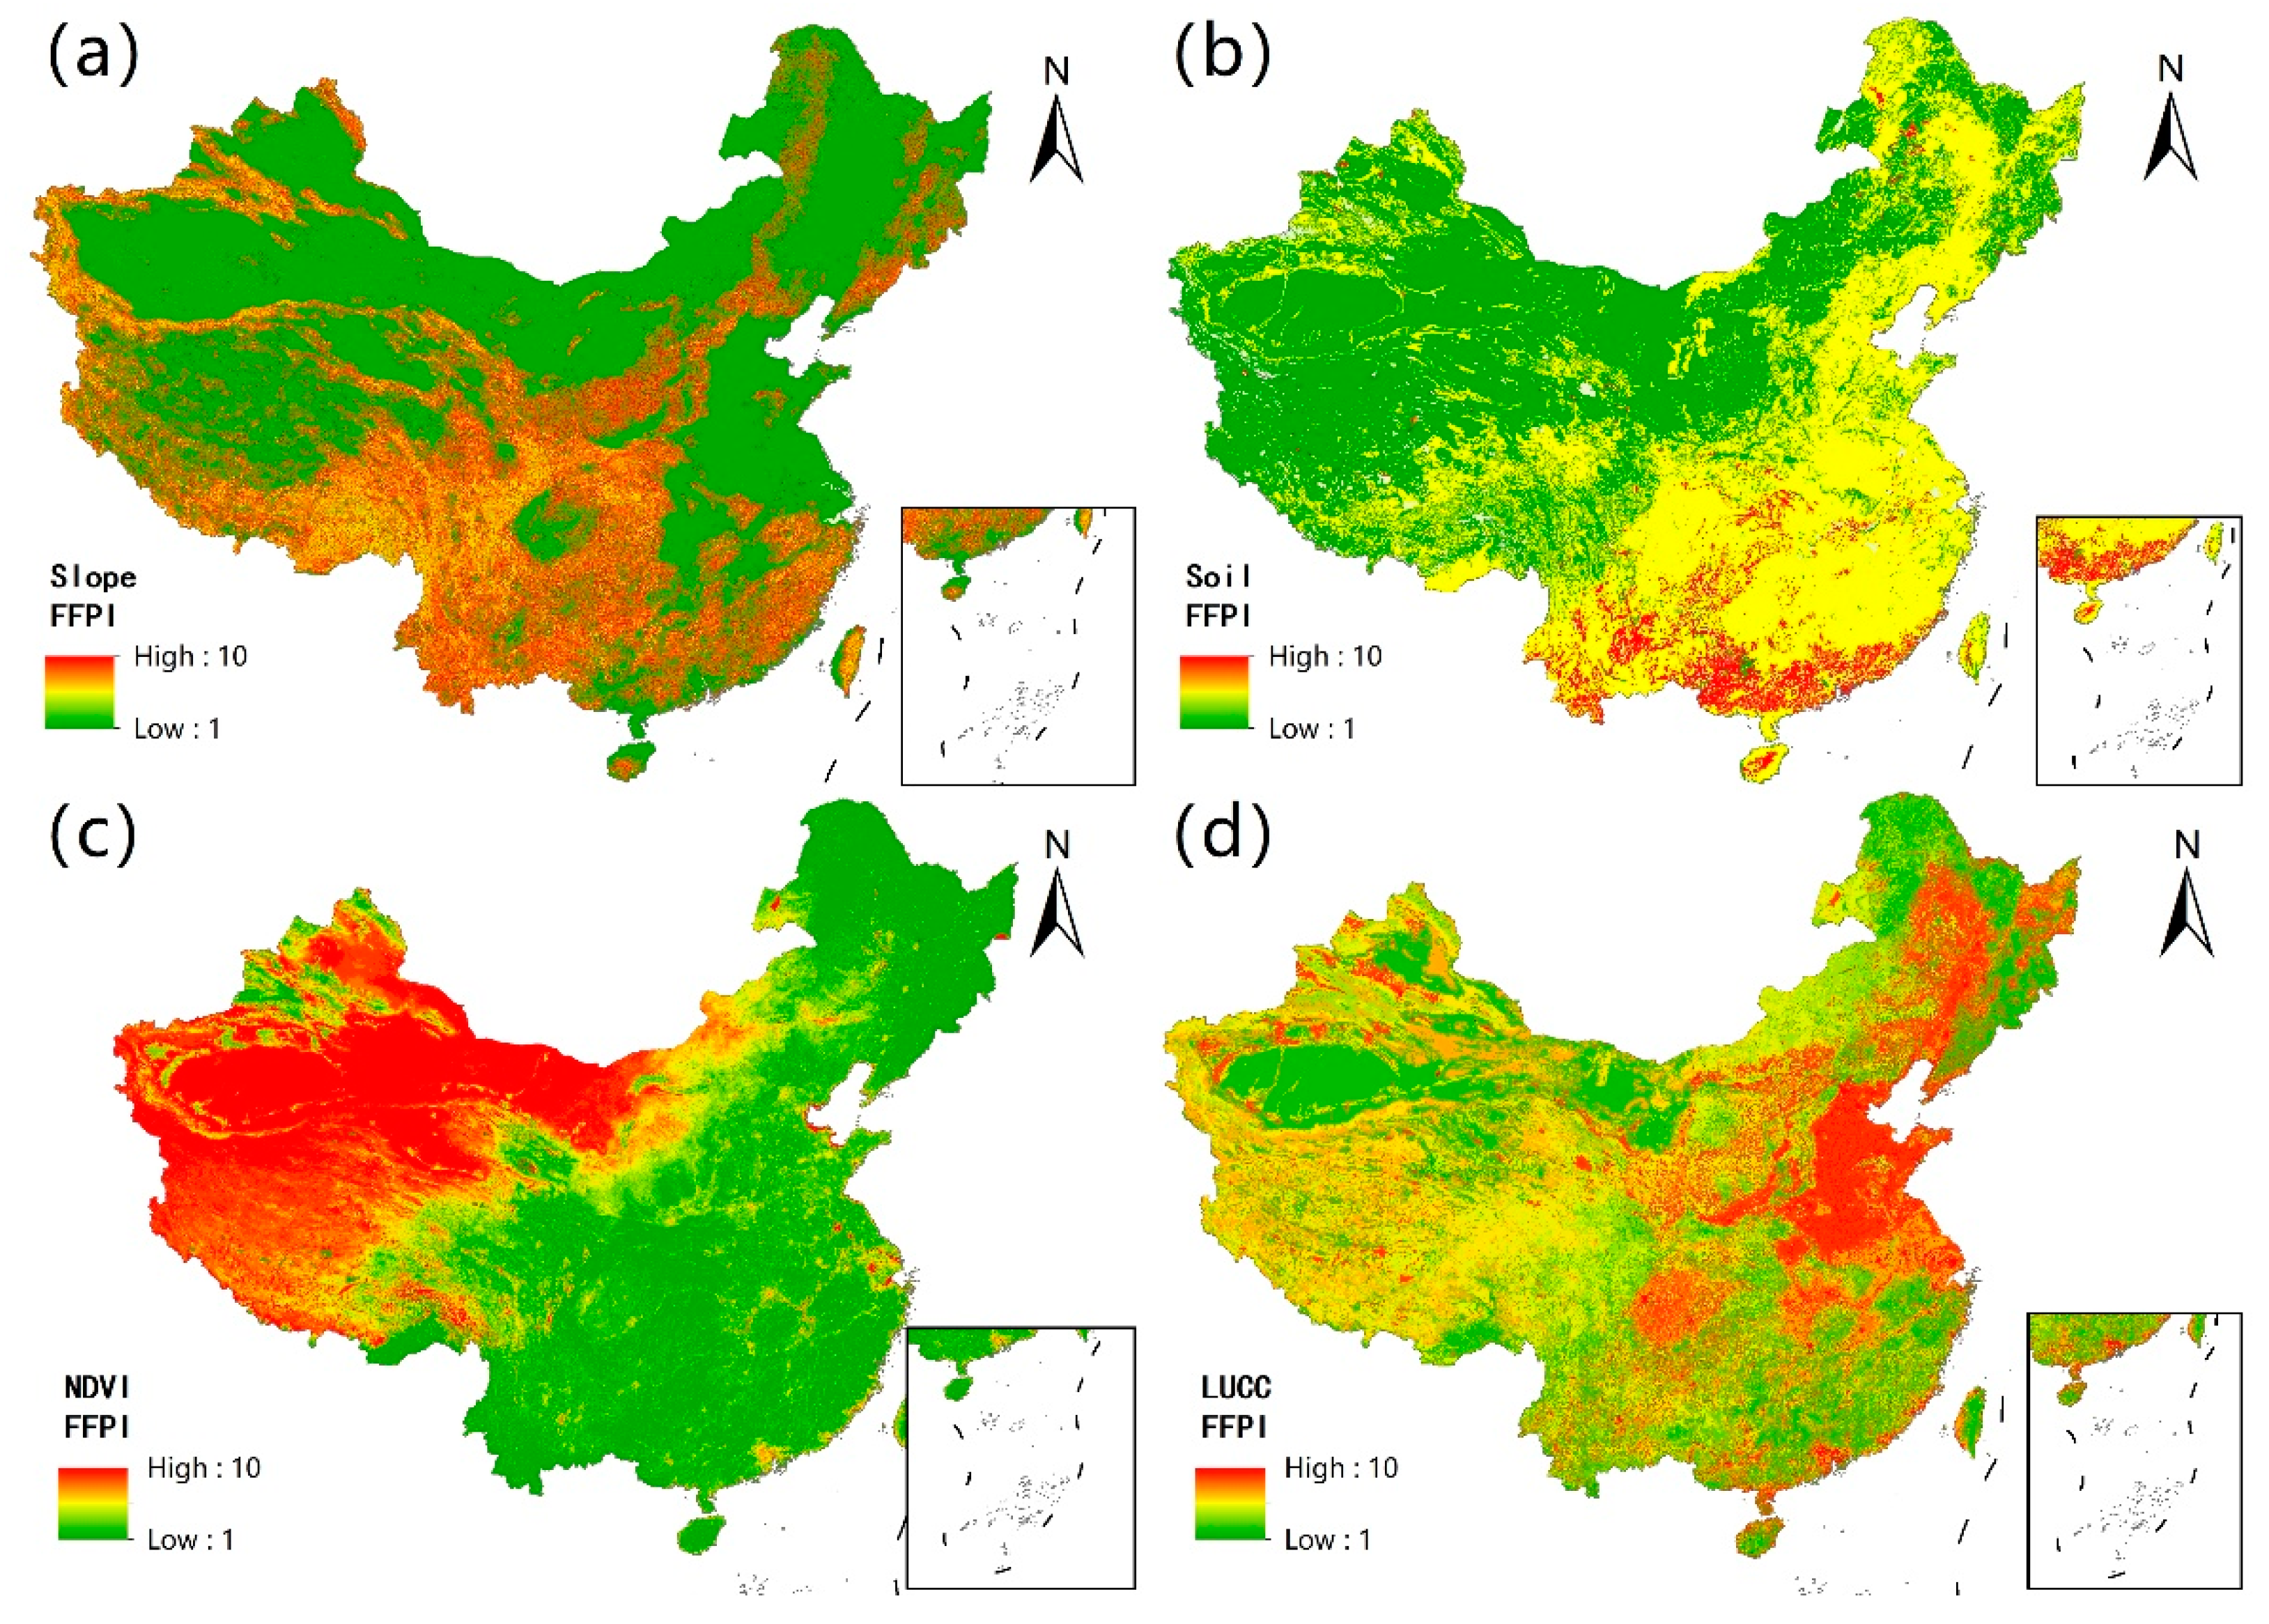
Figure 5.
Distribution of flash flood potential index.
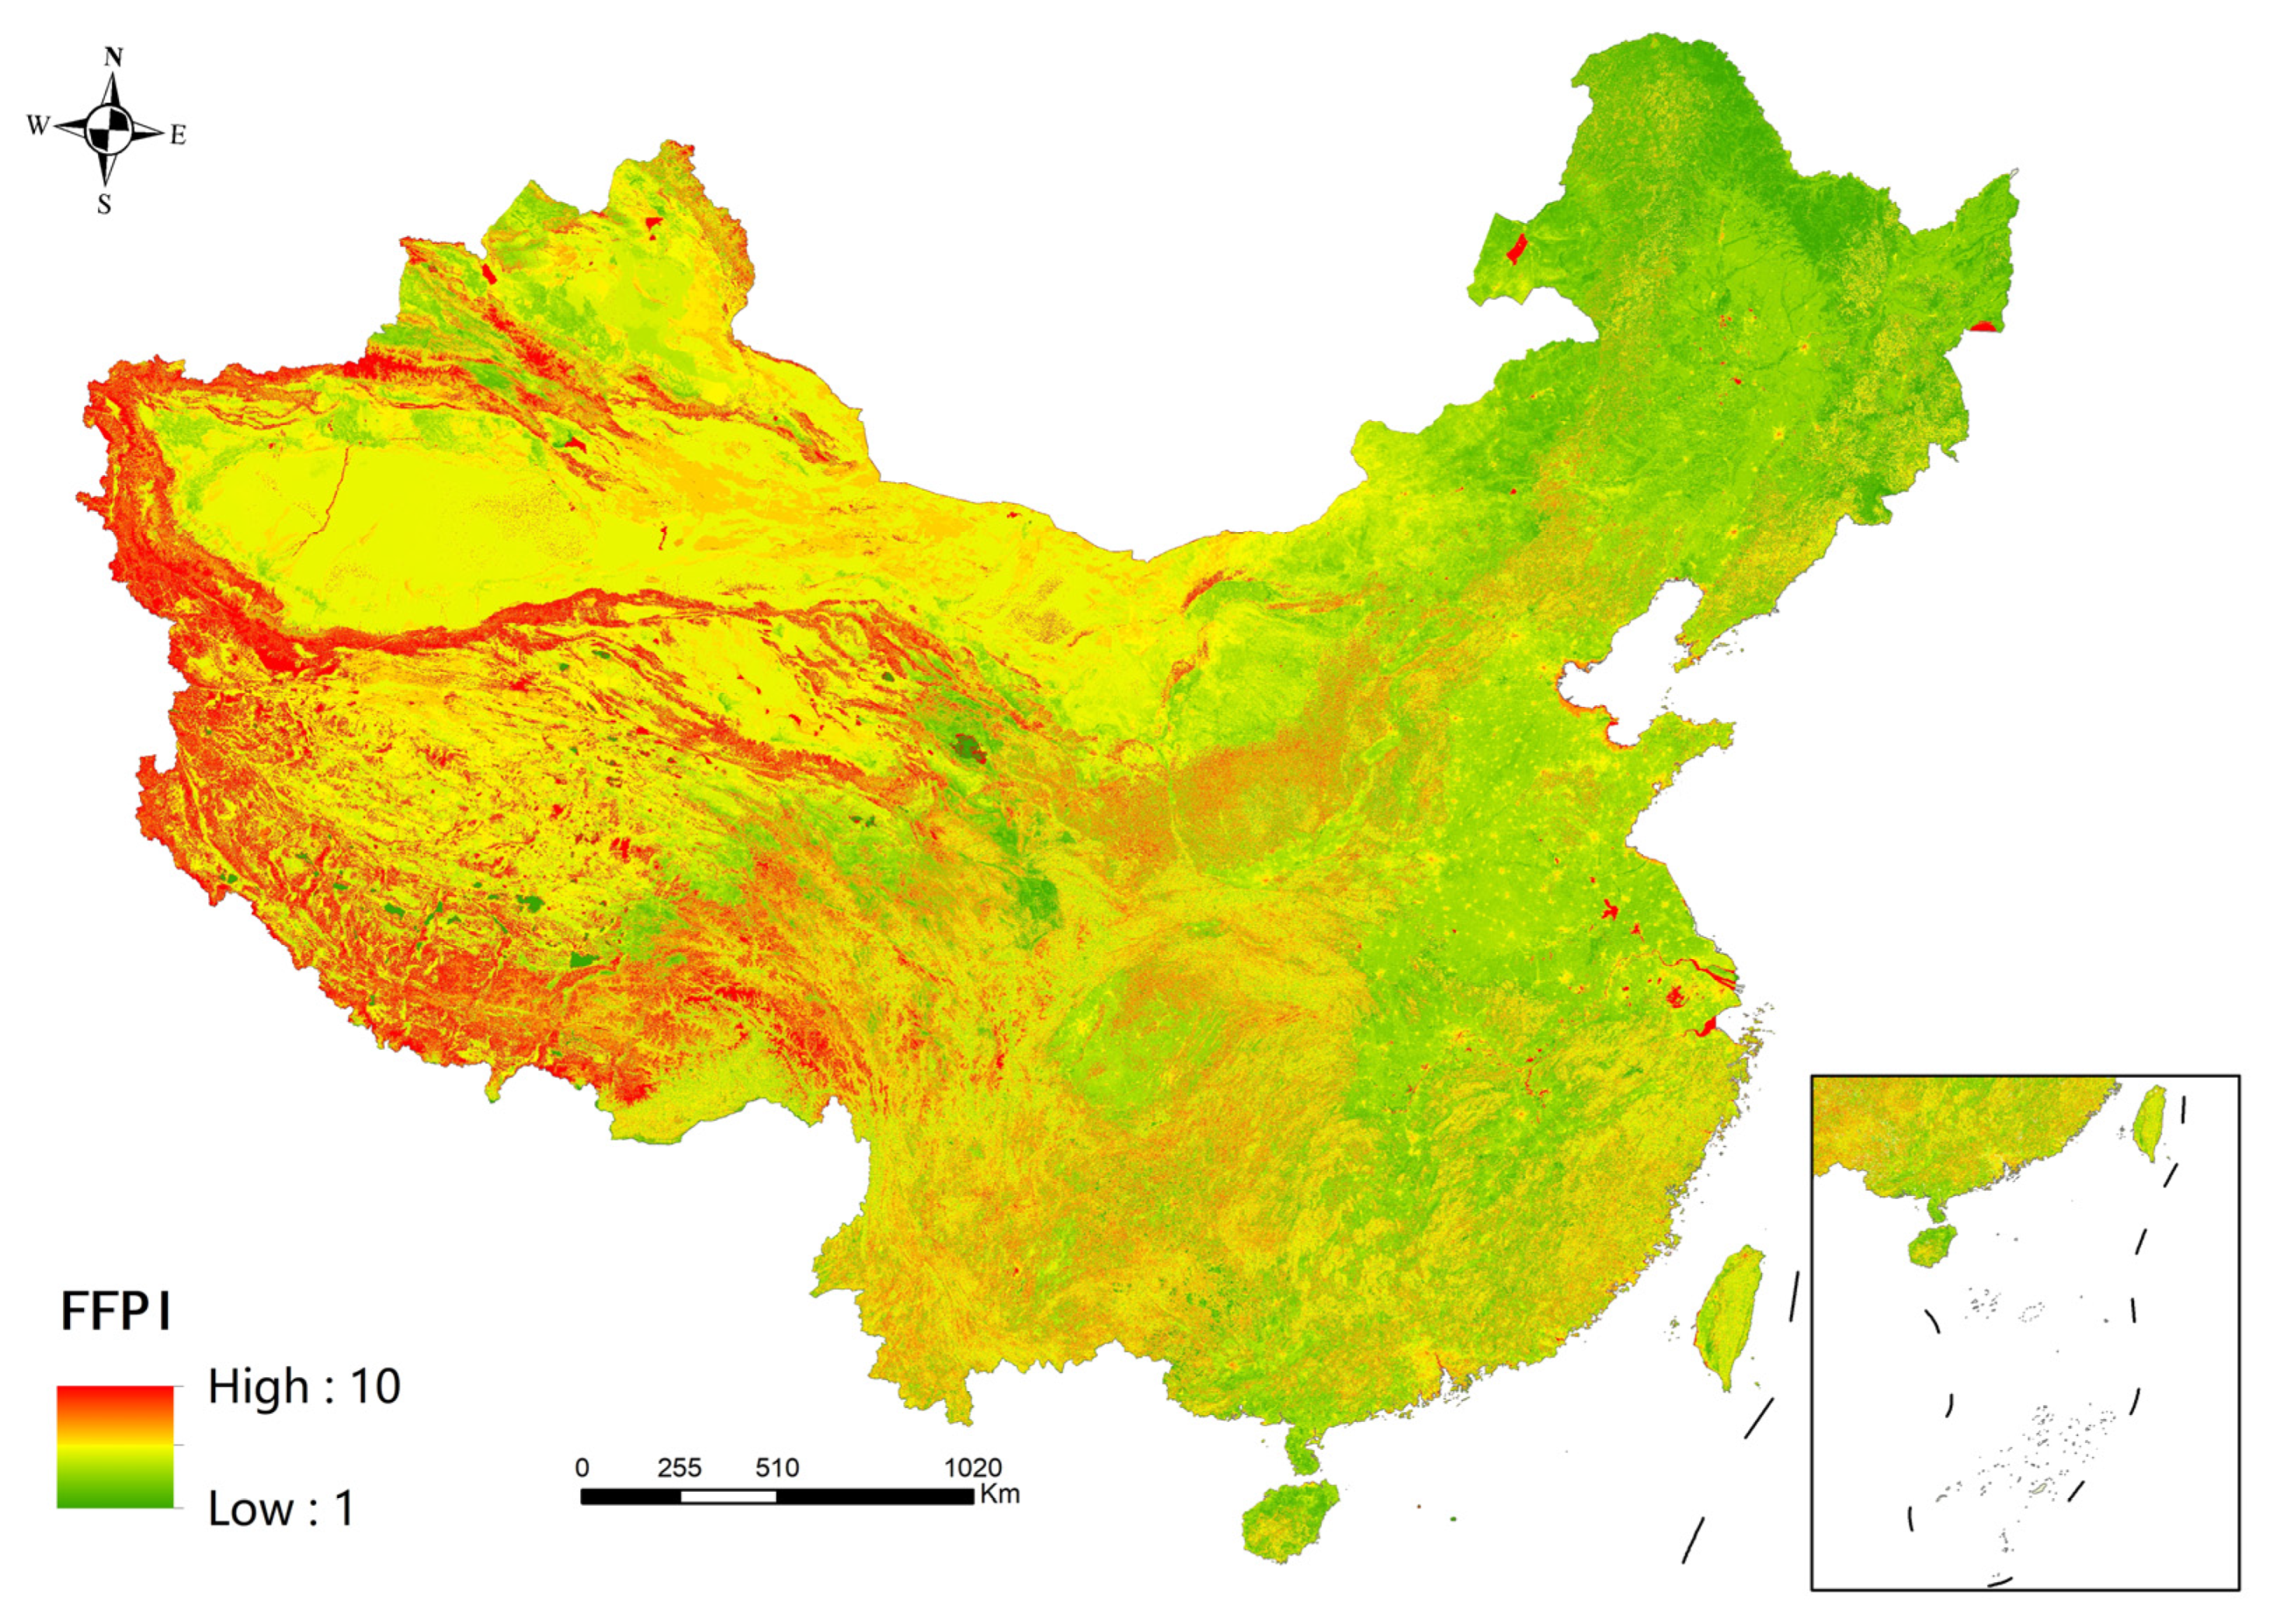
Figure 6.
Probability distribution of flash flood risk.

Table 1.
Research data.
| Data Name | Data Source | Attribute | Data Year |
|---|---|---|---|
| Precipitation | National Tibetan Plateau Data Center | 1 km, monthly | 2017–2021 |
| DEM | Resource and Environment Science and Data Center | By province, 90 m | 2008 |
| Landform Types | 1:1,000,000 | 2009 | |
| Soil Types | - | - | |
| NDVI | Annual, 1 km | 2018 | |
| Land Use | Raster data, 30 m | 2020 | |
| Population Spatial Distribution | Kilometer grid | 2019 |
Table 2.
Results of single-factor driver analysis.
| Factor | p-Value | Q-Value | Factor | p-Value | Q-Value |
|---|---|---|---|---|---|
| Precipitation | 0.000 | 0.363 | Soil | 0.000 | 0.268 |
| Elevation | 0.000 | 0.191 | NDVI | 0.000 | 0.201 |
| Slope | 0.000 | 0.221 | Land Use | 0.004 | 0.106 |
| Landform | 0.000 | 0.195 | Population Density | 0.000 | 0.185 |
Table 3.
Results of interaction detection for flash flood risk driving factors.
| PRCP | DEM | SL | Geom | Soil | NDVI | LUCC | PD | |
|---|---|---|---|---|---|---|---|---|
| PRCP | 0.363 | |||||||
| DEM | 0.594 | 0.191 | ||||||
| SL | 0.496 | 0.393 | 0.221 | |||||
| Landform | 0.548 | 0.441 | 0.415 | 0.195 | ||||
| Soil | 0.640 | 0.611 | 0.566 | 0.558 | 0.268 | |||
| NDVI | 0.494 | 0.429 | 0.374 | 0.400 | 0.530 | 0.201 | ||
| LUCC | 0.456 | 0.347 | 0.372 | 0.423 | 0.442 | 0.266 | 0.106 | |
| PD | 0.529 | 0.413 | 0.447 | 0.481 | 0.598 | 0.418 | 0.341 | 0.185 |
Table 4.
Interaction effects of flash flood risk driving factors.
| Primary Driving Factor | Q-Value | Interaction Factors with the Highest Explanatory Power | Interactive Q-Value | Interaction |
|---|---|---|---|---|
| Precipitation | 0.363 | |||
| Elevation | 0.191 | Precipitation–elevation | 0.594 | Enhanced; nonlinear |
| Slope | 0.221 | Precipitation–slope | 0.496 | Enhanced; linear |
| Landform | 0.195 | Precipitation–landform | 0.548 | Enhanced; linear |
| Soil | 0.268 | Precipitation–soil | 0.640 | Enhanced; nonlinear |
| NDVI | 0.201 | Soil–NDVI | 0.530 | Enhanced; nonlinear |
| Land Use | 0.106 | Precipitation–land ese | 0.456 | Enhanced; linear |
| Population Density | 0.185 | Soil–population density | 0.598 | Enhanced; nonlinear |
Table 5.
Classification of factors influencing flash floods and FFPI value.
| FFPI | Slope | Soil Texture | NDVI | Land Use |
|---|---|---|---|---|
| 1 | 1~5 | Loamy sandy soil | 0.8~1 | Other woodland |
| 2 | 5~10 | Forested land | ||
| 3 | 10~15 | Sandy loam soil | 0.6~0.8 | Shrubland |
| 4 | >45 | High coverage grassland | ||
| 5 | 40~45 | Loamy soil | 0.4~0.6 | Sparse woodland and moderate-coverage grassland |
| 6 | 35~40 | Low-coverage grassland | ||
| 7 | 30~35 | Silty soil | 0.2~0.4 | Bare land and paddy field |
| 8 | 25~30 | Wetland | ||
| 9 | 20~25 | Sandy clay soil | 0~0.2 | Water body and dryland |
| 10 | 15~25 | Urban and rural land and other developed Land |
Table 6.
Weights of each driving factor based on geodetector.
| Driving Factor | Q-Value | Weight |
|---|---|---|
| Precipitation | 0.363 | 0.210 |
| Elevation | 0.191 | 0.110 |
| Slope | 0.221 | 0.138 |
| Landform | 0.195 | 0.113 |
| Soil | 0.268 | 0.155 |
| NDVI | 0.201 | 0.116 |
| Land Use | 0.106 | 0.061 |
| Population Density | 0.185 | 0.107 |
Disclaimer/Publisher’s Note: The statements, opinions and data contained in all publications are solely those of the individual author(s) and contributor(s) and not of MDPI and/or the editor(s). MDPI and/or the editor(s) disclaim responsibility for any injury to people or property resulting from any ideas, methods, instructions or products referred to in the content. |
© 2024 by the authors. Licensee MDPI, Basel, Switzerland. This article is an open access article distributed under the terms and conditions of the Creative Commons Attribution (CC BY) license (https://creativecommons.org/licenses/by/4.0/).
Share and Cite
MDPI and ACS Style
Li, Q.; Li, Y.; Zhao, L.; Zhang, Z.; Wang, Y.; Ma, M. Comprehensive Risk Assessment Framework for Flash Floods in China. Water 2024, 16, 616. https://doi.org/10.3390/w16040616
AMA Style
Li Q, Li Y, Zhao L, Zhang Z, Wang Y, Ma M. Comprehensive Risk Assessment Framework for Flash Floods in China. Water. 2024; 16(4):616. https://doi.org/10.3390/w16040616
Chicago/Turabian StyleLi, Qing, Yu Li, Lingyun Zhao, Zhixiong Zhang, Yu Wang, and Meihong Ma. 2024. "Comprehensive Risk Assessment Framework for Flash Floods in China" Water 16, no. 4: 616. https://doi.org/10.3390/w16040616
Note that from the first issue of 2016, this journal uses article numbers instead of page numbers. See further details here.