Abstract
Mismanaged plastic waste threatens the sustainable development goals of the United Nations in social, economic, and ecological dimensions. In the pollution process, fluvial systems are critical transport paths for mismanaged plastic waste, connecting land areas with oceans and acting as plastic reservoirs and accumulation zones. The complex fluid–plastic particle interaction leads to a strong distribution of transported particles over the entire river width and flow depth. Therefore, a holistic plastic removal approach must consider lateral and vertical river dimensions. This study investigates the conceptual design of a comprehensive river-cleaning system that enables the removal of both floating and suspended litter particles from watercourses withstanding flow variations. The innovative technical cleaning infrastructure is based on a self-cleaning system using rotating screen drum units. In 42 prototype-scale experiments using ten representative plastic particle types (both 3D items and fragments) of five different polymer types, we prove the self-cleaning concept of the infrastructure and define its parameters for the best cleaning performance. Its cleaning efficiency is strongly dependent on the polymer type and shape. The overall cleaning efficiency for 3D items amounts to 82%, whereas plastic fragments are removed less efficiently depending on hydraulic conditions. Adaptions to the prototype can enhance its efficiency.
1. Introduction
With the start of the Anthropocene three centuries ago, humankind is a major environmental force and will be for many millennia [1]. We strongly modify the terrestrial water cycle, and new stressors to our water resources force us to improve our knowledge of the interactions between humankind and water systems, incorporating integrated water management strategies [2]. Besides heavy modifications to catchment areas and aquatic biocenoses, the increasing influence of synthetic harmful substances of any aggregate state results in challenges for sustainable water management [3]. In particular, mismanaged plastic waste (MMPW) is ubiquitous in freshwater, maritime, and terrestrial environments [4,5,6,7], so Zalasiewicz et al. propose that MMPW is a geological indicator of the Anthropocene [8,9].
A stop to the ongoing accumulation of microplastics in environments on a global scale can only be expected in the coming decades if humankind takes drastic measures [10,11]. As population growth and urbanization rates outpace our waste reduction measures, the global production of Municipal Solid Waste (MSW) will peak after 2100 [11]. Simultaneously, plastic production’s extremely rapid growth continuously increases the plastics’ share of MSW [12]. The durability of common plastic polymers and the low recycling and incineration rates mean that 76% of the plastic waste generated so far is in landfills, dumps, or the natural environment, making plastic pollution a growing global concern [9,13].
Rivers play a unique role regarding environmental pollution with MMPW: they connect terrestrial and maritime environments and thus transport land-based MMPW to the oceans [14,15,16]. They provide valuable habitats for flora and fauna and are home to millions of residents, supplying them with food, drinking water, transportation routes, and recreational areas. Although many studies regarding MMPW in the environment analyze marine plastic pollution or microplastics, Blettler et al. emphasize the need to target the pollution of freshwater systems with macroplastics [17].
Regarding mass, macroplastics comprise the most significant proportion of MMPW emitted to the oceans by rivers [14,18]. Additionally, the biochemical and physical forces acting on macroplastics in riverine environments make the fragmentation of macroplastics into smaller sizes the primary source of microplastics in rivers [19,20,21]. MMPW constitutes an increasing threat to freshwater ecosystems and their biodiversity. Plastic particles of any size show harmful ecological impacts on invertebrates, fishes, amphibians, reptiles, birds, mammals, and even algae and plants [22]. Monitoring studies spotlight high ingestion rates and rates of entanglement of freshwater fish, birds, and mammals, negatively affecting the reproduction and growth of these species’ populations [23,24,25,26].
The observed damage to fluvial and maritime ecosystems by MMPW also leads to significant economic damage to various sectors, especially fishery, aquaculture, and tourism [4]. Regions with high biodiversity, such as the Coral Triangle in Southeast Asia, not only represent unique habitats that are particularly worthy of protection, such as coral reefs and mangrove forests, but they are also extraordinary tourism destinations and diving hotspots. Rising plastic pollution in this region causes economic losses due to reduced fish populations and tourist attractiveness [27]. Estimations of the global annual financial losses due to marine plastic pollution range from USD 6 to 19 billion per year [28,29].
Furthermore, MMPW interacts with hydraulic infrastructures and causes severe clogging in drainage systems, racks, dams, and hydropower plants [30,31,32,33]. In experiments about the water level increase by waste accumulation at rack structures, Honingh et al. documented a significantly more substantial rise in the upstream water level due to plastics than for other organic materials [34]. As river plastic transport correlates with river discharge, MMPW significantly increases the risk of severe flooding in urban areas and loss of electricity production and supply in case of flood events [35]. A first study about the riverine plastisphere identified a distinct set of potentially pathogenic bacteria and Antimicrobial Resistance Genes (ARGs) in the microbiome of plastics in rivers [36], which can pose a health risk to humans and animals [37].
In summary, MMPW in rivers endangers residents’ livelihoods and negatively impacts achieving sustainable development goals in environmental, social, and economic dimensions [4,38]. In the draft resolution “End Plastic Pollution”, the United Nations Environment Assembly identifies the urgent need to stop the ongoing plastic accumulation in the environment by legally binding instruments and action plans to prevent, reduce, and eliminate MMPW [38]. The EU Action Plan towards zero pollution for air, water, and soil formulates ambiguous zero pollution targets for 2030 as reducing plastic litter at sea by 50% and microplastics released into the environment by 30% [39]. To fulfill these goals, stakeholders and political decision-makers require valid and detailed information about practical and effective engineering or legislative measures to create awareness and tackle the pollution of the environment [39,40].
The latest findings demonstrate that MMPW can remain in rivers for several years or even decades as mobilization, accumulation, and remobilization processes dominate the plastic transport rate [30,41]. Based on this observation, the urgent global task to end plastic pollution needs a systematic clean-up of river ecosystems accompanied by further steps such as ecological restoration and reduction and prevention measures for MMPW [22]. The assessment and technological development for plastic removal still need to be improved, demanding new waste removal concepts for rivers [17].
While the first technological solutions to collect marine and riverine plastic pollution offer positive steps and results, they also show limitations in tackling the problem alone and highlight challenges in scale and life-cycle stages [42]. Developed solutions reveal knowledge gaps and constraints, such as a lack of harmonized terminology and data and the need for more information on efficiency and environmental impacts [43,44]. Most of the devices focus on capturing floating macroplastics, although a significant ratio of riverine plastic transport occurs in suspension along the water column [44,45,46]. Schmaltz et al. identify most collection technologies for the category “boats and wheels”, which have constraints in their operation during high discharges due to security issues when we expect high transport rates of plastics [35,42,47]. Besides inefficiency and limitations, clean-up technologies can have unintended negative impacts on ecosystems caused by bycatch or the removal of organic matter, requiring new regulations and assessments to maximize the benefits of clean-up technologies [48].
Considering the criteria mentioned, this study examined the conceptual design of a comprehensive river-cleaning system to balance cleaning efficiency and environmental compatibility. In prototype-scale experiments, we tested the functional principle of the innovative river-cleaning system that removes floating and suspended MMPW from watercourses. The cleaning device for flowing water bodies aims to eliminate MMPW from rivers and prevent it from drifting further downstream and finally emitting into the oceans [49]. The system will operate continuously throughout the year to enable the removal of MMPW, especially during seasons and events with higher discharges.
The working principle of the cleaning device relies on a series of screen drum units and their self-cleaning mechanism. While the circular horizontal bar racks stop fluvial-transported plastic particles, the rotation of the drums moves the stopped plastics to the side of the installed scrapers, removing the debris from the screen drum. This principle hinders clogging effects and provides a self-cleaning mechanism. This effect enables the transport of stopped plastics toward the riverbank by aligning a series of screen drums, where the debris is finally removed from the river [49,50].
Macroplastics can be found in aquatic environments as solid objects of almost all sizes and shapes, differing in density, stiffness, and other characteristics, leading to diverse particle–flow interactions based on varying buoyancy and sensitivity to turbulence [4,51]. Due to changing hydraulic conditions at reference sites caused by tidal and monsoon influences and additional rack–flow interactions, we also expect heterogeneous plastic particles to have different behavior at cleaning devices. Therefore, this technological cleaning device with many degrees of design freedom should be tested for the most diverse and comprehensive particle samples and hydraulic conditions when testing its functionality and ability for comprehensive waste removal from rivers.
Consequently, this study was intended to test the functionality of the cleaning method and to find first limitations and optimizations in its operation. We hypothesized that (i) the system’s functionality fundamentally depends on the orientation of the cleaning modules to the main flow and the rotational speed of the individual screen drum units. Based on complex particle–fluid interactions, we expected that (ii) the cleaning efficiency would vary significantly for macroplastic particles that differ in density, size, stiffness, and shape, as well as (iii) for changing hydraulic conditions.
2. Materials and Methods
2.1. River-Cleaning Concept
The investigated river-cleaning concept is based on the self-cleaning mechanism of screen drum units [50] shown in Figure 1. The circular horizontal bar racks rotate around their vertical axis and have vertically aligned scrapers next to them. So far, screen drums have been used at intake structures of cooling channels for thermal powerplants to prevent the entry of floating and suspended debris and fish into canals [52]. In this application, the row of screen drums is arranged in line with the riverbank and parallel to the river’s main flow direction [52]. In the new intended application for macroplastic removal in fluvial systems, the series of drums cross the river such that the row of screens builds an acute angle with the embankment line. This means that the river flow attacks the rack structure directly, which results in higher dynamic and static exposure. Due to the frontal flow attack of the system, we expect a divergent behavior in the flow and the transported particles interacting with the horizontal bar racks. In addition, the new alignment raises fundamental demands on the rack structure regarding fish mitigation, navigability, sediment transport, stability, and flood security.
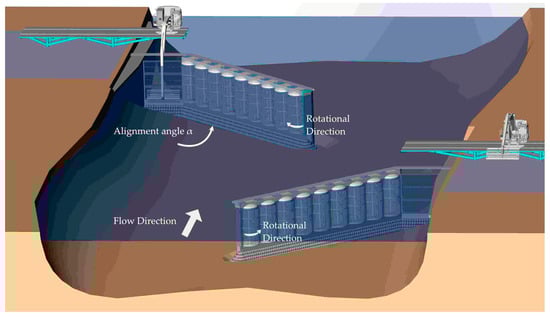
Figure 1.
Sketch of the functional principle of the river-cleaning device. Based on the patent specification DE102017004347B3 [47] and adapted with permission from Fuchs et al. [48].
The river-cleaning device, illustrated in Figure 1, compromises two opposite rows of screen drum units connected to the respective riverbank via vertical trash racks to cover the whole cross-section of the flow [50]. Both modules cover between 50% and 70% of the river width and have a respective distance from each other to ensure the navigability of the affected river section and to achieve a cleaning effect for the entire river width [49]. A similar arrangement of modules has been recommended for removing large wood debris to provide hydraulic continuity and minimum impact on water level increase [53]. Each screen drum of a row rotates in the same direction towards the corresponding riverbank, passing stopped particles to the vertical trash rack. Trash rack-cleaning machines are installed at the riverbank to remove collected MMPW. The vertical trash rack elements are perpendicular to the riverbank, while the rows of screen drums show an inclination angle α towards the main flow direction of the river, defined in Figure 1. A classic trash rack cleaner, such as a hydraulic gripper, removes the collected material from the river course. On land, further sorting and processing steps start [49,50].
Covering the entire river width is crucial for many locations: observations of floating particles on European and Asian rivers show a wide horizontal distribution of plastic load along the full river width. For most rivers, more than 80% of the river width accounts for 90% of the total transported plastic items [54]. The critical factor for the horizontal distribution is the flow velocity, resulting in a strong influence from secondary currents in meanders. Additionally, this leads to varying transport paths over time due to tidal and seasonal variations in discharges and flow velocities. Further influencing factors such as wind speed, direction, and shipping traffic lead to random behavior [4,55,56].
This study focuses on the ability of the facility to remove macroplastics from streams, considering hydraulic conditions and observed plastic transport processes. In addition to floating transport rates, the concept also aims to remove suspended materials. Monitoring studies investigating the vertical distribution of transported plastics highlight a significant share of 21–34% of the plastic to be transported below 1.5 m under the water surface [45,55]. Laboratory experiments underline the importance of turbulent forces and diffusion in ratio to buoyancy and surface tension and identify more suspension load for more turbulent flows [51]. This results in higher vertical mixing of transported MMPW during higher discharges [57]. Therefore, we expect the highest macroplastic transport rates and higher vertical mixing and distribution for high discharges demanding cleaning solutions for suspension load.
Various modeling studies to estimate global riverine plastic emissions into the oceans based on hydrological data, data on population density, MMPW, etc., show a dominant contribution by the Asian region, especially Southeast Asia [14,15,16,58]. Cleanup activities in these areas promise a very significant impact. Therefore, river-cleaning solutions should consider the prevailing hydrological and hydraulic conditions, dominated by substantial seasonal variations in discharge, water levels, and flow velocities due to changes in wet and dry seasons. Tidal influences also lead to daily variations in hydraulic conditions at many relevant locations for cleaning activities [50,59].
In order to meet these conditions, further adjustments are made to the cleaning concept, deviating from the illustrations in Figure 1: The row of drum screens is not fixed to the riverbed but adjusts its vertical position to the changing water levels using a floating body on top of the drum screens. In the case of low-flow conditions, fixed bearings ensure a minimum distance of the drums to the bottom to ensure sediment continuity and hinder deposition processes at the rack structures. Hereby, the water surface interferes with the horizontal bar rack of the screen drums. The free cross-section below the drums enables fish mitigation by creating higher flow velocities below the racks and forming an attracting current. In high-flow conditions, the closed floating body on top of the screen drums lifts the rack structure.
The floating body is a fully enclosed housing around the motors of the screen drum units. Therefore, large flow depths result in a different interaction of the cleaning unit with floating MMPW and the top layer of the current. In this hydraulic state, the water surface no longer interferes with the horizontal bar rack but with the closed floating body. Additionally, the structure lift enlarges the free-flowing cross-section under the screen drums, increasing the discharge capacity.
In this context, there are conflicting objectives between the cleaning effect over the entire cross-section for each discharge, the prevention of additional afflux in critical discharge conditions, and morphological and ecological requirements. Therefore, investigations and tests of the planned infrastructure are mandatory to balance these objectives and optimize the design and ratios of the system.
The cleaning system aims to guarantee the removal of floating and suspended plastic particles up to a design flood discharge. In extreme events, such as severe floods, extreme loads of driftwood, additional loads by ice drift, or ice cover, the entire row of drums can be rotated towards the riverbank via a pivot bearing at the vertical trash rack. This rotation opens the cross-section of the river to discharge the flood wave, a load of ice, or driftwood and prevent hazardous afflux and damage to the cleaning system itself.
2.2. Prototype-Scale Experiments
In prototype-scale experiments with representative plastic items and fragments, this study investigated the self-cleaning mechanism of the presented application of a river-cleaning device based on data collected in Fuchs et al. [50].
In laboratory tests to investigate the vertical flow depth distribution for positively buoyant plastics, Zaat et al. determined different rising velocities and vertical distributions for different fragment sizes of the same plastic polymer [60]. These observations highlight concerns about down-scaling plastic particles for investigations of plastic transport. Valero et al. identified two types of plastic transport in turbulent river-like flows: surfaced and suspended plastics, each dominated by different forces. Following their results, the plastic transport can be described by the ratio of buoyancy to turbulent forces, equivalent to the Rouse number, and by the ratio of surface tension to turbulent diffusion, compromised to an inverse (plastic-based) Weber number [51].
Compliance with these force ratios when scaling down for hydraulic model tests is not feasible, considering the rules of Froude scaling for open channel flows. In particular, concerning the heterogeneity of the relevant plastic particles, expressed in variable sizes, geometries, shapes, deformability, and air-attachment abilities [60]. A further risk for scale effects in this application is correctly representing the flow–rack and particle–rack interactions. Down-scaling can overrepresent the viscous effects on the flow at the vena contracta for small bar spacings.
2.2.1. Examined Plastic Materials and Particles
Since plastic composition shows high variability in different river catchments, along a river course, and over time [54,55,61,62], we did not replicate the mixture of plastic litter and the rate of a specific case study. Instead, we considered relevant polymer types and select item forms based on the main applications of each polymer type based on the frameworks of visual identification used in monitoring studies [4,63].
To consider ongoing fragmentation processes in river courses, we include fragments of each plastic item in the experiment materials [19,64]. These fragmented particles show different mechanical properties than the original particles and enable comparisons between same-shaped fragments that differ in density and stiffness.
We used five different polymer types in the experiments: PET (Figure 2a), PS (Figure 2b), ePS (Figure 2c), HDPE (Figure 2d), and LDPE (Figure 2e). Three of those are positively buoyant polymer densities, and two are negatively buoyant. The items’ forms range from bottles to mugs, bags, and stiff containers [50].
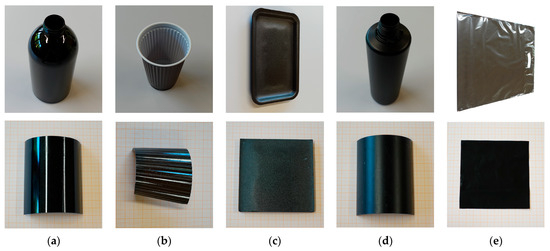
Figure 2.
Tested polymer particles with divergent polymer types PET (a), PS (b), ePS (c), HDPE (d), and LDPE (e) in full 3D item (first row) and related fragment (second row).
Figure 2 shows the tested particles including PET bottles with a height 169 mm and diameter of 78 mm. The HDPE bottles differ in their form with a height of 213.5 mm and smaller diameter of 65 mm. The smallest cylindrical particles are the PS mugs with a height of 96 mm and diameter of 44 mm. The ePS-tainers have a rectangular area of 218 × 135 mm with a small elevation at the boundaries of 17 mm. The LDPE bags have edge lengths of 380 mm and 450 mm. Further properties are listed in Table 1.

Table 1.
Material properties of tested plastic particles developed from Fuchs et al. [50].
The squared quasi-2D fragments cut out of the 3D objects have an edge length of 0.1 × 0.1 m despite the PS fragment having an edge length of 0.1 × 0.05 m. Due to the particles’ prevailing stiffness, PET, PS, and HDPE fragments are not flat and retain their original bend. No smaller pieces were examined on this test stand to ensure the visibility of the particles in the experiments. For the same reason, black-colored materials were used. The dark color increases the contrast to the water and makes it easier to identify the flow paths of the particles.
2.2.2. Experimental Setup
The prototype-scale tests were carried out in the outdoor area of the Oskar von Miller Institute for Hydraulic Engineering at TUM from September 2022 to November 2022. A top view of the laboratory channel is sketched in Figure 3. The used trapezoidal channel of 63 m in length had a bottom width of 4 m and a top width of 9 m at a height of 1.2 m. Grass cover characterized the banks, whereas coarse gravel covered the riverbed. At the end of the flume, an asymmetrical widening on both sides of the banks transformed the trapezoidal shape into a rectangular flume profile of 10.1 m width. The bed and banks of this section (6.4 m in length) were made of concrete. Using formwork panels (Figure 3a) on the orographic left side reduced the channel width to 8.9 m, enabling higher approach flow velocities in the test runs. Figure 3 illustrates the described setups at the test stand.
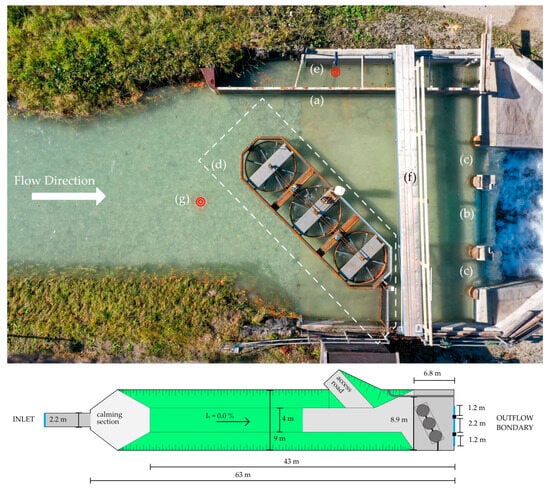
Figure 3.
Top: experimental set-up adapted with permission from Fuchs et al. [48]: (a) formwork panel, (b) gate, (c) additional outlets, (d) prototype, (e) water level gauge, (f) mobile measurement platform, (g) velocity measurement point. Below: global top view of the experimental set-up (not true to scale).
A gate with a width of 2.2 m (Figure 3b) controlled the flow depth and approach flow velocity at the end of the test stand. Additional outlets 1.2 m wide (Figure 3c) to the right and left of the gate provided further necessary discharge capacities. Depending on the required hydraulic conditions, these could be closed stepwise with dam beams. The discharge of the test stand was regulated upstream at a sluice gate in the research institute’s cascade of reservoirs. We determined the discharge via the overflow height at a further sharp-crested measurement weir upstream of the experiment. With the help of calming elements, floating bodies made of Styrodur and wood, at the beginning of the trapezoidal channel, we calmed the current and prevented surface waves.
The prototype of the cleaning system (Figure 3d), shown in detail in Figure 4, comprises all relevant components:
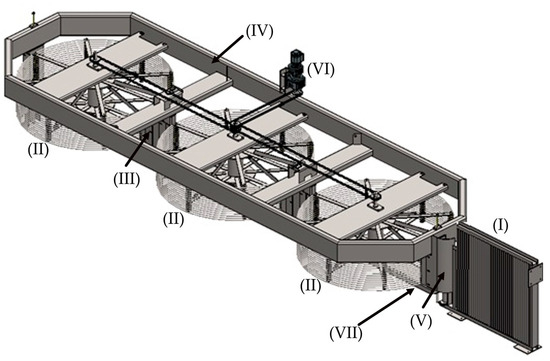
Figure 4.
Engineering drawing of the prototype containing (I) vertical trash rack, (II) screen drum unit, (III) scraper, (IV) floating body, (V) pivot bearing, (VI) motor, (VII) frame tubing.
- A section of the vertical trash rack (Figure 4(I)) is installed on the right bank, 3.8 m upstream of the outflow boundary;
All parts were made of steel. The screen drums had a diameter of 2.0 m and a height of 0.5 m. The rack bars were cylindrical with a diameter of 16 mm. The bar spacing was 15 mm. Scrapers with a width of around 0.5 m were fitted between the drums. A Sew Eurodrive spur gear motor (Figure 4(VI)) drove all three drums via a chain and sprockets all at the same rotational speed at a time.
The drums, scrapers, and the drive were mounted to the frame constructed of rectangular steel tubings of 0.1 × 0.3 m. Therefore, the drums did not stand on the channel bed but on a frame tubing with a height of 0.1 m. To enable the observation of the interaction between particles, rack, and scrapers, the underbody of the floating body was not executed. Therefore, the floating body was implied by its vertical frame design with a height of 0.3 m and five beams to fixate the axis of the screen drums and the chain. The complete module with the implied float had a total length of 7.4 m and a height of 0.9 m. The edges of the float were chamfered at a 45° angle. The vertical trash rack on the bankside had a width of 1.4 m and a height of 1.2 m. The rectangular bars showed a thickness of 6 mm and a clear width of 30 mm.
Installing a pivot bearing at the joint between the vertical trash rack and the row of screen drums enabled the module to set different alignment angles of 45°, 70°, and 75° regarding flow direction. For the 75° alignment angle, the entire flow width up to the mobile wall of formwork panels was covered by the module, while a flow section remained free for the other two angles.
The widening, installation of the different modules, and the very short distance to the gate resulted in very irregular water levels with horizontal and vertical inclinations across the active channel. For this reason, a water level gauge (Figure 3e) was installed behind the mobile wall: the water level measured at this position represents the total prevailing energy height since no velocity occurs in this section. Additionally, a mobile measurement platform (Figure 3f) was installed over the entire test stand. The platform could be adjusted to different test settings and enables the visual observation and record of flow paths of particles at the cleaning prototype and interactions between particles, rack, and scraper.
2.2.3. Experimental Procedure
We added plastic particles 25 m upstream of the cleaning prototype in a water depth of 5 cm below the water surface for each test run. Particles were released at the lateral section corresponding to the drum farthest away from the vertical rack to achieve a worst-case scenario regarding lateral particle transportation, including 30 particles of each polymer type and size class. After quickly adding 30 identical particles, short pauses before the next particle class hindered the interaction between different particle classes at the rack structures and enabled individual observations and evaluations for each particle class.
We observed the particles’ interaction with the cleaning module from the measuring platform. Defined cases of failure of the waste transfer to the bank described in Chapter 2.3 were counted and protocoled for all particle classes. In addition, the tests were continuously filmed and documented from two camera positions: one camera was positioned on the measuring bridge above the module; the other recorded the transfer across the module from the orographic righthand bank side. After a test run, we manually collected trapped particles at the vertical trash rack and quantitatively evaluated the cleaning efficiency for each test run for all particle classes. In addition, the failure case protocols supported the identification of the error sources in the transfer process.
Before each test started, we controlled the approach flow depth and approach flow velocity. Regarding the one-point method [67], we measured the depth-averaged mean flow velocity at a height of 0.37 × h using the vane wheel flow sensor HFA (Höntzsch, Waiblingen). The approach flow velocity was measured in a central position (g in Figure 3) of the channel, 3 m in front of the concrete riverbed. At this measurement point, we did not assume any influences on the determined approach flow by the different test settings. For each test run, we made three measurements each over an average time of 30 s. This method ensures a valid determination of the time-averaged approach flow velocity.
Both parameters of hydraulic conditions and prototype parameters were varied and are listed in Table 2. The hydraulic conditions varied in water depth (0.40 m and 0.75 m) and velocity (0.2, 0.4, 0.6, 0.8 m/s). The rotational speed and the alignment angle of the module of screen drum units are parameters of the tested prototype. The selected rotational speeds were 1 rpm, 3 rpm, and 5 rpm, whereas the considered alignment angles were 45°, 60°, and 75°.
Table 2.
Experimental procedure testing hydraulic and prototype parameters of h—water level, v—flow velocity, Q—discharge, Re—Reynolds number, Fr—Froude number, α—alignment angle and ν—rotational speed.
At the smaller flow depth of 0.4 m, the water surface is at the level of the horizontal bar racks of the drum screens. This test setup corresponds to a natural condition at low flow depths without the module floating. At the greater flow depth of 0.75 m, the water surface is at the middle height of the frame of the implied floating body. This setup corresponds to natural conditions from the buoyancy of the entire module for large flow depths. In this situation, we only tested one rotational speed of 3 rpm. At a flow depth of 0.40 m, flow velocities of 0.2 m/s, 0.4 m/s, 0.6 m/s and 0.8 m/s were investigated. Limitations in the discharge capacities at the test stand only allowed an investigation of the approach flow velocities of 0.2 m/s and 0.4 m/s for the flow depth of 0.75 m. Overall, however, the parameter variations cover representative ranges of the Froude and Reynolds number, which allows conclusions to be drawn for natural sites.
As this study aimed to investigate hydraulic influences on the system’s ability to remove MMPW from rivers for different setups as comprehensively as possible, we conducted in total 42 prototype-scale experiments (see Table 2) and tested 11,340 particles. Potential sites for the cleaning device are influenced by varying discharges, water levels, and flow velocities, reproduced in the prototype-scale experiments concerning limitations in scale and capacities. The scope of the hydraulic conditions tested and the number of plastic particles give the results appropriate significance.
2.3. Data Analysis
The evaluation of collected data refers to infrastructure parameters, hydraulic conditions, and plastic particle types. The target figure was the percentage of cleaning efficiency. This value was defined as the percentage of added particles that could be stopped by the prototype and transported to the vertical rack.
For the evaluation, we did not consider particles that floated aside from the cleaning device between (d) and (a) in Figure 3 since real lateral coverage of a river section is significantly affected by the interaction of two consecutive cleaning modules instead of the one used in the experiments. Furthermore, the gap between the left riverbank and drum row differed depending on the alignment angle and would, therefore, falsify the results.
Fragments of PET were excluded from evaluation since those particles settled just after being released in the upper centimetres of the water column and were not transported further downstream. The interaction of these particles with the interstitial in the coarse gravel led to sedimentation processes.
Through standard statistical analysis, like mean value determination, standard deviation, and linear regression models, we evaluated the results using MATLAB (R2018b). Regarding hypotheses (i) to (iii), the results focus on different aspects, leading to a three-step differentiated analysis. In the first step, we analysed the overall cleaning efficiency separately for different alignment angles and rotational speeds. Therefore, data based on the same flow depth of 0.40 m were used for evaluation. Step two evaluated effects and observations for differing plastic types and shapes using flow depth and approach flow velocity as variables determining cleaning efficiency. In the third step, failure analysis was conducted to identify sources for unsuccessful removal via the prototype. Therefore, we distinguished four failure cases proportionate to the total failure amount:
- (1)
- Particle loss due to passage through the drums.
- (2)
- Particle loss due to passage through a gap between scrapers and drums.
- (3)
- Unsuccessful transport to the vertical trash rack due to trapping at a drum.
- (4)
- Unsuccessful transport to the vertical trash rack due to trapping at a scraper.
The failure processes of each case are sketched in Figure 5. The cases were classified by observations and documentation under the assumption that after the observation time of 5 min, no change in failure class occurred anymore.
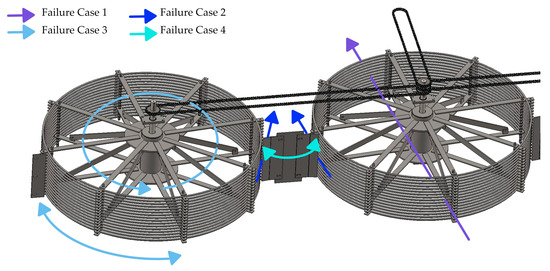
Figure 5.
Process sketch of failure cases 1–4.
3. Results
3.1. Prototype Parameters
Prototype parameters were first analyzed to find the best practice for the cleaning device. Therefore, results concerning the rotational speed and alignment angle were evaluated for experiments with flow depth of 0.4 m. Figure 6 illustrates the evaluation across all polymer and size classes using a scatter plot for each test’s cleaning efficiency and a linear fit representing experiment of each approach flow velocity. Individual experiments are plotted by crosses and linear fits by dashed lines, both marked in the related color. An averaged linear fit was generated, averaged over all approach flow velocities for each alignment angle, and is plotted as a red line. It turns out that cleaning efficiency is highest when using an alignment angle of 45°. In this case, the average cleaning efficiency over all rotational speeds, flow velocities, plastic types, and shapes amounts to 60%. In contrast, in the case of 60° and 75°, the cleaning efficiency decreases significantly to 40% and 33%, respectively.
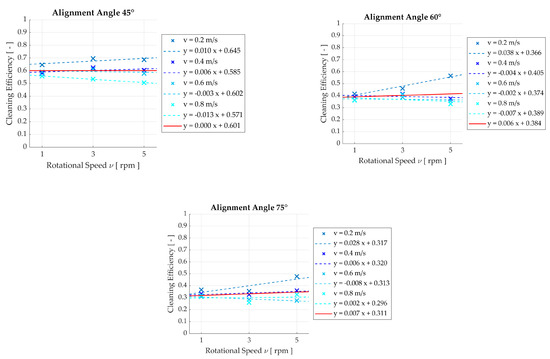
Figure 6.
Linear regression analysis of the cleaning efficiency depending on the rotational speed separately for differing approach flow velocities (v) and alignment angles.
The results of the test runs show almost no dependence of the cleaning efficiency on the rotational speed. Nevertheless, there are weak correlations between efficiency and approach flow velocities combined with rotational speeds, similar at all three alignment angles: higher flow velocities combined with lower rotational speed result in higher cleaning efficiency. At the same time, low approach flow velocities combined with higher rotational speeds also result in higher cleaning efficiencies. The linear regression models for the individual flow velocities illustrate these slight trends very well. The minimal gradient in all linear regressions illustrates the low dependence of the cleaning efficiency on the rotational speed. The Root Mean Square Errors (RMSEs) for the linear regression models for all velocities are in the range of 0.06 for all three cases. Minor differences in the RMSE occur for the individual trends for each flow velocity regarding the alignment angle. For 45°, all RMSE values lie between 0.002 and 0.025; the RMSE value range extends from 0.005 to 0.054 for the two larger angles.
The highest cleaning efficiency is reached in all three alignment angles using the lowest approach flow velocity and highest rotational speed. Generally, the cleaning efficiency decreases slightly with increasing flow velocity, but in the case of the alignment angle of 75°, the lowest cleaning efficiency occurs using the second largest flow velocity.
The change in cleaning efficiency due to rotational speed was calculated by the difference of the absolute maximum value of all linear fits and the related minimum value, for each alignment angle separately. The average maximum was determined by using same procedure but for the averaged linear fit. It reaches an absolute maximum of 3.9% and an average maximum of 0.0% in the case of an alignment angle of 45°. For an alignment angle of 60°, those values increase to an absolute maximum of 11.4% and an average of 1.8%. In contrast, an alignment angle of 75° shows an absolute maximum of 8.4% and an average of 2.1%. The results of angles > 45° indicate that the change in cleaning efficiency due to rotational speed is slightly higher for lower flow velocities (0.2 m/s and 0.4 m/s) than for higher velocities (0.6 m/s and 0.8 m/s). In contrast, the results for the alignment angle of 45° show no dependency.
An alignment angle of 45° significantly provides the best results regarding cleaning efficiency and is therefore used for further evaluation. Since the deviations of cleaning efficiency depending on the rotational speed in this case amount to 0.0% on average and reach the highest value of 3.9%, evaluations according to plastic types and forms and failure cases were conducted, neglecting the influence of rotational speed.
3.2. Plastic Particle Type and Shape
Figure 7 summarizes cleaning efficiency results depending on the varied hydraulic parameters, the approach flow velocity, and the approach flow depth separately for all tested polymer types and shapes at an alignment angle of 45°. The inner dots show the cleaning efficiency for the fragments via color scaling, and the circles show the efficiency for 3D items via the same color scaling. For the small flow depth of 0.4 m, the results of the three tested rotational speeds are averaged and presented together. For the large flow depth of 0.75 m, we carried out only one test at a rotational speed of 3 rpm for each setup and hydraulic condition, so the color here reflects the result of the individual test.
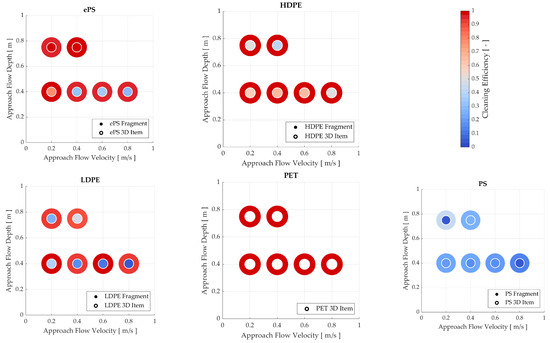
Figure 7.
Cleaning efficiency of different polymer types and fragments depending on approach flow velocity and approach water depth.
Figure 7 shows an apparent discrepancy between fragments and 3D items by examining their cleaning efficiency. While polymer 3D items, excluding for PS mugs, were removed with a minimum cleaning efficiency of 91% at all approach flow velocities and flow depths, removing fragments was significantly less efficient. The global average cleaning efficiency of 3D items is 82%, while PS items have the worst cleaning efficiency of 21%. If PS is excluded, the average cleaning efficiency for 3D items is 98%, close to 100%. Overall, the cleaning efficiency of PS is significantly worse for 3D items than for all other polymer types. The data show no clear correlation between cleaning efficiency, flow depth, and velocity in the case of 3D items for ePS, HDPE, LDPE, and PET polymer types.
There is a global trend for the cleaning efficiency of the fragments: the lower the approach flow velocity, the higher the cleaning efficiency. The removal of HDPE and PS fragments is worse at the tested higher flow depth, whereas the higher flow depth positively influences the removal of ePS fragments. ePS fragments at the high flow depth of 0.75 m show the best cleaning efficiency among all fragments, with an average cleaning efficiency of 100%. LDPE fragments show no clear correlation with the water level but lead to poor cleaning efficiency compared to ePS and HDPE, especially at high flow velocities. Particles of the polymer type PS, both fragments and 3D items, increase their cleaning efficiency with decreasing flow velocity and increasing water depth (see Figure 7).
3.3. Failure Classification
Failures at an alignment angle of 45° were classified according to failure cases and are summarized in Figure 8. The portions of the failure cases are related to the total amount of observations for unsuccessful removal per plastic category, leading to differing sample sizes per plastic category. We could not observe all losses during the experiments. Therefore, the data set is not comprehensive. Nevertheless, the observations provide a good overview of the proportions of the frequency of the failure cases to each other. These data indicate well the weak points of the cleaning system and thus potential for improvement.
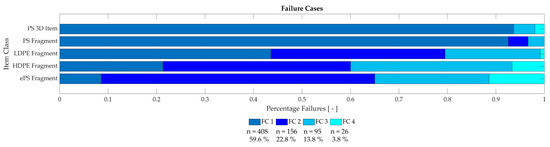
Figure 8.
Portions of failure cases (FC 1–FC 4) depending on item class. n—amount of observed fails for each FC, respectively (percentage in relation to all observed failures below).
Failure case 1 (FC 1) represents the loss of particles due to passing through the drums. Here, the horizontal bar racks do not stop the transported particles. Failure case 2 (FC 2) describes the loss of particles due to passing through the gap between scrapers and drums. Failure case 3 (FC 3) means a failure of transport to the vertical trash rack, either by missing the movement of stopped particles by drum rotation or due to the trapping of particles inside a drum. Failure case 4 (FC 4) means a transport failure to the vertical trash rack due to trapping at a scraper. The results highlight that the frequency of failure cases depends strongly on the item class. Figure 8 shows the percentage distribution of the observed failure cases for all item categories with an average cleaning efficiency of less than 94% across the tested hydraulic conditions.
We observed, clearly identified, and documented 685 failures for 2100 added particles for these selected item classes. The highest share of the losses, with a ratio of 59.6%, belongs to the category FC 1 due to passages through the screen drums. Least often, we identified FC 4, with only a 3.8% share of the total observed cleaning failures, for lacking transport at the scrapers. The ratios for FC 2 and FC 3 are at 22.8%, 13.8%, respectively. Figure 8 additionally lists the total number of observed failures for each case. In addition to this overall distribution, there are considerable differences between the FC 1–4 ratios for the different plastic categories.
PS cups are the only 3D item fulfilling this assumption, having a cleaning efficiency of 21%. Removing this item class is unsuccessful in 93% of cases due to passage through the drums (FC 1), although their projected height is larger than the bar spacings. The cups show a strong vertical distribution along the water column, with some cups floating, some suspended in the upper centimeters of the flow depth, and many transported as bed load just above the channel bottom. The bed load cups transported to the prototype arrive at the height of the frame tubing. There, they get resuspended and skip over the tubing through the open bottom layer of the drums (Figure 4VII). The same process is observed for some PS fragments and is partly responsible for the high ratio of FC 1 of 92%.
Even though LDPE fragments (20% cleaning efficiency) are affected by a high portion of FC 1, the process behind this failure differs from PS: LDPE fragments slip between the bars of the drums and float further downstream. The same process occurred in FC 2, but fragments slipped through the gaps between racks and scrapers instead of slipping through the horizontal bar racks. In the case of HDPE fragments (57% cleaning efficiency), FC 2 and FC 3 account for nearly 80% of total failures by equal shares. HDPE fragments passed through gaps between drums and scrapers in the experiments (FC 2) or got trapped within the drums by passing the horizontal bar racks on the front but not on the backside of the drums (FC 3). Also, ePS fragments (50% cleaning efficiency) often failed due to FC 2. Instead of slipping directly through the gaps, the ePS fragments broke at the scraper and passed the cleaning device.
In total, FC 3 mainly shows observations, where particles are trapped within a screen drum rather than insufficient transport by rotation of the drums. Overall, the main reasons for observed failures are a lack of interaction of the particles with the horizontal bar racks and loss at the scrapers between the screen drums.
4. Discussion
This study proposes an innovative technical solution for eliminating MMPW from rivers, considering prevailing site conditions and plastic transport processes. Conceptual adaptions to the concept enable a continuous cleaning effect of the device throughout the year up to a design discharge, considering changes in water levels, transport rates, and regular flood events without hindering navigability, sediment transport, and fish mitigation. Prototype-scale experiments demonstrate the cleaning efficiency of the novel river-cleaning concept without downscaling and corresponding scaling effects. The experimental method validly verifies the cleaning concept for selected parameter settings and the self-cleaning mechanism of the screen drum units. It confirms the continuous transport of stopped plastic particles toward the riverbank by the rotation of the drums around the vertical axis.
The system’s cleaning efficiency strongly correlates with its alignment angle to the main flow, confirming hypothesis (i). Overall, the alignment angle of 45° generated the best results regarding cleaning efficiency. The flow vector that gets deflected by the prototype acts beneficially for transporting particles towards the vertical trash rack at the riverbank and is highest at smaller the alignment angles. Even smaller alignment angles might enhance cleaning efficiency even more strongly but reduce the lateral coverage of the river section. This would result in inappropriate design dimensions and is therefore not considered.
In contrast, the cleaning efficiency only shows a low correlation to the rotational speed of the screen drum units in our experiments, undermining the research hypothesis (i). In the conducted experiments, increasing rotational speed for approach flow velocities < 0.4 m/s and decreasing rotational speed for flow velocities > 0.6 m/s benefitted the cleaning efficiency. The reason for this counteracting correlation might be that in the case of higher approach flow velocities, the flow vector that acts beneficially for transporting particles toward the riverbank is significantly stronger than in the case of lower approach flow velocities. A high rotational speed might support a resuspension process from the bars to the water column since turbulences in the high flow velocities are strong. In conditions of low approach flow velocities, the flow vector that acts beneficially for particle transport towards the bank is lower, and the rotational speed enhances this transport process towards the bank. The effect of high rotational speed, which caused resuspension in turbulent flow, might support particles that stick to the bars and scrapers to detach again and be transported further toward the bank.
Based on these findings, we recommend a principal orientation of the cleaning modules at a 45° alignment angle to the main flow of a polluted river. Adapting the rotational speed to the prevailing flow velocity can also slightly optimize the cleaning efficiency. Depending on flow velocity, rotational speed should be higher or lower. This observation, combined with the faster self-cleaning of the drums and the faster transport to the riverbank at higher rotational speeds, enables an adaptation of this parameter to the changing transport rates of MMPW in natural rivers [55] without expecting significant reductions in cleaning efficiency.
Our test results imply clear links between the cleaning efficiency, the examined plastic materials, and the hydraulic conditions in the test runs, in line with research hypotheses (ii) and (iii). The cleaning efficiency indeed varies significantly for macroplastic particles that differ in density, size, stiffness, and shape. Concerning 3D items, the cleaning efficiency was always higher than 91%, except for polymer type PS, which had a mean cleaning efficiency of 21%. The reason for this discrepancy is the high in situ density of the PS 3D item. The cups were rapidly filled up with water and, combined with the material raw density of 1.11 g/cm3, the items tended to sink to the ground and be transported in the form of bed load transport and, by resuspension, skip the tubing of the prototype. The in situ density of other 3D items might not represent reality since the experiments’ retention time was limited, and air or water intrusion was not completed. Biofouling processes were also not considered, which typically change riverine plastics’ in situ density [68].
Further differences among the plastic materials regarding their interaction with the cleaning device are particularly evident in the test results of the fragments and their observed failure cases: LDPE fragments cut out of bags showed low removal rates in our experiments. Due to the low stiffness of the plastic bags, LDPE fragments wrapped around the bars and were not remobilized anymore or slipped between the single bars and failed removal. The fragments generally oriented themselves hydrodynamically efficiently to reduce drag forces. As a result, the projected height of the transported particles minimized to the smallest edge length of the particles: the wall thickness.
This effect enabled fragments to pass through the horizontal bar racks of the screen drum (FC 1). Turbulence patterns in the near field of the bar racks could reorientate the transported particles and thus increase their projected height, leading to higher interaction and stopping ratios.
ePS fragments provided the best cleaning efficiency among the fragments, especially for the high flow depth. The implied floating body caused this enhanced cleaning efficiency: all ePS fragments floated on the surface due to their very low density and shape. Therefore, the floating body of the prototype acted as an impermeable barrier and stopped ePS fragments at a rate of 100%. The deflected flow led the fragments to the vertical rack.
Following these findings and observations, we recommend further investigations on the interaction of various plastic particles with bar racks, focusing only on the stopping process and including smaller particles than in this study. Adjusting the orientation of the rake bars can lead to a significant increase in the cleaning rate for fragments. Even perforated plates could be beneficial for efficiently removing fragmented plastic particles. Adaptions and experiments should include design options to further guarantee successful transfer from the screen drum to the scraper. Additionally, we recommend investigations on head losses and affluxes at screen drums, considering the blocking ratios of the drum-shaped rack structures.
Although the results of the prototype-scale experiments do not show any scaling effects, the derived findings are based on model investigations differing from an application at a natural site. It must be noted that the particle load in our experiments was limited and did not represent plastic mixtures found in rivers, but the removal potential for different plastic classes was investigated. We also neglected leaves, loose water hyacinths, and driftwood, which are usually also transported with the flow and interact with plastics [69]. This simplification prevents particle–particle interactions between plastic and other drifting materials. On the one hand, heterogenic plastic mixtures and differing transport loads could lead to instantaneous impacts on the drums. They may hamper the transport toward the vertical trash rack by causing clogging effects at scrapers. On the other hand, conglomerates of particles may show a more considerable projected height, leading to higher stopping ratios at the horizontal bar racks and, in turn, higher cleaning efficiencies at nature sites.
The tested prototype consists of three screen drum units and only represents the conceptualized setup of the cleaning module. The vertical dimension of the prototype is limited and, therefore, covers the complete cross-sectional area at a flow depth of 0.40 m and 0.75 m, which differs from the adapted cleaning concept. This tested setup prevents failure due to the vertical flow depth distribution of the particles. Additionally, we omitted the underbodies of the screen drums and the floating body to record particle–rack interactions. This model adoption negatively impacts the cleaning efficiency for particle types partially transported in suspension or as bed load. The missing underbodies enable pathways for particles that would not exist in closed setups. PS particles passed the prototype via the missing underbody of the drums.
Another failure due to prototype construction occurred in test runs with a high flow depth of 0.75 m. Suspended LDPE and PS particles flowed under the structure without interaction with the cleaning module via vertical flow deflections of the frame of the floating body. This pathway around the cleaning module would be impossible with an underbody installed on the floating body. Therefore, on the one hand, these test results can be viewed as conservative; on the other hand, these observations illustrate how sensitively many plastic particles react to turbulence in flow. These findings follow previous observations [45,51] and highlight the need to consider this plastic transport process for comprehensive removal strategies.
Due to capacity limitations in discharge, only two velocities (0.2 and 0.4 m/s) could be conducted at the large flow depth. This velocity variance must be revised to deviate valid results regarding vertical particle distribution. Nevertheless, observations during the experiments confirm a deviating behavior of different polymer types, 3D items, and fragments under the same hydraulic conditions. These findings agree with the context of previous results [58].
Following these model adoptions and limitations, we recommend further investigations to analyze the particle–prototype interaction in the vertical dimension, including a vertical flow depth distribution of transported plastic materials. Field applications bring other alterations and constraints to the installation that stakeholders and political decision-makers must consider: the cleaning module’s length and the number of drums depend on the river width. With an increasing number of drums and scrapers, the potential for failures along the cleaning module increases. Therefore, the test results cannot be upscaled directly to field applications and require further individual considerations for each test site regarding prevailing hydraulic conditions, loads of MMPW, and the mixture of plastic classes on site.
Overall, the cleaning unit promises the comprehensive removal of floating and suspended plastic particles in rivers at an alignment angle of 45°. In particular, the high removal rates for 3D items propose further investigations of the concept. To effectively reduce MMPW in the aquatic environment, stakeholders and policymakers have a range of legislative, social, and technological measures to select from. Helinski et al. summarize many aspects of choosing between diverse plastic pollution capture devices [44].
Although several plastic pollution collection devices are already on the market and in operation in the form of booms (floating barriers), watercraft vehicles, or receptacles, there is a need for more information on efficiency and capacity. Helinski et al. could only gather information on efficiency for 27.5% of their examined concepts [44]. The comparison between the efficiency of the concepts is further hampered by differently used definitions and specifications of efficiency in [%] or [kg/day], a lack of reviewed methods, different TRLs of the devices, differing application sites, and different target loads, most often focusing only on floating plastics and neglecting the suspended load [44]. In addition, current monitoring methods have considerable uncertainties, so even recent determinations of the plastic loads in rivers provide highly inaccurate results, underestimating the plastic load in suspension [51]. Therefore, new methods and databases, including operational efficiency, are needed so stakeholders can make valid decisions and take appropriate measures to eliminate MMPW in the environment effectively [43,44].
Technical solutions to capture floatables, such as StormTrap’s “TrashTrap: Capture floatables with innovative netting systems: Trash Removal Solutions for Stormwater, Urban Runoff and Combined Sewer Overflow (CSO) Discharges” or the “River Cleaning System: consisting of floatable devices”, report removal efficiencies of 97% and 85%, respectively [42,70,71]. The novel cleaning concept investigated in this study achieved these cleaning rates in the prototype-scale experiments only for 3D items. The method showed lower efficiency for fragments, with many particles reaching the system in suspension and not as floatables. Following these uncertainties in the assessment and comparing different approaches to remove MMPW from the environment, it is recommended to create definitions and specific requirements to measure plastic capture devices’ operational efficiency and environmental impact [43].
Overall, the novel river-cleaning system is a promising tool to reduce MMPW in rivers by eliminating already-emitted MMPW. It is a scalable solution that stakeholders can apply to any river size and dimension. In comparison to other capture devices, such as water vehicles or booms, it tackles floating and suspended plastic particles at the same time. The adapted concept design enables a continuous cleaning effect, also during regular floods, where we expect the highest plastic transport rates [55].
Adaptations and operating concepts for extreme events enable sediment continuity at plants, mitigation methods for fish, and navigability in the river section. This reduces the plant’s ecological impact, increases the acceptance of cleaning measures, and can even create awareness among the population towards the well-being of aquatic environments.
All these aspects need to be investigated and confirmed in further scientific studies. We, therefore, recommend fundamental studies on the morphological effects and the passing behavior of fish at such transverse structures in rivers. Even though the findings of this study open new possibilities in removing MMPW from rivers, this cleaning system has yet to be further tested and optimized before an application in a natural context. Due to the limited vertical dimension of the prototype experiments in this study, further investigations are necessary to determine the prototype’s vertical flow development and analyze the particle–prototype interaction in the vertical dimension. Furthermore, the interaction of two cleaning modules according to the presented concept must be checked to ensure comprehensive cleaning across the entire river width. Additionally, force measurements and simulations are mandatory to design the construction and bearing of the system considering various operational and extreme conditions.
5. Conclusions
Overall, the prototype-scale experiments investigating a novel cleaning system confirm the functionality of its operational design. The test results identify the best configuration of the prototype and prove the self-cleaning mechanism of the screen drum units. The system provides good cleaning performance, especially for 3D items, independently of tested hydraulic conditions and particle type (except PS). The cleaning module can partly remove positive and neutral buoyant fragments, whereas removal is slightly more efficient for lower flow velocities. In contrast to 3D items, the cleaning efficiency of fragments varies with the tested plastic types. The adaptation and redesign of the scrapers promise a further increase in cleaning efficiency.
Despite lacking detailed investigations, this novel cleaning system can contribute to integrative river management concepts by efficiently removing MMPW. Especially for heavily polluted fluvial systems, this concept can improve ecological, social, and economic status by removing MMWP in floating and suspended conditions. The comprehensive cleaning concept and self-cleaning mechanism are outstanding compared to previous cleaning systems as they enable continuous waste removal from rivers without ships or manual operations. MMPW is highly relevant for sustainable development in a global context. This study encourages public and private stakeholders to invest in research and practical solutions for removing MMPW from our planet.
Author Contributions
Conceptualization, Y.F. and A.H.; methodology, Y.F. and A.H.; software, Y.F. and S.S.; validation, A.H., R.H. and N.R.; investigation, Y.F.; resources, A.H. and N.R.; writing—original draft preparation, Y.F. and S.S.; writing—review and editing, S.S., A.H., R.H. and N.R.; visualization, Y.F. and S.S.; supervision, A.H., R.H. and N.R.; project administration, Y.F.; funding acquisition, Y.F. All authors have read and agreed to the published version of the manuscript.
Funding
This research was funded by the Federal Ministry for Economic Affairs and Energy on the basis of a decision of the German Bundestag, grant number ZF4855101SA9.
Data Availability Statement
The data presented in this study are available on request from the corresponding author. The data are not publicly available due to ongoing investigations and planned publications.
Acknowledgments
Thanks to the student Tim Lorenz for his support in the prototype-scale experiments. Many thanks to Muhr GmbH, represented by Roland and Erhard Muhr, for the construction and provision of the prototype.
Conflicts of Interest
The authors declare no conflicts of interest.
References
- Crutzen, P.J. Geology of mankind. Nature 2002, 415, 23. [Google Scholar] [CrossRef]
- Savenije, H.H.G.; Hoekstra, A.Y.; van der Zaag, P. Evolving water science in the Anthropocene. Hydrol. Earth Syst. Sci. 2014, 18, 319–332. [Google Scholar] [CrossRef]
- Grambow, M.; Feustel, M.; Manz, E.; Arzet, K.; Hafner, T.; Korck, J. Die Wasserpolitik im Anthropozän—Überlegungen, wie wir in Europa in der Gewässerbewirtschaftung auf die umfassenden Herausforderungen eines neuen Erdzeitalters richtig reagieren können. Korresp. Wasserwirtsch. 2020, 13, 356–368. [Google Scholar] [CrossRef]
- van Emmerik, T.; Schwarz, A. Plastic debris in rivers. WIREs Water 2020, 7, e1398. [Google Scholar] [CrossRef]
- Al-Zawaidah, H.; Ravazzolo, D.; Friedrich, H. Macroplastics in rivers: Present knowledge, issues and challenges. Environ. Sci. Process. Impacts 2021, 23, 535–552. [Google Scholar] [CrossRef]
- Rillig, M.C. Microplastic in Terrestrial Ecosystems and the Soil? Environ. Sci. Technol. 2012, 46, 6453–6454. [Google Scholar] [CrossRef]
- Cózar, A.; Echevarría, F.; González-Gordillo, J.I.; Irigoien, X.; Ubeda, B.; Hernández-León, S.; Palma, A.T.; Navarro, S.; García-de-Lomas, J.; Ruiz, A.; et al. Plastic debris in the open ocean. Proc. Natl. Acad. Sci. USA 2014, 111, 10239–10244. [Google Scholar] [CrossRef]
- Zalasiewicz, J.; Waters, C.N.; Ivar do Sul, J.A.; Corcoran, P.L.; Barnosky, A.D.; Cearreta, A.; Edgeworth, M.; Gałuszka, A.; Jeandel, C.; Leinfelder, R.; et al. The geological cycle of plastics and their use as a stratigraphic indicator of the Anthropocene. Anthropocene 2016, 13, 4–17. [Google Scholar] [CrossRef]
- Geyer, R.; Jambeck, J.R.; Law, K.L. Production, use, and fate of all plastics ever made. Sci. Adv. 2017, 3, e1700782. [Google Scholar] [CrossRef]
- Barnes, D.K.A.; Galgani, F.; Thompson, R.C.; Barlaz, M. Accumulation and fragmentation of plastic debris in global environments. Philos. Trans. R. Soc. Lond. Ser. B Biol. Sci. 2009, 364, 1985–1998. [Google Scholar] [CrossRef]
- Hoornweg, D.; Bhada-Tata, P.; Kennedy, C. Environment: Waste production must peak this century. Nature 2013, 502, 615–617. [Google Scholar] [CrossRef] [PubMed]
- Ryan, P. A Brief History of Marine Litter Research. In Marine Anthropogenic Litter; Bergmann, M., Gutow, L., Klages, M., Eds.; Springer International Publishing: Cham, Switzerland, 2015; pp. 1–25. [Google Scholar] [CrossRef]
- Geyer, R. Chapter 2—Production, use, and fate of synthetic polymers. In Plastic Waste and Recycling; Letcher, T.M., Ed.; Academic Press: Cambridge, MA, USA, 2020; pp. 13–32. [Google Scholar]
- Schmidt, C.; Krauth, T.; Wagner, S. Export of Plastic Debris by Rivers into the Sea. Environ. Sci. Technol. 2017, 51, 12246–12253. [Google Scholar] [CrossRef] [PubMed]
- Meijer, L.J.J.; van Emmerik, T.; van der Ent, R.; Schmidt, C.; Lebreton, L. More than 1000 rivers account for 80% of global riverine plastic emissions into the ocean. Sci. Adv. 2021, 7, eaaz5803. [Google Scholar] [CrossRef] [PubMed]
- Lebreton, L.C.M.; van der Zwet, J.; Damsteeg, J.-W.; Slat, B.; Andrady, A.; Reisser, J. River plastic emissions to the world’s oceans. Nat. Commun. 2017, 8, 15611. [Google Scholar] [CrossRef]
- Blettler, M.C.M.; Wantzen, K.M. Threats Underestimated in Freshwater Plastic Pollution: Mini-Review. Water Air Soil Pollut. 2019, 230, 174. [Google Scholar] [CrossRef]
- Blettler, M.C.M.; Abrial, E.; Khan, F.R.; Sivri, N.; Espinola, L.A. Freshwater plastic pollution: Recognizing research biases and identifying knowledge gaps. Water Res. 2018, 143, 416–424. [Google Scholar] [CrossRef] [PubMed]
- Liro, M.; Zielonka, A.; van Emmerik, T.H.M. Macroplastic fragmentation in rivers. Environ. Int. 2023, 180, 108186. [Google Scholar] [CrossRef]
- Andrady, A.L. Persistence of Plastic Litter in the Oceans. In Marine Anthropogenic Litter; Bergmann, M., Gutow, L., Klages, M., Eds.; Springer International Publishing: Cham, Switzerland, 2015; pp. 57–72. [Google Scholar]
- van Wijnen, J.; Ragas, A.M.J.; Kroeze, C. Modelling global river export of microplastics to the marine environment: Sources and future trends. Sci. Total Environ. 2019, 673, 392–401. [Google Scholar] [CrossRef]
- Azevedo-Santos, V.M.; Brito, M.F.G.; Manoel, P.S.; Perroca, J.F.; Rodrigues-Filho, J.L.; Paschoal, L.R.P.; Gonçalves, G.R.L.; Wolf, M.R.; Blettler, M.C.M.; Andrade, M.C.; et al. Plastic pollution: A focus on freshwater biodiversity. Ambio 2021, 50, 1313–1324. [Google Scholar] [CrossRef]
- Faure, F.; Demars, C.; Wieser, O.; Kunz, M.; de Alencastro, L.F. Plastic pollution in Swiss surface waters: Nature and concentrations, interaction with pollutants. Environ. Chem. 2015, 12, 582–591. [Google Scholar] [CrossRef]
- Windsor, F.M.; Durance, I.; Horton, A.A.; Thompson, R.C.; Tyler, C.R.; Ormerod, S.J. A catchment-scale perspective of plastic pollution. Glob. Change Biol. 2019, 25, 1207–1221. [Google Scholar] [CrossRef]
- Possatto, F.E.; Barletta, M.; Costa, M.F.; do Sul, J.A.; Dantas, D.V. Plastic debris ingestion by marine catfish: An unexpected fisheries impact. Mar. Pollut. Bull. 2011, 62, 1098–1102. [Google Scholar] [CrossRef] [PubMed]
- Gall, S.C.; Thompson, R.C. The impact of debris on marine life. Mar. Pollut. Bull. 2015, 92, 170–179. [Google Scholar] [CrossRef]
- Lasut, M.T.; Weber, M.; Pangalila, F.; Rumampuk, N.D.C.; Rimper, J.R.T.S.L.; Warouw, V.; Kaunang, S.T.; Lott, C. From Coral Triangle to Trash Triangle—How the Hot spot of Global Marine Biodiversity Is Threatened by Plastic Waste. In Proceedings of the International Conference on Microplastic Pollution in the Mediterranean Sea; Cocca, M., Di Pace, E., Errico, M.E., Gentile, G., Montarsolo, A., Mossotti, R., Eds.; Springer Water; Springer International Publishing: Cham, Switzerland, 2018; pp. 107–113. [Google Scholar]
- Diggle, A.; Walker, T.R. Environmental and Economic Impacts of Mismanaged Plastics and Measures for Mitigation. Environments 2022, 9, 15. [Google Scholar] [CrossRef]
- Petten, L.; Schalekamp, J.; Viool, V.; Gupta, A. The Price Tag of Plastic Pollution–An Economic Assessment of River Plastic; Deloitte: Costa Mesa, CA, USA, 2019. [Google Scholar]
- van Emmerik, T.; Mellink, Y.; Hauk, R.; Waldschläger, K.; Schreyers, L. Rivers as Plastic Reservoirs. Front. Water 2022, 3, 786936. [Google Scholar] [CrossRef]
- Tramoy, R.; Gasperi, J.; Colasse, L.; Silvestre, M.; Dubois, P.; Noûs, C.; Tassin, B. Transfer dynamics of macroplastics in estuaries—New insights from the Seine estuary: Part 2. Short-term dynamics based on GPS-trackers. Mar. Pollut. Bull. 2020, 160, 111566. [Google Scholar] [CrossRef] [PubMed]
- AfricaNews. Plastic Pollution Clogs Hydropower Dam in DR Congo. AfricaNews, 21 March 2022. [Google Scholar]
- CBC. Plastic Garbage Clogging Serbian Dam Threatens Hydroelectric Plant. CBC, 7 January 2021. [Google Scholar]
- Honingh, D.; van Emmerik, T.; Uijttewaal, W.; Kardhana, H.; Hoes, O.; van de Giesen, N. Urban River Water Level Increase Through Plastic Waste Accumulation at a Rack Structure. Front. Earth Sci. 2020, 8, 28. [Google Scholar] [CrossRef]
- van Emmerik, T.H.M.; Frings, R.M.; Schreyers, L.J.; Hauk, R.; de Lange, S.I.; Mellink, Y.A.M. River plastic transport and deposition amplified by extreme flood. Nat. Water 2023, 1, 514–522. [Google Scholar] [CrossRef]
- Zadjelovic, V.; Wright, R.J.; Borsetto, C.; Quartey, J.; Cairns, T.N.; Langille, M.G.I.; Wellington, E.M.H.; Christie-Oleza, J.A. Microbial hitchhikers harbouring antimicrobial-resistance genes in the riverine plastisphere. Microbiome 2023, 11, 225. [Google Scholar] [CrossRef]
- Zhang, Z.; Zhang, Q.; Wang, T.; Xu, N.; Lu, T.; Hong, W.; Penuelas, J.; Gillings, M.; Wang, M.; Gao, W.; et al. Assessment of global health risk of antibiotic resistance genes. Nat. Commun. 2022, 13, 1553. [Google Scholar] [CrossRef]
- United Nations Environment Assembly. End Plastic Pollution: Towards an International Legally Binding Instrument—Resolution Adopted by the United Nations Environment Assembly on 2 March 2022; [UNEP/EA.5/Res.14]; United Nations Environment Programme: Nairobi, Kenya, 2022. [Google Scholar]
- European Commission. Communication from the Commission to the European Parliament, the Council, the European Economic and Social Committee and the Committee of the Regions. Pathway to a Healthy Planet for All EU Action Plan: ‘Towards Zero Pollution for Air, Water and Soil’; European Commission: Brussels, Belgium, 2021. [Google Scholar]
- Rethink Plastic. How Can EU Legislation Tackle Microplastic Pollution; Rethink Plastic: Brussels, Belgium, 2022. [Google Scholar]
- Liro, M.; van Emmerik, T.; Wyżga, B.; Liro, J.; Mikuś, P. Macroplastic Storage and Remobilization in Rivers. Water 2020, 12, 2055. [Google Scholar] [CrossRef]
- Schmaltz, E.; Melvin, E.C.; Diana, Z.; Gunady, E.F.; Rittschof, D.; Somarelli, J.A.; Virdin, J.; Dunphy-Daly, M.M. Plastic pollution solutions: Emerging technologies to prevent and collect marine plastic pollution. Environ. Int. 2020, 144, 106067. [Google Scholar] [CrossRef]
- Bellou, N.; Gambardella, C.; Karantzalos, K.; Monteiro, J.G.; Canning-Clode, J.; Kemna, S.; Arrieta-Giron, C.A.; Lemmen, C. Global assessment of innovative solutions to tackle marine litter. Nat. Sustain. 2021, 4, 516–524. [Google Scholar] [CrossRef]
- Helinski, O.K.; Poor, C.J.; Wolfand, J.M. Ridding our rivers of plastic: A framework for plastic pollution capture device selection. Mar. Pollut. Bull. 2021, 165, 112095. [Google Scholar] [CrossRef] [PubMed]
- Hohenblum, P.; Frischenschlager, H.; Reisinger, H.; Konecny, R.; Uhl, M.; Mühlegger, S.; Habersack, H.; Liedermann, M.; Gmeiner, P.; Weidenhiller, B.; et al. Plastik in der Donau: Untersuchung zum Vorkommen von Kunststoffen in der Donau in Österreich; Umweltbundesamt: Vienna, Austria, 2015; p. 120. [Google Scholar]
- Morritt, D.; Stefanoudis, P.V.; Pearce, D.; Crimmen, O.A.; Clark, P.F. Plastic in the Thames: A river runs through it. Mar. Pollut. Bull. 2014, 78, 196–200. [Google Scholar] [CrossRef]
- van Emmerik, T.H.M.; Schreyers, L.J.; Mellink, Y.A.M.; Sok, T.; Arias, M.E. Large variation in Mekong river plastic transport between wet and dry season. Front. Environ. Sci. 2023, 11, 1173946. [Google Scholar] [CrossRef]
- Falk-Andersson, J.; Rognerud, I.; De Frond, H.; Leone, G.; Karasik, R.; Diana, Z.; Dijkstra, H.; Ammendolia, J.; Eriksen, M.; Utz, R.; et al. Cleaning Up without Messing Up: Maximizing the Benefits of Plastic Clean-Up Technologies through New Regulatory Approaches. Environ. Sci. Technol. 2023, 57, 13304–13312. [Google Scholar] [CrossRef]
- Muhr, E. Wasserreinigungsvorrichtung für Fließgewässer. International Patent Application No. DE102017004347B3, 2 August 2018. [Google Scholar]
- Fuchs, Y.; Scherbaum, S.; Hartlieb, A. RiverScreener: Untersuchung eines innovativen Reinigungssystems für Fließgewässer in naturnahen Experimenten. In Proceedings of the 21. Wasserbau-Symposium der Wasserbauinstitute TU München, TU Graz und ETH Zürich, Wallgau, Germany, 28–30 June 2023; pp. 263–272. [Google Scholar]
- Valero, D.; Belay, B.S.; Moreno-Rodenas, A.; Kramer, M.; Franca, M.J. The key role of surface tension in the transport and quantification of plastic pollution in rivers. Water Res. 2022, 226, 119078. [Google Scholar] [CrossRef]
- Muhr, E. Vorrichtung zur Mechanischen Reinigung von Wasser und zur Zurückhaltung von Fischen mit Nebeneinander Angeordneten und Rotativ Antreibbaren, Vertikalen Rechentrommeln. International Patent Application No. DE202011102465U1, 27 December 2012. [Google Scholar]
- Panici, D.; Kripakaran, P. Trapping large wood debris in rivers: Experimental study of novel debris retention system. J. Hydraul. Eng. 2021, 147, 3. [Google Scholar] [CrossRef]
- van Calcar, C.J.; van Emmerik, T.H.M. Abundance of plastic debris across European and Asian rivers. Environ. Res. Lett. 2019, 14, 124051. [Google Scholar] [CrossRef]
- van Emmerik, T.; Strady, E.; Kieu-Le, T.-C.; Nguyen, L.; Gratiot, N. Seasonality of riverine macroplastic transport. Sci. Rep. 2019, 9, 13549. [Google Scholar] [CrossRef] [PubMed]
- Lechthaler, S.; Waldschläger, K.; Stauch, G.; Schüttrumpf, H. The Way of Macroplastic through the Environment. Environments 2020, 7, 73. [Google Scholar] [CrossRef]
- Vriend, P.; Schoor, M.; Rus, M.; Oswald, S.B.; Collas, F.P.L. Macroplastic concentrations in the water column of the river Rhine increase with higher discharge. Sci. Total Environ. 2023, 900, 165716. [Google Scholar] [CrossRef] [PubMed]
- Jambeck, J.R.; Geyer, R.; Wilcox, C.; Siegler, T.R.; Perryman, M.; Andrady, A.; Narayan, R.; Law, K.L. Plastic waste inputs from land into the ocean. Science 2015, 347, 768–771. [Google Scholar] [CrossRef] [PubMed]
- Fuchs, Y.; Hartlieb, A.; Muhr, R. The RiverScreener Project: Proof and Optimization of a novel River Cleaning Concept. In Proceedings of the Hydro Power and Dams Asia 2023, Kuala Lumpur, Malaysia, 14–16 March 2023. [Google Scholar]
- Zaat, L.-A. Below the Surface: A Laboratorial Research to the Vertical Distribution of Buoyant Plastics in Rivers. Master’s Thesis, Delft University of Technology, Delft, The Netherlands, 2020. [Google Scholar]
- van Emmerik, T.; Loozen, M.; van Oeveren, K.; Buschman, F.; Prinsen, G. Riverine plastic emission from Jakarta into the ocean. Environ. Res. Lett. 2019, 14, 084033. [Google Scholar] [CrossRef]
- van Emmerik, T.; van Klaveren, J.; Meijer, L.J.J.; Krooshof, J.W.; Palmos, D.A.A.; Tanchuling, M.A. Manila River Mouths Act as Temporary Sinks for Macroplastic Pollution. Front. Mar. Sci. 2020, 7, 545812. [Google Scholar] [CrossRef]
- Vriend, P.; Roebroek, C.T.J.; van Emmerik, T. Same but Different: A Framework to Design and Compare Riverbank Plastic Monitoring Strategies. Front. Water 2020, 2, 563791. [Google Scholar] [CrossRef]
- Andrady, A.L. The plastic in microplastics: A review. Mar. Pollut. Bull. 2017, 119, 12–22. [Google Scholar] [CrossRef]
- Baur, E.; Brinkmann, S.; Osswald, T.A.; Schmachtenberg, E. Saechtling Kunststoff Taschenbuch, 30th ed.; Hanser: Munich, Germany, 2007; p. 24. [Google Scholar]
- Weißbach, W. Werkstoffkunde: Strukturen, Eigenschaften, Prüfung, 19th ed.; Springer Vieweg: Wiesbaden, Germany, 2015; p. 597. [Google Scholar]
- Jirka, G.H.; Lang, C. Einführung in die Gerinnehydraulik; KIT Scientific Publishing: Karlsruhe, Germany, 2009. [Google Scholar]
- Kooi, M.; van Nes, E.H.; Scheffer, M.; Koelmans, A.A. Ups and Downs in the Ocean: Effects of Biofouling on Vertical Transport of Microplastics. Environ. Sci. Technol. 2017, 51, 7963–7971. [Google Scholar] [CrossRef] [PubMed]
- Schreyers, L.; van Emmerik, T.; Nguyen, T.L.; Castrop, E.; Phung, N.-A.; Kieu-Le, T.-C.; Strady, E.; Biermann, L.; van der Ploeg, M. Plastic plants: Water hyacinths as driver of plastic transport in tropical rivers. Earth ArXiv 2021. [Google Scholar] [CrossRef]
- Stormtrap. TrashTrap. Available online: https://stormtrap.com/products/trashtrap/#trashtrap-Projects (accessed on 4 January 2024).
- River Cleaning System. Rivercleaning. Available online: https://rivercleaning.com/river-cleaning-system/ (accessed on 4 January 2024).
Disclaimer/Publisher’s Note: The statements, opinions and data contained in all publications are solely those of the individual author(s) and contributor(s) and not of MDPI and/or the editor(s). MDPI and/or the editor(s) disclaim responsibility for any injury to people or property resulting from any ideas, methods, instructions or products referred to in the content. |
© 2024 by the authors. Licensee MDPI, Basel, Switzerland. This article is an open access article distributed under the terms and conditions of the Creative Commons Attribution (CC BY) license (https://creativecommons.org/licenses/by/4.0/).