
Projected Changes in Extreme Precipitation Patterns across Algerian Sub-Regions
by
 , , , , ,
Yasmine Hamitouche
1 ,
,
Ayoub Zeroual
1,2,*,
Mohamed Meddi
1,
Ali A. Assani
3,*,
Ramdane Alkama
4,
Zekâi Şen
5 and
Xinhua Zhang
2 1
Water Engineering and Environment Laboratory, National Higher School of Hydraulics (ENSH-Blida), Blida 09000, Algeria
2
State Key Laboratory of Hydraulics and Mountain River Engineering, Sichuan University, Chengdu 610065, China
3
Department of Environmental Sciences, University of Quebec at Trois-Rivières, 3351 Boulevard des Forges, Trois-Rivières, QC G9A 5H7, Canada
4
European Commission, JRC, Directorate D-Sustainable Resources, Bio-Economy Unit, TP124 Via E. Fermi, 2749, 21027 Ispra, Italy
5
Engineering and Natural Sciences Faculty, Istanbul Medipol University, Beykoz, Istanbul 34181, Turkey
*
Authors to whom correspondence should be addressed.
Water 2024, 16(10), 1353; https://doi.org/10.3390/w16101353
Submission received: 12 April 2024
/
Revised: 6 May 2024
/
Accepted: 8 May 2024
/
Published: 10 May 2024
(This article belongs to the Special Issue Hydroclimatic Modeling and Monitoring under Climate Change)
Abstract
:Extreme precipitation events play a crucial role in shaping the vulnerability of regions like Algeria to the impacts of climate change. To delve deeper into this critical aspect, this study investigates the changing patterns of extreme precipitation across five sub-regions of Algeria using data from 33 model simulations provided by the NASA Earth Exchange Global Daily Downscaled Climate Projections (NEX-GDDP-CMIP6). Our analysis reveals a projected decline in annual precipitation for four of these regions, contrasting with an expected increase in desert areas where annual precipitation levels remain low, typically not exceeding 120 mm. Furthermore, key precipitation indices such as maximum 1-day precipitation (Rx1day) and extremely wet-day precipitation (R99p) consistently show upward trends across all zones, under both SSP245 and SSP585 scenarios. However, the number of heavy precipitation days (R20mm) demonstrates varied trends among zones, exhibiting stable fluctuations. These findings provide valuable foresight into future precipitation patterns, offering essential insights for policymakers and stakeholders. By anticipating these changes, adaptive strategies can be devised to mitigate potential climate change impacts on crucial sectors such as agriculture, flooding, water resources, and drought.
1. Introduction
In the context of current climate change, the Sixth Assessment Report by the Intergovernmental Panel on Climate Change [1,2] highlights the anticipated changes in the intensity, duration, and frequency of extreme weather events in many regions of the world. These variations arise from atmospheric circulation dynamics and thermodynamic effects, themselves influenced by the significant rise in temperature [3,4,5,6]. Changes in extreme weather events can have numerous significant socio-economic repercussions, such as urban flooding and infrastructure damage [7,8].
In recent years, Algeria has experienced numerous devastating floods caused by torrential rainfalls in different areas, as highlighted by the works of Korichi et al. [9] and Hadjij et al. [10]. These floods have caused relatively significant material and human damage [11]. Their frequency has significantly increased over the past two decades in several Algerian cities [11,12]. The devastating floods in Algiers on 10 November 2001 caused 680 deaths and 115 people to go missing, left 30,000 people homeless, and caused EUR 250 million in damage [13,14]. Hamitouche et al. [10] emphasize that several cities in Algeria have faced floods over the last decade. For example, in Constantine on 24 August 2015, three people lost their lives due to torrential rains. Similarly, the flood on 18 September 2018 resulted in two deaths and eleven injuries. During the flood on 25 August 2019, one person was reported missing. More recently, on 14 June 2023, ten families had to be evacuated from their homes affected by floods caused by heavy rainfall events. A growing number of studies attempt to analyze these extreme events [15] and identify the factors responsible for flood-related losses [10]. Among these factors, it is possible to cite the intensive urbanization of flood-prone areas, the increase in the number of houses located near rivers, and the rise in episodes of extreme precipitation in the Mediterranean regions [13,14]. The study conducted by Hamitouche et al. [10], focusing on the spatio-temporal analysis of extreme events based on in situ observational data from four distinct climatic zones in Algeria spanning from 1969 to 2021, revealed several key findings. In the warm Mediterranean climatic zone (Csa), most of the ten extreme precipitation indices exhibited an increase in temporal variability over this period, with the exception of the consecutive dry-days index (CDD). Conversely, in the cold/warm semi-arid zones (BSK/BSH), all indices displayed a decreasing trend, except for the consecutive wet-days index (CWD). Regarding stations located in the cold desert climatic zone (Bwk), the results unveiled heterogeneous trends, with some stations showing negative trends, while others exhibited positive trends. However, the anticipated climate changes in the 21st century are expected to lead to diverse responses in extreme precipitation events [2]. The Mediterranean Basin, including Algeria, occupies a distinctive position between arid (Sahara) and humid (Northern Europe) regions, making it particularly vulnerable to climate change. According to the Intergovernmental Panel on Climate Change’s (IPCC) Sixth Assessment Report [2], this region is projected to face significantly increased climate risks, including an intensification of extreme weather events, due to anticipated greenhouse gas (GHG) emission concentrations [16,17,18,19]. The question is, will this increase be accompanied by changes in patterns of extreme precipitation across the various climatic zones of Algeria? How will these extreme precipitation events evolve in the future?
This study aimed to tackle these inquiries by initially characterizing the various zones through an analysis of the interannual mean precipitation variation spanning from 1990 to 2014. We then calculated four extreme precipitation climate indices for each grid cell covering Algeria for a historical period (1990–2014) as well as for three future periods, namely 2026–2050, 2051–2075, and 2076–2100, based on daily precipitation data from the 33 simulations of the NEX-GDDP-CMIP6 models. These indices were analyzed as recommended by the World Meteorological Organization [20] for historical and future periods under the SSP245 and SSP585 scenarios. Relative and absolute changes between these periods were also evaluated at each grid cell level. Subsequently, the averages of these changes were calculated for each defined zone, each climate model, and for the different future periods. Significant increasing or decreasing trends in the indices were determined based on the number of models indicating a change in a given direction [21]. Such an approach helps us to better anticipate the future, make informed decisions, and enhance Algeria’s resilience to the growing challenges posed by precipitation extremes in a rapidly changing climate context. In the final part of this study, we focused on identifying the thresholds associated with the projected changes and compared the values of the most probable indices of precipitation extremes for the three future periods under the two scenarios with those observed during the historical period. This analysis enabled us to assess whether values exceeding the most probable thresholds will increase or decrease, and with what probability, using kernel density distributions (KDDs). This information is essential for adjusting agricultural practices, planning water resource management, and designing resilient infrastructures capable of coping with changing weather conditions.
2. Study Area
Located on the southern shore of the Mediterranean Basin, Algeria is a vast territory that stretches along the Mediterranean Sea with 1200 km of coastline. A latitudinal extension ranging from the 37th to the 18th parallel covers this territory with an area of 2,381,741 km2 (Figure 1 on the left). Interannual precipitation in Algeria is characterized by significant spatial variation, as shown in Figure 1 (on the right), which depicts a map of the average precipitation over the 1990–2014 period using CHIRPS reanalysis data at a 0.05° × 0.05° resolution [22] (https://www.chc.ucsb.edu/data/chirps; accessed on 1 November 2023).
Precipitation in the country exhibits significant spatial variations. Annual rainfall values decrease as one moves away from the Mediterranean Sea. The average annual rainfall along the coast varies between 300 mm and 1200 mm, increasing from west to east. The north–south and west–east disparities in precipitation in Algeria result from a complex interaction of various geographical and meteorological factors. In the north, the Tell Atlas and Saharan Atlas form two sets of parallel reliefs that converge eastward, interspersed with vast plains and the High Plateaus. These reliefs, combined with the extensive mountain ranges of the Aurès and Nememcha in Eastern Algeria, contribute to precipitation variability. In addition to latitude, atmospheric circulation and seasonal meteorological phenomena also influence the distribution of precipitation across the country. These factors have generated five distinct zones, each characterized by similar average precipitation. The first zone, with an average annual precipitation of 750 mm, extends along the eastern coast to latitude 36.4°. Zone 2 lies between the eastern coast (at latitude 36.4°) and the High Plateaus (at latitude 35.8°) (Zone 4), with an average annual precipitation of 550 mm. The average annual precipitation in Zone 4 (which lies between latitudes 35.8° and 34.5°) is 300 mm. Zone 3 represents the western coastal regions with an average annual precipitation of 350 mm, while Zone 5 (which extends between latitudes 34.5° and 18.9°) corresponds to the desert with an average precipitation of 55 mm. According to the Köppen classification, this study area mainly comprises four climatic zones, namely the following:
- The Csa climatic zone, characterized by a hot-summer Mediterranean climate, is represented by Zones 1 and 2.
- The BSk/BSh climatic zone, representing the cold/hot semi-arid climate zone, which is covered by Zones 3 and 4.
- The BWk/BWh climatic zone, indicating the cold/hot desert climate in Zone 5.
3. Materials and Methods
3.1. Data
In this study, daily precipitation data from 1990 to 2100 were extracted from the entire ensemble of 33 global climate models available in the NASA Earth Exchange Global Daily Downscaled Projections (NEX-GDDP-CMIP6) database (https://ds.nccs.nasa.gov/thredds/catalog/AMES/NEX/GDDP-CMIP6/catalog.html; accessed on 1 November 2023), as indicated in Table S1 of the Supplementary Materials S1. Table S1 presents a list of CMIP6 Global Climate Models (GCMs) used to develop the NEX-GDDP-CMIP6 database (0.25° × 0.25°), along with details including the model name, the institution responsible for its development, and the country where this institution is based, as well as the spatial resolution of the model. To assess precipitation extremes in Algeria in the 21st century, the study period from 1990 to 2100 was divided into a historical period (1990–2014) and three distinct future periods according to the SSP245 and SSP585 scenarios as near future (2026–2050), mid-century future (2051–2075), and far-future (2076–2100). The NEX-GDDP-CMIP6 dataset [23] provides downscaled global climate scenarios from model runs of the Coupled Model Intercomparison Project Phase 6 (CMIP6) general circulation models (GCMs) and Shared Socioeconomic Pathways (SSPs). These bias-corrected projections are intended to assess the high-resolution impacts of climate change on processes sensitive to climate gradients and local topography. The Bias Correction and Spatial Disaggregation (BCSD) method [24,25] was employed to adjust the future projections to be consistent with historical observations for the interpolation of GCM outputs to a higher spatial resolution. This dataset combines historical simulations from thirty-five CMIP6 GCMs from 1950 to 2014 and future projections for the period of 2015–2100 under low-emissions (SSP1-2.6), medium-emissions (SSP2-4.5), and high-emissions (SSP5-8.5) scenarios, at a spatial resolution of 0.25 × 0.25 degrees. To apply the Bias Correction Spatial Disaggregation (BCSD) method, daily precipitation data from the Global Meteorological Forcing Dataset (GMFD) (DOI: https://doi.org/10.5065/JV89-AH11) spanning from 1960 to 2014 and GCM simulations were first corrected for biases using a quantile mapping approach. This involved matching the cumulative distribution functions (CDFs) of observed and simulated data and adjusting the GCM data accordingly. Once bias correction was complete, spatial disaggregation was performed to downscale the GCM data to the finer resolution of the GMFD (0.25-degree resolution). This was achieved by scaling the GCM data using spatial scaling factors derived from observed data. The BCSD method ensures that the downscaled GCM data retain the statistical characteristics of the observed data while incorporating the climate projections from the GCMs. This process resulted in spatially and temporally consistent climate projections at a finer resolution (0.25° × 0.25°), suitable for local-scale impact assessments and adaptation planning.
3.2. Methods
In this study, daily precipitation data were utilized from the NEX-GDDP-CMIP6 model simulations to compute four extreme precipitation climate indices for each grid cell covering Algeria (0.25° × 0.25°), spanning from 1990 to 2100 (see Table 1). These four indices were recommended by the Expert Team on Climate Change Detection Indices (ETCCDI) of the World Meteorological Organization (WMO) for regional climate analysis [20]. In this study, the following steps were followed:
- After calculating the four ETCCDI extreme precipitation indices for the historical period (1990–2014) as well as for the three future periods ((2026–2050), (2051–2075), and (2076–2100)) under both SSP245 and SSP585 scenarios, the average of each ETCCDI index was calculated for each grid cell over the four periods. Then, the changes between the three future periods were determined and compared to the historical period using relative change (%) for the indices PRCPTOT (mm), RX1day (mm), RX5day (mm), R95p (mm), and R99p (mm), and absolute change (days) for the two indices R10mm (days) and R20mm (days). The relative change (%) and absolute change (days) between the ETCCDI indices were calculated at each grid cell level over the historical period () and the projected periods (), according to the following expressions.
- For each of the five defined zones and each of the ETCCDI extreme precipitation indices, the mean relative change (%) and the mean absolute change (in days) were calculated for each zone for each climate model, as well as the ensemble mean of all models (MME-33) for the three future periods ((2026–2050), (2051–2075), and (2076–2100)) under both SSP245 and SSP585 scenarios.
- After calculating the mean relative (%) and absolute (in days) changes in each index for each zone and climate model over three future periods according to the SSP245 and SSP585 scenarios, the relative changes in the 33 climate models are presented in each zone for the three future periods under the two scenarios using box and whisker plots. Each box represents the distribution of model relative changes for a specific period and for each zone with both scenarios. In these box and whisker plots, the medians, quartiles, and inter-quartile ranges are clearly visible, enabling a quick comparison of projected variations by different models in each zone and with the two scenarios. Additionally, spatial maps of each model for the four indices and their changes over the three future periods are provided under the two scenarios.
- After calculating the mean relative (%) and absolute (in days) changes for each zone and climate model over three future periods according to the SSP245 and SSP585 scenarios, the number of models out of the 33 was assessed for indications of an increase or decrease in the extreme precipitation index. An increase or decrease is considered significant if it is simulated in at least 22 models, which is two-thirds of the total models (33 models) or 66% of the models [21].
- For each extreme precipitation index from the ETCCDI for each climate model, specific grid cells were defined for each zone and plotted in the form of the kernel density distribution (KDD) for the historical period (1990–2014) as well as for the three future periods ((2026–2050), (2051–2075), and (2076–2100)) according to the SSP245 and SSP585 scenarios. This analysis was performed by identifying specific grid cells for each zone from the ensemble of models simultaneously. The kernel density distribution (KDD) [26] is a non-parametric approach used to estimate the probability distribution function (PDF) of data based on their density without assuming a specific PDF shape. It relies on the use of kernels, typically PDFs such as the Gaussian, to estimate the probability density at each data point. The KDD is widely used in data analysis and is available in the Python seaborn library under the sns.kdeplot() module. The bandwidth, a key parameter of the method, controls the width of the window around each point from which estimation data are considered. A wider bandwidth produces a smoother estimate but may lose details, while a narrower bandwidth can capture local variations under more noise. Jones [26] studied the performance of kernel density functions, while Kamalov [27] demonstrated the applicability of KDD in various contexts. In this study, a bandwidth of 0.1 was used, which smoothed the data over a window of 0.1 units to balance smoothing and to capture local variations.
4. Results
4.1. Future Evolution of Extreme Precipitation Indices in Each Zone
4.1.1. Relative Changes (%) in Indices for Each Model Simulation
The relative percentage changes of the indices are considered with each of the models as well as with the multi-model ensemble (MME-33) in Figure 2 (PRCPTOT), Figure 3 (RX1day), Figure 4 (R99p), and Figure 5 (R20mm) for each zone and for the three future periods of (2026–2050), (2051–2075), and (2076–2100) according to the two scenarios.
- a.
- Annual Total Precipitation in Wet Days (PRCPTOT)
Regarding the relative change (%) in the PRCPTOT index for the three periods and both scenarios, a general decreasing precipitation trend was observed in Zones 1, 2, 3, and 4, as illustrated in Figure 2. However, most models predicted a relative increase in precipitation in Zone 5, regardless of the period or scenario considered. For Zone 1, the maximum decrease in precipitation under the SSP245 scenario was observed in the CMCC-ESM2 model simulations, with, a decrease of −24.10% for the period of 2026–2050, followed by the PSL-CM6A-LR model, with −26.14% for the period of 2051–2075, and finally the CESM2 model, with a decrease of −31.36% for the period of 2076–2100. Under the SSP585 scenario, the greatest precipitation decrease in Zone 1 was recorded with simulations from the IPSL-CM6A-LR model. This decrease was about −22.82% for the period of 2026–2050; −36.78% for the period of 2051–2075; and reached a considerable level of −57.49% for the period of 2076–2100. For Zone 2, under the SSP245 scenario, simulations from the CMCC-ESM2 model showed the greatest decrease in precipitation, reaching −24.89% for the period of 2026–2050. Similarly, for the period of 2051–2075, the IPSL-CM6A-LR model recorded the highest decrease, with a decrease of −27.64%. Finally, for the period of 2076–2100, the CESM2 model presented the maximum decrease, with −32.23%.
Under the SSP585 scenario, the IPSL-CM6A-LR model recorded the most pronounced decreases, with −23.38% for the period of 2026–2050; −37.43% for the period of 2051–2075; and −58.45% for the period of 2076–2100. For Zone 3, the IPSL-CM6A-LR model recorded the greatest decrease, with −25.21% for the period of 2026–2050, −31.88% for the period of 2051–2075, and −37.06% for the period of 2076–2100. Under the SSP585 scenario, the IPSL-CM6A-LR model also showed the largest declines, with decreases of −26.23%, −39.18%, and −64.03% for the periods 2026–2050, 2051–2075, and 2076–2100, respectively. In the case of Zone 4, under the SSP245 scenario, the CMCC-ESM2 model showed the largest decrease, reaching −23.41% for the period of 2026–2050. This trend intensified over time, with the MPI-ESM1-2-HR model recording the greatest decrease of -38.65% for the period of 2076–2100. Under the SSP585 scenario, the trend towards decreasing precipitation was also very pronounced, with minimum values of −24.92%, −36.57%, and −60.01% for the periods of 2026–2050, 2051–2075, and 2076–2100, respectively, all recorded with the IPSL-CM6A-LR model. Finally, for Zone 5 under the SSP245 scenario, although the general trend was towards an increase in precipitation, divergent results were observed for certain periods. For the period of 2026–2050, the MRI-ESM2-0 model showed an increase of 34.36%. However, for the subsequent periods, the increase with the EC-Earth3 model was more pronounced with values of 63.64% for the period of 2051–2075 and 62.57% for the period of 2076–2100. Under the SSP585 scenario, the NESM3 model showed the highest increase for the period of 2026–2050 with 59.1%. The increases for the subsequent periods were 86.63% for 2051–2075 and 97.6% for 2076–2100, respectively, and all were recorded with the EC-Earth3 model.
The use of the multi-model ensemble MME-33 confirmed these observations, with a general decrease in precipitation in Zones 1, 2, 3, and 4 and an increase in Zone 5, regardless of the scenario or period as shown in Figure 2. Thus, under the SSP245 scenario, the results obtained with the MME-33 multi-model ensemble reveal a trend of decreasing precipitation in Zones 1, 2, 3, and 4 for the period OF 2026–2050, with percentages ranging from 7.5% to 8.5%. This trend intensified over time, with percentage decreases reaching up to 15% in Zone 1, 14.3% in Zone 3, and 16.1% in Zone 4 for the period of 2076–2100. Conversely, an increase in precipitation was observed in Zone 5, with respective percentages of 8.01%, 4.04%, and 3.31% for the periods of 2026–2050, 2051–2075, and 2076–2100. Under the SSP585 scenario and for the period of 2026–2050, the percentage decreases with MME-33 range from 7.5% in Zone 1 to 8.5% in Zone 3 and 7.7% in Zone 4. This trend becomes more intense over time, with percentage decreases of 15.1% in Zone 1, 14.3% in Zone 3, and 16.1% in Zone 4 for the period of 2076–2100. On the other hand, the relative increase occurrence in precipitation Zone 5 is about 8.1%, 4.1%, and 3.3%, respectively, for the periods of 2026–2050, 2051–2075, and 2076–2100.
- b.
- Annual maximum 1-day precipitation (RX1day)
Regarding the relative change (%) in the RX1day index for the three periods and two scenarios, a general increasing trend took place across all model simulations, as observed in the five zones (see Figure 3). For Zone 1 under the SSP245 scenario, the KACE-1-0-G model showed the highest increase in RX1day for the period of 2026–2050, reaching 26.62%. This trend persisted for the subsequent periods, with values of 26.03% for 2051–2075 and 31.26% for 2076–2100 both recorded with the same model. Under the SSP585 scenario, the KACE-1-0-G model exhibited the highest increase in RX1day for the period of 2026–2050, with a value of 20.36. This trend continued for the period of 2076–2100, with an increase of 31.02, both recorded with the KACE-1-0-G model. For Zone 2, under the SSP245 scenario, the UKESM1-0-LL model showed the highest increase in the RX1day index for the period of 2026–2050, with a value of 15.44%. However, for the periods of 2051–2075 and 2076–2100, the FGOALS-G3 model recorded the most significant increases, with values of 16.47% and 16.18%, respectively. Under the SSP585 scenario, the CMCC-ESM2 model showed the highest increase in rx1day for the period of 2026–2050, with a value of 18.87. However, for the periods of 2051–2075 and 2076–2100, the FGOALS-g3 model recorded the most significant increases, with values of 14.31 and 11.51, respectively. For Zone 3, under the SSP245 scenario, the NESM3 model exhibited the highest increase in the RX1day index for the period of 2026–2050, with 20.28%. This trend continued for the period of 2076–2100, with an increase of 29.43%, while for the period of 2051–2075, the MIROC6 model recorded the highest increase, with 17.83%. Under the SSP585 scenario, the CMCC-ESM2 models showed the highest increases in RX1day for the period of 2026–2050 (17.06%). For the period of 2051–2075, the NESM3 model records the highest increase with (20.76%), while for the period of 2076–2100, the MIROC6 model shows the highest increase, with a value of 17.05%. For Zone 4, under the SSP245 scenario, the CESM2-WACCM model showed the highest increases in the RX1day index for the period of 2051–2075, with values of 16.92%. For the period of 2026–2050, the NESM3 model recorded the highest increase (16.35%), while for the period of 2076–2100, the FGOALS-g3 model showed the highest increase, with 14.99%. Under the SSP585 scenario, the CMCC-ESM2 models exhibited the highest increases in Rx1day for the period of 2026–2050, with a rate of 18.34%. For the period of 2051–2075, the CANESM5 model recorded the highest increase with a rate of 14.66%, while for the period of 2076–2100, the FGOALS-g3 model showed the highest increase (11.67%). For Zone 5 under the SSP245 scenario, the MRI-ESM2-0 model exhibited the highest increase in the RX1day index for the period of 2026–2050 with 32.22%. For the subsequent periods, the most significant increases were recorded with the KIOST-ESM model, with 29.34% for 2051–2075 and 26.38% for 2076–2100. Under the SSP585 scenario, the NESM3 model exhibited the highest increase in Rx1day for the period of 2026–2050, with 47.11%. For the periods 2051–2075 and 2076–2100, the most significant increases were recorded with the KIOST-ESM model, with 45.76% and 59.83%, respectively.
The use of the multi-model ensemble MME-33 confirmed these simulations with a general increase in the Rx1day index in five zones regardless of the scenario or period as illustrated by Figure 3. Therefore, under the SSP245 scenario, the results from the MME-33 multi-model ensemble reveal an increasing trend in Rx1day in five zones for the period of 2026–2050, with rates ranging from 2.5% to 7.0%. This trend intensifies during the subsequent period, 2051–2075, where the increase reaches up to 5.0% in Zone 1, 3.85% in Zone 2, 4.15% in Zone 3, 2.90% in Zone 4, and 5.58% in Zone 5. However, for the period of 2076–2100, these increase rates decrease slightly. Under the SSP585 scenario, for the period of 2026–2050, the increase obtained by the MME-33 multi-model ensemble ranges from 3.56% in Zone 1 to 8.63% in Zone 5 and 3.6% in Zone 3. This increasing trend strengthens during the subsequent period, 2051–2075, with rates reaching 4.1% in Zone 1 and 8.83% in Zone 5. However, for the period of 2076–2100, these rates show a slight decrease, except for Zone 5 where this rate increases up to 12.43%.
- c.
- Annual total precipitation from days > 99th percentile (R99p)
Regarding the relative change (%) in the R99p index for the three periods and the two scenarios, a general increasing trend took place across all model simulations and in the five zones as illustrated in Figure 4. For Zone 1, under the SSP245 scenario, the NorESM2-LM model recorded the highest increase in R99p values for the period of 2026–2050 reaching 45.72%. This trend persisted also for the subsequent periods at values of 44.97% for 2051–2075 with the KACE-1-0-G model and 49.78% for 2076–2100 in the NorESM2-LM model. Under the SSP585 scenario, the KACE-1-0-G model also exhibited the highest increase in R99p for the periods of 2026–2050 and 2076–2100, with rates of 46.06% and 81.02%, respectively. This trend was also observed in the GFDL-CM4 model for the period of 2051–2075, with an increase of 49.66%. For Zone 2, under the SSP245 scenario, the EC-Earth3 model showed the highest increase in R99p values for the period of 2026–2050, reaching 37.91%. This trend persisted for the period of 2051–2075 with a value of 42.89% recorded with the MRI-ESM2-0 model. For the period of 2076–2100, the EC-Earth3-Veg-LR model exhibited the highest increase at 41.38%. Under the SSP585 scenario, the CMCC-ESM2 model also showed the highest increase for the period of 2026–2050, at a value of 44.83, while the GISS-E2-1-G model recorded the highest increase for the period of 2051–2075, with a value of 42.91%. This trend was also observed through the KACE-1-0-G model for the period of 2076–2100, with an increase of 50.61%. For Zone 3, under the SSP245 scenario, the CNRM-CM6-1 model exhibited the highest increase in R99p values for the period of 2026–2050, reaching 56.15%. It persisted for the period of 2051–2075 to reach 82.18%, which was recorded with the MRI-ESM2-0 model. For the period of 2076–2100, the MIROC6 model presented the highest increase of 62.80%. Under the SSP585 scenario, the NorESM2-MM model also showed the highest increase for the period of 2026–2050 (43.39), while the GFDL-CM4 model recorded the highest increase for the periods of 2051–2075 and 2076–2100, with 42.36% and 75.52%, respectively. For Zone 4, under the SSP245 scenario, the CMCC-CM2-SR5 model exhibited the highest increase in R99p values for the period of 2026–2050, reaching 36.05%. This trend persisted for the period of 2051–2075, with a value of 55.31% recorded with the MRI-ESM2-0 model. For the period of 2076–2100, the EC-Earth3-Veg-LR model presented the highest increase (35.88%). Under the SSP585 scenario, the BCC-CSM2-MR model showed the highest increase in R99p values for the period of 2026–2050 (38.47%). This trend was also observed with the GFDL-CM4 model for the period of 2051–2075, with an increase (42.57%). Additionally, the GFDL-CM4 model recorded the highest increase for the period of 2076–2100, with a value of 48.39%. For Zone 5, under the SSP245 scenario, the CNRM-CM6-1 model recorded the highest increase in R99p values for the period of 2026–2050, reaching 42.23%. This trend persisted for the period of 2051–2075, with a value of 52.87% recorded with the NorESM2-LM model. For the period of 2076–2100, the MRI-ESM2-0 model presented the highest increase at 48.83%. Under the SSP585 scenario, the KIOST-ESM model showed the highest increase in R99p values for the period of 2026–2050, reaching 44.72. This trend persisted for the period of 2051–2075, with 44.98% recorded by the EC-Earth3-Veg-LR model. For the period of 2076–2100, the KIOST-ESM model exhibited the highest increase, at 59.38%.
The use of the multi-model ensemble MME-33 confirmed these simulations with a general increase in the R99p index in the five zones, regardless of the scenario or period (Figure 4). Therefore, under the SSP245 scenario, the results from the MME-33 multi-model ensemble reveal an increasing trend in R99p index values in the five zones for the period of 2026–2050. The R99p index values range from 12.00% to 19.32% across different zones, with Zone 5 showing the highest value (19.32%). For the period of 2051–2075, the increasing values range from 14.99% to 25.9%. Once again, Zone 5 recorded the highest increase with 25.9%. Finally, for the period of 2076–2100, the values decreased slightly compared to the previous period from 12.29% to 19.45%. Also, in this period, Zone 5 exhibited the highest value at 19.45%. For the SSP585 scenario, the increase rates recorded with the MME-33 multi-model ensemble varied differently across the different periods. For the period of 2026–2050, the increase varied from 14.28% in Zone 1 to 19.06% in Zone 5. During the period of 2051–2075, these rates experienced an increase, ranging from 14.72% to 23.52%. However, for the period of 2076–2100, there was an average variation from 12.42% to 23.76%. Generally, there was a rising trend in the R99p index over time, with specific variations across zones and periods.
- d.
- Number of heavy precipitation days (R20mm)
Figure 5 shows that in all zones and for both scenarios, there is a general increasing trend in R20mm index values. The observed increases go up to 1.5 days, and the decreases go down to −1.6 days. For Zone 1, under the SSP245 scenario, the GFDL-CM4 model recorded the highest increase in R20mm values for the period of 2026–2050, reaching 1.17 days. This trend continued for the subsequent periods, with values of 1.43 days for 2051–2075 with the GFDL-CM4 model and 0.58 days for 2076–2100 in the MPI-ESM1-2-LR model. Under the SSP585 scenario, the MRI-ESM2-0 model also showed the highest increase in R20mm for the period of 2026–2050, with a value of 0.77 days. For the period of 2051–2075, the GFDL-CM4 model recorded the highest increase, with a value of 1.33 days. Finally, for the period of 2076–2100, the FGOALS-G3 model exhibits the highest increase, with a rate of 0.51 days.
For Zone 2, under the SSP245 scenario, the IITM-ESM model had the highest increase in R20mm rates for the period of 2026–2050, reaching 1.18 days. This trend continued for the subsequent periods, with a maximum of 0.88 days for 2051–2075 and 0.89 days for 2076–2100 with the GFDL-CM4 model for both periods. Under the SSP585 scenario, the MRI-ESM2-0 model indicated the highest increase in R20mm for the period of 2026–2050, with a value of 0.71 days. For the period of 2051–2075, the GFDL-CM4 model recorded the highest increase, with a value of 0.94 days. Finally, for the period of 2076–2100, the FGOALS-G3 model presented the highest increase, with a value of 0.50 days. For Zone 3, under the SSP245 scenario, the GFDL-CM4 model recorded the highest increase in R20mm values for the period of 2026–2050, reaching 0.94 days. This trend continued for the subsequent periods, with values of 0.57 days for 2051–2075 with the BCC-CSM2-MR model and 0.79 days for 2076–2100 with the MIROC6 model. Under the SSP585 scenario, the NorESM2-MM model also recorded the highest increase in R20mm for the period of 2026–2050, with a value of 0.57 days. For the period of 2051–2075, the NESM3 model showed the highest increase at a rate of 0.54 days. Finally, for the period of 2076–2100, the GFDL-CM4 model presented the highest increase with a value of 0.69 days. For Zone 4, under the SSP245 scenario, the GFDL-CM4 model showed the highest increase in R20mm values for the period of 2026–2050, reaching 0.84 days. This trend continued for the subsequent periods, with values of 0.60 days for 2051–2075 with the CMCC-CM2-SR5 model and 0.89 days for 2076–2100 with the GFDL-CM4 model. Under the SSP585 scenario, the NorESM2-MM model recorded the highest increase in R20mm for the period of 2026–2050, with a value of 0.60 days. For the period of 2051–2075, this value still decreased to 0.47 days with the NorESM2-MM model. Finally, during the period of 2076–2100, the FGOALS-G3 model yielded the highest increase, with a value of 0.28 days. For Zone 5, under the SSP245 scenario, the MRI-ESM2-0 model recorded the highest increase for R20mm for the period of 2026–2050, with 0.11 days. This trend continued for the subsequent periods, with values of 0.06 days for 2051–2075 for the ACCESS-CM2 model and 0.09 days for 2076–2100 from for CMCC-CM2-SR5 model. Under the SSP585 scenario, the NESM3 model maintained a constant value of R20mm for the periods of 2026–2050 and 2051–2075 with values of 0.06 days. However, for the period of 2076–2100, the MIROC-ES2L model showed a slight increase with 0.09 days.
The individual models as well as the multi-model ensemble MME-33 show the same increasing and decreasing trends from the simulated variations across the five zones for different periods under both scenarios (Figure 5). For Zone 1, under the SSP245 scenario, there is a decrease of −0.09 days from 2026 to 2050, followed by a slight increase of −0.028 days from 2051 to 2075 and a more pronounced decrease of −0.118 days from 2076 to 2100. In Zone 2, the values gradually decrease from −0.12 to −0.16 for the three periods. However, in Zone 3, there is an increasing trend that ranges from 0.07 to 0.09 days over the same period. As for Zones 4 and 5, they show relatively stable variations with oscillations around 0 days. Under the SSP585 scenario, the variations in the R20mm index are also variable across the five zones for different periods. In Zone 1, a decrease is observed from −0.17 days for 2026–2050 to −0.53 days for 2076–2100. Zone 2 shows a similar trend with values ranging from −0.18 days to −0.62 days over the same period. However, in Zone 3, there is a slight increase of 0.06 days from 2026 to 2050, which is followed by a decrease from 2051 to −0.09 days in the 2076–2100 period. Zones 4 and 5 also show downward trends, though these are less pronounced than in Zones 1 and 2, with values ranging from −0.03 days to −0.32 days for Zone 4 and remaining relatively stable around 0 days for Zone 5.
4.1.2. Relative Percentage Variations in Indices for Each Zone by All Models
The box and whisker plots illustrate the relative variations in the 33 climate models in each zone for the three future periods, and they are presented according to the two scenarios in Figure 6 (PRCPTOT), Figure 7 (RX1day), Figure 8 (R99p), and Figure 9 (R20mm). The spatial maps of each model for the four indices as well as their changes over the three future periods under the two scenarios are compiled in Supplementary Materials S2 in the form of an HTML page.
- a.
- Annual Total Precipitation in Wet Days (PRCPTOT)
The box and whisker plots represent the relative changes (%) of the PRCPTOT index for the 33 climate models in each zone for the three future periods according to the two scenarios presented in Figure 6.
The analysis of changes in the PRCPTOT index according to the SSP245 and SSP585 scenarios over three distinct periods (2026–2050, 2051–2075, and 2076–2100) highlights general trends as well as emphasizing disparities among the geographical regions. Across each period, a variety of values were observed in all zones, ranging from negative to positive. These variations are clearly depicted by the box plots, revealing specific asymmetrical distributions for each zone. In the SSP245 scenario, the average changes in the PRCPTOT index for each zone are generally lower than in SSP585 over the three periods. For example, for Zone 1 during the period of 2026–2050, the average change is -7.66% in SSP245, compared to −10.09% in SSP585. This trend holds true across all periods and zones illustrating less pronounced variations in SSP245 compared to SSP585. In both scenarios, Zones 1 to 4 show a decreasing trend characterized by negative means and quartiles, indicating significant dispersion of relative changes in the PRCPTOT index, while Zone 5 stands out with an increasing trend, suggesting a progressive relative increase in precipitation in this region over time. Despite these differences in means, the variations between zones and periods remain consistent between the two scenarios, with the trend in Zones 1 to 4 generally decreasing and that in Zone 5 increasing. Detailed descriptions of the box plots of relative (%) changes in the PRCPTOT index for each period and scenario are provided in Annex 3.
- b.
- Annual maximum 1-day precipitation (RX1day)
The box and whisker plots illustrate the relative (%) changes in the RX1day index for the 33 climate models in each zone over the three future periods, according to the two scenarios (Figure 7).
The analysis of RX1day index variations under the SSP245 and SSP585 scenarios for the periods 2026–2050, 2051–2075, and 2076–2100 reveals significant results, highlighted by the changes from the 33 climate models used. In the SSP245 scenario, the observed changes in each zone over the periods show some consistency. Overall, the trends vary between decreases and increases with relatively moderate discrepancies. For example, in Zone 1 for the period of 2026–2050, the average change is about 4.0%, while for the period of 2076–2100, it is about 5.45%. This general trend is observed in all zones, although variations may differ across periods. Conversely, in the SSP585 scenario, variations are more pronounced, with larger discrepancies between periods and zones. The average changes are also higher than in SSP245, which reflects more significant variations in extreme precipitation. For instance, in Zone 5 for the period of 2026–2050, the average change is 8.96%, while for the period of 2076–2100, it is 12.76%. In summary, the results show that the SSP585 scenario projections have more substantial variations in the RX1day index compared to SSP245, with significantly marked differences between periods. While SSP245 presents relatively stable and moderate variations, SSP585 reveals more dynamic trends and significant variations over time. Descriptions of the box and whisker plots of relative (%) changes in the RX1day index for each period and scenario are detailed in Supplementary Materials S3.
- c.
- Annual total precipitation from days > 99th percentile (R99p)
The box and whisker plots represent the relative (%) changes in the R99p index for the 33 climate models in each zone over the three future periods under the two scenarios that are presented in Figure 8.
The analysis of R99p index variations under the SSP245 and SSP585 scenarios reveals significant differences between the different geographical zones and periods. Under the SSP245 scenario, the variations in the R99p index for the periods of 2026–2050, 2051–2075 and 2076–2100 show notable discrepancies. The values vary significantly, with averages progressively increasing over time in each zone. For example, for the period of 2026–2050, the average changes observed in all zones in sequence are 12.0%, 12.67%, 14.13%, 14.04%, and 19.32% in Zones 1, 2, 3, 4, and 5, respectively. Similar trends are observed for the following periods, with average changes continuing to increase. Similarly, under the SSP585 scenario, significant variations are observed between different geographical zones for the three analyzed periods. The average changes are higher than under the SSP245 scenario, which indicates more significant variations in extreme precipitation. For example, for the period of 2026–2050, the average changes for the different zones are 14.17%, 12.99%, 12.48%, 12.1%, and 19.24%, respectively. Variations are also observed in the following periods in the average increase change continuation. Descriptions of the box and whisker plots of relative (%) changes in the R99p index for each period and scenario are detailed in Supplementary Materials S3.
- d.
- Number of heavy precipitation days (R20mm)
Box and whisker plots illustrating the absolute changes (in days) in the R20mm index for the 33 climate models in each zone over the three future periods are presented in Figure 9, according to the two scenarios.
The absolute changes in the R20mm index under the SSP245 scenario show relatively small differences in each geographical zone and for the three analyzed periods. The overall trends indicate slight fluctuations around zero with means close to zero in most zones. Under the SSP585 scenario, the absolute variations in the R20mm index exhibit trends similar to those observed under SSP245, but with slightly more pronounced means around zero. The differences between zones remain relatively small, although some deviations may be observable. Overall, the variations are close to zero and thus indicate that the mean changes in the R20mm index are relatively small and the values fluctuate around zero positively and negatively. This suggests a general stability of the R20mm index in the different geographical zones and for the studied periods, with minimal changes in most cases.
4.2. Analysis of the Significance of Changes in Extreme Precipitation Indices: Analysis of Model Consensus
Figure 10 depicts the percentage of models showing a relative positive change for each zone and over three future periods under the SSP245 and SSP585 scenarios, accompanied by a threshold of 66% to highlight the significance of the increase. Additionally, a lower threshold of 33% is included. If the percentage of models with a relative positive change falls below this 33% threshold, it implies a significant decrease.
- a.
- Annual Total Precipitation in Wet Days (PRCPTOT)
Figure 10 exhibits significant variations in the percentage of models in Zones 1, 2, 3, and 4, with a positive relative change over time for the SSP245 scenario. Specifically, Zones 1 and 2 display percentages between 0% and 15.15% (<33%) for the period of 2026–2050, indicating that a significant consensus appears in the model projections in terms of a decrease in the PRCPTOT index. However, these percentages decrease considerably over time, reaching 0% for the period of 2076–2100. Zone 5 shows higher percentages, exceeding 66% for all three periods, suggesting a significant increase in the PRCPTOT index.
For the SSP585 scenario, the results show similar trends, although the percentages of models with a positive relative change have generally lower values (not exceeding 3.5%) compared to SSP245. Overall, Zones 1, 2, 3, and 4 display percentages that gradually decrease over time, eventually reaching 0% for the period of 2076–2100, indicating a significant consensus in the model projections in terms of a decrease in the PRCPTOT index. However, Zone 5 exhibits significant variations, with percentages exceeding 66% for the first and last periods, indicating a significant increase in the PRCPTOT index.
- b.
- Annual maximum 1-day precipitation (RX1day)
For the SSP245 scenario, Zones 1, 2, 3, and 5 exhibit significant variations in the percentage of models, with a relative positive change over time for the RX1day index. Specifically, Zones 1 and 2 display high percentages that range between 60.61% and 72.73% for the period of 2026–2050, with a significant consensus in the model projections in terms of an increase in the RX1day index. These percentages decrease slightly over time but remain generally high for all periods. Zone 3 shows an increase in the percentages of models over time, reaching up to 75.76% for the period of 2076–2100. Zone 4 displays percentages ranging between 63.64% and 75.76% throughout the study period.
For the SSP585 scenario, the results show similar trends, although the percentages of models, with a positive relative change, are generally lower compared to SSP245. Zones 1, 2, and 5 exhibit percentages that decrease slightly over time, while Zone 3 shows a more pronounced decrease that reaches 57.58% for the last period. Zone 4 demonstrates a gradual decrease in the percentage of models over time, with values ranging between 48.48% and 63.64%.
- c.
- Annual total precipitation from days > 99th percentile (R99p)
For both scenarios and all three periods, a significant consensus was observed in the model projections in terms of an increase in the R99p index. As for the SSP245 scenario, all zones show variations in the models’ percentages with a positive relative change over time for the R99p index. Zones 1, 2, and 3 exhibit high percentages from the beginning of the study period, ranging from 69.70% to 87.88% for the period of 2026–2050. These percentages remain high over time, although Zone 5 has a decrease in the percentage of models over time from 93.94% to 87.88% between the periods of 2051–2075 and 2076–2100. For the SSP585 scenario, the trends are similar, with generally lower percentages compared to SSP245. Zones 1, 2, and 3 display high percentages at the beginning of the study period, but they decrease gradually over time. Zone 5 also shows a decreasing trend, although the percentages remain high, exceeding 90% for the last two periods.
- d.
- Number of heavy precipitation days (R20mm)
For both scenarios and all three periods, a consensus was observed in the model projections in terms of an increase in the R20mm index. For the SSP245 scenario, all zones show significant variations in the models’ percentage with a relative positive change over time. Specifically, Zones 1, 2, and 3 display high percentages from the beginning of the study period, ranging from 45.45% to 57.58% for the period of 2026–2050. However, these percentages gradually decrease over time, eventually reaching 39.39% for the period of 2076–2100. Zone 5 stands out with higher percentages, exceeding 66% for all three periods (2026–2050, 2051–2075, 2076–2100), which indicates a significant increase in the R20mm index in this zone throughout the study period. For Zone 3, a significant increase is also observed during the period of 2051–2075, with a percentage exceeding 66%. For the SSP585 scenario, the percentages of models with a relative positive change are generally lower compared to SSP245. Zones 1, 2, 3, and 4 exhibit high percentages at the beginning of the study period (ranging from 34% to 57%), but these gradually decrease over time, eventually reaching 9.09% in Zones 1 and 2 and 12.12% in Zone 4 for the period of 2076–2100. This suggests a significant decrease in the R20mm index in these zones for the period of 2076–2100. Zone 5 shows a trend towards an increase, although the percentages remain high but do not exceed 66% for all three periods.
4.3. Kernel Density Distribution (KDD) Plots for Extreme Precipitation Indices across Studied Periods and Regions Using MME-33
In this section, a comparison of kernel density distributions (KDDs) is performed for the three future periods under the SSP245 and SSP585 scenarios compared to the historical period, for each extreme precipitation index. The comparison is conducted for each zone using the multi-model ensemble MME-33 simultaneously. However, figures showing the comparison of probability densities for each individual model are aggregated in Supplementary Materials S2 in the form of an HTML page.
- a.
- Annual Total Precipitation in Wet Days (PRCPTOT)
Using the multi-model ensemble MME-33 simultaneously, Figure 11 illustrates the comparison, in each zone, of the KDDs for the three future periods of the PRCPTOT index under the SSP245 and SSP585 scenarios compared to the historical period.
The KDD curves of the PRCPTOT index indicate a shift to the left for future periods under all scenarios compared to the reference period in the first four zones with a nearly similar distribution in Zone 5. For the historical period (1990–2014), the annual precipitation corresponding to the maximum KDD in Zones 1 and 2 is approximately 580 mm, indicating that this value is the most frequently observed during this period. For the three future periods under the SSP245 scenario, the relative probability is higher than that of the historical period but with annual precipitation values lower than 580 mm. For Zone 1, according to both SSP245 and SSP585 scenarios, the most probable precipitations are similar, with values of 520 mm for the period of 2026–2050 and 480 mm for the periods 2051–2075. However, for the period of 2076–2100, the probable precipitations differ significantly between the two scenarios, with 480 mm under SSP245 and 290 mm under SSP585. For Zone 2, the most probable precipitations under SSP245 are 480 mm for the periods of 2026–2050 and 2051–2075, and 420 mm for the period of 2076–2100.
Under SSP585, precipitation levels of 480 mm are also observed for 2026–2050, 440 mm for 2051–2075, and 290 mm for 2076–2100. Furthermore, it is important to note that for both Zones 1 and 2, as well as for all three future periods under both SSP245 and SSP585 scenarios, annual precipitation levels below 580 mm are more likely than during the historical period, while precipitation levels above 580 mm are less likely. During the historical period, the most frequently observed annual precipitations in Zones 3 and 4 were 380 mm and 350 mm, respectively. For these zones, the most probable precipitations could decrease in the future under the SSP245 scenario, reaching 300 mm for the periods of 2026–2050 and 2051–2075, and then decrease to 250 mm for the period of 2076–2100. Under the SSP585 scenario, the most probable annual precipitations are 280 mm for 2026–2050 and 200 mm for both periods of 2051–2075 and 2076–2100. Additionally, it is important to note that for Zones 3 and 4 for all three future periods under both scenarios, annual precipitation levels below 380 mm are more likely than during the historical period, while precipitation levels above 380 mm are less likely. It is also worth mentioning that the likely observed annual precipitation, less than 380 mm, is higher in the period of 2076–2100 than in the two periods of 2026–2050 and 2051–2075. For the desert zone (Zone 5), it is more likely to observe zero annual precipitation under both SSP245 and SSP585 scenarios, whether during the historical or future periods. However, this probability is higher in the period of 2076–2100 than in the two periods of 2026–2050 and 2051–2075, as well as during the historical period. For the three future periods, an annual rainfall of between 20 and 100 mm has a higher probability of occurrence, albeit minimal, than that observed historically.
- b.
- Annual maximum 1-day precipitation (RX1day)
Figure 12 illustrates the comparison, in each zone, of the KDD of the RX1day index for the three future periods according to the SSP245 and SSP585 scenarios against the historical period, using the multi-model ensemble MME-33 simultaneously. The RX5day KDD shows a nearly similar pattern and becomes flatter in the future under both scenarios compared to the reference period. However, compared to the historical period, there is an increase in the probability of daily maximum precipitation exceeding 35 mm in the four northern zones. These values could reach up to 100 mm per day but with a relatively low probability. Under both scenarios, the most probable daily maximum precipitation for the historical period is almost similar to that of the three future periods. These values are approximately 25 mm in Zone 1, 28 mm in Zone 2, 18 mm in Zone 3, 22 mm in Zone 4, and 0 mm in Zone 5. Additionally, it is noteworthy that for Zones 1, 2, 3, and 4, as well as for the three future periods under both scenarios, daily maximum precipitation exceedance of 35 mm will be more probable compared to the historical period. These precipitations could range from 60 mm to 100 mm, although their probability remains relatively low. As for Zone 5, daily maximum precipitation values from 20 mm to 100 mm could be observed in the future.
- c.
- Annual total precipitation from days > 99th percentile (R99p)
Figure 13 illustrates the comparison, in each zone, of the KDD of the R99p index for the three future periods under the SSP245 and SSP585 scenarios based on the historical period, using the multi-model ensemble MME-33 simultaneously. The KDDs of R99p indicate that future periods are shifted to the right and become flatter under all scenarios compared to the reference period. In comparison with the historical period, it is possible to observe an increase in the probability of experiencing extremely heavy precipitation events (R99p) of more than 50 mm in all five examined zones. Although their probability remains relatively low, these values could reach up to 200 mm per year. The most probable R99p indices for the historical period are nearly similar to those for the three future periods under both scenarios that range around 30 mm in Zones 1, 2, 3, and 5 and 25 mm in Zone 4. Moreover, it is noteworthy that these extremely heavy precipitations will be more probable in future periods compared to the historical period, although their occurrence will remain rare.
- d.
- Number of heavy precipitation days (R20mm)
Figure 14 illustrates the comparison, in each zone, of the R20mm index KDDs for the three future periods under the SSP245 and SSP585 scenarios based on the historical period by using the multi-model ensemble MME-33 simultaneously. It is noteworthy that all zones exhibit double and triple peaks in the distribution of R20mm, and the distributions are flatter in the future period compared to the historical period. With respect to the historical period, there is an increase in the probability of the annual number of days where the daily precipitation is ≥20 mm exceeding 8 days in Zones 1, 2, and 4 and 2 days in Zones 3 and 5. These numbers could reach up to 25 days in Zones 1, 2, and 4 and up to 16 days in Zones 3 and 5, although their probability remains relatively low. Moreover, it is noteworthy that the annual number of days with daily precipitation of ≥20 mm ranges between 1 and 5 days but could increase in the three future periods under both scenarios compared to the historical period in Zones 1, 2, and 4.
5. Discussion and Conclusions
A comparison of spatial variability across five distinct sub-regions of Algeria and the temporal evolution of potential changes in the four extreme precipitation indices over the three future periods (2026–2050, 2051–2075, and 2076–2100), under the SSP245 and SSP585 scenarios, relative to the historical period (1990–2014) was conducted using 33 simulation models from NEX-GDDP-CMIP6. Five significant conclusions result from this analysis:
- Despite the differences among the individual models, the multi-model ensemble MME-33 predicted a decrease in annual precipitation in Zones 1 (eastern coastal), 2 (between the eastern coastal zone and the High Plateaus), 3 (western coastal regions), and 4 (High Plateaus) and an increase in Zone 5 (desert regions). The rate of increase or decrease projected by all 33 models for the SSP585 scenario was higher than the one projected for the SSP245 scenario. Furthermore, this rate of change gradually increased from the period of 2026–2050 to the period of 2076–2100. The MME-33 ensemble showed a decreasing trend in precipitation in Zones 1, 2, 3, and 4 for the period of 2026–2050 with percentages that ranged from 7.5% to 8.5% under the SSP245 scenario and 7.5% in Zones 1 and 2; 8.5% in Zone 3; 7.7% in Zone 4 under the SSP585 scenario. This trend intensified over time, with percentage decreases reaching up to 15% in Zone 1, 14.3% in Zone 3, and 16.1% in Zone 4 for the period of 2076–2100 under the SSP245 scenario, and 15.1% in Zone 1, 14.3% in Zone 3, and 16.1% in Zone 4 for the period of 2076–2100 under the SSP585 scenario. Conversely, under the SSP245 scenario, the increases in precipitation in Zone 5 were, respectively, 8.01%, 4.04%, and 3.31% for the periods of 2026–2050, 2051–2075, and 2076–2100. Under the SSP585 scenario, these increases were 8.1%, 4.1%, and 3.5% for the same periods. The average changes for the three periods were estimated for the entire model ensemble at −11% (Zone 1), −12.5% (Zones 2 and 4), −14% (Zone 3), and 5% (Zone 5) under the SSP245 scenario, and at −19% (Zone 1), −20% (Zones 2 and 4), −23% (Zone 3), and 11% (Zone 5) under the SSP585 scenario. Similar changes have been observed in different regions of the Mediterranean Basin. For example, in a study using simulations from the regional climate model RCA4, Bouabdelli et al. [15] and Zeroual et al. [28] found decreases in precipitation ranging from −0.5 to −1.5 mm/year (RCP4.5) and from −1.5 to −2.5 mm/year (RCP8.5) in Northern Algeria, while a trend around 0 was observed in Southern Algeria. Compared to the reference period from 1986 to 2005 using simulations from CMIP5 and CMIP6, Cos et al. [17] anticipated a significant decrease in long-term winter precipitation, reaching up to −20% to −40% over Northern Africa. Furthermore, compared to the reference period of 1985–2014, Majdi et al. [29] found a decrease in precipitation of 81 mm in both future periods (2020–2049 and 2050–2079) under the SSP585 scenario in the northern zones of the MENA region, which includes Zones 1, 2, and 3. Conversely, increases of up to 189 mm were observed in the southern regions of the MENA, where Zone 5 of our study is located.
- Despite the differences among the individual models, the multi-model ensemble MME-33 predicted an upward trend in the maximum precipitation in one day (Rx1day) and extremely heavy precipitation (R99p) indices across all zones, according to nearly all models. The results from the MME-33 ensemble reveal an increasing trend in the Rx1day and R99p indices in all five zones. For the period of 2026–2050, the rates of increase varied from 2.5% to 7.0% under the SSP245 scenario and from 3.6% to 8.6% according to the SSP585 scenario for the Rx1day index, and from 12.0% to 19.3% under SSP245 and from 14.3% to 19.1% under SSP585 for the R99p index. This trend strengthened for the following period, 2051–2075, where the rates of range increase were from 3.9% to 5.6% under SSP245 and from 4.1% to 8.8% under SSP585 for the Rx1day index, and from 15.0% to 25.9% under SSP245 and from 14.3% to 19.1% under SSP585 for the R99p index. However, for the period of 2076–2100, a slight decrease in the rates of increase was observed, except for Zone 5, where this rate increased up to 12.4% under SSP585 for the Rx1day index, while it ranged from 12.3% to 19.5% under SSP245 and from 14.7% to 23.5% under SSP585 for the R99p index. The average changes for the three periods were estimated for the entire model ensemble, with +14% (Zone 1), +13.5% (Zones 2 and 4), +17% (Zone 3), and +21% (Zone 5) for the Rx1day index and +5% (Zone 1), +3% (Zones 2 and 4), +4% (Zone 3), and +8% (Zone 5) for the R99p index under the SSP245 scenario. Under SSP585, the changes were +15% (Zone 1), +14% (Zones 2 and 4), +14% (Zone 3), and +22% (Zone 5) for the Rx1day index and 3% (Zone 1), +2% (Zones 2 and 4), +1% (Zone 3), and +12% (Zone 5) for the R99p index. The results obtained by Li et al. [30] and Seneviratne et al. [2] corroborate our results, showing an increase in the intensity and frequency of heavy precipitation events (Rx1day) for the period of 2071–2100 under the SSP126 and SSP585 scenarios compared to the reference period of 1985–2014. Specifically, Li et al. [30] observed increases ranging from 10% to 20% in Rx1day and Rx5day events over a 50-year period, as well as 5% to 10% increase in annual Rx1day and Rx5day events during the period of 2071–2100 under the SSP585 scenario. Similar results have been obtained by other studies covering regions including Algeria. Those studies were based on CMIP5 simulations and regional climate models (RCMs) assessing an increase in the intensity of heavy precipitation events [31,32,33]. For example, in a study on the MENA region, Driouech et al. [33] observed positive changes in the future (%) in extremely rainy days (R99p) for the period of 2071–2100 compared to the reference period of 1976–2005; for the R99p index in this study, changes ranged from +5% to +10% (Zone 1), +5% to +10% (Zones 2, 3, and 4), and exceeded +40% (Zone 5) under RCP4.5, while under RCP8.5, the changes ranged from +5% to +20% (Zone 1), +20% to +40% (Zones 2, 3, and 4), and from +40% to +100% (Zone 5).
- The individual models as well as the multi-model ensemble MME-33 showed the same trend, with increases and decreases in simulated variations across the five zones for different periods under both scenarios. However, it is important to note that these changes were minimal, not exceeding one day in the case of the multi-model ensemble MME-33. In Zone 1, the MME-33 ensemble predicted decreases for the periods of 2026–2050, 2051–2075, and 2076–2100 of −0.09 days, −0.03 days, and −0.12 days under the SSP245 scenario and −0.1 days, −0.17 days, and −0.12 days under the SSP585 scenario, respectively. In Zone 2, the values gradually decreased from −0.12 to −0.16 days over the three periods under the SSP245 scenario and from −0.18 days to −0.62 days under the SSP585 scenario. Under the SSP245 scenario, in Zone 3, an increasing trend was observed, ranging from 0.07 to 0.09 days. Regarding the SSP585 scenario, a slight increase of 0.06 days was observed from 2026 to 2050, which was followed by a progressive decrease to −0.09 days in 2076–2100. Under both scenarios and for the three future periods, Zones 4 and 5 exhibited relatively stable variations that oscillated around 0 days. The average changes for the three periods were estimated for the entire model ensemble, with −0.1 days (Zones 1 and 2) and +0.1 days (Zones 3, 4, and 5) under the SSP245 scenario and -0.36 days (Zones 1 and 2), −0.14 days (Zone 3), and 0.01 days (Zones 4 and 5) under the SSP585 scenario. In the Sixth IPCC Assessment Report [2], it was emphasized that at a global warming level of 1.5 °C, projections from CMIP6, CMIP5, and RCM models show divergent changes in the Mediterranean region, of which Algeria is a part [30,31,32,34]. In this regard, a decrease in annual precipitation and an expected intensification of extreme precipitation in the future are observed. This forecast is associated with low confidence when compared to the recent period (1995–2014) and with medium confidence when placed in the context of the pre-industrial era [2,30]. At a global warming level of 2 °C, the CMIP6 models anticipate a significant increase in the intensity and frequency of extreme precipitation in the Mediterranean Basin [30]. A median increase of over 2% is projected for Rx1day and Rx5day events over 50 years for a 1 °C warming level [30], as well as over 1% for annual Rx1day and Rx5day events and less than −2% for annual Rx30day events compared to the pre-industrial era. Additional evidence from CMIP5 simulations and RCMs confirms an increase in the intensity of extreme precipitation [30,31,32,34]. In this context, an intensification of extreme precipitation events is anticipated. This anticipation is characterized by moderate confidence when evaluated against the recent period (1995–2014) and by high confidence when considered against the pre-industrial era [2,30]. At a level of global warming of 4 °C, CMIP6 models project a robust decrease in annual precipitation and an increase in the intensity and frequency of extreme precipitation throughout the Mediterranean Basin [30]. A median increase of over 8% is projected for Rx1day and Rx5day events over 50 years compared to a 1 °C warming level [30], as well as over 2% for annual Rx1day and Rx5day events, and less than −2% for annual Rx30day events compared to the pre-industrial era [2]. Additional simulations from CMIP5 models and RCMs confirm an increase in the intensity of extreme precipitation [31,32,33,34,35,36]. In this context, an increase in extreme precipitation is projected. This anticipation is strongly supported when compared to the recent period (1995–2014) and also when evaluated against the pre-industrial era [2,30].
- For the three future periods under both scenarios, the decrease in annual precipitation in Zones 1, 2, 3, and 4, as well as the relative increase in annual precipitation in Zone 5 and the increase in the Rx1day and R99p indices in all zones, was predicted by 70% of the models. However, for the R20mm index, in Zones 1, 2, 3, and 4, a number of models indicated increases reaching 45.5% to 57.6% during the first period, with these gradually decreasing in the second and third periods to 9.09% and 12.12%. Zone 5 stood out with higher percentages exceeding 66% for the first two periods under the SSP245 scenario. These rates of increase remained high but did not exceed 66% for the third period under SSP245 and for all three periods under SSP585.
- The comparison of probability densities for the three future periods of the four indices with the historical period, according to the SSP245 and SSP585 scenarios, revealed the following facts: (a) Annual precipitation being below the most probable values in each zone during the historical period will become more probable in the future, while precipitation exceeding these values will be less probable. (b) The RX1day index for the three future periods showed an increase compared to the historical period in the probability of occurrence of the maximum daily precipitation exceeding 35 mm in the four northern zones. These values could reach up to 100 mm per day with a relatively low probability. Regarding Zone 5, a maximum daily precipitation from 20 mm to 100 mm could be observed in the future. (c) Compared to the historical period, there was an increase in the probability of extremely heavy precipitation (R99p) exceeding 50 mm in the five zones examined. Furthermore, these extremely heavy precipitation events are expected to be more probable in future periods with respect to the historical period, although their occurrences are rare. Furthermore, compared to the historical period, the models anticipated an increase in the probability of daily precipitation thresholds ≥20 mm in Zones 1, 2, and 4 (8 days), as well as in Zones 3 and 5 (2 days) for future periods. Additionally, it is noteworthy that the probability of observing between 1 and 5 days with daily precipitation ≥20 mm could increase in the three future periods in Zones 1, 2, and 4 compared to the historical period.
The current decrease in precipitation and the increase in extreme precipitation in certain areas of Algeria raise major concerns according to the reports by Hamitouche et al. [11], along with rising temperatures [37]. Additionally, forecasts anticipate a future decrease in precipitation in all sub-regions of Algeria, as well as a projected increase in maximum daily precipitation and extremely heavy precipitation. These trends could lead to numerous problems, including disruptions to agricultural cycles, reduced water resource availability, growing challenges in natural resource and environmental management, as well as increased flood risks, with their detrimental consequences on infrastructure, homes, and society as well as arable soil erosion, which will pose serious problems for food security. It is also wise to harness water resources from maximum precipitation events by building water retention basins in urban areas and constructing dams in watersheds to better manage floods and store excess water for future use, particularly for agricultural irrigation. This approach would help optimize water resource management and mitigate the adverse effects of extreme weather events on populations and infrastructure. It is essential to integrate these considerations into future socio-economic development plans to enhance resilience to anticipated climate change. By providing valuable insights to policymakers, planners, and researchers, this study contributes to strengthening Algeria’s resilience to the growing challenges posed by precipitation extremes in a context of rapid climate change.
Supplementary Materials
The following supporting information can be downloaded at: https://www.mdpi.com/article/10.3390/w16101353/s1, Table S1: CMIP6 Global Climate Models (GCMs) and their Affiliated Institutions and Countries.
Author Contributions
Conceptualization, Y.H., A.Z. and R.A.; data curation, Y.H., A.Z. and R.A.; formal analysis, Y.H., A.Z., M.M., A.A.A., R.A. and Z.Ş; investigation, Y.H., A.Z. and R.A.; methodology, Y.H., A.Z. and R.A.; resources, Y.H., A.Z. and R.A.; software, Y.H., A.Z. and R.A.; supervision, Y.H., A.Z. and R.A.; validation, Y.H., A.Z., M.M., A.A.A., R.A., Z.Ş. and X.Z.; visualization, Y.H., A.Z., R.A. and X.Z.; writing—original draft, Y.H. and A.Z.; writing—review and editing, A.Z., M.M., A.A.A., Z.Ş. and X.Z. All authors have read and agreed to the published version of the manuscript.
Funding
This research received no external funding.
Data Availability Statement
This research utilized gridded daily precipitation data obtained from the NASA Earth Exchange Global Daily Downscaled Projections (NEX-GDDP), derived from the latest generation of state-of-the-art general circulation model (GCM) simulations conducted as part of the Coupled Model Intercomparison Project Phase 6 (CMIP6). These NEX-GDDP datasets are accessible at https://ds.nccs.nasa.gov/thredds/catalog/AMES/NEX/GDDP-CMIP6/catalog.html (accessed on 1 November 2023). Daily precipitation observations were acquired from the Rainfall Estimates from Rain Gauge and Satellite Observations (CHIRPS), which can be accessed at https://www.chc.ucsb.edu/data/chirps (accessed on 1 November 2023).
Acknowledgments
This study is partially supported by the Open Funds of the State Key Laboratory of Hydraulics and Mountain River Engineering, Sichuan University (SKHL2303).
Conflicts of Interest
The authors declare no conflicts of interest.
References
- IPCC. Climate Change 2014: Impacts, Adaptation, and Vulnerability. Part A: Global and Sectoral Aspects. Contribution of Working Group II to the Fifth Assessment Report of the Intergovernmental Panel on Climate Change; Field, C.B., Ed.; Cambridge University Press: Cambridge, UK; New York, NY, USA, 2014; 1132p, Available online: www.ipcc.ch/report/ar5/wg2 (accessed on 1 April 2023).
- Seneviratne, S.; Zhang, X.; Adnan, M.; Badi, W.; Dereczynski, C.; Di Luca, A.; Ghosh, S.; Iskandar, I.; Kossin, J.; Lewis, S.; et al. Weather and Climate Extreme Events in a Changing Climate. In Climate Change (2021) The Physical Science Basis. Contribution of Working Group I to the Sixth Assessment Report of the Intergovernmental Panel on Climate Change; Masson-Delmotte, V., Zhai, P., Pirani, A., Connors, S.L., Péan, C., Berger, S., Caud, N., Chen, Y., Goldfarb, L., Gomis, M.I., et al., Eds.; Cambridge University Press: Cambridge, UK; New York, NY, USA, 2021; Chapter 11. [Google Scholar]
- Faranda, D.; Messori, G.; Jezequel, A.; Vrac, M.; Yiou, P. Atmospheric circulation compounds anthropogenic warming and impacts of climate extremes in Europe. Proc. Natl. Acad. Sci. USA 2023, 120, e2214525120. [Google Scholar] [CrossRef] [PubMed]
- King, A.D.; Reid, K.J.; Saunders, K.R. Communicating the link between climate change and extreme rain events. Nat. Geosci. 2023, 16, 552–554. [Google Scholar] [CrossRef]
- Chan, S.C.; Kendon, E.J.; Berthou, S.; Fosser, G.; Lewis, E.; Fowler, H.J. Europe-wide precipitation projections at convection permitting scale with the Unified Model. Clim. Dyn. 2020, 55, 409–428. [Google Scholar] [CrossRef]
- Shen, X.; Liu, B.; Lu, X. Weak cooling of cold extremes versus continued warming of hot extremes in China during the recent global surface warming hiatus. J. Geophys. Res. Atmos. 2018, 123, 4073–4087. [Google Scholar] [CrossRef]
- Kumari, A.; Kumar, P.; Dubey, A.K.; Mishra, A.K.; Saharwardi, S. Dynamical and thermodynamical aspects of precipitation events over India. Int. J. Clim. 2021, 42, 3094–3106. [Google Scholar] [CrossRef]
- Pall, P.; Patricola, C.M.; Wehner, M.F.; Stone, D.A.; Paciorek, C.J.; Collins, W.D. Diagnosing conditional anthropogenic contributions to heavy Colorado rainfall in September 2013. Weather. Clim. Extremes 2017, 17, 1–6. [Google Scholar] [CrossRef]
- Korichi, K.; Hazzab, A.; Atallah, M. Flash floods risk analysis in ephemeral streams: A case study on Wadi Mekerra (northwestern Algeria). Arab. J. Geosci. 2016, 9, 589. [Google Scholar] [CrossRef]
- Hadjij, I.; Sardou, M.; Missoum, H.; Maouche, S. Flood-related deaths in Northwestern Algeria from 1966 to 2019. Arab. J. Geosci. 2021, 14, 1923. [Google Scholar] [CrossRef]
- Hamitouche, Y.; Zeroual, A.; Meddi, M.; Assani, A.A.; Alkama, R. Changes in extreme precipitation indices across Algeria climate zones. Int. J. Climatol. 2024, 1–24. [Google Scholar] [CrossRef]
- Kastali, A.; Zeroual, A.; Remaoun, M.; Serrano-Notivoli, R.; Moramarco, T. Design flood and flood-prone areas under rating curve uncertainty: Area of Vieux-Ténès, Algeria. J. Hydrol. Eng. 2021, 26, 05020054. [Google Scholar] [CrossRef]
- Llasat, M.C.; Llasat-Botija, M.; Prat, M.A.; Porcú, F.; Price, C.; Mugnai, A.; Lagouvardos, K.; Kotroni, V.; Katsanos, D.; Michaelides, S.; et al. High-impact floods and flash floods in Mediterranean countries: The FLASH preliminary database. Adv. Geosci. 2010, 23, 47–55. [Google Scholar] [CrossRef]
- Kastali, A.; Zeroual, A.; Zeroual, S.; Hamitouche, Y. Auto-calibration of HEC-HMS Model for Historic Flood Event under Rating Curve Uncertainty. Case Study: Allala Watershed, Algeria. KSCE J. Civ. Eng. 2022, 26, 482–493. [Google Scholar] [CrossRef]
- Bouabdelli, S.; Zeroual, A.; Meddi, M.; Djelloul, F.; Alkama, R. Past and future drought in Northwestern Algeria: The Beni Bahdel Dam catchment. Proc. Int. Assoc. Hydrol. Sci. 2020, 383, 315–318. [Google Scholar] [CrossRef]
- Todaro, V.; D’oria, M.; Secci, D.; Zanini, A.; Tanda, M.G. Climate change over the mediterranean region: Local temperature and precipitation variations at five pilot sites. Water 2022, 14, 2499. [Google Scholar] [CrossRef]
- Cos, J.; Doblas-Reyes, F.; Jury, M.; Marcos, R.; Bretonnière, P.-A.; Samsó, M. The Mediterranean climate change hotspot in the CMIP5 and CMIP6 projections. Earth Syst. Dyn. 2022, 13, 321–340. [Google Scholar] [CrossRef]
- IPCC. Summary for policymakers. In Climate Change 2021: The Physical Science Basis. Contribution of Working Group I to the Sixth Assessment Report of the Intergovernmental Panel on Climate Change; Masson-Delmotte, V., Zhai, P., Pirani, A., Connors, S.L., Péan, C., Berger, S., Caud, N., Chen, Y., Goldfarb, L., Gomis, M.I., et al., Eds.; Cambridge University Press: Cambridge, UK; New York, NY, USA, 2021. [Google Scholar]
- Zittis, G.; Hadjinicolaou, P.; Klangidou, M.; Proestos, Y.; Lelieveld, J. A multi-model, multi-scenario, and multi-domain analysis of regional climate projections for the Mediterranean. Reg. Environ. Chang. 2019, 19, 2621–2635. [Google Scholar] [CrossRef]
- Zhang, X.; Feng, Y. RClimDex User Manual. Climate Research Division, Science and Technology Branch Science and Technology Branch, Environment Canada, 23p. 2004. Available online: https://www.scirp.org/reference/referencespapers?referenceid=1945678 (accessed on 1 November 2023).
- Haensler, A.; Saeed, F.; Jacob, D. Assessing the robustness of projected precipitation changes over central Africa on the basis of a multitude of global and regional climate projections. Clim. Chang. 2013, 121, 349–363. [Google Scholar] [CrossRef]
- Funk, C.; Peterson, P.; Landsfeld, M.; Pedreros, D.; Verdin, J.; Shukla, S.; Husak, G.; Rowland, J.; Harrison, L.; Hoell, A.; et al. The climate hazards infrared precipitation with stations—A new environmental record for monitoring extremes. Sci. Data 2015, 2, 150066. [Google Scholar] [CrossRef] [PubMed]
- Thrasher, B.; Wang, W.; Michaelis, A.; Melton, F.; Lee, T.; Nemani, R. NASA Global Daily Downscaled Projections, CMIP6. Sci. Data 2022, 9, 262. [Google Scholar] [CrossRef]
- Maurer, E.P.; Hidalgo, H.G. Utility of daily vs. monthly large-scale climate data: An intercomparison of two statistical downscaling methods. Hydrol. Earth Syst. Sci. 2008, 12, 551–563. [Google Scholar] [CrossRef]
- Thrasher, B.; Maurer, E.P.; McKellar, C.; Duffy, P.B. Technical Note: Bias correcting climate model simulated daily temperature extremes with quantile mapping. Hydrol. Earth Syst. Sci. 2012, 16, 3309–3314. [Google Scholar] [CrossRef]
- Jones, M. The performance of kernel density functions in kernel distribution function estimation. Stat. Probab. Lett. 1990, 9, 129–132. [Google Scholar] [CrossRef]
- Kamalov, F. Kernel density estimation based sampling for imbalanced class distribution. Inf. Sci. 2020, 512, 1192–1201. [Google Scholar] [CrossRef]
- Zeroual, A.; Assani, A.A.; Meddi, H.; Bouabdelli, S.; Zeroual, S.; Alkama, R. Assessment of Projected Precipitations and Temperatures Change Signals over Algeria Based on Regional Climate Model: RCA4 Simulations. In Water Resources in Algeria-Part I: Assessment of Surface and Groundwater Resources; Springer: Berlin/Heidelberg, Germany, 2020; pp. 135–159. [Google Scholar]
- Majdi, F.; Hosseini, S.A.; Karbalaee, A.; Kaseri, M.; Marjanian, S. Future projection of precipitation and temperature changes in the Middle East and North Africa (MENA) region based on CMIP6. Theor. Appl. Clim. 2022, 147, 1249–1262. [Google Scholar] [CrossRef]
- Li, C.; Zwiers, F.; Zhang, X.; Li, G.; Sun, Y.; Wehner, M. Changes in Annual Extremes of Daily Temperature and Precipitation in CMIP6 Models. J. Clim. 2021, 34, 3441–3460. [Google Scholar] [CrossRef]
- Samuels, R.; Hochman, A.; Baharad, A.; Givati, A.; Levi, Y.; Yosef, Y.; Saaroni, H.; Ziv, B.; Harpaz, T.; Alpert, P. Evaluation and projection of extreme precipitation indices in the Eastern Mediterranean based on CMIP5 multi-model ensemble. Int. J. Clim. 2018, 38, 2280–2297. [Google Scholar] [CrossRef]
- Cardell, M.F.; Amengual, A.; Romero, R.; Ramis, C. Future extremes of temperature and precipitation in Europe derived from a combination of dynamical and statistical approaches. Int. J. Clim. 2020, 40, 4800–4827. [Google Scholar] [CrossRef]
- Driouech, F.; ElRhaz, K.; Moufouma-Okia, W.; Arjdal, K.; Balhane, S. Assessing Future Changes of Climate Extreme Events in the CORDEX-MENA Region Using Regional Climate Model ALADIN-Climate. Earth Syst. Environ. 2020, 4, 477–492. [Google Scholar] [CrossRef]
- Zollo, A.L.; Rillo, V.; Bucchignani, E.; Montesarchio, M.; Mercogliano, P. Extreme temperature and precipitation events over Italy: Assessment of high-resolution simulations with COSMO-CLM and future scenarios. Int. J. Clim. 2016, 36, 987–1004. [Google Scholar] [CrossRef]
- Rajbhandari, R.; Shrestha, A.B.; Kulkarni, A.; Patwardhan, S.K.; Bajracharya, S.R. Projected changes in climate over the Indus river basin using a high resolution regional climate model (PRECIS). Clim. Dyn. 2016, 44, 339–357. [Google Scholar] [CrossRef]
- Monjo, R.; Gaitán, E.; Pórtoles, J.; Ribalaygua, J.; Torres, L. Changes in extreme precipitation over Spain using statistical downscaling of CMIP5 projections. Int. J. Clim. 2016, 36, 757–769. [Google Scholar] [CrossRef]
- Taïbi, S.; Zeroual, A.; Meddi, M. Effect of autocorrelation on temporal trends in air-temperature in Northern Algeria and links with teleconnections patterns. Theor. Appl. Clim. 2022, 147, 959–984. [Google Scholar] [CrossRef]
Figure 1.
On the left are the boundaries and locations of the five defined geographical zones of Algeria. On the right, mean annual precipitation (1990–2014) in Algeria derived from CHIRPS 0.05° × 0.05° data.
Figure 1.
On the left are the boundaries and locations of the five defined geographical zones of Algeria. On the right, mean annual precipitation (1990–2014) in Algeria derived from CHIRPS 0.05° × 0.05° data.

Figure 2.
Relative percentage changes of PRCPTOT index across models, multi-model ensemble, and scenarios for future periods (2026–2100) compared to the historical period (1990–2014) in Algeria’s five zones.
Figure 2.
Relative percentage changes of PRCPTOT index across models, multi-model ensemble, and scenarios for future periods (2026–2100) compared to the historical period (1990–2014) in Algeria’s five zones.
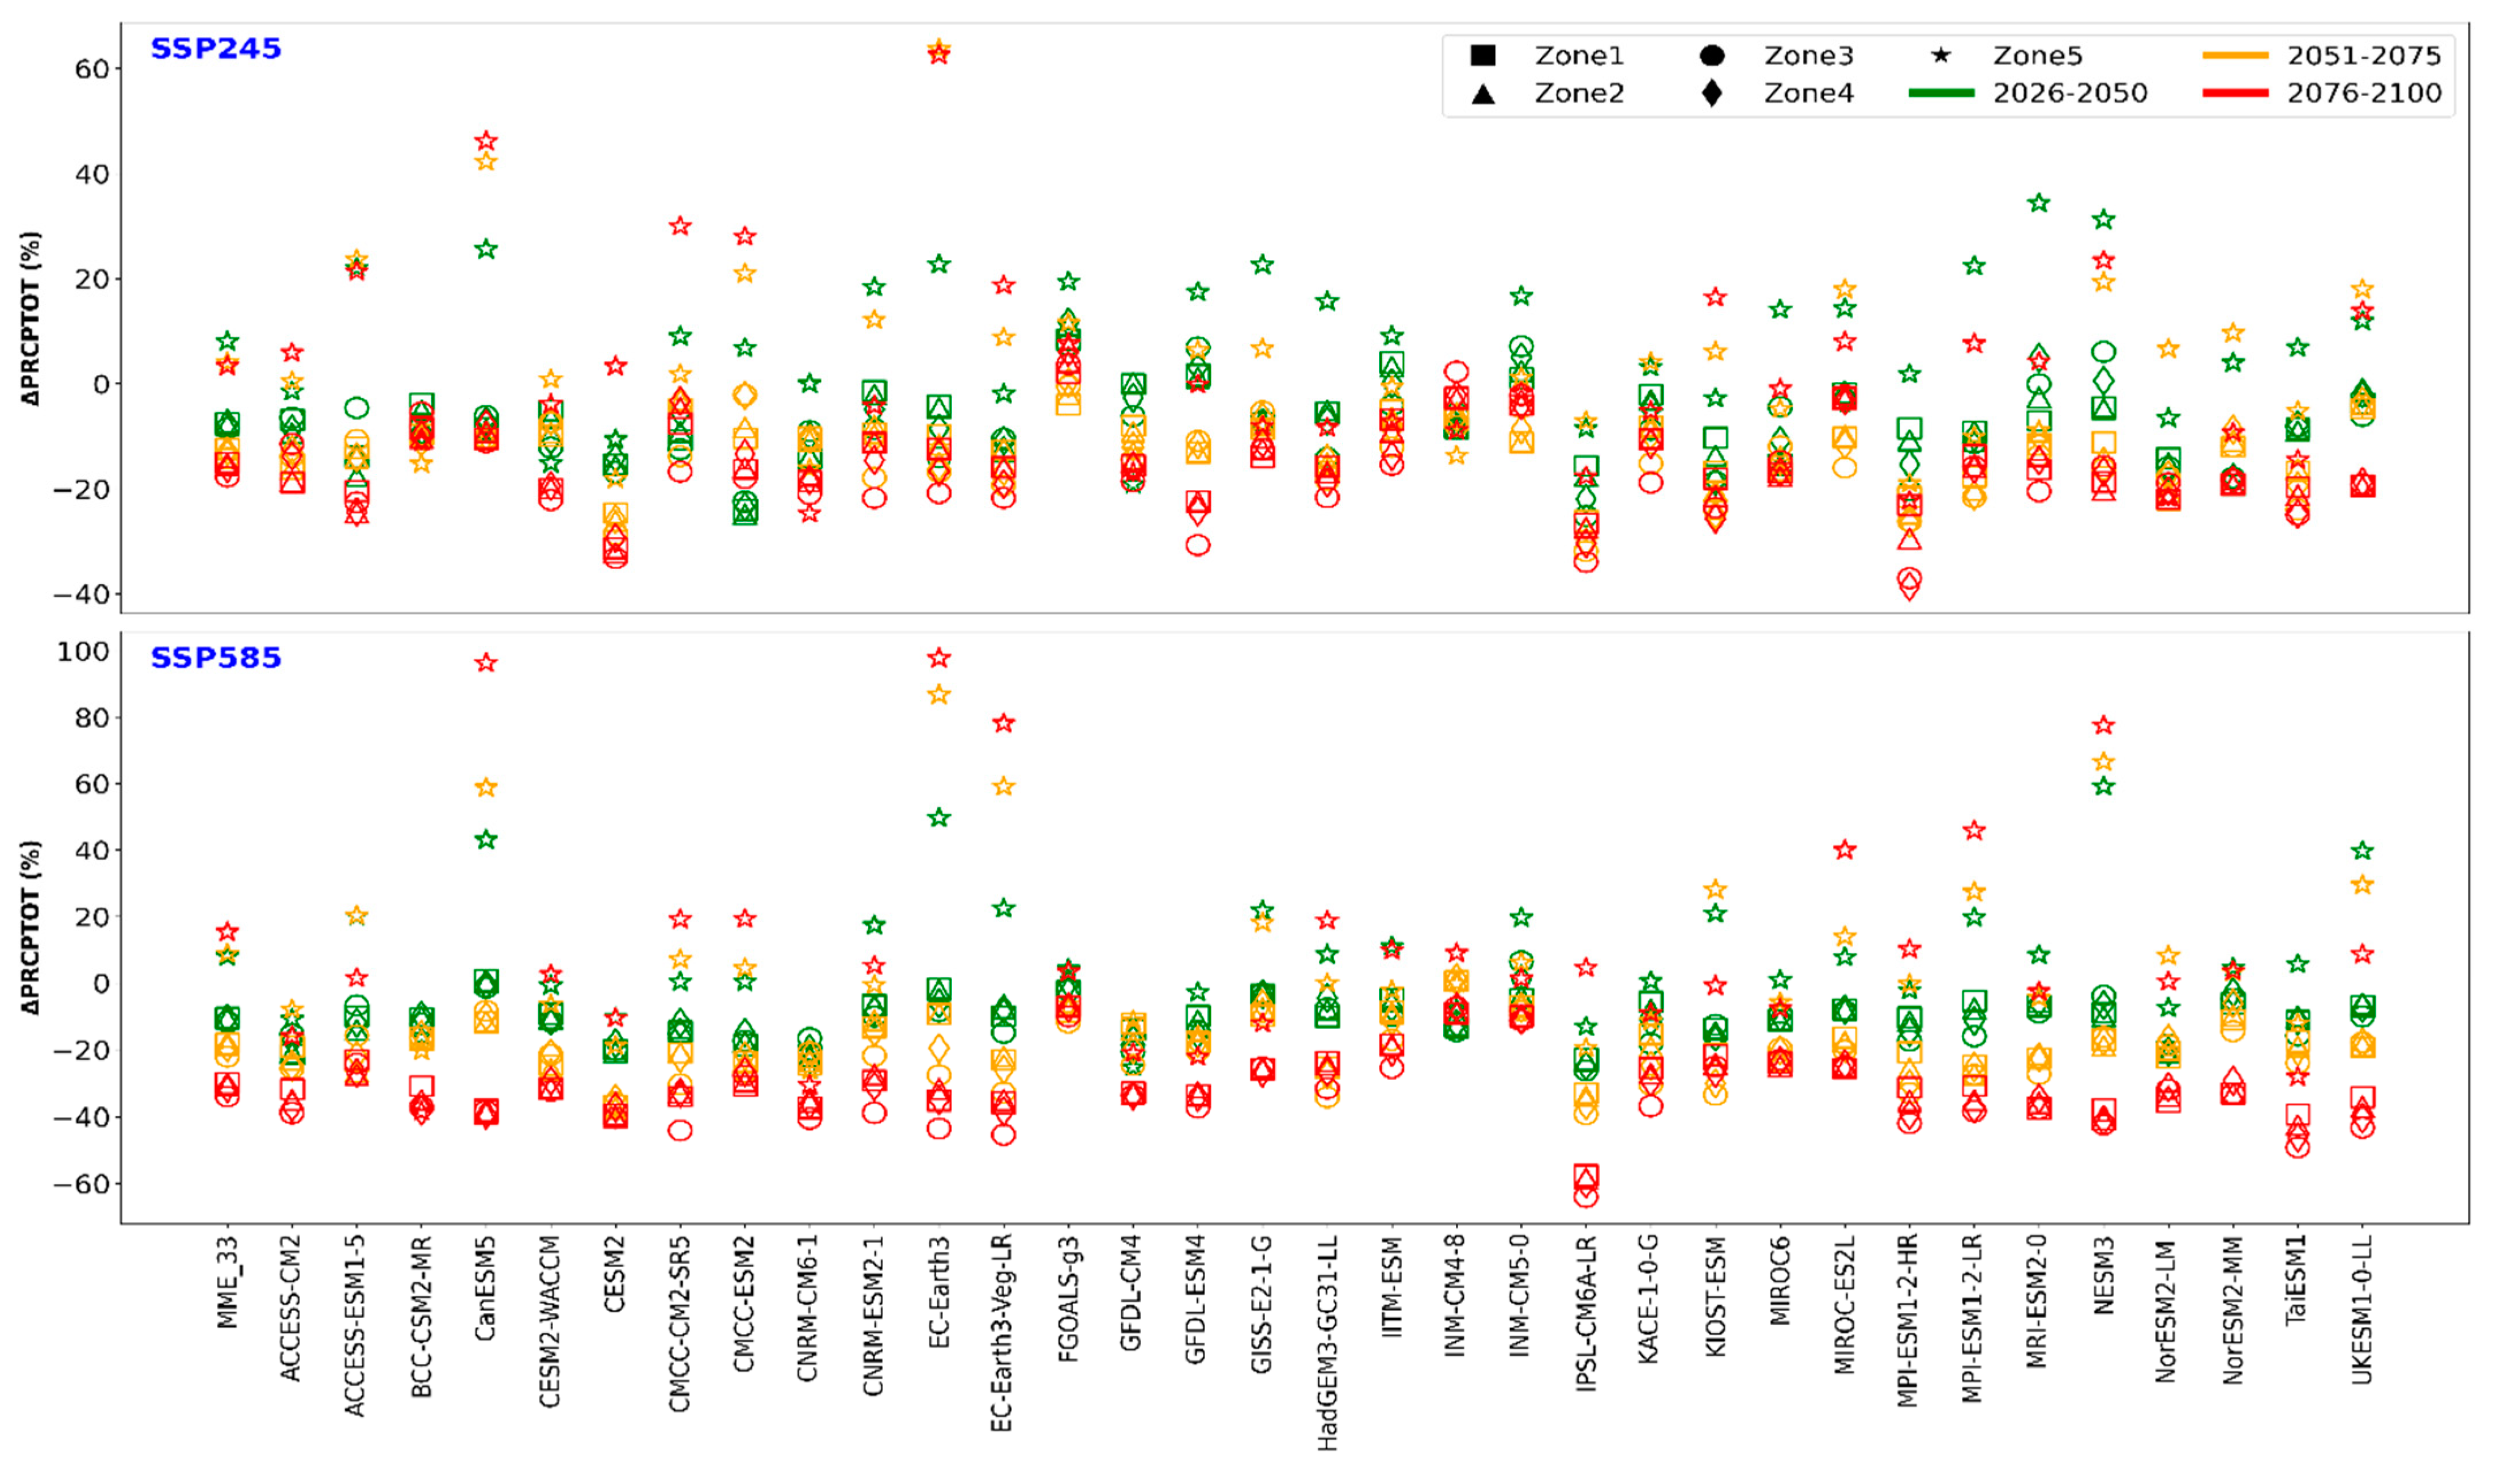
Figure 3.
Relative percentage changes of RX1day index across models, multi-model ensemble, and scenarios for future periods (2026–2100) compared to the historical period (1990–2014) in Algeria’s five zones.
Figure 3.
Relative percentage changes of RX1day index across models, multi-model ensemble, and scenarios for future periods (2026–2100) compared to the historical period (1990–2014) in Algeria’s five zones.
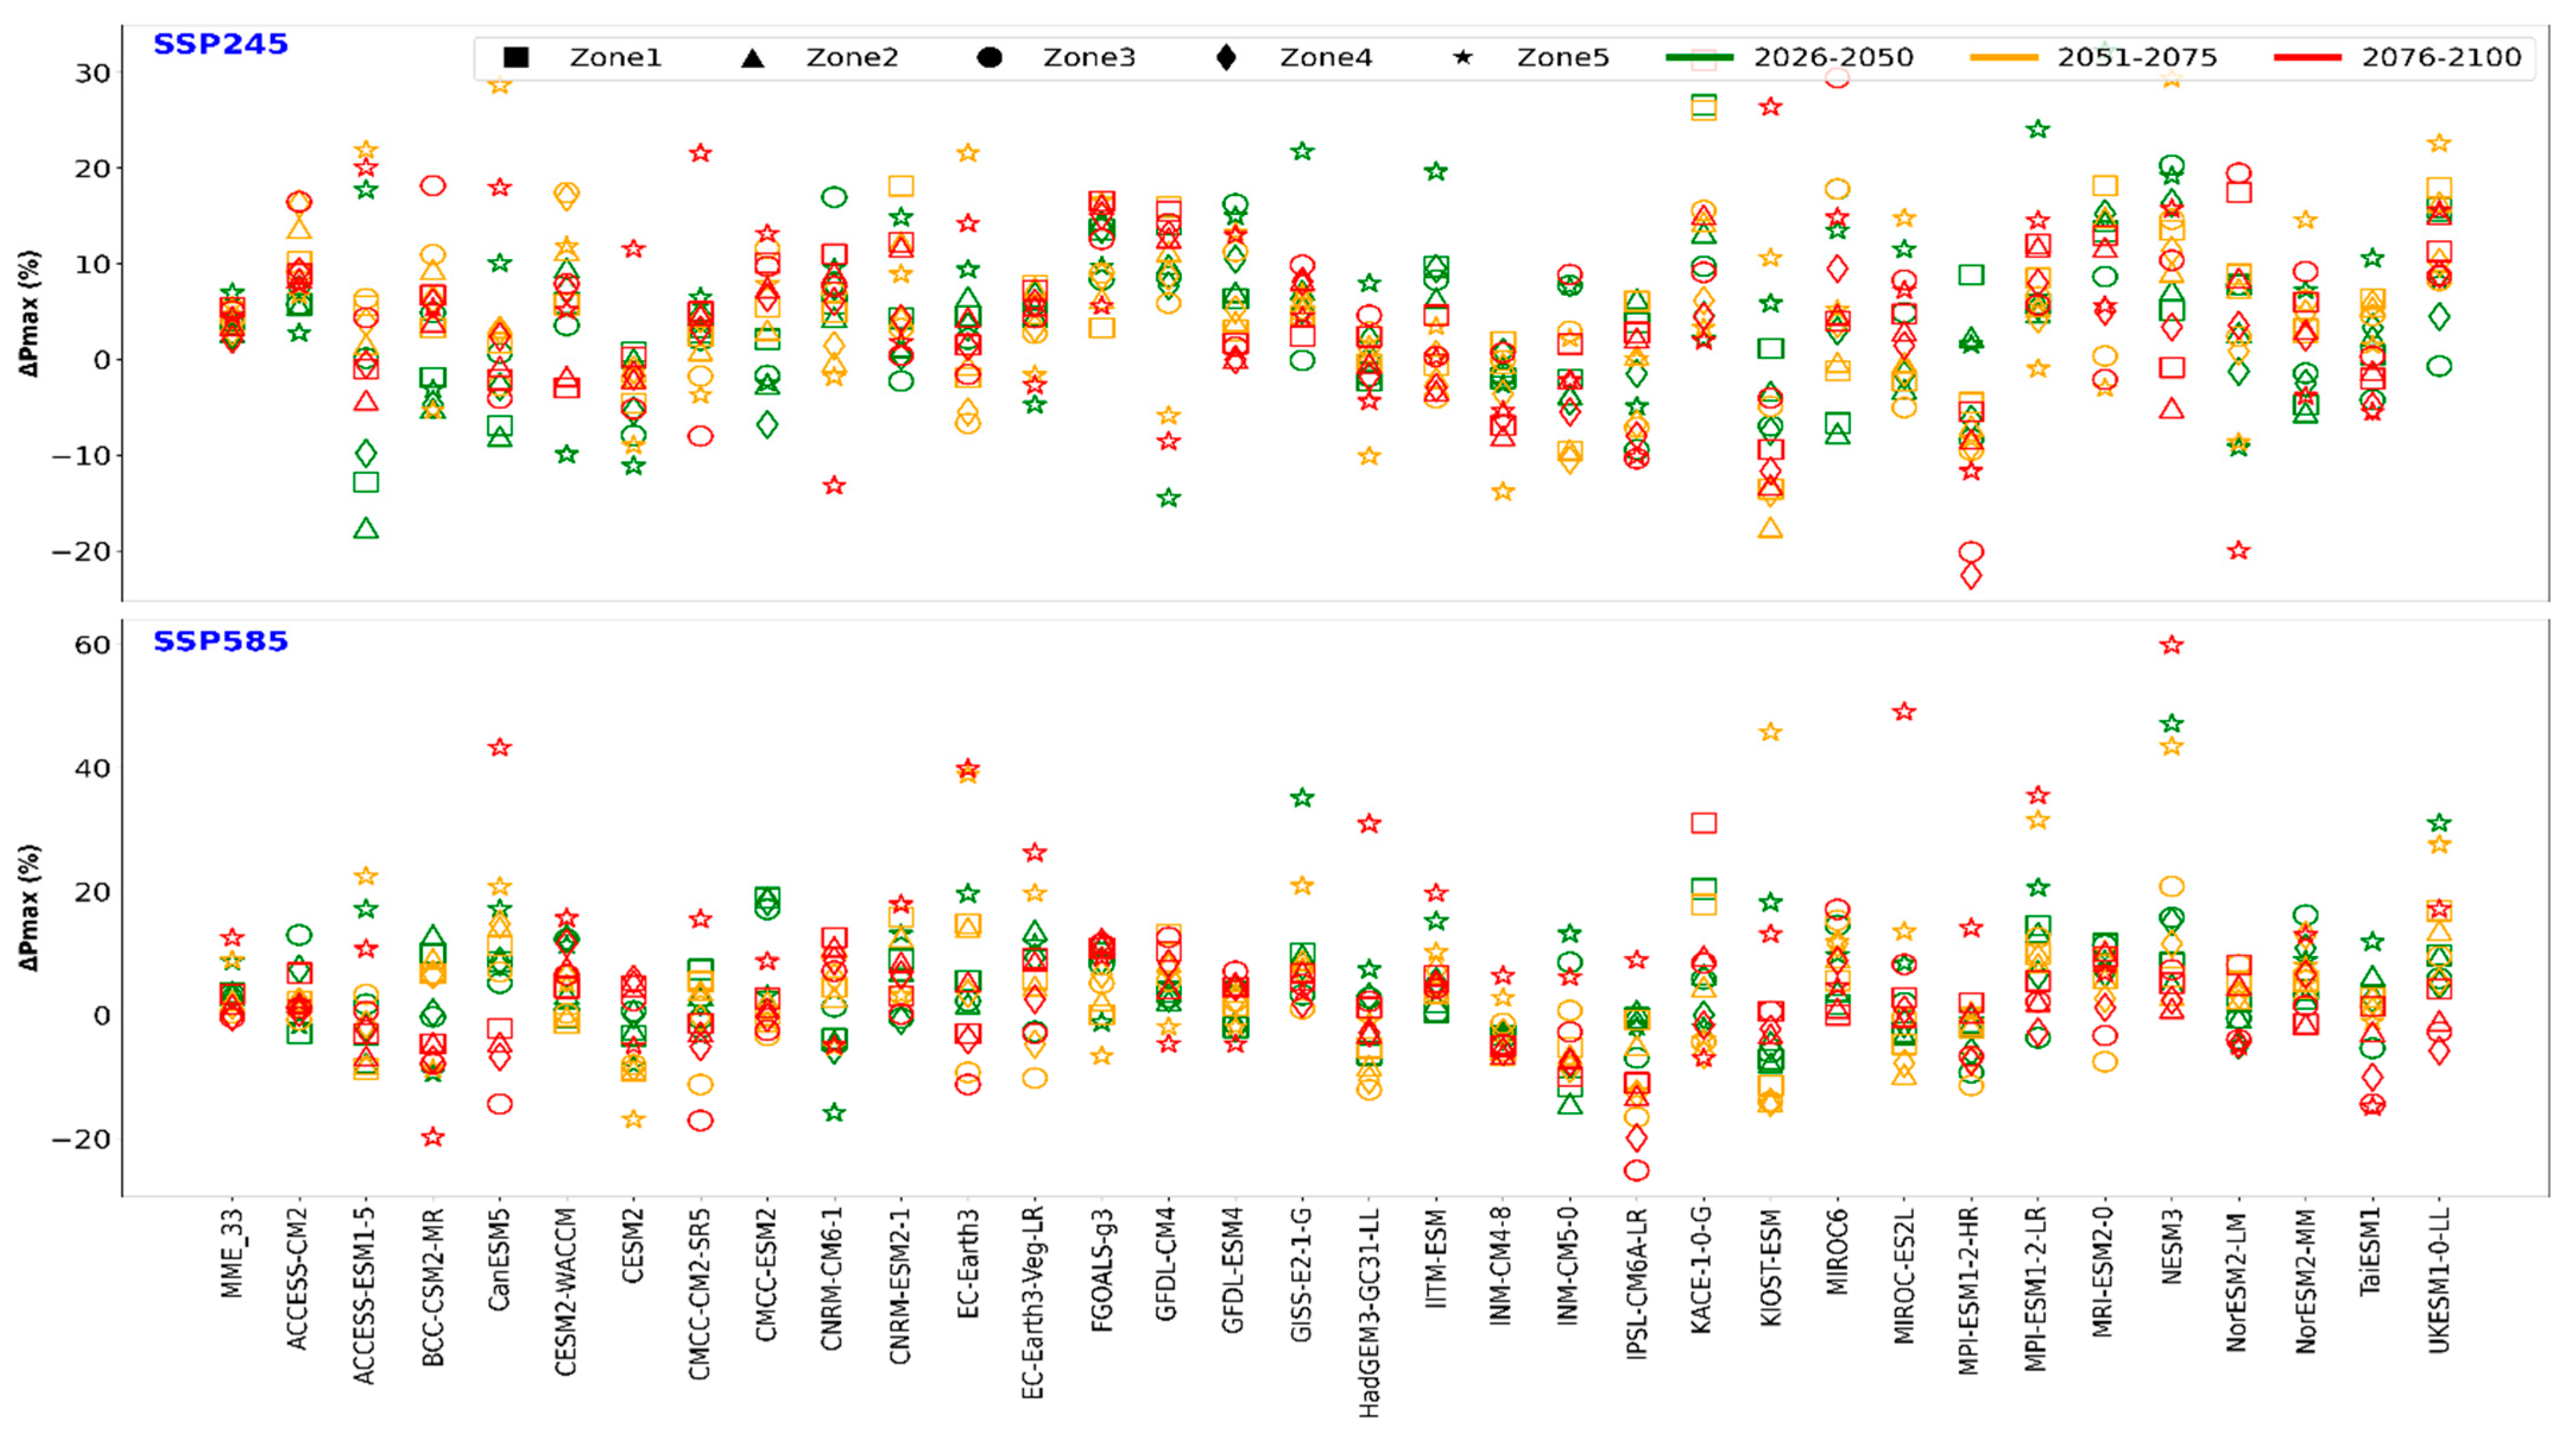
Figure 4.
Relative percentage changes of R99p index across models, multi-model ensemble, and scenarios for future periods (2026–2100) compared to the historical period (1990–2014) in Algeria’s five zones.
Figure 4.
Relative percentage changes of R99p index across models, multi-model ensemble, and scenarios for future periods (2026–2100) compared to the historical period (1990–2014) in Algeria’s five zones.

Figure 5.
Absolute percentage changes of R20mm index across models, multi-model ensemble, and scenarios for future periods (2026–2100) compared to the historical period (1990–2014) in Algeria’s five zones.
Figure 5.
Absolute percentage changes of R20mm index across models, multi-model ensemble, and scenarios for future periods (2026–2100) compared to the historical period (1990–2014) in Algeria’s five zones.

Figure 6.
Box and whisker plots of relative changes in the PRCPTOT index for the 33 climate models under the SSP245 (left) and SSP585 (right) scenarios.
Figure 6.
Box and whisker plots of relative changes in the PRCPTOT index for the 33 climate models under the SSP245 (left) and SSP585 (right) scenarios.

Figure 7.
Box and whisker plots of relative changes in the RX1day index from the 33 climate models according to the SSP245 scenarios (left) and SSP585 scenarios (right).
Figure 7.
Box and whisker plots of relative changes in the RX1day index from the 33 climate models according to the SSP245 scenarios (left) and SSP585 scenarios (right).

Figure 8.
Box and whisker plots of relative changes in the R99p index from the 33 climate models according to the SSP245 scenarios (Left) and SSP585 scenarios (Right).
Figure 8.
Box and whisker plots of relative changes in the R99p index from the 33 climate models according to the SSP245 scenarios (Left) and SSP585 scenarios (Right).
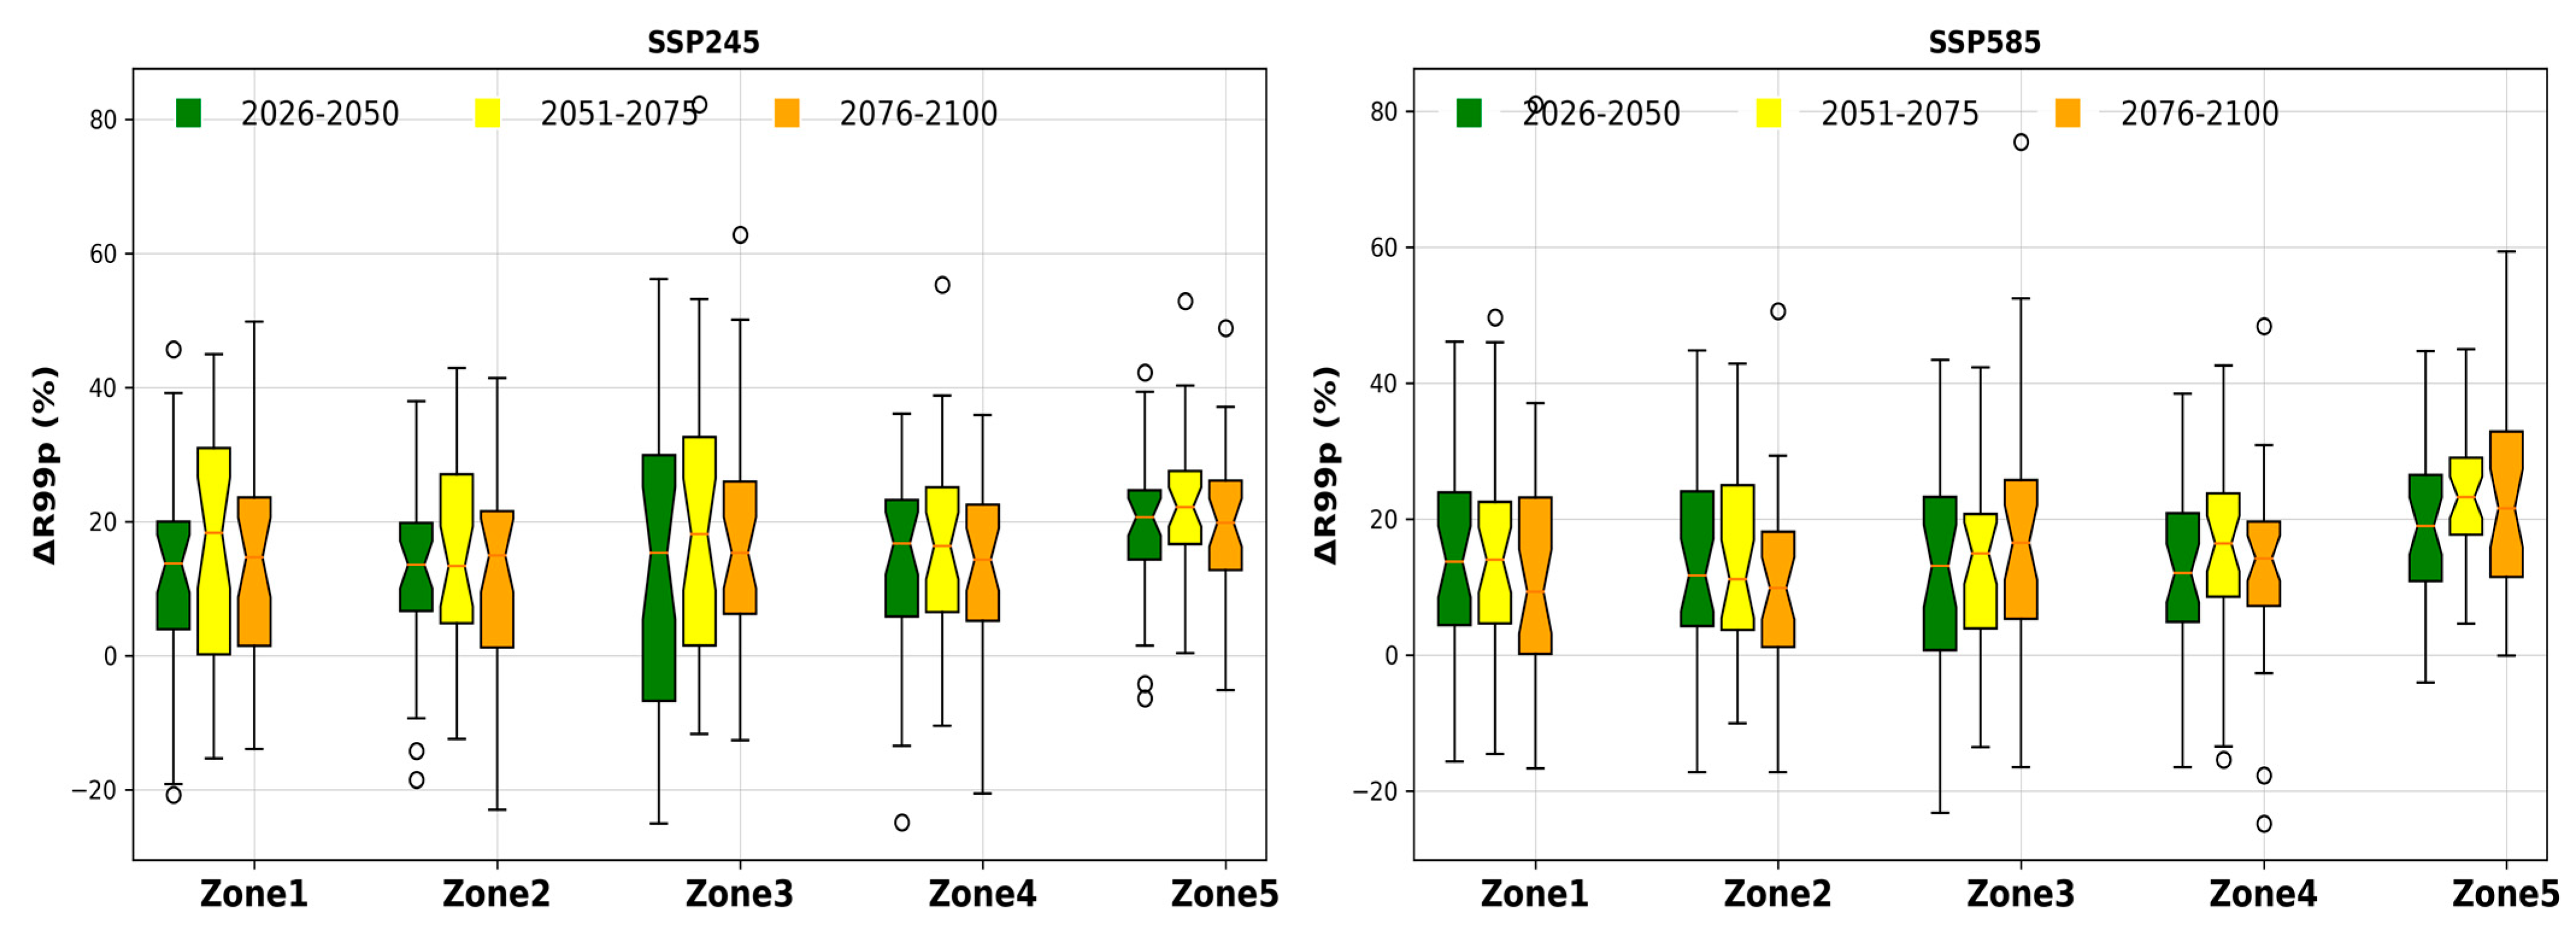
Figure 9.
Box and whisker plots of absolute changes in the R20mm index from the 33 climate models according to the SSP245 scenarios (left) and SSP585 scenarios (right).
Figure 9.
Box and whisker plots of absolute changes in the R20mm index from the 33 climate models according to the SSP245 scenarios (left) and SSP585 scenarios (right).

Figure 10.
Percentage of models with a positive relative change according to scenarios over three future periods, with significance thresholds.
Figure 10.
Percentage of models with a positive relative change according to scenarios over three future periods, with significance thresholds.

Figure 11.
Comparison of kernel density distributions of PRCPTOT index values for future periods according to SSP245 and SSP585 scenarios compared to the historical period using MME-33.
Figure 11.
Comparison of kernel density distributions of PRCPTOT index values for future periods according to SSP245 and SSP585 scenarios compared to the historical period using MME-33.
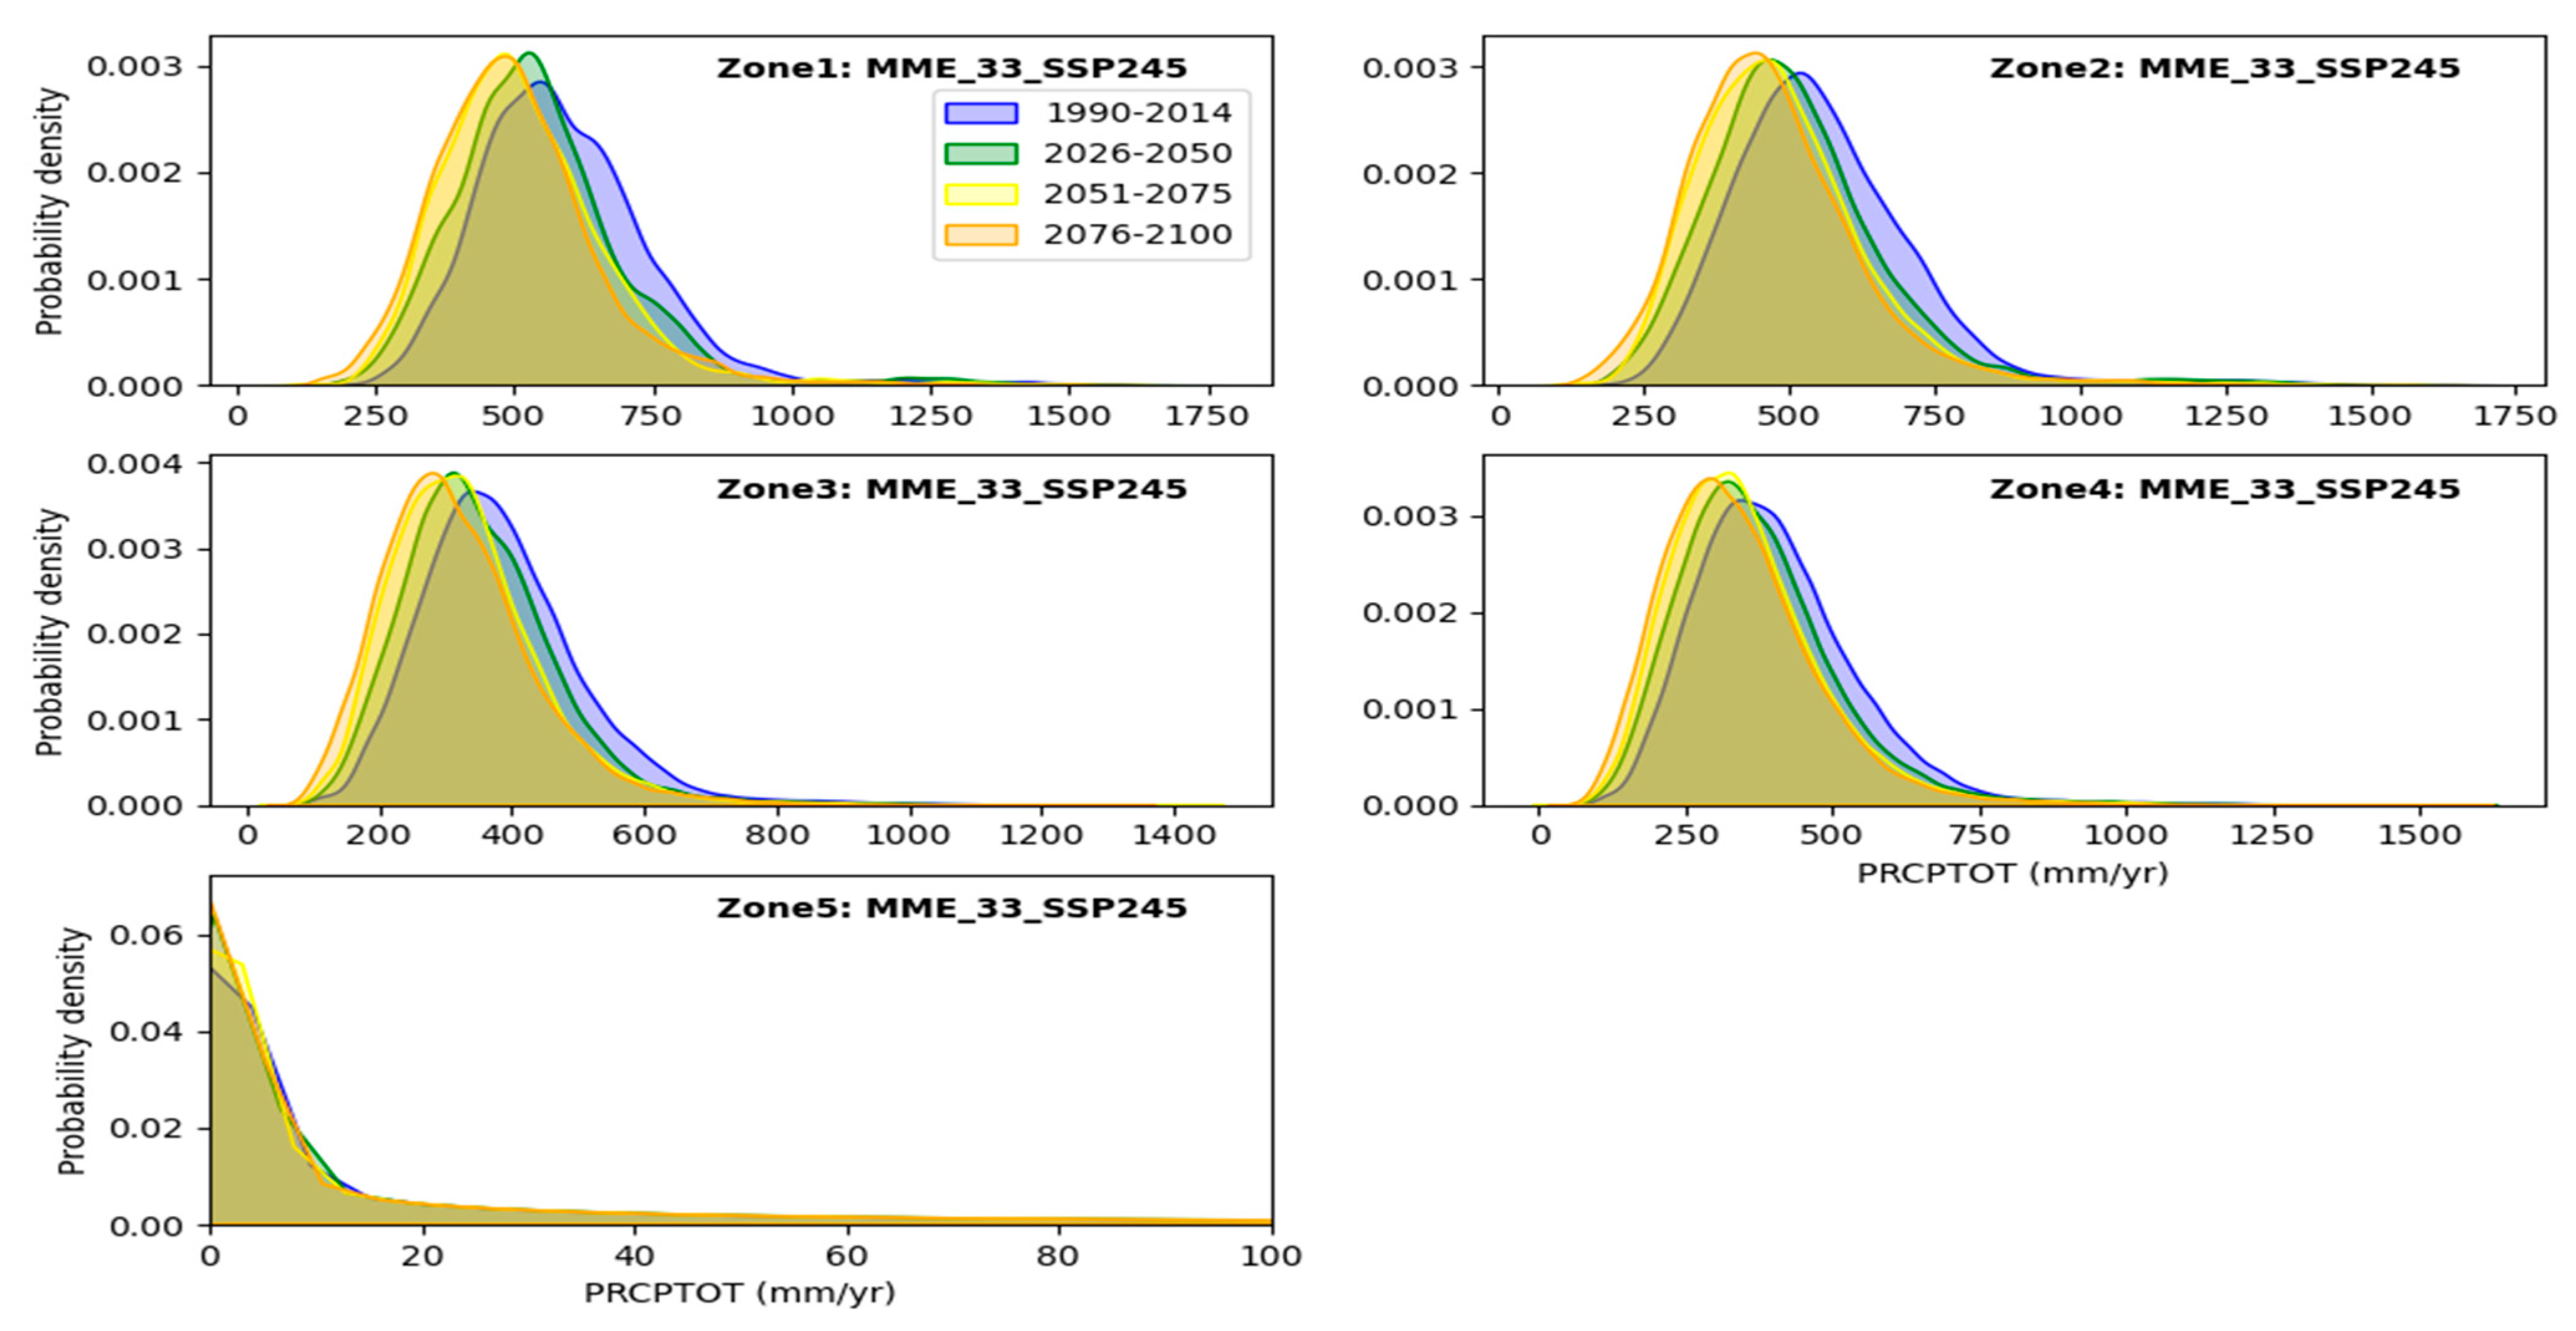
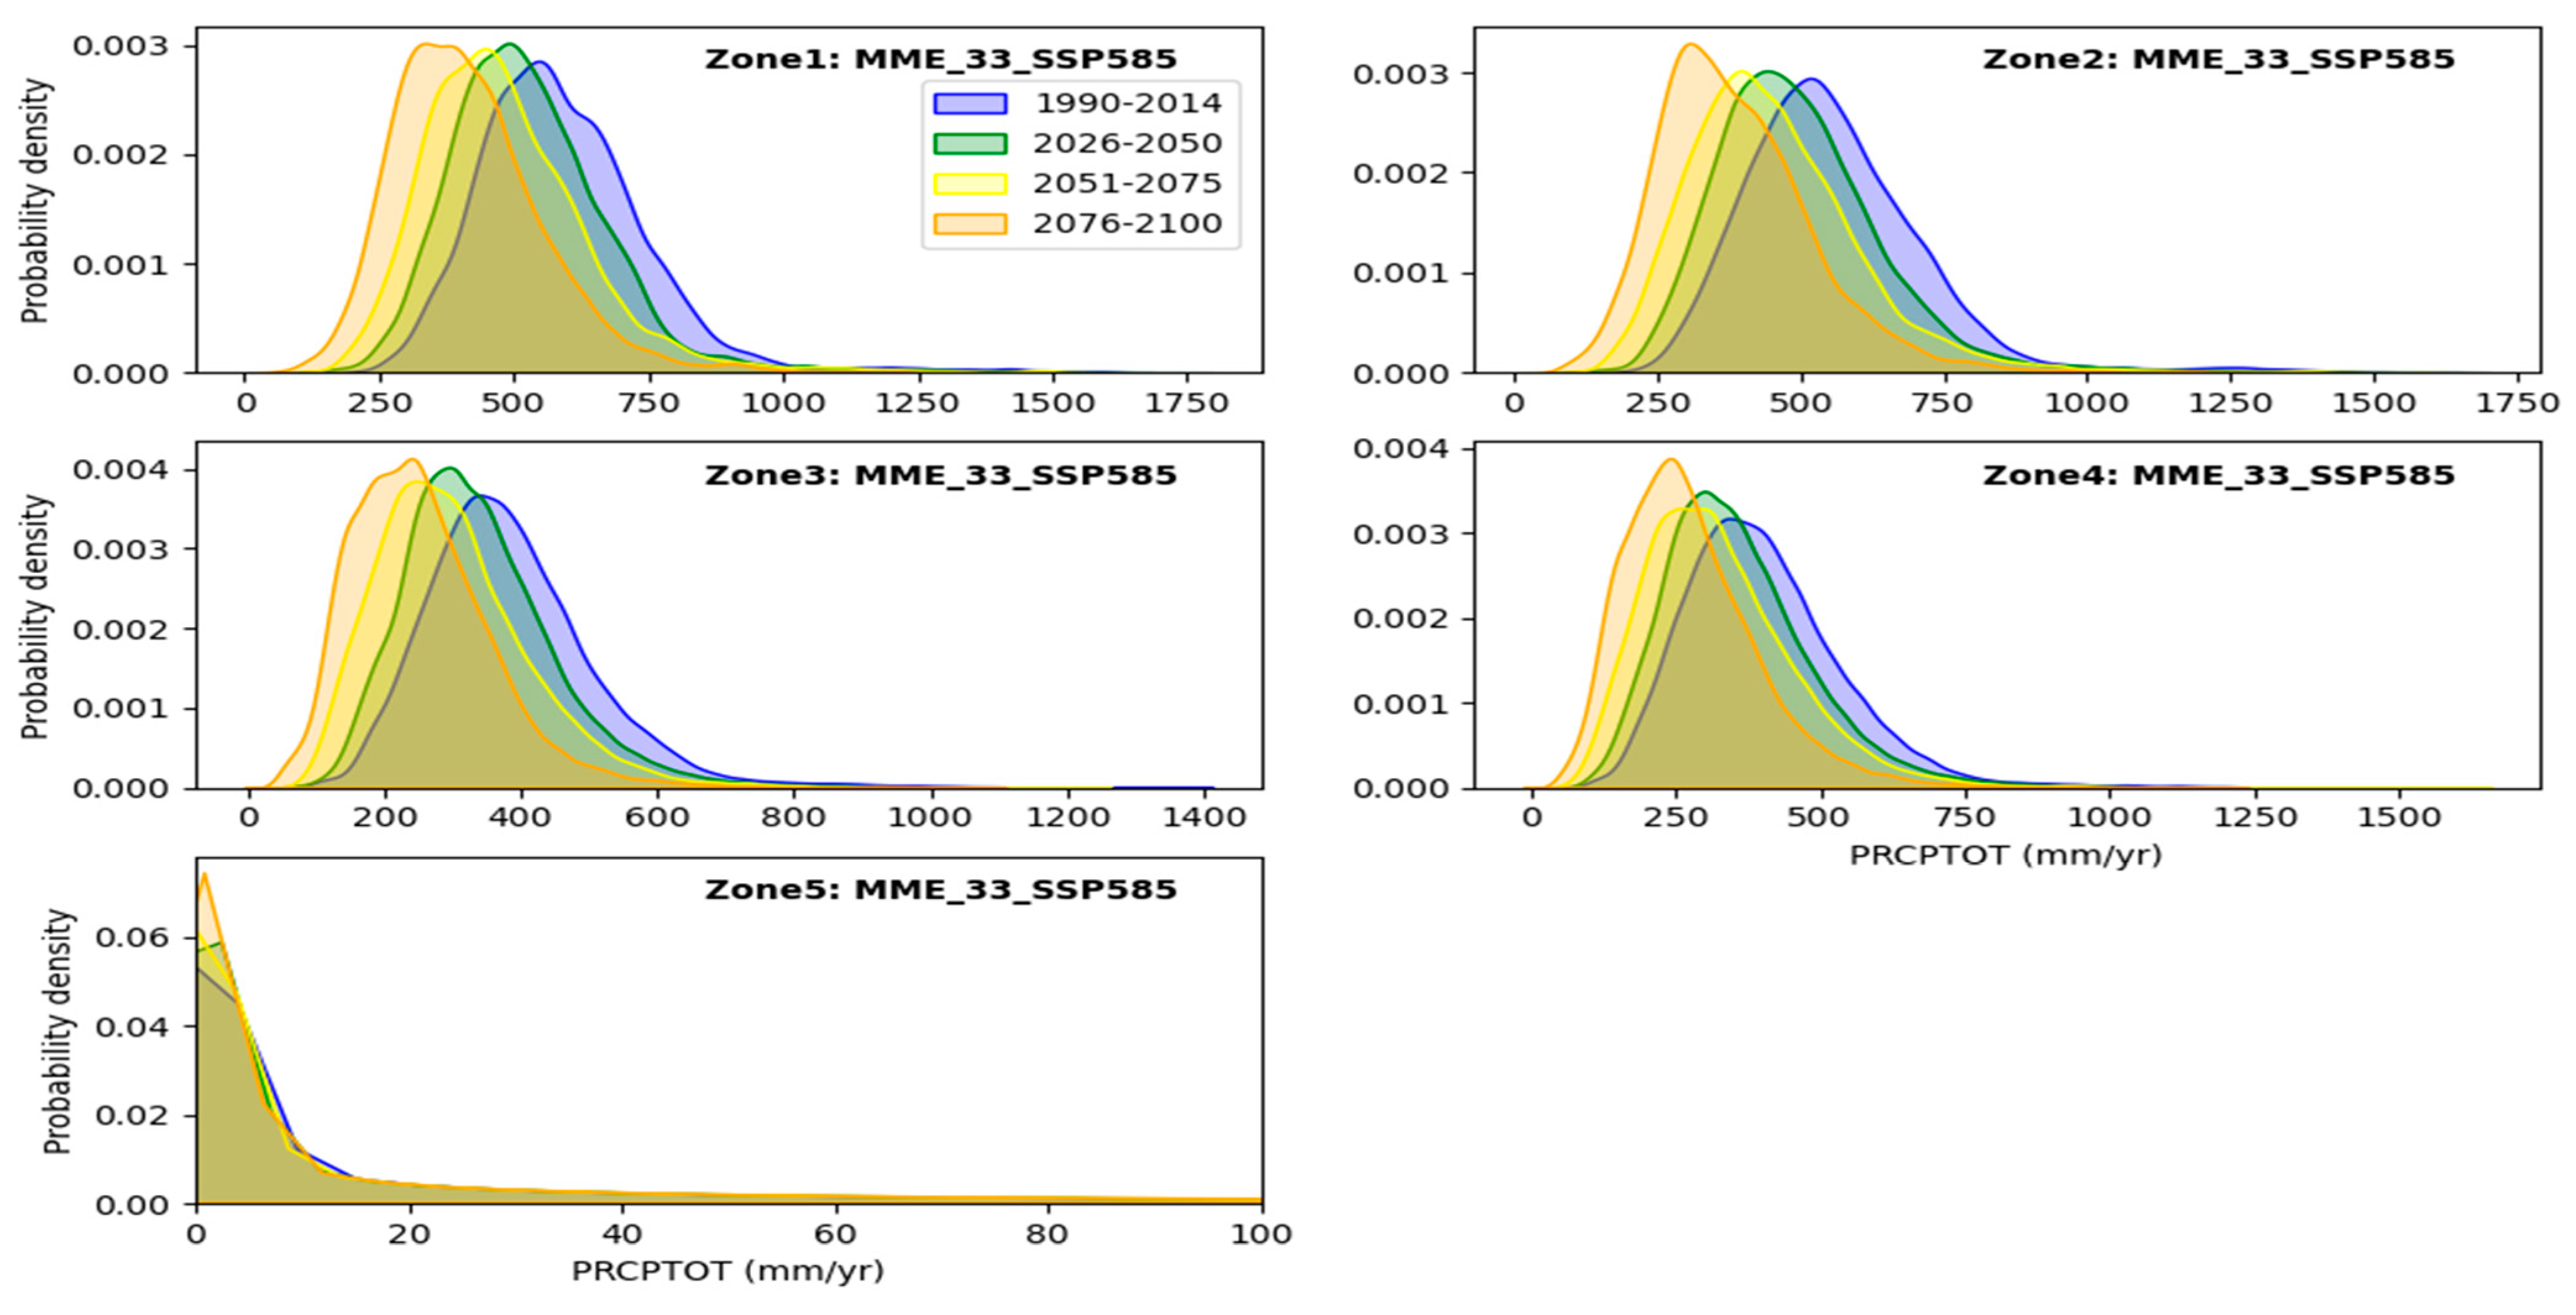
Figure 12.
Comparison of kernel density distributions (KDDs) of RX1day values for future periods according to SSP245 and SSP585 scenarios compared to the historical period using MME-33.
Figure 12.
Comparison of kernel density distributions (KDDs) of RX1day values for future periods according to SSP245 and SSP585 scenarios compared to the historical period using MME-33.
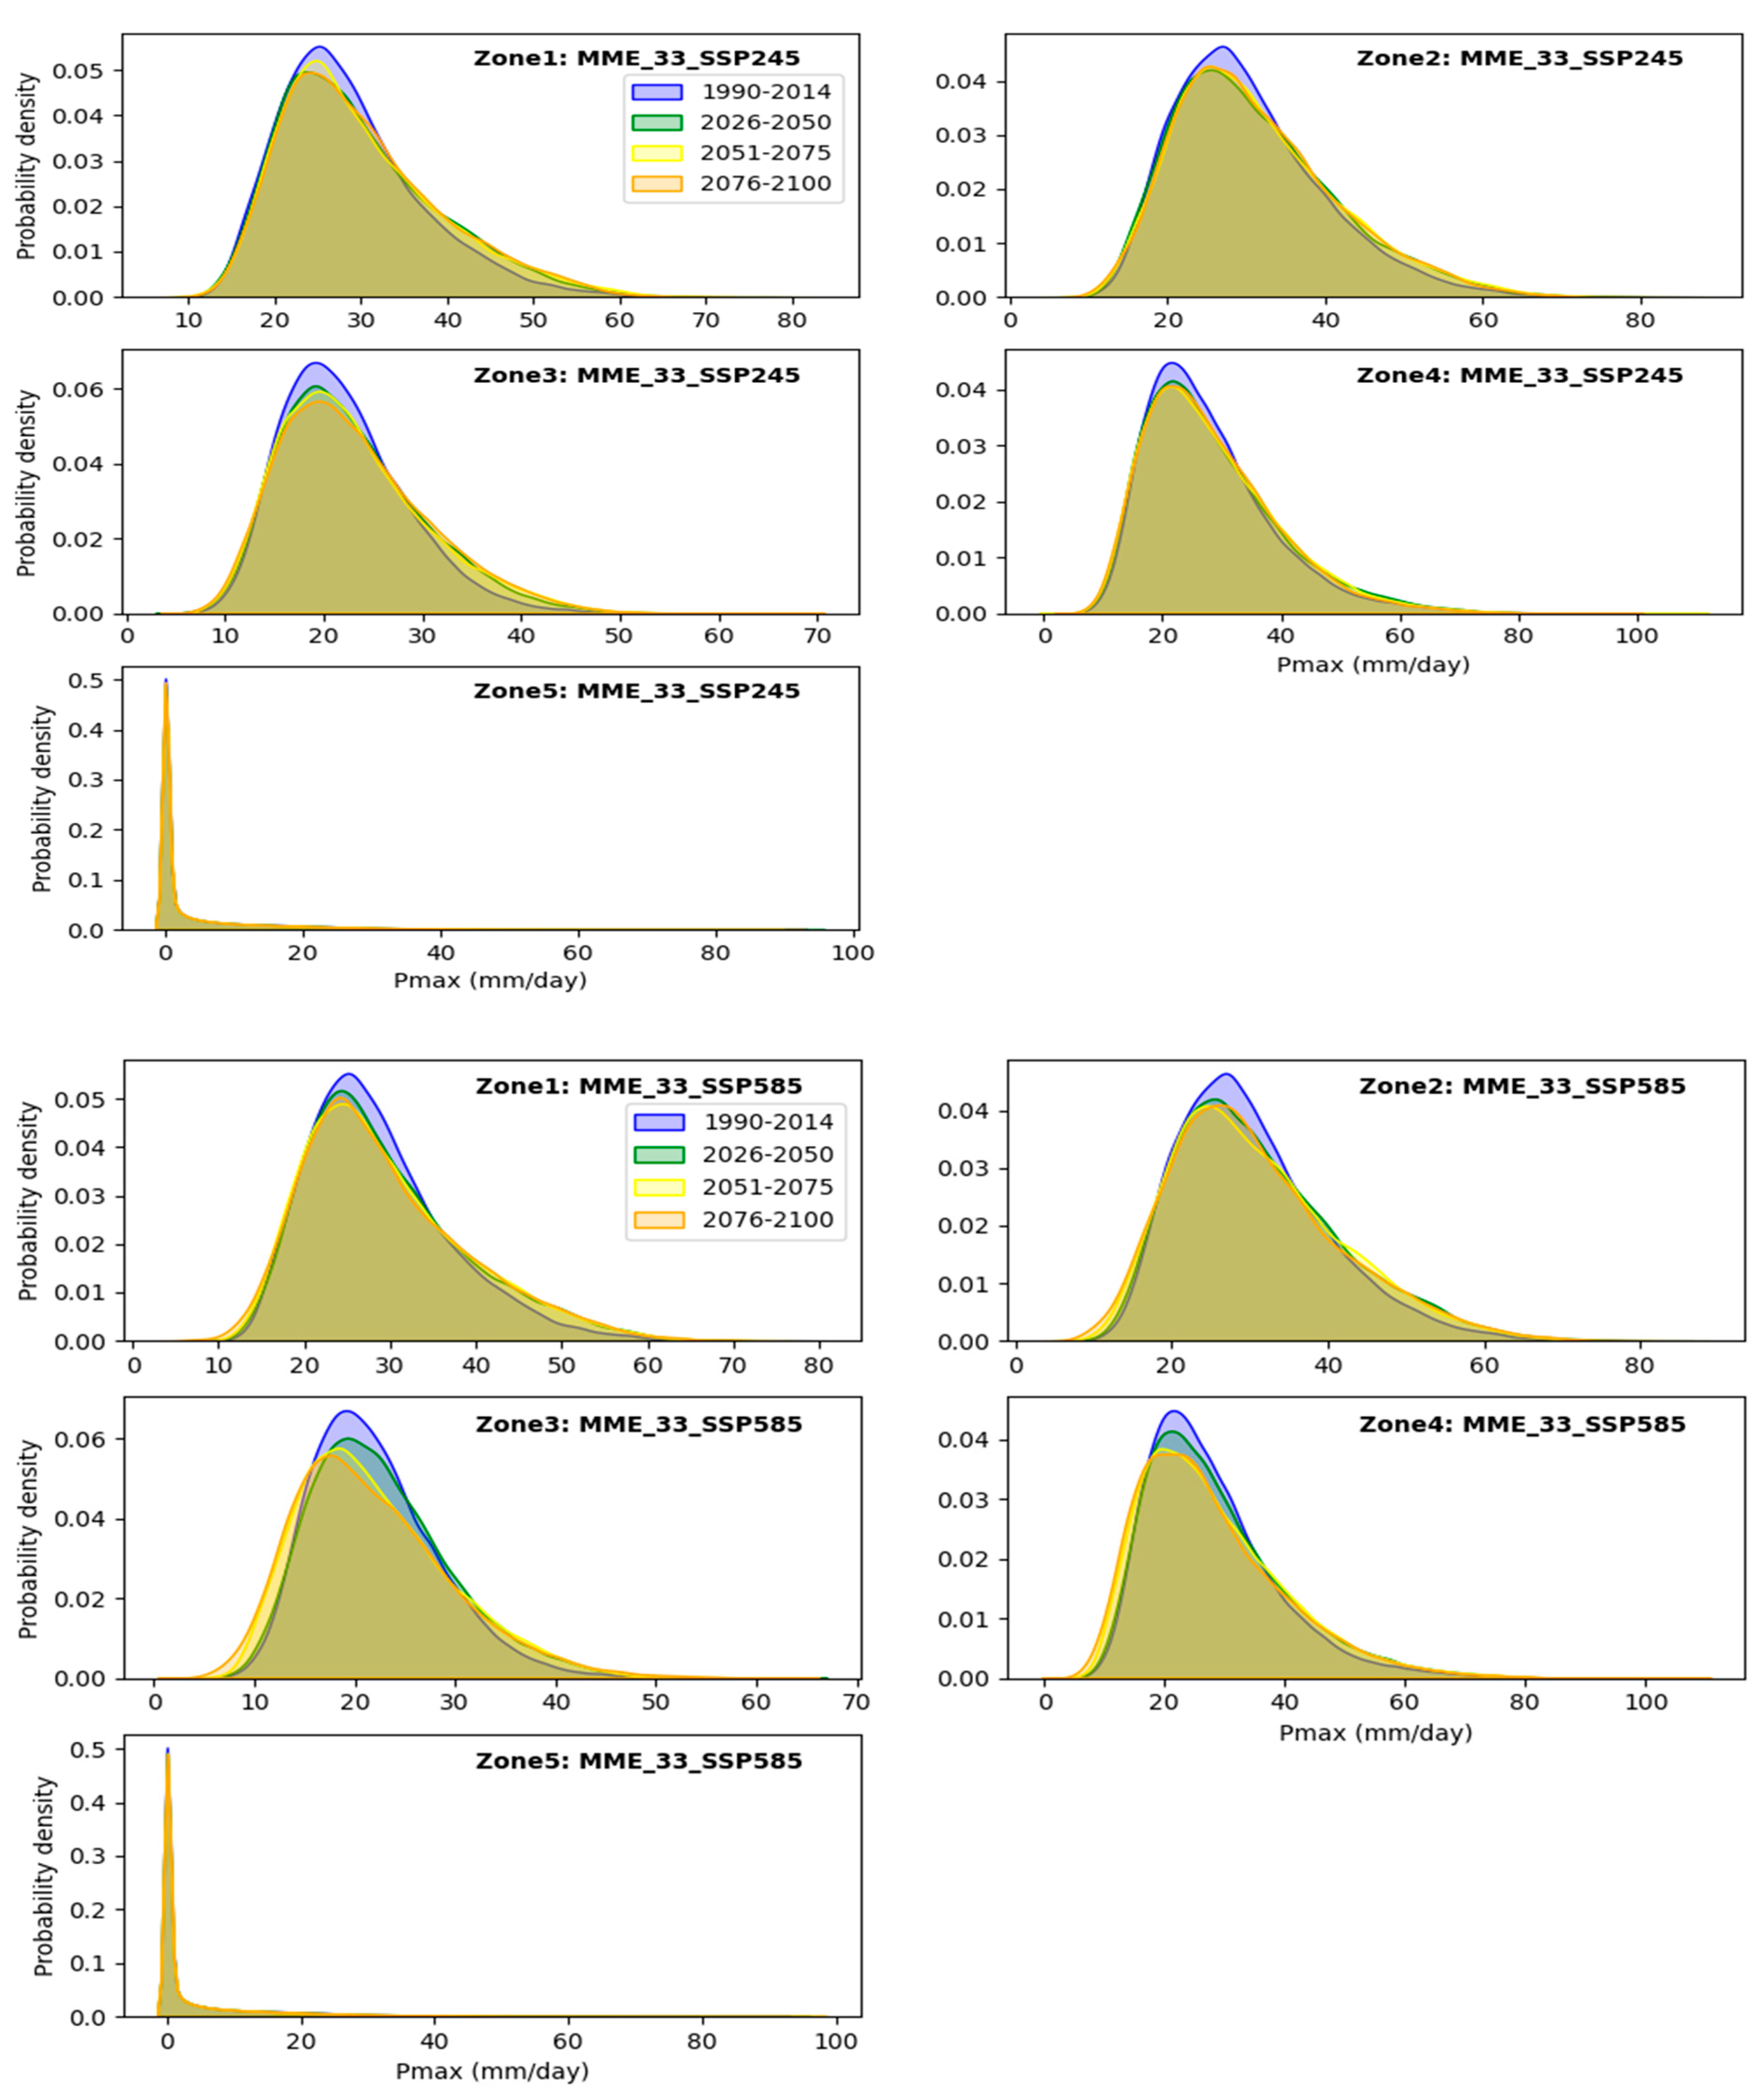
Figure 13.
Comparison of kernel density distributions (KDDs) of R99p values for future periods according to SSP245 and SSP585 scenarios compared to the historical period using MME-33.
Figure 13.
Comparison of kernel density distributions (KDDs) of R99p values for future periods according to SSP245 and SSP585 scenarios compared to the historical period using MME-33.

Figure 14.
Comparison of kernel density distributions (KDDs) of R20mm values for future periods according to SSP245 and SSP585 scenarios compared to the historical period using MME-33.
Figure 14.
Comparison of kernel density distributions (KDDs) of R20mm values for future periods according to SSP245 and SSP585 scenarios compared to the historical period using MME-33.
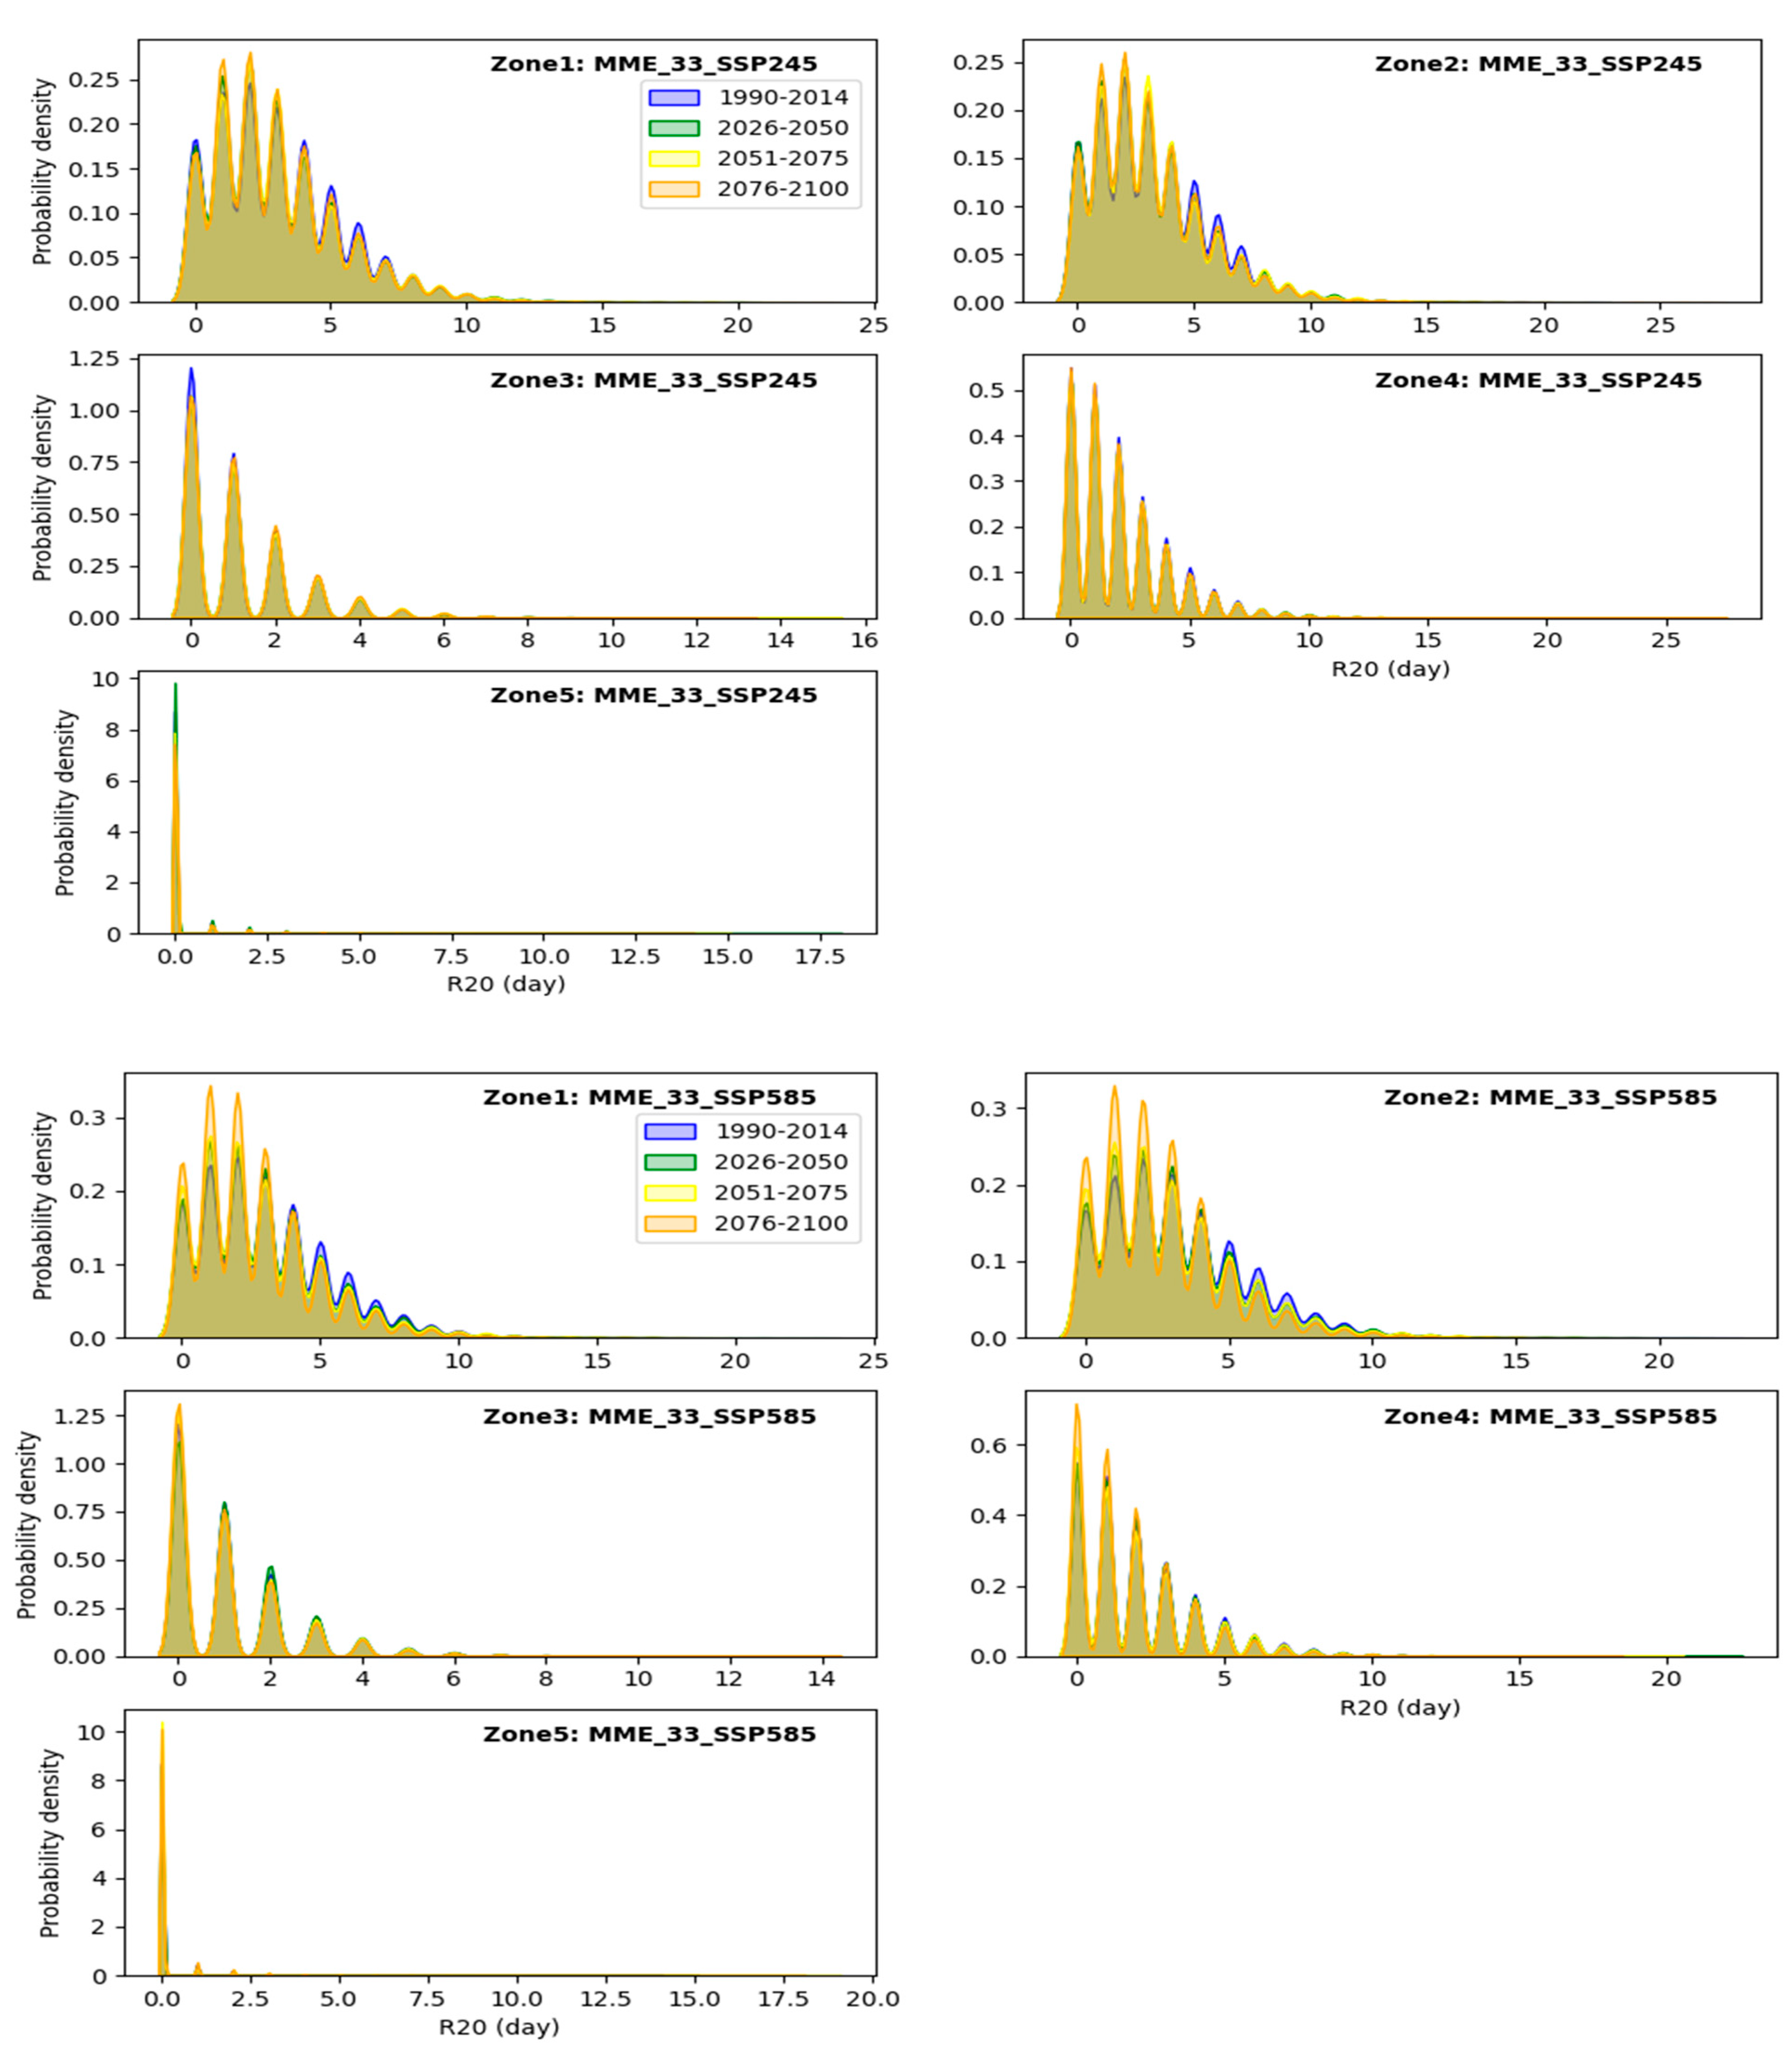

Table 1.
Extreme precipitation index.
| Index | Index Name | Definition | Units | |
|---|---|---|---|---|
| 01 | PRCPTOT | Wet-day precipitation | Annual total precipitation in wet days | mm |
| 02 | RX1day or Pmax | Maximum 1-day precipitation | Annual maximum 1-day precipitation | mm |
| 03 | R99p | Extremely wet-day precipitation | Annual total precipitation from days > 99th percentile | mm |
| 04 | R20mm | Number of heavy precipitation days | Annual number of days when daily precipitation ≥ 20 mm | days |
Disclaimer/Publisher’s Note: The statements, opinions and data contained in all publications are solely those of the individual author(s) and contributor(s) and not of MDPI and/or the editor(s). MDPI and/or the editor(s) disclaim responsibility for any injury to people or property resulting from any ideas, methods, instructions or products referred to in the content. |
© 2024 by the authors. Licensee MDPI, Basel, Switzerland. This article is an open access article distributed under the terms and conditions of the Creative Commons Attribution (CC BY) license (https://creativecommons.org/licenses/by/4.0/).
Share and Cite
MDPI and ACS Style
Hamitouche, Y.; Zeroual, A.; Meddi, M.; Assani, A.A.; Alkama, R.; Şen, Z.; Zhang, X. Projected Changes in Extreme Precipitation Patterns across Algerian Sub-Regions. Water 2024, 16, 1353. https://doi.org/10.3390/w16101353
AMA Style
Hamitouche Y, Zeroual A, Meddi M, Assani AA, Alkama R, Şen Z, Zhang X. Projected Changes in Extreme Precipitation Patterns across Algerian Sub-Regions. Water. 2024; 16(10):1353. https://doi.org/10.3390/w16101353
Chicago/Turabian StyleHamitouche, Yasmine, Ayoub Zeroual, Mohamed Meddi, Ali A. Assani, Ramdane Alkama, Zekâi Şen, and Xinhua Zhang. 2024. "Projected Changes in Extreme Precipitation Patterns across Algerian Sub-Regions" Water 16, no. 10: 1353. https://doi.org/10.3390/w16101353
Note that from the first issue of 2016, this journal uses article numbers instead of page numbers. See further details here.