Article

A Comprehensive Approach to Azo Dichlorotriazine Dye Treatment: Assessing the Impact of Physical, Chemical, and Biological Treatment Methods through Statistical Analysis of Experimental Data

1
Water Pollution and Research Department, National Research Centre, 33 Behooth St., Dokki, Giza P.O. Box 12622, Egypt
2
Basic Science Department, Canal Higher Institute of Engineering and Technology, Suez P.O. Box 11837, Egypt
3
Chemical Engineering Department, Canal Higher Institute of Engineering and Technology, Suez P.O. Box 11837, Egypt
4
Department of Engineering Mathematics and Physics, El-Shorouk Academy, Cairo P.O. Box 11835, Egypt
5
Department of Sanitary Engineering, Faculty of Civil and Environmental Engineering, Gdańsk University of Technology, 11/12 Narutowicza Street, 80-233 Gdańsk, Poland
*
Authors to whom correspondence should be addressed.
Water 2024, 16(10), 1327; https://doi.org/10.3390/w16101327
Submission received: 14 March 2024 / Revised: 29 April 2024 / Accepted: 3 May 2024 / Published: 7 May 2024
(This article belongs to the Special Issue Wastewater Treatment Technologies: Theory, Methods and Applications)

Abstract

:
This exploration investigates integrated treatment systems combining advanced oxidation processes (Fenton and photo-Fenton) with biological methods for the effective elimination of stubborn organic compounds in simulated textile wastewater composed of azo Dichlorotriazine dye. A comprehensive optimization of key process factors including catalyst dosage, hydrogen peroxide quantity, irradiation duration, etc. was systematically conducted for both Fenton and photo-Fenton processes to realize maximum COD and color removal. Under ideal conditions (0.4 g/L photocatalyst, 1 mL/L H2O2, and 75-Watt UV intensity for 60 min), the photo-Fenton process realized 80% COD elimination and complete decolorization, meeting industrial discharge limits without needing extra biological treatment. Statistical models correlating process parameters to treatment efficiency were developed, giving important design insights. For Fenton, effluent COD exceeded discharge thresholds, so a post-biological treatment using activated sludge was essential to comply with regulations. This integrated Fenton–biological scheme utilizes synergism between chemical and biological processes for enhanced overall treatment. Notable economic benefits were achieved by photo-Fenton over conventional UV-only and UV/H2O2 methods regarding energy consumption and operating costs. Overall, this pioneering work successfully proves integrated advanced oxidation–biological systems as a superior, sustainable alternative to traditional techniques for economically removing obstinate pollutants, such as azo Dichlorotriazine dye, as it is a simulated textile wastewater treatment used to satisfy environmental standards.

1. Introduction

Textile industries are among the greatest sources of wastewater, as a great quantity of water is utilized in coloration and finishing operations. Effluents’ emission from textile industries comprise biodegradable and non-biodegradable substances like dyes, dispersants, levelling agents, chromium, methanol, and so on [1,2,3,4]. These effluents are discharged into water bodies that can change the physical, chemical, and biological nature of the receiving water bodies, causing harm to humans and the environment [5]. For this reason, the wastewater treatment in efficient and harmless approaches, before discharging it into the environment or utilizing it for other intents so as to conserve human health and the environment, is crucial [6]. Recently, these methods used for the production of valuable products from wastewater have been mentioned in some studies [7].
There are several technologies utilized to treat industrial effluents inclusive of textile wastewater and even the solids that are produced from this industry as they harm the landfill [8]. Generally, these technologies are assorted into physical, chemical, and biological methods [9,10]. The most commonly utilized methods for textile wastewater treatment are adsorption process, advanced oxidation (AOP), electrochemical treatment, membrane filtration, and flocculation and coagulation [11]. An incorporation of two or more primary treatment technologies may also be applied. Physicochemical, bio-physical, and electro-chemical technologies are simple examples of an incorporation of the treatment techniques. Both physical and chemical techniques are regarded as the traditional techniques to treat textile wastewater that have their own constraints on an enormous band [12]. These techniques are unable to eliminate unconventional dyes and their organic metabolites. In addition, they form a large amount of sludge and by-product residues that require additional treatment and safe elimination from them. These methods are also characterized by elevated cost, depressed competence, and are very specified in nature [13].
The biological treatment of wastewater has some advantages such as being environmentally friendly, producing less sludge, and being inexpensive, so it is often the most cost-effective alternative compared to other treatment solutions [14,15]. However, the biological treatment systems are not efficacious in the treatment of industrial effluents when utilized independently because these effluents, especially textile effluent, usually contain toxic and/or refractory organic chemicals that are complicated to treat so, the biological treatment should be combined or using dual of biological stage [16]. Consequently, the incorporation of chemical, photochemical, and biological treatment processes has been suggested for these instances. The biological method is utilized as a pre-treatment to remove the biodegradable contaminates from the textile wastewater and a post-treatment using an advanced oxidation process (AOP) is utilized to transform non-biodegradable contaminates into biodegradable materials that can be disposed of by biological methods as notified by Basha et al. [17]. The incorporation of one or more chemical methods with other techniques such as biological methods rely on the contaminate type present in the wastewater, output goodness, and the technique cost.
Numerous studies have been developed and have elucidated the efficacy of the incorporation of chemical/photochemical with biological treatment methods. These comprise pre-treatment of anaerobic flow-through sludge followed by H2O2/UV or ozonation systems or activated sludge treatment or attached growth systems (bio filters) followed by advanced oxidation processes (suspended or fixed film heterogeneous photo catalysis, Fenton’s reagent, O3 and H2O2 coupled with UV, etc.). One of the most inspected integrations are the consecutive photo-Fenton as well as activated sludge treatment processes, where even visual lighting can enhance the photochemical oxidation of organic matters [18]. Accordingly, textile wastewater, which include Refractory Organic Compounds (ROCs), can be treated with high efficiency by photo-Fenton followed by biological treatment [19]. Fenton is an efficient advanced treatment process. The hydroxyl radical (OH) is formed from the reaction between hydrated Fe+2 and hydrogen peroxide (H2O2), which degrade the refractory and toxic organic contaminates present in wastewater [16]. There are many advantages of the Fenton process, such as high performance, inexpensive reagents, H2O2 can decompose into environmentally harmless sorts such as H2O and O2, and it is conducted at ambient temperature and atmospheric pressure for the organic oxidation [20].
A lot of examinations have been performed to decolorize dyes using Fenton oxidation, but photo-Fenton, which is also a newly emerged advanced oxidation process, has also been applied to the treatment of dye materials [21]. The adding of the UV radiation to the Fenton process may be an attention-provoking element of the dye elimination owing to its ability to impact the direct formation of OH radicals, which increases the processing efficiency [22,23]. The formation of OH radical in the photo-Fenton process is similar to that in the Fenton process in addition to irradiation (UV), which leads to the reduction in Fe3+ to Fe2+ as revealed below [24]:
Fe3+ + H2O + hv → Fe2+ + HO + H+
Fe3+ + H2O2 + hv → Fe2+ + HO2 + H+
Therefore, a larger production of OH radicals by UV light is expected in the photo-Fenton process, which leads to the degradation of more organic matter in a shorter time [24,25,26].
H2O2 + hv → 2HO
The photo-Fenton process has many advantages, such as reducing the catalyst dose and H2O2 dose in Fenton, reducing the iron sludge formation efficiently compared to the Fenton process, and UV radiation rises H2O2 utilization [20].
The target of this exploration is to establish an integrated treatment unit that combines advanced methods such as Fenton and photo-Fenton with a traditional method, which is biological treatment, to treat azo Dichlorotriazine dye, which contains refractor organic compounds, so that these compounds are disposed of and the treated water reaches the required environmental specifications. For Fenton and photo-Fenton processes, the impact of processing conditions such as catalyst dose and hydrogen peroxide amount on the color removal percent and the COD removal percent, and the COD/BOD5 ratio was inspected. Moreover, an economical study and statistical study for this integration of the treatments has been provided.
Some of the key contributions that have been completed in the current study include:
  • This examination exhibits the integration of advanced oxidation processes (Fenton and photo-Fenton) with biological treatment for the effective removal of recalcitrant organic compounds from textile industry wastewater. The integrated schemes provide a novel, efficient, and economical solution for treating toxic textile effluents;
  • A comprehensive optimization of critical process parameters like catalyst dose, H2O2 amount, irradiation time etc. was carried out for both Fenton and photo-Fenton processes to achieve maximum COD and color removal;
  • The development of statistical regression models correlating the process factors to treatment efficiency, providing important design guidelines;
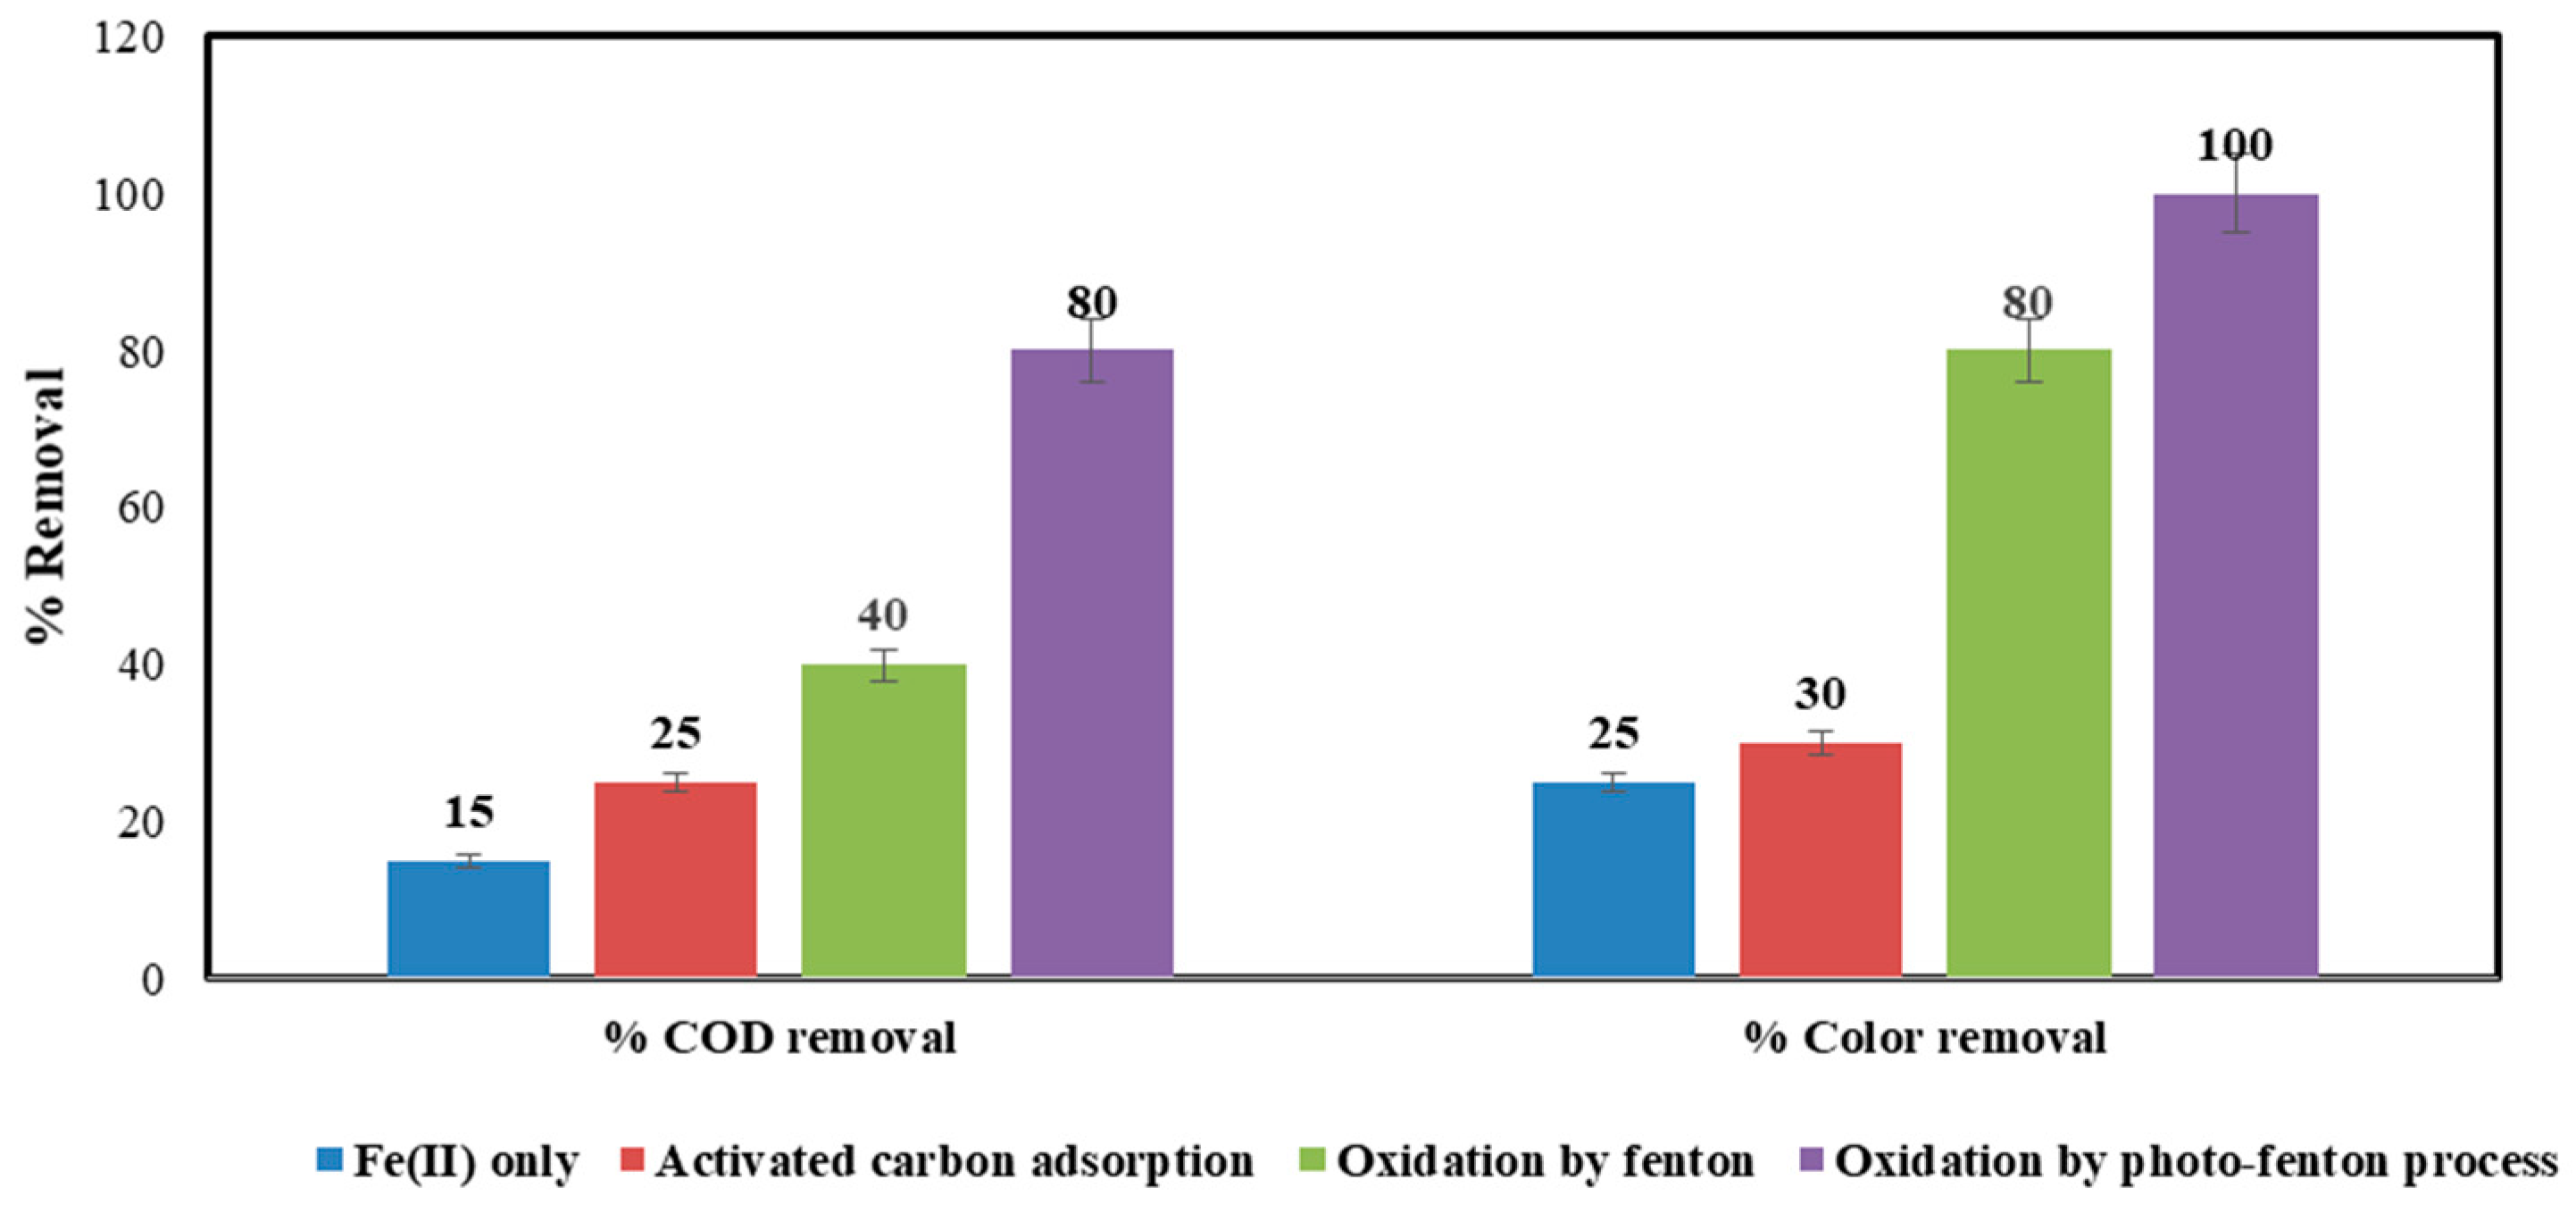
  • Photo-Fenton realized 80% COD removal and complete decolorization of the dye, enabling direct discharge without needing an additional biological treatment step. This makes it an economical and sustainable solution;
  • For Fenton, the effluent COD exceeded discharge limits, so a post-biological treatment was required to finally comply with regulations. The Fenton–biological integrated scheme provides a novel treatment approach exploiting synergism between chemical and biological processes;
  • A techno-economic analysis revealed photo-Fenton to be more economical than UV-only and UV/H2O2 treatment in terms of energy consumption and operating costs;
  • Overall, the study successfully demonstrates integrated AOP–biological schemes as a superior and sustainable alternative to conventional methods for removing recalcitrant compounds from textile wastewater (simulated azo dye) in an economical manner.

2. Materials and Methods

2.1. Raw Materials

Raw materials utilized in our test such as dye from a type of azo Dichloratriazine dye, FeSO4·7H2O, were purchased from Merck Company (Darmstadt, Germany), H2O2 (30% purity), NaOH (48% purity), and H2SO4 (98% purity) from Pure Egypt Company El-Mottahda company (Fayoum, Egypt) but the activated sludge utilized is mainly extra sludge reaped from the large-scale activated sludge treatment plant located in Greater Cairo.

2.2. Experimental Systems

Figure 1 exhibits an integrated unit designed representing the process setup to achieve the purpose of this research. It consists of a feed plastic tank made of polyethylene (PET) with a capacity of 19 L, a height of 40 cm, a filter containing green sand with a grain size ranging from 0.5 mm to 1 mm, and a granule-activated carbon with 830/1240 mesh size, as well as a chemical reactor made of plexiglass with a capacity of 24 L, which has a wooden cover, 2 lamps each of 75 watts, and a type of UVA-UVB (280–400 nm) with a motor of 14 watts, and a stainless-steel mixer at 30 rpm. It also contains 3 tubes and 2 super booster pumps. The first tube is used to transfer dye solution from the feeding tank to the filter made of polyvinyl chloride (PVC) with a length of 168 cm and a diameter of 6 mm, the second tube is used to transfer dye solution from a filter to a chemical reactor made of polyvinyl chloride (PVC) with a length of 111cm and a diameter of 6 mm, and the third tube is used to transfer wastewater from the chemical reactor to the biological reactor made of polyvinyl chloride (PVC) with a length of 1 m and a diameter of 14 mm. The first super booster pump is used to transfer dye solution from a filter to a chemical reactor with a capacity of 75 gallon per day (GPD), flow rate of 1.6 L/min, and a power supper to reduce voltage from 220 to 24 v, and the second pump is used to transfer wastewater from the chemical reactor to the biological reactor with flow rate of 1100 L/h and power of 15 watts. It also contains a cylinder tank made of plexiglass with capacity of 16 L, an air pump (compressors) of 4-watt power and 240 L/h flow rate, and air flow through a pipe with a diameter of 4 mm and a length of 0.5 m.

2.3. Experimental Run

The feeding tank is filled up to 12 L with distilled water, then 9 gm of dye is added. The color of the wastewater was a dark blue with a COD value of 4200 ppm, and a BOD value of 630 ppm with pH 8.2.

2.4. Physical Treatment

After preparing the dyed simulated wastewater, a filter containing green sand and activated carbon is used to remove color and odor from the contaminated water. This step is most effective if the real wastewater is used in future studies.

2.5. Chemical Treatment

2.5.1. Fenton and Photo-Fenton Process

The pH of the dye solution is set to 3.0 by adding H2SO4 and this value is verified by a pH meter. In this work, the impact of pH on the process efficiency was not exhibited but pH 3.0 is selected according to the previous literature [24,27,28]. These studies stated that the maximum color and COD removal percent was accomplished at pH 3.0. Then, 0.6 gm/L of catalyst dose and 1.5 mL/L of H2O2 are simultaneously added to the wastewater sample and the stopwatch is triggered from the beginning of its placement in the contaminated water contained in the chemical reactor. A sample (50 mL) was drawn every 5 min, over a 20-min period, to measure the color elimination percent. A small drop of NaOH is placed in the sample to stop the reaction. A sample is drawn every 15 min within an hour, to measure the COD removal percent. A small drop of NaOH is placed to stop the reaction. A series of runs are conducted with the diverse catalyst dose as 0.2 gm/L, 0.4 gm/L, and 0.8 gm/L and the diverse amount of H2O2 as 0.5 mL/L, 1 mL/L, and 2 mL/L. The experiments were conducted at 25 °C. Regarding the photo-Fenton process, the same procedure that was performed in the Fenton technique has been completed, and UV radiation was also conducted.

2.5.2. Biological Treatment

Pre-Biological Preparations

Fenton is stopped by raising the pH of wastewater sample to 11. After that, the suspended dye residues and iron particles were eliminated from water treated with the Fenton process by gravity sedimentation for 3 to 4 h. Then, water free from dye residues and iron particles was placed in a tank for ventilation for a day to ensure that there were no H2O2 particles available to turn into H2O and O2, and finally, the pH of the water was reduced to 7.5, so that the water sample was suitable for biological treatment. The equivalent of 5 L of activated sludge was taken and placed in an aeration tank for approximately 8 h as preparation. After 8 h, the activated sludge was ready for biological water treatment.

Biological Treatment Procedure

Only one liter of water treated with the Fenton process is placed in a biological reactor (aerobic type) for two hours, then it is passed through a sedimentation tank and a sample is taken for COD measurement to ensure that the activated sludge is compatible with the water to be treated. This process is repeated more than once (approximately 3 times), and samples are taken for analysis to ensure that the water reaches the required specifications. In all cases, pH was measured before and after treatment by pH-meter type Schott Greate CG820. The Chemical Oxygen Demand (COD), and color removal in the influent and effluent were determined by a spectrophotometer; the Direct Reading; Dr/2000; Hach, and the reactor with model HI839800 Reactor; Hanna instruments—USA. The biochemical or biological Oxygen Demand (BOD) in the influent and effluent were determined by a BOD determination, Model BD 600; Lovibond type—UK, and the BOD incubator, which takes 5 days in incubation.

3. Result and Discussion
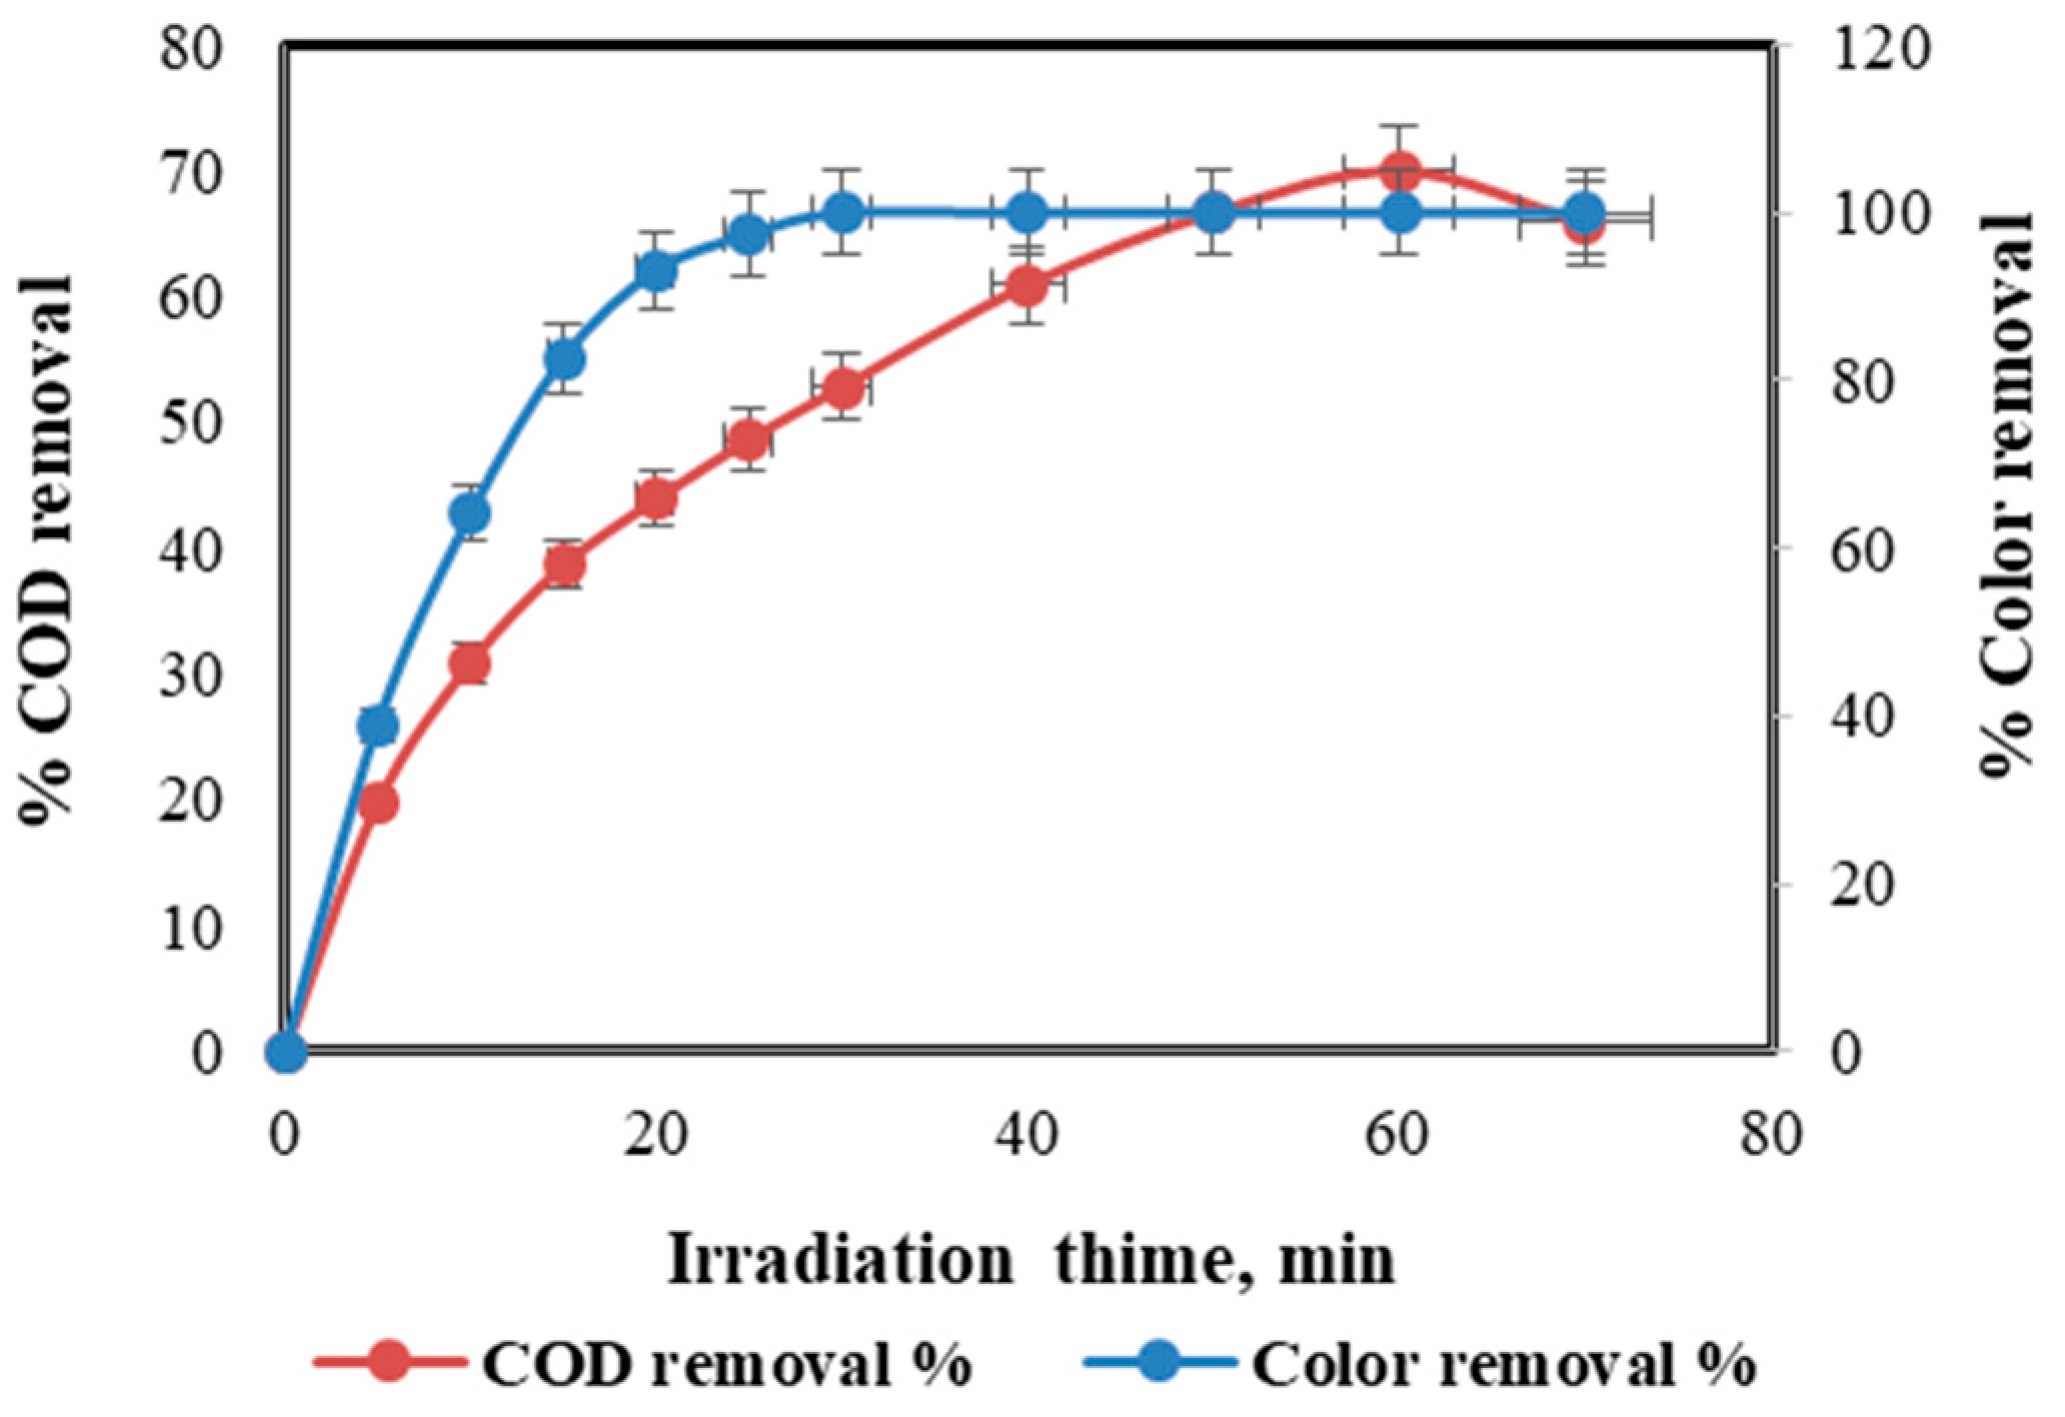
3.1. Fenton Process

The impact of numerous operating factors such as catalyst dose (0.2–0.8 gm/L), hydrogen peroxide amount (0.5–2 mL//L), irradiation time (5–60 min), and wastewater flow rate (20–80 mL/min) on the COD removal percent, color removal percent, and BOD5/COD ratio was inspected.

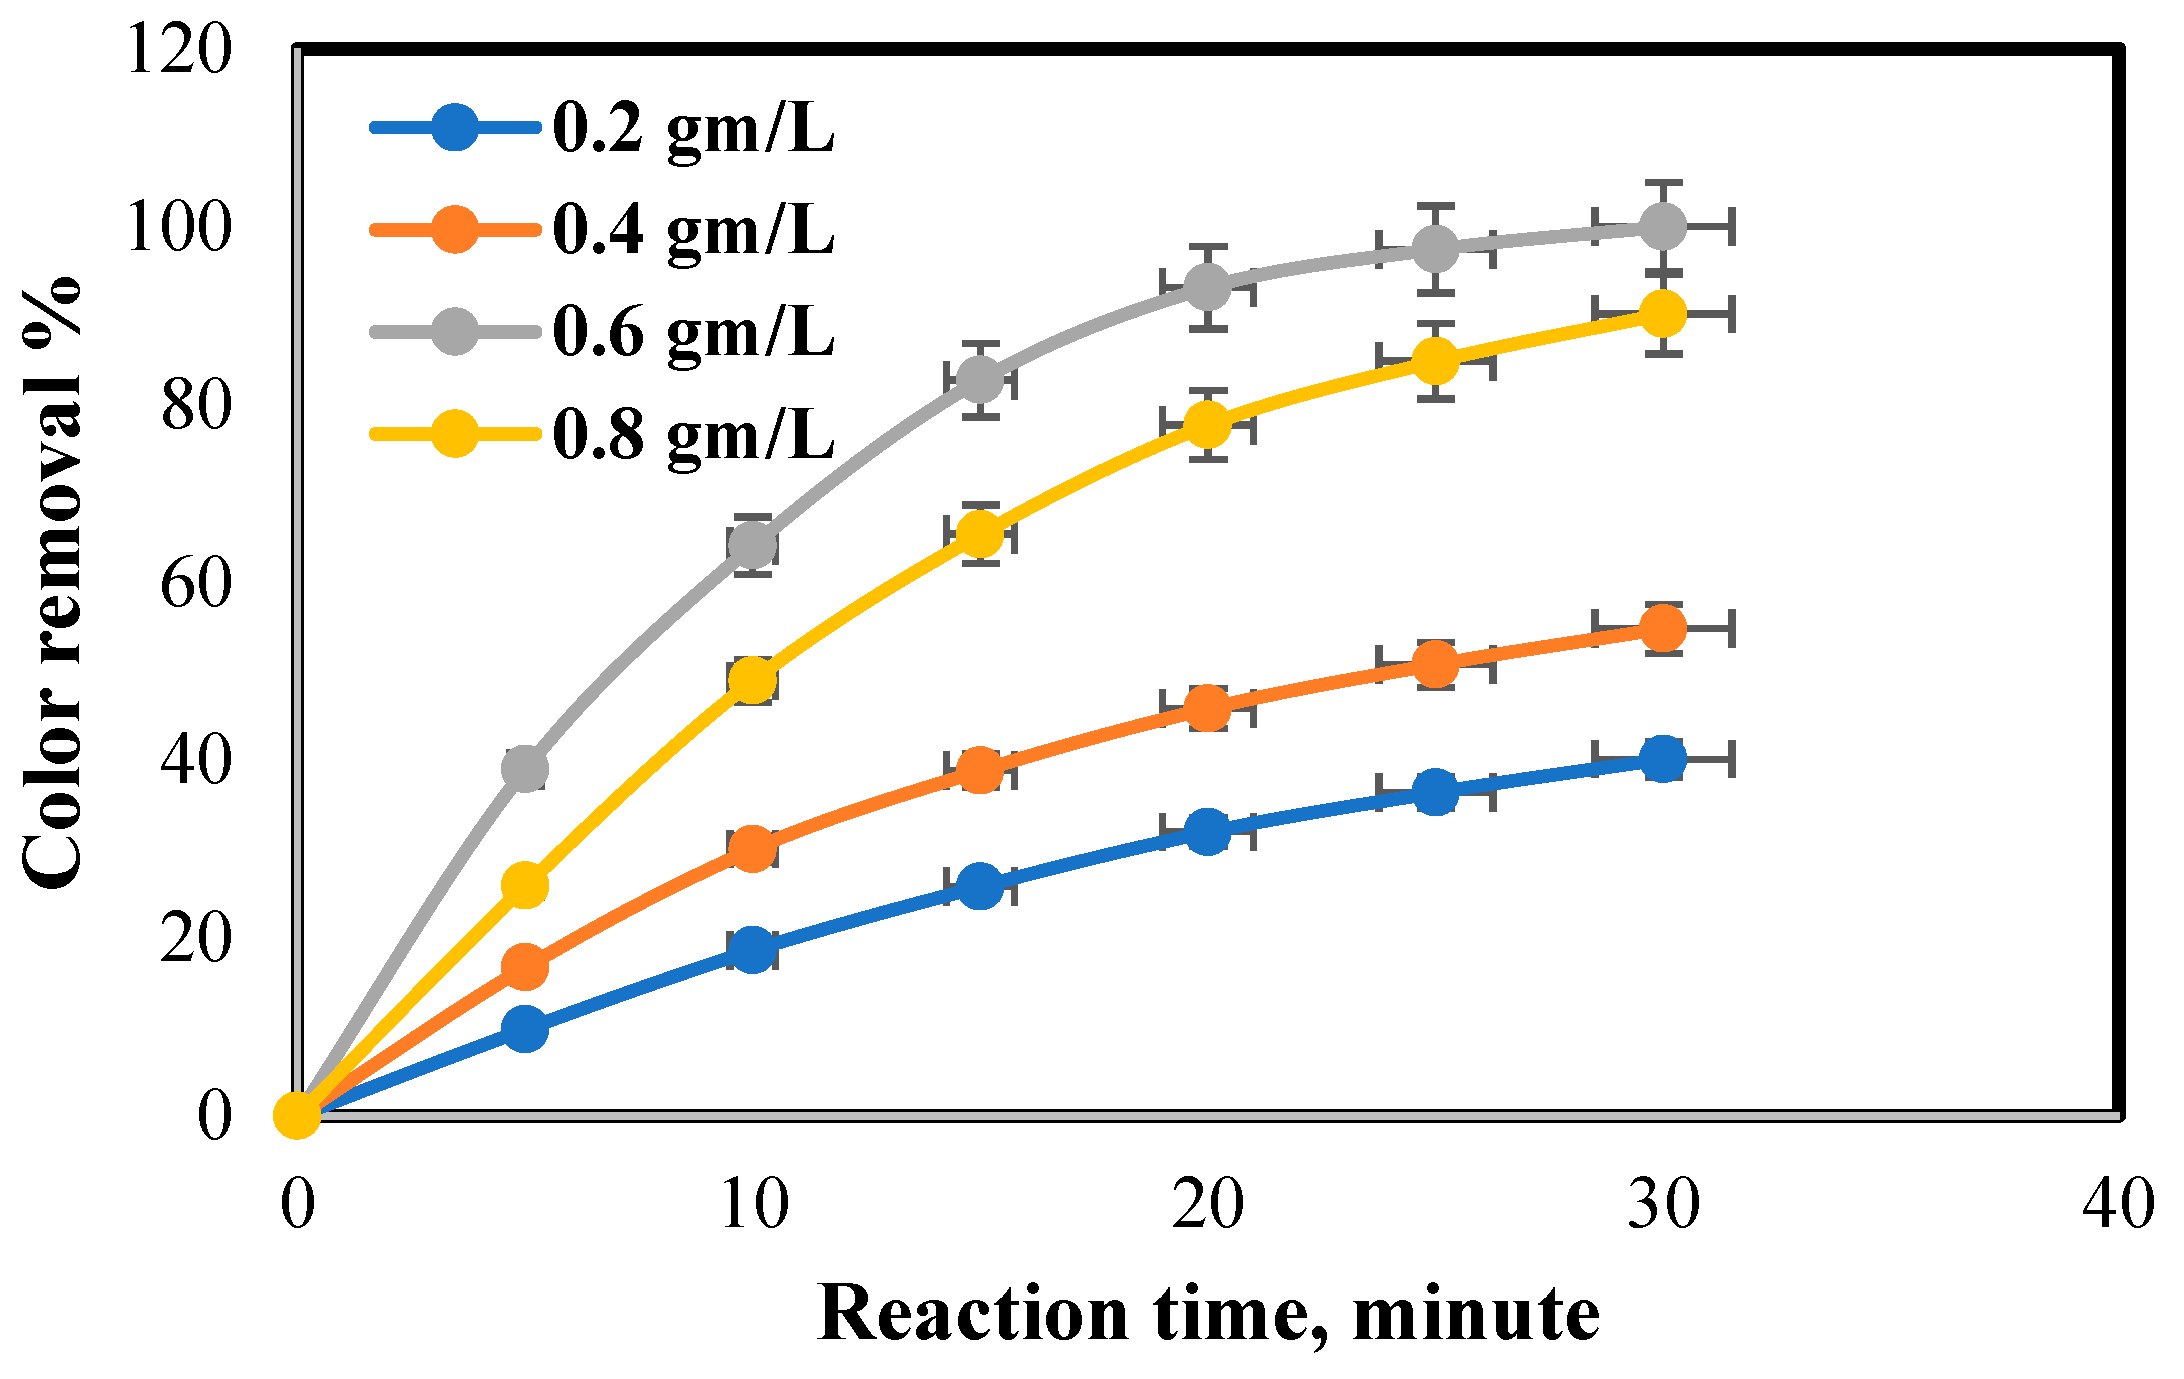
Effect of Irradiation Time and Catalyst Dose on COD and Color Removal Percent

To investigate the optimal time for the Fenton process and its impact on the removal of COD and color, a series of experiments were conducted for durations ranging from 10 to 60 min. Figure 2 demonstrates that the highest removal percentages were achieved after 30 min for dye removal (100%) and 60 min for COD removal (70%). The percentage of COD removal initially increased as time increased from 10 to 60 min, but then began to decrease due to the formation of intermediate compounds that reacted with hydroxyl radicals, ultimately reducing performance and eliminating hydroxyl [29,30].
One of the most important factors that have an effect on COD and color removal percent is catalyst dose. Figure S1 depicts the impact of catalyst dose on the COD removal percent and the BOD5/COD ratio. The set of runs was accomplished at 3 pH, 60 min reaction time, 1.5 mL/L of H2O2, 0.75 gm/L of initial dye concentration, and 20 mL/min flow rate to reveal the impact of catalyst dose on the COD removal percent. As exhibited in Figure 3, the best COD removal efficacy was 70% when the catalyst dose was 0.6 gm/L, which is the ideal dose of catalyst in 60 min, reducing COD from 4200 ppm to 1260 ppm. Whereas, after 0.6 gm/L of catalyst dose, the COD removal efficacy reduced owing to the excess of ferrous ions in the system resulting in a decrease in mineralization yield. Probable formation of Futile intermediate iron (IV) species (ferryl iron FeO2+) could be the reason for this negative behavior [31], resulting in a potential side reaction that interferes with the hydroxyl radical formation necessary for the oxidation of organic matter as revealed in Equations (4)–(6) [32].
H2O2 + Fe (II) → FeO2+ + H2O
FeO2+ + Fe (II) + H+ → Fe(OH)2+ + Fe (III)
Fe(OH)2+ + H+ → Fe (II) + H2O
The catalyst dose also impacts decolorization as exhibited by the results signified in Figure 3. The maximum color removal percent is 100% at 0.6 gm/L of catalyst dose in 30 min. Also, after 0.6 gm/L, the color removal efficiency reduced for the same reason mentioned above.

3.2. Effect of Hydrogen Peroxide Amount on COD and Color Removal Percent

The utilization of H2O2 is fundamental, but an excess of it backfires. The addition of H2O2, as a means of controlling the OH radical concentration, is the farthest significant operating factor in the Fenton process, which influences both the outcome of reaction and the cost of process [26]. For that reason, a few trials have been devoted to identifying conditions that enhance the process performance by adding an appropriate amount of H2O2. Figure S2 elucidates the impact of H2O2 amount on the COD removal percent and the BOD5/COD ratio.
The impact of H2O2 amount on the COD removal percent was determined at various H2O2 amounts (0.5 to 2 mL/L) via saving reaction time, pH, catalyst dose, wastewater flow rate, and initial dye concentration at the values 60 min, 3, 0.6 gm/L, and 20 mL/min, and 0.75 mg/L, respectively. The outcomes indicate that a raise in H2O2 amount from 0.5 to 1.5 mL/L raises the COD removal percent from 40% to 70%. These results also evidenced that the increase in H2O2 amount to more than 1.5 mL/L caused a decrease in the COD removal percent, owing to the spontaneous decomposition of H2O2 to oxygen and water and recombination of OH radicals [23,31,33,34,35] as elucidated in Equations (7) and (8):
2H2O2 → H2O + O2
OH + H2O2 → HO2 + H2O
Excess amounts of H2O2 will react with OH competing with organic pollutants and consequently reducing the COD removal efficacy, and H2O2 itself contributes to the scavenging ability of OH radicals [23,32,36].
The amount of hydrogen peroxide also has an impact on color removal % as clarified in Figure 4. The outcomes elucidate that the color removal percent rose from 46.39% to 100% with raising the H2O2 amount from 0.5 mL/L to 1.5 mL/L at 30 min. After 1.5 mL/L of H2O2 approximately 2 mL/L, the color removal % tends to drop to 89.17% for 30 min owing to the fact that an excess amount of H2O2 will react with OH competing with organic pollutants, consequently reducing the efficiency of color removal. Based on this, 1.5 mL/L of H2O2 is selected as the ideal value. In general, the COD and color elimination rate raises as the H2O2 amount raises until a certain value; after this value, the elimination may drop or not raise significantly [33,36]. This is consistent with the fact that an excessive amount of H2O2 in the solution will slightly delay the degradation and elimination of dyes [36].

3.3. Effect of Flow Rate of Wastewater on COD and Color Removal Percent

To assess the dye removal competence, the flow rate of the dye solution varied from 20 to 80 mL/min, which represents a pilot-scale process. The effect of the flow rate on the color removal at pH = 3, catalyst dose = 0.6 gm/L, H2O2 = 1.5 mL/L, reaction time = 30 min, and initial dye concentration = 0.75 gm/L is elucidated in Figure S3. The highest color removal of 100% was achieved at a flow rate of 20 mL/min. Results also demonstrated that increasing the flow rate from 20 to 80 mL/min resulted in a decrease in color removal percent, indicating an inverse relationship between flow rate and color removal competence. The decrease in COD removal percentage with an increase in flow rate can be attributed to the shorter degradation time of the contaminated solution. This results in a lower production of free radicals, which are necessary for COD removal.
The impact of the flow rate on the COD removal was also inspected under the following conditions: pH = 3, catalyst dose = 0.6 gm/L, H2O2 = 1.5 mL/L, reaction time = 60 min, and initial dye concentration = 0.75 gm/L. As exhibited in Figure S4, the COD removal percent decreased with an increase in the wastewater flow rate. The maximum COD removal percent of 70% was achieved at a flow rate of 20 mL/min.

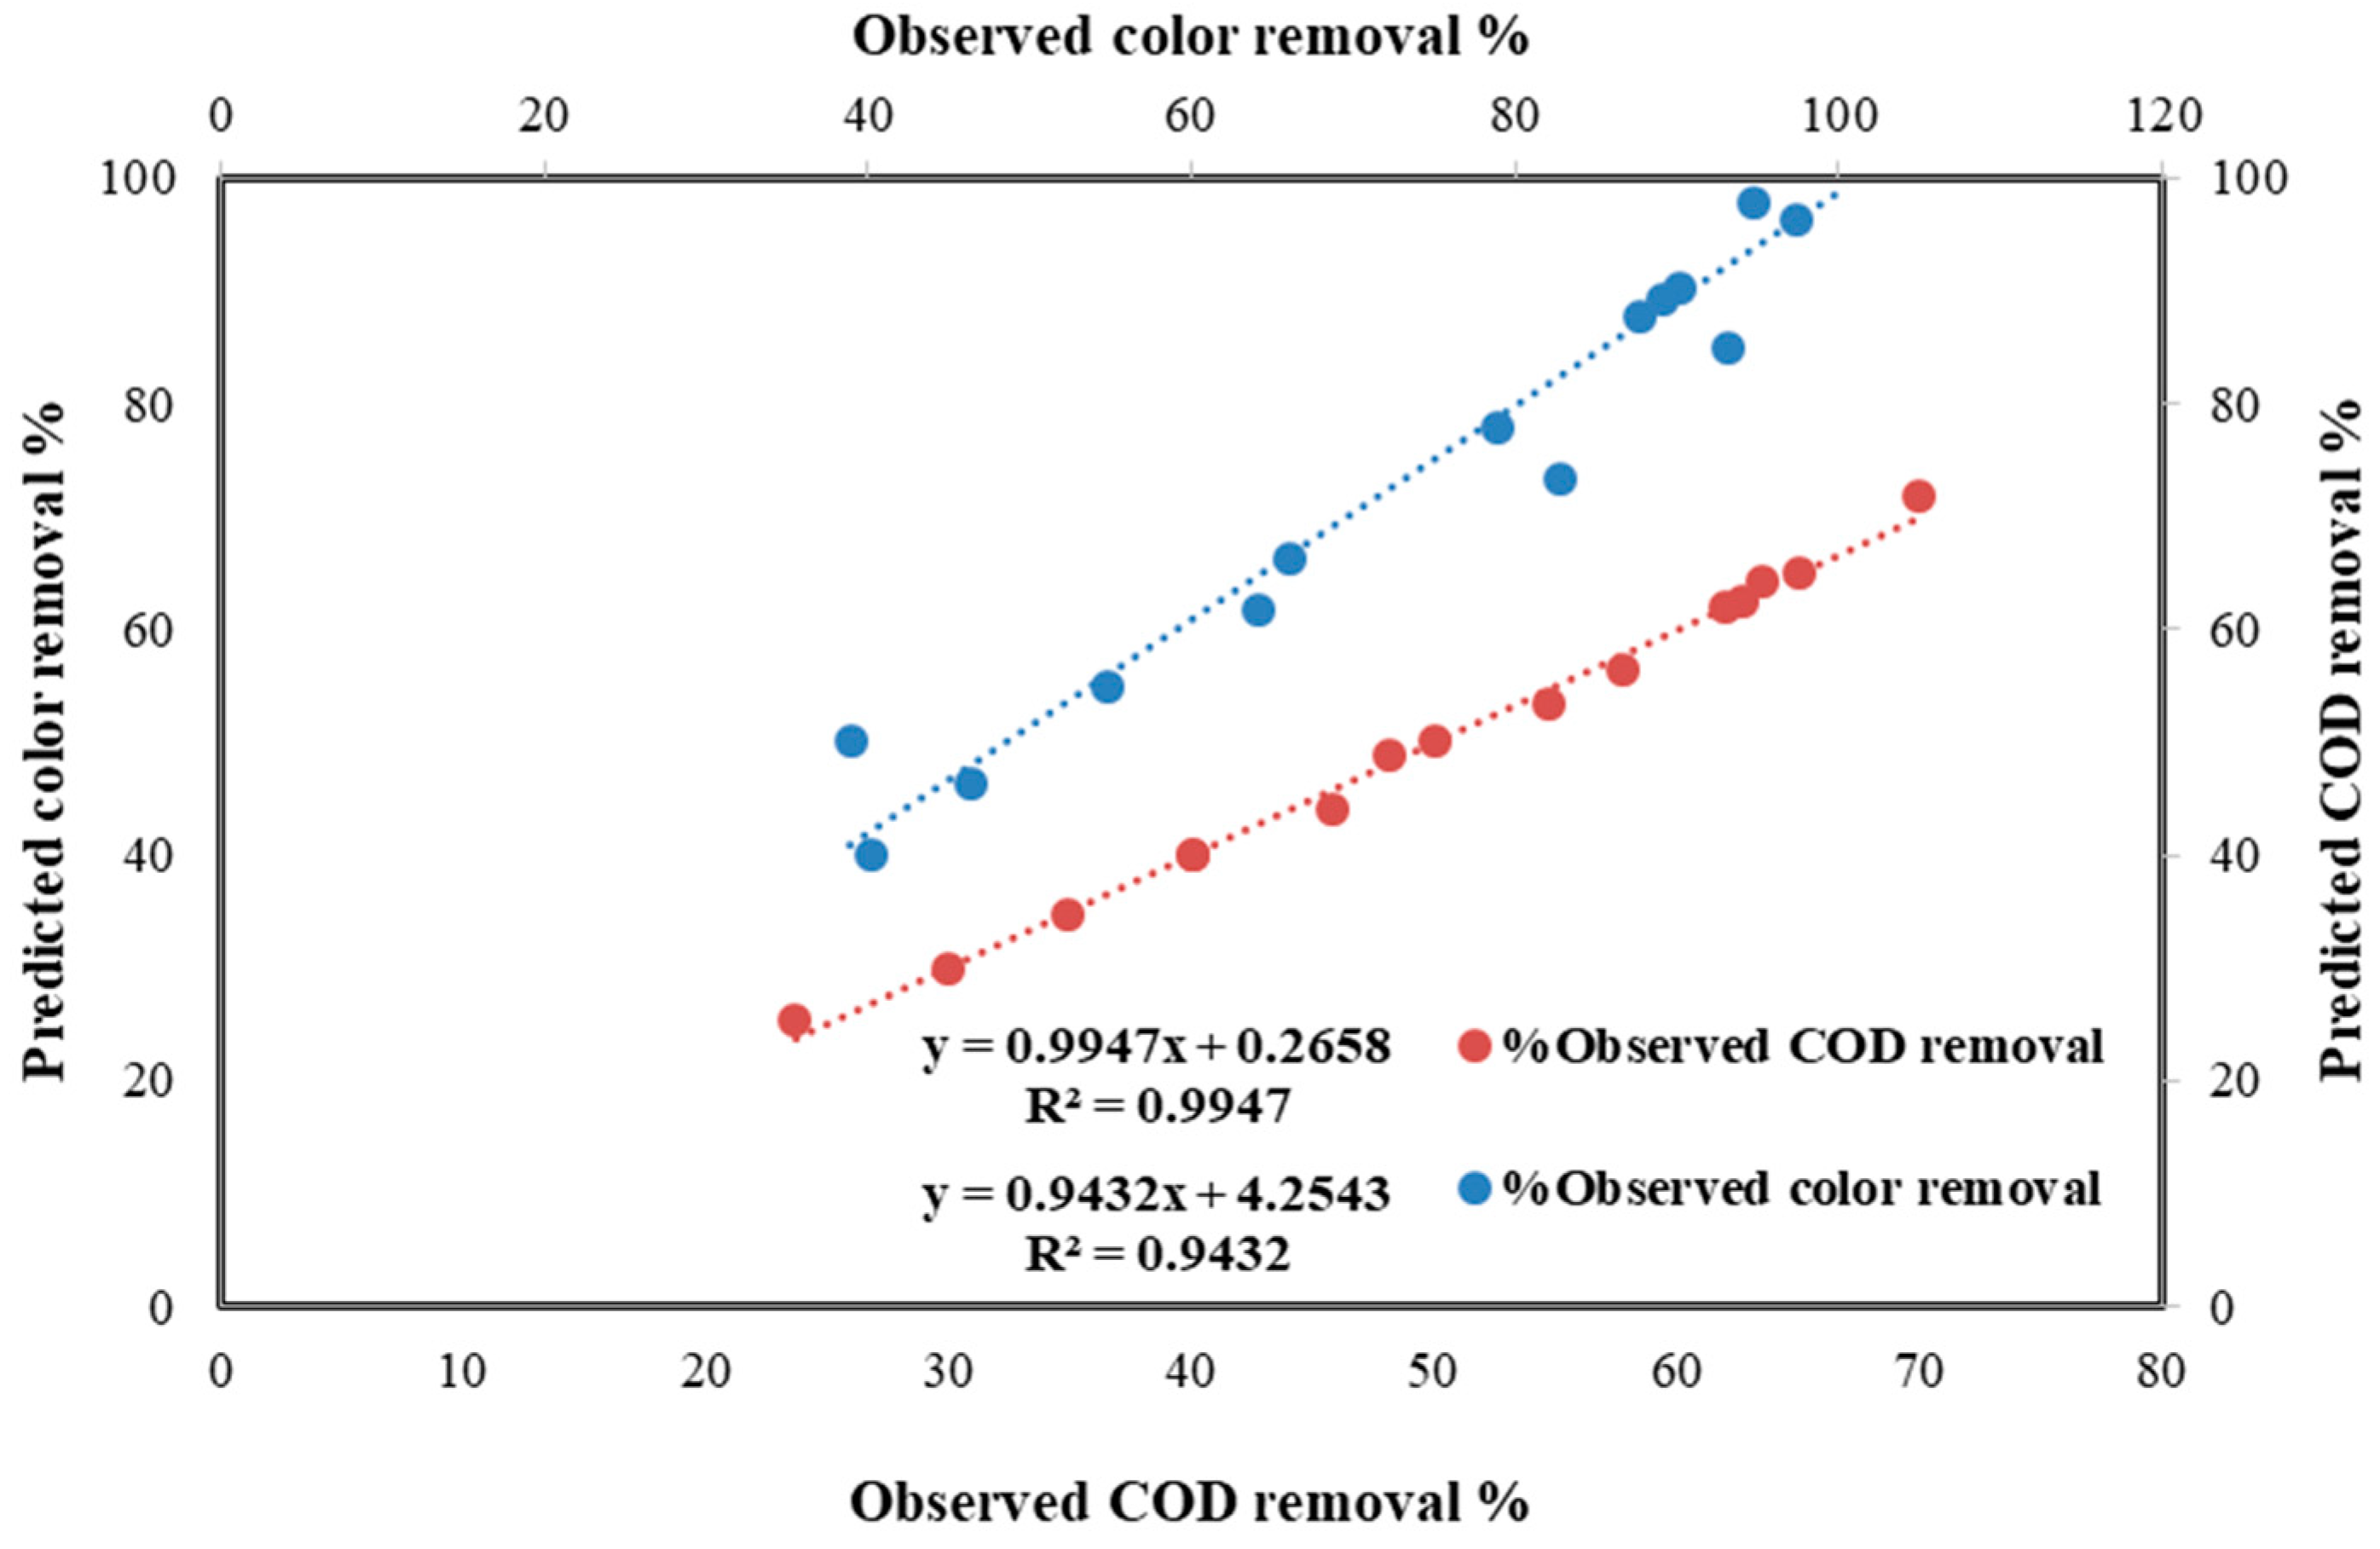
3.4. Statistic Study for Fenton the Process

The outcomes above indicate that COD and color removal % is non-linearly affected by various processing factors, including the catalyst dose (mg/L), H2O2 amount (mL/L), irradiation time (min), and flow rate (mL/min). To clarify the correlation between these processing factors and COD and color removal %, a statistical and least squares multivariate regression technique was employed. The resulting mathematical models are presented below:
% COD removal → 67.57 − 163.26 A − 693.98 B − 0.38 C + 0.93 D + 184.92 A2 + 1855.77 B2 − 53.79 A3 − 1319.6 B3
where: A, B, C, and D are the H2O2 amount (mL/L), catalyst dose (mg/L), wastewater flow rate (mL/min), and irradiation time (min), respectively. The regression coefficient R2 of the resulting correlation was 99.47%.
Table S1 exhibits the data for ANOVA, while Table S2 includes the values, p-values, standard error, and t-test for all coefficients. Any p-value less than 0.05 indicates that the correlation term is significant.
% Color removal → 137.36 − 329.79 A − 1217.34 B − 0.5 C + 2.31 D + 374.75 A2 + 3214.47 B2 − 110.2 A3 − 2278.19 B3
The regression coefficient R2 of the resulting correlation was 94.32%. The data for ANOVA are elucidated in Table S3, while Table S4 comprises the values, p-values, standard error, and t-test for all coefficients. Any p-value less than 0.05 signifies a significant correlation term. Figure 5 compares the experimentally determined COD and color removal % with the expected values for the Fenton process.

3.5. Fenton Followed by Biological Treatment

The Fenton process fulfilled 70% of COD elimination percent under ideal conditions of 1.5 mL/L of H2O2, catalyst dose 0.6 gm/L, 20 mL/min flow rate, and 60 min of reaction time, reducing COD from 4200 ppm to 1260 ppm, and BOD5 from 630 ppm to 378 ppm with recording the BOD5/COD ratio of 0.3. Even so, the COD value still does not match the environmental specifications for drainage in industrial areas because it is more than 1100 ppm, so a biological treatment using activated sludge for 2 h should be applied to treat one liter of the sample. The results indicate a decrease in COD from 1260 ppm to 504 ppm (60% COD removal percent); therefore, the treated water has become in conformity with the environmental specifications for discharge in industrial areas.

4. Photo-Fenton Process

The impact of numerous operating factors such as catalyst dose (0.2–0.8 gm/L), hydrogen peroxide amount (0.5–2 mL/L), irradiation time (5–60 min), wastewater flow rate (20–80 mL/min), and UV irradiation intensity (25–75 watts) on the COD removal percent, color removal percent, and BOD5/COD ratio was inspected.

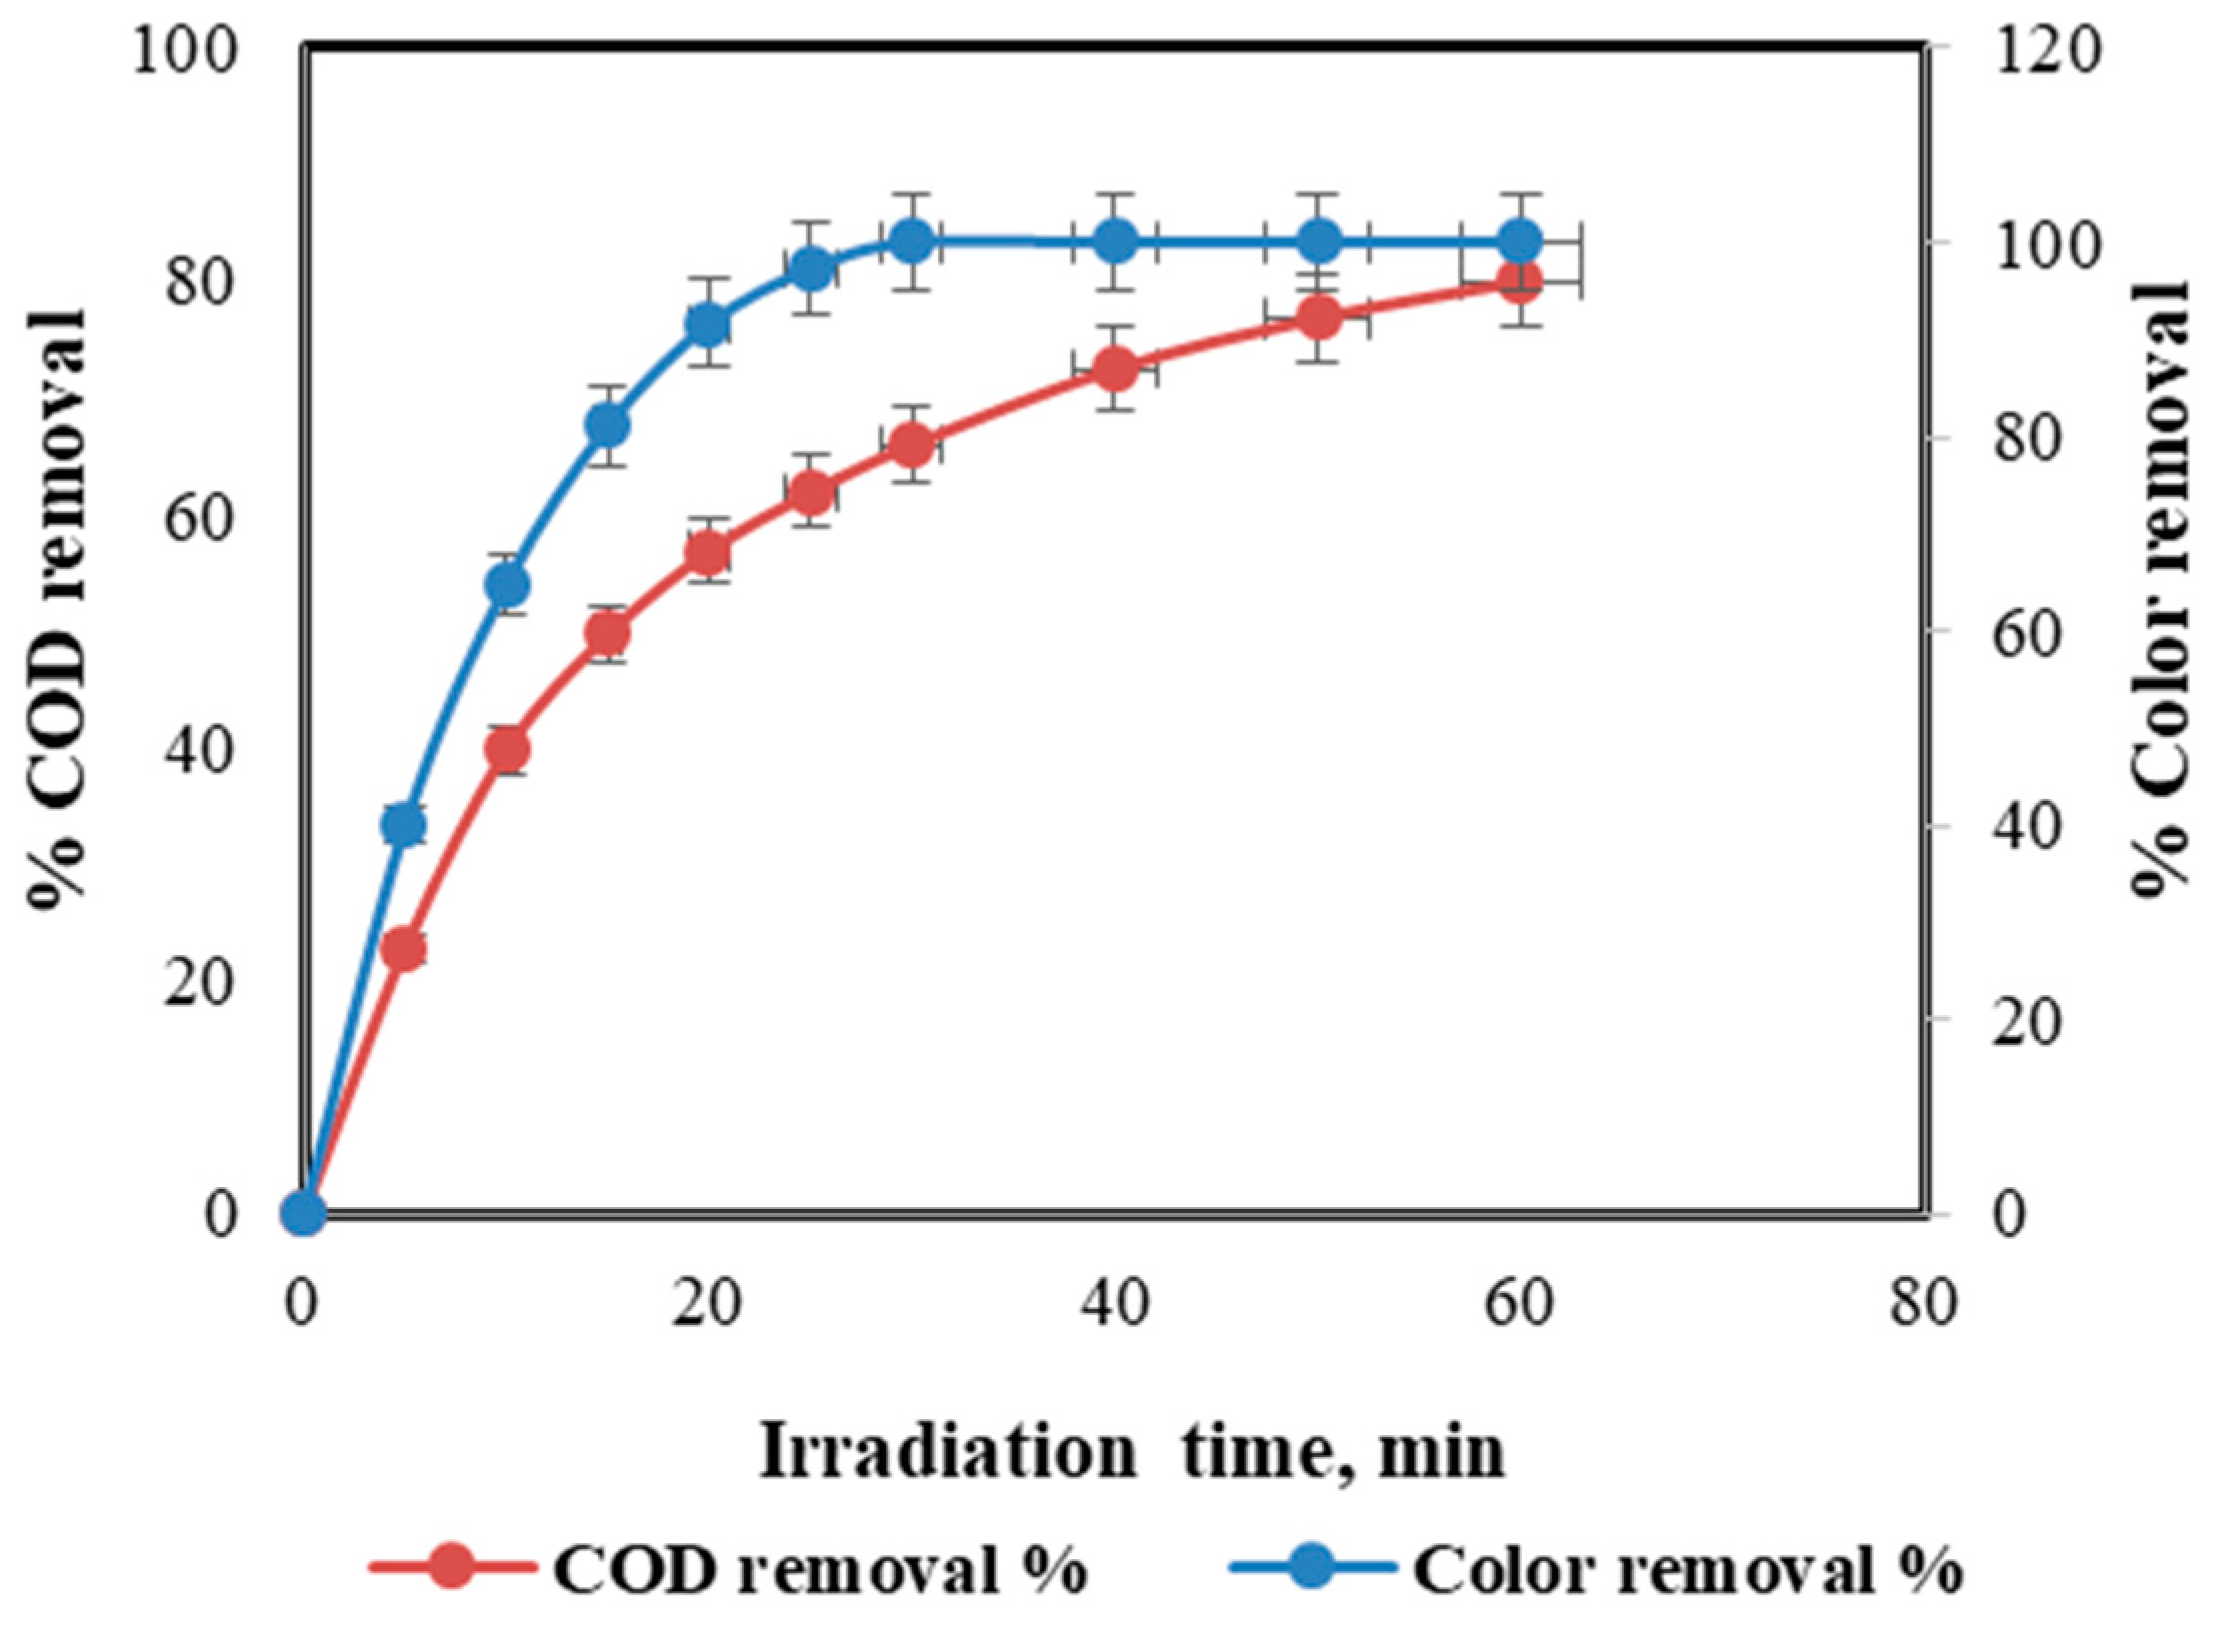
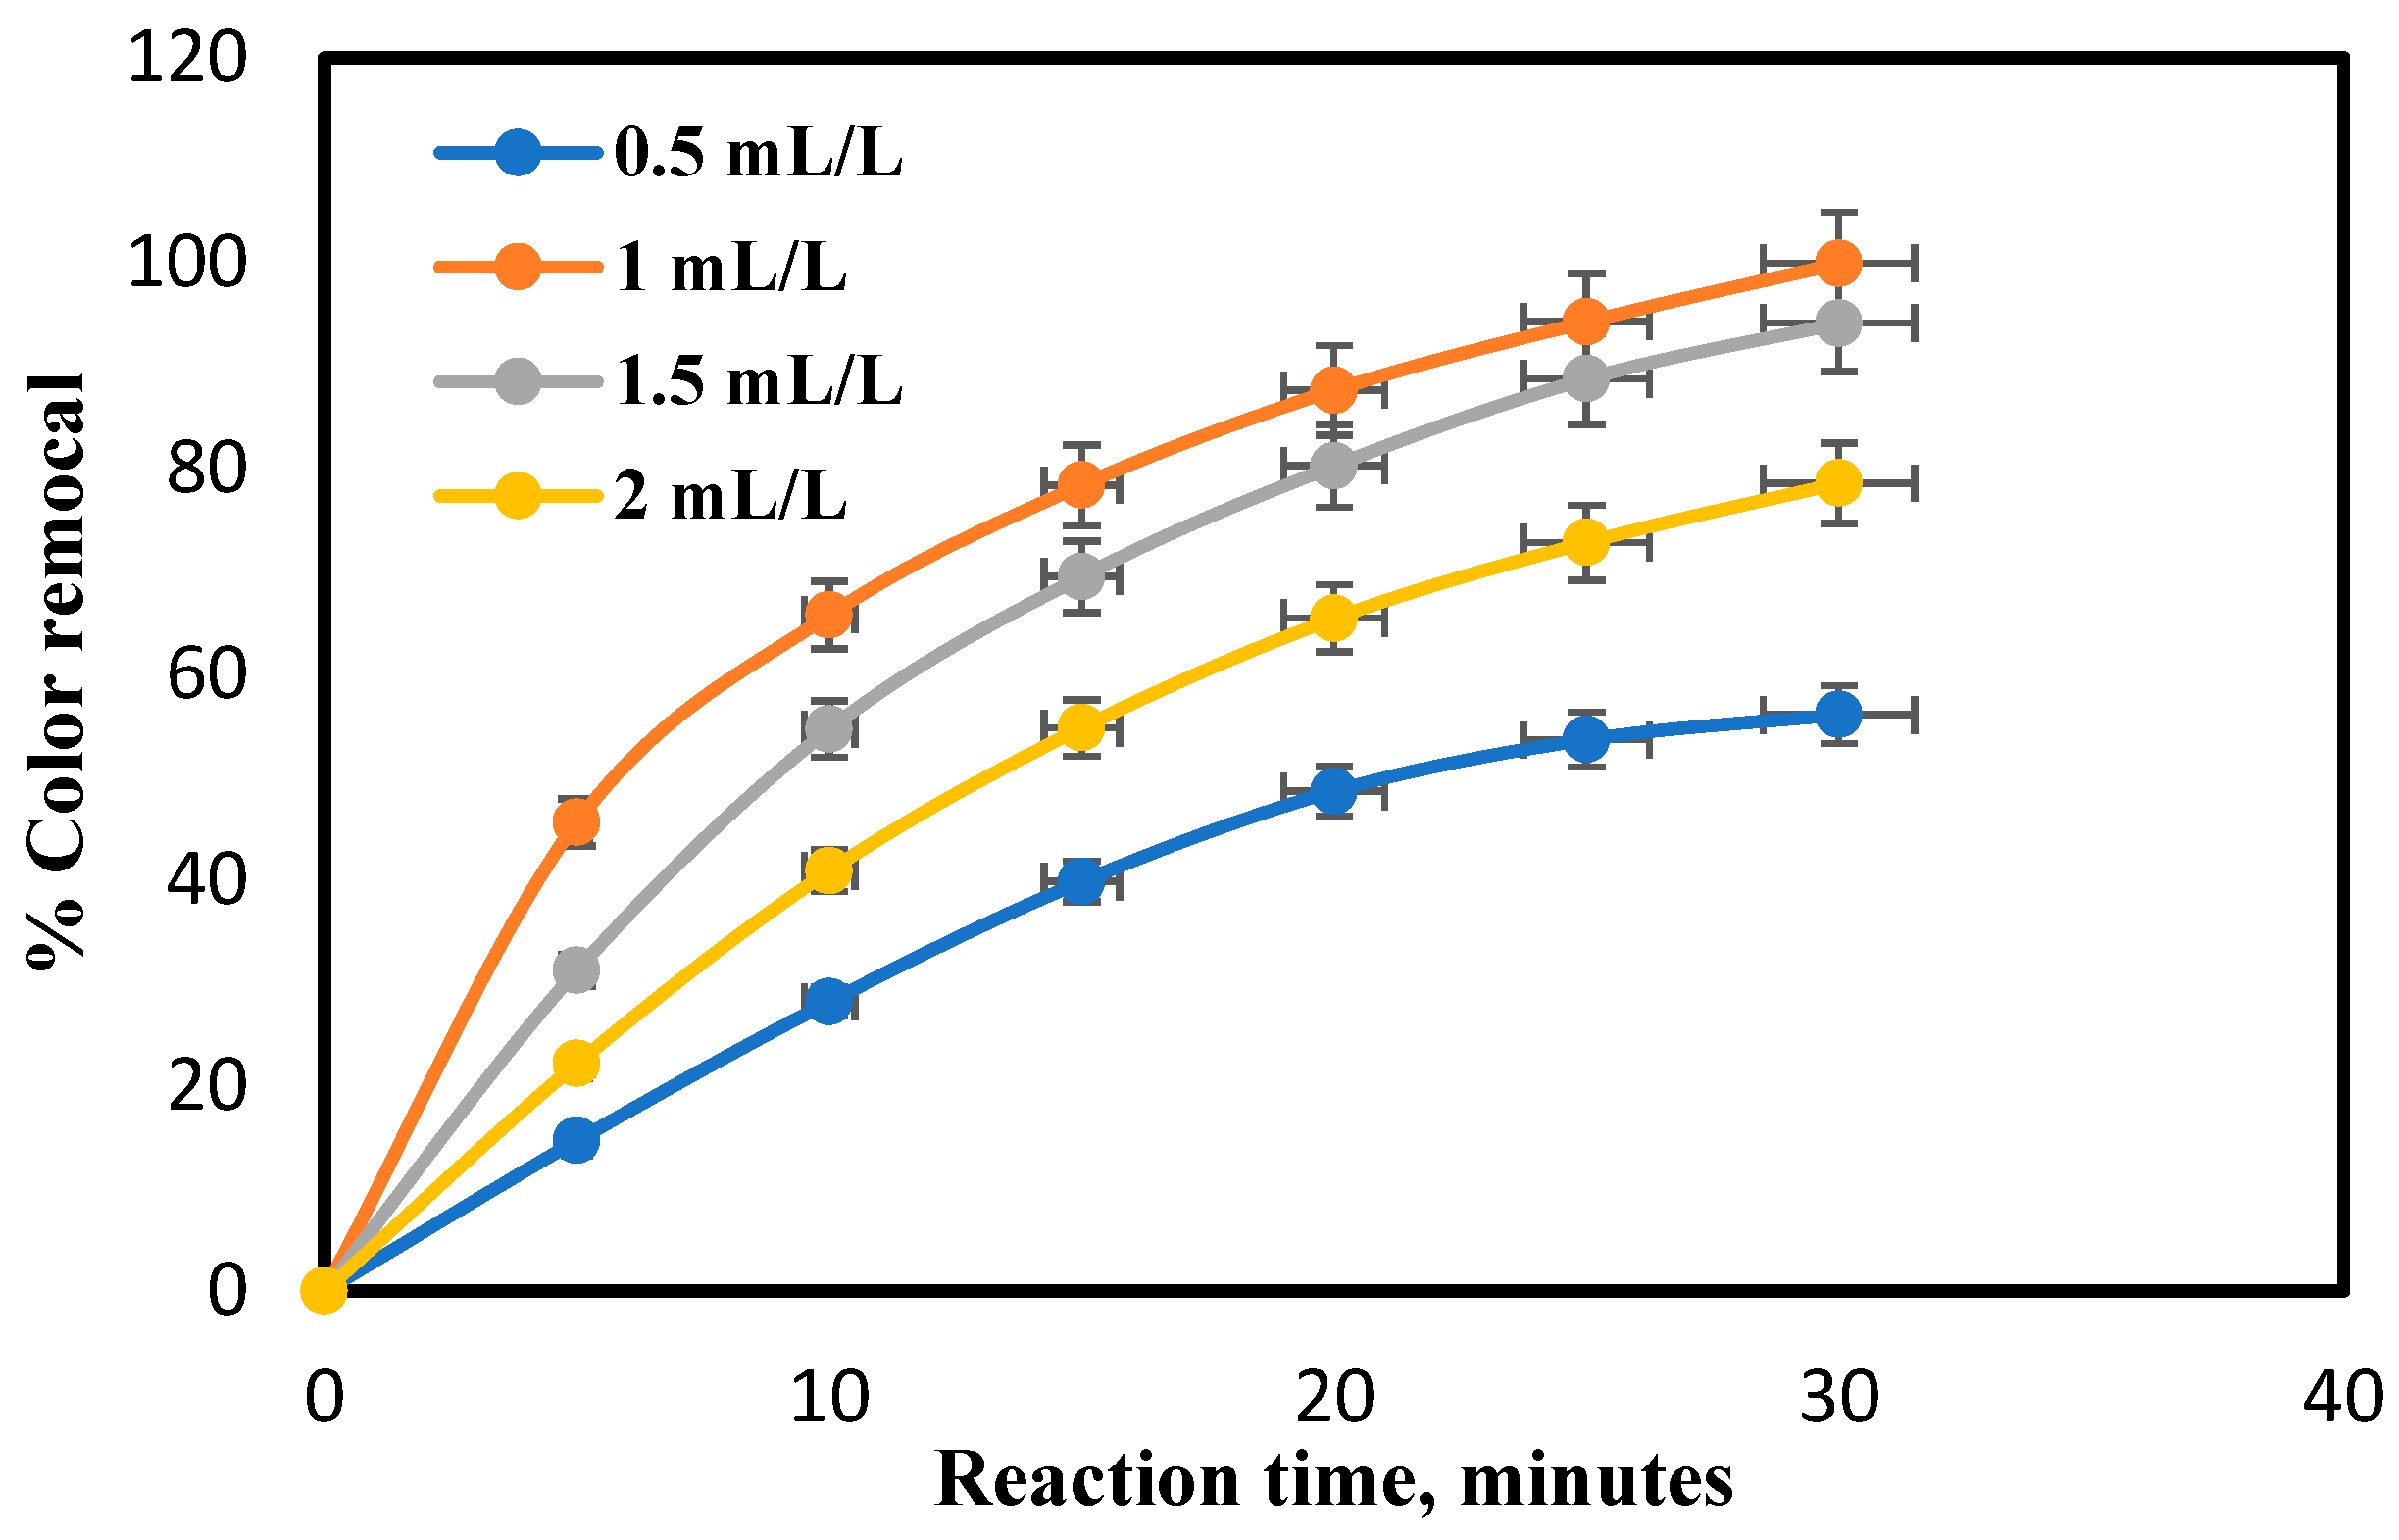
4.1. Effect of Irradiation Time on COD and Color Removal Percent

The effectiveness of the photo-Fenton process relies on the composition and recovery rates of OH, which can vary depending on the organic substrate and duration of irradiation [37,38]. To determine the optimal duration for COD removal, the impact of various irradiation times (ranging from 10 to 60 min) on photo-Fenton treatment was examined, at the following conditions, pH = 3, catalyst dose = 0.4 mg/L, H2O2 = 1 mL/L, 20 mL/min flow rate, initial dye concentration = 0.75 gm/L, and 75-watt light intensity. Results indicated that the highest COD removal % (80%) was achieved after 60 min of irradiation.
Also, to determine the optimal duration for color removal, the impact of various irradiation times (ranging from 3 to 30 min) on photo-Fenton treatment was examined, as depicted in Figure 6. Results denoted that the highest color removal % (100%) was acquired after 30 min of irradiation. Notably, the percentage of color removal increased with prolonged irradiation time, as this facilitated the generation of more free radicals resulting from multiple reactions. These findings align with Tabarek A. Sajjad’s 2020 [37] research.

4.2. Effect of PhotoCatalyst Dose on COD and Color Removal Percent

To define the impact of photocatalyst dose on the COD removal %, runs were carried out at 3 pH, reaction time = 60 min, 1 mL/L of H2O2, 20 mL/min flow rate, 0.75 mg/L of initial dye concentration, and 75-watt light intensity. The results are elucidated in Figure S5. The results clarify that the highest COD removal is 80% for 60 min when the photocatalyst dose is 0.4 gm/L, which is the ideal dose that reduces COD from 4200 ppm to 840 ppm. When the photocatalyst dose was higher than 0.4 gm/L, the COD removal percent dropped as in the case of 0.6 gm/L and 0.8 gm/L of photocatalyst dose. This is owing to the catalytic impact of ferrous ions on H2O2. When ferrous ions concentration raises, the Fe (OH)2+ formation also rises. Fe (OH)2+ absorbs UV light, causing a decrease in the strength of UV light [31].
Photocatalyst dose also has an impact on the color removal as displayed in Figure 7. The maximum color removal % is 100% obtained at 0.4 gm/L of photocatalyst dose for 30 min, which is the ideal amount. When the photocatalyst dose raised to 0.6 gm/L and 0.8 gm/L, the color removal % dropped to 93.61% and 68.43%, respectively, producing a possible side reaction that interfered with the formation of hydroxyl radicals that are essential for the oxidation of organic matter.

4.3. Effect of Hydrogen Peroxide Amount on COD and Color Removal Percent

The impact of H2O2 amount was examined (ranging from 0.5 mL/L to 2 mL/L). In these runs, other factors were held constant at the dye initial concentration of 0.75 mg/L, 0.4 gm/L of catalyst dose, 60 min reaction time, 20 mL/min flow rate, pH value of 3, and 75-watt light intensity. The impact of H2O2 is elucidated in Figure S6. The COD removal % increased from 40% to 80% with the increase in H2O2 amount from 0.5 mL/L to 1 mL/L. Increasing the H2O2 amount to 2 mL/L leads to a decrease in COD removal % to 67%, owing to H2O2 decomposition spontaneously to oxygen and water and recombination of OH radicals as exhibited in Equations (7) and (8). For that reason, the H2O2 amount of 1 mL/L is chosen as the ideal amount.
H2O2 amount also impacts on color removal for that reason the impact of H2O2 amount on the color removal % was inspected to determine the ideal amount of H2O2 that accomplishes the highest removal %. Figure 8 exposes the acquired results. It can be noticed that the color removal % increased from 56.09% to 100% with increasing the H2O2 amount from 0.5 mL/L to 1 mL/L for 30 min. On increasing H2O2 amount to 1.5 and 2 mL/L, however, the removal % was reduced because an excess of H2O2 will react with OH competing with organic pollutants and consequently dropping the competence of color removal.

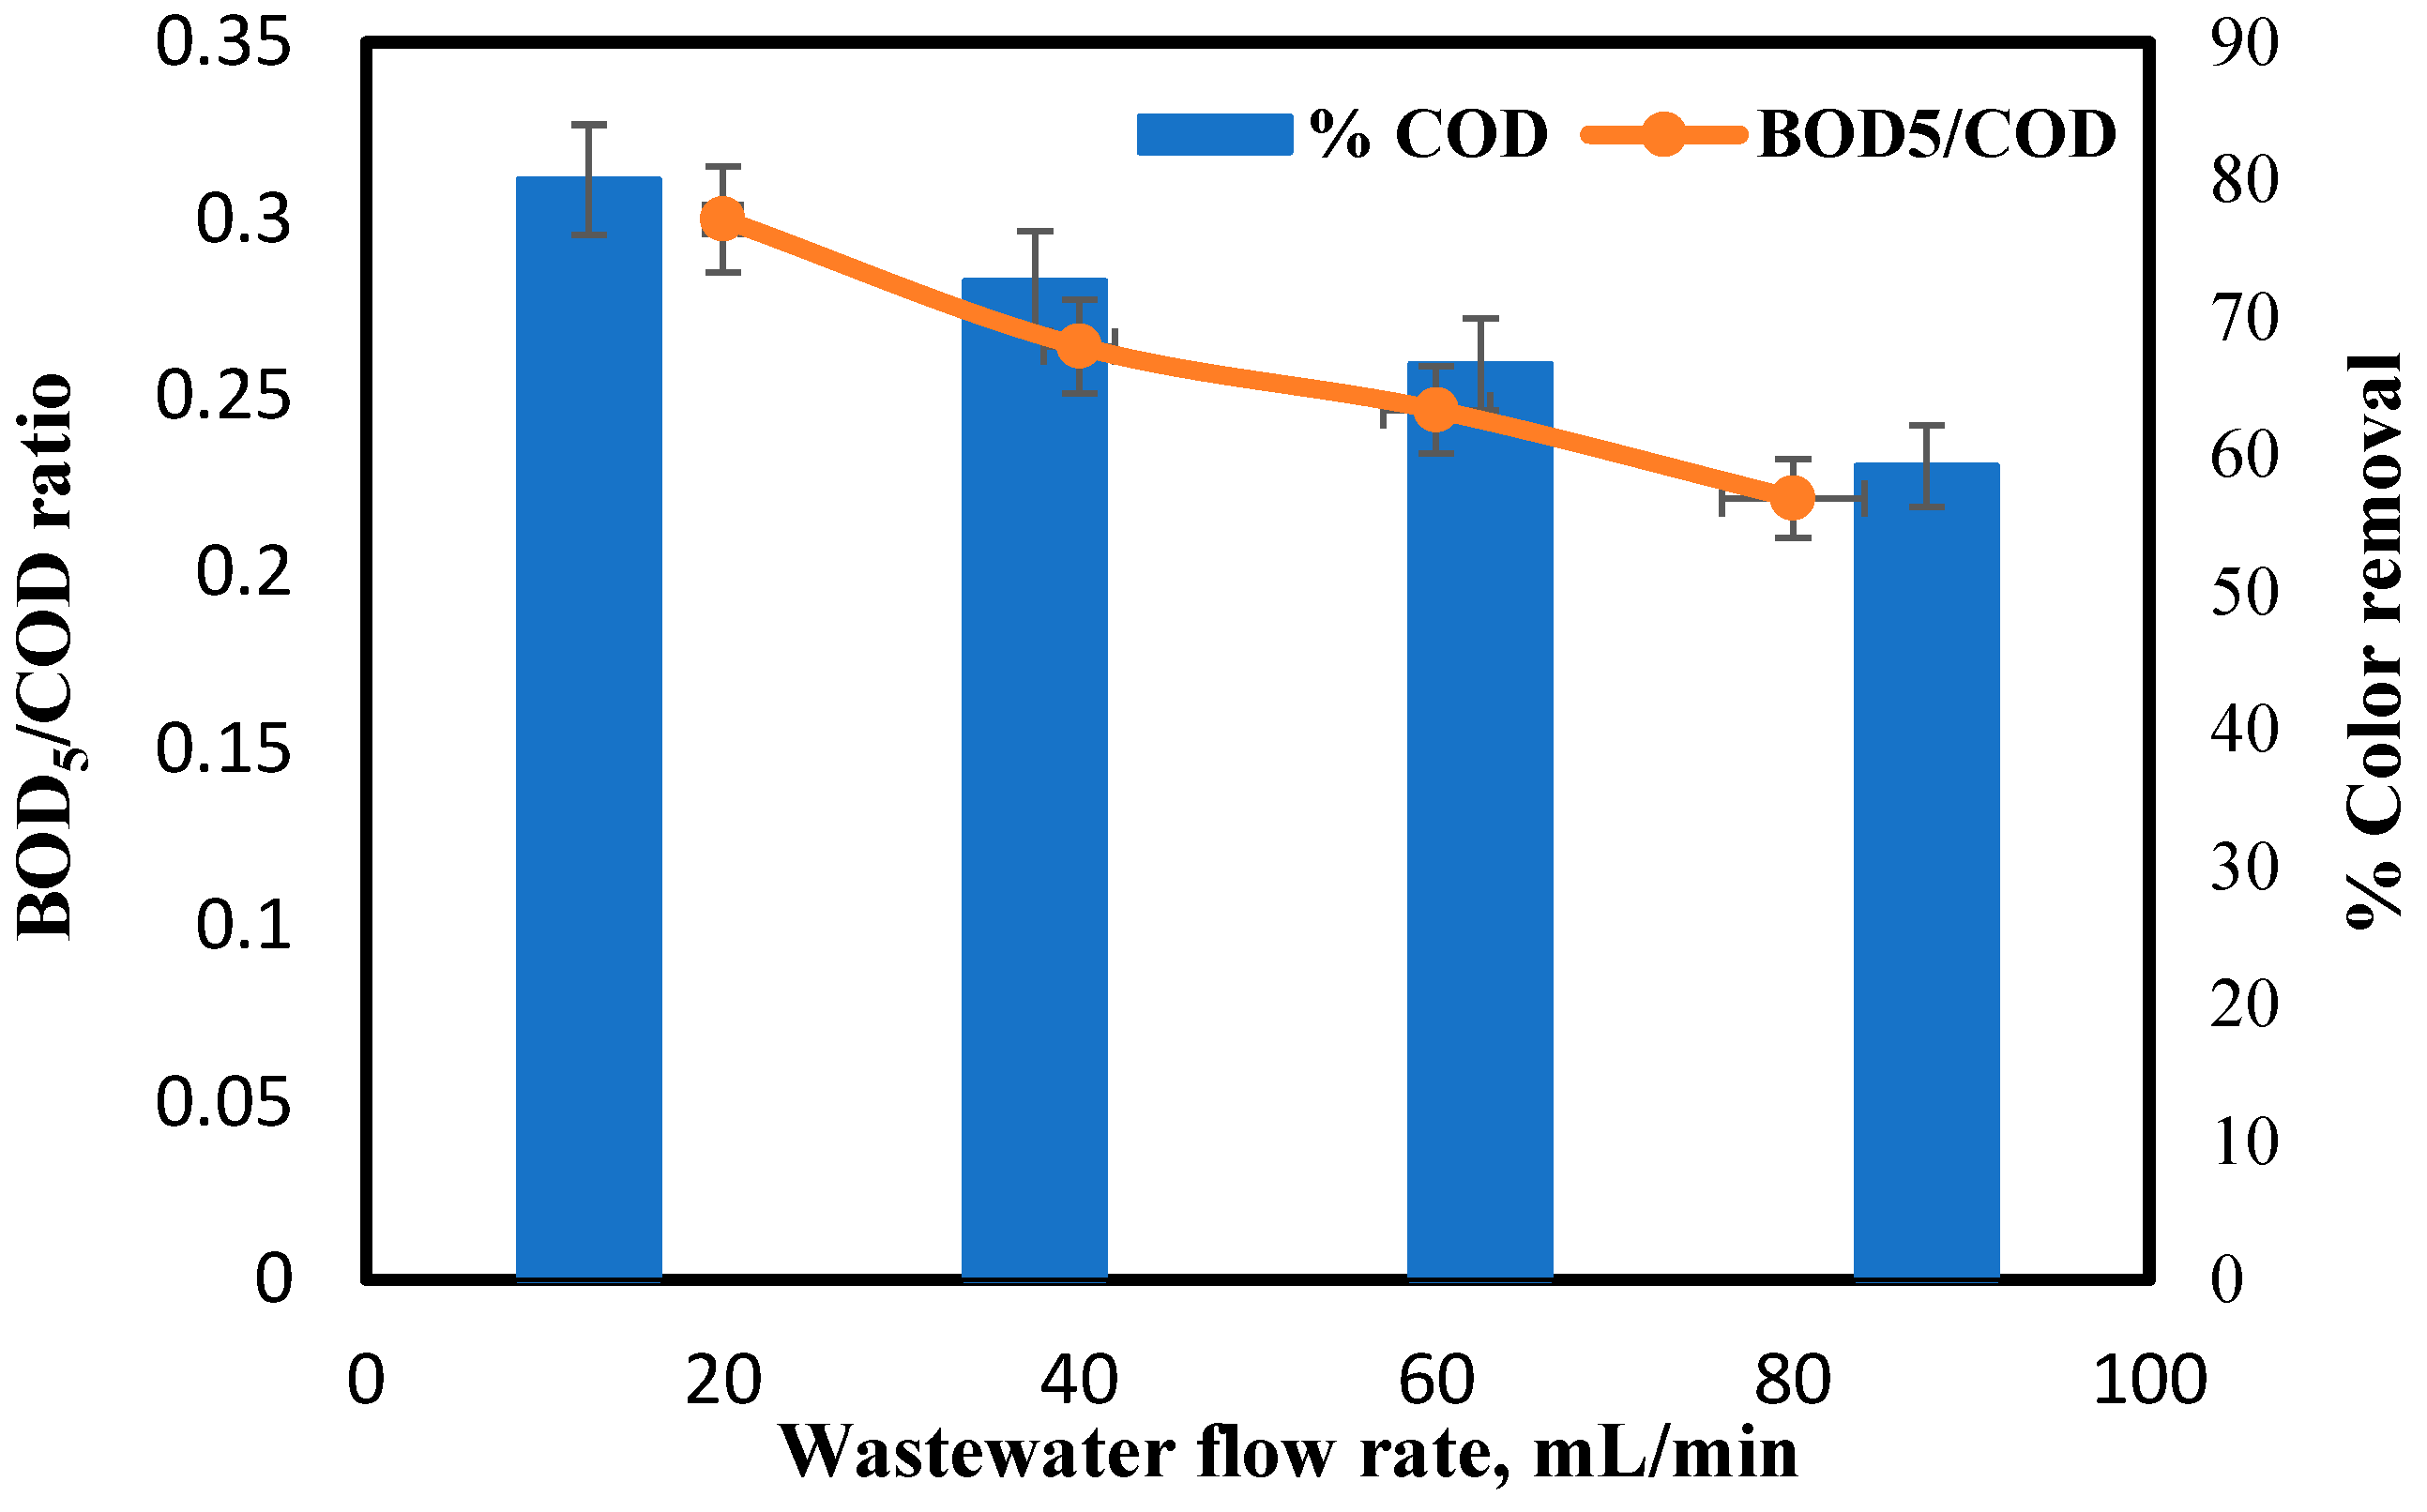
4.4. Effect of Wastewater Flow Rate on COD and Color Removal Percent

To evaluate the dye removal efficacy, the flow rate of the dye solution varied from 20 to 80 mL/min, representing a pilot-scale process. The impact of the flow rate on color removal at pH = 3, catalyst dose = 0.4 g/L, H2O2 = 1 mL/L, reaction time = 30 min, initial dye concentration = 0.75 g/L, and 75-watt UV intensity is elucidated in Figure S7. The highest color removal efficiency of 100% was achieved at a flow rate of 20 mL/min. However, increasing the flow rate from 20 to 80 mL/min resulted in a decrease in color removal percentage, indicating an inverse relationship between flow rate and dye removal efficiency. This can be attributed to the fact that a higher flow rate leads to a shorter exposure time of the polluted solution to the UV lamp, which requires a decrease in the amount of H2O2 to form more hydroxyl radical (OH), as supported by previous studies [37,39].
The impact of the flow rate on COD removal was examined under the following conditions: pH = 3, catalyst dose = 0.4 g/L, H2O2 = 1 mL/L, reaction time = 60 min, initial dye concentration = 0.75 g/L, and 75-watt UV intensity. Figure 9 illustrates that the percentage of COD removal decreased with an increase in the flow rate of the wastewater. The highest COD removal percentage of 80% was achieved at a flow rate of 20 mL/min.

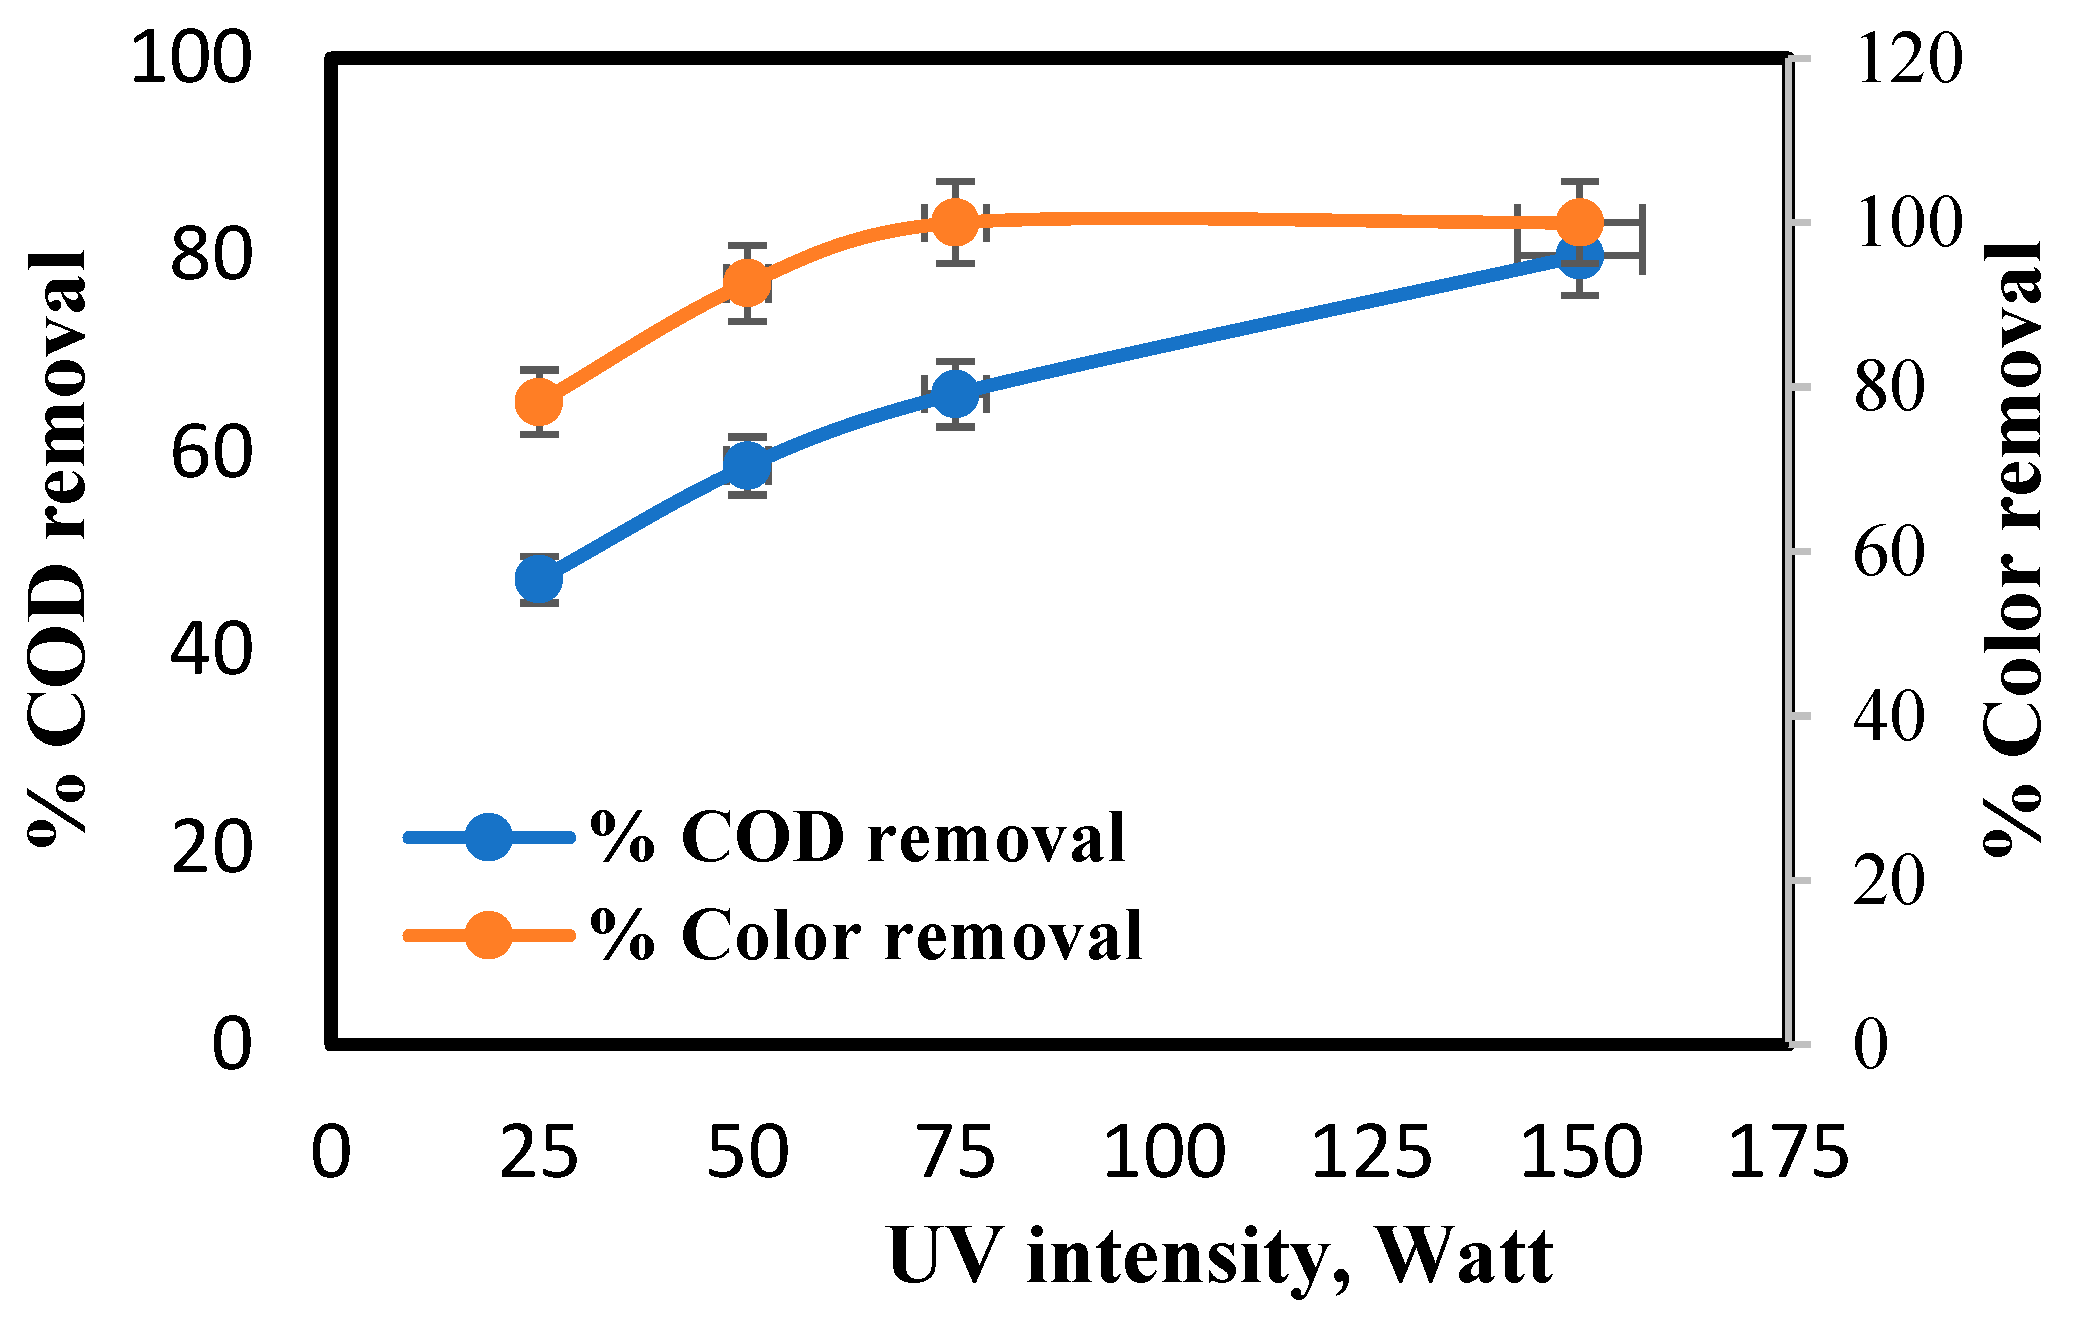
4.5. Effect of Light Intensity on Irradiation Time, COD and Color Removal Percent

To study the impact of light intensity on irradiation time, two runs were carried out using two lamps with different intensities, one with a power of 75 watts and the other with a power of 150 watts. The set of runs was accomplished at 3 pH, 1 mL/L of H2O2, 0.75 gm/L of initial dye concentration, 0.4 mg/L of catalyst dose, and 20 mL/min flow rate. As shown in Figure S8, the 150-watt lamp achieves 80% COD removal for 30 min and the 75-watt lamp achieves the same COD removal % but for 60 min. This is in consequence of more OH radicals being generated with increased UV light intensity in the photo-Fenton process causing more organic matter to degrade in a shorter period [22,24,25,37].
The impact of the UV radiation intensity on the COD and color removal was also examined utilizing the ideal factors. The impact of UV radiation intensity on the COD and color removal was assessed at 25, 50, 75, and 150 watts, as depicted in Figure 10. The results clarify that the elimination percent of organic matter raises with rising light intensity, owing to an increase in the number of photons that flow into the dye solution, which leads to an increase in the degradation rate of organic matter. Therefore, the decolorization rapidity relies on the number of photons that hit with the dye molecules and their ability to destroy the chromospheres bonds in the dye molecules [40,41]. The maximum color removal 100% and COD removal 80% were acquired at high UV intensity (150 watts) for 30 min.
It is evident that the photo-Fenton process fulfilled 80% COD elimination percent under ideal conditions such as 0.75 mg/L initial dye concentration, 1 mL/L of H2O2, catalyst dose 0.4 gm/L, 20 mL/min wastewater flow rate, and 75-watt light intensity at 60 min of reaction time, reducing COD from 4200 ppm to 840 ppm, and BOD5 from 630 ppm to 252 ppm. Thus, the BOD5/COD ratio is 0.3 and all non-biodegradable materials become biodegradables. The COD value matches the environmental specifications for drainage in industrial areas because it is less than 1100 ppm, so biological treatment using activated sludge is not applied in this case.

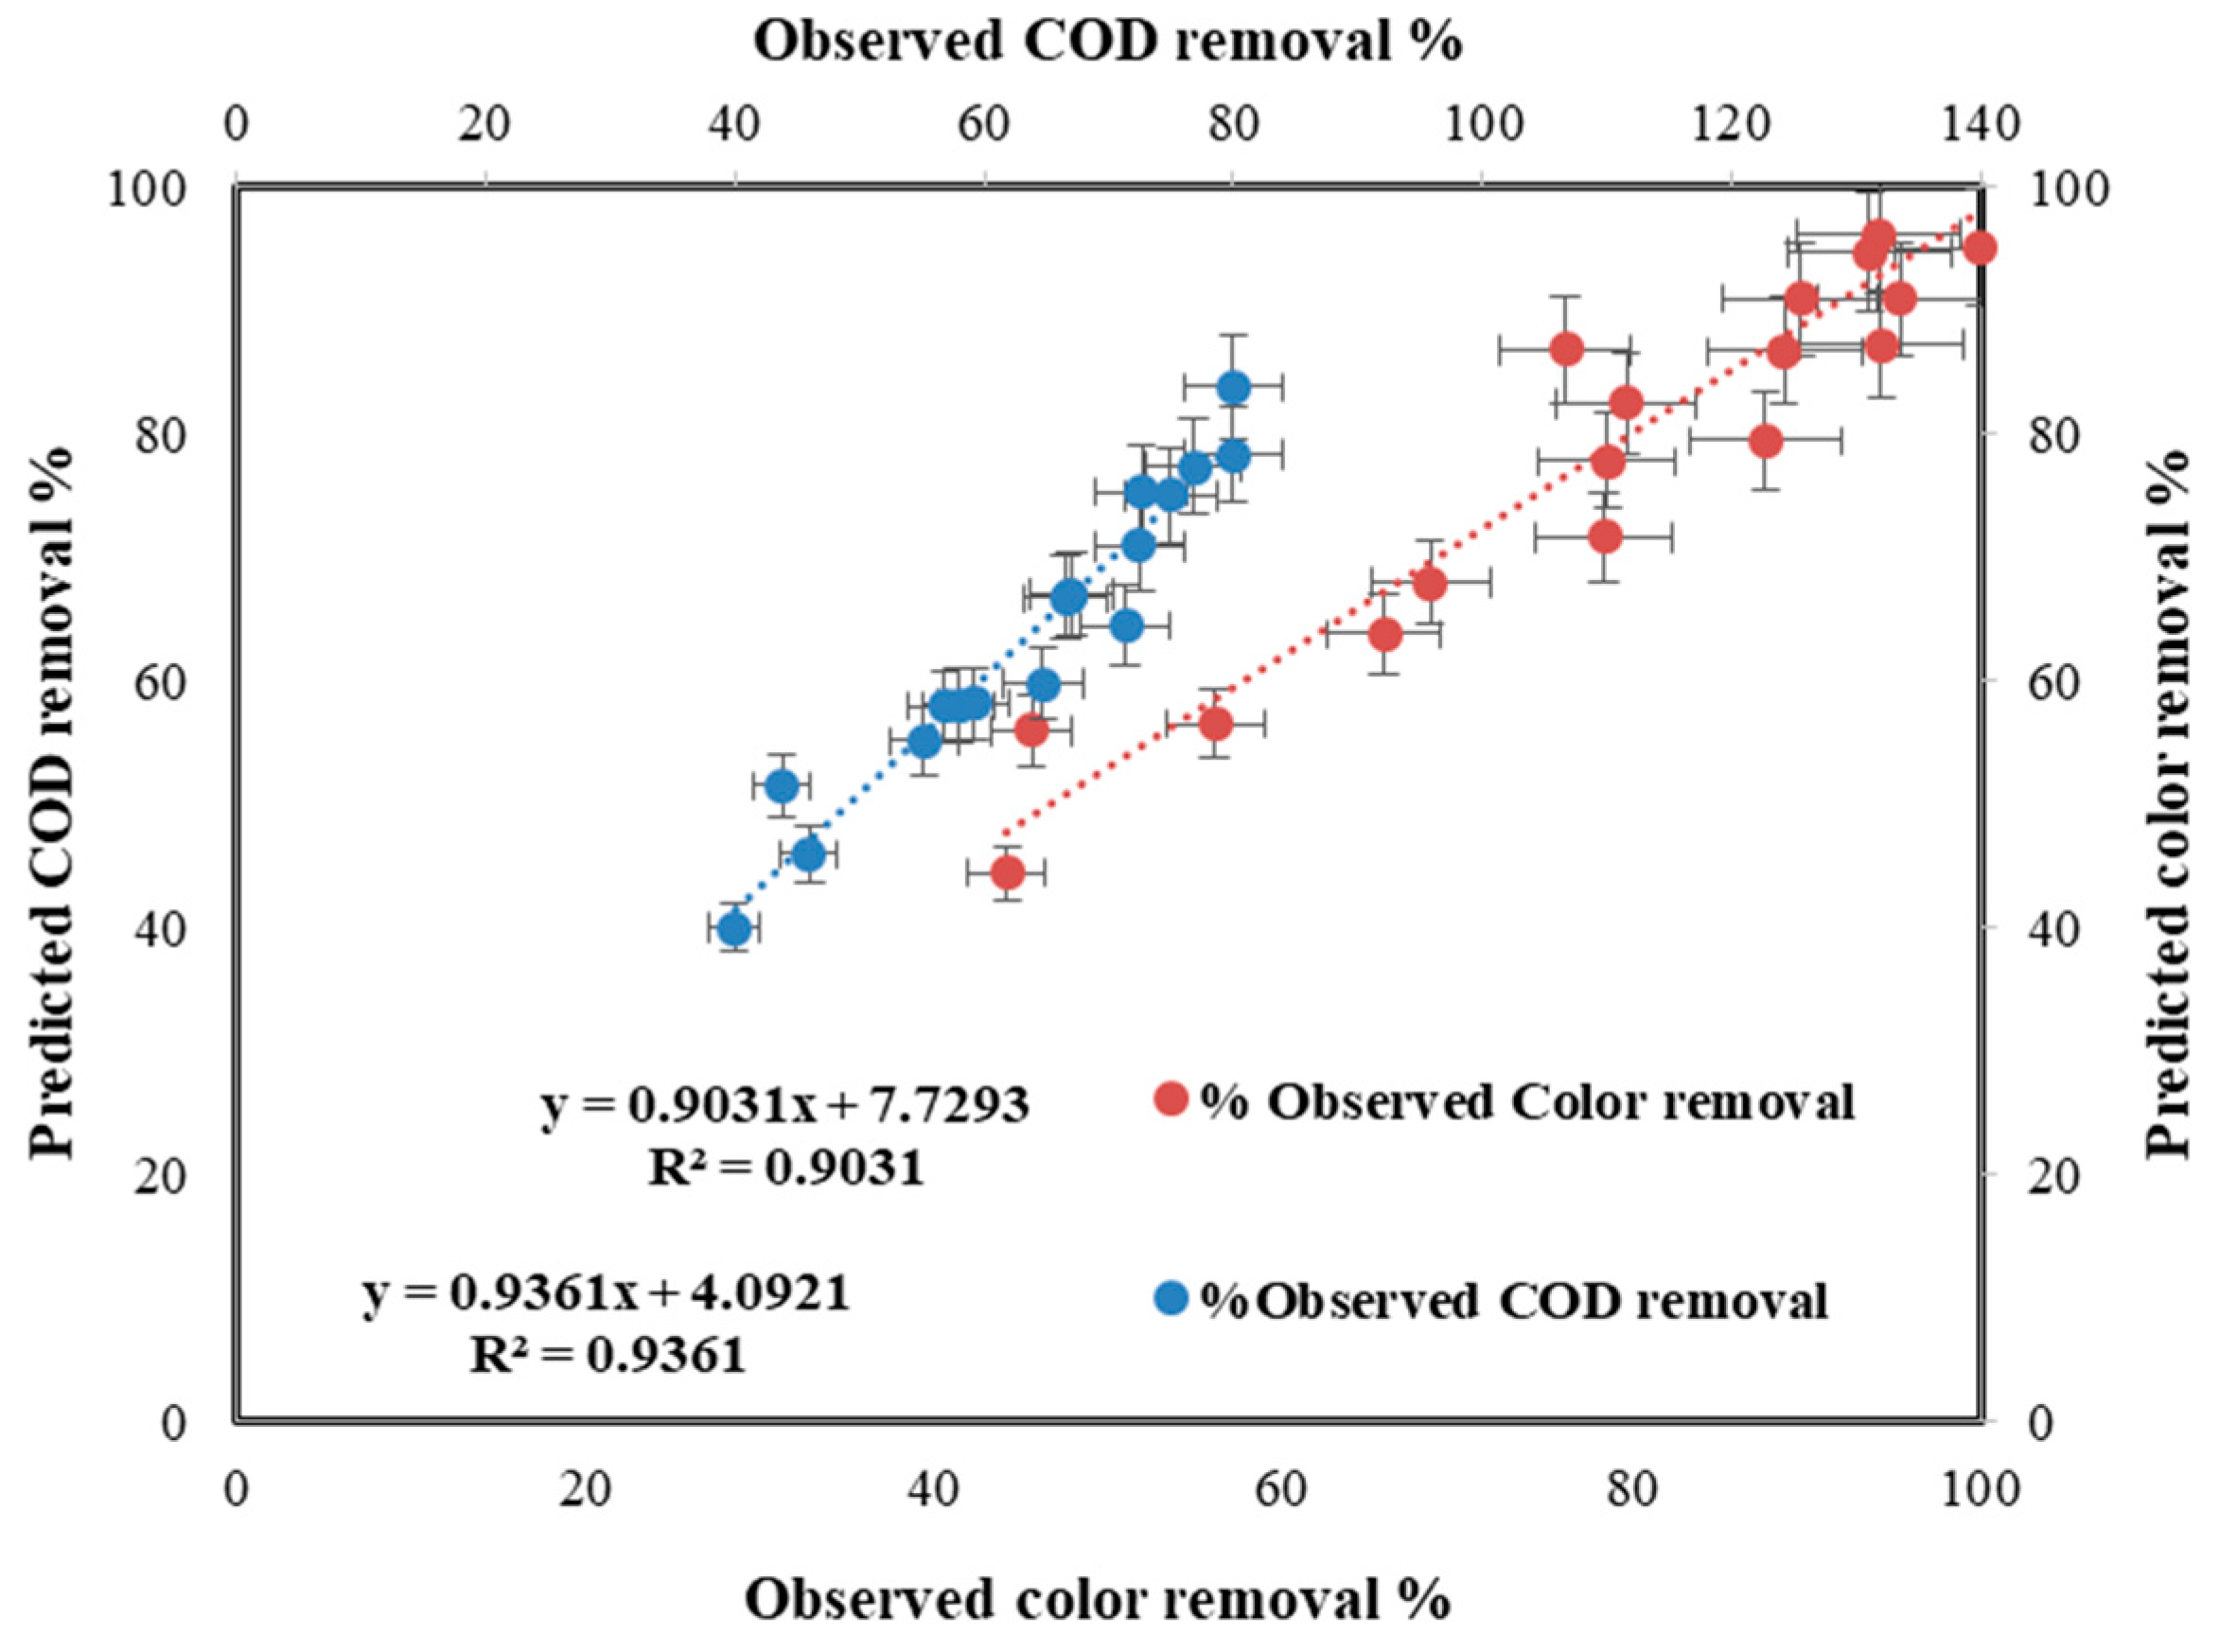
4.6. Statistic Study for the Photo-Fenton Process

The results mentioned above denote that COD and color removal percentages are non-linearly affected by several processing factors, including catalyst dose (mg/L), H2O2 amount (mL/L), flow rate (mL/min), irradiation time (min), and UV radiation intensity. To understand the correlation between these processing factors and COD and color removal percentages, a statistical and least squares multivariate regression technique was utilized. The mathematical models resulting from this analysis are presented below:
% COD removal → −247.29 − 441.18 A − 1172.94 B − 0.43 C + 0.65 D + 0.19 E − 319.6 A2 − 2247.64 B2 + 71.41 A3 + 1303.21 B3
where: A, B, C, D, and E are H2O2 amount (mL/L), catalyst dose (mg/L), wastewater flow rate (mL/min), irradiation time, and UV radiation intensity, respectively. The regression coefficient R2 of the resulting correlation was 93.61%.
Table S5 exhibits the data for ANOVA, while Table S6 includes the values, p-values, standard error, and t-test for all coefficients. Any p-value less than 0.05 indicates that the correlation term is significant.
% Color removal → −677.44 − 245.63 A − 843.84 B − 0.21 C + 1.57 D + 0.17 E + 551.2 A0.5 + 1184.77 B0.5
The regression coefficient R2 of the resulting correlation was 90.31%. The data for ANOVA is elucidated in Table S7, while Table S8 comprises the values, p-values, standard error, and t-test for all coefficients. Any p-value less than 0.05 signifies a significant correlation term. Figure 11 compares the experimentally determined COD and color removal % with the expected values for the photo-Fenton process.

4.7. Comparison between % COD Removal and % Color Removal Using Several Techniques

Numerous runs were carried out using several techniques to accomplish the highest removal percent of COD and color as depicted in Figure 12. It is obvious the most efficient technique applied to eliminate both COD and color is the photo-Fenton process, which achieves the largest removal percent of COD (80%) and color (100%).

4.8. Economic Study

Recently, using economic studies to prove the efficiency of the used systems has become more urgent [42,43]. Fenton and photo-Fenton followed by biological treatment is one of the most efficient as well as very economical techniques. The cost estimation was calculated according to the prices of raw materials necessary for the treatment of 1 L of wastewater effluent, and the results were registered in Table 1.
To eliminate 1 kg of COD through different photo-chemical oxidation processes, the energy results elucidate that the photo-Fenton process is more economic than using UV only and UV/H2O2 reducing energy consumption from 7.444 to 1.861 Kwhr/Kg and from 3.722 to 1.861 Kwhr/Kg in each case, respectively, when using a 75 W UV lamp. Also, the photo-Fenton process reduces energy consumption compared to using UV only and UV/H2O2 from 8.933 to 2.232 Kwhr/Kg and from 4.464 to 2.232 Kwhr/Kg in each case, respectively, when using a 150 W UV lamp as depicted in Figure S9. It is observed that the specific energy consumed was calculated only from the converted UV radiation, which represents only a portion of the total electrical energy.
The cost of energy consumption required to remove 1 kg of COD by different photo-chemical oxidation processes is elucidated in Figure S10.

5. Conclusions

This pioneering research successfully demonstrates for the first time integrated treatment systems combining advanced oxidation processes (Fenton and photo-Fenton) with biological methods for the effective elimination of stubborn organic compounds in simulated textile wastewater composed of azo Dichlorotriazine dye. Key innovations include comprehensive optimization of critical process parameters like catalyst dosage and hydrogen peroxide amount for both Fenton and photo-Fenton to realize maximum COD and color removal. Under optimized conditions (0.4 gm/L of photocatalyst dose, 20 mL/min flow rate, 1mL/L of H2O2, and 75-watt UV intensity for one hour), photo-Fenton achieved 80% COD removal and complete decolorization, enabling direct discharge meeting industrial norms without needing additional biological treatment. This makes photo-Fenton an economical, sustainable solution for treating simulated textile wastewater composed of azo Dichlorotriazine dye. For Fenton, the integrated Fenton–biological scheme uniquely exploits synergism between chemical and biological processes for enhanced overall treatment. Post-biological treatment using activated sludge was required to comply with discharge limits (less than 1100 ppm). Significant economic benefits were realized by photo-Fenton over conventional UV-only and UV/H2O2 methods in terms of energy use and operating costs. Overall, this pioneering work successfully establishes integrated advanced oxidation–biological systems as a superior, sustainable alternative to traditional techniques for efficiently and economically removing persistent pollutants from simulated textile wastewater composed of azo Dichlorotriazine dye to satisfy environmental regulations.

Supplementary Materials

The following supporting information can be downloaded at: https://www.mdpi.com/article/10.3390/w16101327/s1, Figure S1: Effect of catalyst dose on COD removal percent and BOD5/COD ratio in homogeneous photo-catalytic oxidation by Fenton oxidation [pH = 3, reaction time = 60 min, H2O2 = 1.5 mL/L, 20 mL/min flow rate, and initial dye concentration = 0.75gm/L]. Figure S2: Effect of the hydrogen peroxide amount on COD removal percent and BOD5/COD ratio, in the homogeneous photo-catalytic oxidation by Fenton oxidation [pH = 3, catalyst dose = 0.6 gm/L, reaction time = 60 min, 20 mL/min flow rate, and initial dye concentration = 0.75 gm/L]. Figure S3: Effect of wastewater flow rate on the colour removal percent in homogeneous photo-catalytic oxidation by Fenton oxidation [pH = 3, Catalyst dose = 0.6 gm/L, reaction time = 30 min, H2O2 = 1.5 mL/L, and initial dye concentration = 0.75 gm/L]. Figure S4: Effect of wastewater flow rate on the COD removal percent and BOD5/COD ratio in homogeneous photo-catalytic oxidation by Fenton oxidation [pH = 3, Catalyst dose = 0.6 gm/L, reaction time = 60 min, H2O2 = 1.5 mL/L, and initial dye concentration = 0.75 gm/L]. Figure S5: Effect of photocatalyst dose on COD removal % in homogeneous photo- catalytic oxidation by photo-Fenton oxidation [pH = 3, reaction time = 60 min, H2O2 = 1 mL/L, 20 mL/min flow rate, initial dye concentration = 0.75 gm/L, and 75-watt light intensity]. Figure S6: Effect of hydrogen peroxide amount on COD removal % in the homogeneous photo-catalytic oxidation by photo-Fenton oxidation [pH = 3, Catalyst dose = 0.4 gm/L, reaction time = 60 min, 20 mL/min flow rate, initial dye concentration = 0.75 gm/L, and 75-watt light intensity]. Figure S7: Effect of wastewater flow rate on the colour removal percent in homogeneous photo-catalytic oxidation by photo-Fenton oxidation [pH = 3, Catalyst dose = 0.4 gm/L, reaction time = 30 min, H2O2 = 1 mL/L, 75-watt UV-intensity, and initial dye concentration = 0.75 gm/L]. Figure S8: Effect of the light intensity on irradiation time in the homogeneous photo-catalytic oxidation to remove 80 % of COD [pH = 3, H2O2 = l mL/L, Catalyst dose = 0.4 mg/L, 20 mL/min flow rate, and initial dye concentration = 0.75 gm/L]. Figure S9: Specific energy consumption of 80 % COD removal for UV, UV/H2O2 and UV/H2O2/Fe (II): (Total UV-power 150-W, irradiation time 30 min) (Total UV-power 75-W, irradiation time 60 min). Figure S10: Cost of energy consumption of 80% COD removal for UV, UV/H2O2 and UV/H2O2/Fe (II): (Total UV-power 75-W, irradiation time 60 min) (Total UV-power 150-W, irradiation time 30 min). Table S1: ANOVA test outcomes for Fenton process [COD removal]. Table S2: Values, p-values, standard error, and t-test for all coefficients [COD removal]. Table S3: ANOVA test outcomes for Fenton process [Colour removal]. Table S4: Values, p-values, standard error, and t-test for all coefficients [Colour removal]. Table S5: ANOVA test outcomes for photo-Fenton process [COD removal]. Table S6: Values, p-values, standard error, and t-test for all coefficients [COD removal]. Table S7: ANOVA test outcomes for photo-Fenton process [Colour removal]. Table S8: Values, p-values, standard error, and t-test for all coefficients [Colour removal].

Author Contributions

Conceptualization, G.K.H. and G.E.A.; methodology, G.K.H., G.E.A. and R.M.M.; validation, H.A.E.-G., H.E.A.-H. and G.K.H.; formal analysis, P.K., H.E.A.-H. and G.K.H.; investigation, M.Y.G. and G.K.H.; writing—original draft preparation, G.K.H., G.E.A., H.A.E.-G. and H.E.A.-H.; writing—review and editing, G.K.H., H.E.A.-H. and A.A.A.; supervision, M.Y.G. and A.A.A. All authors have read and agreed to the published version of the manuscript.

Funding

This research received no external funding.

Data Availability Statement

Data are contained within the article and Supplementary Materials.

Acknowledgments

This work was carried out with assistance from all universities that were affiliated with the authors.

Conflicts of Interest

The authors declare no conflicts of interest.

References

  1. Altinbas, U.; Dökmeci, S.; Baristiran, A. Treability Study of Wastewater from Textile Industry. Environ. Technol. 1995, 16, 389–394. [Google Scholar] [CrossRef]
  2. Mersal, M.; Zedan, A.F.; Mohamed, G.G.; Hassan, G.K. Fabrication of Nitrogen Doped TiO2/Fe2O3 Nanostructures for Photocatalytic Oxidation of Methanol Based Wastewater. Sci. Rep. 2023, 13, 4431. [Google Scholar] [CrossRef]
  3. El-Gawad, H.A.; Hassan, G.K.; Aboelghait, K.M.; Mahmoud, W.H.; Mohamed, R.M.; Afify, A.A. Removal of Chromium from Tannery Industry Wastewater Using Iron-Based Electrocoagulation Process: Experimental; Kinetics; Isotherm and Economical Studies. Sci. Rep. 2023, 13, 19597. [Google Scholar] [CrossRef]
  4. Kurniawan, T.A.; Batool, F.; Mohyuddin, A.; Goh, H.H.; Othman, M.H.D.; Aziz, F.; Anouzla, A.; Al-Hazmi, H.E.; Chew, K.W. Chitosan-Coated Coconut Shell Composite: A Solution for Treatment of Cr(III)-Contaminated Tannery Wastewater. J. Taiwan Inst. Chem. Eng. 2024, 105478, in press. [Google Scholar] [CrossRef]
  5. Singh, R.P.; Singh, P.K.; Gupta, R.; Singh, R.L. Treatment and Recycling of Wastewater from Textile Industry. In Advances in Biological Treatment of Industrial Waste Water and Their Recycling for a Sustainable Future; Springer: Singapore, 2019; pp. 225–266. [Google Scholar]
  6. Donkadokula, N.Y.; Kola, A.K.; Naz, I.; Saroj, D. A Review on Advanced Physico-Chemical and Biological Textile Dye Wastewater Treatment Techniques. Rev. Environ. Sci. Bio/Technol. 2020, 19, 543–560. [Google Scholar] [CrossRef]
  7. Afify, A.A.; Hassan, G.K.; Al-Hazmi, H.E.; Kamal, R.M.; Mohamed, R.M.; Drewnowski, J.; Majtacz, J.; Mąkinia, J.; El-Gawad, H.A. Electrochemical Production of Sodium Hypochlorite from Salty Wastewater Using a Flow-by Porous Graphite Electrode. Energies 2023, 16, 4754. [Google Scholar] [CrossRef]
  8. Al-Hazmi, H.E.; Hassan, G.K.; Kurniawan, T.A.; Śniatała, B.; Joseph, T.M.; Majtacz, J.; Piechota, G.; Li, X.; El-Gohary, F.A.; Saeb, M.R.; et al. Technological Solutions to Landfill Management: Towards Recovery of Biomethane and Carbon Neutrality. J. Environ. Manag. 2024, 354, 120414. [Google Scholar] [CrossRef]
  9. Al-Hazmi, H.E.; Maktabifard, M.; Grubba, D.; Majtacz, J.; Hassan, G.K.; Lu, X.; Piechota, G.; Mannina, G.; Bott, C.B.; Mąkinia, J. An Advanced Synergy of Partial Denitrification-Anammox for Optimizing Nitrogen Removal from Wastewater: A Review. Bioresour. Technol. 2023, 381, 129168. [Google Scholar] [CrossRef]
  10. Al-Hazmi, H.E.; Hassan, G.K.; Maktabifard, M.; Grubba, D.; Majtacz, J.; Mąkinia, J. Integrating Conventional Nitrogen Removal with Anammox in Wastewater Treatment Systems: Microbial Metabolism, Sustainability and Challenges. Environ. Res. 2022, 215, 114432. [Google Scholar] [CrossRef]
  11. Samsami, S.; Mohamadizaniani, M.; Sarrafzadeh, M.-H.; Rene, E.R.; Firoozbahr, M. Recent Advances in the Treatment of Dye-Containing Wastewater from Textile Industries: Overview and Perspectives. Process Saf. Environ. Prot. 2020, 143, 138–163. [Google Scholar] [CrossRef]
  12. Mohamed, R.M.; Afify, A.A.-M. Modified Ultrasonic Irradiation Reactor: Application on Produced Water Treatment. Egypt. J. Chem. 2023, 66, 443–451. [Google Scholar] [CrossRef]
  13. Gosavi, V.D.; Sharma, S. A General Review on Various Treatment Methods for Textile Wastewater. J. Environ. Sci. Comput. Sci. Eng. Technol. 2014, 3, 29–39. [Google Scholar]
  14. Al-Sayed, A.; Hellal, M.S.; Al-Shemy, M.T.; Hassan, G.K. Performance Evaluation of Submerged Membrane Bioreactor for Municipal Wastewater Treatment: Experimental Study and Model Validation with GPS-X Software Simulator. Water Environ. J. 2023, 37, 480–492. [Google Scholar] [CrossRef]
  15. El-kebeer, A.A.; Mahmoud, U.F.; Ismail, S.; Jalal, A.A.E.; Kowal, P.; Al-Hazmi, H.E.; Hassan, G.K. Maximizing Bio-Hydrogen and Energy Yields Obtained in a Self-Fermented Anaerobic Bioreactor by Screening of Different Sewage Sludge Pretreatment Methods. Processes 2024, 12, 118. [Google Scholar] [CrossRef]
  16. Hassan, G.; Alaneny, A.; Afify, A.; El-Liethy, M.A.; El-Gohary, F. Production of biofuels (H2&CH4) from food leftovers via dual-stage anaerobic digestion: Enhancement of bioenergy production and determination of metabolic fingerprinting of microbial communities. Egypt. J. Chem. 2021, 64, 4105–4115. [Google Scholar]
  17. Basha, C.A.; Selvakumar, K.V.; Prabhu, H.J.; Sivashanmugam, P.; Lee, C.W. Degradation Studies for Textile Reactive Dye by Combined Electrochemical, Microbial and Photocatalytic Methods. Sep. Purif. Technol. 2011, 79, 303–309. [Google Scholar] [CrossRef]
  18. Hassan, G.K.; Gad-Allah, T.A.; Badawy, M.I.; El-Gohary, F.A. Remediation of Ammonia-Stripped Sanitary Landfill Leachate by Integrated Heterogeneous Fenton Process and Aerobic Biological Methods. Int. J. Environ. Anal. Chem. 2023, 103, 7287–7300. [Google Scholar] [CrossRef]
  19. Wang, J.L.; Xu, L.J. Advanced Oxidation Processes for Wastewater Treatment: Formation of Hydroxyl Radical and Application. Crit. Rev. Environ. Sci. Technol. 2012, 42, 251–325. [Google Scholar] [CrossRef]
  20. Xu, M.; Wu, C.; Zhou, Y. Advancements in the Fenton Process for Wastewater Treatment. Adv. Oxid. Process 2020, 61, 61–77. [Google Scholar]
  21. Hansson, H.; Kaczala, F.; Marques, M.; Hogland, W. Photo-Fenton and Fenton Oxidation of Recalcitrant Industrial Wastewater Using Nanoscale Zero-Valent Iron. Int. J. Photoenergy 2012, 2012, 531076. [Google Scholar] [CrossRef]
  22. Qiu, M.; Huang, C. A Comparative Study of Degradation of the Azo Dye CI Acid Blue 9 by Fenton and Photo-Fenton Oxidation. Desalin. Water Treat. 2010, 24, 273–277. [Google Scholar] [CrossRef]
  23. El-Gawad, H.A.; Ebrahiem, E.E.; Ghaly, M.Y.; Afify, A.A.; Mohamed, R.M. An Application of Advanced Oxidation Process on Industrial Crude Oily Wastewater Treatment. Sci. Rep. 2023, 13, 3420. [Google Scholar] [CrossRef] [PubMed]
  24. Benassi, J.C.; Sánchez, A.A.C.; da Costa, S.A.; da Costa, S.M. Evaluation of Color Removal Efficiencies and Kinetic Parameters of Fenton (H2O2/Fe2+) and Photo-Fenton (H2O2/Fe2+/UV) Processes in the Treatment of a Textile Wastewater Containing Indigo Blue/Avaliação Da Eficiência de Remoção de Cor e Parâmetros Cinético. Braz. J. Dev. 2021, 7, 102327–102347. [Google Scholar] [CrossRef]
  25. Hafezi, M.; Mozaffarian, M.; Jafarikojour, M.; Mohseni, M.; Dabir, B. Application of Impinging Jet Atomization in UV/H2O2 Reactor Operation: Design, Evaluation, and Optimization. J. Photochem. Photobiol. A Chem. 2020, 389, 112198. [Google Scholar] [CrossRef]
  26. Yu, X.; Somoza-Tornos, A.; Graells, M.; Pérez-Moya, M. An Experimental Approach to the Optimization of the Dosage of Hydrogen Peroxide for Fenton and Photo-Fenton Processes. Sci. Total Environ. 2020, 743, 140402. [Google Scholar] [CrossRef] [PubMed]
  27. Patil, A.D.; Raut, P.D. Treatment of Textile Wastewater by Fenton’s Process as a Advanced Oxidation Process. IOSR J. Environ. Sci. Toxicol. Food. Technol 2014, 8, 29–32. [Google Scholar] [CrossRef]
  28. Ilhan, F.; Ulucan-Altuntas, K.; Dogan, C.; Kurt, U. Treatability of Raw Textile Wastewater Using Fenton Process and Its Comparison with Chemical Coagulation. Desalin. Water Treat 2019, 162, 142–148. [Google Scholar] [CrossRef]
  29. Nidheesh, P.V.; Gandhimathi, R. Electro Fenton Oxidation for the Removal of Rhodamine B from Aqueous Solution in a Bubble Column Reactor under Continuous Mode. Desalin. Water Treat. 2015, 55, 263–271. [Google Scholar] [CrossRef]
  30. Moghadam, F.; Kohbanan, N.N. Removal of Reactive Blue 19 Dye Using Fenton from Aqueous Solution. Avicenna J. Environ. Health Eng. 2018, 5, 50–55. [Google Scholar] [CrossRef]
  31. Sreeja, P.H.; Sosamony, K.J. A Comparative Study of Homogeneous and Heterogeneous Photo-Fenton Process for Textile Wastewater Treatment. Procedia Technol. 2016, 24, 217–223. [Google Scholar] [CrossRef]
  32. Metin, S.; Çifçi, D.İ. Chemical Industry Wastewater Treatment by Coagulation Combined with Fenton and Photo-Fenton Processes. J. Chem. Technol. Biotechnol. 2023, 98, 1158–1165. [Google Scholar] [CrossRef]
  33. Azbar, N.; Yonar, T.; Kestioglu, K. Comparison of Various Advanced Oxidation Processes and Chemical Treatment Methods for COD and Color Removal from a Polyester and Acetate Fiber Dyeing Effluent. Chemosphere 2004, 55, 35–43. [Google Scholar] [CrossRef]
  34. Çalık, Ç.; Çifçi, D.İ. Comparison of Kinetics and Costs of Fenton and Photo-Fenton Processes Used for the Treatment of a Textile Industry Wastewater. J. Environ. Manag. 2022, 304, 114234. [Google Scholar] [CrossRef]
  35. Rubio-Clemente, A.; Chica, E.; Peñuela, G.A. Petrochemical Wastewater Treatment by Photo-Fenton Process. Water Air Soil Pollut. 2015, 226, 62. [Google Scholar] [CrossRef]
  36. Wali, F.K.M. Color Removal and COD Reduction of Dyeing Bath Wastewater by Fenton Reaction. Int. J. Waste Resour 2015, 5, 171. [Google Scholar]
  37. Sajjad, T.A.; Al-zobai, K.M.M. Investigation the Effect of Intensity and Direction of Light on the Removal of Reactive Blue Dye from Simulated Wastewater Using Photo-Fenton Oxidation under UV Irradiation: Batch and Continuous Methods. IOP Conf. Ser. Mater. Sci. Eng. 2020, 928, 022132. [Google Scholar] [CrossRef]
  38. Alalm, M.G.; Tawfik, A.; Ookawara, S. Degradation of Four Pharmaceuticals by Solar Photo-Fenton Process: Kinetics and Costs Estimation. J. Environ. Chem. Eng. 2015, 3, 46–51. [Google Scholar] [CrossRef]
  39. Wang, X.S.; Lu, Z.P.; Miao, H.H.; He, W.; Shen, H.L. Kinetics of Pb (II) Adsorption on Black Carbon Derived from Wheat Residue. Chem. Eng. J. 2011, 166, 986–993. [Google Scholar] [CrossRef]
  40. Alshamsi, H.A.H.; Shdood, A. UV-ClO2 Assisted Decolorization of Methylene Blue. J. Chem. Pharm. Res. 2015, 7, 36–44. [Google Scholar]
  41. Punjabi, P.B.; Ameta, R.; Kumar, A.; Jain, M. Visible Light Induced Photocatalytic Degradation of Some Xanthene Dyes Using Immobilized Anthracene. Bull. Chem. Soc. Ethiop. 2008, 22, 361–368. [Google Scholar] [CrossRef]
  42. Tawfik, A.; Al-sayed, A.; Hassan, G.K.; Nasr, M.; El-Shafai, S.A.; Alhajeri, N.S.; Khan, M.S.; Akhtar, M.S.; Ahmad, Z.; Rojas, P.; et al. Electron Donor Addition for Stimulating the Microbial Degradation of 1,4 Dioxane by Sequential Batch Membrane Bioreactor: A Techno-Economic Approach. Chemosphere 2022, 306, 135580. [Google Scholar] [CrossRef]
  43. El-Khateeb, M.; Hassan, G.K.; El-Liethy, M.A.; El-Khatib, K.M.; Abdel-Shafy, H.I.; Hu, A.; Gad, M. Sustainable municipal wastewater treatment using an innovative integrated compact unit: Microbial communities, parasite removal, and techno-economic analysis. Ann. Microbiol. 2023, 73, 35. [Google Scholar] [CrossRef]
Figure 1. Schematic experimental setup for the proposed current study (left) and the photographic picture (right).
Water 16 01327 g001
Figure 2. Effect of irradiation time on COD and color removals in homogeneous photo-catalytic oxidation by Fenton oxidation [pH = 3, catalyst dose = 0.6 mg/L, H2O2 = 1.5 mL/L, 20 mL/min flow rate, and initial dye concentration = 0.75 gm/L].
Water 16 01327 g002
Figure 3. Effect of catalyst dose on color removal percent in homogeneous photo-catalytic oxidation by Fenton oxidation [pH = 3, reaction time = 30 min, H2O2 = 1.5 mL/L, 20 mL/min flow rate, and initial dye concentration = 0.75 gm/L].
Water 16 01327 g003
Figure 4. Effect of hydrogen peroxide amount on the color removal percent in homogeneous photo-catalytic oxidation by Fenton oxidation [pH = 3, catalyst dose = 0.6 gm/L, reaction time = 30 min, 20 mL/min flow rate, and initial dye concentration = 0.75 gm/L].
Water 16 01327 g004
Figure 5. Experimentally determined COD and color removal % with the expected values for the Fenton process.
Water 16 01327 g005
Figure 6. Effect of irradiation time on COD and color removal % in homogeneous photo-catalytic oxidation by photo-Fenton oxidation [pH = 3, catalyst dose = 0.4 mg/L, H2O2 = 1 mL/L, 20 mL/min flow rate, initial dye concentration = 0.75 gm/L, and 75-watt light intensity].
Water 16 01327 g006
Figure 7. Effect of photocatalyst dose on color removal % in homogeneous photo-catalytic oxidation by photo-Fenton oxidation [pH = 3, reaction time = 30 min, H2O2 = 1 mL/L, 20 mL/min flow rate, initial dye concentration = 0.75 gm/L, and 75-watt light intensity].
Water 16 01327 g007
Figure 8. Effect of hydrogen peroxide amount on color removal % in homogeneous photo-catalytic oxidation by photo-Fenton oxidation [pH = 3, catalyst dose = 0.4 gm/L, reaction time = 30 min, 20 mL/min flow rate, initial dye concentration = 0.75 gm/L, and 75-watt light intensity].
Water 16 01327 g008
Figure 9. Effect of wastewater flow rate on the COD removal percent and BOD5/COD ratio in homogeneous photo-catalytic oxidation by photo-Fenton oxidation [pH = 3, catalyst dose = 0.4 gm/L, reaction time = 60 min, H2O2 = 1 mL/L, 75-watt UV intensity, and initial dye concentration = 0.75 gm/L].
Water 16 01327 g009
Figure 10. Effect of the UV intensity on COD and color removal % in the homogeneous photo-catalytic oxidation [pH = 3, H2O2 = l mL/L, catalyst dose = 0.4 mg/L, reaction time = 30 min, 20 mL/min flow rate, and initial dye concentration = 0.75 gm/L].
Water 16 01327 g010
Figure 11. Experimentally determined COD and color removal % with the expected values for the photo-Fenton process.
Water 16 01327 g011
Figure 12. Comparison between % color and COD removal by applying several techniques [pH = 3, reaction time = 30 min, Fe (II) = 0.4 gm/L, activated carbon = 0.4 gm/L, initial dye concentration = 0.75 gm/L, 20 mL/min flow rate, and H2O2 = 1 mL/L].
Water 16 01327 g012
Table 1. Relationship between ideal doses used for the treatment of wastewater with cost (in USD).
MaterialsIdeal Dose/LCost for 1 L Treatment
FentonPhoto-FentonFentonPhoto-Fenton
Ferrous sulphate, Kg0.6 gm/L0.4 gm/L0.02250.0151
Hydrogen peroxide 30%, L1.5 mL/L1 mL/L1.20.83
Sulfuric acid 98%, L0.05 mL/L0.05 mL/L1.51.5
Sodium hydroxide 48%, Kg0.0213 gm0.0213 gm0.00930.00935
Total cost of materials USD/L 2.752.35
Total cost of materials USD/L 5.484.7
Disclaimer/Publisher’s Note: The statements, opinions and data contained in all publications are solely those of the individual author(s) and contributor(s) and not of MDPI and/or the editor(s). MDPI and/or the editor(s) disclaim responsibility for any injury to people or property resulting from any ideas, methods, instructions or products referred to in the content.

