Article

Assessing Climate-Change-Driven Impacts on Water Scarcity: A Case Study of Low-Flow Dynamics in the Lower Kalu River Basin, Sri Lanka

by
Rangika Fernando
1,2,
Harsha Ratnasooriya
1,3,
Janaka Bamunawala
4,
Jeewanthi Sirisena
5,
Merenchi Galappaththige Nipuni Odara
6,*,
Luminda Gunawardhana
1,3 and
Lalith Rajapakse
1,3
1
UNESCO-Madanjeeth Singh Centre for South Asia Water Management, University of Moratuwa, Moratuwa 10400, Sri Lanka
2
National Water Supply and Drainage Board, Ratmalana 10390, Sri Lanka
3
Department of Civil Engineering, University of Moratuwa, Moratuwa 10400, Sri Lanka
4
Department of Civil and Environmental Engineering, Graduate School of Engineering, Tohoku University, Sendai 980-8579, Miyagi, Japan
5
Climate Service Center Germany (GERICS), Helmholtz-Zentrum Hereon, Fischertwiete 1, 20095 Hamburg, Germany
6
School of Engineering, University of Warwick, Coventry CV4 7AL, UK
*
Author to whom correspondence should be addressed.
Water 2024, 16(10), 1317; https://doi.org/10.3390/w16101317
Submission received: 15 March 2024 / Revised: 22 April 2024 / Accepted: 29 April 2024 / Published: 7 May 2024
(This article belongs to the Section Water and Climate Change)

Abstract

:
The adverse impacts of climate change are becoming more frequent and severe worldwide, and Sri Lanka has been identified as one of the most severely affected countries. Hence, it is vital to understand the plausible climate-change-driven impacts on water resources to ensure water security and socio-economic well-being. This study presents novel assessments on low-flow dynamics along the lower Kalu River Basin, Sri Lanka, and water availability during the dry spells of the 2030–2060 period. Bias-corrected daily precipitation projections of a high resolution (25 km × 25 km) NCC-NORESM1-M regional climate model is used here to force a calibrated HEC-HMS hydrological model to project catchment discharge during the future period considered under the two end-member Representative Concentration Pathways (i.e., RCP 2.6 and RCP 8.5). Our results show that the study area (i.e., Kuda Ganga sub-basin) may become warmer (in non-monsoonal periods) and wetter (in monsoon season) under both scenarios during the near future (2030–2040) when compared to the baseline period (1976–2005) considered. Consequently, the streamflow may reduce, making it the decade with the largest water deficit within the time horizon. The subsequent deficit volume assessment for the 2031–2040 period shows a probable water shortage (~5 million m3) under the RCP 2.6 scenario, which may last for ~47 days with an average daily intensity of 105,000 m3. Our results highlight the need of incorporating climate-change-driven impacts in water resources management plans to ensure water security.

1. Introduction

Throughout history, mankind has confronted countless difficulties due to varied climatic conditions [1], and foreshadowed climate change projections show that the 21st century is most likely to be even more challenging. Thus, human well-being in the future is closely linked with the ability to manage risks related to climate variability [2]. In this regard, climate services are needed by the decision-makers to support the adaptation/mitigation activities against climate-change-driven impacts such as depleting water resources, droughts, heat waves, floods, and coastal erosion [3,4,5,6], in which sufficient, safe, and convenient water and sanitation services are fundamental prerequisites for societal advancement and individual well-being [5,7,8]. These services are indispensable for fostering economic development, as they underpin various industries and agricultural practices reliant on water resources. Moreover, access to clean water and adequate sanitation is pivotal in safeguarding public health by mitigating the spread of waterborne diseases and reducing morbidity rates [8,9], and ensuring the availability of safe drinking water, sanitation, and hygiene is a UN Sustainable Development Goal [10].
Approximately half the global population presently encounters significant water scarcity during certain periods each year [2]. Climate change and anthropogenic activities, such as urbanisation and change in land use [11], transpire as primary driving forces behind the changes in river basin hydrology [12], posing significant challenges in meeting future water demand. Potential changes in rainfall patterns, saline water intrusion into coastal aquifers as the sea water level rises, and increased evaporation rates (driven by rising temperatures) are among the main climate-change-driven impacts that affect freshwater availability [13,14]. Utilising the recent Intragovernmental Panel on Climate Change’s (IPCC) Shared Socio-economic Pathways (SSP), Koutroulis et al. [15] demonstrate that the population facing intensified vulnerability to freshwater scarcity varies significantly depending on the extent of global warming and the level of socio-economic development. According to their estimates, the number of people affected by global water scarcity (by the end of the 21st century) may vary between one billion (under SSP5-8.5 at 4.0 °C) and three billion (under SSP3-7.0 at 4.0 °C). The rapid rise in urbanisation imposes an additional stress on the water balance of river basins, which is attributable to population growth, economic advancement, and shifts in lifestyle. The anticipated rise in water scarcity among the global urban population is expected to surge from 933 million individuals (representing one-third of the global urban population) in 2016 to a range between 1.7 and 2.4 billion people (constituting nearly half of the global urban population) by 2050 [16]. Due to diverse climatic conditions and socio-economic developments, impacts of future water scarcity may vary geographically, fluctuating from country to country and region to region. According to the World Bank [17], climate-change-driven water scarcity may impact South Asian countries by as much as 6% of their GDP by 2050.
Based on observations between 1985 and 2017, Shelton et al. [18] showed that the diurnal temperature range in Sri Lanka is decreasing by around 0.14–0.18 °C/decade across different climate zones. Dissanayaka and Rajapakse [19] showed that the temperature and precipitation extremes are rising while the annual average precipitation in the wet region is declining over the 2020–2050 period. Increases in rainfall variability with frequent heavy rainfall and prolonged dry periods are projected to be common due to climate change, increasing the risks of severe floods and droughts in Sri Lanka. Using historical temperature and precipitation data, Marambe et al. [20] and Punyawardena et al. [21] also stated that the climate pattern in Sri Lanka would be getting polarised during the 21st century as the wet zone areas become wetter and dry zones become drier.
At present, the drinking water requirement in Sri Lanka is fulfilled by different sources. In 2015, the contributions from different water resources were identified as pipe-bone water (~49%), protected wells (~36%), reservoirs or rivers (~6%), unprotected wells (~4%), tube wells (~3%), and rainwater harvesting [22]. Efforts are currently underway to enhance water supply and sanitation services through urban and semi-urban schemes. Consequently, the projected water supply demand in the country is expected to increase by 9% and 15%, respectively, in 2030 and 2050, compared to the demand recorded in 2020 [23]. Densely populated urban centres will necessitate more water than the national average demand. For instance, the water demand in Colombo District is forecasted to escalate by 16% and 22% by 2030 and 2050, respectively, compared to the demand in 2020. An endeavour to expand portable water coverage may encounter a significant challenge when choosing a water intake and designing a new treatment plant, as the potential increase in basin-wide droughts will result in low-flow regimes and seasonal variabilities of river discharge [24].
General Circulation Models (GCMs) and Regional Climate Models (RCMs) are crucial in projecting future water availability within hydrological studies. The GCMs, however, face significant challenges when applied to hydrological studies in hilly areas of small islands like Sri Lanka. One of the primary issues is the coarse spatial resolution of GCMs, which often fails to capture the complex terrain characteristics of hilly regions like the Kalu River Basin, leading to inaccuracies in precipitation and temperature projections [25]. Additionally, GCMs often fail to accurately represent local climate phenomena, such as monsoonal patterns and orographic effects, which are crucial for understanding hydrological processes within regions with complex topographic features [26]. In contrast, Regional Climate Models offer several advantages in such contexts. RCMs provide higher spatial resolution, allowing a more accurate representation of topographic features and local climate dynamics crucial for hilly areas [27]. For example, Azmat et al. [28] concluded that COordinated Regional Climate Downscaling EXperiment-South Asia (i.e., CORDEX-SA) simulations substantially improve the capturing of seasonal changes in climate variables over the Indus Basin. In their recent studies, Sirisena et al. [12,29] used three RCMs from the same CORDEX-SA experiment to estimate climate change impacts on sediment load generation in the Kalu River Basin in Sri Lanka.
In the wake of competing water demands and multiple pressures posed by climate variability and anthropogenic activities mentioned above, understanding future water resource availability poses a critical scientific challenge and a broader societal need. Therefore, this study aims to project and assess the drinking water extraction capacity during the low-flow periods affected by climate change by taking a case study of the Kolemodara intake located in the Kalu River basin, Sri Lanka. Here, future projections were undertaken using RCM data from the CORDEX-SA experiment, offering the highest spatial resolution presently accessible. Future rainfall variation projections were incorporated into a calibrated and validated hydrological model to project streamflow regimes, facilitating an understanding of the forthcoming alterations in the low-flow regime within the lower Kalu River Basin.

2. Materials and Methods

The research methodology adopted in this study is illustrated in Figure 1, and the sub-sections provide details of the study area and the main steps involved in numerical model development and applications. Since this study is focused on assessing future dry-flow regimes along the lower Kalu River Basin, during the numerical model development, attention was given to simulating the low-flow conditions with acceptable accuracy.

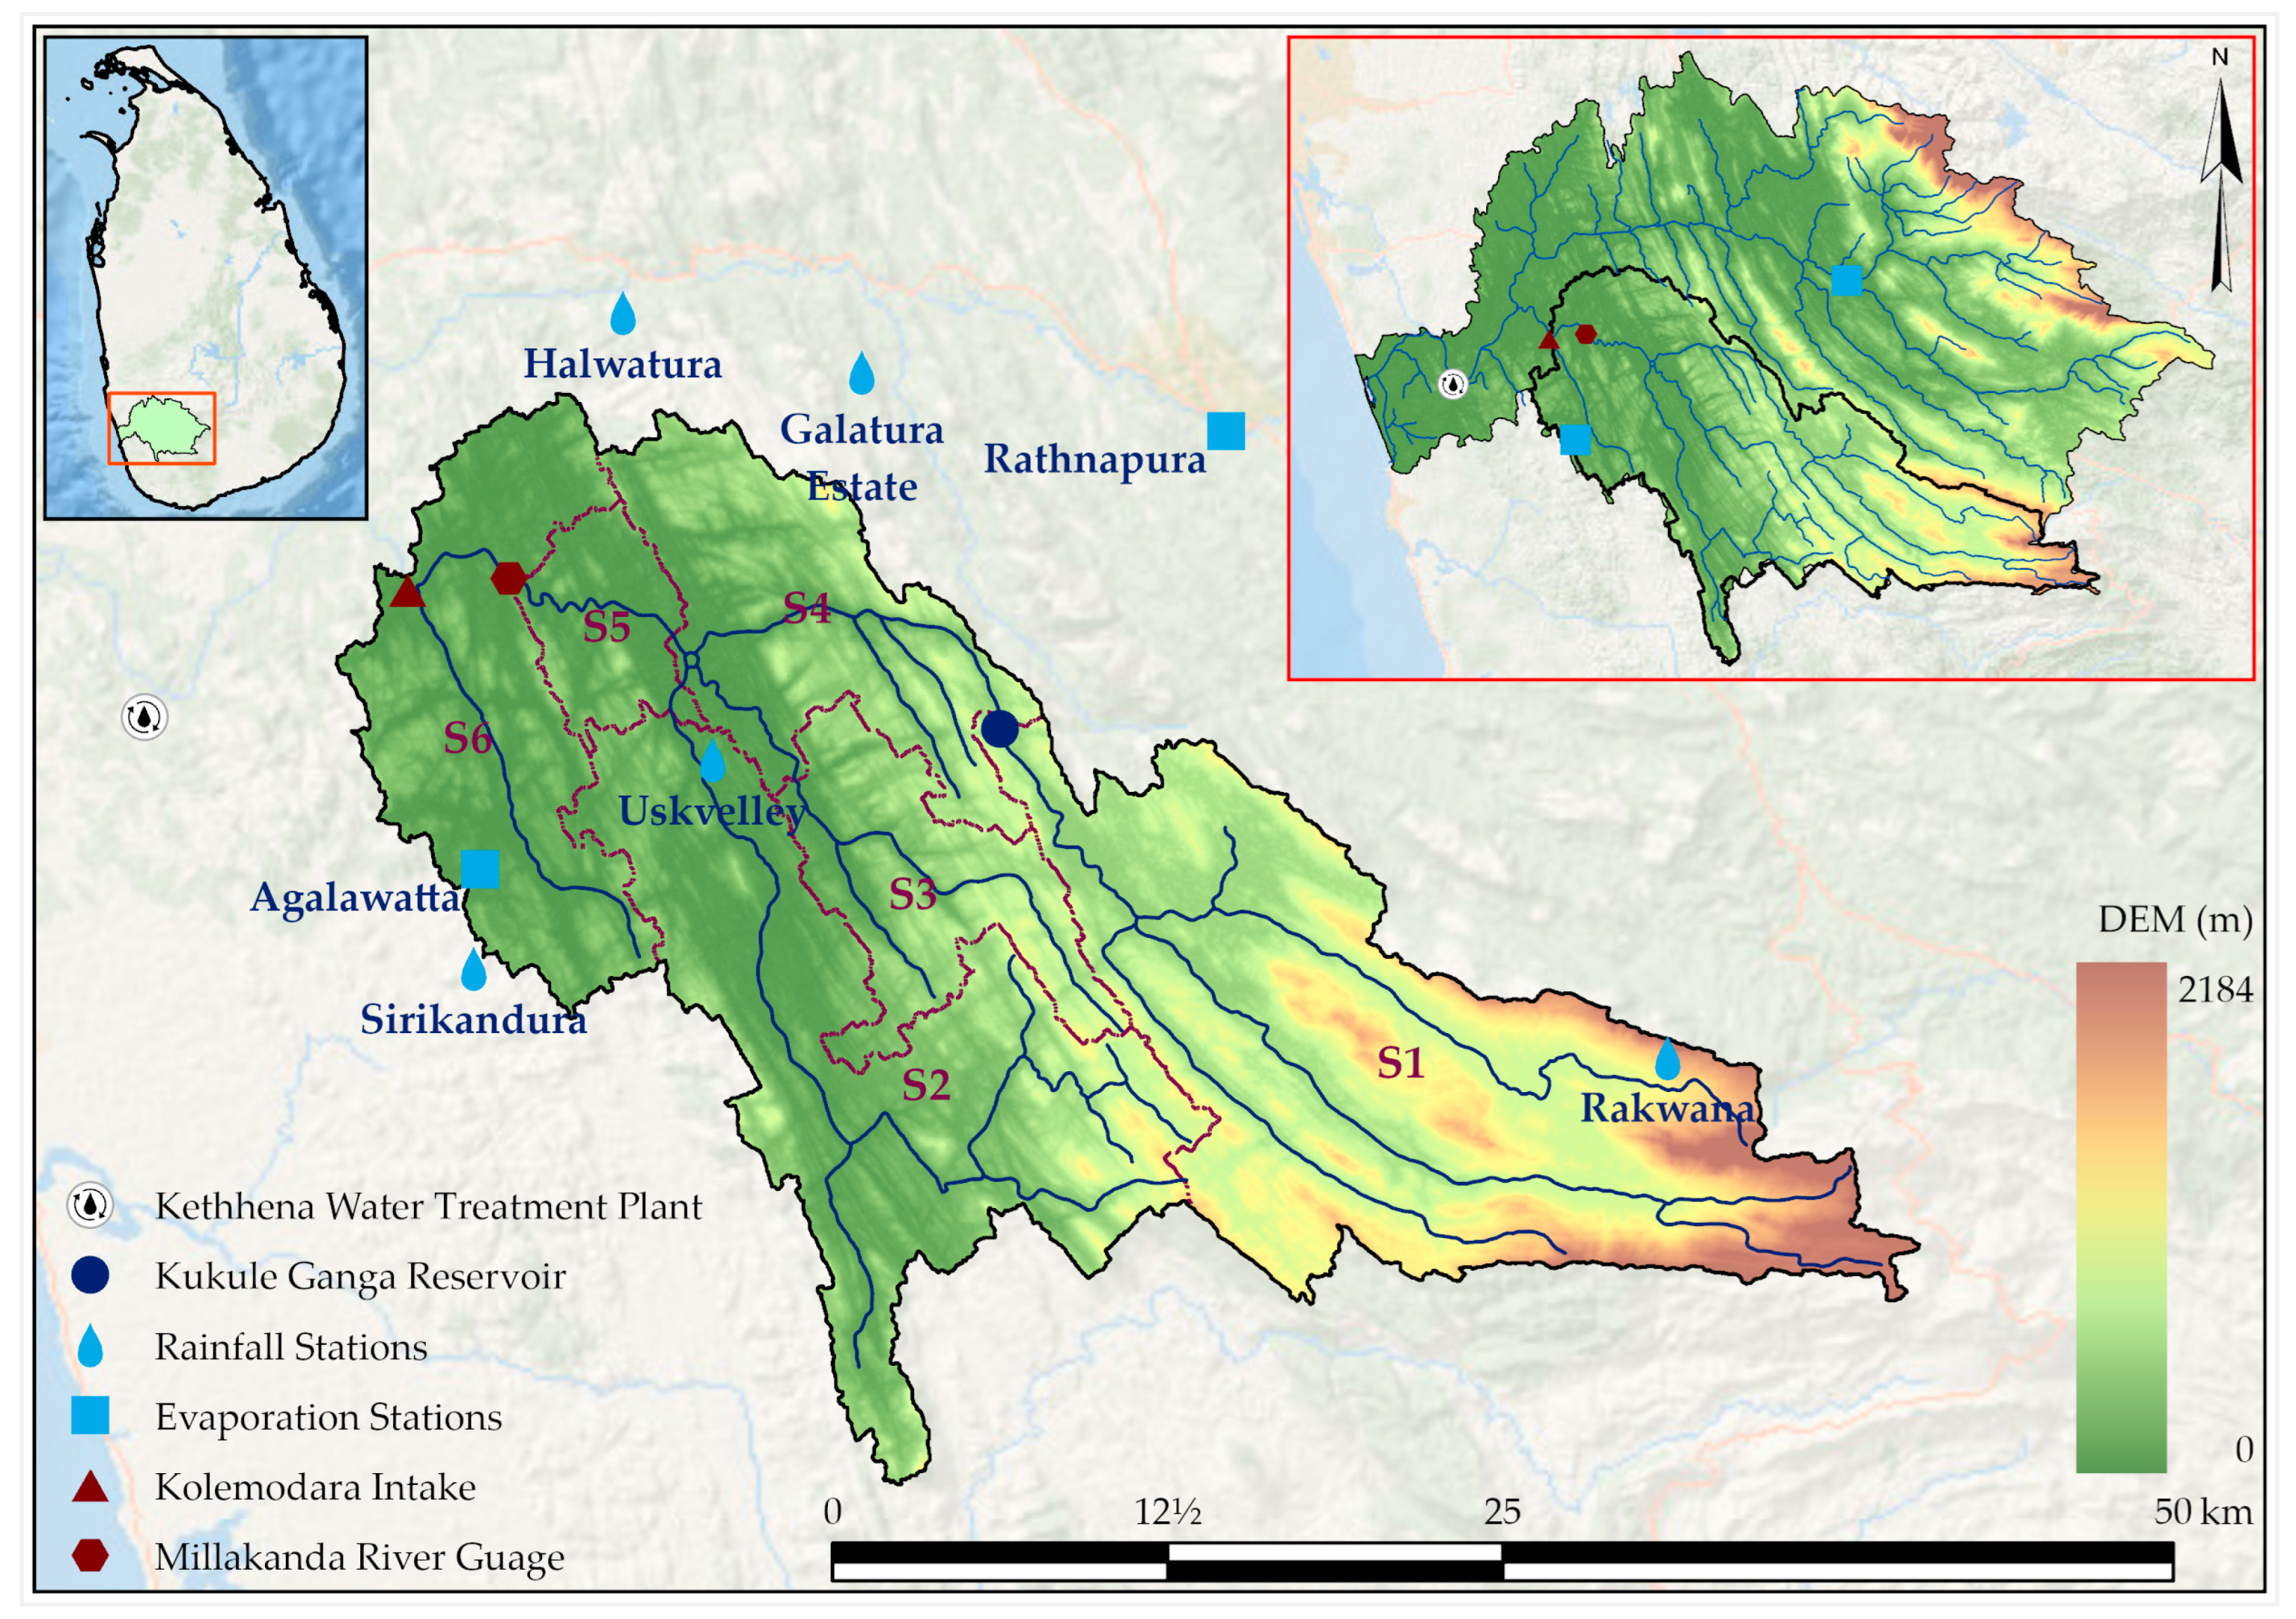
2.1. Study Area and Input Data

The Kalu River is the third-longest in Sri Lanka yet discharges the largest annual volume of water into the sea (~4000 million cubic meters (i.e., MCM)) as the basin is entirely found within the wet zone of the country. The average annual rainfall in the basin is ~4000 mm, which ranges from 6000 mm in mountainous regions to 2000 mm in the low plain areas. The Kalu River is the primary source of water for the Thebuwana water intake, operated by the National Water Supply and Drainage Board (NWSDB), which supplies treated water to the southern half of the Kalutara District through the Kethhena Water Treatment Plant (WTP). As a solution for the salinity intrusion to Thebuwana intake (located at Kalu Ganga around 17 km upstream of the river’s outfall; Figure 2) during the dry weather periods (i.e., February, March, and August), NWSDB has constructed a new water intake at Kolemodara in Kuda Ganga, a tributary of the Kalu River. This location has been selected considering the recorded minimum daily average discharges at the Millakanda river gauging station during 1991–2008 and water quality conditions during dry periods at the proposed intake (capacity 75,000 m3/day to cater for the demand till 2030).
Our study area lies in the Kuda Ganga, one of the main tributaries of the Kalu River, located in the southern part of the Kalu River Basin (KRB) (Figure 2). The watershed area of the Kolemodara intake is ~916 km2. The study used several spatial and temporal datasets (Table 1) to numerically simulate the flow regimes along the lower Kuda Ganga river basin while considering the Kolemodara intake as the primary outlet (Figure 2). Digital Elevation Model (DEM) terrain data with 30 m resolution from the Survey Department of Sri Lanka was used to develop an HEC-HMS model. About one-third of the area is covered with unclassified forest, whereas rubber (~23.2%), chena (~12.9%), homesteads/garden (~12.9%), scrubland (~8%), and paddy (~6%) are the other dominant land-use types found in this area. The soil in the Kolemodara sub-basin consists of three types, i.e., Red Yellow podzolic soils, steeply dissected, hilly, and rolling terrain (~84%), Red Yellow podzolic soils with prominent A1 or semi-prominent A1 (~13%), and Alluvial soils of variable texture and drainage; flat terrain (~3%).
Observed data from four rain gauging stations (viz., Galathura Estate, Sirikandura, Rakwana (Depadena), and Usk Valley) and two evaporation stations at Ratnapura and Agalawatta were used for this study (Figure 2). Daily rainfall data between 1976 and 2015 and monthly evaporation data from 2001 to 2015 were used for climate data bias correction and HEC-HMS hydrological model simulation, while Millakanda river gauging station data were used for model calibration and validation. The Kukule Ganga power plant data (i.e., reservoir characteristics, outflows, and operations) were also collected and used accordingly in numerical simulations. The climate projections and the datasets used are summarised in Section 2.4.

2.2. Data Analysis and Pre-Processing

Visual checks and single and double mass curve analyses were undertaken to determine rainfall and streamflow data inconsistencies. Missing rainfall data were filled in to obtain the time series required for rainfall-runoff modelling. The percentage of missing rainfall and streamflow data during the model simulation period (i.e., October 2005 to September 2020) is less than 6% for all stations. In this study, two methods were used to fill the missing data [30]. The arithmetic average method (1) was used when the average annual rainfall of the station with missing data was within 10% of the average annual rainfall at the adjoining stations. The normal ratio method (2) was used if any index station has an annual rainfall of magnitude that varies more than 10% of the interpolation station. Accordingly, missing rainfall data ( P x ) of the station X are filled by the ‘m’ number of nearby stations using:
P x = 1 m i = 1 m P i
P x = 1 m i = 1 m N x N i × P i
where P x is the rainfall under consideration, P 1 , P 2 , …, and P m are rainfall corresponding to ‘m’ neighbouring stations, N 1 , N 2 , …, and N m are average annual precipitations at each of the stations, including station X.

2.3. Hydrological Model Setup, Calibration, and Validation

The HEC-HMS hydrological model [31] was set up as a six-basin semi-distributed model with Kolemodara Intake as the primary outlet (i.e., sink) and Millakanda Junction as the calibration point (Figure 2). The model was simulated as a continuous model for a single water cycle. The model comprises several sub-models: canopy storage, surface storage, loss, transform, base flow, and channel routing. The detailed basin components, parameters, and estimation methods are presented in Table 2. River flow regulations caused by the Kukule Ganga run-of-the-river powerplant operation were also considered, as this study mainly focuses on the dry flow period. Based on the reservoir’s elevation–capacity–discharge relationship, Kukule Ganga powerplant discharges (data from Ceylon Electricity Board, Ratnapura, Sri Lanka) were added to the model.
The model calibration period was selected after the Kukule Ganga power plant started operating. The model was calibrated and validated considering separate water cycles (i.e., October to September) having more extended dry periods as it is necessary to emphasise the capturing dry periods more accurately. Water cycles with longer deficit durations related to the flow with a 90% probability of exceedance flow of the 10th percentile (Q10) were selected as calibration and validation events from October 2005 to October 2015. The observed streamflow’s seven-day moving average time series was used to obtain deficit durations to avoid dividing a lengthy deficit period into short durations. Two and three continuous water cycles between October 2005 and September 2015 were selected for calibration (2006/2007 and 2011/2012) and validation (2008/2009, 2009/2010, and 2013/2014), respectively, and the model was evaluated for continuous simulation during the same period. Simulated flow data during calibration were evaluated based on several objective functions, including the Mean Ration of Absolute Error (MRAE). This objective function is suggested by the World Meteorological Organization [32] and has been widely used in the hydrologic modelling of Sri Lankan River Basins (e.g., [33,34,35,36,37,38]). Further, the goodness of fit of the simulated runoff series of calibration and validation was evaluated using the Root Mean Square Error (RMSE), the Percentage Bias (PBIAS), and relative Nash–Sutcliffe (NSErel). The optimal parameter values used in this study are summarised in Table 2.

2.4. Climate Projections and Bias Correction

This study utilises finer-resolution RCM data capable of capturing the monsoon precipitation signal [12,29]. The hindcasted precipitation data for the 1976–2005 baseline period and projections for the next design horizon (2031–2060) were derived from the CORDEX dataset for South Asia under ICTP-RegCM4-7 simulations based on three GCMs, NCC-NORESM1-M, MPI-M-MPI-ESM-MR, and MIROC-MIROC5 (WAS-22 domain with 25 km × 25 km spatial resolution) from the CMIP5 ensemble. These RCM data have been successfully used in other studies (e.g., Sirisena et al. [29]) for hydrological simulations in the Kalu River Basin, thus providing confidence in selecting the same for this study.
Observed precipitation data from the baseline period (1976–2005) were used in the Mean-Based method to eliminate biases in RCM data. Furthermore, different indices of dry-spell characteristics and statistical measures such as the maximum, mean, and standard deviation of dry spell length across the entire data period; the 99th, 95th, and 90th percentiles of dry spell length of the two data sets (i.e., observed and RCM) were compared for the baseline period (1976–2005).

2.5. Streamflow under Climate Change Scenarios

Biased corrected projected precipitation data were used to force the calibrated HEC-HMS hydrological model to obtain simulated streamflow at the Kolemodara intake for the next 30-year design horizon 2031 to 2060 under two end-member scenarios (viz., RCP 2.6 and RCP 8.5). Several low-flow indices were used to assess the low-flow dynamics of the study area. The relative differences in the low-flow indices were analysed relative to the model simulations of the 15-year base period (i.e., from 2005 to 2020). Since the hindcasts of RCM data are unavailable for this period, the observed precipitation was used to simulate the base period’s streamflow series.
The projected streamflow based on the RCM inputs was compared against future water extraction requirements. Several low-flow indices, including the median discharge (Q50), 10th percentile discharge (Q10), 7-day Mean Annual Minima (MAM7), 30-day Mean Annual Minima (MAM30), and the Baseflow index (BFI, Equation (3)) were used to assess the low-flow dynamics during the 2031–2060 period. Those indices were used by Sapač et al. [39] in their study to investigate low-flow conditions concerning climate change projections. Further, the low-flow deficit analysis parameters such as deficit duration, deficit volume, and intensity were also used in this study to determine the future variability of low-flow regimes. We compared the projected changes in these low flow indices in the design horizon (2030–2060) with the baseline period (2005–2020) under each RCP scenario.
B F I = B a s e f l o w T o t a l   S t r e a m f l o w

2.6. Determination of Low-Flow Threshold for Water Deficit Analysis

The present intake capacity at the Kolemodara intake is 75,000 m3/day (i.e., 0.9 m3/s). According to the Masterplan of NWSDB [23], the additional intake capacity requirement to fulfil the region’s future water demands is estimated to be 50,000 m3/day (0.6 m3/s). Therefore, the total water extraction requirement for the next design horizon would be 1.5 m3/s.
The Kukule Ganga (Figure 2) run-of-the-river powerplant hydropower generation project maintains an environmental flow of 0.5 m3/s. The reservoir has a catchment area of 322 km2, whereas the catchment area corresponding to the Kolemodara intake is 916 km2. Assuming similar ecological conditions downstream of the Millakanda and Kolemodara outlets, an equivalent environmental flow of ~1.5 m3/s can be proportionate to the respective watershed areas. Consequently, a threshold value of 3.0 m3/s was established for low-flow analysis by summing up the respective water extraction and environmental flow requirements.

3. Results

The content of this section is structured into four sub-sections. The first sub-section shows the HEC-HMS model calibration and validation results. The following sub-section presents the bias-correction results of the RCM data, followed by the outcome of the projected precipitation analysis. The last sub-section presents the projected variations in streamflow and deficit volume analysis under several sub-categories.

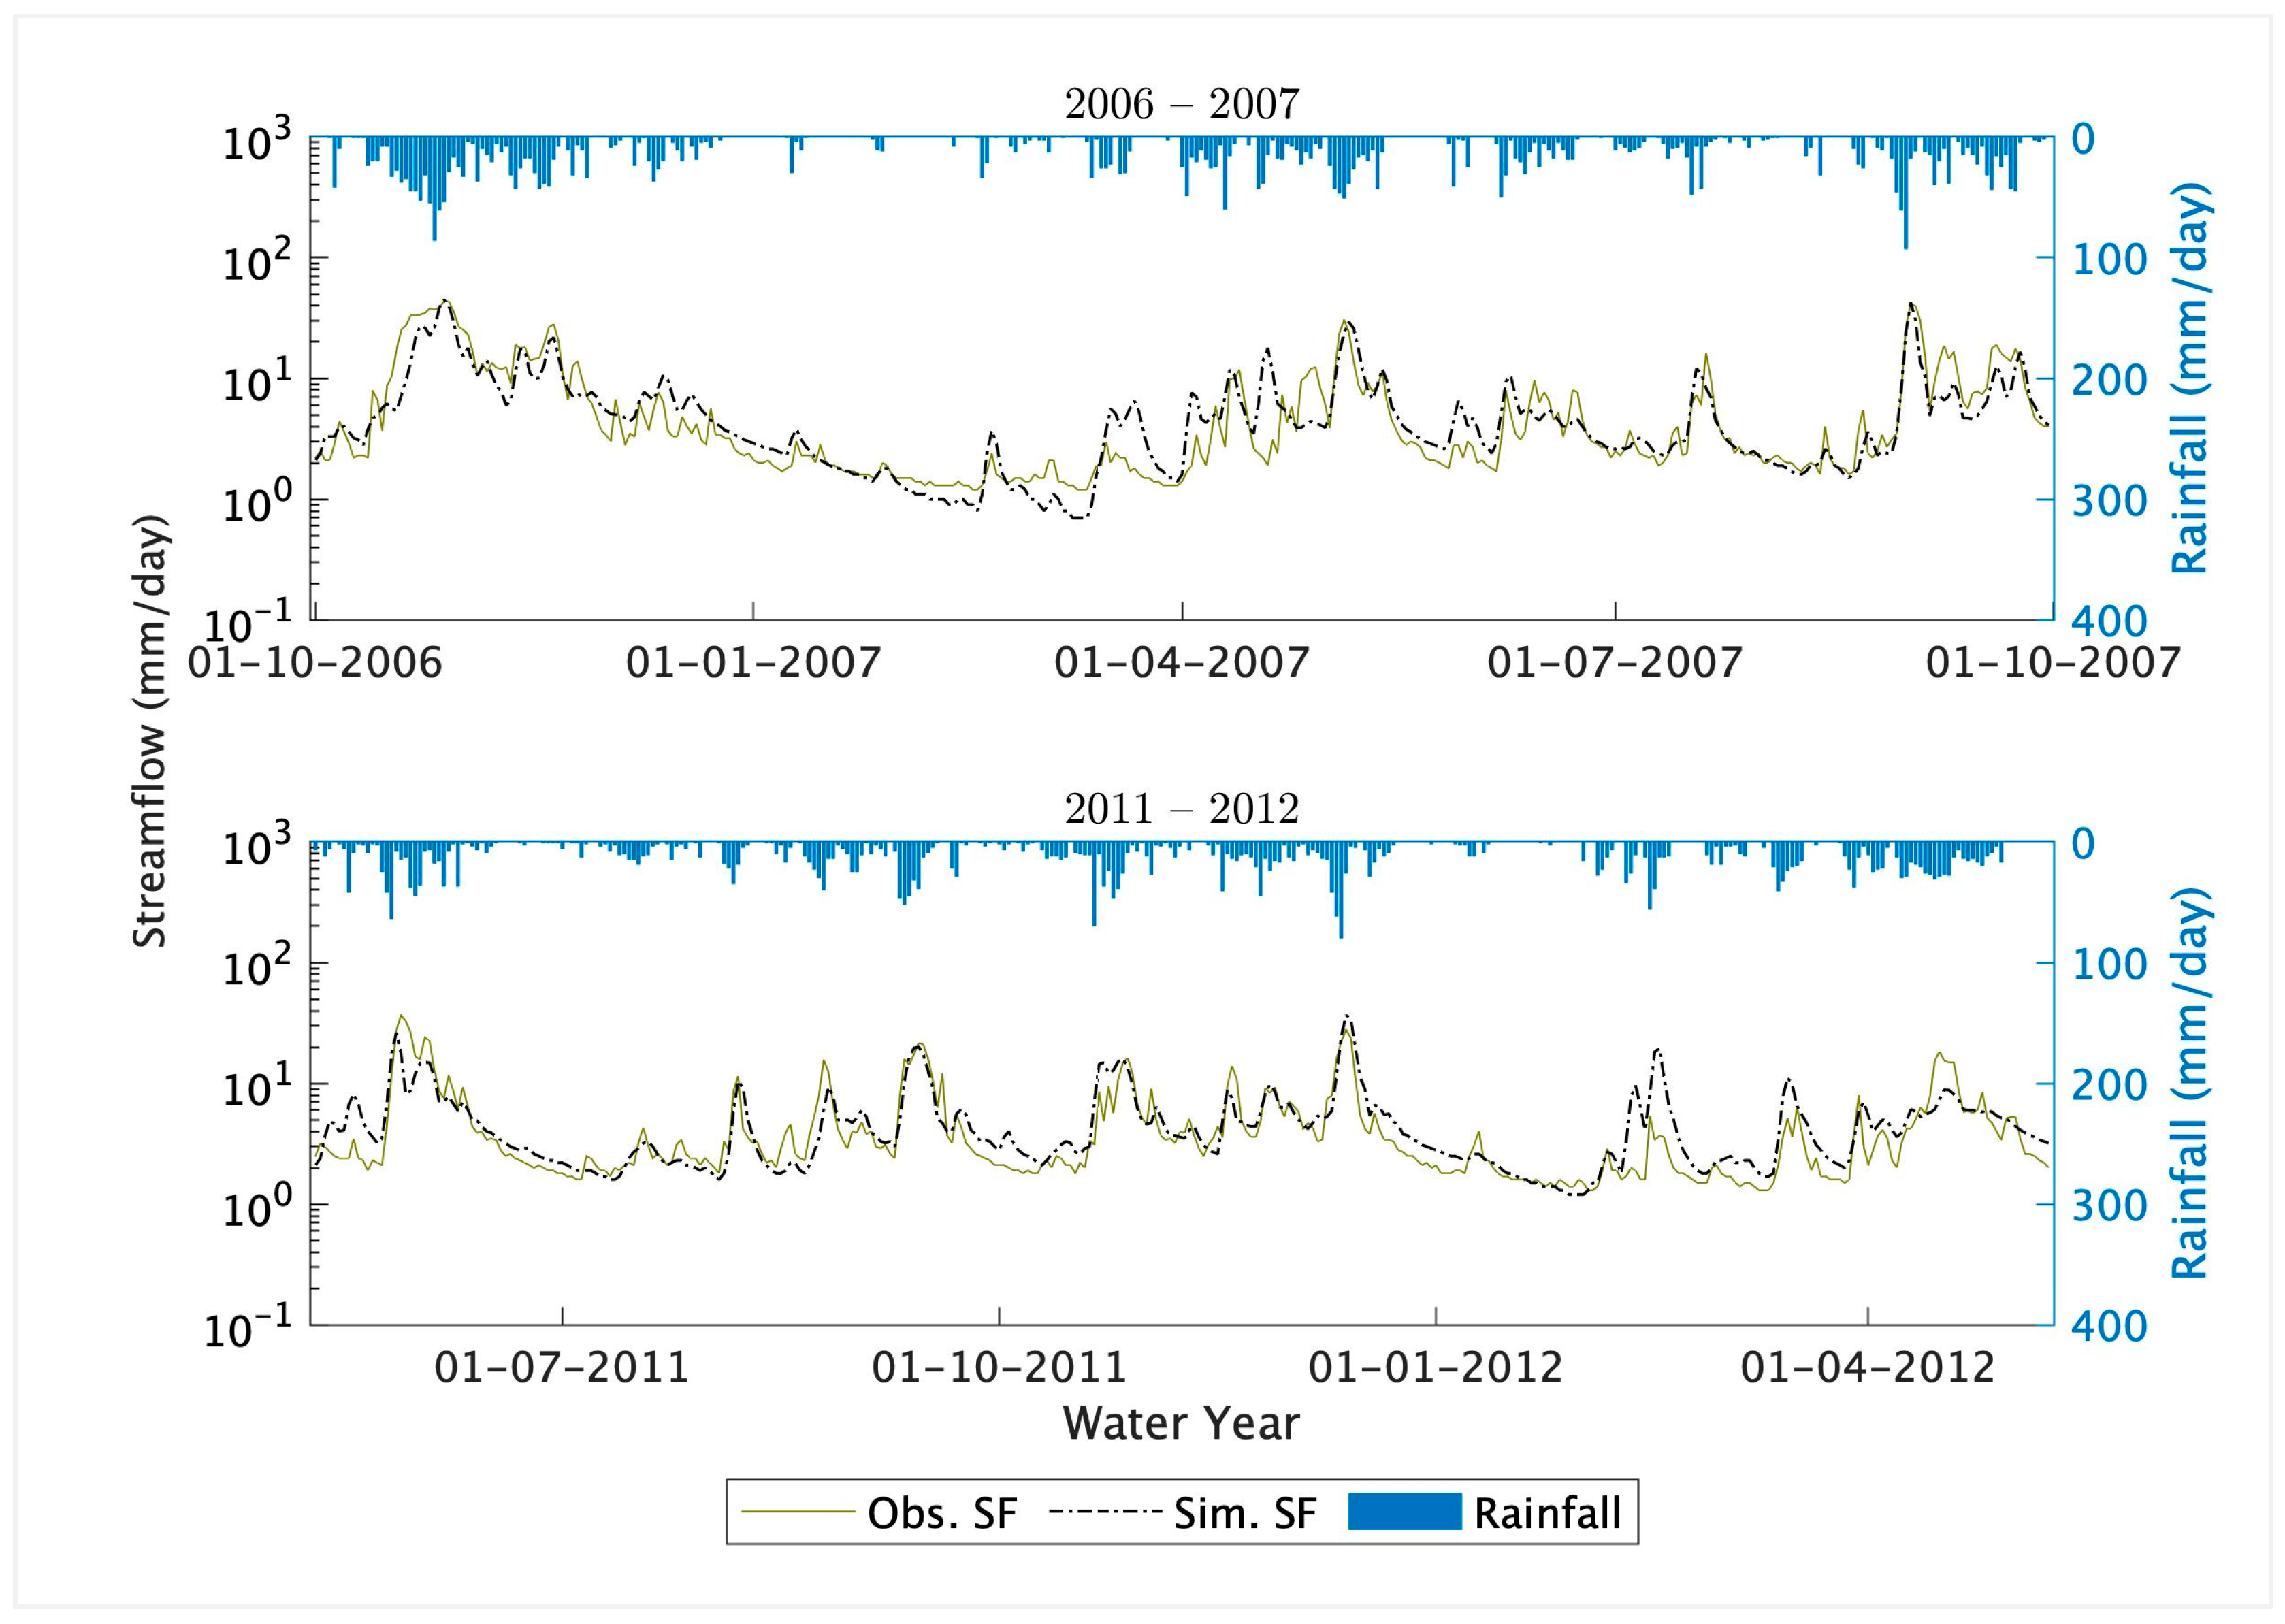
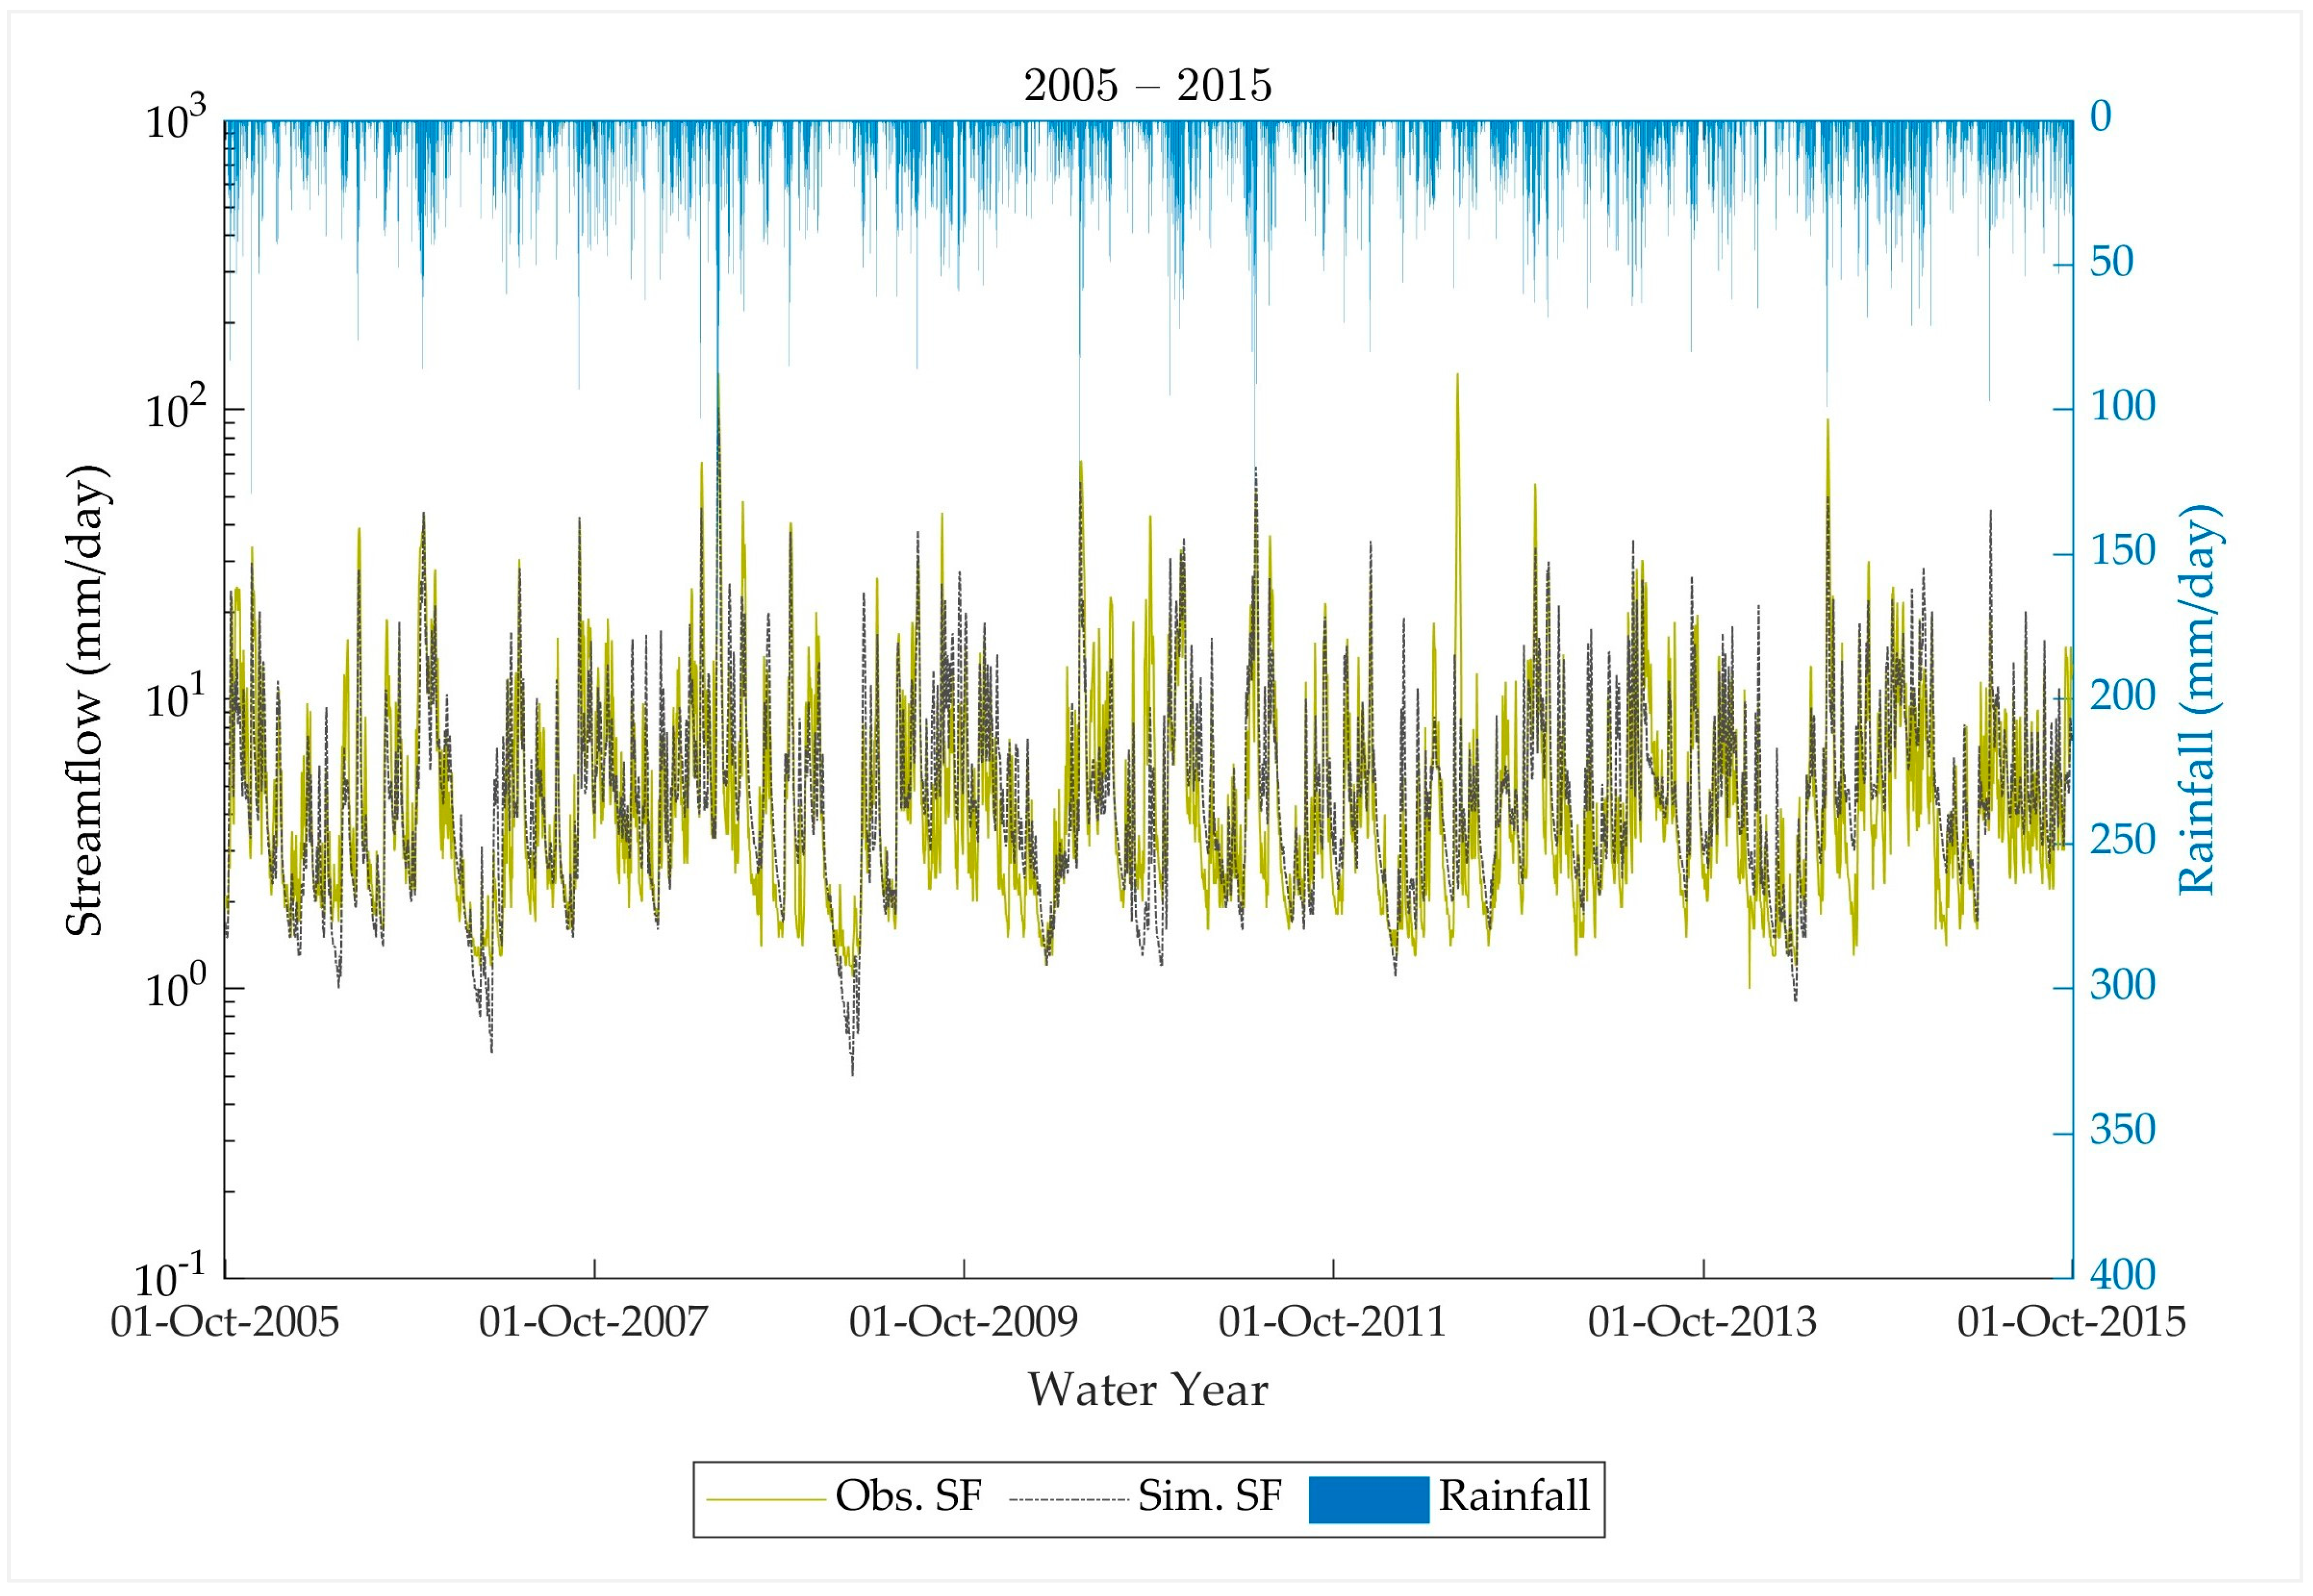
3.1. Performances of Hydrological Model Simulations (Calibration and Validation)

During the calibration periods (i.e., 2006/2007 and 2011/2012), the respective water cycles observed underestimations and overestimations of low-flow events (Figure 3). The 2006/2007 water cycle comprises a longer dry spell than the 2011/2012 period. A minor variation between simulated and observed flows can be observed during the low-flow regimes below the 10th percentile (compared to intermediate and high flows). In general, HEC-HMS simulations underestimate the flow during prolonged dry periods with small discharges (as observed in the 2006/2007 cycle) and overestimate the low-flow regimes over (relatively) short dry spells, as occurred in the 2011/2012 period.
During the validation periods (i.e., 2008/2009, 2009/2010, and 2013/2014), the model reproduced the high- and low-flow events (Figure 4). During the 2008/2009 water cycle, the model underestimated the low-flow regimes below Q10 (i.e., 13.1 m3/s), possibly due to the prolonged dry period similar to the 2006/2007 event. The model also overestimated the low-flow regimes in the 2013/2014 water cycle and with the (comparatively) short low-flow periods.
The continuous simulation from October 2005 to September 2015 also indicates that the model can reproduce the low- and high-flow events considerably well, except for the simulated flood event on 2 June 2012, which does not comply with rainfall (Figure 5). It should be noted that the model underestimates the flood peaks since it places more emphasis on capturing low-flow events.
When considering the calibration water cycles (Figure 3), it was observed that the model slightly underestimates the low-flow conditions below Q10 of 2006/2007, whereas the model output slightly overestimates the same flow regime during 2011/2012. When trying to match the shorter low-flow periods in the 2011/2012 water cycle, 2006/2007 longer low-flow period flows are further underestimated. The model’s tendency to underestimate high-flow regimes and overestimate intermediate flow can also be observed in the validation events (Figure 4 and Figure 5). Similarly, as in the calibration events, the model underestimates the low-flow regimes below Q10 in the 2008/2009 water cycle, and overestimates flows between Q20 and Q10 in the water cycle 2009/2010 with longer and comparatively shorter low-flow periods, respectively.
Statistical indicators (i.e., NSE, MRAE, PBias, and RMSE) also indicate a “good” performance of model simulations (Table 3). Out of all the calibration and validation events, the highest NSErel (0.85) and the lowest MRAE (0.15) were obtained in the 2006/2007 cycle (Table 3). That is explained by the good agreement between Q30 (16.7 m3/s) and Q10 (13.1 m3/s) low-flow regimes observed during the same period. The highest PBIAS value (−8.6%) occurred in 2006/2007, possibly due to the model underestimating the more extended high-flow event during October and November in 2006. Out of the two calibration events, the lowest PBIAS (−5.7%) and RMSE (29.7 m3/s) occurred in the 2011/2012 water cycle (Table 3). Nevertheless, the NSErel value (0.67) is the lowest of all the calibration and validation events, possibly due to the overestimation of the low-flow regimes. The 2008/2009 event in the validation period shows overall good results (Table 3), as the simulated low-flow regimes between Q30 (19.1 m3/s) and Q10 (13.1 m3/s) show minimal variations (compared to the observed streamflow). During the 2009/2010 validation period, the higher RMSE (48.2 m3/s) values may have occurred due to the overestimation of short-duration low-flow events (Figure 4). The 2013/2014 water cycle shows the best performance indicators. Nevertheless, the highest MRAE (0.35) out of all simulation periods is also observed, possibly because the model could not reproduce the high flood event in June 2014. The continuous simulation (October 2005–September 2015) also indicated better results in performance, with 0.81 in NSErel, 0.20 in MRAE, −3.9% in PBIAS, and 55.1 m3/s in RMSE. The model identifies the observed flow’s peaks and low-flow depressions well, although it underestimates the low-flow regimes during prolonged dry periods. Even though the model could identify the flood events, it could not match the peaks, as the calibration was focused on matching the low-flow conditions.
The continuous model performance from 1 October 2005 to 30 September 2015 was further evaluated based on the length of deficit duration and the number of deficit days related to the 90% exceedance probability value (i.e., Q10 of 15.8 m3/s) of the same duration. The drought analysis threshold was taken as the 7-day moving average flow and Q10 of the continuous simulation period (2005–2015). The most prolonged drought events have occurred in the 2006/2007 and 2008/2009 water cycles (Table 4). The 2006/2007 event underestimated the deficit duration (32 and 52 days for the simulated and observed flows, respectively), whereas the 2008/2009 event overestimated the same with 55 and 46 days, respectively, for the simulated and observed flows. Other events show good agreement between simulated and observed events with differences of three, six, and two days during the 2011/2012, 2009/2010, and 2013/2014 cycles, respectively. Further, the number of deficit days comparison for the whole data period shows less bias (15 days) concerning the observed flow (Table 4).

3.2. Selection of RCM Data and Performance of Bias Correction

According to Figure 6, NCC-NorESM1-M shows a better correlation with observed data during the low-flow months of the 30-year data period (1976 to 2005). Therefore, the NCC-NorESM1-M model was selected for further evaluation. Several dry spell characteristics (viz., average dry spell length, maximum dry spell length, standard deviation of dry spell lengths, 90th percentile dry spell length, 95th percentile dry spell length, and 99th percentile dry spell lengths) were used to evaluate the bias-corrected NCC-NorESM1-M data with observed precipitation data, particularly during dry months of the 1976–2005 period. The reference evapotranspiration ( E T 0 ) was selected as the threshold to determine dry spells [40,41]. The average monthly E T 0 of Agalawatta and Ratnapura were used to derive each month’s daily mean E T 0 of the Millakanda sub-basin. Figure 7 shows a reasonable agreement between indices derived from RCM and observed data with some exceptions. For example, maximum dry spell length shows a higher difference between the two datasets, particularly in February and October.

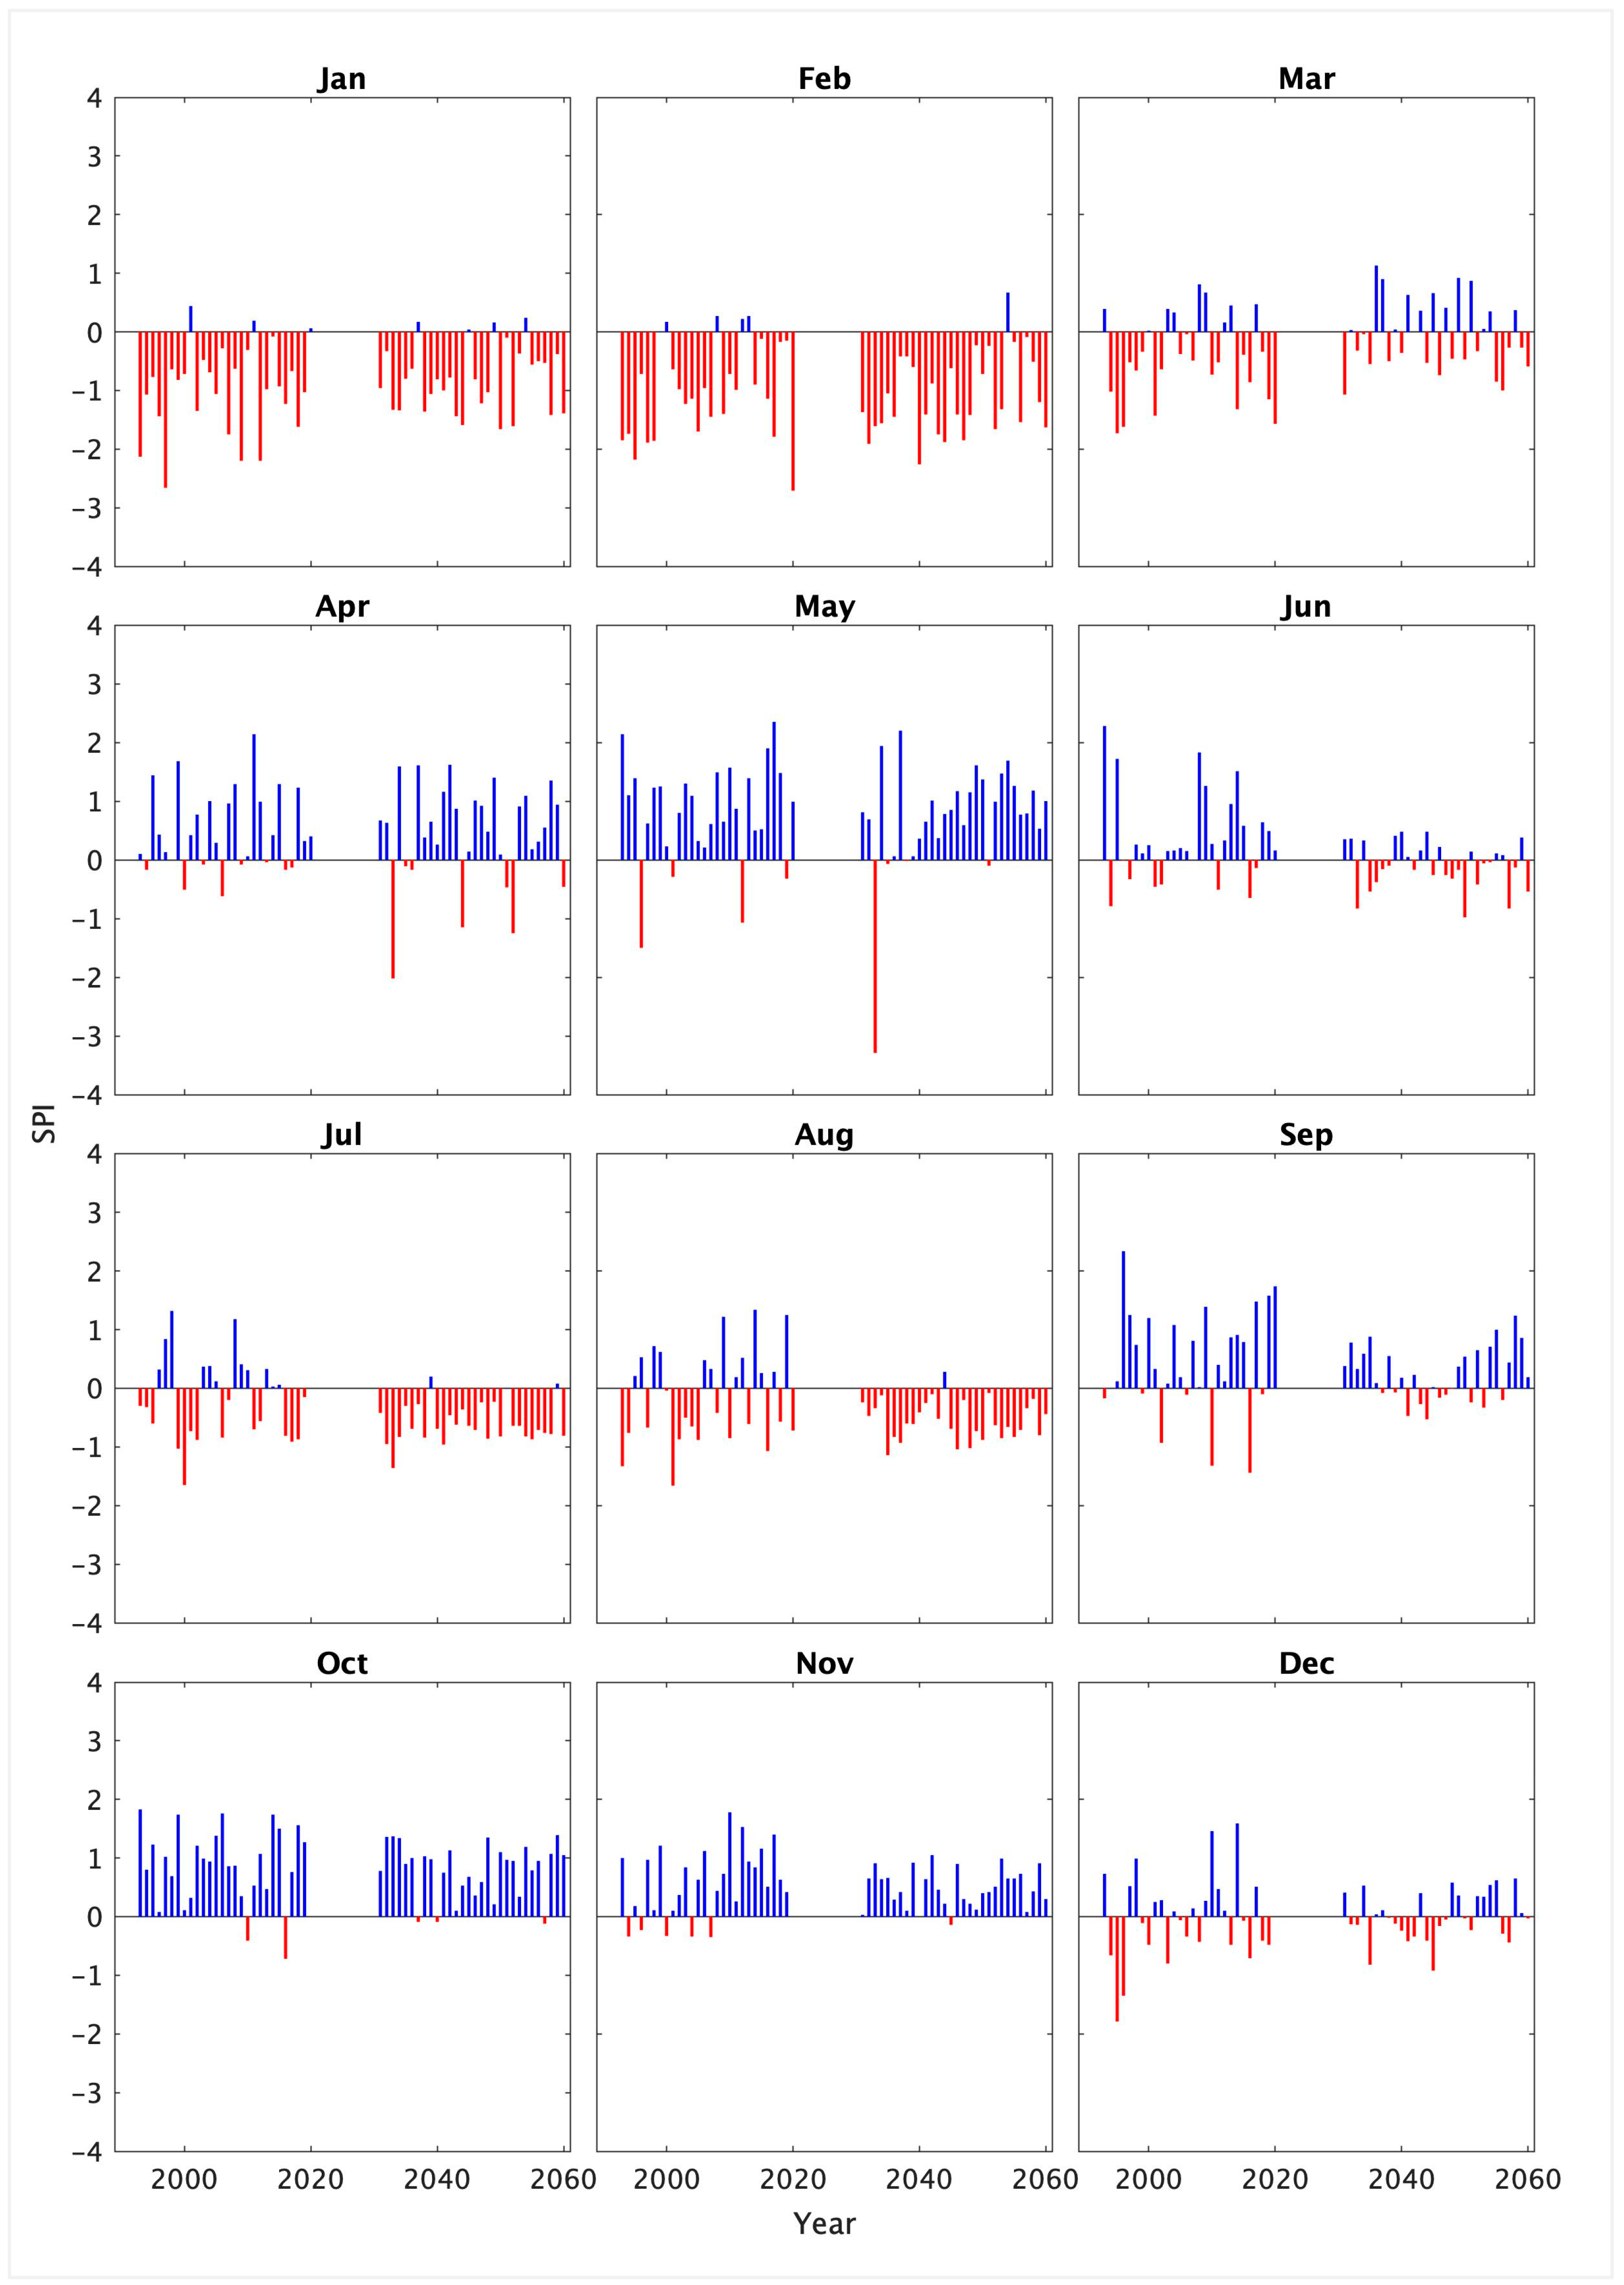
3.3. Projected Precipitation over Kuda Ganga Sub-Basin

RCP 2.6 and RCP 8.5 precipitation projections over the 2030–2060 period were compared to the 30-year base period (1976 to 2005). The average annual rainfall of the base period is 3657 mm, projected to increase by 4.5% (3820 mm) and 9.2% (3992 mm) under RCP 2.6 and RCP 8.5, respectively. The monthly variations shown in Figure 8 illustrate that the projected monthly rainfall tends to increase under RCP 8.5 (by 0.01% to 33.5% (in May) relative to the base period) during all months except October, February, April, July, and August (decreased by 1.4% to 6.7%, relative to the baseline period).
When decade-wise precipitation projections are compared with the baseline period (Figure 9), the first decade of the design period (i.e., 2030–2040) may become drier except for May, June, August, September, and November under RCP 8.5 (reductions between ~39% and ~2%) and during February, May and July under RCP 2.6 (reductions between ~22% and ~7%). On the other hand, monthly precipitation is projected to increase by ~3% to 34% under the RCP 8.5 scenario in all months of the 2040–2050 period, except for February. During the same decadal period, RCP 2.6 projections show mix variation (−20% to 27%) compared to the base period. During the final decade of the design period, the monthly mean precipitation varies between −13% and 55% and −10% to 316% under RCP 8.5 and RCP 2.6 scenarios, respectively (relative to the baseline period).
Furthermore, the standard precipitation index (SPI) was used to assess the historical, present, and future precipitation projections. In this study, one-month SPI (i.e., SPI-1) was used as it enables the detection of shorter drought periods within the month, which the longer time scale of SPI may not detect. Also, a longer dry period with less rain followed by a high rainfall event (which is more likely to the situation of the study area) cannot be identified by a longer time scale SPI. The SPI-1 was calculated considering the Thiessen average rainfall of the Millakanda watershed from October 1992 to September 2020 (27 years). The analysis revealed that, under the RCP 2.6 scenario, June, July, and August may become drier towards the end of the design period, while the prevailing dry conditions are projected to continue in January and February (Figure 10). Under RCP 8.5, July and August are likely to become drier towards the end of the design period. Even though September is not a dry month, precipitation may reduce (i.e., SPI-1 values less than one) compared to the baseline period. Further, prevailing dry conditions of January and February are projected to continue, while the month of May would receive more precipitation with high rainfall events (Figure 11). Both scenarios indicate that the first decade of the design period would be drier than the subsequent decades of the design period (i.e., 2040–2060).

3.4. Future Streamflow at Kolemodara Intake

The future changes in streamflow, particularly the low-flow regimes at the Kolemodara Intake, were assessed based on several low-flow indices, and the results are presented in the following sub-sections.

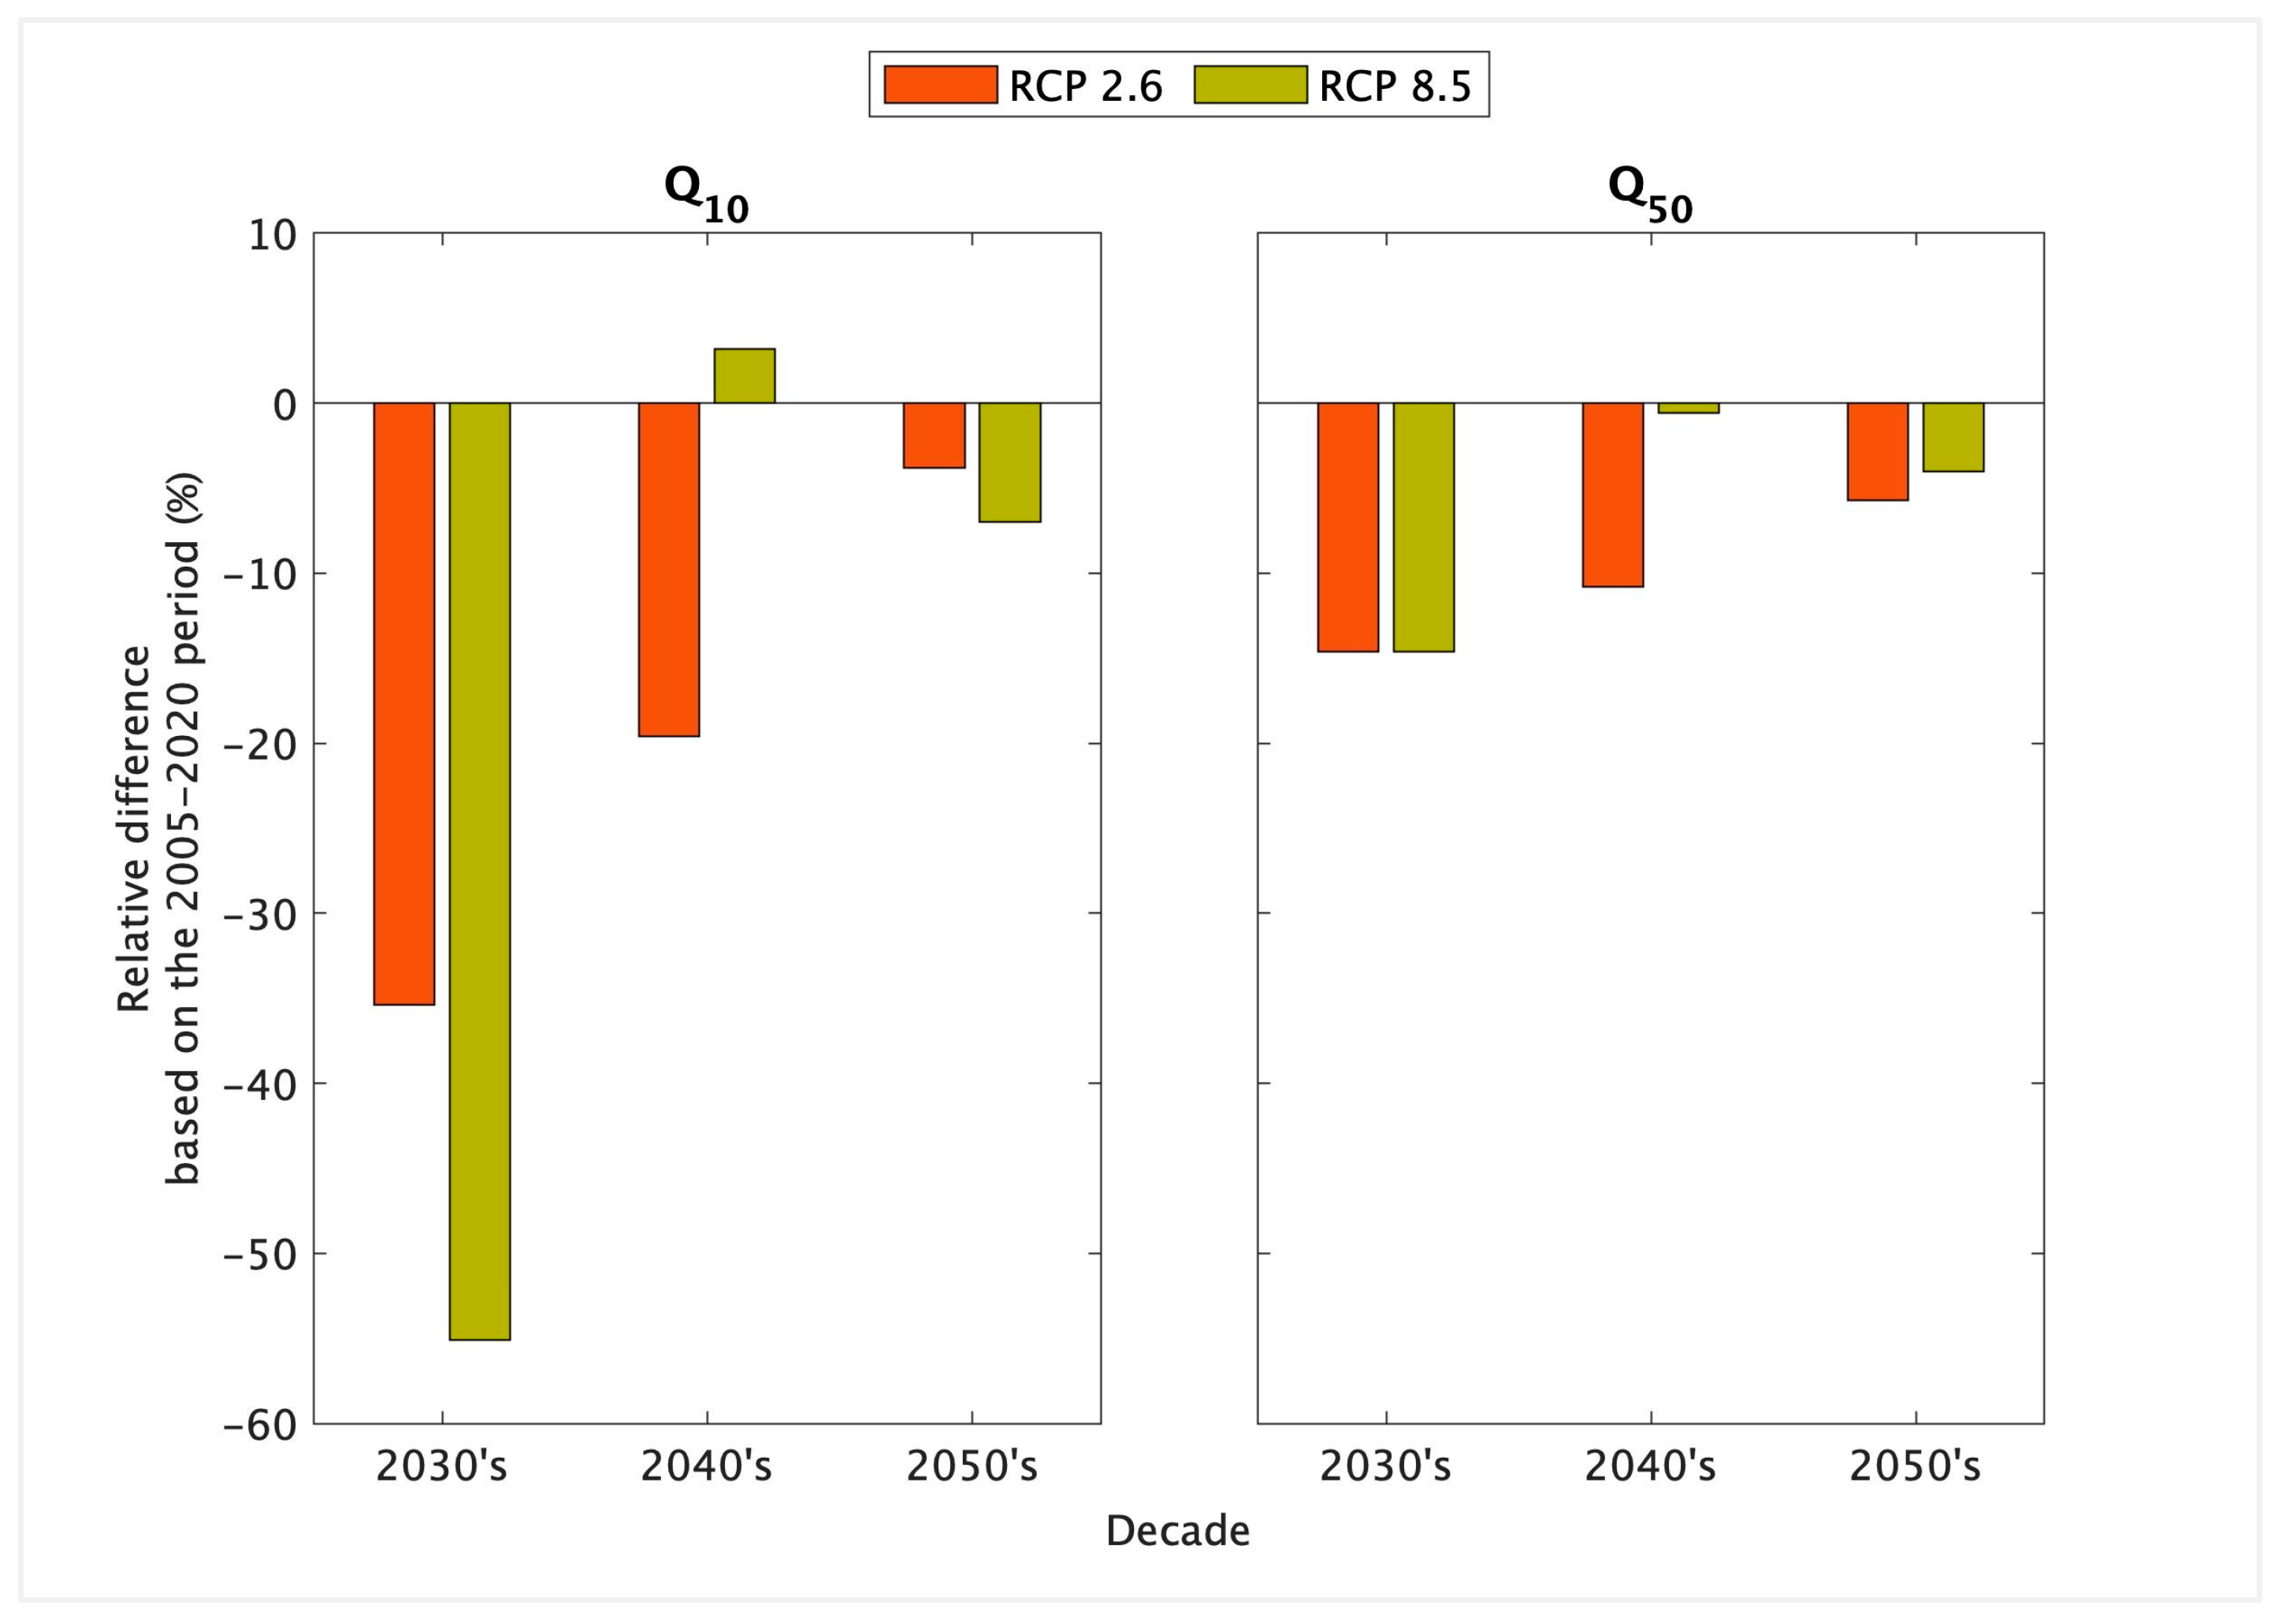
3.4.1. Variations in Q50 and Q10

Compared to the baseline conditions (2005–2020), Q10 and Q50 flow values are projected to decrease under both scenarios (Figure 12). The Q10 flow values during the first decadal period of the design period (2030–2040) are projected to decrease by 35% and 55% under RCP 2.6 and RCP 8.5 scenarios, respectively. Under both scenarios, the projected Q50 flows decrease at a lower rate (~15%) than Q10, indicating a more significant reduction in low-flow regimes than the median flow conditions during the 2030–2040 period.
The first decade of the design period is likely to be the driest period in both scenarios. The projected streamflow improves under RCP 2.6 during 2050–2060, but Q90 and Q50 values remain less than their base period, with a similar pattern observed with the SPI analysis (Figure 10). Low-flow regimes are projected to improve under RCP 8.5 (relative to the base period), with Q10 values increasing by ~3% during the 2040–2050 period, followed by a projected reduction of ~7% over the last decade (i.e., 2050–2060). During this period, the median flow values are also projected to reduce by ~4%.

3.4.2. Changes in MAM7 and MAM30 of Discharge

The average yearly and seasonal minima of the 7-day and 30-day moving average flow were evaluated using MAM7 and MAM30 analysis. Projected MAM7 values over the 2030–2060 period indicate that, compared to the baseline period of 2005 to 2020, the low-flow values may improve during the wet seasons of the basin, including ~5% to 35% (under RCP 2.6) and ~35% to 57% (under RCP 8.5) increases during the SWM and 2nd IM periods. However, for the same period, the low-flow regimes are projected to further reduce during the dry seasons, with reductions varying by ~21% to 33% (under RCP 2.6) and ~3% to 51% (under RCP 8.5) in NEM and ~32% to 54% (under RCP 2.6) and ~9% to 72% (under RCP 8.5) in the first IM period (Figure 13). Contrarily, during the last decade (i.e., 2050–2060), the MAM7 of NEM are projected to increase by ~40% and ~3%, under RCP 2.6 and 8.5, respectively (relative to the baseline period value of ~11 m3/s).
However, the annual minima results show that the low-flow regimes may reduce up to 30% under RCP 2.6 and between 10% and 55% under RCP 8.5 during the total design period. Further, the respective low-flow regime projections would increase to ~8.7 m3/s and ~7.9 m3/s under RCP 2.6 and RCP 8.5 scenarios but remain less than the baseline period value (8.85 m3/s). Under RCP 2.6, low-flow regimes are projected to improve over the base period during the NEM of the last decade (i.e., 2050–2060).
When the MAM30 analysis is considered, low-flow regimes are projected to reduce during all four seasons under both scenarios (Figure 13). The annual minimal values of MAM30 also show a reduction in projected values (relative to the base value of 16.56 m3/s) under RCP 2.6 (by ~12% to 41%) and RCP 8.5 (by ~10% to 55%) during the design horizon (i.e., 2030–2060). In both scenarios, the smallest deviation is likely to occur during the last decade, indicating reductions in longer-period averages compared to the base period, possibly due to the prolonged dry periods projected during the design horizon.

3.4.3. Changes in Baseflow Index (BFI)

According to the results presented in Figure 14, the projected BFI has increased during all four seasons of the design horizon (i.e., 2030–2060) under both scenarios (compared with the baseline period of 2005–2020), indicating that the base flow component would significantly influence the streamflow of this river basin. The projected BFI shows increments of ~30% to ~45% in the two main monsoons (i.e., SWM and NEM), ~40% to 55% in the 2nd IM and ~20% in the 1st IM season under both scenarios. These increments can be correlated with the decrease in MAM30 (compared to MAM7), possibly due to prolonged dry periods projected (compared to the base period).

3.4.4. Continuous Low-Flow and Deficit Volume

According to the baseline period simulations (i.e., 2005–2020), only two events are recorded with an eight-day duration. Those two events are associated with drastically different deficit intensities of 36,000 and 7000 m3/day. With the projected flow regimes, nine and twelve such events accounted for the RCP 2.6 and RCP 8.5 scenarios, respectively. All those events are projected to occur during either the NEM or 1st IM period, with the majority (~50%) expected during the first decade of the design period, while the intensity is reduced towards the end of the design period. The maximum deficit events related to the future projections are also expected during the first decade, with the respective total deficit volumes of ~5 MCM (~47 days long) and ~4.5 MCM (~42 days long) under the RCP 2.6 and RCP 8.5 scenarios.
According to the findings, the number of drought events, their durations, and intensities are likely to reduce towards the last decade of the design horizon (i.e., 2050–2060) under both projection scenarios, i.e., two events (with deficit durations of four and six days with respective intensities of 15,000 and 13,000 m3/day) under RCP 2.6 and two events (with deficit durations of one and six days with respective intensities of 1000 and 34,000 m3/day) under RCP 8.5. Other low-flow indices (viz., Q10, MAM7, and MAM30) also indicate a possible improvement of low-flow regimes under RCP 2.6 towards the last decade of the design horizon (but having less flow than the baseline period of 2005–2020). A similar pattern was observed under RCP 8.5 regarding the MAM7 and MAM30; nevertheless, Q10 tends to have a lower percentage during the last decade than in the preceding period (Table 5 and Figure 15).

4. Discussion

Our results show that, in general, the Kuda Ganga basin may become wetter and warmer in the near future (2030–2060) compared to the baseline period (1976–2005). Particularly, wet months (viz., May, June, September, and October) are projected to be wetter, while the dry months (viz., January, February, July, and August) may become warmer. Other researchers have also concluded that the Kalu Ganga Basin (i.e., the main watershed that the Kuda Ganaga Basin belongs to) would become warmer and wetter with increased discharges during the SWM periods of the late 21st century [29]. Furthermore, Nyunt et al. [42] have used an ensemble of nine CMIP4 GCMs from the 4th IPCC assessment report to assess the hydrological responses of the Kalu River Basin and concluded that more intense rainfalls might occur during the monsoon seasons, while longer dry spells are expected over the 2046–2065 period. Furthermore, based on the median of 42 downscaled CMIP5 GCMs, Zheng et al. [43] have identified that, under the RCP 8.5 scenario, annual precipitation over Sri Lanka may increase by 11% during 2046–2070 compared to 1976–2005.
In the first decade (i.e., 2030–2040), streamflow in the Kuda Ganga Basin is projected to decrease during the months of March, April, and December to February under both projection scenarios considered. Per our knowledge, no study has assessed the low-flow dynamics in the Kalu River Basin (or any other river basin in Sri Lanka). Therefore, regrettably, we have to limit the discussion to overall streamflow projections in the Kalu River Basin. According to the findings of Sirisena et al. [29], the mean annual streamflow in the Kalu River Basin over 2046–2075 is projected to increase by 5% to 13% and 14% to 22% under RCP 2.6 and RCP 8.5 scenarios, respectively (relative to the baseline period of 1991–2005). Similarly, the mean annual runoff of Sri Lanka will be increased by 31% (median value from 17 GCM projections forced in simulations) under RCP8.5 during 2046–2075 compared to 1976–2005 [43]. When the regional projections are considered, Mudbhatkal et al. [44] have found a decreasing trend in the low-flow regimes (~90% dependable) in the Malapraba River Basin in Western Ghats, India during the 2006–2070 period (under RCP 4.5). However, average annual and seasonal flows show increasing trends over the same period. A study on the Mun River Basin, Thailand, has highlighted that dry seasonal (February to May) streamflow may decrease by ~1% to 37% under RCP 2.6, 4.5, and 8.5 scenarios over 2020–2093, compared to the baseline period of 1980–2004 [45].
Low-flow indices analysis suggested decreased low-flow regimes with longer deficit durations under both projection scenarios (i.e., RCP 2.6 and 8.5), particularly during 2030–2040. Further, the first inter-monsoon and Northwest monsoon periods (i.e., March–April and December–February, respectively) are projected to remain dry. Consequently, the respective deficit volumes projected under RCP 2.6 and 8.5 are ~5 MCM and 4.5 MCM. Further, these prolonged dry periods may have also reduced the direct runoff component of the river, thus increasing the contribution from the baseflow by ~30% to ~55% during the future period considered. As such, the Kolemodara intake may fail to meet the required demands during the 2030–2040 period. Such deficit events are projected to increase (nine and twelve) under RCP 2.6 and 8.5, respectively, during the analysis period (2030–2060), whereas only two events were recorded during the base period (2005–2022). Therefore, NWSDB would require an additional storage excess of ~5 MCM to maintain an uninterrupted water supply during the low-flow period of 2030–2060.
It should be noted that power plant operations and schedules are very likely to vary based on future energy and water demands and availability. However, in all the simulations of this study, we assumed the currently available operation schedule to remain invariant during the design horizon. Therefore, updated reservoir operations and scheduling will help better represent the downstream flow regime. Furthermore, we used observed evapotranspiration data in the model simulation for future periods. The use of evapotranspiration projections by adopting future temperature changes will further improve projection accuracy.

5. Conclusions

The HEC-HMS hydrological model was applied to the lower Kalu River Basin (i.e., the Kuda Ganga sub-basin) to assess the climate-change-driven impacts on water availability over the 2030–2060 period. The hydrological model was developed as a six-sub-basin model, which successfully reproduced the dry flow regimes over the 2005–2015 period, providing sufficient confidence to apply it in projection mode. Model application at the Kuda Ganga sub-basin under two of the IPCC AR5 end-member climate scenarios (i.e., RCP 2.6 and RCP 8.5) using high resolution (25 km × 25 km) CMIP5 regional climate model projections (viz., NCC-NORESM1-M) indicate that the study area’s dry periods may become drier (during January, February, July, and August) and wet periods may become wetter (during May, June, September, and October) over the 2030–2060 period. A deficit volume assessment revealed that the near future period (2031–2040) may become critical, as the streamflow is projected to reduce during the first inter-monsoon (i.e., March to April) and Northeast monsoon (i.e., December to February) times. Consequently, under the RCP 2.6 scenario, water shortages were identified, with a maximum deficit volume of ~5 MCM that may last for ~47 days (i.e., ~105,000 m3/day). Accordingly, it can be concluded that an additional emergency storage volume of ~5 MCM is required to ensure water safety during the 2030–2040 period.
In this study, HEC-HMS simulations for future periods were undertaken by assuming the land-use types remain invariant from the reference conditions. This assumption was necessary because projections of land-use characteristics are not available for the study area considered. Hence, it is recommended that suitable land-use projections be used to arrive at a more comprehensive assessment of water resource availability. Furthermore, the use of CMIP6 regional climate models is also recommended once such projections become available for a better understanding of the low-flow dynamics of this region. The use of multiple regional climate models to obtain climatic projections is also recommended to assess the uncertainties in outputs, thus minimising the risks involved in planning for future water security.

Author Contributions

Conceptualisation, R.F., H.R. and J.B.; methodology, R.F., J.B., L.R., L.G. and J.S.; software, R.F., L.G., J.S. and L.R.; validation, R.F., L.G. and L.R.; formal analysis, R.F.; investigation, R.F.; resources, L.R. and J.S.; data curation, R.F.; writing—original draft preparation, R.F.; writing—review and editing, R.F., J.S., L.G., J.B. and M.G.N.O.; visualisation, R.F., M.G.N.O. and J.B.; supervision, H.R. and J.B.; project administration, L.R. and J.B. All authors have read and agreed to the published version of the manuscript.

Funding

This study is a part of RF’s MSc research, supported via a scholarship offered by the UNESCO-Madanjeet Singh Centre for South Asia Water Management (UMCSAWM), University of Moratuwa, Sri Lanka.

Data Availability Statement

The raw data supporting the conclusions of this article will be made available by the authors, without undue reservation, to any qualified researcher. All data requests are encouraged to CC [email protected] (accessed on 1 April 2024) for swift processing, monitoring, and administrative purposes.

Acknowledgments

RF expresses her sincere gratitude to the late Sri Madanjeet Singh for founding the South Asia Foundation (SAF), through which the funds were provided to the UMCSAWM to grant financial support for RF’s MSc study. This study could not have been possible without the support from the Irrigation Department and Ceylon Electricity Board, Sri Lanka, by freely issuing the data needed in the research, for which the authors are very grateful. Further, RF greatly acknowledges the Chief Engineer–Planning and Design, the Deputy General Manager (Western-South), and the General Manager of the National Water Supply and Drainage Board (NWSDB) for their valuable guidance, encouragement, and granting RF’s leave to complete her MSc degree.

Conflicts of Interest

The authors declare no conflicts of interest.

References

  1. National Research Council; Sarachik, E.S. Global Environmental Change: Research Pathways for the Next Decade; National Academy Press: Washington, DC, USA, 1999. [Google Scholar]
  2. IPCC. IPCC, 2023: Summary for Policymakers. In Climate Change 2023: Synthesis Report. Contribution of Working Groups I, II and III to the Sixth Assessment Report of the Intergovernmental Panel on Climate Change; Core Writing Team, Lee, H., Romero, J., Eds.; IPCC: Geneva, Switzerland, 2023; pp. 1–34. [Google Scholar] [CrossRef]
  3. Lemos, M.C.; Finan, T.J.; Fox, R.W.; Nelson, D.R.; Tucker, J. The Use of Seasonal Climate Forecasting in Policymaking: Lessons from Northeast Brazil. Clim. Change 2002, 55, 479–507. [Google Scholar] [CrossRef]
  4. Findlater, K.; Webber, S.; Kandlikar, M.; Donner, S. Climate services promise better decisions but mainly focus on better data. Nat. Clim. Change 2021, 11, 731–737. [Google Scholar] [CrossRef]
  5. Vaughan, C.; Dessai, S. Climate services for society: Origins, institutional arrangements, and design elements for an evaluation framework. Wiley Interdiscip. Rev. Clim. Change 2014, 5, 587–603. [Google Scholar] [CrossRef] [PubMed]
  6. Fisher, S.; Dodman, D.; Van Epp, M.; Garside, B. The usability of climate information in sub-national planning in India, Kenya and Uganda: The role of social learning and intermediary organisations. Clim. Change 2018, 151, 219–245. [Google Scholar] [CrossRef]
  7. Hewitt, C.; Mason, S.; Walland, D. The Global Framework for Climate Services. Nat Clim. Change 2012, 2, 831–832. [Google Scholar] [CrossRef]
  8. World Meteorological Organization. State of Climate Services 2023: Health; World Meteorological Organization: Geneva, Switzerland, 2023. [Google Scholar]
  9. World Health Organization. World Health Statistics 2017: Monitoring Health for the SDGs, Sustainable Development Goals; World Health Organization: Geneva, Switzerland, 2017. [Google Scholar]
  10. United Nations. The Sustainable Development Goals Report 2023: Special Edition; United Nations: New York, NY, USA, 2023. [Google Scholar]
  11. Venter, O.; Sanderson, E.W.; Magrach, A.; Allan, J.R.; Beher, J.; Jones, K.R.; Possingham, H.P.; Laurance, W.F.; Wood, P.; Fekete, B.M.; et al. Sixteen Years of Change in the Global Terrestrial Human Footprint and Implications for Biodiversity Conservation. Nat. Commun. 2016, 7, 12558. [Google Scholar] [CrossRef] [PubMed]
  12. Sirisena, T.A.J.G.; Bamunawala, J.; Maskey, S.; Ranasinghe, R. Comparison of process-based and lumped parameter models for projecting future changes in fluvial sediment supply to the coast. Front. Earth Sci. 2023, 10, 978109. [Google Scholar] [CrossRef]
  13. Konapala, G.; Mishra, A.K.; Wada, Y.; Mann, M.E. Climate change will affect global water availability through compounding changes in seasonal precipitation and evaporation. Nat. Commun. 2020, 11, 3044. [Google Scholar] [CrossRef]
  14. Feist, S.E.; Hoque, M.A.; Islam, M.A.; Ahmed, K.M.; Fowler, M. Recent trends in inland water level change in coastal Bangladesh–Implications of sea level rise in low-lying deltas. Glob. Planet. Change 2021, 206, 103639. [Google Scholar] [CrossRef]
  15. Koutroulis, A.G.; Papadimitriou, L.V.; Grillakis, M.G.; Tsanis, I.K.; Warren, R.; Betts, R.A. Global water availability under high-end climate change: A vulnerability based assessment. Glob. Planet. Change 2019, 175, 52–63. [Google Scholar] [CrossRef]
  16. He, C.; Liu, Z.; Wu, J.; Pan, X.; Fang, Z.; Li, J.; Bryan, B.A. Future global urban water scarcity and potential solutions. Nat. Commun. 2021, 12, 4667. [Google Scholar] [CrossRef] [PubMed]
  17. World Bank. High and Dry: Climate Change, Water, and the Economy; World Bank: Washington, DC, USA, 2016. [Google Scholar] [CrossRef]
  18. Shelton, S.; Pushpawela, B.; Liyanage, G. The long-term trend in the diurnal temperature range over Sri Lanka from 1985 to 2017 and its association with total cloud cover and rainfall. J. Atmos. Sol.-Terr. Phys. 2022, 227, 105810. [Google Scholar] [CrossRef]
  19. Dissanayaka, K.D.C.R.; Rajapakse, R.L.H.L. Long-term precipitation trends and climate extremes in the Kelani River basin, Sri Lanka, and their impact on streamflow variability under climate change. Paddy Water Environ. 2019, 17, 281–289. [Google Scholar] [CrossRef]
  20. Marambe, B.; Punyawardena, R.; Silva, P.; Premalal, S.; Rathnabharathie, V.; Kekulandala, B.; Nidumolu, U.; Howden, M. Climate, Climate Risk, and Food Security in Sri Lanka: The Need for Strengthening Adaptation Strategies. In Handbook of Climate Change Adaptation; Filho, W.L., Ed.; Springer: Berlin/Heidelberg, Germany, 2015; pp. 1759–1789. [Google Scholar] [CrossRef]
  21. Punyawardena, B.V.R.; Mehmood, S.; Hettiarachchi, A.K.; Iqbal, M.; De Silva, A.S.H.S.A.; Goheer, A. Future climate of Sri Lanka: An approach through dynamic downscaling of ECHAM4 general circulation model (GCM). Trop. Agric. 2013, 161, 35–52. [Google Scholar]
  22. Fan, M. Sri Lanka’s Water Supply and Sanitation Sector: Achievements and a Way Forward; No. 35; Asian Development Bank: Manila, Philippines, 2015. [Google Scholar]
  23. FCG International, Ltd. Comprehensive Strategic Investment Plan and Road Map for the Water Supply and Sanitation Sector in Sri Lanka; Ministry of Urban Development, Water Supply & Housing Facilities: Ratmalana, Sri Lanka, 2020. [Google Scholar]
  24. Kubiak-Wójcicka, K.; Zeleňáková, M.; Blištan, P.; Simonová, D.; Pilarska, A. Influence of climate change on low flow conditions. Case study: Laborec River, eastern Slovakia. Ecohydrol. Hydrobiol. 2021, 21, 570–583. [Google Scholar] [CrossRef]
  25. Chokkavarapu, N.; Mandla, V.R. Comparative study of GCMs, RCMs, downscaling and hydrological models: A review toward future climate change impact estimation. SN Appl. Sci. 2019, 1, 1698. [Google Scholar] [CrossRef]
  26. Jayaminda, C.; Gunawardhana, L.; Rajapakse, L. Rating Performances of Global Climate Models in Capturing Monsoon Rainfall Patterns in Sri Lanka. In Proceedings of the 2023 Moratuwa Engineering Research Conference (MERCon), Moratuwa, Sri Lanka, 9–11 November 2023; pp. 264–269. [Google Scholar] [CrossRef]
  27. Teutschbein, C.; Seibert, J. Regional Climate Models for Hydrological Impact Studies at the Catchment Scale: A Review of Recent Modeling Strategies. Geogr. Compass 2010, 4, 834–860. [Google Scholar] [CrossRef]
  28. Azmat, M.; Wahab, A.; Huggel, C.; Qamar, M.U.; Hussain, E.; Ahmad, S.; Waheed, A. Climatic and hydrological projections to changing climate under CORDEX-South Asia experiments over the Karakoram-Hindukush-Himalayan water towers. Sci. Total Environ. 2020, 703, 135010. [Google Scholar] [CrossRef] [PubMed]
  29. Sirisena, T.A.J.G.; Maskey, S.; Bamunawala, J.; Coppola, E.; Ranasinghe, R. Projected Streamflow and Sediment Supply under Changing Climate to the Coast of the Kalu River Basin in Tropical Sri Lanka over the 21st Century. Water 2021, 13, 3031. [Google Scholar] [CrossRef]
  30. Deb, P.; Shrestha, S. Hydrology Measurement and Analysis Training Manual; Asian Institute of Technology: Pathumthani, Thailand, 2015. [Google Scholar] [CrossRef]
  31. Hydrologic Engineering Center. Hydrologic Modelling System HEC-HMS User’s Manual Version 4.7. 2021. Available online: https://www.hec.usace.army.mil/confluence/hmsdocs/hmsum/latest (accessed on 14 March 2021).
  32. World Meteorological Organization. Manual on Low-Flow Estimation and Prediction Operational Hydrology (Report No. 50, WMO-No. 1029); World Meteorological Organization: Geneva, Switzerland, 2008. [Google Scholar]
  33. Dissanayake, P.K.M. Applicability of a Two Parameter Water Balance Model to Simulate Daily Rainfall-Runoff a Case Study of Kalu and Gin River Basins. Master’s Thesis, University of Moratuwa, Moratuwa, Sri Lanka, 2017. [Google Scholar]
  34. Dissanayaka, K.D.C.R. Climate Extremes and Precipitation Trends in Kelani River Basin, Sri Lanka and Impact on Streamflow Variability under Climate Change. Master’s Thesis, University of Moratuwa, Moratuwa, Sri Lanka, 2017. [Google Scholar]
  35. Herath, M.H.B.C.W.; Wijesekera, N.T.S. Evaluation of HEC-HMS Model for Water Resources Management in Maha Oya Basin in Sri Lanka. Eng. J. Inst. Eng. Sri Lanka 2021, 54, 45–53. [Google Scholar] [CrossRef]
  36. Jayadeera, P.M.; Wijesekera, N.T.S. A Diagnostic Application of HEC–HMS Model to Evaluate the Potential for Water Management in the Ratnapura Watershed of Kalu Ganga Sri Lanka. Eng. J. Inst. Eng. Sri Lanka 2019, 52, 11–21. [Google Scholar] [CrossRef]
  37. Wijesekera, N.T.S.; Abeynayake, J.C. Watershed similarity conditions for peak flow transposition–A study of river basins in the wet zone of Sri Lanka. Eng. J. Inst. Eng. Sri Lanka 2003, 36, 26–31. [Google Scholar]
  38. Perera, K.R.J.; Wijesekera, N.T.S. Identification of the Spatial Variability of Runoff Coefficients of Three Wet Zone Watersheds of Sri Lanka. Eng. J. Inst. Eng. Sri Lanka 2011, 44, 1–10. [Google Scholar] [CrossRef]
  39. Sapač, K.; Medved, A.; Rusjan, S.; Bezak, N. Investigation of Low- and High-Flow Characteristics of Karst Catchments under Climate Change. Water 2019, 11, 925. [Google Scholar] [CrossRef]
  40. Allen, R.; Pereira, L.; Raes, D.; Smith, M. Crop Evapotranspiration, Guidelines for Computing Crop Water Requirements–FAO Irrigation and Drainage Paper 56; FAO: Rome, Italy, 1998. [Google Scholar]
  41. Rivoire, P.; Tramblay, Y.; Neppel, L.; Hertig, E.; Vicente-Serrano, S.M. Impact of the dry-day definition on Mediterranean extreme dry-spell analysis. Nat. Hazards Earth Syst. Sci. 2019, 19, 1629–1638. [Google Scholar] [CrossRef]
  42. Nyunt, C.T.; Yamamoto, H.; Yamamoto, A.; Nemoto, T.; Kitsuregawa, M.; Koike, T. Application of bias-correction and downscaling method to Kalu Ganga Basin in Sri Lanka. J. Jpn. Soc. Civ. Eng. Ser. B1 (Hydraul. Eng.) 2012, 68, I_115–I_120. [Google Scholar] [CrossRef] [PubMed]
  43. Zheng, H.; Chiew, F.H.S.; Charles, S.; Podger, G. Future climate and runoff projections across South Asia from CMIP5 global climate models and hydrological modelling. J. Hydrol. Reg. Stud. 2018, 18, 92–109. [Google Scholar] [CrossRef]
  44. Amogh, M.; Raikar, R.V.; Venkatesh, B.; Mahesha, A. Impacts of Climate Change on Varied River-Flow Regimes of Southern India. J. Hydrol. Eng. 2017, 22, 05017017. [Google Scholar] [CrossRef]
  45. Li, C.; Fang, H. Assessment of climate change impacts on the streamflow for the Mun River in the Mekong Basin, Southeast Asia: Using SWAT model. Catena 2021, 201, 105199. [Google Scholar] [CrossRef]
Figure 1. Methodology flowchart of the overall study.
Water 16 01317 g001
Figure 2. The location map with gauging stations.
Water 16 01317 g002
Figure 3. Comparison of observed and simulated discharge for the calibration periods: 2006/2007 and 2011/2012 water cycles (in semi-log scale).
Water 16 01317 g003
Figure 4. Comparison of observed and simulated discharge for the validation periods: 2008/2009, 2009/2010, and 2013/2014 water cycles (in semi-log scale).
Water 16 01317 g004
Figure 5. Comparison of observed and simulated discharge for continuous model validation simulation 2005–2015.
Water 16 01317 g005
Figure 6. Variation in monthly observed, RCM, and bias-corrected-RCM rainfall over 30 years (1976 to 2005). The boxes are limited to the 25th and 75th percentiles, and the horizontal line shows the median (i.e., 50th percentile) value of the monthly data sets. Whiskers are extended to 1.5 times inter-quartile range to the top and bottom of the boxes.
Water 16 01317 g006
Figure 7. Comparison of the monthly variation in the dry spell characteristics of RCM precipitation data with the observed precipitation data over 30 years (1976 to 2005).
Water 16 01317 g007
Figure 8. Average monthly and seasonal variation in precipitation (2030–2060) compared to the historical base period (1976 to 2005) under RCP 2.6 and 8.5 scenarios.
Water 16 01317 g008
Figure 9. Average monthly variation in precipitation in three decades over 2030–2060 compared to the historical base period (1976 to 2005) under RCP 2.6 and RCP 8.5.
Water 16 01317 g009
Figure 10. Variation in SPI-1 under RCP 2.6 scenarios for the 2030–2060 period, compared to the baseline period (1992 to 2020).
Water 16 01317 g010
Figure 11. Variation in SPI-1 under RCP 8.5 scenarios for the 2030–2060 period, compared to the baseline period (1992 to 2020).
Water 16 01317 g011
Figure 12. Variation in probability exceedance of flow indices Q10 and Q50 relative to the baseline period (2005 to 2020) under RCP 2.6 and 8.5 scenarios.
Water 16 01317 g012
Figure 13. Percentage difference in MAM7 under RCP 2.6 and RCP 8.5 (top) and the MAM30 under RCP 2.6 and RCP 8.5 (bottom) relative to the base period 2005–2020.
Water 16 01317 g013
Figure 14. Average annual and seasonal baseflow index (BFI) variation and percentage change relative to the base period 2005–2015 under RCP 2.6 and 8.5.
Water 16 01317 g014
Figure 15. Variation in the cumulative deficit volume over the baseline period (i.e., 2005–2020) and the design horizon (i.e., 2030–2060). Note: Deficit volume was calculated by considering the drought events that last for eight or more consecutive days with respective flow rates below the design threshold value of 3.0 m3/s.
Water 16 01317 g015
Table 1. Data used in the study.
DataResolutionSource
DEM30 m × 30 mSurvey Dpt., Sri Lanka
Land use-Survey Dpt., Sri Lanka
Soil data-Survey Dpt., Sri Lanka
RainfallDailyDpt. of Meteorology, Sri Lanka
EvaporationDailyDpt. of Meteorology, Sri Lanka
StreamflowDailyIrrigation Dpt., Sri Lanka
Reservoir and power plant dataDailyCeylon Electricity Board, Sri Lanka
Table 2. Basin model components and parameters.
Model ComponentParameterUnitsMethod of EstimationOptimum Value *
Canopy
(Simple Canopy)
Initial Storage%Calibration0
Canopy max storagemmLand-use map 1.95–2.23
Crop coefficient-Default1.0
Surface
(Simple Surface)
Initial storage%Calibration0
Surface maximum storagemmLand-use map12.7–20.3
Loss
(Deficit and constant)
Initial DeficitmmCalibration25
Maximum deficitmmSoil map, literature, and calibration80.5–81.7
Constant ratemm/hSoil map, literature, and calibration1.03–1.18
Impervious%Landuse map and calibration5–7
Transform
(Snyder UH)
Standard LaghSnyder UH Method (Ct)13.3–30.5
Peaking coefficient-Cp (ID Technical Guideline) 0.50–0.55
Baseflow
(Linear Reservoir)
GW1 Fraction-Calibration0.05
GW1 CoefficienthBasin characteristics and calibration50.4–136.7
GW1 Initial Dischargem3/s/km2Calibration0
GW2 Fraction-Calibration0.4
GW2 CoefficienthBasin characteristics and calibration430–1088.6
GW2 Initial Dischargem3/s/km2Calibration0.04
Muskingum RoutingKhCalibration1.7–9.95
X-Calibration0.2
Note: * Optimum Value range represents the six sub-basins.
Table 3. Model performance (calibration and validation).
PeriodNSErelMRAEPBIAS (%)RMSE (m3/s)
Calibration2006/20070.850.15−8.634.5
2011/20120.670.245.729.7
Validation2008/20090.840.213.140.7
2009/20100.770.20−5.748.2
2013/20140.740.355.146.3
Continuous Simulation2005–20150.810.20−3.955.1
Table 4. Summary of deficit durations of drought events during the period 2005–2015.
Water Cycles with Drought EventsLongest Deficit Duration (Days)
Simulated flowObserved flowDifference
2006/20073252−20
2011/20121720−03
2008/2009554609
2009/20102329−06
2013/2014232102
Total Number of Deficit days
2005–2015257272−15
Table 5. Summary of the projected deficit events over the design horizon (i.e., 2030–2060).
PeriodEvent NumberYearSeasonNumber of Deficit DaysTotal Deficit Volume (×103 m3)Deficit Intensity (×103 m3/Day)
Historical
(2005–2020)
12009NEM828936
220201st IM8547
RCP 2.6
(2030–2060)
120311st IM1028929
220311st IM35418
32033NEM/1st IM1245338
420331st IM/SWM474945105
52033SWM11108198
62034NEM/1st IM 1597065
72040NEM/1st IM22010
820401st IM524749
92043NEM513828
102044NEM723333
112052NEM45915
122060NEM68013
RCP 8.5
(2030–2060)
12035NEM/1st IM424409105
22036NEM/1st IM43322375
320371st IM25202181
42038NEM/1st IM1373456
520401st IM35323492
62045NEM18144080
72051NEM/1st IM24147161
820531st IM111
920571st IM620634
Note: Deficit volume was calculated by considering the drought events that last for eight or more consecutive days with respective flow rates below the design threshold value of 3.0 m3/s.
Disclaimer/Publisher’s Note: The statements, opinions and data contained in all publications are solely those of the individual author(s) and contributor(s) and not of MDPI and/or the editor(s). MDPI and/or the editor(s) disclaim responsibility for any injury to people or property resulting from any ideas, methods, instructions or products referred to in the content.

