Article

Towards a Better Understanding of the Back-Side Illumination Mode on Photocatalytic Metal–Organic Chemical Vapour Deposition Coatings Used for Treating Wastewater Polluted by Pesticides

by
Cristian Yoel Quintero-Castañeda
1,2,
Claire Tendero
3,
Thibaut Triquet
1,
Paola Andrea Acevedo
2,
Laure Latapie
1,
María Margarita Sierra-Carrillo
2 and
Caroline Andriantsiferana
1,*
1
Laboratoire de Génie Chimique, Université de Toulouse, CNRS, INPT, UPS, 31432 Toulouse, France
2
Faculty of Engineering, Universidad Cooperativa de Colombia, Santa Marta 470003, Colombia
3
Centre Inter-Universitaire de Recherche et d’Ingénierie des Matériaux, Université de Toulouse, CNRS, INPT, UPS, 31432 Toulouse, France
*
Author to whom correspondence should be addressed.
Water 2024, 16(1), 1; https://doi.org/10.3390/w16010001
Submission received: 15 November 2023 / Revised: 7 December 2023 / Accepted: 8 December 2023 / Published: 19 December 2023

Abstract

:
Pesticides are emerging contaminants that pose various risks to human health and aquatic ecosystems. In this work, diuron was considered as a contaminant model to investigate the influence of the back-side illumination mode (BSI) on the photocatalytic activity of TiO2 coatings grown on Pyrex plates by metal–organic chemical vapour deposition (MOCVD). A photoreactor working in recirculation mode was irradiated at 365 nm with ultraviolet A (UVA) light-emitting diodes in BSI. The degradation of diuron and its transformation products was analysed by high-performance liquid chromatography, ion chromatography, and total organic carbon analysis. The coatings were characterised by X-ray diffraction analysis and scanning electron microscopy. Five coatings containing 3, 7, 10, 12 and 27 mg of TiO2 exhibited different morphology, crystallinity, thickness and photocatalytic activities. The morphology and crystallinity of the coatings had no significant influence on their photocatalytic activity, unlike their mass and thickness. TiO2 contents less than 10 mg limit the photocatalytic activity, whereas those greater than 15 mg are inefficient in the BSI because of their thickness. The maximum efficiency was achieved for coatings of thickness 1.8 and 2 µm with TiO2 contents of 10 and 12 mg, revealing that the photocatalyst thickness controls the photocatalytic efficiency in the BSI.

Graphical Abstract

1. Introduction

In the field of water treatment, emerging contaminants (ECs) are a major concern [1,2,3]. Even at very low concentrations (in the order of less than micrograms per litre), such contaminants and their transformation products (TPs) can have extremely harmful effects on human health and the environment [4]. Among the different types of ECs, synthetic pesticides are of particular concern [5,6,7] because of their potential for long-distance transport through the hydrological cycle [8,9,10] and their sustainability in the environment accompanied by their high toxicity and bioaccumulation capacity; hence, they pose hazards to ecosystem stability and living beings [11]. Pesticides are being increasingly used in urban areas because of their wide spectrum of applications as herbicides, fungicides and insecticides [10], and they are widely used in gardening, road and railway weed control [12] and treatments for pets [13,14]. They are mainly detected in surface water [10,15], groundwater [16,17] and wastewater [18,19,20]. Wastewater treatment plants using conventional physico-chemical and biological processes may be inefficient for degrading such pollutants. For example, in various wastewater treatment plants [21,22,23], the herbicide diuron has been reported with very similar concentrations in the effluents (29.1–2393.1 ng L−1) and influents (28.4–2526.1 ng L−1). These data highlight the limitations of conventional processes for degrading ECs and the need for appropriate technologies at the tertiary treatment stage.
Among the various treatment processes adapted for degrading organic micropollutants in water, heterogeneous photocatalysis with titanium dioxide (TiO2) [24], zinc oxide (ZnO) [25], nanocomposites such as tungsten oxide doped (WO2/g-C3N4) [26], bismuth ferrite (BFO) [27] and other semiconductors have been widely studied. They generate strong oxidant radicals that react non-selectively with pollutants, initiating a series of oxidation reactions that degrade the contaminants and their TPs. Among these semiconductors, TiO2 is one of the most interesting and comprehensively studied photocatalysts for degrading pesticides as it works at room temperature and pressure and has the advantages of high chemical stability, resistance to photocorrosion, high photon absorption efficiency, large specific area, low electron–hole recombination rate and low cost [24,28,29,30].
However, despite its excellent photocatalysis yield, TiO2 has not been widely used at industrial scales because it is mostly commercially available as a nanometre-powder, which requires an additional expensive filtration step after use. This requirement makes the process expensive, tedious or even prohibitive because of the risk of carcinogenic effects [31]. To avoid the separation step required for TiO2 powder, attempts were made to immobilise TiO2 on a wide range of supports, such as membranes [16], activated carbon [32], metals [33] and glass [34]. These attempts involved deposition techniques such as metal–organic chemical vapour deposition (MOCVD) [35], plasma-assisted coating [36], sol–gel deposition [37] or impregnation [38]. Each of these techniques presents different challenges, such as mass transfer limitations, photocatalyst deactivation and leaching [39]. MOCVD is an excellent solution to overcome the challenges of photocatalytic coatings; nevertheless, it has a low degradation rate, which is a common problem in the case of supported photocatalysts unlike in the case of powder forms [34].
The implementation of a photocatalytic process with supported TiO2 on an industrial scale is strongly limited by the photonic efficiency and lighting mode. Two modes can be considered: front-side illumination (FSI) and back-side illumination (BSI) modes [40]. FSI is the most studied mode and it has been used at the laboratory scale for research on photocatalysts; meanwhile, although BSI is of greater interest for industrial applications, it has been less studied [41]. In the FSI configuration, illumination first passes through the fluid and then radiates to the front through the photocatalytic coating [42]. This mode has the limitations that non-turbid water and shallow reactors should be used to maintain the photonic efficiency of the system; however, its advantage is that any type of support material can be used. In contrast, in the BSI configuration, the illumination first passes through the support material, then passes through the rear part of the photocatalytic coating and finally through the fluid [43]. This configuration solves the limitations of the FSI mode by allowing the use of both real turbid water and deep reactors. Its disadvantages are that only glass supports that allow passage of light can be used and that little information is available on the influence of the intrinsic characteristics of the coatings (such as crystallinity, morphology, mass and/or thickness) on the photocatalytic activity. Photocatalytic TiO2 coatings under FSI have been extensively studied for different deposition techniques [33,36,44,45,46,47]. Meanwhile, only few studies have examined the BSI mode [41,42,43]. These studies mainly dealt with modelling the optimal coating thickness for the TiO2–P25 impregnation technique.
The target molecule in this work was diuron (3-(3,4-dichlorophenyl)-1,1-dimethylurea), which belongs to the group of herbicides composed of ureas with substituted chemical groups [8]. It has been identified as a compound with carcinogenic effects [48]. Owing to its transport capacity in the aquatic environment and inhibitory action on photosystem II, it is one of the most toxic herbicides found in coastal areas, affecting the development of corals, grasses and marine microalgae [49,50]. The degradation of diuron by heterogeneous photocatalysis with TiO2 has been studied [51,52,53,54] and seems to be one of the most optimal AOPs for the complete mineralisation of the herbicide and its TPs [12,55,56]. As far as we know, no studies have reported the degradation of diuron with TiO2 MOCVD coatings in the BSI mode.
Hence, with regard to photocatalytic coatings in the BSI mode, there is a lack of information on their application for water treatment and there is a need for insight into the role of the intrinsic characteristics of the coating in determining the degradation rate. In this context, the primary objective of this work was to study different TiO2 coatings deposited via MOVCD and the relationship of the morphology, crystallinity and mass/thickness of the coatings with their photocatalytic activity in the BSI mode for degrading diuron present in water. After exploring these aspects, a comprehensive study was performed using the most efficient coating to explore the long-term reuse of the material, mineralisation of the pesticide and possible reaction pathways.

2. Materials and Methods

2.1. Chemicals

The diuron (C9H10Cl2N2O, ≥98%), N-demetoxylinuron (C8H8Cl2N2O, 95%), 1-methylurea (C2H6N2O, 97%), 1,1-dimethylurea (C3H8N2O, 99%), titanium tetraisopropoxide (TTIP, 97%) and powdered TiO2 (Degussa P25, 99.5%) were purchased from Sigma Aldrich (Darmstadt, Germany). Solutions were prepared in distilled water. Borosilicate glass (Pyrex) substrates (138 × 18 × 3 mm) were purchased from Verre Vagner (Toulouse, France). The physico-chemical properties of diuron are summarised in Table S1.

2.2. TiO2 Coatings by MOCVD

TiO2 coatings were grown in a tubular, horizontal hot-wall reactor, as described in [57], on borosilicate glass substrates. The metal–organic precursor (TTIP) was thermally regulated in a bubbler and carried to the deposition zone with 99.999% pure nitrogen as the carrier gas. Different operating conditions were applied to obtain coatings with different characteristics (Table 1). The coating was performed in two steps, and the sample was rotated by 180° after each step to improve the homogeneity of the coating; this precaution reduced the influence of precursor depletion in the gas phase that results in a deposition rate gradient. Each coating was identified as follows: C-X, where C stands for coating and X, the rounded value of TiO2 mass (in milligrams) that was deposited on the glass substrate. The samples were weighed before and after deposition to determine the mass of the coatings.

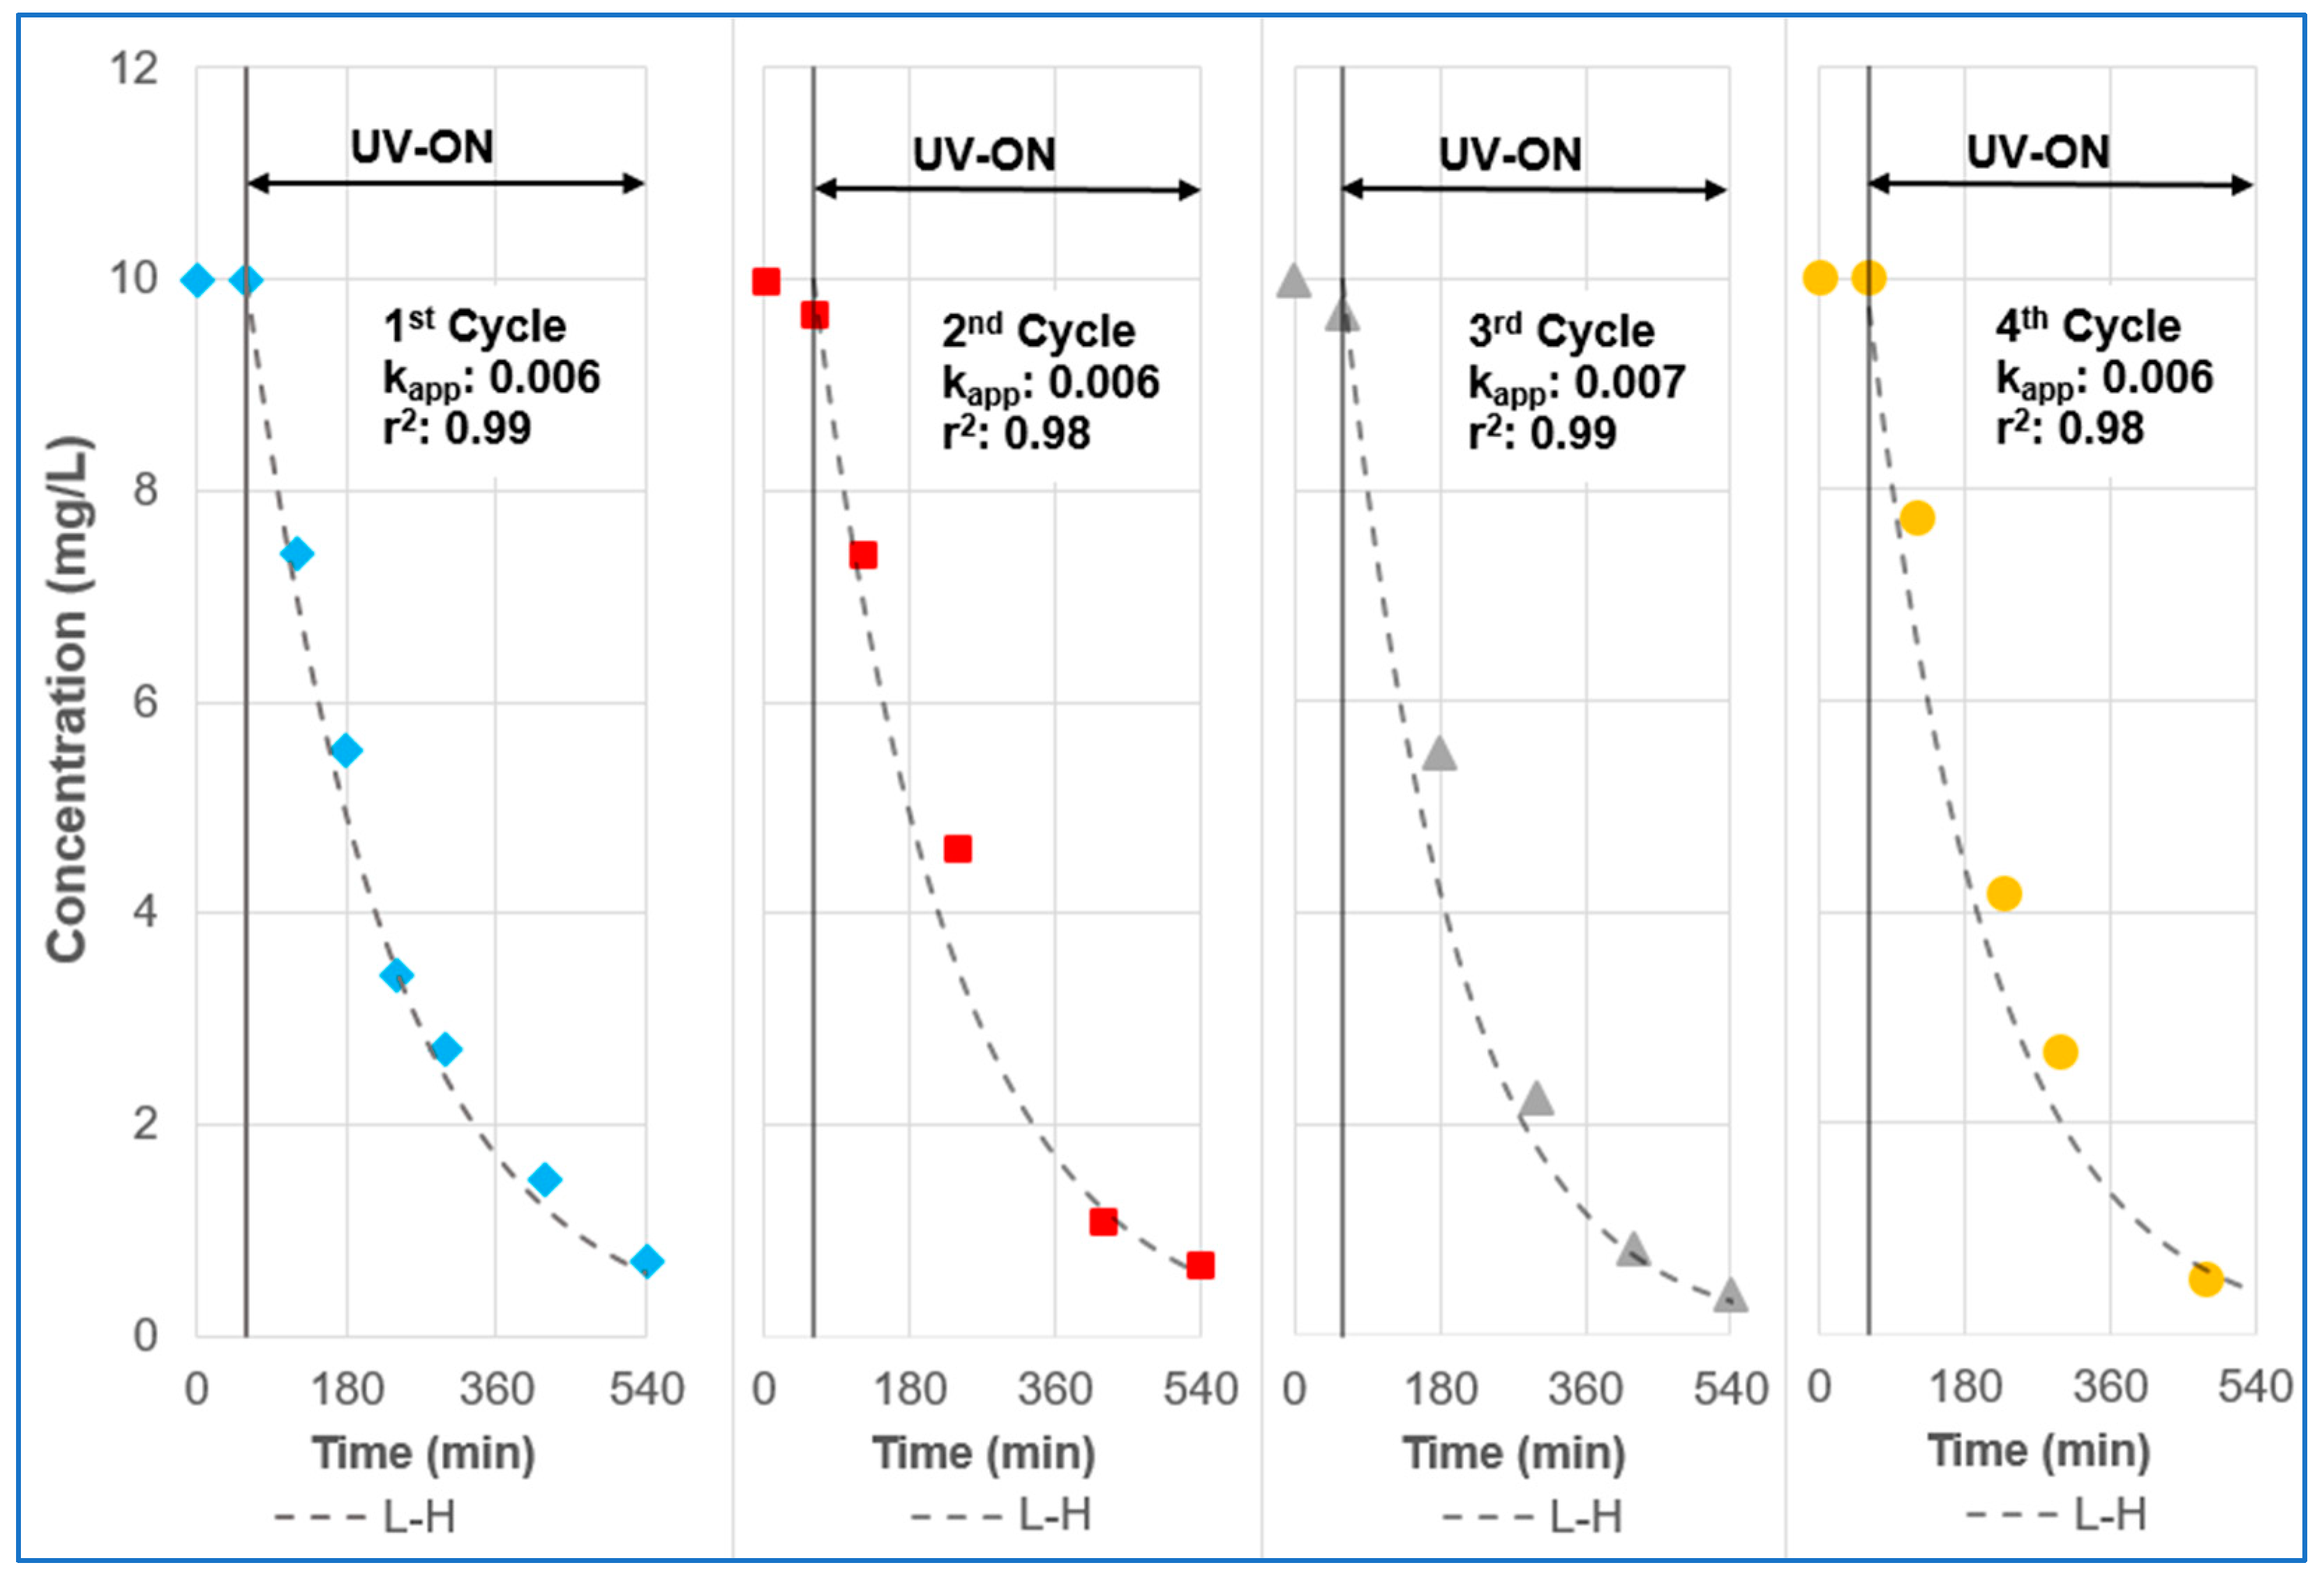
2.3. Photocatalytic Degradation Experiments

All the experiments (adsorption, photolysis and photocatalysis) were conducted in the experimental device shown in Figure S1. The reactor was a 16 mL stainless-steel reactor (12 × 10 × 130 mm3) with a glass window at the top. This window was located directly under a panel of monochromatic ultraviolet A (UVA) (365 nm) light-emitting diodes (LEDs) (LED Engineering, Montauban, France). Diuron solution (10 mg L−1 and 100 mL) was circulated from an intermediate storage tank to the reactor at 200 mL min−1 by a peristaltic pump. In this study, pH was not adjusted to fit real industrial conditions as closely as possible (without adding any chemical products). To control the temperature at 25 °C (±1 °C), the storage tank was immersed in a thermostatic bath at 25 °C and the reactor and LEDs were placed in a continuously ventilated chamber.
The experimental protocol for the photolysis and photocatalysis experiments comprised a 60 min recirculation of the diuron solution in the dark (UV-OFF) to achieve an adsorption equilibrium and a subsequent 480 min recirculation under constant irradiation (10 mW cm−2) of the glass window (UV-ON). Depending on the experiment, the window was made of either bare borosilicate glass (for adsorption, photolysis and photocatalysis with powder TiO2–P25 (0.12 g L−1)) or borosilicate glass with TiO2 MOCVD coating (for photocatalysis with C-3, C-7, C-10, C-12 and C-27). Every 60 or 120 min, a 2 mL sample of the solution was collected from the storage tank and filtered with a 0.45 µm nylon filter. The filtered solution was analysed by high-performance liquid chromatography with UV spectroscopy and mass spectrometry (HPLC–UV/MS). The remaining solution at the end of the experiments (≈85 mL) was used for TOC analysis and inductively coupled plasma optical emission spectroscopy (ICP-OES) analyses. The protocol for the C-12 coating reuse tests was the same as described above, but it included an additional step for cleaning the system by recirculating 100 mL of distilled water for 30 min between each cycle.

2.4. Characterisation of Materials (TiO2 Coatings and Diuron)

X-ray diffraction (XRD) analysis was performed to identify the crystalline structure of the coatings. Scanning was performed using an X-ray diffractometer (GI-XRD, Bruker D8, Karlsruhe, Germany) equipped with a Cu Kα source (1.54060 Å), under a 2° grazing incidence, in the 2θ mode from 20° to 80° in steps of 0.02° and 2 s of integration time. The morphology was observed by scanning electron microscopy (SEM, LEO-435 VP-PGT, Cambridge, UK). Calowear equipment (CSEM Calotest, Dephis, Étupes, France) with a stainless-steel ball of diameter 20 mm was used to estimate the thickness of the coatings by measuring five spherical wear scars evenly distributed on the surface of each sample. The arithmetic roughness was deduced by mechanical profilometry analysis (DektakXT, Bruker, Billerica, MA, USA): 10 scans (length: 10 mm) were performed on each sample using a tip with a radius of 2 µm. Finally, the absorbance spectra of diuron were recorded by UV–Vis spectrometry (Perkin-Elmer LAMBDA 19, Norwalk, CT, USA).

2.5. Analytical Methods

The diuron concentrations were determined by HPLC–UV. The equipment used was a Thermo Accela HPLC-PDA (Shimadzu, Kyoto, Japan), implementing a C-18 Thermo Scientific (Waltham, MA, USA) Acclaim PA2 column (particle size: 2.2 μm, inner diameter: 2.1 mm and column length: 150 mm). Samples (10 µL) were injected into the column and UV detection was performed at 254 nm. A gradient method was used with a mobile phase composed of acetonitrile (A) (≥99.9%) and ultrapure water acidified with 0.1% formic acid (B). The mobile phase gradient started at a ratio of 20%A/80%B, until it reached a ratio of 75%A/25%B in 20 min. This ratio (75/25) remained constant for 2 min and then decreased in 3 min to the initial ratio (20/80); the 20/80 ratio was maintained for another 3 min. The total analysis lasted 28 min with a constant flow rate of 0.3 mL min−1.
Some diuron TPs were detected and quantified by HPLC-MS, while some could only be assumed to be detected. For this purpose, a Thermo Fisher UltiMate 3000 UHPLC (Sunnyvale, CA, USA) instrument connected to an Orbitrap high-resolution mass spectrometer (HRMS-Exactive, Waltham, MA, USA) was used. The electrospray ionisation (ESI) source was programmed in the positive mode with a capillary, tube lens and skimmer voltage of 35.00 V, a capillary temperature of 300 °C and a spray voltage of 5.00 kV. The same C-18 column and gradient method as those used in the HPLC–UV analyses were implemented. Three certified standards (N-demetoxylinuron, 1-methylurea and 1,1-dimethylurea) were used to confirm the TPs detected.
A TOC-L direct analyser (Shimadzu, Japan) was used to monitor the mineralisation of the pollutant. In each experiment, two samples were analysed—the initial and final solutions. Each sample was measured twice to determine the total carbon (TC) concentration in the first analysis and the inorganic carbon (IC) concentration in the second one. From the difference between TC and IC, the TOC concentration in the solution was determined.
Cl ions and carboxylic acids (formic and acetic acids) were quantified by high-pressure ion chromatography (HPIC) using a Thermo Scientific ICS 5000+ ion chromatograph equipped with a conductometric detector and an AS19 anion column (4 μm, 2 × 250 mm). KOH (5 mM) solution was used as the mobile phase for 10 min; this was followed by an increase in the KOH concentration for 15 min to reach a value of 45 mmol L−1. The solution was maintained at this KOH concentration for 10 min and subsequently, the KOH concentration decreased to the initial condition in 2 min. The total analysis time was 37 min, and a constant flow rate of 0.25 mL min−1 and a temperature of 25 °C were maintained during this time.
Finally, an ICP-OES spectrometer (Ultima2, Horiba, Kyoto, Japan) was used to measure the Ti concentration in the final solution of the experiments that involved TiO2 coatings. The Ti concentration was measured to investigate the strength of the coatings. The equipment has a concentric glass nebuliser and glass cyclonic spray chamber, and its operating conditions are as follows: power, 1100 W; plasma gas (Ar) flowrate, 12 L min−1; and pump speed, 15 rpm.

3. Results and Discussion

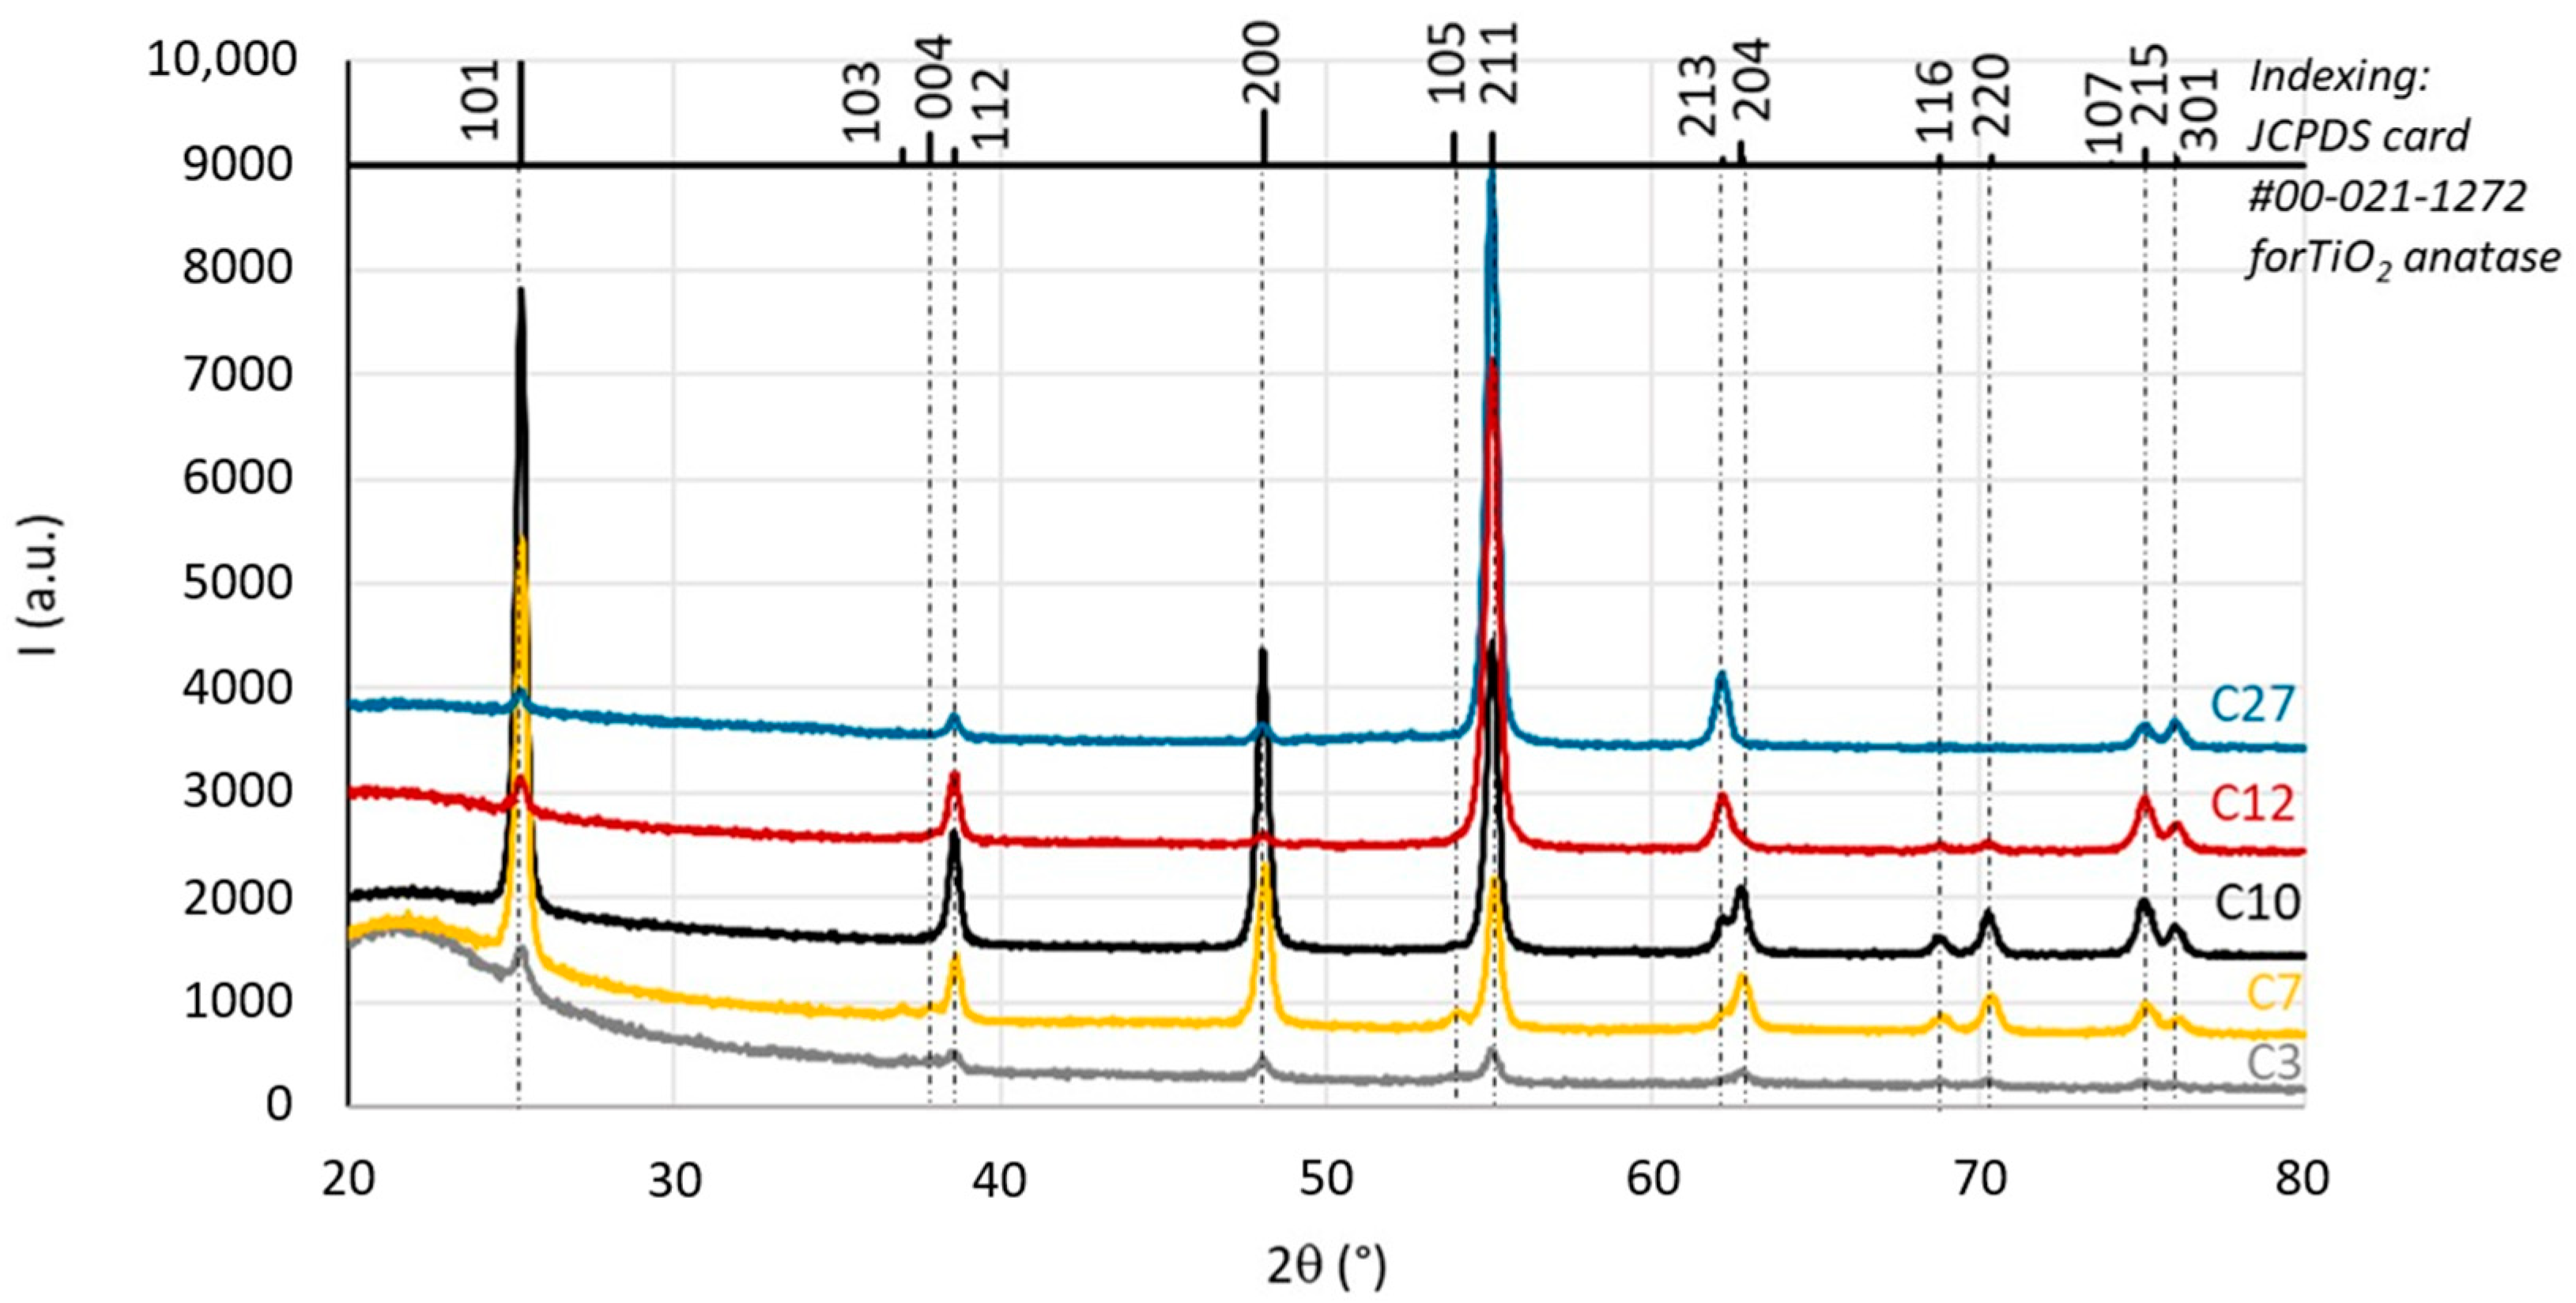
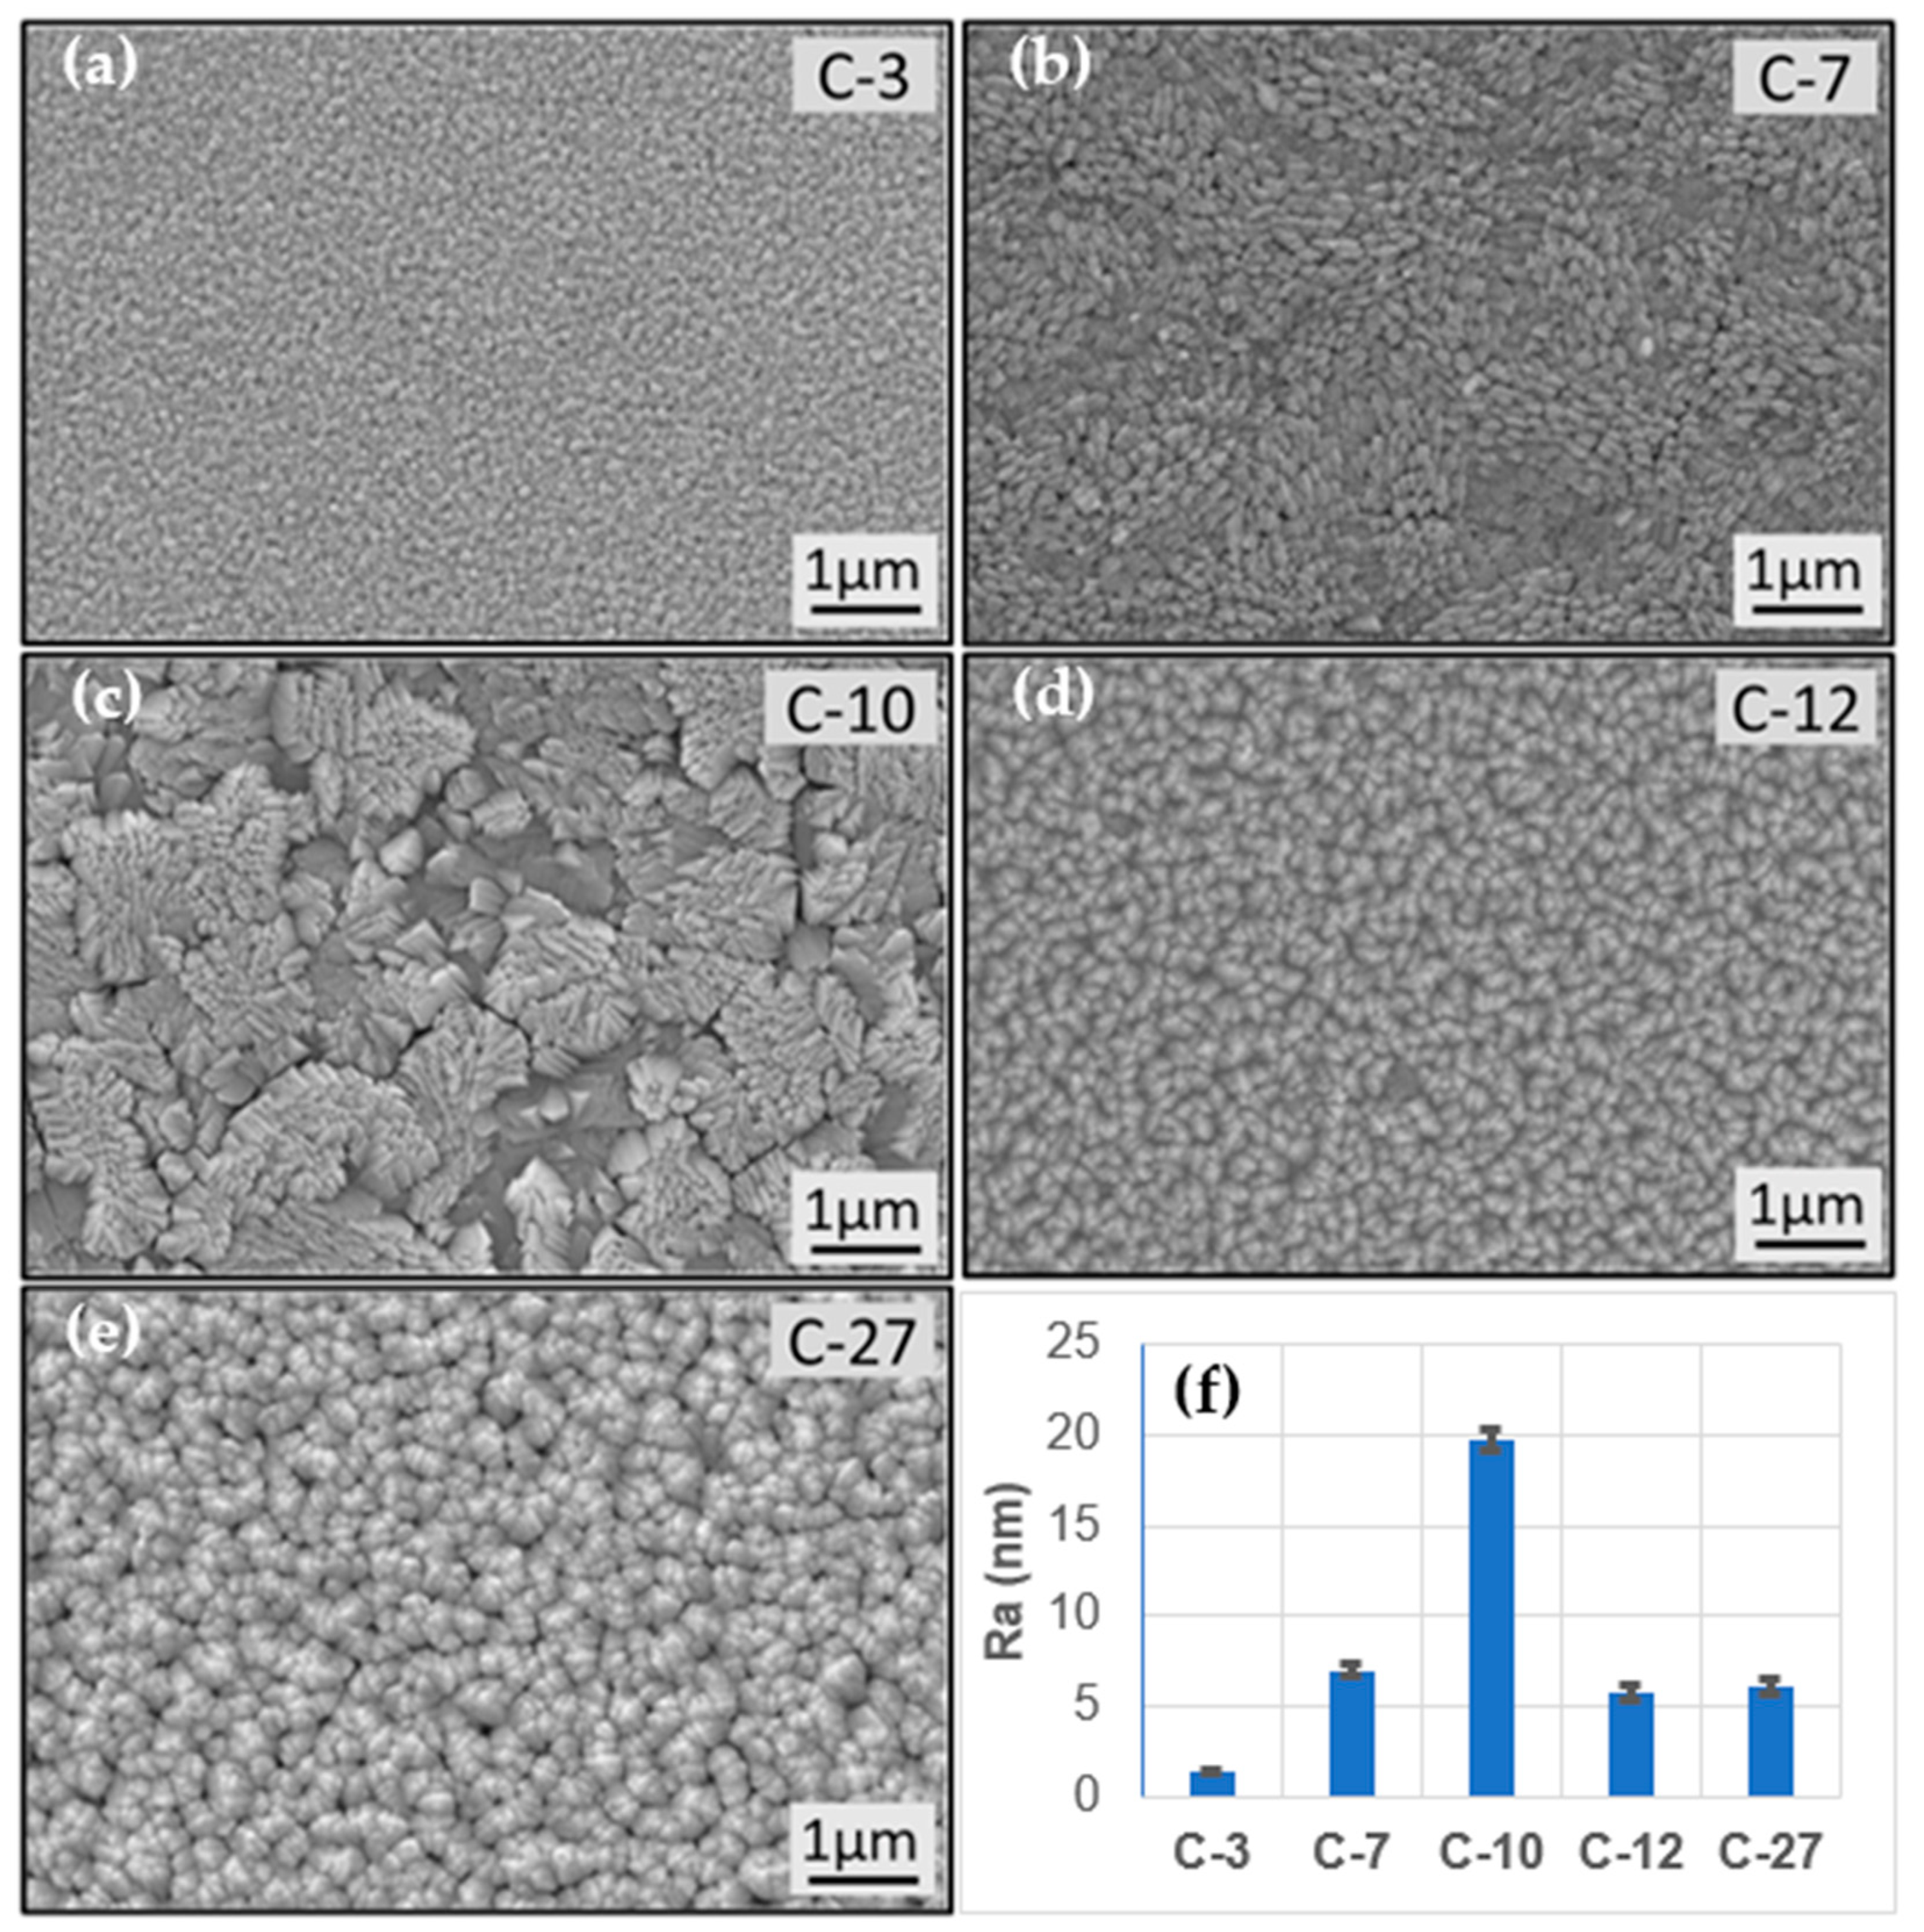
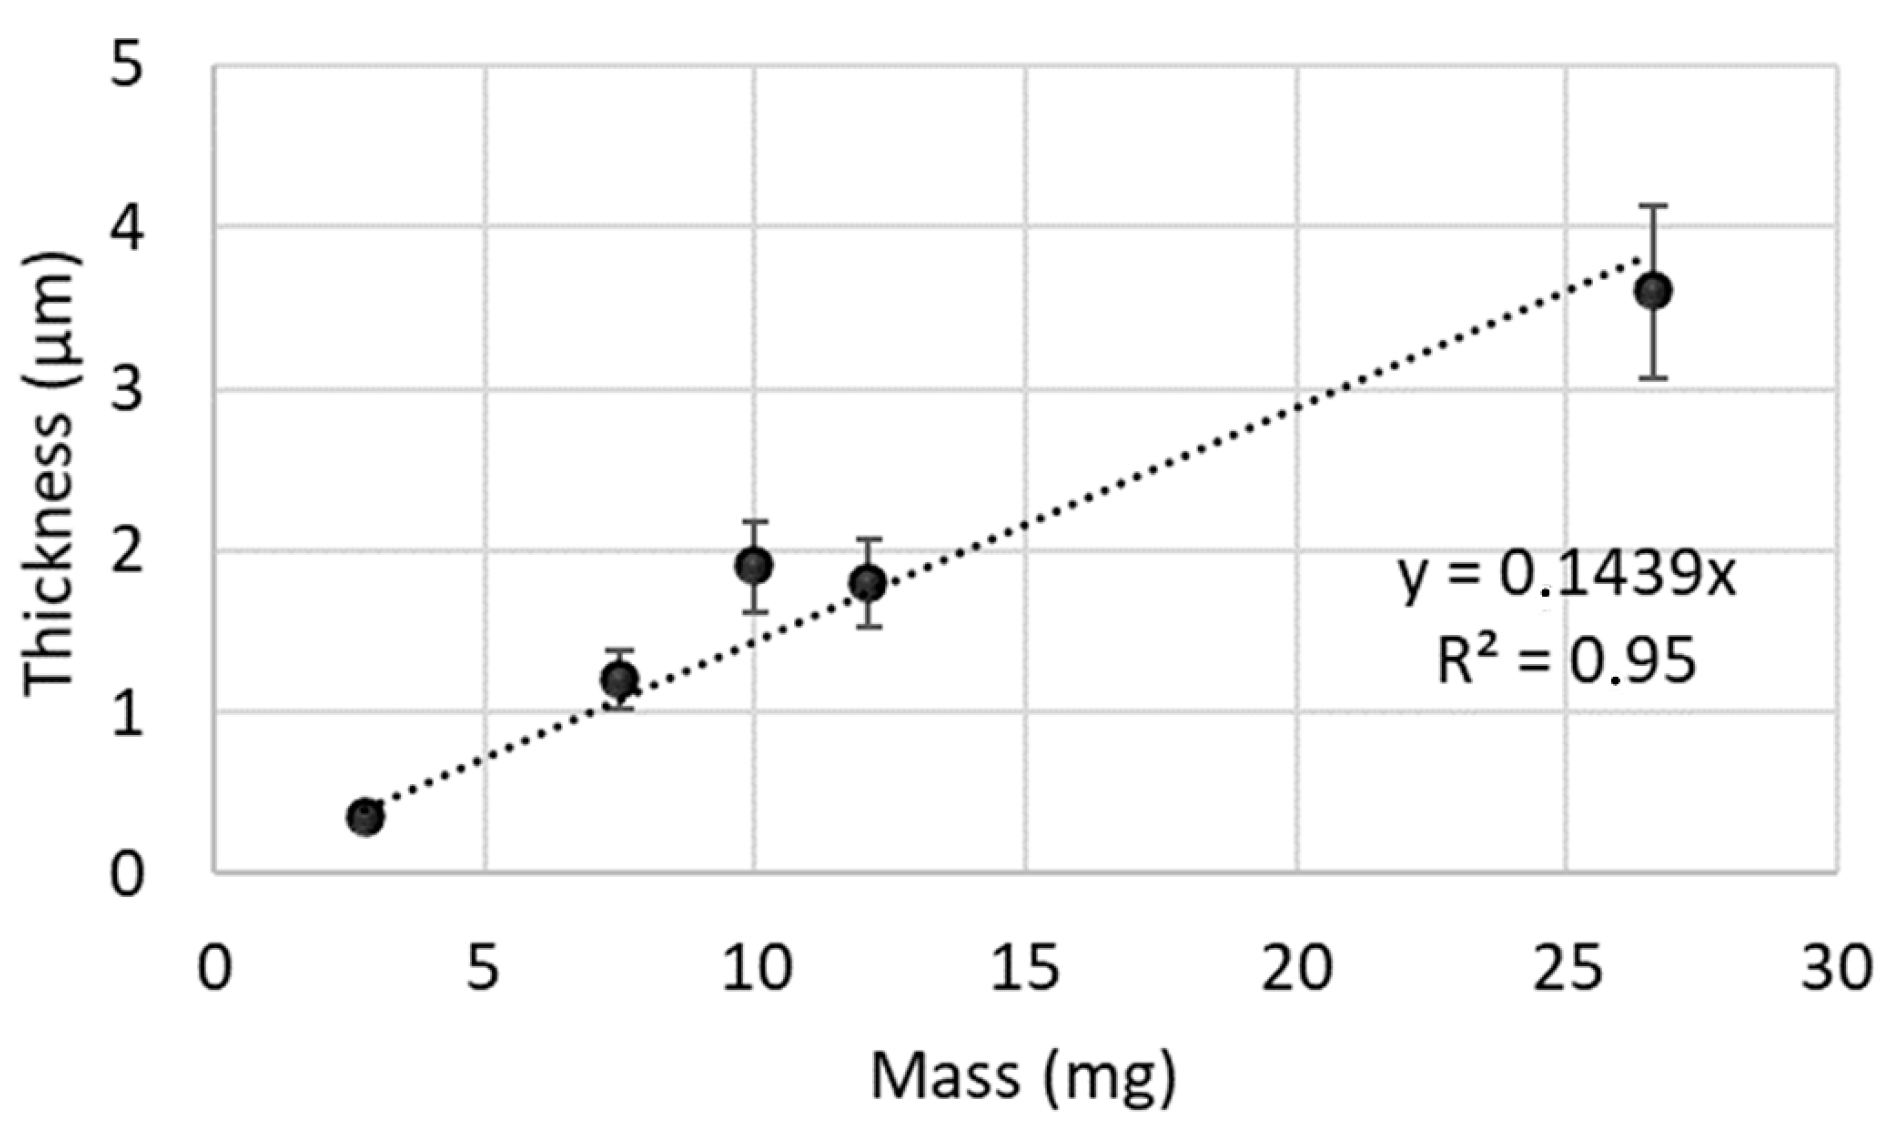
3.1. Characterisation of TiO2 Coatings

The coatings were characterised in terms of their crystalline structure, morphology, thickness and roughness by XRD, SEM, calotest and profilometry analysis, respectively, as described in Section 2.4. Figure 1 shows the XRD patterns of C-3, C-7, C-10, C-12 and C-27, indicating the crystalline structure of pure anatase TiO2 for all coatings. Representative peaks were observed at 2θ values of 25.3°, 38.61°, 48.09°, 55.11°, 62.17°, 62.75°, 68.82°, 70.36°, 75.10° and 76.09° corresponding to (101), (112), (200), (211), (213), (204), (116), (220), (215) and (301) crystalline planes, respectively, in agreement with JCPDS card # 00-021-1272. The patterns did not show any peaks originating from rutile or brookite, which are the forms of TiO2 that exhibit less photocatalytic activity compared to anatase [33,58].
The C-3 diffractogram presents an important background signal originating from a strong contribution of the substrate (in spite of the grazing incidence of the X-ray source) because of the low coating thickness. The relative intensities of the diffraction lines for C-10 and C-7 coatings are rather close to the ones that are referenced in the JCPDS card #00-021-1272: i.e., the (101) line being the most intense, followed by the (200), (211) and (004) lines. For the C-3 coating, a slight (211) texturation is starting to appear as (211) and (101) have similar intensities. Finally, coatings C-12 and C-27 clearly present a (211) preferential orientation and an inversion of the relative intensities of the (213) and (204) peaks.
Figure 2 shows the SEM images and roughness values of the coatings. Although all the samples are completely covered by a crack-free and uniform layer, they reveal different morphologies. C-3 presented the finest morphology with small prismatic grains because of its short deposition time and the low mass of TiO2 deposited (2.8 ± 0.2 mg and 2 × 20 min), which limit the growth of the grains. In contrast, C-10 presents the coarsest, most angular and lamellar morphology, likely because of its higher TTIP mole fraction (5.1 × 10⁻⁴) that causes rapid nucleation with small grains that agglomerate into larger crystallised structures owing to the constant availability of the precursor. This peculiar morphology results in an apparent inhomogeneity of the crystalline growth that is in contrast with the growth of C-3, C-12 and C-27.
C-7 also shows an apparent disorganisation with a smaller grain size. C-12 and C-27 exhibit a morphology similar to that of C-3, with evenly textured grains that become larger as the deposition time increases. Roughness values ranging from 1.4 ± 0.1 nm to 19.7 ± 0.6 nm confirm this evolution of morphology: the finest morphology corresponds to the lowest roughness and vice versa. These two types of morphology (evenly textured and apparent inhomogeneity) can be correlated with the XRD responses that show that the evenly textured grains seen in Figure 2d,e correspond to the preferential orientation of (211).
These observations are in agreement with the literature: it was previously reported that the deposition temperature (475 °C) is in the range that favours the columnar growth of the coating [59]. The grains seen in Figure 2a–e are, therefore, the heads of the columns. From the Arrhenius plot [60], we see that the growth is no longer controlled by surface reaction but by mass transfer. Therefore, the precursor mole fraction plays a major part in determining the growth. The column size and growth mode directly depend on the precursor concentration: the higher the precursor concentration, the wider are the columns [61]. This concentration also influences the column orientation.
To further highlight the influence of different morphologies on the resulting characteristics and properties of the coatings, the apparent densities were examined on the basis of thickness measurements (via the calotest, see Figure 3a) versus the mass. The results are shown in Figure 4. The plots (thickness vs. mass) of C-3, C-7 and C-12 are linearly distributed; the plot of C-27 is also linearly distributed but has a higher deviation due to higher deposition time. In a similar range of deposition time, C-10 seems slightly less dense (or more porous) than the other coatings. This deviation takes into account both measurement uncertainty and thickness gradient.
This latter gradient is highlighted by the analysis of the calotest crater by mechanical profilometry (see Figure 3b): the profile reveals the influence of the depletion of the precursor (TTIP) concentration in the gas phase that flows along the horizontal axis of the cylindrical CVD reactor, as highlighted in the literature [62]. For the example shown in Figure 3b, measurement was performed at the extremity of the substrate, where the influence of depletion of TTIP is high: in step one, the extremity is the zone farthest from the precursor introduction, whereas in step two (after the 180° rotation), it is the closest one.

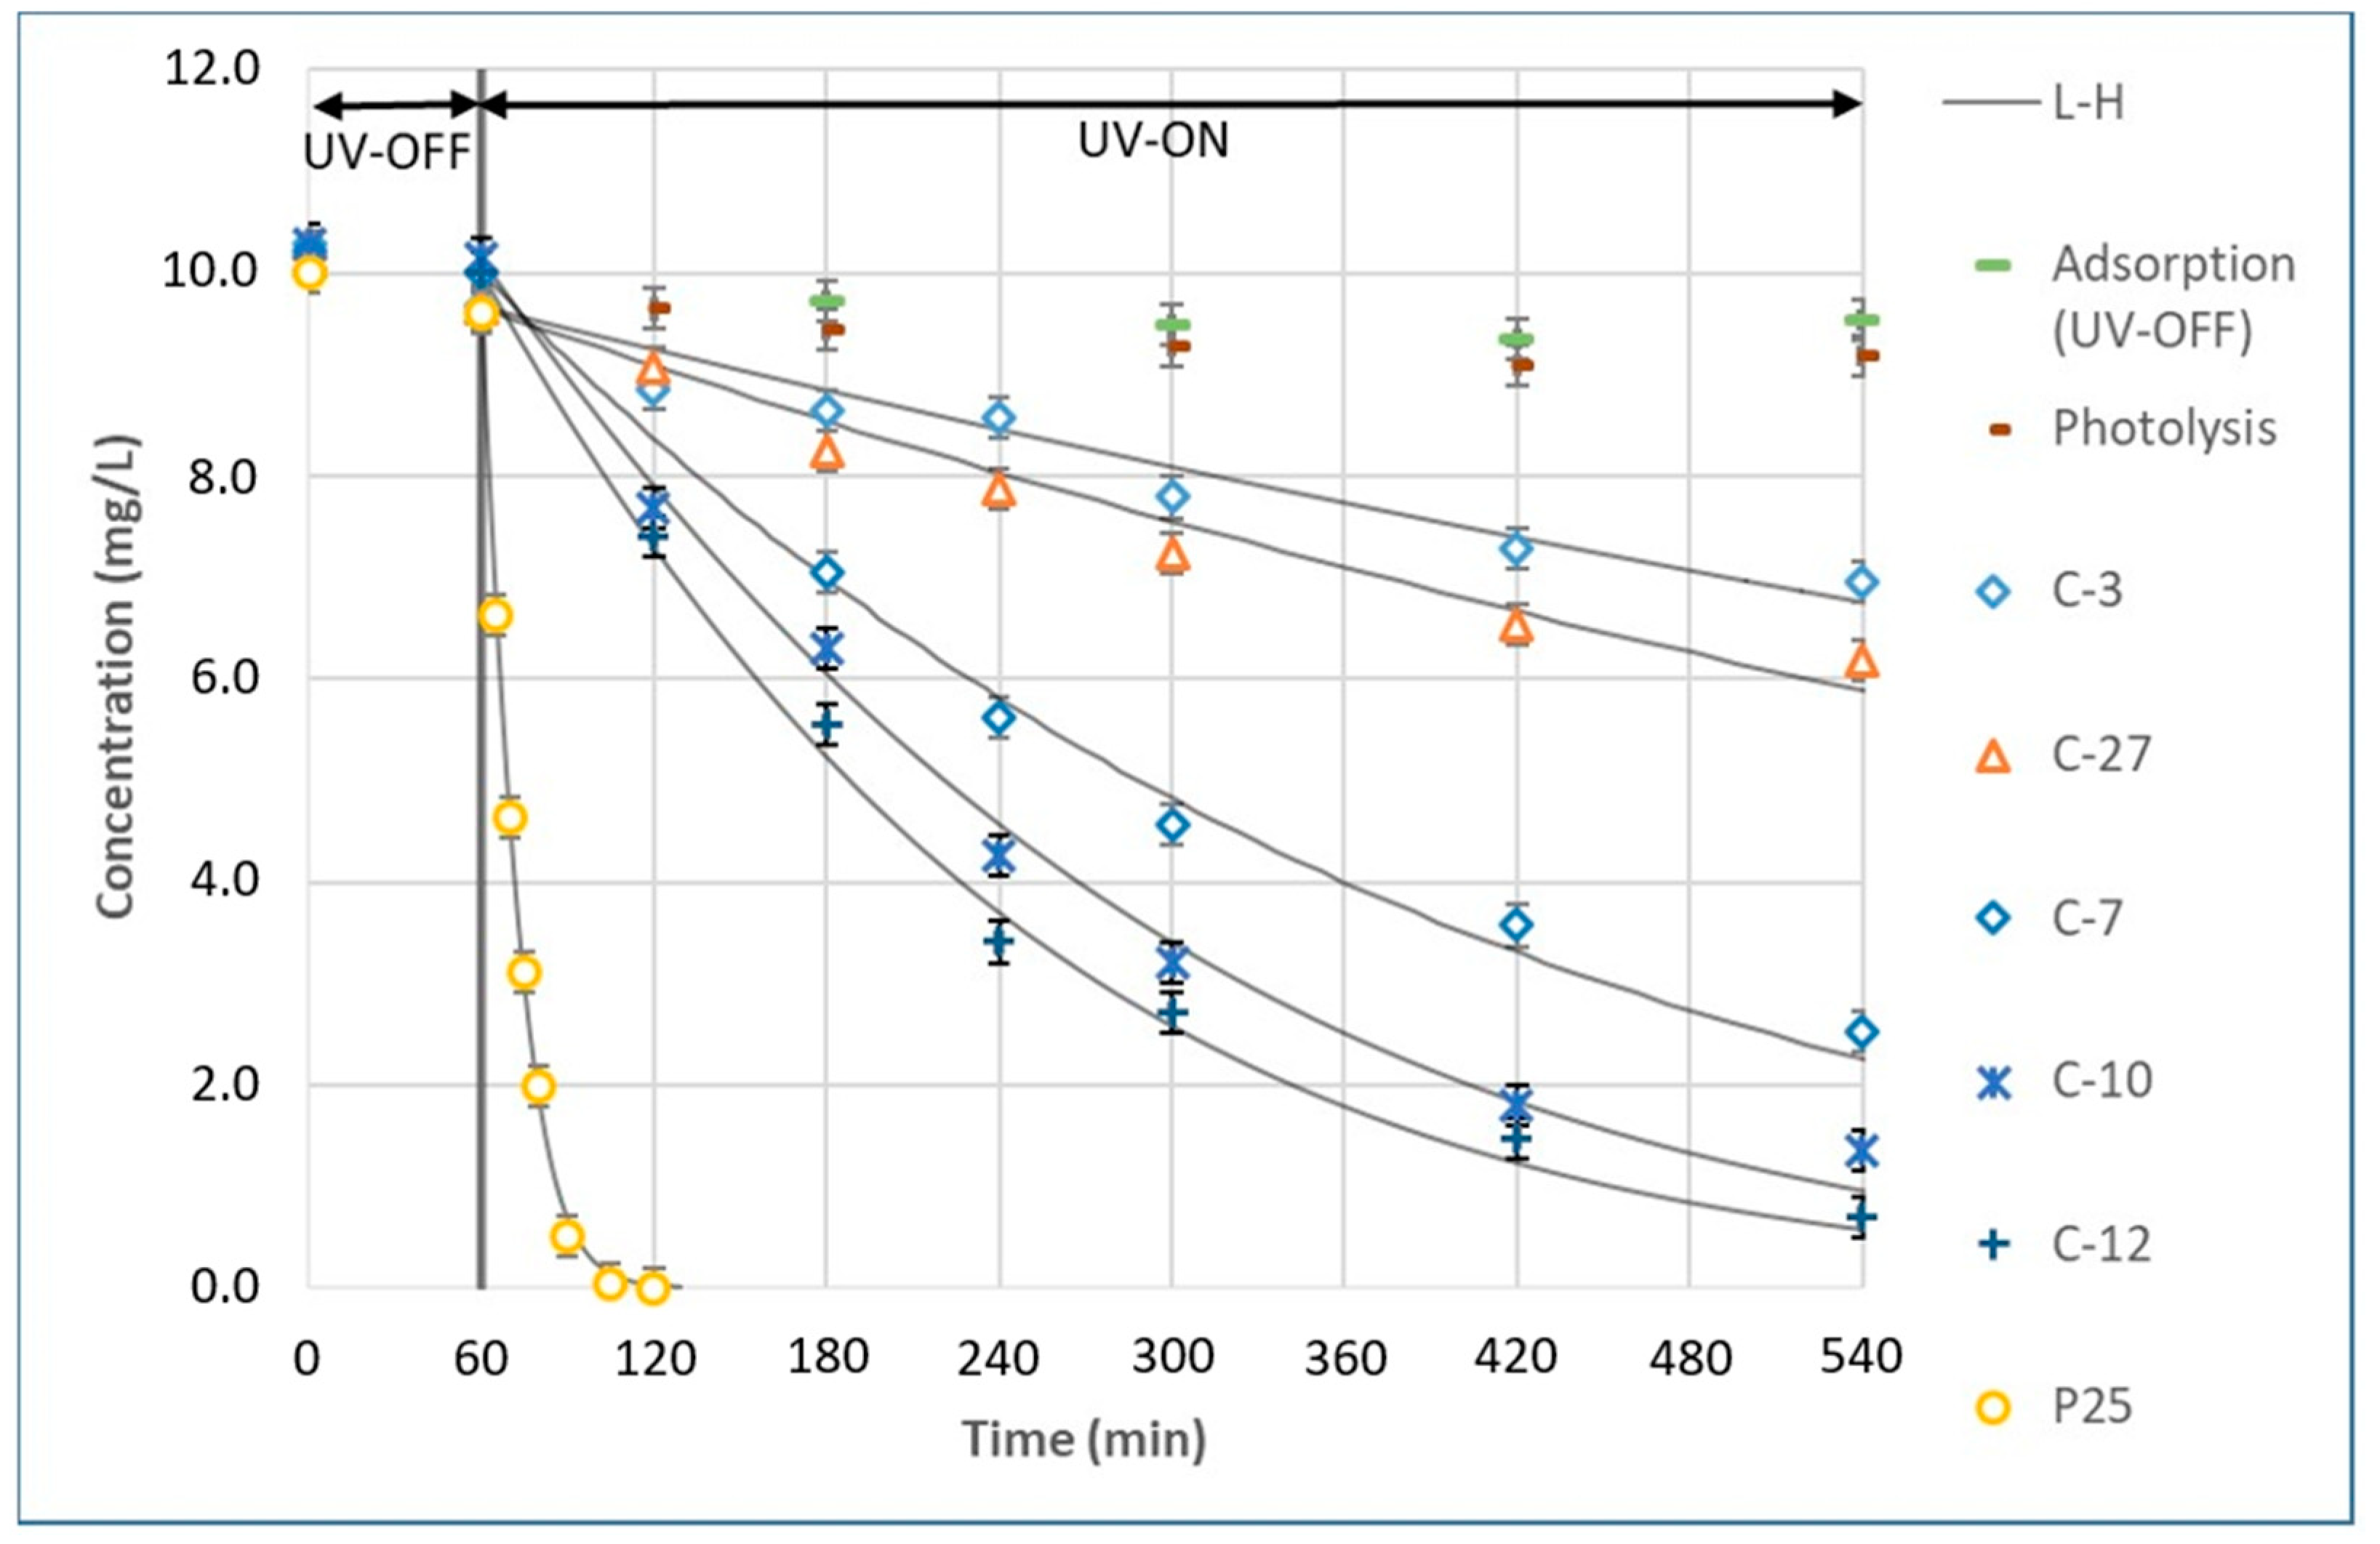
3.2. Photocatalytic Degradation and Kinetics Model

Figure 5 depicts (i) diuron adsorption inside the system, (ii) diuron photolysis (without TiO2) and (iii) diuron photocatalytic degradation with TiO2 (both coatings and P25 powder). Diuron elimination in the dark, without any catalyst, was 5% after 540 min. As expected, a small amount of diuron was adsorbed on the system (reactor, tubes and glass) and diuron evaporation was negligible under these experimental conditions [63]. In addition, degradation by photolysis under LEDs (UVA 365 nm) without the catalyst was low (<10% after 540 min). This result confirms that diuron is a very stable molecule and thus a problematic EC in water because it absorbs mainly in the UVC wavelength range (Figure S2). Indeed, several studies reported that the diuron half-life time (DT50) is greater than 70 days in the environment [63,64,65].
For all experiments conducted with a photocatalyst, low adsorption of diuron on both the system and catalyst (less than 6%) was observed during the first 60 min without UV light. Under irradiation, the concentration decreased at different rates showing the different performances of the catalysts. The catalysts ranked from the least to the most effective for diuron elimination (for 8 h of irradiation) are as follows: C-3 (32%), C-27 (40%), C-7 (75%), C-10 (87%), C-12 (93%) and P25 (100%). The differences in the performances of the coatings can be explained by the differences in the amount of TiO2 and their physico-chemical characteristics. Indeed, C-3 has the least TiO2 (3 mg), followed by C-7 (7 mg). C-27 has the highest amount of TiO2 in this study (27 mg), which is likely to screen the incident radiation. C-10 (10 mg) and C-12 (12 mg) have average amounts of TiO2 that may be close to the optimal amount. Moreover, the growth of the TiO2 layers by MOCVD depends on the operating conditions (temperature, precursor mole fraction, duration, etc.), which influence the morphology, texture, crystalline structure and amount of catalyst deposited. The relationship between performances and coating characteristics will be discussed in Section 3.3.
The obtained results were compared to the performances of a commercial TiO2 powder P25. A concentration of 0.12 g L−1 was selected to compare this commercial photocatalyst to TiO2 coating C-12 (12.1 ± 0.2 mg TiO2). C-12 required 240 min to degrade more than 50% of diuron (DT50) and 480 min to reach 90% elimination (DT90). For P25, DT50 was reached after 10 min and DT90 after 30 min; total elimination was achieved after 2 h. These results obtained with P25 agree well with the literature. Amorós-Pérez et al. [45] reported DT90 and DT50 at 30 and 10 min, respectively, for the removal of 10 mg L−1 diuron with 0.1 g L−1 P25. Katsumata et al. [54] reported DT90 and DT50 at 25 and 8 min, respectively, for treating 10 mg L−1 diuron with 0.5 g L−1 P25, while Farkas et al. [12] reported 40 and 15 min, respectively, for 40 mg L−1 diuron and 1 g L−1 P25. The faster degradation kinetics with the photocatalyst powder are mainly attributed to its better homogeneous dispersion compared to a thin layer of immobilised catalyst. Dispersed catalyst possibly leads to better mass transfer and diffusional gradients and promotes diuron coming in contact with the photocatalyst surface. Indeed, when using a TiO2 coating and taking into account the hydrodynamics inside the reactor, a mixing problem can occur and some diuron molecules can flow through the reactor without making contact with the catalyst, possibly causing slower kinetics. Moreover, for the TiO2 coatings, only one side is in contact with the liquid: that is, less photocatalyst is available for the reaction. Finally, electron–hole pairs produced by TiO2 on the UV side of the glass do not manage to migrate to the liquid side. In the absence of reagents adsorbed near the catalyst (H2O, O2 or diuron and its TPs), the recombination phenomenon is favoured.
Equation (1) describe the Langmuir–Hinshelwood model (L-H) used to model diuron degradation by photocatalysis in the present study, where the apparent rate constant (Kapp) includes both photodegradation (k) and adsorption (Kad) phenomena [45], and C is the diuron concentration at time t.
d C d t = k K a d C 1 + K a d C = K a p p C 1 + K a d C   w i t h   K a p p = k K a d
The L-H model was solved by means of a Matlab code using the simulanealbnd function [34]. Results are shown in Table S2. To validate the simulations, the minimised square difference between the calculated concentration (Cmod) and the experimental concentration (Cexp) was chosen as a convergence criterion (∑(Cmod-Cexp)2 < 0.05). As shown in Figure 5, the L-H model represented the concentration evolution during diuron photocatalytic degradation well. Kapp of P25 (0.1088 min−1) was higher than that of the coatings: 0.0008 min−1 (C-3), 0.0030 min−1 (C-7), 0.0050 min−1 (C-10), 0.0065 min−1 (C-12) and 0.0011 min−1 (C-27). These differences do not indicate the insufficiency of the photocatalytic properties of the coatings. The slower diuron degradation kinetics may be due to the limitation of the transfer under these experimental conditions. Indeed, the poor distribution of the catalyst in the reactor (as an immobilised thin layer) and the laminal flow regime (Re ≅ 300) do not favour the reaction conditions. Consequently, the kinetic constants obtained from the model are surely lower than the intrinsic kinetic constants of the coated catalyst.
The Kapp values for the C-10 and C-12 coatings indicate good performance compared to the values reported in the literature. For TiO2 coatings deposited by sol–gel in the FSI mode, Kouamé et al. [47] reported a Kapp value of 0.0025 min−1 with an initial concentration of 10 mg L−1 of diuron and seven times more TiO2. For TiO2 coatings deposited by MOCVD in the FSI mode, Kapp values of 0.06 min−1 and 0.08 min−1 are reported for carbamazepine and warfarin degradation [66]. For ciprofloxacin degradation in the BSI mode, a Kapp value of 0.0085 min−1 for MOCVD TiO2 coatings was reported [34].

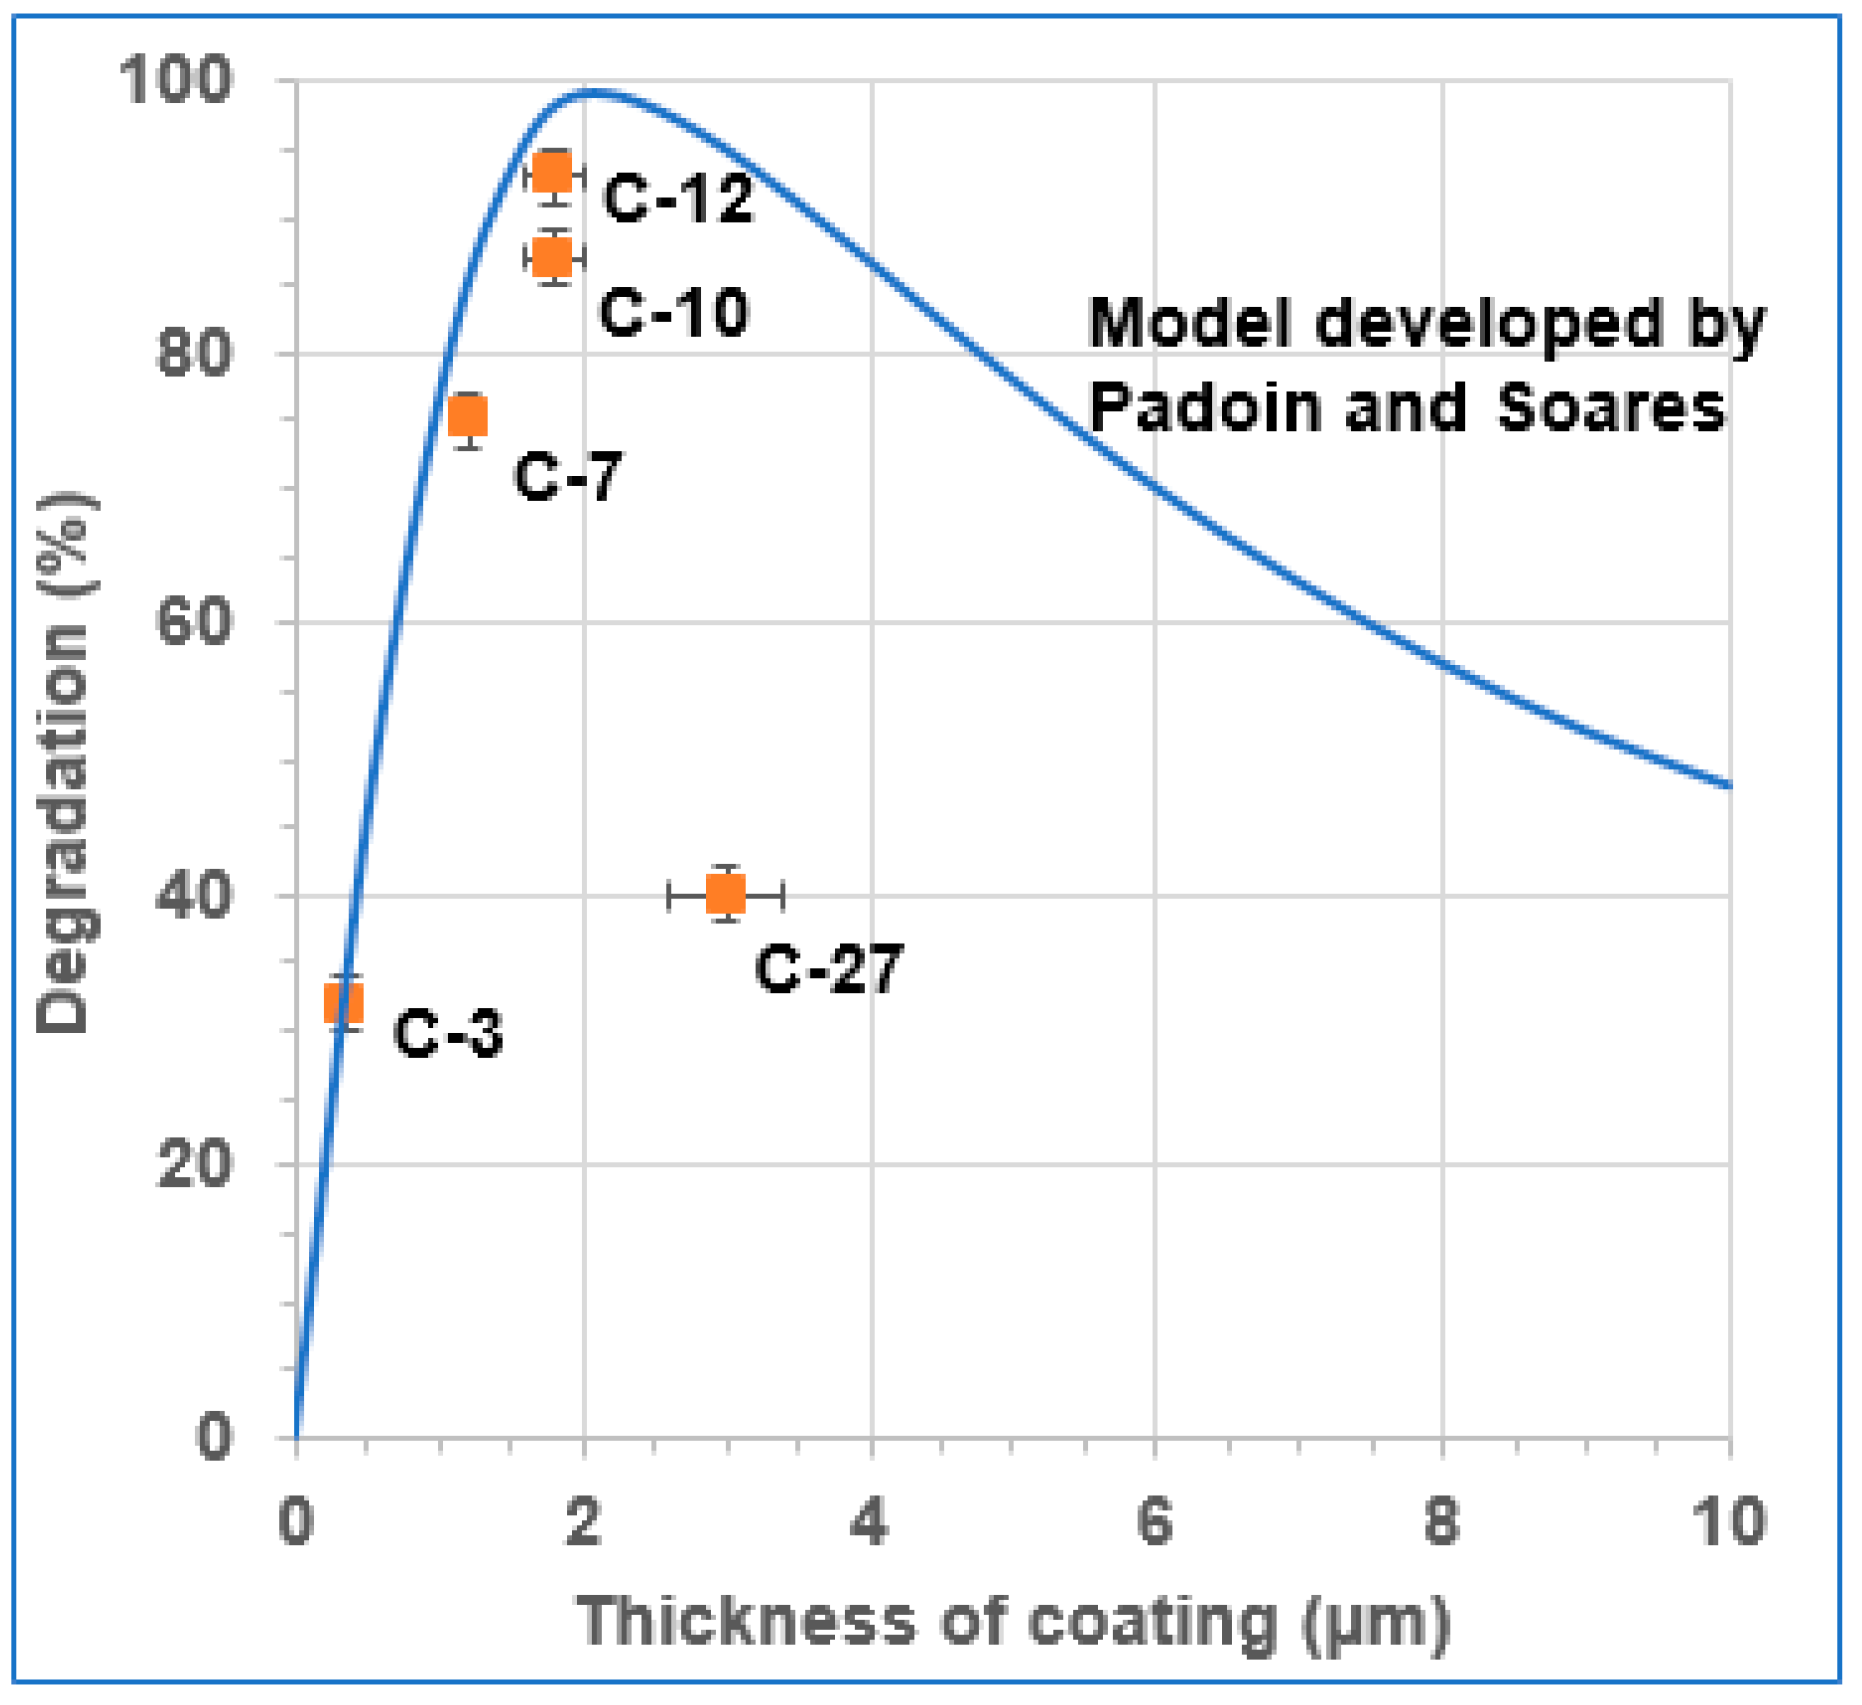
3.3. Relationship of TiO2 Coatings with Degradation Kinetics

First, the amount of catalyst is the key parameter that can directly influence the photocatalytic activity. This has been widely reported for photocatalytic powders [67,68,69]: the efficiencies increase as a function of mass up to a critical point where the overload of the system generates a shadow on the same particles and decreases the efficiency. For columnar coatings in the FSI, a similar trend has been reported [33,44,70], since the increase in mass generates taller columns and therefore increases the reaction surface. After reaching the critical point (optimal mass and/or thickness), the efficiency is either maintained constant or decreases. For our TiO2 coatings, between 3 and 27 mg of TiO2 were deposited with coating thicknesses of 0.3–3.6 µm. Coatings C-3 and C-27 with 3 and 27 mg of TiO2, respectively, showed a trend of low photocatalytic activities (<40%). Intermediate activity (≈75%) was obtained for coating C-7. High activity (>85%) was reported for coatings C-10 (10 mg TiO2) and C-12 (12 mg TiO2), indicating that a critical point of maximum efficiency exists between 10 and 15 mg of TiO2 (Figure 6). This critical point has been highlighted by Padoin and Soares [40], especially in photocatalytic reactors that involve BSI (i.e., the radiation first passes through the substrate, then the coating and finally the liquid).
Figure 6 shows the degradation performance of each material against the coating thickness. The results show a trend that follows the model developed by Padoin and Soares [40] for TiO2 photocatalytic coatings in the BSI mode (also plotted in Figure 6). As the thickness of the coating increases, the degradation efficiency increases up to the critical point (the maximum efficiency) and thereafter, it decreases. This behaviour can be explained as follows: in thin layers, the charge carrier generated in the photocatalyst may migrate to the coating/liquid interface and degrade the contaminants. As the thickness is increased up to the critical point, the absorption of the incident radiation and the production of charge carriers also increase, thereby improving efficiency. The critical point of maximum efficiency corresponds to the point with the maximum absorption of the radiation with the highest rate of transfer of the charge carriers to the coating surface. When the thickness exceeds the critical point, two phenomena may occur: radiation attenuation in the coating and charge recombination. Radiation attenuation occurs because of the decrease in the number of photons available to generate charges near the TiO2/liquid interface and charge recombination occurs because the electron–hole pairs are generated very far from the reaction surface and do not have sufficient time to migrate, thereby decreasing the photocatalytic efficiency.
The behaviours of C-3, C-7, C-10 and C-12 coatings fit the model developed by Padoin and Soares [40], while C-27 strongly deviates because of a rapid decrease in degradation efficiency. This may be explained by the fact that the model considers the photocatalytic film as a homogeneous porous matrix with variable thickness. Our coatings differ from one another in terms of column size, crystalline texture and morphology; hence, they may deviate from the model, especially in the case of thicker coatings, for which the material contribution is expected to be more important.
This deviation may suggest that the photocatalytic activity is also influenced by the crystalline structure and morphology. To further investigate this aspect and to reduce the influence of the amount of photocatalyst, we considered coatings C-10 and C-12, which have a similar thickness. This structure/property correlation is not straightforward: the two coatings have extremely different morphology and texture and yet exhibit comparable photocatalytic efficiency (>85%). Nevertheless, C-10 has a larger grain size and higher roughness, resulting in a more developed surface that promotes contact between the photocatalyst and effluent and thus improves photocatalytic activity. On the other hand, the photocatalytic efficiency is degraded in the case of (101) with crystalline texture, as seen in the case of C-10. Thus, it is possible to suggest that the influence of morphology (column size and roughness) and texture are antagonists and compensate for each other, and hence, C-10 and C-12 exhibit extremely similar photocatalytic activity.

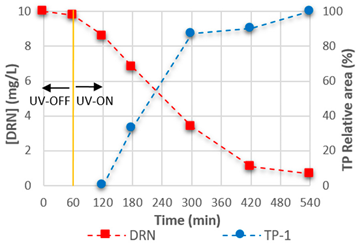
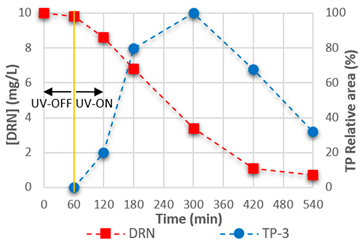
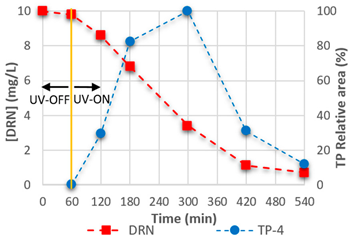
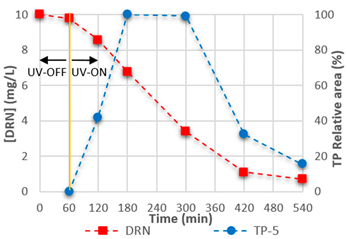
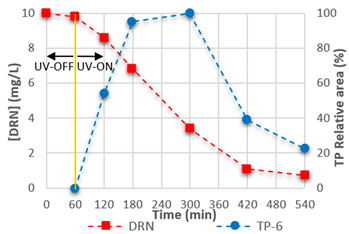
3.4. Mineralisation and TPs

The TOC content was determined at the end of each experiment to evaluate the mineralisation rate (initial TOC = 5 mgC L−1). Figure 7a shows the final TOC values for each catalyst against the initial value. To analyse these results, it is important to confirm that the total degradation of diuron and aromatic transformation products (ATPs) detected results in 58% TOC elimination (Note: For P25, the TOC was 58% at 100% degradation of diuron and its ATPs detected). If the final TOC is less than 58%, ATPs or diuron may still be present at the end of the process. The results confirmed there was no mineralisation after photolysis degradation and the TOC concentration was 5 mgC L−1 with only 9% diuron elimination. Photocatalytic experiments with C-3 and C-27 coatings revealed 10% and 26% TOC elimination, respectively, confirming the limited performances of these coatings and the presence of reactional intermediates. Theoretically, the total degradation one mole of diuron should liberate two moles of chloride. Hence, the chloride concentration was measured simultaneously along with TOC analysis, as shown in Figure 7b. After 32% (C-3) and 40% (C-27) diuron degradation, 0.97 and 1.21 mg L−1 of Cl, respectively, should be generated; however, at the end of the process, only 0.64 and 0.9 mg L−1 of Cl were detected by HPIC. This difference was caused by the incomplete mineralisation of diuron with the formation of chlorine TPs. Furthermore, ClO, ClO2, ClO3 or ClO4 ions were not detected, confirming the presence of ATPs.
The use of coatings C-7, C-10 and C-12 and P25 led to higher mineralisation percentages of 38%, 44%, 52% and 58%, respectively. Photocatalytic degradation with P25 showed the total elimination of diuron; however, 42% of the TOC still remained. Moreover, except for P25, the measured Cl concentrations for the other coatings were systematically different from the theoretical calculation. In the case of C-3 and C-27, this difference indicates the presence of aromatic and non-aromatic products.
To further understand the evolution of the TOC, the TPs generated during the photocatalytic diuron degradation were examined by HPLC–UV/MS analyses. For these analyses, we considered only C-12, which provided the best photocatalysis performance among the coatings. Table 2 summarises the information obtained by HPLC–MS to identify six TPs with a high degree of certainty.
The figures in Table 2 present the evolution of the concentration of each molecule with time in comparison with diuron degradation. The areas shown are normalised by the largest area detected for each molecule. The identified molecules were N-methylurea (TP-1), 1,1-dimethylurea (TP-2), 1-(3-chloro-4-hydroxyphenyl)-3-methylurea (TP-3), 3-(4-chloro-3-hydroxyphenyl)-1,1-dimethylurea (TP-4), 3-(3,4-dichlorohydroxyphenyl)-1,1-dimethyl-urea (TP-5) and N-demethoxylinuron (TP-6). These molecules were identified from among more than 30 diuron TPs reported in the literature [12,53,54,71,72]. The TP-2 to TP-6 molecules undergo a first phase of generation and a second phase of degradation; these phases are closely linked to the availability of the diuron molecule to generate TPs during its degradation. The maximum production of each TP occurred between 180 and 300 min of treatment. During this time, the diuron concentration started to decrease from 65% to 7%. This phenomenon can be explained by the lack of a reaction site at the surface of the catalyst until 65% diuron degradation and hydrodynamic limitation (laminar flow). At this diuron concentration, a sufficient number of reaction sites become available: the TPs in the solution are adsorbed and degraded. It is also possible that these TPs are more resistant to photocatalysis. The simultaneous degradation of TPs after more than 60% of the original compound was degraded has been reported in the case of other pesticides such as monuron and antibiotics such as ciprofloxacin [12,34]. In contrast, TP-1 followed a different trend; TP-1 was first detected 1 h later than the other TPs. TP-1 is one of the final products of the diuron reaction pathways before complete mineralisation and is generated by the degradation of the same TPs. After 180 min, the amount of TP-2 begins to decrease while that of TP-1 continues to increase, indicating TP-1 production by TP-2 demethylation (Figure S3). TP-1 was degraded in the tests with P25 and in studies performed by Calza et al. [73], confirming that this molecule can be degraded by photocatalysis with TiO2. Therefore, a longer irradiation time is needed to degrade this TP. At 540 min, more than 70% of TP-2, TP-3 and TP-6 was degraded and more than 80% of TP-4 and TP-5 was degraded. This finding highlights the high performance of this photocatalytic process to degrade diuron and its TPs.
The main reaction pathways of diuron reported in the literature are the demethylation of its modified urea group and the hydroxylation and dehalogenation of the benzene ring [12,53,71,72]. For TiO2 coating C-12, from the TPs identified, we can conclude that the three aforementioned mechanisms were responsible for the degradation of diuron. A schematic mechanism of the degradation is proposed in Figure S3, adapted from the literature [53,54,71].
Three TPs were quantified (PT-1, PT-2 and PT-6) with reference to certified standards (1-methylurea, 1,1-dimethylurea, N-demetoxylinuron). The results are shown in Figure S4. The final concentrations were 0.49 mg L−1 for TP-1 and 0.07 mg L−1 for TP-2 and TP-6, which represent the remaining TOC values corresponding to 0.16, 0.03 and 0.03 mgC L−1, respectively, at the end of the process. Considering the remaining diuron (0.70 mg L−1 corresponding to 0.32 mgC L−1), the TOC contribution of these four aromatic products corresponds to 22.5% (0.54 mgC L−1) of the final TOC (2.40 mgC L−1). In previous works, carboxylic acids, such as formic, acetic, propionic, citric, malic and oxalic acids, were identified during diuron degradation [53,72]. In this study, only formic (1.05 mg L−1) and oxalic acids (0.20 mg L−1) were detected at the end of the process (the initial pH was 6.8 ± 0.1 and final 6.1 ± 0.1). Therefore, the 78% remaining TOC should correspond to the other ATPs and TPs in very low concentrations (that could not be identified or quantified) or with a low extinction coefficient at 254 nm (for UV detection in HPLC).
Most TPs detected in this study are not are hazardous substances (1-methylurea (TP1), 1,1-dimethylurea (TP2) and aliphatic acids) but some TPs like 1-(3,4-Dichlorophenyl)-3-methylurea could be as toxic as diuron [74]. Nevertheless, this study shows clearly that photocatalysis can non-selectively degrade all TPs present in the solution, provided that the irradiation time is optimised.

3.5. Reuse and Leaching

Four cycles of diuron degradation were performed to verify the usefulness and long-term sustainability of the coatings. For this experiment, the coating with the highest efficiency (C-12) was used. Figure 8 shows the kinetics of diuron degradation for the cycles studied with the adjustment of the L-H model and the apparent rate constant (Kapp). The coating has the same degradation efficiency for all the cycles with Kapp values of 0.006–0.007 min−1. This is attributed to the non-selective photocatalytic degradation of all the molecules that are adsorbed on the surface of the coating, ensuring that the same reaction surface is available for all cycles. UV–Vis and XRD analysis showed that after the last cycle, the coating remained unchanged in terms of its absorbance spectrum, crystalline structure and morphology. This finding indicates that the coating was stable over time and had high reuse efficiency. In addition, in the ICP-OES analysis, the Ti in solution was measured after each cycle to verify whether leaching occurred in the photocatalyst. Ti was not detected in solution or the concentrations were below the detection limit of the equipment (<10 µg L−1), indicating the excellent fixation of the coating and confirming that the degradation efficiencies remained stable. The concentrations of TOC, Cl ions and TPs of diuron remained constant in all the cycles, with values similar to those shown in Figure 7 and listed in Table 2 for C-12 coating.
The promising reuse efficiency of coatings formed by MOCVD has also been reported in the literature. Xingwang et al. [75] examined TiO2/Fe supported on AC, and Murgolo et al. [66] coated stainless-steel meshes with TiO2; both the coatings demonstrated stability and could be reused for 10 cycles of 60 min each. For sol–gel TiO2 coatings, Hsuan-Fu et al. [76] reported that the photocatalyst remained stable and could be reused for four cycles of 720 min each. In contrast, He et al. [38] reported the leaching-induced deactivation of a WOx/TiO2 photocatalyst supported by impregnation. According to these results, C-12 has a good reuse efficiency as leaching does not occur and the photocatalytic efficiency remains unchanged after four cycles of 540 min each (more than 2000 min). Thus, the C-12 coating is a sustainable photocatalyst.

4. Conclusions

Five TiO2 coatings with different morphology, crystallinity and thickness/mass were grown by the MOCVD method. Their performance in the photocatalytic degradation of the herbicide diuron and its TPs in the BSI mode was examined. The amount of mass deposited determines the film thickness, which is the key parameter that directly influences the degradation kinetics in this illumination mode. Coatings C-10 and C-12 showed good photocatalytic activities for degrading diuron (>85%), and C-3 and C-27 had low activities (<40%), because of the limitations imposed by the small amount of TiO2 and the electron–hole recombination and screening effect attributed to the coating thickness in the BSI mode applied. Moreover, the morphology and crystalline texture are likely to further influence the photocatalytic activity. Diuron degradation proceeded via demethylation, hydroxylation and dehalogenation. At the end of the process, mainly recalcitrant carboxylic acids (formic and oxalic acids) that affect the remaining TOC were identified. The coatings did not experience leaching and remained stable over time, allowing their sustainable reuse with constant degradation efficiencies.
With supported catalysts, the implementation of large-scale photocatalysis is often limited by irradiation constraints: if the catalyst is deposed inside the reactor, the effluent must be transparent and the depth of the reactor low. With back-side irradiation, there is no longer a problem with photon penetration. Indeed, under these conditions, it is possible to treat turbid water and also to design reactors which deal with larger flows. This study shows that TiO2 coatings grown by MOCVD present good performances for the degradation of pesticides using the BSI mode and thus open up prospects for large-scale development.

Supplementary Materials

The following supporting information can be downloaded at: https://www.mdpi.com/article/10.3390/w16010001/s1, Figure S1: Schematic of the experimental setup; Figure S2: Absorbance spectrum of diuron; Figure S3: Proposed reaction pathways for the photocatalytic degradation of diuron by C-12 coating: Hydroxylation (+[OH]), demethylation (-[CH3]) and dehalogenation (-[Cl]); Figure S4: Kinetics of the formation and elimination of TP-1, TP-2 and TP-6 during diuron degradation. Table S1: Physico-chemical properties of diuron; Table S2: Kinetic constants obtained for the Langmuir–Hinshelwood (L-H) model.

Author Contributions

C.A., C.T., C.Y.Q.-C. and T.T. designed and supervised the experiments. C.Y.Q.-C. performed the experiments, the kinetics models, ICP-OES, TOC and HPLC–UV analysis. C.Y.Q.-C. and L.L. conducted HPLC–MS analysis. C.T. performed the TiO2 compact coating on Pyrex and its characterisations by XRD, SEM, EDX and UV–Vis. C.Y.Q.-C., C.T., T.T., P.A.A., M.M.S.-C., L.L. and C.A. wrote the paper. All authors have read and agreed to the published version of the manuscript.

Funding

The first author’s research is funded by a PhD scholarship from the Food Research Focus (Foco Alimentos) of the programme Colombia Scientific—Passport to Science (Colombia Científica—Pasaporte a la Ciencia), granted by the Colombian Institute for Educational Technical Studies Abroad (Instituto Colombiano de Crédito Educativo y Estudios Técnicos en el Exterior, ICETEX).

Data Availability Statement

The data presented in this study are available on request from the corresponding author.

Acknowledgments

The authors are grateful for the support of the projects ANR TRANSPRO and POA-INV-2790. The first was financed by Agence National de la Recherche (ANR) within the Laboratoire de Génie Chimique (Université de Toulouse, CNRS, INPT, UPS), EPOC (Université de Bordeaux, CNRS, Bordeaux INP, EPHE) and REVERSAAL (INRAE). The second was financed by the Universidad Cooperativa de Colombia—UCC within the ISI Research Group.

Conflicts of Interest

The authors declare no conflict of interest.

References

  1. Roulová, N.; Hrdá, K.; Kašpar, M.; Peroutková, P.; Josefová, D.; Palarčík, J. Removal of Chloroacetanilide Herbicides from Water Using Heterogeneous Photocatalysis with TiO2/UV-A. Catalysts 2022, 12, 597. [Google Scholar] [CrossRef]
  2. Shukla, R.; Ahammad, S.Z. Performance assessment of a modified trickling filter and conventional activated sludge process along with tertiary treatment in removing emerging pollutants from urban sewage. Sci. Total Environ. 2023, 858, 159833. [Google Scholar] [CrossRef]
  3. Choi, Y.; Jung, E.-Y.; Lee, W.; Choi, S.; Son, H.; Lee, Y. In vitro bioanalytical assessment of the occurrence and removal of bioactive chemicals in municipal wastewater treatment plants in Korea. Sci. Total Environ. 2023, 858, 159724. [Google Scholar] [CrossRef]
  4. Blessing, M.; Baran, N. A review on environmental isotope analysis of aquatic micropollutants: Recent advances, pitfalls and perspectives. TrAC-Trends Anal. Chem. 2022, 157, 116730. [Google Scholar] [CrossRef]
  5. Goh, P.S.; Ahmad, N.A.; Wong, T.W.; Yogarathinam, L.T.; Ismail, A.F. Membrane technology for pesticide removal from aquatic environment: Status quo and way forward. Chemosphere 2022, 307, 136018. [Google Scholar] [CrossRef]
  6. Zhang, Y.; Qin, P.; Lu, S.; Liu, X.; Zhai, J.; Xu, J.; Wang, Y.; Zhang, G.; Liu, X.; Wan, Z. Occurrence and risk evaluation of organophosphorus pesticides in typical water bodies of Beijing, China. Environ. Sci. Pollut. Res. 2021, 28, 1454–1463. [Google Scholar] [CrossRef]
  7. Mahmoud, A.E.D.; Fawzy, M.; Hosny, M. Chapter 4—Feasibility and challenges of biopesticides application. In New and Future Developments in Microbial Biotechnology and Bioengineering; Singh, H.B., Vaishnav, A., Eds.; Elsevier: Amsterdam, The Netherlands, 2022; pp. 83–97. ISBN 978-0-323-85581-5. [Google Scholar]
  8. Pham, T.H.; Bui, H.M.; Bui, T.X. Chapter 13—Advanced oxidation processes for the removal of pesticides. In Current Developments in Biotechnology and Bioengineering; Varjani, S., Pandey, A., Tyagi, R.D., Ngo, H.H., Larroche, C., Eds.; Elsevier: Amsterdam, The Netherlands, 2020; pp. 309–330. ISBN 978-0-12-819594-9. [Google Scholar]
  9. Carravieri, A.; Cherel, Y.; Brault-Favrou, M.; Churlaud, C.; Peluhet, L.; Labadie, P.; Budzinski, H.; Chastel, O.; Bustamante, P. From Antarctica to the subtropics: Contrasted geographical concentrations of selenium, mercury, and persistent organic pollutants in skua chicks (Catharacta spp.). Environ. Pollut. 2017, 228, 464–473. [Google Scholar] [CrossRef]
  10. de Souza, R.M.; Seibert, D.; Quesada, H.B.; de Jesus Bassetti, F.; Fagundes-Klen, M.R.; Bergamasco, R. Occurrence, impacts and general aspects of pesticides in surface water: A review. Process Saf. Environ. Prot. 2020, 135, 22–37. [Google Scholar] [CrossRef]
  11. Mrema, E.J.; Rubino, F.M.; Brambilla, G.; Moretto, A.; Tsatsakis, A.M.; Colosio, C. Persistent organochlorinated pesticides and mechanisms of their toxicity. Toxicology 2013, 307, 74–88. [Google Scholar] [CrossRef]
  12. Farkas, J.; Náfrádi, M.; Hlogyik, T.; Pravda, B.C.; Schrantz, K.; Hernádi, K.; Alapi, T. Comparison of advanced oxidation processes in the decomposition of diuron and monuron—Efficiency, intermediates, electrical energy per order and the effect of various matrices. Environ. Sci. Water Res. Technol. 2018, 4, 1345–1360. [Google Scholar] [CrossRef]
  13. Perkins, R.; Whitehead, M.; Civil, W.; Goulson, D. Potential role of veterinary flea products in widespread pesticide contamination of English rivers. Sci. Total Environ. 2021, 755, 143560. [Google Scholar] [CrossRef] [PubMed]
  14. Wells, C.; Collins, C.M.T. A rapid evidence assessment of the potential risk to the environment presented by active ingredients in the UK’s most commonly sold companion animal parasiticides. Environ. Sci. Pollut. Res. 2022, 29, 45070–45088. [Google Scholar] [CrossRef]
  15. Malnes, D.; Ahrens, L.; Köhler, S.; Forsberg, M.; Golovko, O. Occurrence and mass flows of contaminants of emerging concern (CECs) in Sweden’s three largest lakes and associated rivers. Chemosphere 2022, 294, 133825. [Google Scholar] [CrossRef] [PubMed]
  16. Schostag, M.D.; Gobbi, A.; Fini, M.N.; Ellegaard-Jensen, L.; Aamand, J.; Hansen, L.H.; Muff, J.; Albers, C.N. Combining reverse osmosis and microbial degradation for remediation of drinking water contaminated with recalcitrant pesticide residue. Water Res. 2022, 216, 118352. [Google Scholar] [CrossRef] [PubMed]
  17. Lagunas-Basave, B.; Brito-Hernández, A.; Saldarriaga-Noreña, H.A.; Romero-Aguilar, M.; Vergara-Sánchez, J.; Moeller-Chávez, G.E.; Díaz-Torres, J.d.J.; Rosales-Rivera, M.; Murillo-Tovar, M.A. Occurrence and Risk Assessment of Atrazine and Diuron in Well and Surface Water of a Cornfield Rural Region. Water 2022, 14, 3790. [Google Scholar] [CrossRef]
  18. Webb, D.T.; Zhi, H.; Kolpin, D.W.; Klaper, R.D.; Iwanowicz, L.R.; LeFevre, G.H. Emerging investigator series: Municipal wastewater as a year-round point source of neonicotinoid insecticides that persist in an effluent-dominated stream. Environ. Sci. Process. Impacts 2021, 23, 678–688. [Google Scholar] [CrossRef]
  19. Blum, K.M.; Haglund, P.; Gao, Q.; Ahrens, L.; Gros, M.; Wiberg, K.; Andersson, P.L. Mass fluxes per capita of organic contaminants from on-site sewage treatment facilities. Chemosphere 2018, 201, 864–873. [Google Scholar] [CrossRef] [PubMed]
  20. Oluwalana, A.E.; Musvuugwa, T.; Sikwila, S.T.; Sefadi, J.S.; Whata, A.; Nindi, M.M.; Chaukura, N. The screening of emerging micropollutants in wastewater in Sol Plaatje Municipality, Northern Cape, South Africa. Environ. Pollut. 2022, 314, 120275. [Google Scholar] [CrossRef]
  21. Masiá, A.; Ibáñez, M.; Blasco, C.; Sancho, J.V.; Picó, Y.; Hernández, F. Combined use of liquid chromatography triple quadrupole mass spectrometry and liquid chromatography quadrupole time-of-flight mass spectrometry in systematic screening of pesticides and other contaminants in water samples. Anal. Chim. Acta 2013, 761, 117–127. [Google Scholar] [CrossRef]
  22. Lopez-Herguedas, N.; González-Gaya, B.; Castelblanco-Boyacá, N.; Rico, A.; Etxebarria, N.; Olivares, M.; Prieto, A.; Zuloaga, O. Characterization of the contamination fingerprint of wastewater treatment plant effluents in the Henares River Basin (central Spain) based on target and suspect screening analysis. Sci. Total Environ. 2022, 806, 151262. [Google Scholar] [CrossRef]
  23. Alexa, E.T.; Bernal-Romero del Hombre Bueno, M.d.l.Á.; González, R.; Sánchez, A.V.; García, H.; Prats, D. Occurrence and Removal of Priority Substances and Contaminants of Emerging Concern at the WWTP of Benidorm (Spain). Water 2022, 14, 4129. [Google Scholar] [CrossRef]
  24. Weng, B.; Qi, M.-Y.; Han, C.; Tang, Z.-R.; Xu, Y.-J. Photocorrosion Inhibition of Semiconductor-Based Photocatalysts: Basic Principle, Current Development, and Future Perspective. ACS Catal. 2019, 9, 4642–4687. [Google Scholar] [CrossRef]
  25. Agustina, T.E.; Habiburrahman, M.; Amalia, F.; Arita, S.; Faizal, M.; Novia, N.; Gayatri, R. Reduction of Copper, Iron, and Lead Content in Laboratory Wastewater Using Zinc Oxide Photocatalyst under Solar Irradiation. J. Ecol. Eng. 2022, 23, 107–115. [Google Scholar] [CrossRef]
  26. Li, N.; Gao, X.; Su, J.; Gao, Y.; Ge, L. Metallic WO2-decorated g-C3N4 nanosheets as noble-metal-free photocatalysts for efficient photocatalysis. Chin. J. Catal. 2023, 47, 161–170. [Google Scholar] [CrossRef]
  27. Jamshaid, M.; Khan, H.M.; Nazir, M.A.; Wattoo, M.A.; Shahzad, K.; Malik, M.; Rehman, A.-U. A novel bentonite–cobalt doped bismuth ferrite nanoparticles with boosted visible light induced photodegradation of methyl orange: Synthesis, characterization and analysis of physiochemical changes. Int. J. Environ. Anal. Chem. 2022, 0, 1–16. [Google Scholar] [CrossRef]
  28. Andriantsiferana, C.; Mohamed, E.F.; Delmas, H. Photocatalytic degradation of an azo-dye on TiO2/activated carbon composite material. Environ. Technol. 2014, 35, 355–363. [Google Scholar] [CrossRef]
  29. Sathishkumar, P.; Mangalaraja, R.V.; Anandan, S. Review on the recent improvements in sonochemical and combined sonochemical oxidation processes—A powerful tool for destruction of environmental contaminants. Renew. Sustain. Energy Rev. 2016, 55, 426–454. [Google Scholar] [CrossRef]
  30. Rani, M.; Shanker, U. Degradation of traditional and new emerging pesticides in water by nanomaterials: Recent trends and future recommendations. Int. J. Environ. Sci. Technol. 2018, 15, 1347–1380. [Google Scholar] [CrossRef]
  31. Kirkland, D.; Aardema, M.J.; Battersby, R.V.; Beevers, C.; Burnett, K.; Burzlaff, A.; Czich, A.; Donner, E.M.; Fowler, P.; Johnston, H.J.; et al. A weight of evidence review of the genotoxicity of titanium dioxide (TiO2). Regul. Toxicol. Pharmacol. 2022, 136, 105263. [Google Scholar] [CrossRef]
  32. Quiñones, D.H.; Rey, A.; Álvarez, P.M.; Beltrán, F.J.; Plucinski, P.K. Enhanced activity and reusability of TiO2 loaded magnetic activated carbon for solar photocatalytic ozonation. Appl. Catal. B Environ. 2014, 144, 96–106. [Google Scholar] [CrossRef]
  33. Galenda, A.; Natile, M.M.; El Habra, N. Large-Scale MOCVD Deposition of Nanostructured TiO2 on Stainless Steel Woven: A Systematic Investigation of Photoactivity as a Function of Film Thickness. Nanomaterials 2022, 12, 992. [Google Scholar] [CrossRef]
  34. Triquet, T.; Tendero, C.; Latapie, L.; Manero, M.-H.; Richard, R.; Andriantsiferana, C. TiO2 MOCVD coating for photocatalytic degradation of ciprofloxacin using 365 nm UV LEDs—Kinetics and mechanisms. J. Environ. Chem. Eng. 2020, 8, 104544. [Google Scholar] [CrossRef]
  35. Maury, F.; Duminica, F.-D. TiOxNy coatings grown by atmospheric pressure metal organic chemical vapor deposition. Surf. Coat. Technol. 2010, 205, 1287–1293. [Google Scholar] [CrossRef]
  36. Jung, S.-C.; Bang, H.-J.; Lee, H.; Ha, H.-H.; Yu, Y.H.; Kim, S.-J.; Park, Y.-K. Assessing the photocatalytic activity of europium doped TiO2 using liquid phase plasma process on acetylsalicylic acid. Catal. Today 2022, 388–389, 365–371. [Google Scholar] [CrossRef]
  37. Arconada, N.; Durán, A.; Suárez, S.; Portela, R.; Coronado, J.M.; Sánchez, B.; Castro, Y. Synthesis and photocatalytic properties of dense and porous TiO2-anatase thin films prepared by sol–gel. Appl. Catal. B Environ. 2009, 86, 1–7. [Google Scholar] [CrossRef]
  38. He, J.; Burt, S.P.; Ball, M.R.; Hermans, I.; Dumesic, J.A.; Huber, G.W. Catalytic C-O bond hydrogenolysis of tetrahydrofuran-dimethanol over metal supported WOx/TiO2 catalysts. Appl. Catal. B Environ. 2019, 258, 117945. [Google Scholar] [CrossRef]
  39. Yilleng, M.T.; Gimba, E.C.; Ndukwe, G.I.; Bugaje, I.M.; Rooney, D.W.; Manyar, H.G. Batch to continuous photocatalytic degradation of phenol using TiO2 and Au-Pd nanoparticles supported on TiO2. J. Environ. Chem. Eng. 2018, 6, 6382–6389. [Google Scholar] [CrossRef]
  40. Padoin, N.; Soares, C. An explicit correlation for optimal TiO2 film thickness in immobilized photocatalytic reaction systems. Chem. Eng. J. 2017, 310, 381–388. [Google Scholar] [CrossRef]
  41. Vezzoli, M.; Farrell, T.; Baker, A.; Psaltis, S.; Martens, W.N.; Bell, J.M. Optimal catalyst thickness in titanium dioxide fixed film reactors: Mathematical modelling and experimental validation. Chem. Eng. J. 2013, 234, 57–65. [Google Scholar] [CrossRef]
  42. Espíndola, J.C.; Cristóvão, R.O.; Santos, S.G.S.; Boaventura, R.A.R.; Dias, M.M.; Lopes, J.C.B.; Vilar, V.J.P. Intensification of heterogeneous TiO2 photocatalysis using the NETmix mili-photoreactor under microscale illumination for oxytetracycline oxidation. Sci. Total Environ. 2019, 681, 467–474. [Google Scholar] [CrossRef]
  43. da Costa Filho, B.M.; Araujo, A.L.P.; Padrão, S.P.; Boaventura, R.A.R.; Dias, M.M.; Lopes, J.C.B.; Vilar, V.J.P. Effect of catalyst coated surface, illumination mechanism and light source in heterogeneous TiO2 photocatalysis using a mili-photoreactor for n-decane oxidation at gas phase. Chem. Eng. J. 2019, 366, 560–568. [Google Scholar] [CrossRef]
  44. Gerbasi, R.; Bolzan, M.; Habra, N.E.; Rossetto, G.; Schiavi, L.; Strini, A.; Barison, S. Photocatalytic Activity Dependence on the Structural Orientation of MOCVD TiO2 Anatase Films. J. Electrochem. Soc. 2009, 156, K233. [Google Scholar] [CrossRef]
  45. Amorós-Pérez, A.; Lillo-Ródenas, M.Á.; Román-Martínez, M.d.C.; García-Muñoz, P.; Keller, N. TiO2 and TiO2-Carbon Hybrid Photocatalysts for Diuron Removal from Water. Catalysts 2021, 11, 457. [Google Scholar] [CrossRef]
  46. Rico-Santacruz, M.; García-Muñoz, P.; Keller, V.; Batail, N.; Pham, C.; Robert, D.; Keller, N. Alveolar TiO2-β-SiC photocatalytic composite foams with tunable properties for water treatment. Catal. Today 2019, 328, 235–242. [Google Scholar] [CrossRef]
  47. Kouamé, N.A.; Robert, D.; Keller, V.; Keller, N.; Pham, C.; Nguyen, P. TiO2/[beta]-SiC foam-structured photoreactor for continuous wastewater treatment. Environ. Sci. Pollut. Res. Int. 2012, 19, 3727–3734. [Google Scholar] [CrossRef]
  48. Panis, C.; Candiotto, L.Z.P.; Gaboardi, S.C.; Gurzenda, S.; Cruz, J.; Castro, M.; Lemos, B. Widespread pesticide contamination of drinking water and impact on cancer risk in Brazil. Environ. Int. 2022, 165, 107321. [Google Scholar] [CrossRef]
  49. Wilkinson, A.D.; Collier, C.J.; Flores, F.; Negri, A.P. Acute and additive toxicity of ten photosystem-II herbicides to seagrass. Sci. Rep. 2015, 5, 17443. [Google Scholar] [CrossRef]
  50. Taucare, G.; Bignert, A.; Kaserzon, S.; Thai, P.; Mann, R.M.; Gallen, C.; Mueller, J. Detecting long temporal trends of photosystem II herbicides (PSII) in the Great Barrier Reef lagoon. Mar. Pollut. Bull. 2022, 177, 113490. [Google Scholar] [CrossRef]
  51. Lopes, J.Q.; Salgado, B.C.B. Photocatalytic performance of titanium and zinc oxides in diuron degradation. Environ. Chall. 2021, 4, 100186. [Google Scholar] [CrossRef]
  52. Lopes, J.Q.; Cardeal, R.A.; Araújo, R.S.; Assunção, J.C.D.C.; Salgado, B.C.B. Application of titanium dioxide as photocatalyst in diuron degradation: Operational variables evaluation and mechanistic study. Eng. Sanit. E Ambient. 2021, 26, 61–68. [Google Scholar] [CrossRef]
  53. De Oliveira, P.L.; Lima, N.S.; Costa, A.C.F.d.M.; Cavalcanti, E.B.; Conrado, L.d.S. Obtaining TiO2:CoFe2O4 nanocatalyst by Pechini method for diuron degradation and mineralization. Ceram. Int. 2020, 46, 9421–9435. [Google Scholar] [CrossRef]
  54. Katsumata, H.; Sada, M.; Nakaoka, Y.; Kaneco, S.; Suzuki, T.; Ohta, K. Photocatalytic degradation of diuron in aqueous solution by platinized TiO2. J. Hazard. Mater. 2009, 171, 1081–1087. [Google Scholar] [CrossRef] [PubMed]
  55. Solís, R.R.; Rivas, F.J.; Martínez-Piernas, A.; Agüera, A. Ozonation, photocatalysis and photocatalytic ozonation of diuron. Intermediates identification. Chem. Eng. J. 2016, 292, 72–81. [Google Scholar] [CrossRef]
  56. Kovács, K.; Farkas, J.; Veréb, G.; Arany, E.; Simon, G.; Schrantz, K.; Dombi, A.; Hernádi, K.; Alapi, T. Comparison of various advanced oxidation processes for the degradation of phenylurea herbicides. J. Environ. Sci. Health-Part B Pestic. Food Contam. Agric. Wastes 2016, 51, 205–214. [Google Scholar] [CrossRef]
  57. Sarantopoulos, C. Photocatalyseurs à Base de TIO2 Préparés par Infiltration Chimique en Phase Vapeur (CVI) Sur Supports Microfibreux. Ph.D. Thesis, INPT, Toulouse, France, 2007. [Google Scholar]
  58. Al-Mamun, M.R.; Kader, S.; Islam, M.S.; Khan, M.Z.H. Photocatalytic activity improvement and application of UV-TiO2 photocatalysis in textile wastewater treatment: A review. J. Environ. Chem. Eng. 2019, 7, 103248. [Google Scholar] [CrossRef]
  59. Miquelot, A.; Youssef, L.; Villeneuve-Faure, C.; Prud’homme, N.; Dragoe, N.; Nada, A.; Rouessac, V.; Roualdes, S.; Bassil, J.; Zakhour, M.; et al. In- and out-plane transport properties of chemical vapor deposited TiO2 anatase films. J. Mater. Sci. 2021, 56, 10458–10476. [Google Scholar] [CrossRef]
  60. Xu, Y.; Yan, X.-T. Chemical Vapour Deposition: An Integrated Engineering Design for Advanced Materials; Engineering Materials and Processes; Springer: London, UK, 2010; ISBN 978-1-84882-893-3. [Google Scholar]
  61. Duminica, F.-D.; Maury, F.; Hausbrand, R. Growth of TiO2 thin films by AP-MOCVD on stainless steel substrates for photocatalytic applications. Surf. Coat. Technol. 2007, 201, 9304–9308. [Google Scholar] [CrossRef]
  62. Topka, K.C.; Chliavoras, G.A.; Senocq, F.; Vergnes, H.; Samelor, D.; Sadowski, D.; Vahlas, C.; Caussat, B. Large temperature range model for the atmospheric pressure chemical vapor deposition of silicon dioxide films on thermosensitive substrates. Chem. Eng. Res. Des. 2020, 161, 146–158. [Google Scholar] [CrossRef]
  63. Chin-Pampillo, J.S.; Perez-Villanueva, M.; Masis-Mora, M.; Mora-Dittel, T.; Carazo-Rojas, E.; Alcañiz, J.M.; Chinchilla-Soto, C.; Domene, X. Amendments with pyrolyzed agrowastes change bromacil and diuron’s sorption and persistence in a tropical soil without modifying their environmental risk. Sci. Total Environ. 2021, 772, 145515. [Google Scholar] [CrossRef]
  64. Silva, T.S.; Araújo de Medeiros, R.C.; Silva, D.V.; de Freitas Souza, M.; das Chagas, P.S.F.; Lins, H.A.; da Silva, C.C.; Souza, C.M.M.; Mendonça, V. Interaction between herbicides applied in mixtures alters the conception of its environmental impact. Environ. Sci. Pollut. Res. 2022, 29, 15127–15143. [Google Scholar] [CrossRef]
  65. Mercurio, P.; Mueller, J.F.; Eaglesham, G.; O’Brien, J.; Flores, F.; Negri, A.P. Degradation of Herbicides in the Tropical Marine Environment: Influence of Light and Sediment. PLoS ONE 2016, 11, e0165890. [Google Scholar] [CrossRef]
  66. Murgolo, S.; Yargeau, V.; Gerbasi, R.; Visentin, F.; El Habra, N.; Ricco, G.; Lacchetti, I.; Carere, M.; Curri, M.L.; Mascolo, G. A new supported TiO2 film deposited on stainless steel for the photocatalytic degradation of contaminants of emerging concern. Chem. Eng. J. 2017, 318, 103–111. [Google Scholar] [CrossRef]
  67. Gonçalves, M.S.T.; Oliveira-Campos, A.M.F.; Pinto, E.M.M.S.; Plasência, P.M.S.; Queiroz, M.J.R.P. Photochemical treatment of solutions of azo dyes containing TiO2. Chemosphere 1999, 39, 781–786. [Google Scholar] [CrossRef]
  68. Herrmann, J.-M. Heterogeneous photocatalysis: Fundamentals and applications to the removal of various types of aqueous pollutants. Catal. Today 1999, 53, 115–129. [Google Scholar] [CrossRef]
  69. Bizani, E.; Fytianos, K.; Poulios, I.; Tsiridis, V. Photocatalytic decolorization and degradation of dye solutions and wastewaters in the presence of titanium dioxide. J. Hazard. Mater. 2006, 136, 85–94. [Google Scholar] [CrossRef] [PubMed]
  70. Jung, S.-C.; Kim, S.-J.; Imaishi, N.; Cho, Y.-I. Effect of TiO2 thin film thickness and specific surface area by low-pressure metal–organic chemical vapor deposition on photocatalytic activities. Appl. Catal. B Environ. 2005, 55, 253–257. [Google Scholar] [CrossRef]
  71. Meephon, S.; Rungrotmongkol, T.; Puttamat, S.; Praserthdam, S.; Pavarajarn, V. Heterogeneous photocatalytic degradation of diuron on zinc oxide: Influence of surface-dependent adsorption on kinetics, degradation pathway, and toxicity of intermediates. J. Environ. Sci. 2019, 84, 97–111. [Google Scholar] [CrossRef]
  72. de Matos, D.B.; Barbosa, M.P.R.; Leite, O.M.; Steter, J.R.; Lima, N.S.; Torres, N.H.; Marques, M.N.; de Alsina, O.L.S.; Cavalcanti, E.B. Characterization of a tubular electrochemical reactor for the degradation of the commercial diuron herbicide. Environ. Technol. 2020, 41, 1307–1321. [Google Scholar] [CrossRef]
  73. Calza, P.; Medana, C.; Baiocchi, C.; Hidaka, H.; Pelizzetti, E. Light-Induced Transformation of Alkylurea Derivatives in Aqueous TiO2 Dispersion. Chem. Eur. J. 2006, 12, 727–736. [Google Scholar] [CrossRef]
  74. Mohammed, A.M.; Huovinen, M.; Vähäkangas, K.H. Toxicity of diuron metabolites in human cells. Environ. Toxicol. Pharmacol. 2020, 78, 103409. [Google Scholar] [CrossRef]
  75. Zhang, X.; Zhou, M.; Lei, L. Preparation of photocatalytic TiO2 coatings of nanosized particles on activated carbon by AP-MOCVD. Carbon 2005, 43, 1700–1708. [Google Scholar] [CrossRef]
  76. Hsuan-Fu, Y.; Chao-Wei, C. Enhancing photocatalytic ability of TiO2 films using gel-derived P/Si-TiO2 powder. J. Sol-Gel Sci. Technol. 2021, 97, 259–270. [Google Scholar] [CrossRef]
Figure 1. X-ray diffraction (XRD) patterns of the TiO2 coatings.
Water 16 00001 g001
Figure 2. Scanning electron microscopy (SEM) image showing the top view of TiO2 coatings on borosilicate glass substrates for C-3 (a), C-7 (b), C-10 (c), C-12 (d), C-27 (e) and arithmetic roughness (Ra) values (f).
Water 16 00001 g002
Figure 3. Determination of the coating thickness (a) by calotest and (b) from the crater profile measured by mechanical profilometry. In this example, ∅1 = 354 µm, ∅2 = 670 µm and ∅ball = 20 mm. The resulting thickness t = 4 µm, as confirmed by the profilometry measurement.
Water 16 00001 g003
Figure 4. Relationship between the thickness and mass of the coatings, with stable substrate surfaces.
Water 16 00001 g004
Figure 5. Diuron degradation kinetics for different TiO2 coatings formed by metal–organic chemical vapour deposition (MOCVD) (C-3, C-7, C-10, C-12 and C-27), TiO2–P25, photolysis, adsorption (without UV) and the Langmuir–Hinshelwood (L-H) model (black solid curves).
Water 16 00001 g005
Figure 6. Degradation performance vs. coating thickness and the model developed by Padoin and Soares [40].
Water 16 00001 g006
Figure 7. (a) Total organic carbon (TOC) content after 540 min of diuron degradation for different TiO2 coatings formed by MOCVD. (b) Chloride concentrations measured at the end of the experiments and theoretically calculated from the percentage of diuron degradation.
Water 16 00001 g007
Figure 8. Diuron degradation kinetics for different reuse cycles of the C-12 coating and the L-H model with Kapp (min−1).
Water 16 00001 g008
Table 1. Operating conditions for obtaining different coatings by metal–organic chemical vapour deposition (MOCVD) and the resulting deposited TiO2 mass.
Operating ConditionsCoatings
C-3C-7C-10C-12C-27
Deposition time (min)2 × 202 × 602 × 602 × 752 × 100
Precursor temperature in the bubbler (°C)3734
Deposition temperature (°C)475
Carrier gas (N2) flow rate (cm3 min−1)881288
Dilution gas (N2) flow rate (cm3 min−1)530
Deposition pressure (Torr)5
Inlet precursor mole fraction 3.4 × 10−43.4 × 10−45.1 × 10−42.8 × 10−42.8 × 10⁻⁴
Deposited mass (mg)2.8 ± 0.27.5 ± 0.210.0 ± 0.212.1 ± 0.226.6 ± 0.2
Table 2. Transformation products (TPs) detected by high-performance liquid chromatography–mass spectrometry (HPLC–MS) during the degradation of diuron (DRN) with the C-12 coating.
MoleculeFormulaProposed StructureMoleculeFormulaProposed Structure
TP-1C2H7N2OWater 16 00001 i001TP-2C3H8N2OWater 16 00001 i002
RT (min)
LC-MS
Measured mass [M+H]+ (m/z)Maximum area detectedRT (min)
LC-MS
Measured mass [M+H]+ (m/z)Maximum area detected
1.6275.0561381,1781.8489.0716117,049,090
Water 16 00001 i003Water 16 00001 i004
MoleculeFormulaProposed structureMoleculeFormulaProposed structure
TP-3C8H9N2O2ClWater 16 00001 i005TP-4C9H11O2N2ClWater 16 00001 i006
RT (min)
LC-MS
Measured mass [M+H]+ (m/z)Maximum area detectedRT (min)
LC-MS
Measured mass [M+H]+ (m/z)Maximum area detected
5.36201.04262176,6345.96215.058273,193,831
Water 16 00001 i007Water 16 00001 i008
MoleculeFormulaProposed structureMoleculeFormulaProposed structure
TP-5C9H10N2O2Cl2Water 16 00001 i009TP-6C8H8Cl2N2OWater 16 00001 i010
RT (min)
LC-MS
Measured mass [M+H]+ (m/z)Maximum area detectedRT (min)
LC-MS
Measured mass [M+H]+ (m/z)Maximum area detected
14.60249.01920900,21415.23219.00861976,775
Water 16 00001 i011Water 16 00001 i012
Disclaimer/Publisher’s Note: The statements, opinions and data contained in all publications are solely those of the individual author(s) and contributor(s) and not of MDPI and/or the editor(s). MDPI and/or the editor(s) disclaim responsibility for any injury to people or property resulting from any ideas, methods, instructions or products referred to in the content.

