
Prediction for the Sluice Deformation Based on SOA-LSTM-Weighted Markov Model
by
Jianhe Peng
1, 
Wei Xie
2,3,4,
Yan Wu
5,
Xiaoran Sun
1,
Chunlin Zhang
6,
Hao Gu
2,3,4,
Mingyuan Zhu
2,3,4,5 and
Sen Zheng
2,3,4,* 1
Anhui and Huaihe River Institute of Hydraulic Research (Anhui Provincial Water Conservancy Engineering Quality Testing Center Station), Hefei 230088, China
2
The National Key Laboratory of Water Disaster Prevention, Hohai University, Nanjing 210098, China
3
College of Water Conservancy and Hydropower Engineering, Hohai University, Nanjing 210098, China
4
National Engineering Research Center of Water Resources Efficient Utilization and Engineering Safety, Hohai University, Nanjing 210098, China
5
Xinjiang Institute of Water Resources and Hydropower Research, Urumqi 830049, China
6
Anhui Huaihe River Management Bureau, Bengbu 233099, China
*
Author to whom correspondence should be addressed.
Water 2023, 15(21), 3724; https://doi.org/10.3390/w15213724
Submission received: 12 September 2023
/
Revised: 17 October 2023
/
Accepted: 23 October 2023
/
Published: 25 October 2023
(This article belongs to the Special Issue Remote Sensing, Artificial Intelligence and Deep Learning in Hydraulic Structure Safety Monitoring)
Abstract
:Increasingly, deformation prediction has become an essential research topic in sluice safety control, which requires significant attention. However, there is still a lack of practical and efficient prediction modeling for sluice deformation. In order to address the limitations in mining the deep features of long-time data series of the traditional statistical model, in this paper, an improved long short-term memory (LSTM) model and weighted Markov model are introduced to predict sluice deformation. In the method, the seagull optimization algorithm (SOA) is utilized to optimize the hyper-parameters of the neural network structure in LSTM primarily to improve the model. Subsequently, the relevant error sequences of the fitting results of SOA-LSTM model are classified and the Markovity of the state sequence is examined. Then, the autocorrelation coefficients and weights of each order are calculated and the weighted and maximum probability values are applied to predict the future random state of the sluice deformation. Afterwards, the prediction model of sluice deformation on the SOA-LSTM-weighted Markov model is proposed. Ultimately, the presented model is used to predict the settlement characteristics of an actual sluice project in China. The analysis results demonstrate that the proposed model possesses the highest values of R2 and the smallest values of RMSE and absolute relative errors for the monitoring data of four monitoring points. Consequently, it concluded that the proposed method shows better prediction ability and accuracy than the SOA-LSTM model and the stepwise regression model.
1. Introduction
There is no doubt that sluices have played a significant role in flood control, irrigation, shipping, hydroelectric power and water supply for a very long time [1,2]. Therefore, research on the safety properties of sluices has become a subject of intense interest [3]. Sluice deformation as the most intuitive index to reflect the sluice structural characteristics has brought about widespread attention. Many failure incidents of sluices have already taken place caused by extreme deformations, which have seriously affected the safety of people’s lives and property. Hence, it is becoming increasingly difficult to ignore the research on monitoring techniques, prediction and assessment methods of sluice deformation.
In order to monitor the sluice deformation in real-time to access the structural health conditions of sluices, besides traditional monitoring techniques, GPS/GNSS [4,5], geodetic methods [6,7], laser scanning devices [8,9,10], interferometric synthetic aperture radar (InSAR) [11,12], etc. are all viable alternatives. Among them, GPS is the Global Positioning System, which is designed as an all-weather space-based navigation system for both military and civilian navigation needs. GNSS is the Global Navigation Satellite System, which serves as a popular means of deformation monitoring technique with the advantages of functioning in all weather conditions, is fully automated, requires no need for visibility conditions, etc. The geodetic monitoring methods usually utilize different optical and mechanical instruments, combined with other monitoring methods, such as the visual line method, lead line method and forward intersection method. Laser scanning devices and InSAR are both the latest emerging monitoring technology, which have been applied universally in deformation monitoring due to their high monitoring precision. Yang et al. [13] applied interferometric synthetic aperture radar (InSAR) in sluice deformation monitoring. Zhang et al. [14] introduced a digital photography and measurement robot into the monitoring of sluice health. As important means of deformation monitoring techniques, the above methods possess many merits such as high accuracy and efficiency [15] and have been widely applied. The monitoring results are able to provide reliable information of structural characteristics of hydraulic engineering.
In view of extreme deformations always leading to failure cases of hydraulic structure engineering, establishing deformation prediction models based on monitoring data series is of great importance [16,17]. For example, mathematical statistics, structural analysis and artificial intelligence algorithms have been utilized in the studies of variation law, early warning and risk analysis related to the deformation of dams for decades [18,19,20]. Recently, with the rapid development of artificial intelligence algorithms, artificial neural networks [21,22,23], grey system models [24,25,26], clustering algorithms [27,28,29] and intelligent optimization algorithms [30,31,32] have been widely applied in the deformation prediction of hydraulic structure engineering. These algorithms are able to overcome the shortcomings of traditional prediction models in terms of multidimensional input, model adaptive learning and overfitting. Given that deformation monitoring data series of hydraulic structure engineering possess apparent variations in regulation in the time dimension, the recurrent neural network (RNN) has excellent development and application prospects in learning sequenced data. However, RNNs are prone to the problems of gradient vanishing and gradient explosion during long sequence training. Therefore, as an RNN, LSTM is introduced to establish the more sensible deformation prediction model construction due to its advantage in learning from experience to classify, processing and predicting long time series [33,34,35]. Song et al. [36] and Hu et al. [37] optimized the hyperparameters of the LSTM model to establish deformation prediction models of concrete dam and concrete faced rockfill dam, respectively. The application results verified the good analysis accuracy and efficiency of the models, which demonstrates the practical application value of LSTM in engineering safety monitoring.
In recent decades, some researchers carried out monitoring, laboratory tests and numerical analyses of sluice deformation. Si et al. analyzed the overall strength and deformation of complex sluice chamber structures based on the finite element method [38]. Ding et al. [39] established the horizontal deformation prediction model of sluice based on the back propagation neural network weighted Markov model. The sluice deformation prediction model serves as a useful tool which can effectively analyze sluice performance in real-time and prevent potential risks. Unfortunately, the existing studies focus primarily on the dam deformation prediction. So far, there are only a few studies concerning sluice deformation prediction model establishment in the literature.
Above all, there is an urgent need to propose an efficient prediction model of sluice deformation. Considering the obvious merits of the LSTM, this paper aims to present a novel prediction model for sluice deformation. First, the deformation prediction method of sluice based on a statistical model is introduced in Section 2. Subsequently, the principle of the LSTM network optimized by the seagull optimization algorithm (SOA) is studied in Section 3. Then, the weighted Markov model is applied to adjust the prediction residuals of the SOA-LSTM model. Accordingly, the sluice deformation prediction model is proposed by combining the SOA, LSTM and weighted Markov model in Section 4. Subsequently, a practical sluice project in China is introduced as a case study to verify the prediction ability and accuracy of the proposed model in Section 5. The fitted and predicted results are demonstrated and discussed in Section 6. Finally, the conclusions are drawn in Section 7.
2. Statistical Model of Sluice Deformation
The statistical model is a practical tool for hydraulic structure deformation prediction, which assumes that the expectation of the disturbance term is zero in the monitoring data, and approximately obeys the normal distribution. However, the monitoring data in practical engineering scenarios may not necessarily satisfy this condition. The prediction accuracy of the statistical model is generally more complex and depends on the selection of influencing factors. In this paper, the contribution of three components of hydraulic structure deformation is mainly analyzed, such as water pressure, temperature, and time effect factors, to the final results. Among all the factors, the time effect component has many influencing factors, which makes it difficult to formulate an explicit expression. Therefore, in this paper, the expression of deformation can be adopted as follows.
where denotes the water pressure component; is the temperature component, which can be expressed as a harmonic function; denotes the time effect component. The deformation expression can be converted to:
where is the amount of deformation; is the i-th power of the upstream water depth, m; t is the number of days from the observation date to the beginning of the monitoring day; is equal to the number of days from the observation date to the beginning of the monitoring day divided by 100; and are the constant terms and the regression coefficient, respectively, which can be obtained by the stepwise regression analysis method.
3. SOA-LSTM Network Model
3.1. Principles of (Long Short-Term Memory) LSTM Neural Network
LSTM is a special kind of recurrent neural network (RNN), which effectively solves the problems of gradient explosion, gradient disappearance, and long-term dependence of traditional recurrent neural networks in the process of adaptation and prediction by introducing the concepts of cell state and gating. As a result, it has excellent time-series prediction performance. The structure of the LSTM unit mainly consists of a cell state, forgetting gate, input gate, and output gate as depicted in Figure 1. The cell state is also called the memory unit, which provides a channel for information transmission. The cell state is also known as the memory cell, which provides a channel for the transmission of information. The cell state update is controlled by the forgetting gate, input gate, and output gate.
The forgetting gate decides with a certain probability whether to retain the cell state of the previous moment and selects the weight of the information to be retained. Meanwhile, it reads the output of the hidden layer of the previous moment and the input of the current moment to obtain the output of the forgetting gate through a sigmoid activation function:
where represents the weight matrix of the forgetting gate; denotes the bias term; is the sigmoid activation function, ; the output of the forgetting gate controls the degree of forgetting the information of the cell state in the previous moment, which takes the range of . When , indicates complete retention, when , indicates complete forgetting.
The role of the input gate is to filter the new information being input at the current moment for storage in the cell state. The introduction of new information is determined by the sigmoid layer in conjunction with the tanh layer, where the sigmoid layer determines the extent to which new information is selected, and the tanh layer is applied to generate candidates for storing the learned new information.
where , are the weight matrices of the sigmoid layer and the tanh layer, respectively; bi, bc are the bias terms of the sigmoid layer and the tanh layer, respectively; tanh is the hyperbolic tangent function, .
Based on the selection of the cell state at the previous moment by the forgetting gate and the input information at the current moment by the input gate, the cell state can be updated as follows.
The output gate extracts valid information from the current cell state, which is used to generate a new hidden layer. Firstly, the output portion of the current cell state is determined by the sigmoid function. Subsequently, the current cell state is processed by the tanh function. Finally, a new hidden layer is generated as follows.
where is the output of the hidden layer; is the weight matrix of the output gate; is the bias term.
In summary, the hidden layer output and cell state of the LSTM at the current moment is determined by the hidden layer output and cell state of the previous moment in conjunction with the input of the current moment.
When establishing the sluice deformation prediction model based on LSTM, the number of hidden layers plays an essential role in the training accuracy and efficiency of the model. Theoretically, although the fitting accuracy of the LSTM model will improve with the increase in the number of hidden layers, too many hidden layers will lead to a decrease in the training efficiency and even cause a decrease in the fitting and prediction accuracy of the model. Consequently, in this paper, the network structure with two hidden layers of LSTM is adopted.
According to Equation (2), it can be observed that the number of input nodes provided to the LSTM network is nine, and the number of output nodes is one. When selecting the number of nodes in the hidden layer, the initial number of nodes is usually calculated using the empirical formula, and then the number of nodes is incrementally increased or decreased in an attempt to find out the number of nodes of the more optimal hidden layer. Furthermore, the network training utilizes the dropout technique to avoid overfitting, i.e., the model training effect is good but the prediction performance is poor, and the batch processing technique is used to improve the training efficiency of the model [36].
3.2. Principles of Seagull Optimization Algorithm (SOA)
SOA is a novel bio-inspired algorithm proposed by Dhiman et al. [40]. Compared to traditional algorithms like particle swarm optimization (PSO) and the genetic algorithm (GA), SOA has advantages in terms of simplicity, ease of implementation, and better search performance [41]. SOA treats the migration and aggressive behaviors of seagulls in nature as an optimization process. In this algorithm, each seagull represents an individual searching entity in the search space, and the position of a seagull represents a potential solution to the optimization problem. The migration and aggressive behaviors of seagulls are illustrated in Figure 2.
The implementation process of the algorithm is expressed as follows.
- (1)
- Migration behavior (global search)During the seagull migration process, a seagull moves from one position to another. The above migration behavior should satisfy the following three conditions:
- (1)
- Avoiding collision. To avoid collisions between adjacent seagulls, an additional variable A is introduced to update the position of the seagull during the iterative calculation, as shown in Figure 3a.where is the new position; is the current position of the seagull; i is the number of the current iteration; A is the additional variable representing the movement of seagull in the given search space. The calculation method of A is as follows.where is the control frequency of variable A, its range is [0, ]. Typically, is set to 2; i is the number of current iterations, ; is the maximum number of iterations.
- (2)
- Moving towards the best neighbor. After avoiding collisions between adjacent seagulls, a seagull moves towards the direction of the best neighbor, as illustrated in Figure 3b.where represents the direction in which the seagull moves from its original position to the position of the best neighboring seagull ; B is a random parameter used to balance the global and local search, and its calculation formula can be denoted as:where rd is a random value between 0 and 1.
- (3)
- Moving towards the best position. Finally, the seagull updates its own position based on the best position, as depicted in Figure 3c.where represents the distance between the current position and the global best position.
- (2)
- Aggressive behavior (local search)When a seagull needs to attack its prey during flight, it forms a spiral formation in the air, as shown in Figure 3d. This behavior can be described in the xyz three-dimensional plane as follows.where r denotes the spiral radius formed by the seagull swarm; k is a random angle within the range [0, 2π]; v and u are constants that determine the spiral shape; e denotes the base of the natural logarithm.Considering both seagull migration and aggressive behaviors, the calculation formula of seagull location updating can be obtained based on Equation (12) to Equation (16) as follows.where is the attack position of the seagull, which is denoted as its final location is updated.
3.3. SOA Optimized LSTM
Since LSTM has many hyper-parameters that need to be adjusted manually, such as the number of neurons in the hidden layer, the initial learning rate, the maximum number of iterations, the minimum number of batches, the time step, etc., these hyper-parameters have a certain impact on the prediction results, and it takes a lot of time to adjust these parameters. Determining how to find the hyper-parameters that can make the whole prediction process faster and more accurate is a problem that needs to be solved.
The seagull optimization algorithm, as a biomimetic global optimization algorithm, can be used to optimize the hyper-parameters of the neural network.
In the prediction of sluice deformation, the factors that can affect the amount of deformation are mainly obtained as the characteristic variables for the prediction of deformation and are normalized as the input data. Simultaneously, sluice deformation monitoring data are normalized to ensure the prediction accuracy. By adjusting and designing the LSTM network structure and using SOA to optimize and solve the hyper-parameters of the LSTM model, the optimized parameters are directly used as the parameter values of the LSTM model to predict the sluice deformation. Finally, the prediction value of sluice deformation is obtained. The specific modeling and prediction ideas are as follows.
- (1)
- Data processing. First, the data set is normalized, and 80% of the data in the monitoring sequence is selected as the training set, and 20% of the data in the monitoring sequence is selected as the test set.
- (2)
- Single LSTM model structure design. The LSTM model results are designed in terms of the number of network layers, the number of neurons in the input and hidden layers, the optimizer, and the loss function of the LSTM, and the multivariate multidimensional single-step LSTM network model with an initial input of nine dimensions, a time step of one, and an output of one dimension is constructed.
- (3)
- Construction of SOA LSTM model. The LSTM hyper-parameters to be optimized, such as the number of neurons in the hidden layer, the initial learning rate, the maximum number of iterations, the minimum number of batches, the time step, and the regularization parameter, are used as the solution objectives of the seagull optimization algorithm, and the root mean square error (RMSE) on the training set is taken as the fitness function to obtain the SOA-LSTM model. The computational formula is given by:where n is the number of data in the training set; is the measured value of data in training set; is the fitted value of data in training set.
- (4)
- Model training and prediction. The training data are applied to train the SOA-LSTM model, the test data are input into the trained model, and finally obtain the predicted values.
- (5)
- Model comparison. The prediction results are utilized to calculate the prediction accuracy evaluation index to test the model effect.
The optimization process of LSTM based on SOA is exhibited in Figure 4.
4. SOA-LSTM-Weighted Markov Model for Sluice Deformation Prediction
4.1. Weighted Markov Model-Based Sluice Deformation Prediction
The measured data of sluice deformation has a certain degree of volatility. Due to the advantage of Markov chain in terms of dealing with data with high random volatility, it has been applied in predicting the deformation of hydraulic structures. There are three common Markov models: the Markov model based on absolute distribution, the superposition Markov model, and the weighted Markov model. In this paper, the weighted Markov model is introduced, which is not restricted by the time chi-square of the Markov chain, and takes into account the strength of dependence of different lags, fully exploiting the information contained in the sample data. Furthermore, the accuracy of the weighted Markov model is generally higher than the other two models, and the steps of the weighted Markov model building are as follows:
- (1)
- State classification. The mean square deviation method is proposed to classify the values of random sequence indicator into five state intervals.
- (2)
- Markovianity test. For discrete sluice deformation sequences, the chi-square statistic can be constructed to test for Markovianity.
- (3)
- State transition probability matrix. The one-step state transition frequency matrix with different lags (k is the step size) and the one-step state transition probability matrix should be calculated, separately.
- (4)
- Autocorrelation coefficients and transfer weights of each order. After selecting the lag time, the autocorrelation coefficient and transfer weight of each order should be calculated, separately.
- (5)
- Prediction table preparation. The sluice deformation of several years before the prediction year should be taken as the initial state, and then the sluice deformation should be combined with the transfer probability matrix of the corresponding lag time to obtain the probability of each order state in the prediction year. Afterwards, the predicted state probabilities of each year of the same state are weighted and summed, which is the average probability of being in each state in the prediction year. The above calculations can be compiled into a prediction table, and the state corresponding to the maximum probability value in the prediction table is taken and predicted by using the weighted Markov model.
4.2. Sluice Deformation Prediction Procedure of SOA-LSTM-Weighted Markov Model
In view of the fact that the LSTM network can deal well with nonlinear problems, the Markov chain is suitable for predicting random sequences with large volatility. Therefore, the SOA-LSTM network-weighted Markov model synthesizes the above advantages, which can be applied to sluice deformation prediction. The prediction procedure of the model is as follows:
- (1)
- Based on the training set, the SOA-LSTM network model is established.
- (2)
- After comparing the measured data with the fitted value, the error sequence can be obtained.
- (3)
- The weighted Markov model is constructed according to the steps in Section 3.1.
- (4)
- The sluice deformation prediction model based on the SOA-LSTM-weighted Markov model can be established.
The computational flow of the SOA-LSTM-weighted Markov model is exhibited in Figure 5.
5. Project Overview
The Bengbu sluice project is located in the middle reaches of the Huaihe River. It now consists of a regulating sluice with 12 holes, a regulating sluice with 28 holes, a hydropower plant, the ship lock, the floodway, embankment and so on. The regulating sluice with 12 holes is composed of six bottom boards, each bottom board with one monitoring point at each corner. One settlement monitoring point at each downstream of the left-side and right-side piers. Six settlement monitoring points at each symmetrical position of upstream and downstream on the left and right bank wing walls. A total of 50 monitoring points were installed in the regulating sluice with 12 holes. Figure 6 illustrates the layout of settlement monitoring points of the regulating sluice with 12 holes of the Bengbu sluice.
The pre-flood settlement monitoring of the regulating sluice of Bengbu has been in progress since 10 March 2021 and the monitoring data are recorded every 30 days. According to the settlement monitoring results, the largest cumulative average variation in settlement of the regulating sluice with 12 holes appeared at the lower right-wing wall at monitoring point Lr-2, with a value of −18.11 mm. The largest cumulative variation in settlement was appeared of monitoring point 3–4, with the largest difference value of 31.59 mm at the upper sluice pier. The largest cumulative settlement appeared at monitoring point 5-1, with the cumulative settlement of −35.75 mm. The settlement eigenvalues of the regulating sluice with 12 holes are counted in Table 1.
In this study, we selected the settlement data (the vertically downward is positive, the vertically upward is negative) of four monitoring points (2-2, Lr-2, Ul-2, and 5-1) for analysis. The monitoring points 2-2, Lr-2, Ul-2, and 5-1 are marked with red dots in Figure 6. After preprocessing the settlement data, the measured data of each monitoring point can be obtained in Figure 7. It is noted that the vertical settlements of all monitoring points have similar variation rules with time; they increase slowly, and tend to converge without obvious periodic variations.
In this paper, the recent settlement monitoring data of monitoring point 5-1 of the sluice was taken as an example to illustrate the implementation process of the proposed method. Eighty (80)% of the monitoring data were utilized to establish the stepwise regression model, the SOA-LSTM model, and the SOA-LSTM-weighted Markov model. Based on the modeling results, the relative errors of the test set were compared to verify the reliability of the proposed model. The specific settlement monitoring data of point 5-1 are illustrated in Table 2.
6. Results and Discussions
6.1. Fitted and Predicted Results of the Stepwise Regression Model
The measured values, calculated values and relative errors obtained by the stepwise regression model are listed in Table 3. The fitted and predicted results of the stepwise regression model are exhibited in Figure 8. The predicted values are exhibited with a blue background in Figure 8.
The calculation formula of the relative error of each calculated datapoint can be written as:
where RE denotes the relative error; is the fitted or predicted value; is the measured value of sluice settlement.
6.2. Fitted and Predicted Results of the SOA-LSTM Network Model
In total, 80% of the sluice settlement monitoring data were used as training set to establish the SOA-LSTM model. The output and input of the LSTM model are the sluice settlement monitoring data and the influence factors of the sluice settlement. Therefore, the number of nodes in the input layer and output layer are nine and one, respectively. The influence of nodes number on the model performance is similar to the mechanism of the influence of the number of hidden layers on the model performance.
In this work, we adopt the SOA to optimize the hyper-parameters the LSTM model. In SOA, the population size was selected as 20, the number of iterations was taken as 30. Figure 9 illustrates the objective function value of the seagull at each iteration step, and the best objective function value can be determined as 5.326 at the 13th iterations by SOA.
The set of upper bound and lower bound of the search area for are exhibited in Table 4. After calculation, the results of the optimized hyperparameters of LSTM model are presented in Table 4.
Figure 10 depicts the relationship curve between the number of nodes in the hidden layer and the average relative error of the training samples. The initial number of nodes in the hidden layer is 10, and the trial calculation is carried out by incrementing 10 nodes one by one, and the average relative error of the training samples is minimized as the criterion. As can be seen in Figure 10, after the trial calculation, in the two hidden layers of the LSTM adopted in this paper, the minimum value of the relative error can be taken when the node number of the first hidden layer is 120. The minimum value of the relative error can be taken when the number node of the second hidden layer is 60. The batch size and the maximum number of iterations can be set to 50 and 400, respectively. The target error of the model training can be set to 0.001.
Figure 11 exhibits the process line of the fitted and predicted values of the sluice settlement of the monitoring point 5-1 based on the SOA-LSTM network model.
As can be seen from Figure 11, except for a few curve peaks with relatively large data jumps, the fitted value of the LSTM network model has the same trend as the measured value. The average absolute value of the relative error is 5.72%, which verifies the better fitted effect of the model.
6.3. Fitted and Predicted Results of the SOA-LSTM-Weighted Markov Model
To further improve the prediction accuracy of the SOA-LSTM-weighted Markov model proposed in this work, the errors of the SOA-LSTM model were corrected by the weighted Markov model. The following computational steps and results are described as follows.
- (1)
- State classification. The relative error series has a mean of 75% and a root mean square error of 7.64%, which is classified into five states corresponding to the intervals of (−22.44%, −9.16%), (−9.16%, −4.58%), (−4.58%, 3.07%), (3.07%, 7.65%) and (7.65%, 24.20%), respectively.
- (2)
- Markovianity test. The one-step transfer frequency matrix , one-step transfer probability matrix , and marginal probability and chi-square statistics were calculated, and the calculation results are described in Table 5. The value of the calculated statistic is 109.9, and given the significance level, . Then . Because , the random sequence is highly significant in terms of Markovianity, and can be predicted by the weighted Markov model.
- (3)
- The state transition probability matrix determination. The relative errors of the fitted values of the SOA-LSTM model were taken as a random sequence, and the one-step state transfer probability matrixes with the step size of 2, 3, 4, and 5, respectively.
- (4)
- Calculation of the autocorrelation coefficients and transfer weights of each order. The autocorrelation coefficients (rk) and transmission weights (wk) of each order are shown in Table 6.
- (5)
- Prediction table preparation. According to the relative errors of the SOA-LSTM model, the corresponding state transfer probability is weighted and calculated to predict the relative error state of test set. Table 7 illustrates a subset of the weighted prediction results of the relative error state of the test set. The state S with the maximum probability value in the prediction table was determined, E was taken as the median value of the corresponding state interval. xSL was selected as the predicted value of the SOA-LSTM network model. xSlM was selected as the predicted value of the SOA-LSTM-weighted Markov model. Therefore, the corrected predicted value can be expressed as:
Taking the calculated results of the stepwise regression model, the SOA-LSTM model as the basis for comparison, the fitted results, predicted results and the relative errors of three models are illustrated in Figure 12 and Figure 13. Among them, Figure 12 shows the comparison of the predicted effects of three models. Figure 13 exhibits some of the absolute values of the relative errors of the settlement predicted value of three models.
In Figure 12, it can be seen that the measured values of sluice settlement at monitoring point 5-1 are nonlinear with time, and the settlement predicted by the SOA-LSTM model and the SOA-LSTM-weighted Markov model have the same trend with the measured data. However, the settlement predicted by the stepwise regression model shows a linear change different from the measured values. The predicted value of the stepwise regression model cannot reflect the nonlinear change characteristics of the measured data, and its prediction result is not as good as that of the SOA-LSTM model and the SOA-LSTM-weighted Markov model in dealing with nonlinear data. As can be seen from Figure 13, the relative errors of SOA-LSTM-weighted Markov model are generally the smallest, while the relative errors of stepwise regression model are the largest overall. The average absolute values of the relative errors of the stepwise regression model, the SOA-LSTM model, and the SOA-LSTM-weighted Markov model are 7.55%, 3.12%, and 1.57%, respectively. It illustrates that the accuracy of the proposed model is better than the other two models.
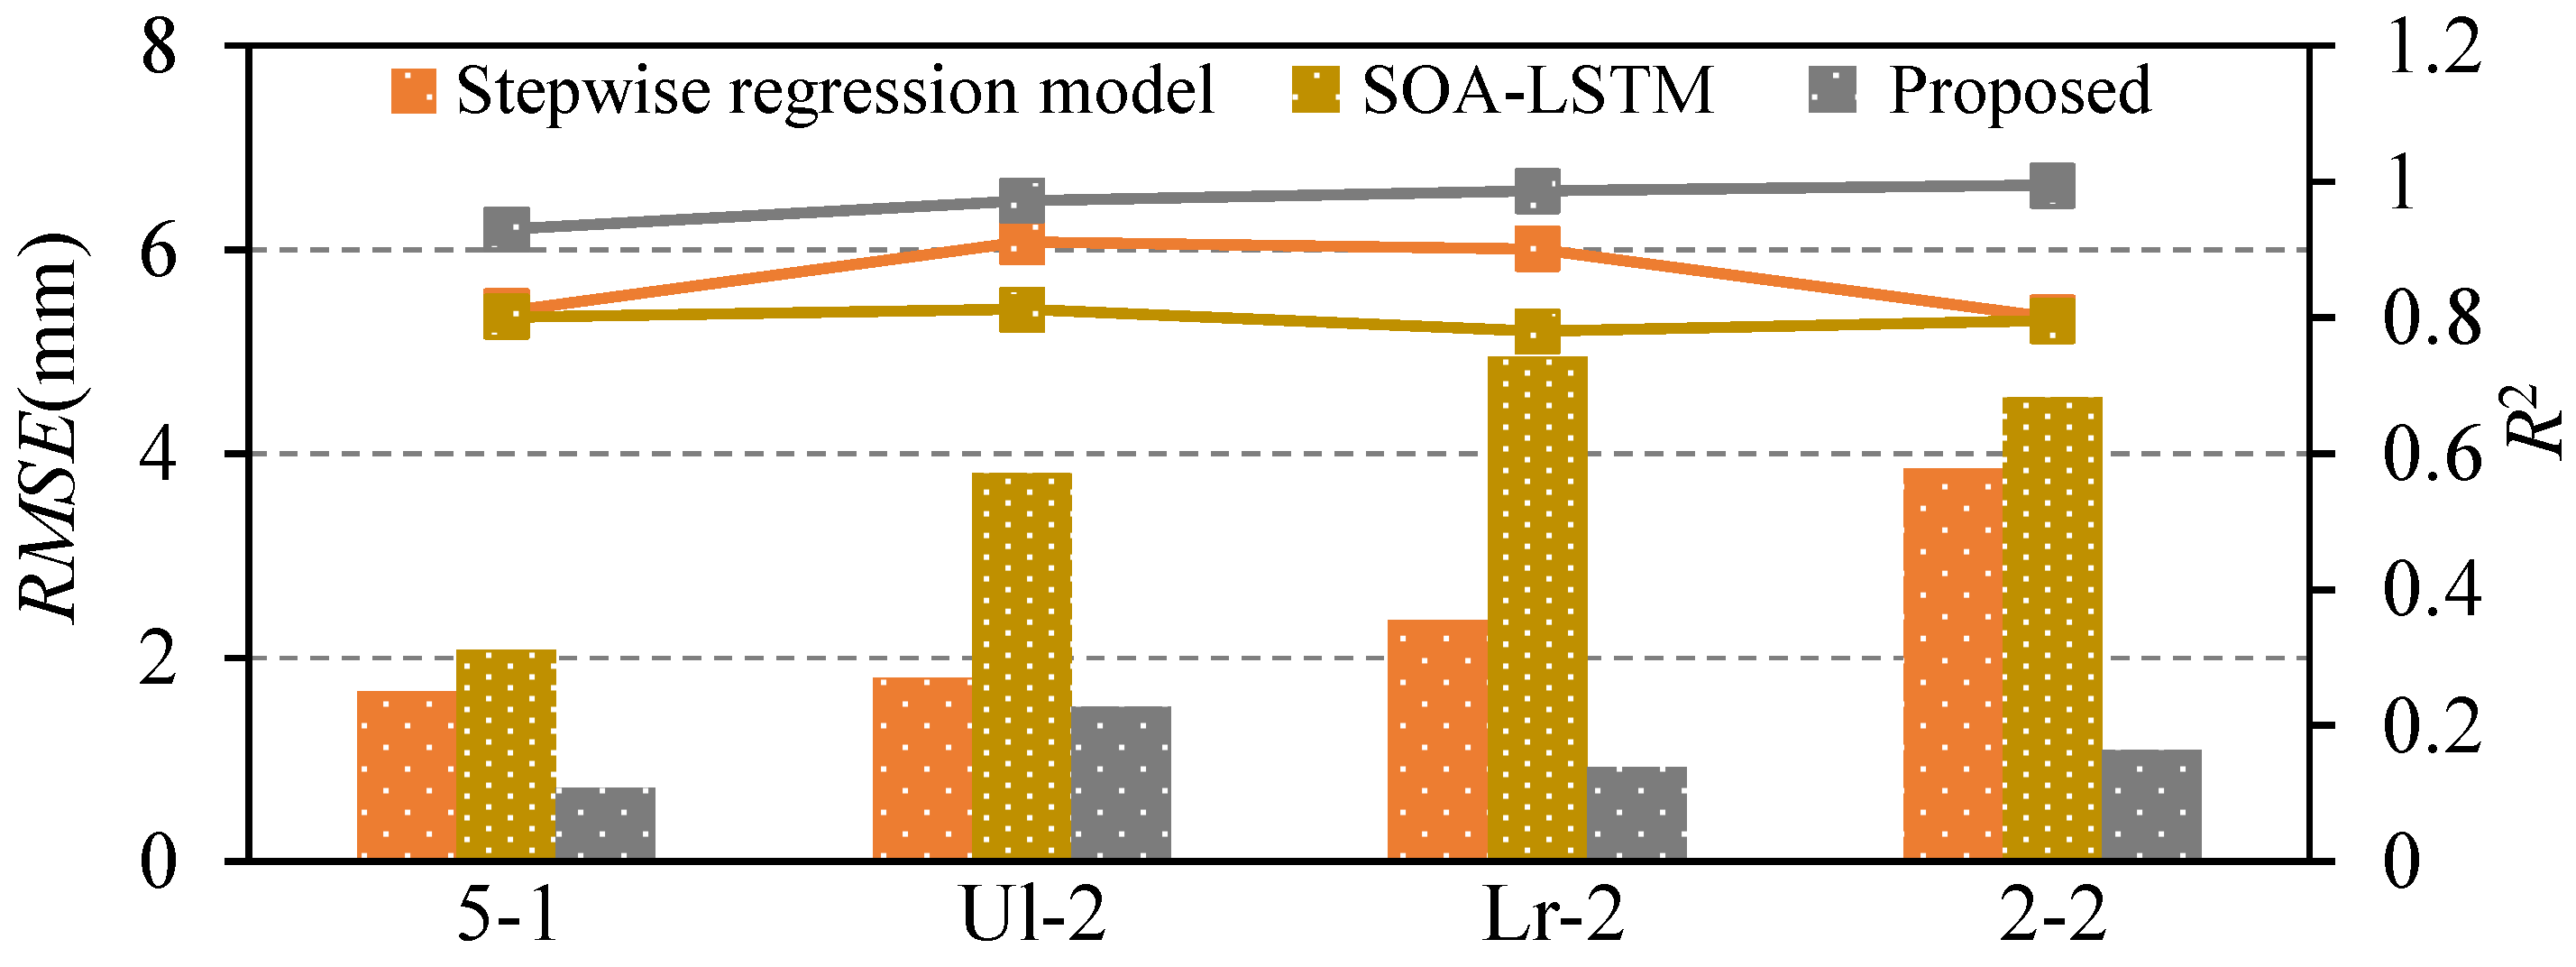
With the aim of verifying the superiority of the SOA-LSTM-weighted Markov model in fitting and predicting sluice deformation, the measured data of monitoring points 2-2, 5-1, Lr-2 and Ul-2 were utilized to establish the prediction models based on the stepwise regression model, SOA-LSTM model, and SOA-LSTM-weighted Markov model, respectively. The calculated results are compared in Figure 14. Figure 15 shows the coefficient of determination (R2) of the training set and the root mean square error (RMSE) of the test set of each model. The calculation formula of R2 can be given by:
where represents the measured data of training set; denotes the average value of the measured data of training set; is the fitted value of the training set; N means the amount of data in the training set.
It can be observed in Figure 14 that although the models can fit the measured data reasonably, the proposed model possesses not only the best fitting effects, but also the best forecast effects. In Figure 15, the R2 and RMSE of the stepwise regression model vary from 0.8001 to 0.9114 and from 1.6705 to 3.8577, respectively. The R2 and RMSE of the stepwise regression model vary from 0.7801 to 0.8514 and from 2.0705 to 4.9561, respectively. The R2 and RMSE of the stepwise regression model vary from 0.9301 to 0.9951 and from 0.725 to 1.517, respectively. Among all four monitoring points, the proposed SOA-LSTM-weighted Markov model has the smallest RMSE, which indicates that the proposed model is feasible and has better prediction accuracy overall.
7. Conclusions
In this paper, the relative error random sequence is obtained by adopting the fitting results of the training set of the SOA-LSTM model and the mean square deviation method is used to classify the states and test the Markovianity of the random sequence. In this case, the SOA-LSTM-weighted Markov model is established. Subsequently, the calculated results of the stepwise regression model, the SOA-LSTM model and the SOA-LSTM-weighted Markov model were compared to verify the fitted and predicted effects of the proposed model. On the basis of the prediction results and the relative errors, the main conclusions can be drawn as follows:
- (1)
- The stepwise regression model is more suitable for dealing with linear problems; it has some limitations in fitting and predicting nonlinear and fluctuating monitoring sequences. By contrast, the proposed model shows obvious superiority in dealing with monitoring data with fluctuation.
- (2)
- The SOA improves the training efficiency of the neural network hyper-parameters of the LSTM model. The SOA-LSTM model can more accurately reflect the nonlinear change rule of the sluice settlement, and the weighted Markov model takes into account the strength of the dependency relationship between different lags, which can fully utilize the information of the training set, significantly reduce the model prediction error, and improve the model prediction accuracy. As listed in Table 1, the maximum settlement variation ranges from 1.73 mm to 31.59 mm, which indicates the apparent fluctuation of sluice settlement monitoring data. On the basis of the fitted results, predicted results and absolute relative errors, the proposed model demonstrates the largest values of R2 and the smallest values of RMSE for the monitoring data of four monitoring points. Therefore, the SOA-LSTM-weighted Markov model is especially suitable for fitting and predicting the larger fluctuation of the sluice settlement, it is also especially suitable for dealing with the more volatile settlement monitoring data.
- (3)
- Due to the better regularity of the actual data series selected in this paper, the prediction accuracy of the SOA-LSTM model and the SOA-LSTM-weighted Markov model is higher. When more monitoring data are obtained, the prediction model should be trained and adjusted in time, and then the subsequent dynamic prediction of the sluice settlement can be carried out, which will be able to better describe the settlement law of the sluice. To our knowledge, the proposed model expresses the stable and accurate results in predicting long sequenced monitoring data. In view of the practical application performance in the case study, the proposed model is supposed to applied extensively in deformation prediction of more sluice projects to improve safety monitoring efficiency, which provides a new aid for structural engineers involved in the real-time health assessment and safety monitoring in sluices. The study in this paper focuses mainly on the data-driven sluice deformation prediction model. A further study should pay more attention to investigating the physics-data double-driven intelligent prediction model, and the proposed method will have prospective applications in sluice structural behavior safety monitoring.
Author Contributions
Conceptualization, J.P. and W.X.; methodology, Y.W. and X.S.; software, S.Z., C.Z. and H.G.; validation, J.P. and X.S.; formal analysis, M.Z.; investigation, S.Z.; resources, J.P.; data curation, X.S.; writing—original draft preparation, W.X. and S.Z.; writing—review and editing, S.Z. and H.G.; supervision, J.P.; project administration, J.P., X.S., C.Z., Y.W. and M.Z.; funding acquisition, J.P., Y.W. and H.G. All authors have read and agreed to the published version of the manuscript.
Funding
This research was funded by Anhui Provincial Natural Science Foundation: “Water Sciences” Joint Fund (2208085US17), National Natural Science Foundation of China (Grant No. U2243223), the Fundamental Research Funds for the Central Universities (Grant No. B230201011), Jiangsu Young Science and Technological Talents Support Project (Grant No.TJ-2022-076), Fund of Water Conservancy Technology of Xinjiang Province (XSKJ-2023-23), and Water Conservancy Science and Technology Project of Jiangsu (Grant No. 2022024).
Data Availability Statement
Not applicable.
Conflicts of Interest
The authors declare no conflict of interest.
References
- Gu, Z.; Cao, X.; Liu, G.; Lu, W. Optimizing operation rules of sluices in river networks based on knowledge-driven and data-driven mechanism. Water Resour. Manag. 2014, 28, 3455–3469. [Google Scholar] [CrossRef]
- He, X.; Wang, Y.P.; Zhu, Q.; Zhang, Y.; Zhang, D.; Zhang, J.; Yang, Y.; Gao, J. Simulation of sedimentary dynamics in a small-scale estuary: The role of human activities. Environ. Earth Sci. 2015, 74, 869–878. [Google Scholar] [CrossRef]
- Zhu, Y.; Tang, H. Automatic damage detection and diagnosis for hydraulic structures using drones and artificial intelligence techniques. Remote Sens. 2023, 15, 615. [Google Scholar] [CrossRef]
- Komac, M.; Holley, R.; Mahapatra, P.; Marel, H.; Bavec, M. Coupling of GPS/GNSS and radar interferometric data for a 3D surface displacement monitoring of landslides. Landslides 2015, 12, 241–257. [Google Scholar] [CrossRef]
- Tu, R.; Liu, J.; Lu, C.; Zhang, R.; Zhang, P.; Lu, X. Cooperating the BDS, GPS, GLONASS and strong-motion observations for real-time deformation monitoring. Geophys. J. Int. 2017, 209, 1408–1417. [Google Scholar] [CrossRef]
- De Lacy, M.C.; Ramos, M.I.; Gil, A.J.; Franco, Ó.D.; Herrera, A.M.; Avilés, M.; Domínguez, A.; Chical, J.C. Monitoring of vertical deformations by means high-precision geodetic levelling. Test case: The Arenoso dam (South of Spain). J. Appl. Geod. 2017, 11, 31–41. [Google Scholar] [CrossRef]
- Milillo, P.; Bürgmann, R.; Lundgren, P.; Salzer, J.; Perissin, D.; Fielding, E.; Biondi, F.; Milillo, G. Space geodetic monitoring of engineered structures: The ongoing destabilization of the Mosul dam, Iraq. Sci. Rep. 2016, 6, 37408. [Google Scholar] [CrossRef] [PubMed]
- Zhang, L.; Liu, P.; Yan, X.; Zhao, X. Middle displacement monitoring of medium–small span bridges based on laser technology. Struct. Control Health Monit. 2020, 27, e2509. [Google Scholar] [CrossRef]
- Zhao, X.; Liu, H.; Yu, Y.; Xu, X.; Hu, W.; Li, M.; Ou, J. Bridge displacement monitoring method based on laser projection-sensing technology. Sensors 2015, 15, 8444–8463. [Google Scholar] [CrossRef]
- Rodriguez, A.; Comeron, A.; Mesalles, E. Performance assessment of a homodyne laser radar for surface displacement monitoring. Opt. Eng. 2001, 40, 2812–2821. [Google Scholar] [CrossRef]
- Li, Z.; Cao, Y.; Wei, J.; Duan, M.; Wu, L.; Hou, J.; Zhu, J. Time-series InSAR ground deformation monitoring: Atmospheric delay modeling and estimating. Earth Sci. Rev. 2019, 192, 258–284. [Google Scholar] [CrossRef]
- Yang, Z.; Li, Z.; Zhu, J.; Wang, Y.; Wu, L. Use of SAR/InSAR in mining deformation monitoring, parameter inversion, and forward predictions: A review. IEEE Geosci. Remote Sens. Mag. 2020, 8, 71–90. [Google Scholar] [CrossRef]
- Yang, X.; Wang, D.; Xu, Y.; Hou, M.; Wang, Z. Performance assessment of Insar-based vertical displacement monitoring of sluices in coastal soft soil area. KSCE J. Civ. Eng. 2022, 26, 371–380. [Google Scholar] [CrossRef]
- Zhang, G.; Yu, C.; Guo, G.; Li, L.; Zhao, Y.; Li, H.; Gong, Y. Monitoring sluice health in vibration by monocular digital photography and a measurement robot. KSCE J. Civ. Eng. 2019, 23, 2666–2678. [Google Scholar] [CrossRef]
- Ferretti, A.; Fumagallim, A.; Novali, F.; Prati, C.; Rocca, F.; Rucci, A. A new algorithm for processing interferometric data-stacks: SqueeSAR. IEEE Trans. Geosci. Remote Sens. 2011, 49, 3460–3470. [Google Scholar] [CrossRef]
- Peng, M.; Zhang, L.M. Analysis of human risks due to dam break floods—Part 2: Application to Tangjiashan landslide dam failure. Nat. Hazards 2012, 64, 1899–1923. [Google Scholar] [CrossRef]
- Kalkan, Y.; Potts, L.V.; Bilgi, S. Assessment of vertical deformation of the Atatürk dam using geodetic observations. J. Surv. Eng. 2016, 142, 04015011. [Google Scholar] [CrossRef]
- Li, W.; Ye, Y.; Hu, N.; Wang, X.; Wang, Q. Real-time warning and risk assessment of tailings dam disaster status based on dynamic hierarchy-grey relation analysis. Complexity 2019, 2019, 5873420. [Google Scholar] [CrossRef]
- Shao, C.; Gu, C.; Yang, M.; Xu, Y.; Su, H. A novel model of dam displacement based on panel data. Struct. Control Health Monit. 2018, 25, e2037. [Google Scholar] [CrossRef]
- Zhu, Y.; Xie, M.; Zhang, K.; Li, Z. A dam deformation residual correction method for high arch dams using phase space reconstruction and an optimized long short-term memory network. Mathematics 2023, 11, 2010. [Google Scholar] [CrossRef]
- Zheng, S.; Gu, C.; Shao, C.; Hu, Y.; Xu, Y.; Huang, X. A novel prediction model for seawall deformation based on CPSO-WNN-LSTM. Mathematics 2023, 11, 3752. [Google Scholar] [CrossRef]
- Li, M.; Wang, J. An empirical comparison of multiple linear regression and artificial neural network for concrete dam deformation modelling. Math. Prob. Eng. 2019, 2019, 7620948. [Google Scholar] [CrossRef]
- Wu, X.; Zheng, D.J.; Liu, Y.T.; Chen, Z.Y.; Chen, X.Q. Temporal convolution network-based time frequency domain integrated model of multiple arch dam deformation and quantification of the load impact. Struct. Control Health Monit. 2022, 29, e3090. [Google Scholar] [CrossRef]
- Wang, L.; Zhang, S.C.; Li, Y.H. Application of dynamic gray forecast model in dam deformation monitoring and forecast. J. Xi’an Univ. Sci. Technol. 2005, 3, 014. [Google Scholar]
- Huang, C.; Zhou, L.; Liu, F.; Cao, Y.; Liu, Z.; Xue, Y. Deformation prediction of dam based on optimized grey verhulst model. Mathematics 2023, 11, 1729. [Google Scholar] [CrossRef]
- Chu, C.; Xu, G. Application of grey deformation prediction model optimized by double coefficient for tailings dam. Math. Prob. Eng. 2022, 2022, 6103860. [Google Scholar] [CrossRef]
- Hu, Y.; Shao, C.; Gu, C.; Meng, Z. Concrete dam displacement prediction based on an ISODATA-GMM clustering and random coefficient model. Water 2019, 11, 714. [Google Scholar] [CrossRef]
- Chen, W.; Wang, X.; Cai, Z.; Liu, C.; Zhu, Y.; Lin, W. DP-GMM clustering-based ensemble learning prediction methodology for dam deformation considering spatiotemporal differentiation. Knowl.-Based Syst. 2021, 222, 106964. [Google Scholar] [CrossRef]
- Hu, J.; Ma, F. Zoned deformation prediction model for super high arch dams using hierarchical clustering and panel data. Eng. Comput. 2020, 37, 2999–3021. [Google Scholar] [CrossRef]
- Lin, C.; Weng, K.; Lin, Y.; Zhang, T.; He, Q.; Su, Y. Time series prediction of dam deformation using a hybrid STL–CNN–GRU model based on sparrow search algorithm optimization. Appl. Sci. 2022, 12, 11951. [Google Scholar] [CrossRef]
- Shao, C.; Zheng, S.; Gu, C.; Hu, Y.; Qin, X. A novel outlier detection method for monitoring data in dam engineering. Expert Syst. Appl. 2022, 193, 116476. [Google Scholar] [CrossRef]
- Xing, Y.; Chen, Y.; Huang, S.; Wang, P.; Xiang, Y. Research on dam deformation prediction model based on optimized SVM. Processes 2022, 10, 1842. [Google Scholar] [CrossRef]
- Hochreiter, S.; Schmidhuber, J. Long short-term memory. Neural Comput. 1997, 9, 1735–1780. [Google Scholar] [CrossRef] [PubMed]
- Abdel-Nasser, M.; Mahmoud, K. Accurate photovoltaic power forecasting models using deep LSTM-RNN. Neural Comput. Appl. 2019, 31, 2727–2740. [Google Scholar] [CrossRef]
- Altan, A.; Karasu, S.; Zio, E. A new hybrid model for wind speed forecasting combining long short-term memory neural network, decomposition methods and grey wolf optimizer. Appl. Soft Comput. 2021, 100, 106996. [Google Scholar] [CrossRef]
- Song, S.; Zhou, Q.; Zhang, T.; Hu, Y. Automatic concrete dam deformation prediction model based on TPE-STL-LSTM. Water 2023, 15, 2090. [Google Scholar] [CrossRef]
- Hu, Y.; Gu, C.; Meng, Z.; Shao, C.; Min, Z. Prediction for the settlement of concrete face rockfill dams using optimized LSTM model via correlated monitoring data. Water 2022, 14, 2157. [Google Scholar] [CrossRef]
- Si, H.Y.; Chen, M. Three dimensional structural analysis of complex sluice chamber structures. Appl. Mech. Mater. 2012, 170, 1971–1976. [Google Scholar] [CrossRef]
- Ding, Q.; Huang, Y.; Xie, T.; Li, F.; Gao, L. Prediction of horizontal displacement of sluice gate based on BP neural network weighted Markov model. J. Water Resour. Water 2020, 31, 187–193. [Google Scholar]
- Dhiman, G.; Kumar, V. Seagull optimization algorithm: Theory and its applications for large-scale industrial engineering problems. Knowl.-Based Syst. 2019, 165, 169–196. [Google Scholar] [CrossRef]
- Cao, Y.; Li, Y.; Zhang, G.; Jermsittiparsert, K.; Razmjooy, N. Experimental modeling of PEM fuel cells using a new improved seagull optimization algorithm. Energy Rep. 2019, 5, 1616–1625. [Google Scholar] [CrossRef]
Figure 1.
(a) Cell structure of RNN; (b) cell structure of LSTM.
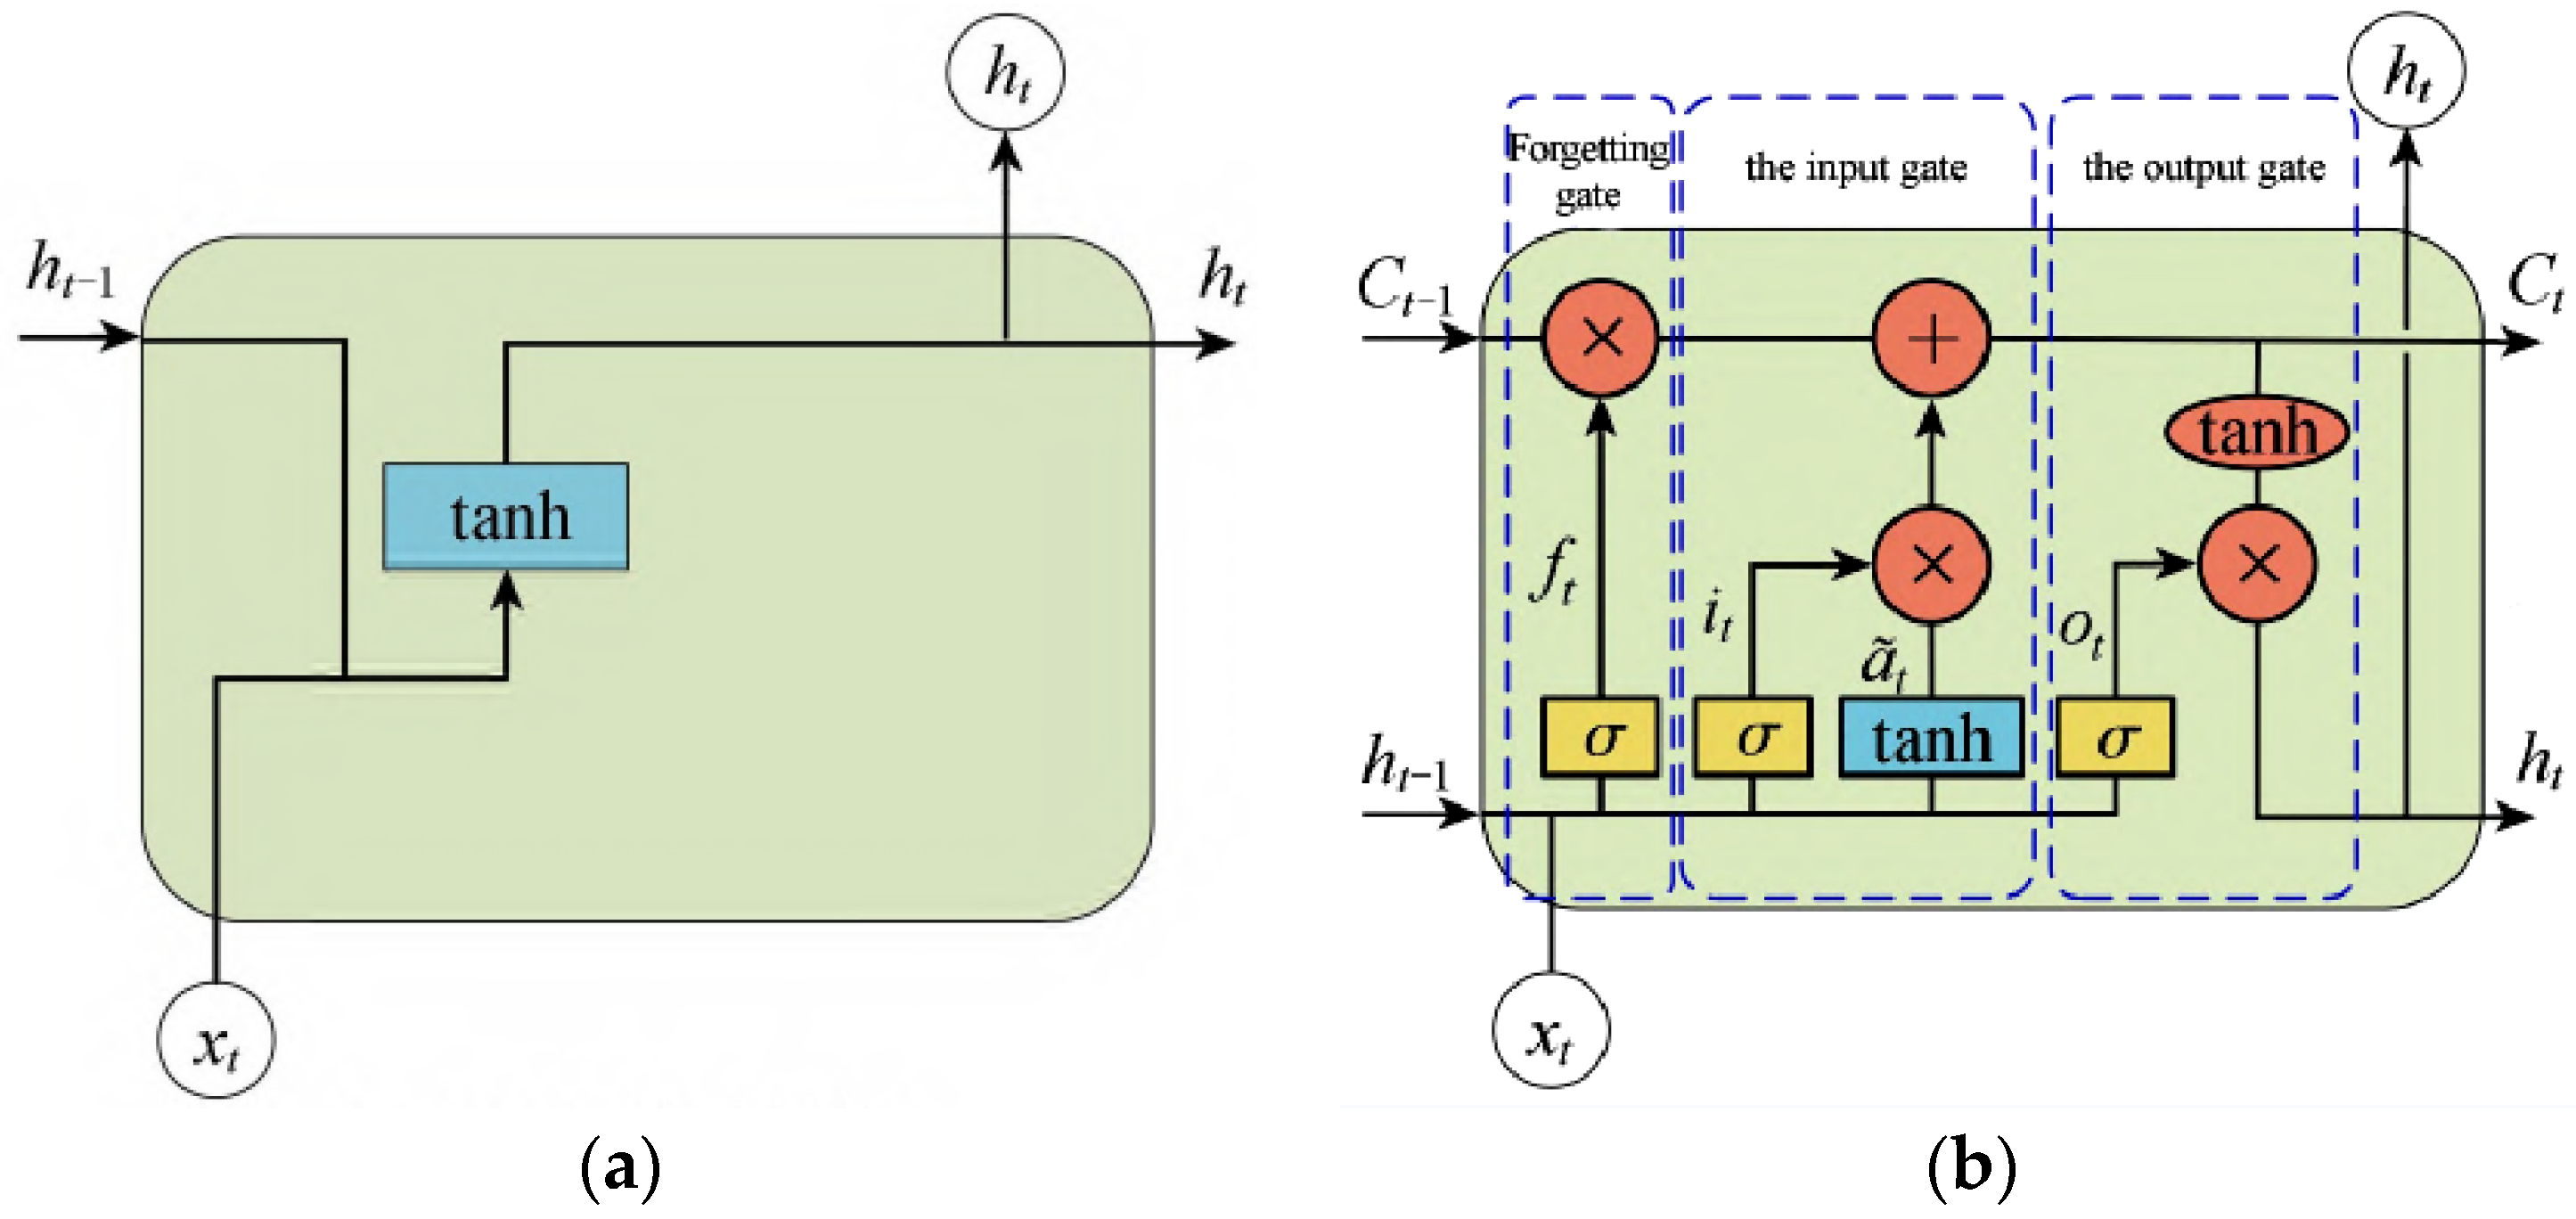
Figure 2.
The migration and aggressive behaviors of seagulls.
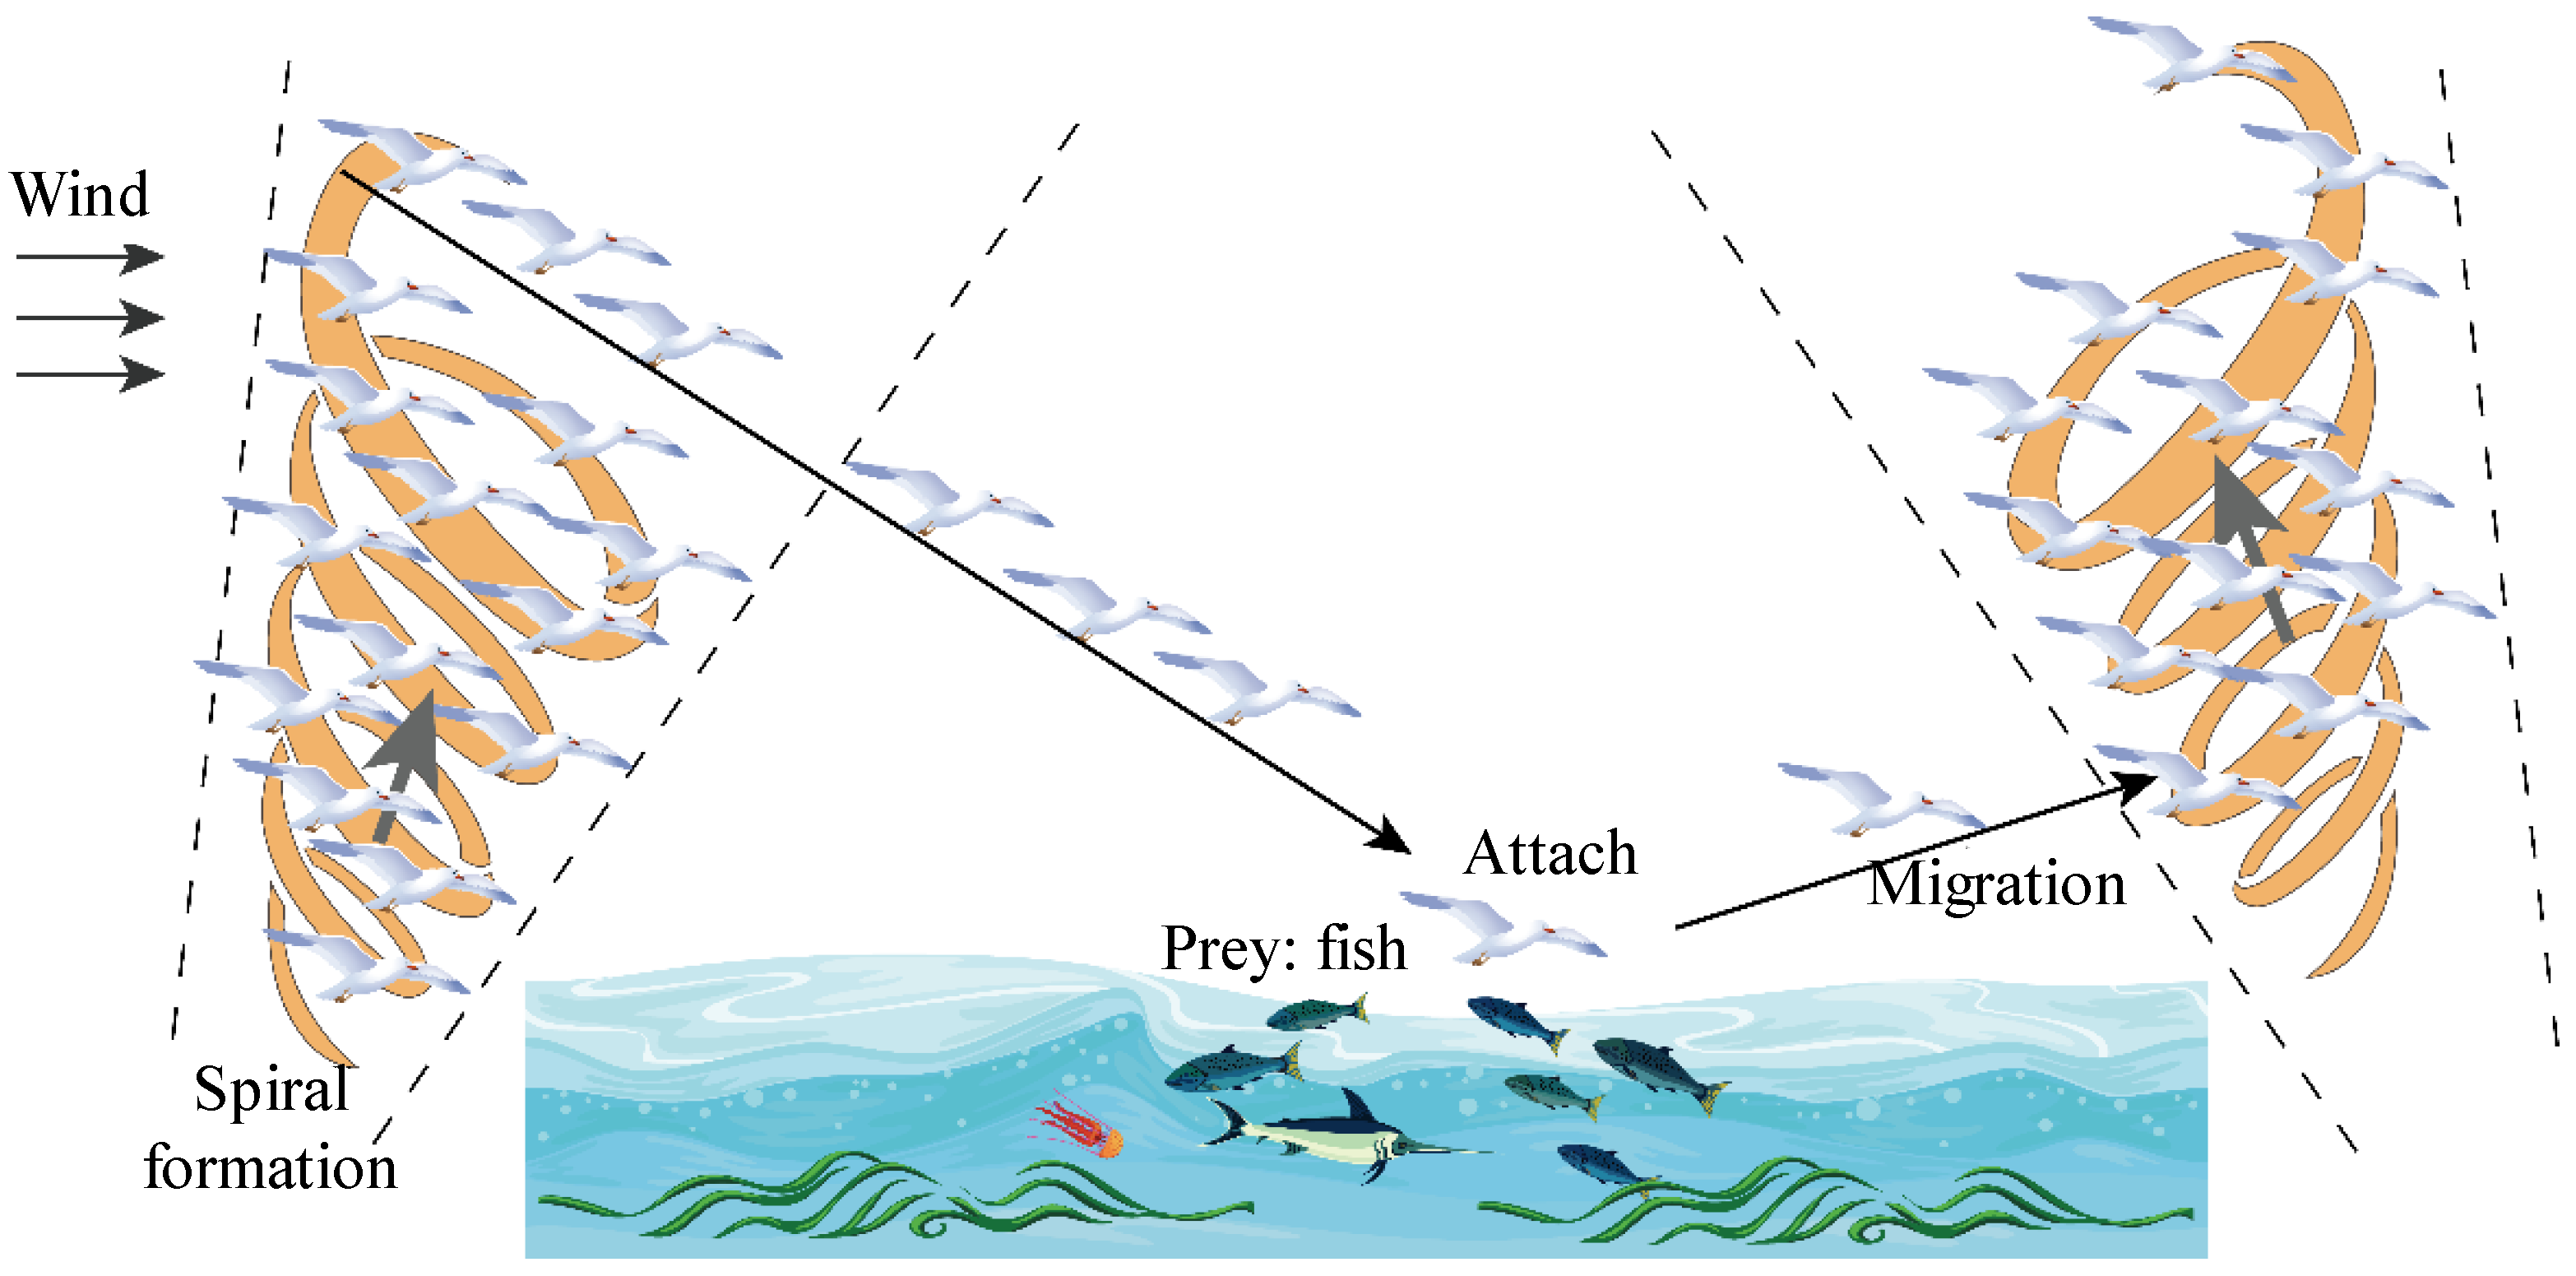
Figure 3.
Schematic diagram of migration and aggressive behavior of SOA: (a) avoiding collision, (b) moving towards the best neighbor, (c) moving towards the best position, (d) the spiral aggressive behavior.
Figure 3.
Schematic diagram of migration and aggressive behavior of SOA: (a) avoiding collision, (b) moving towards the best neighbor, (c) moving towards the best position, (d) the spiral aggressive behavior.
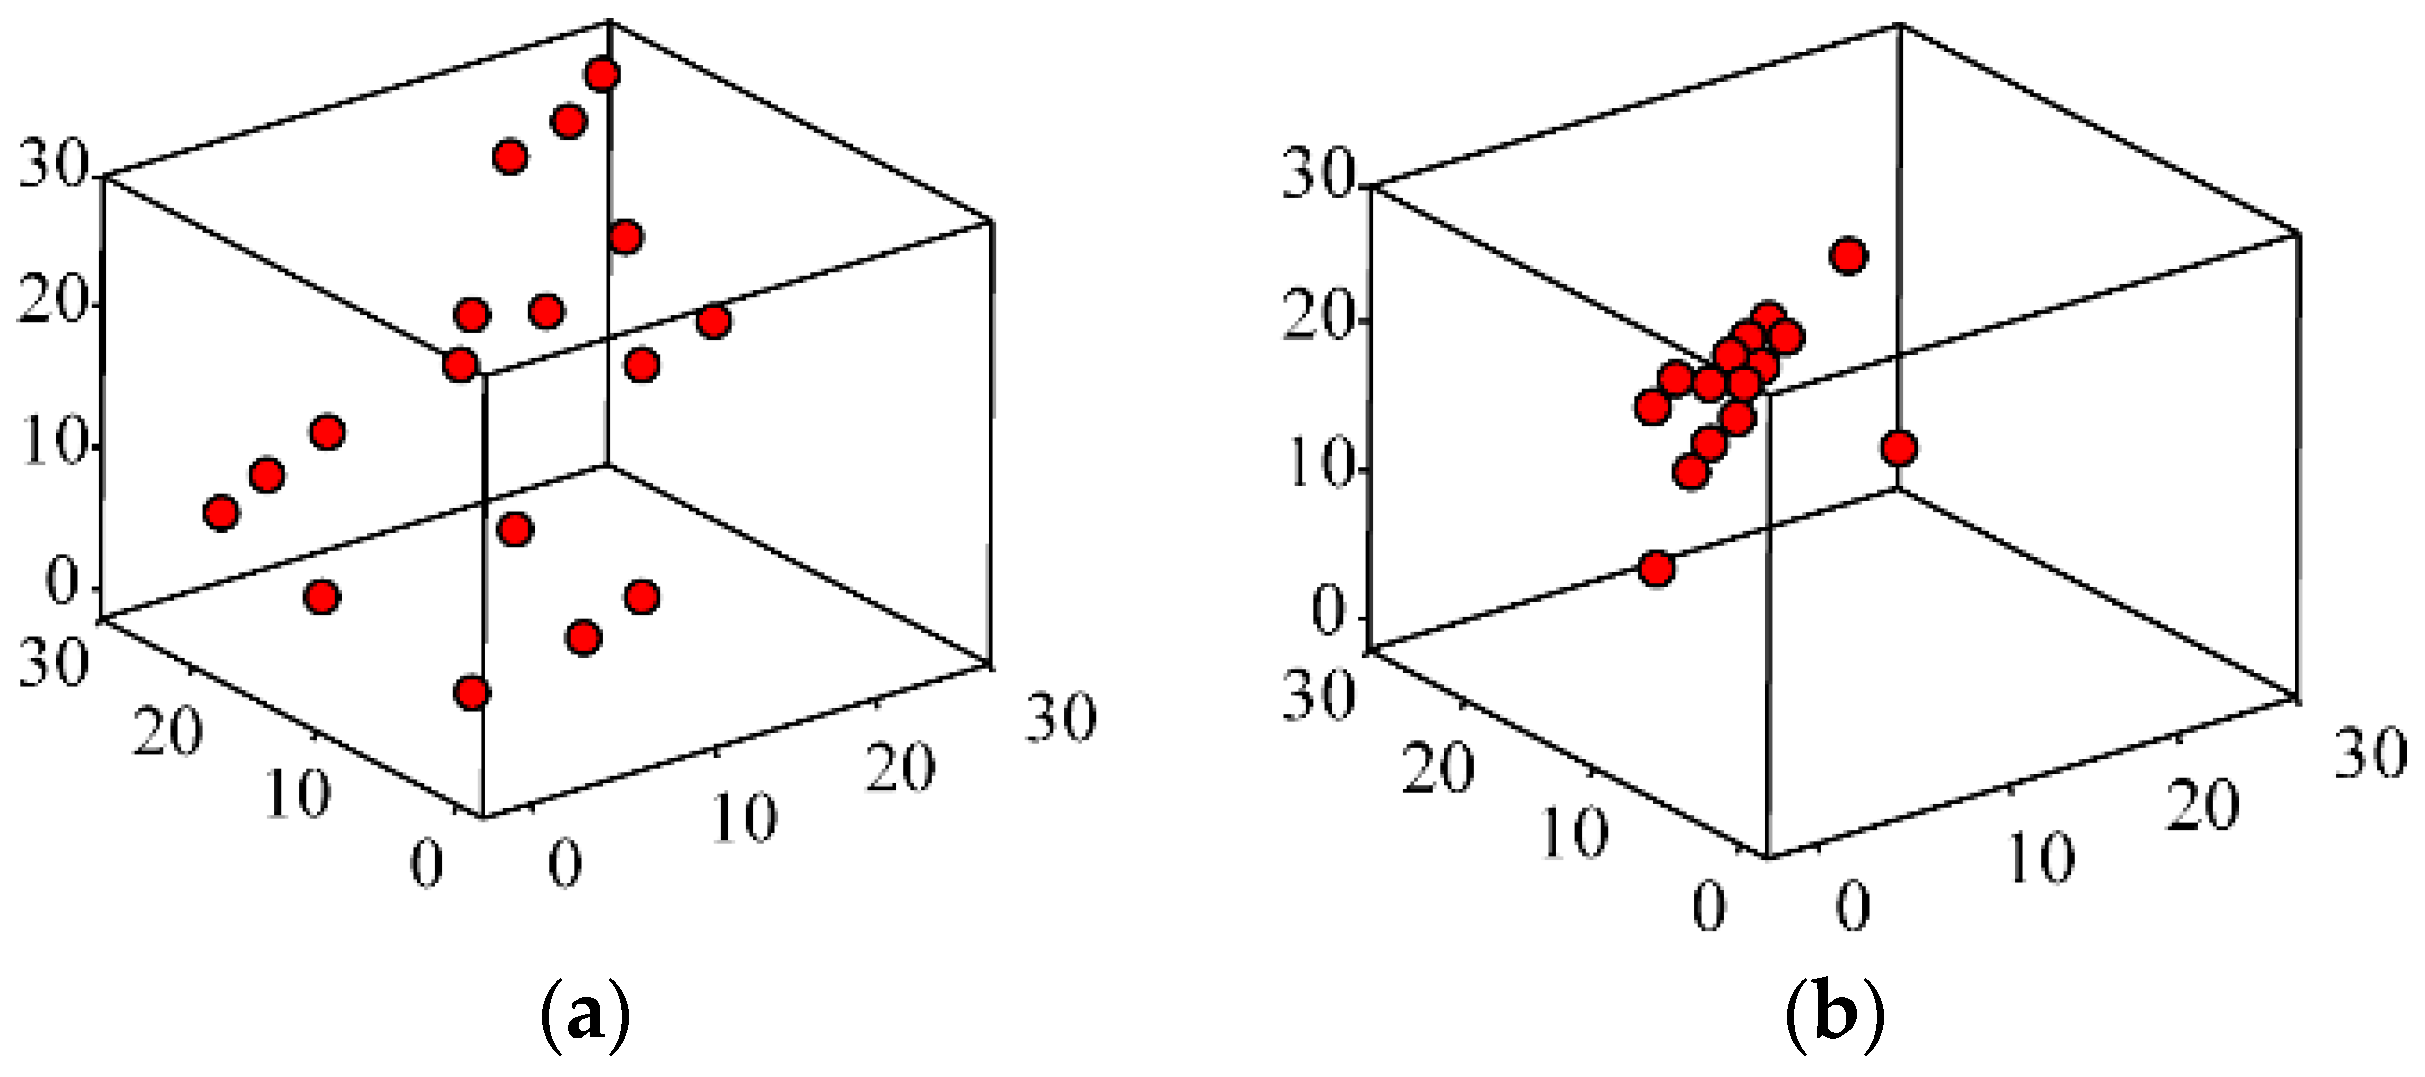
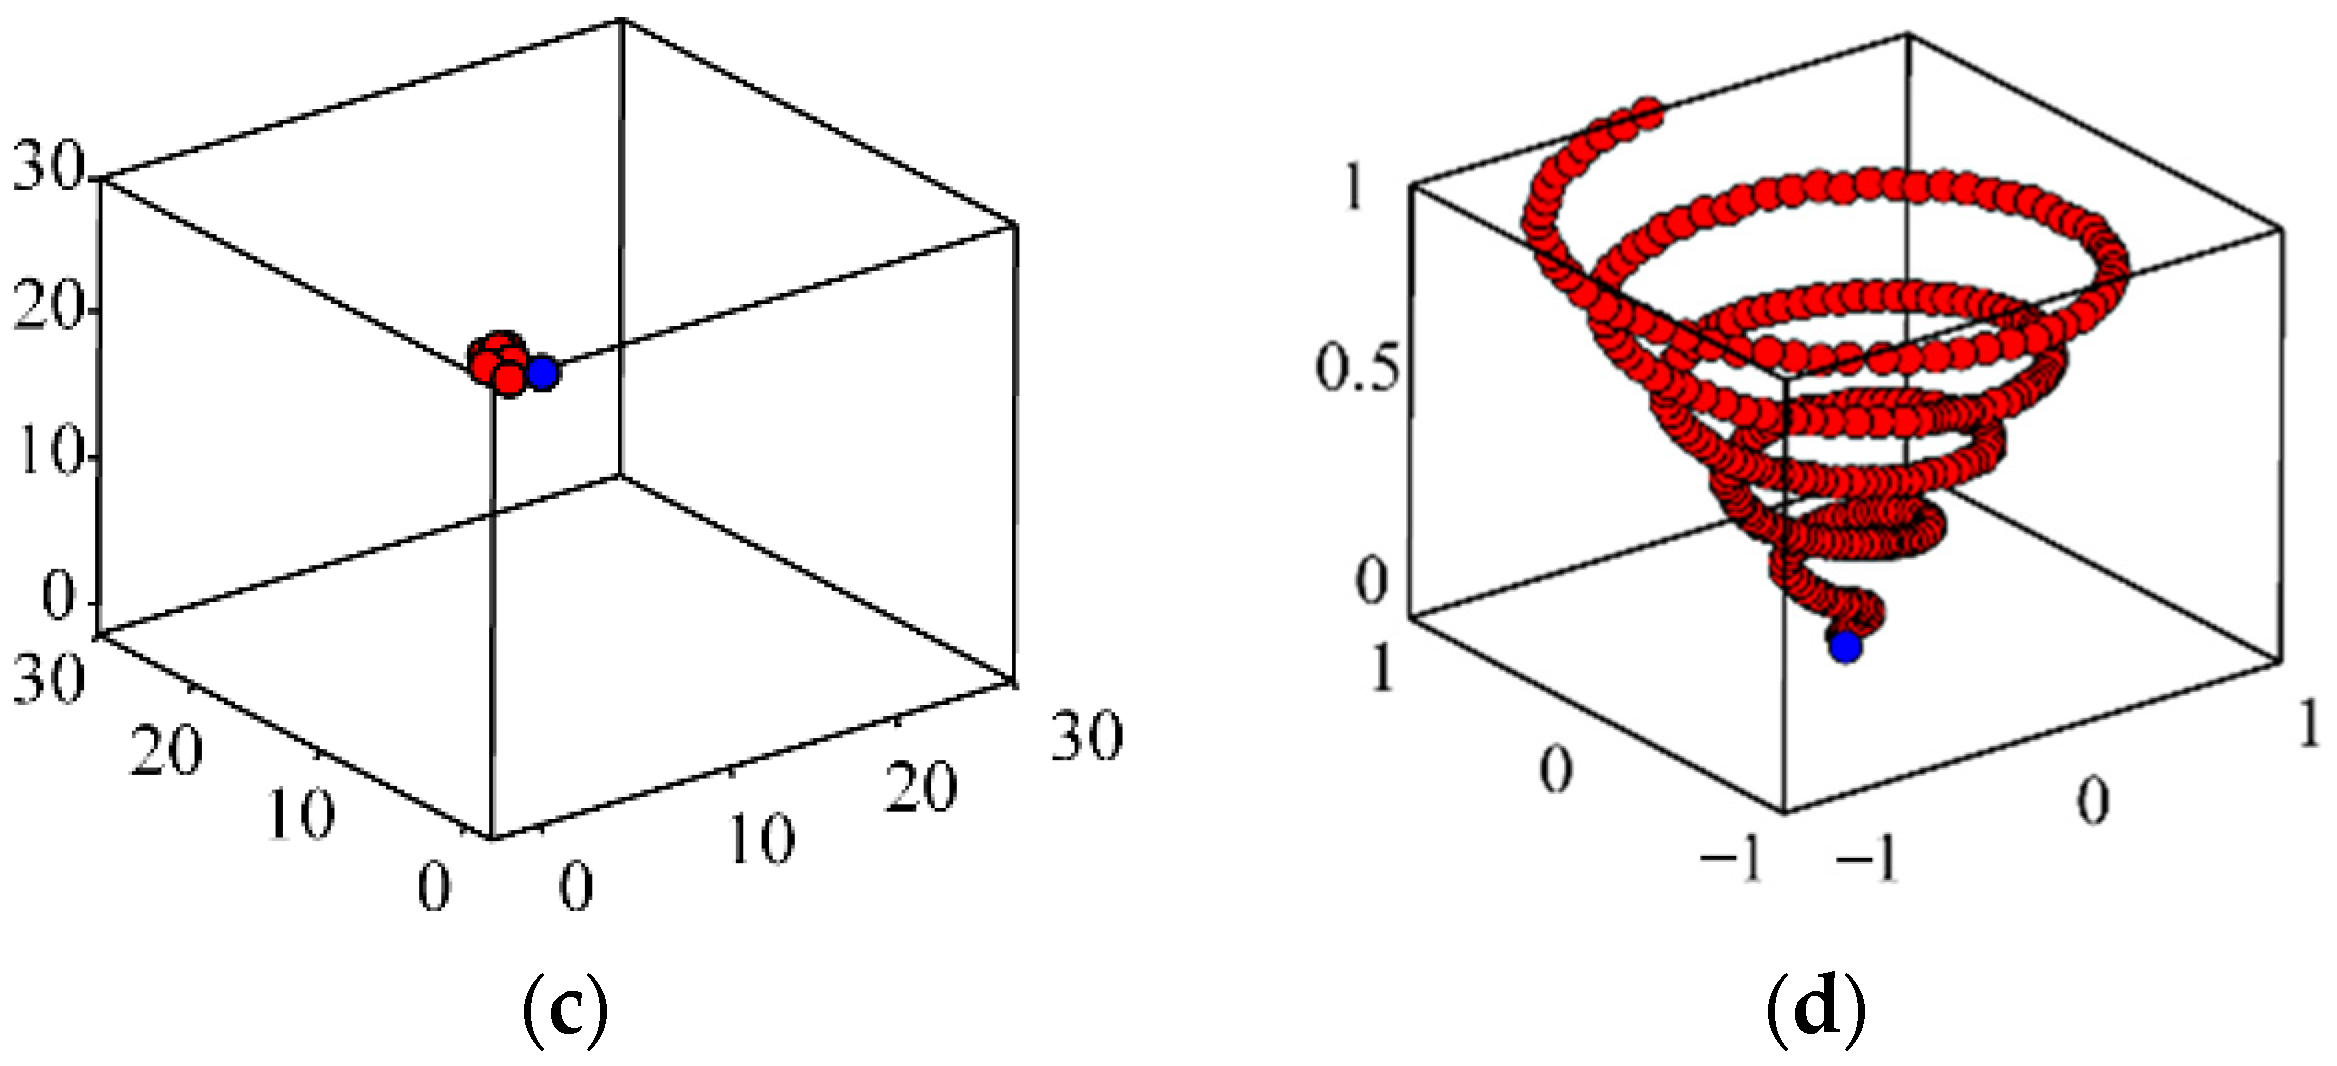
Figure 4.
The flow chart of optimization of LSTM based on SOA.
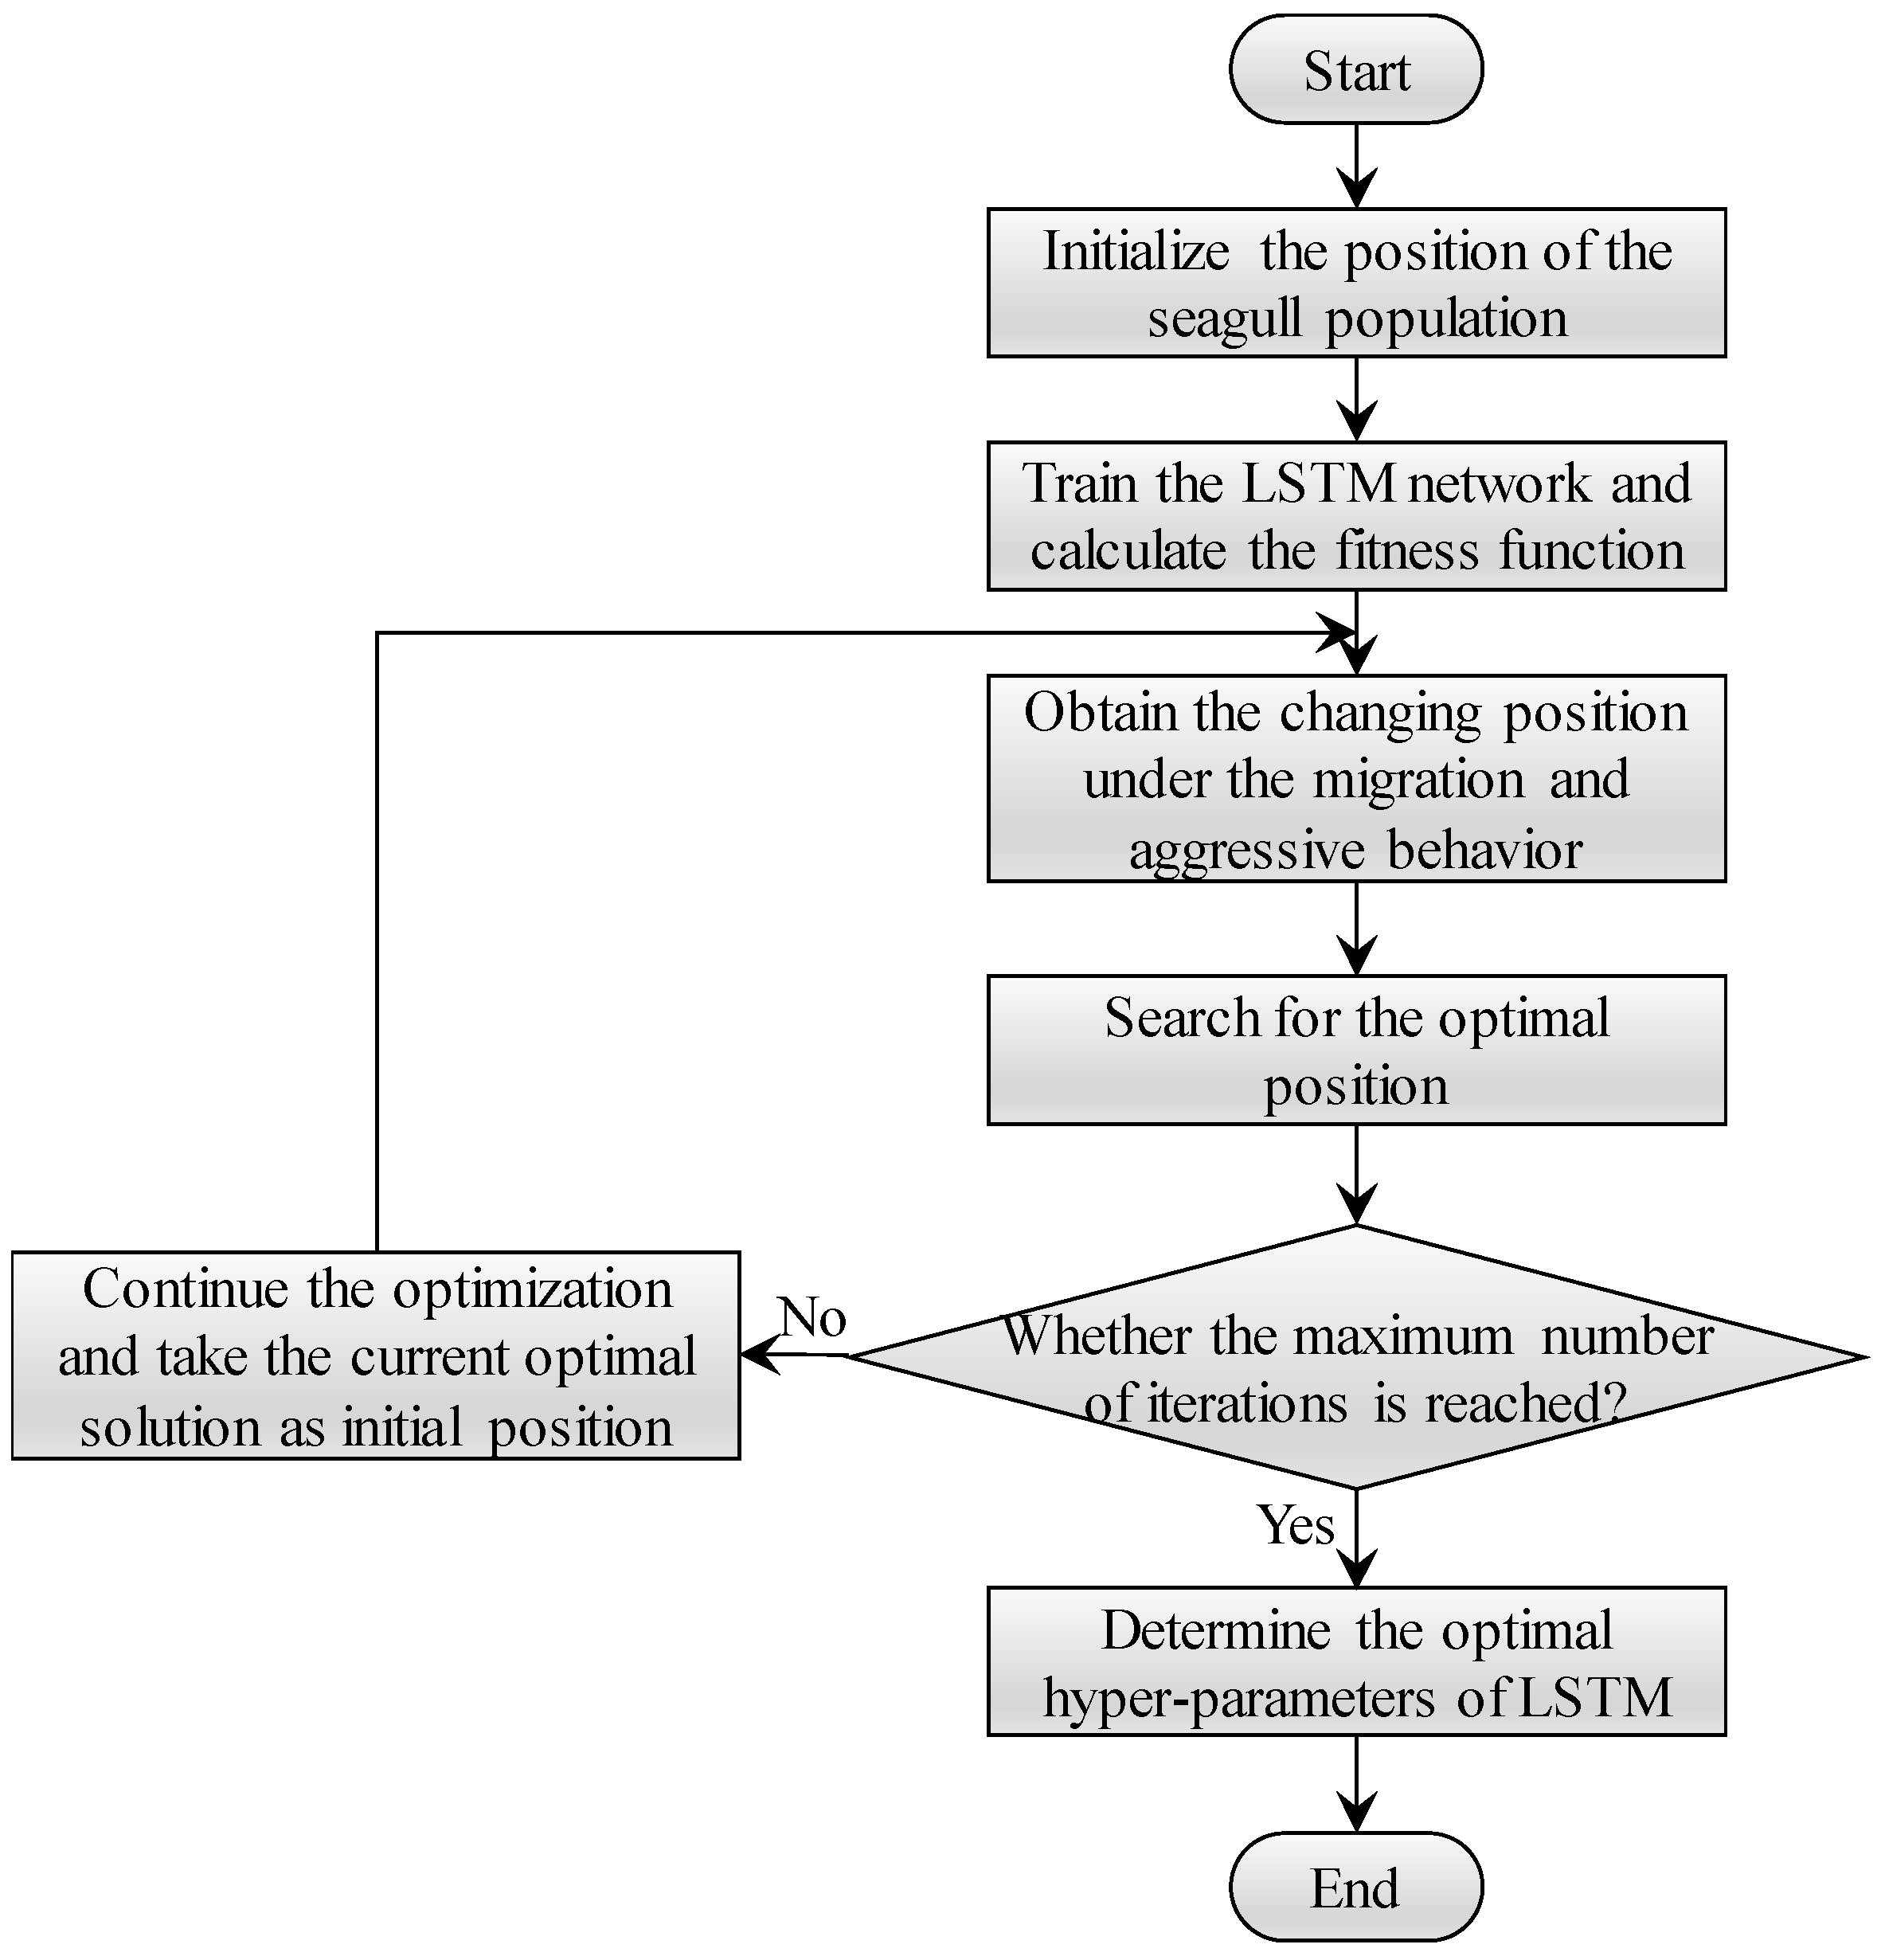
Figure 5.
The establishment process of SOA-LSTM-weighted Markov model.
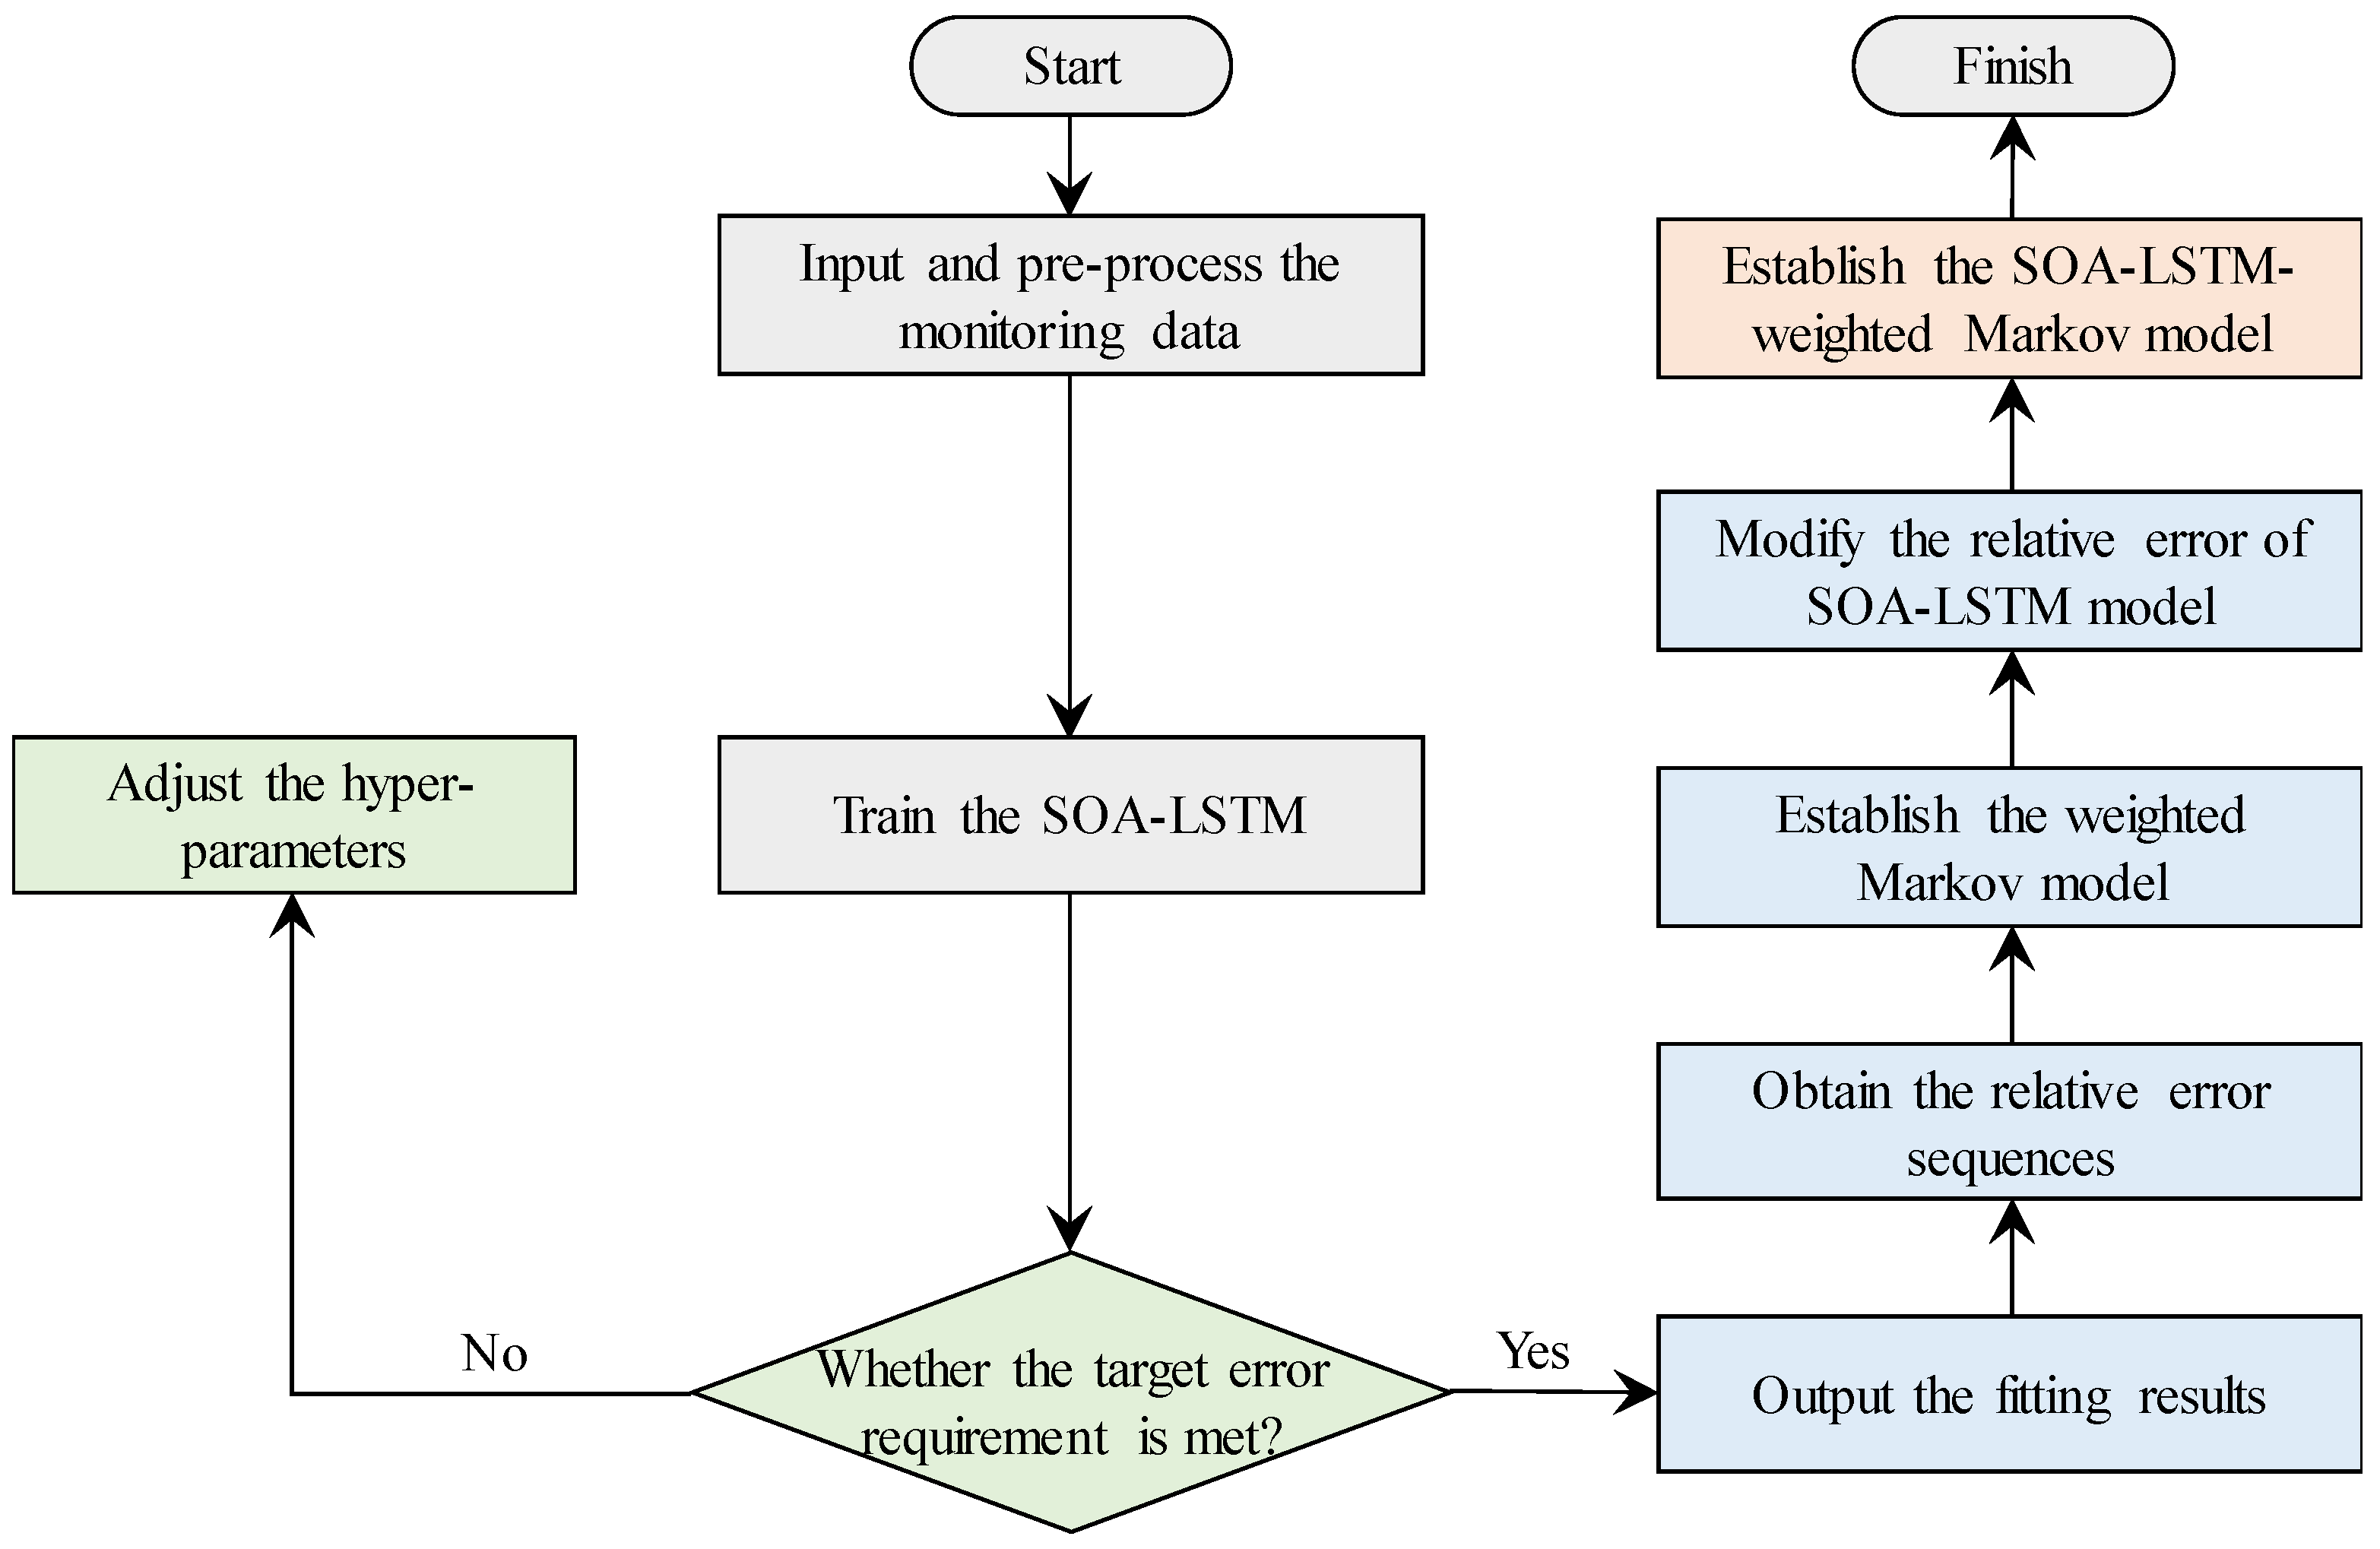
Figure 6.
(a) Engineering scene of the regulating sluice with 12 holes at Bengbu sluice; (b) elevation map of the regulating sluice with 12 holes at Bengbu sluice; (c) layout of settlement monitoring points of the regulating sluice with 12 holes at Bengbu sluice.
Figure 6.
(a) Engineering scene of the regulating sluice with 12 holes at Bengbu sluice; (b) elevation map of the regulating sluice with 12 holes at Bengbu sluice; (c) layout of settlement monitoring points of the regulating sluice with 12 holes at Bengbu sluice.
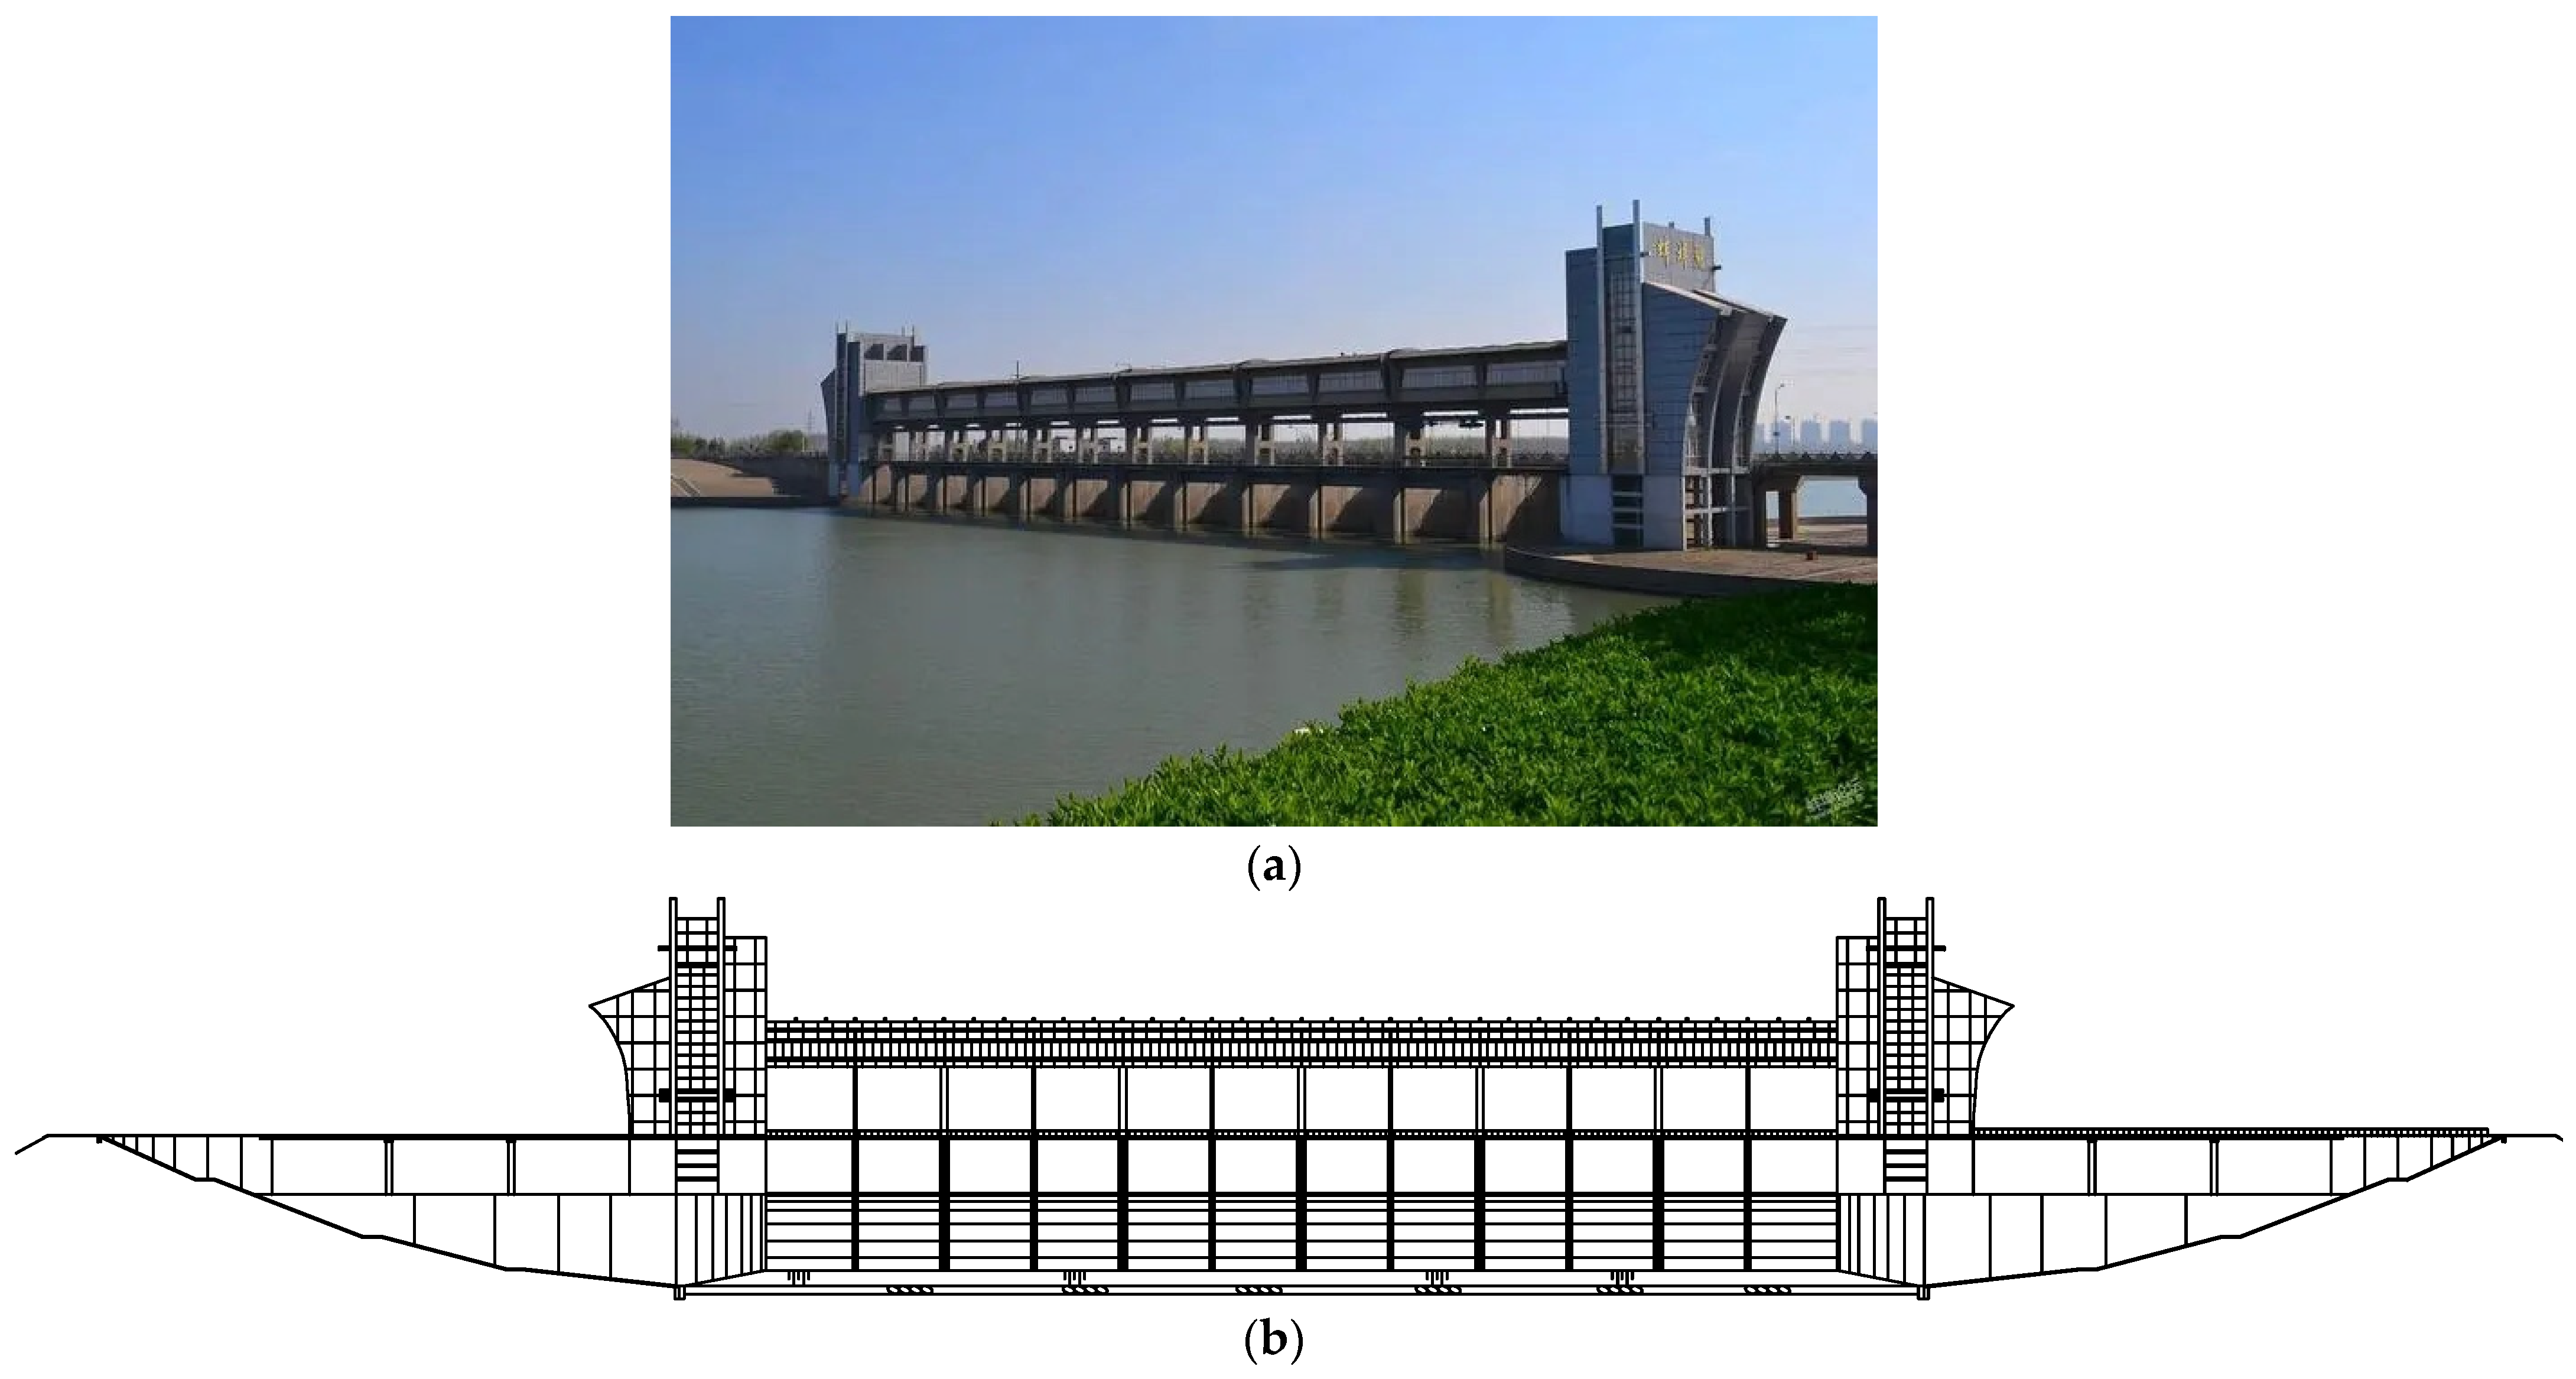
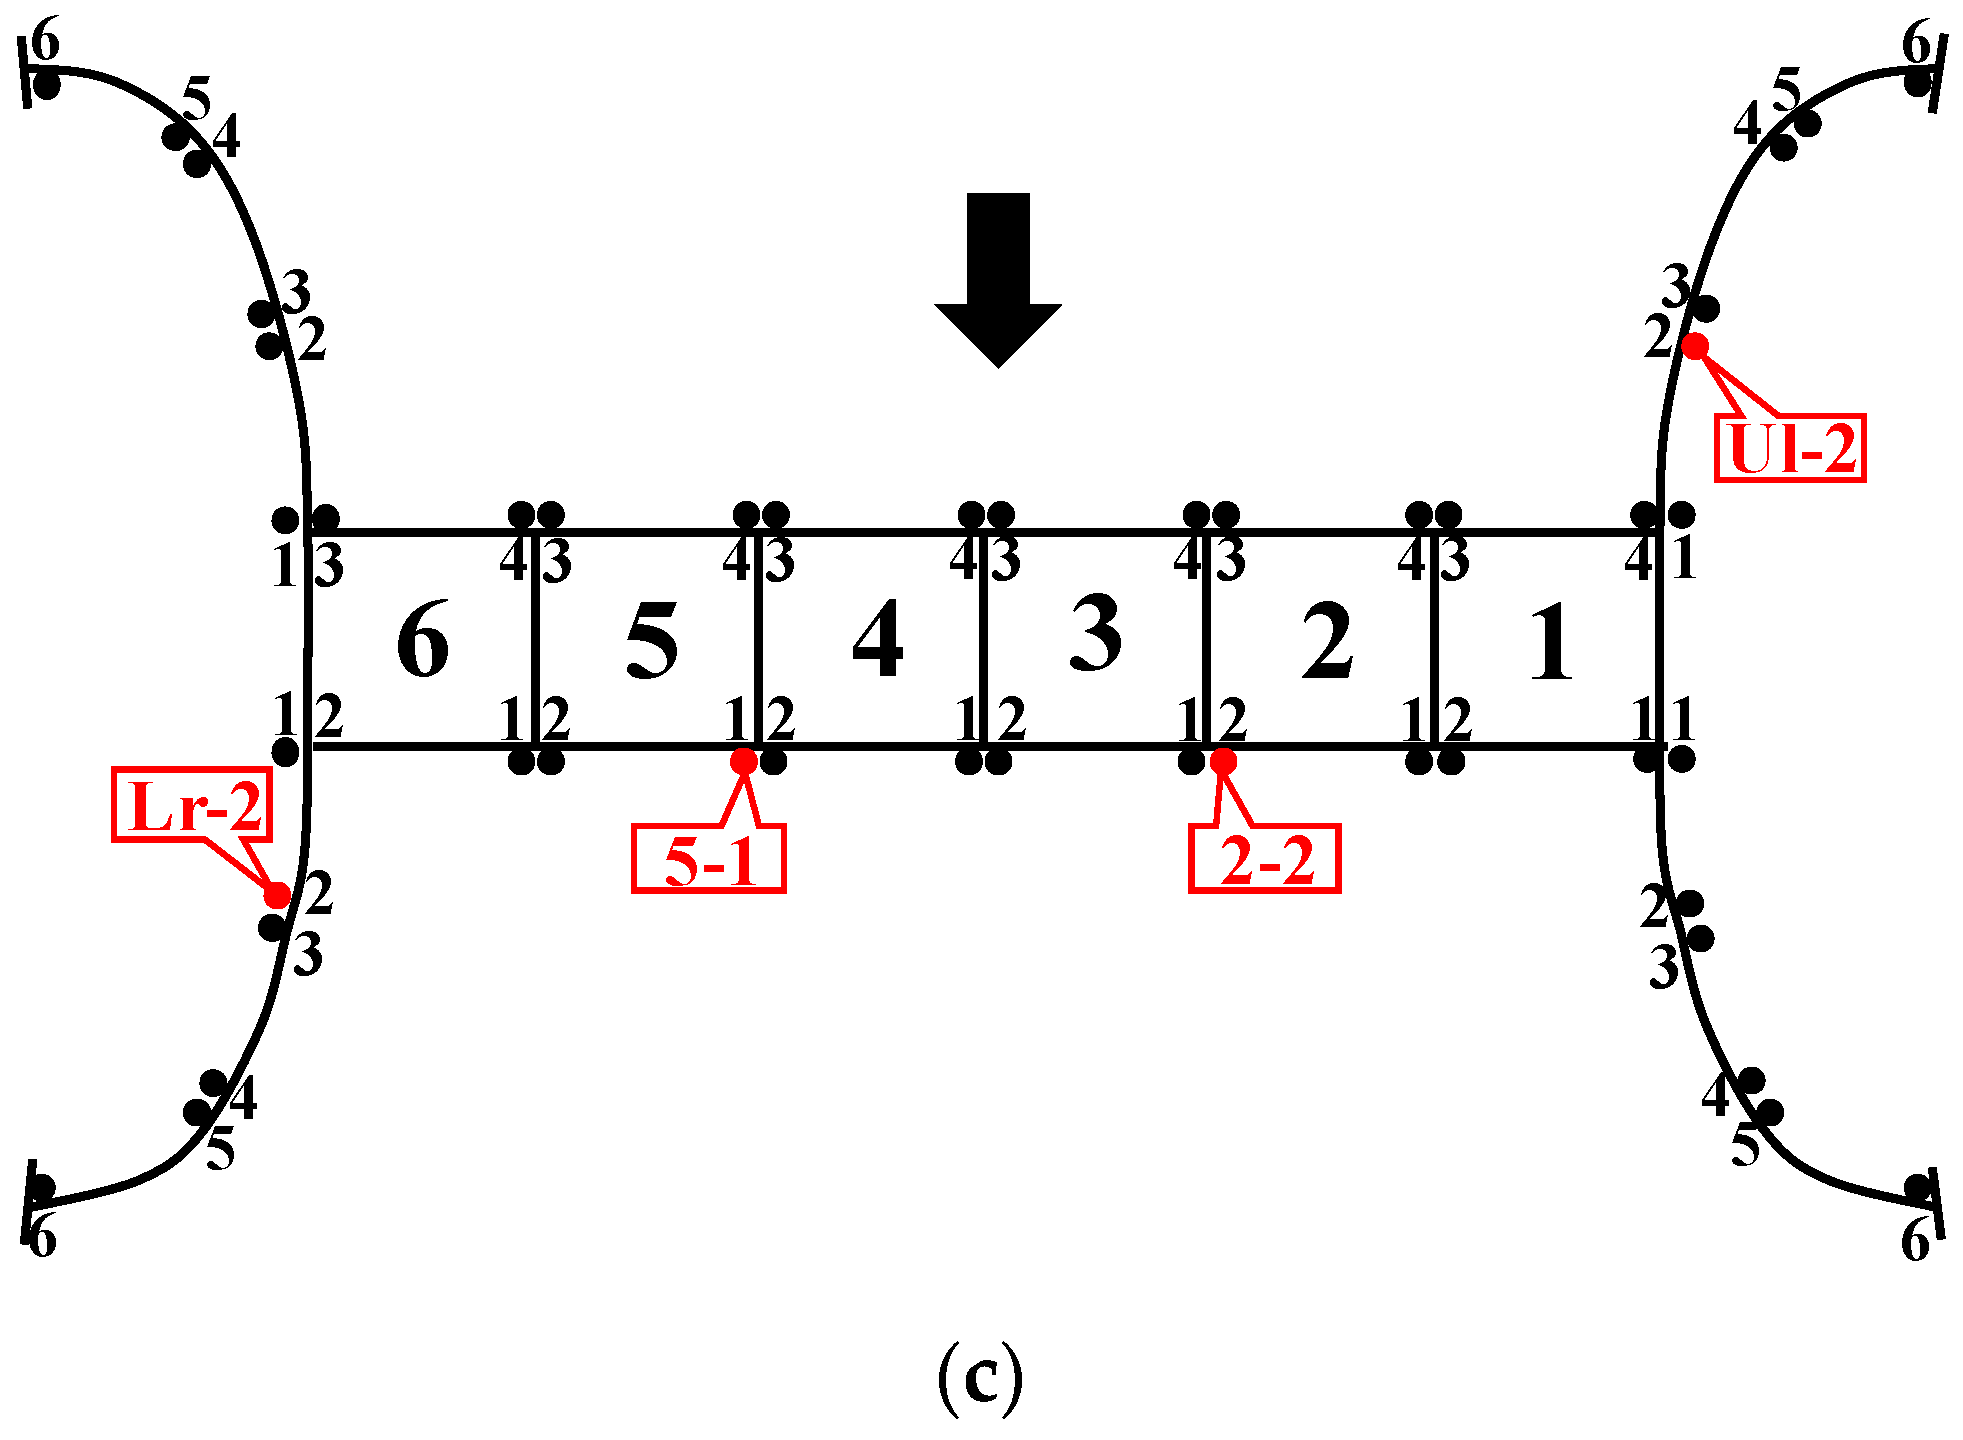
Figure 7.
Settlement measured data series of four selected monitoring points.
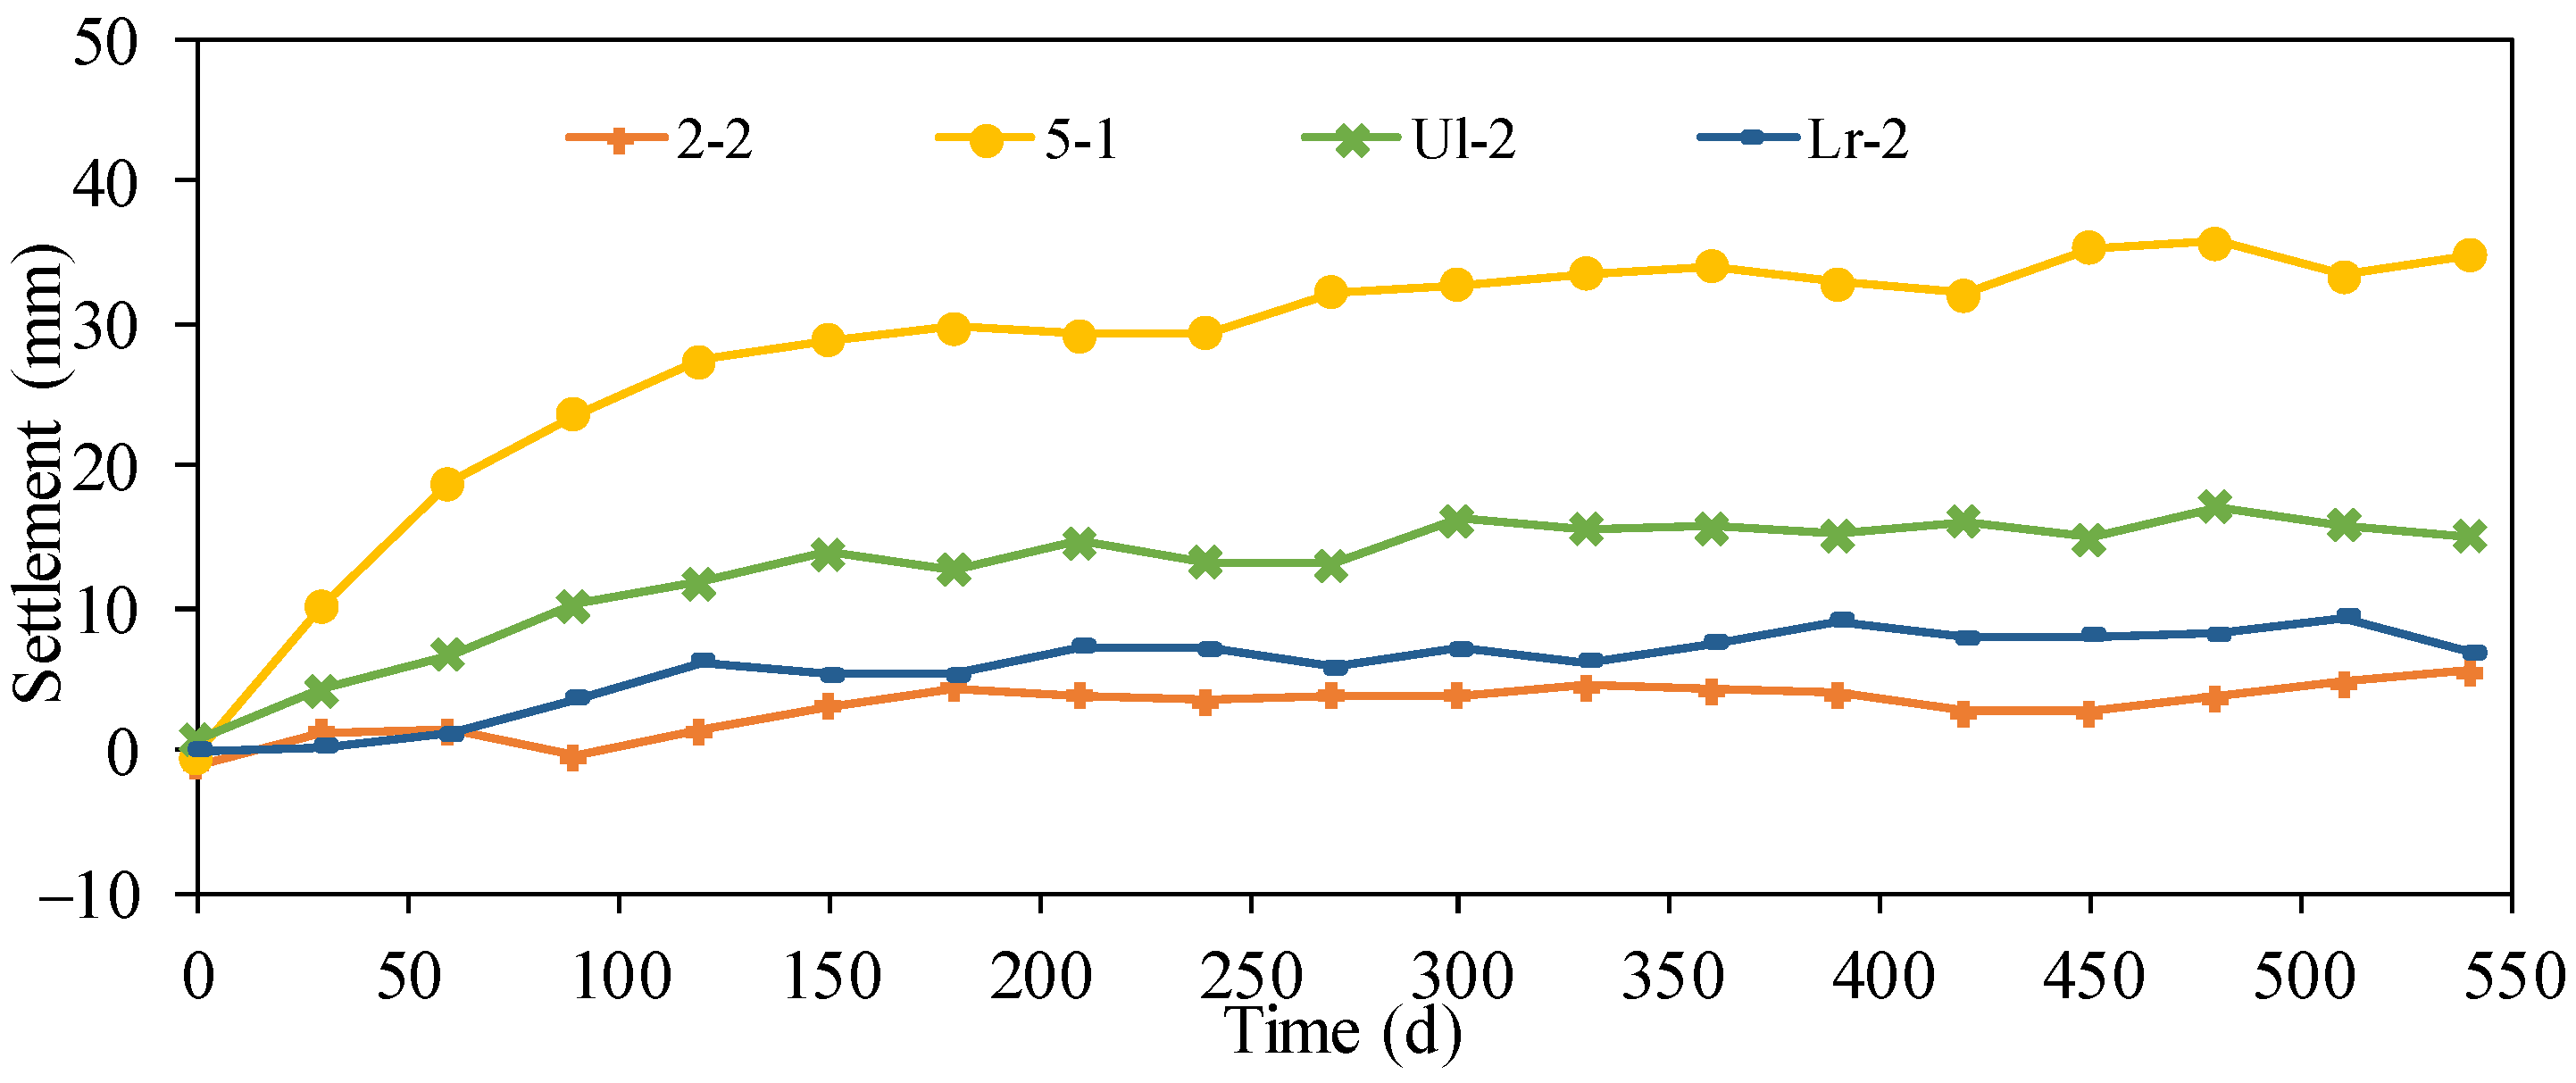
Figure 8.
Fitted and predicted values of the stepwise regression model.
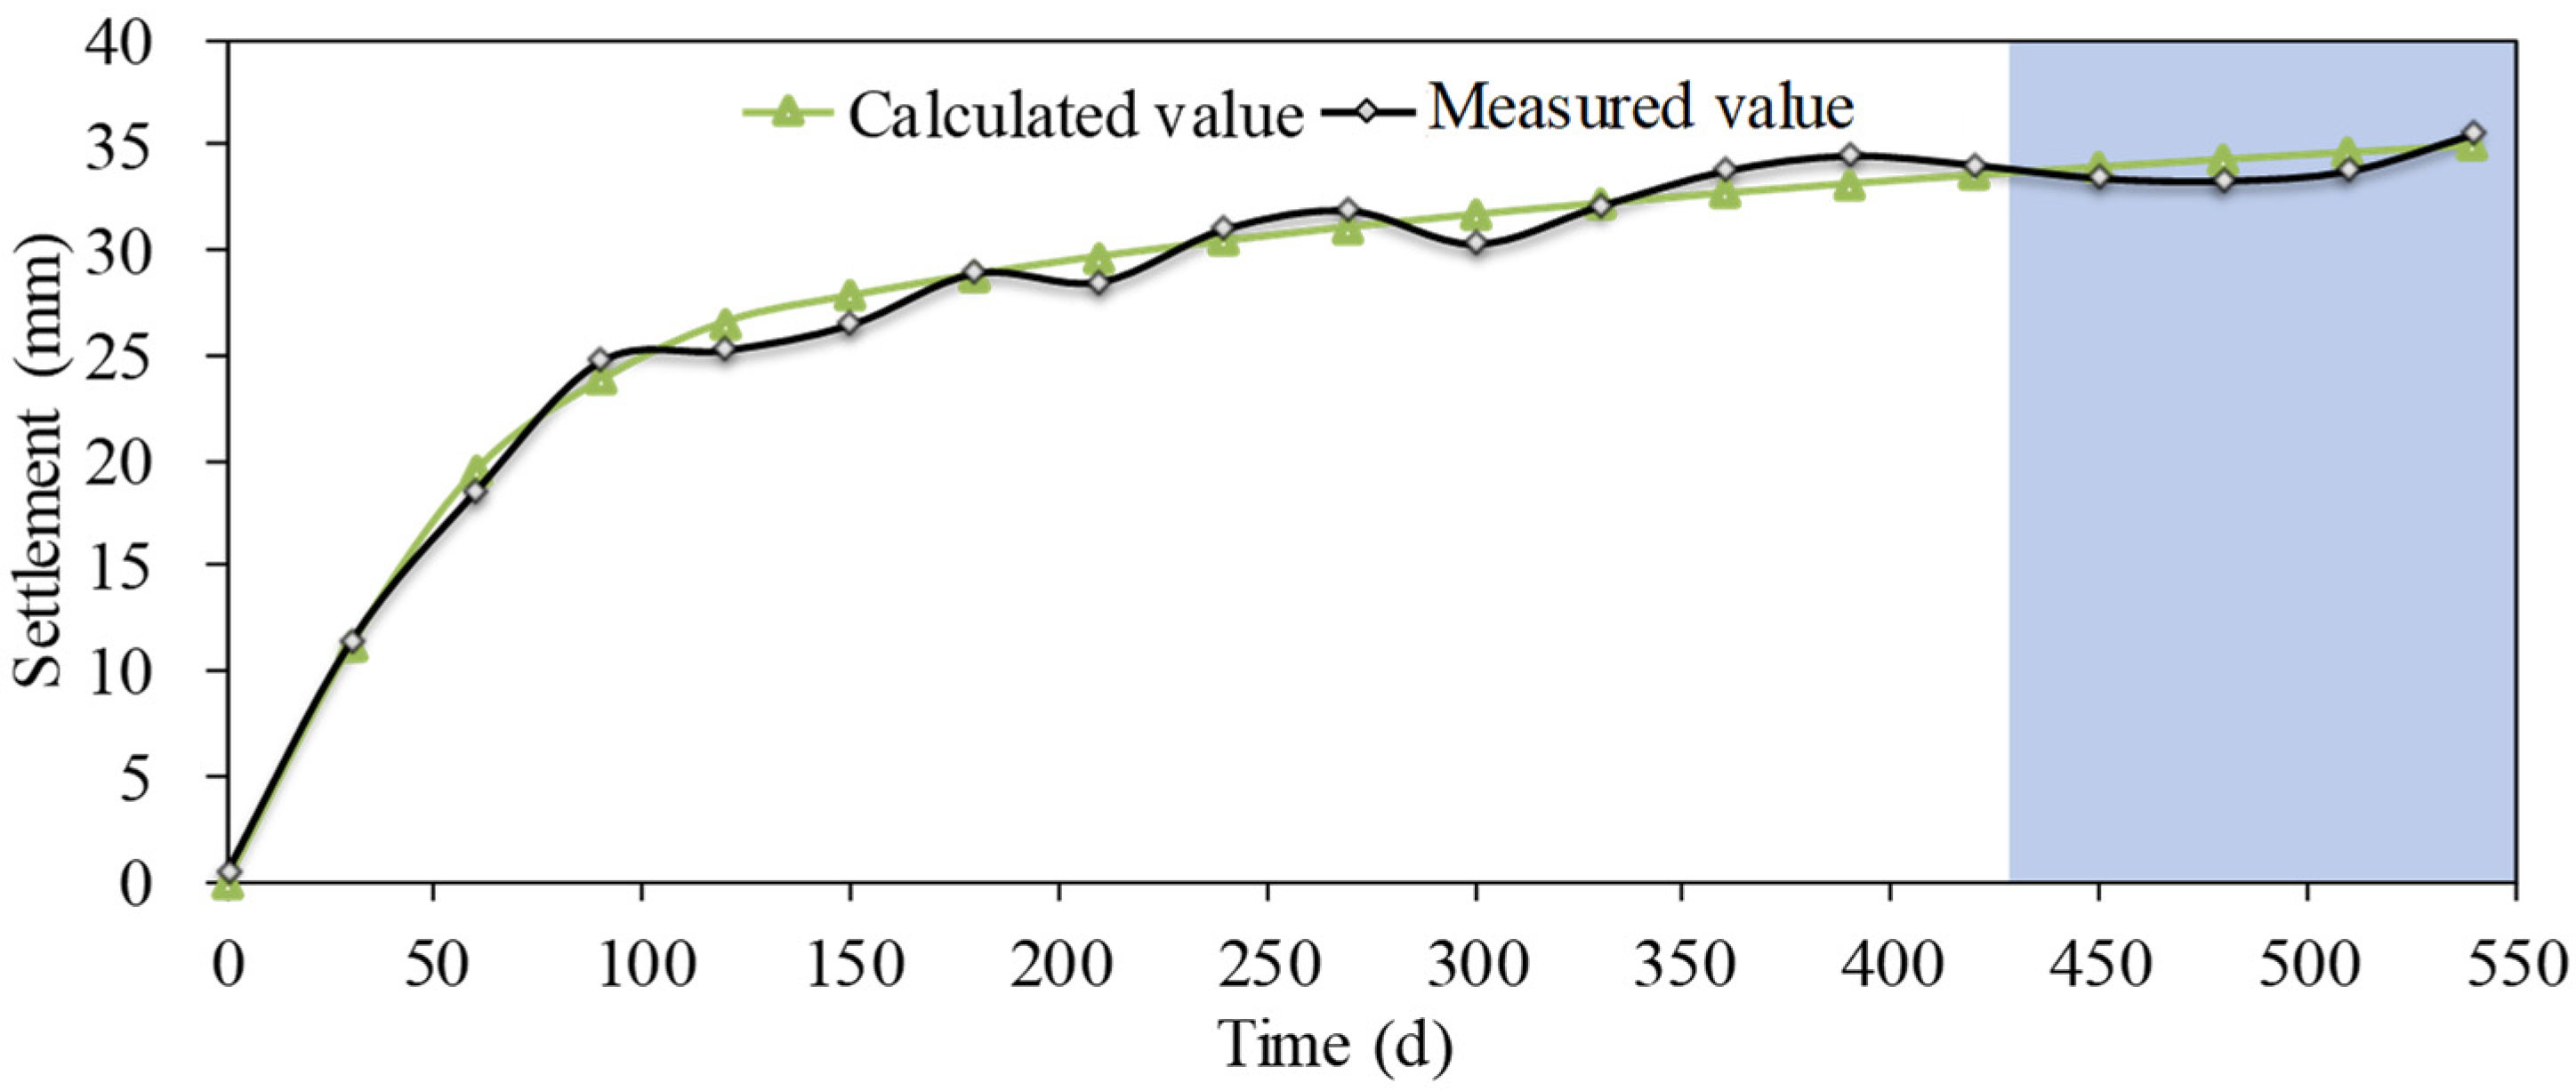
Figure 9.
Plot of the objective function values versus the number of iterations.
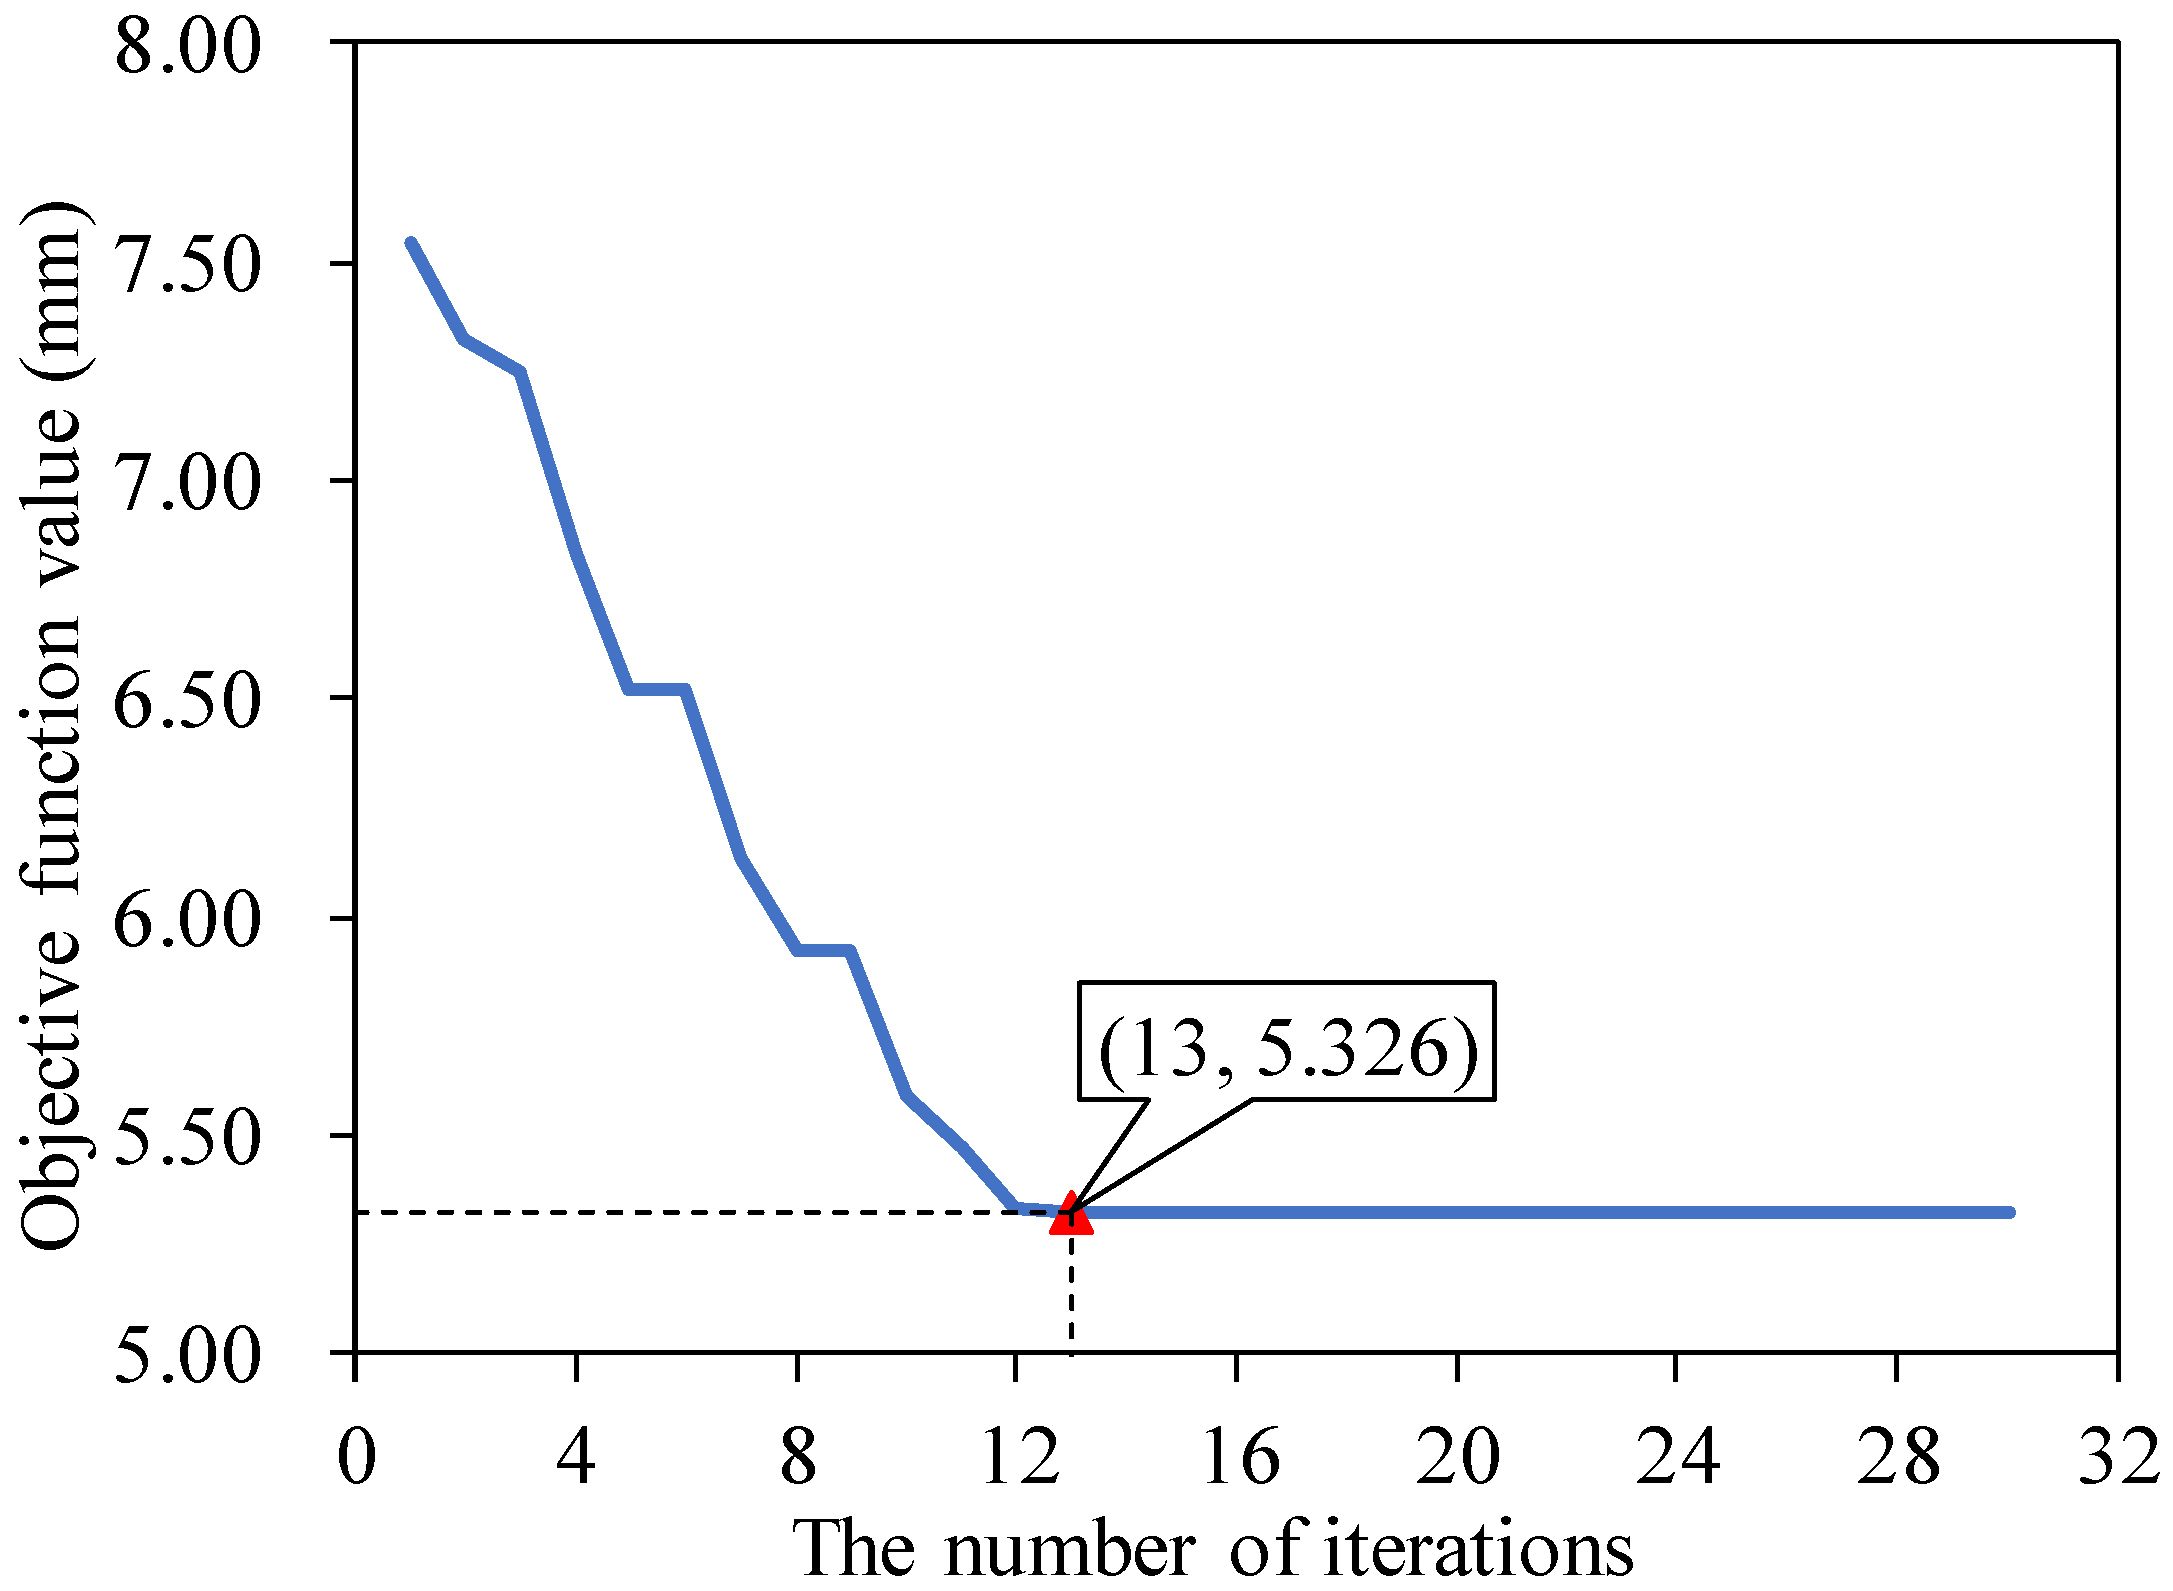
Figure 10.
The average relative error with the number of nodes in the hidden layer.
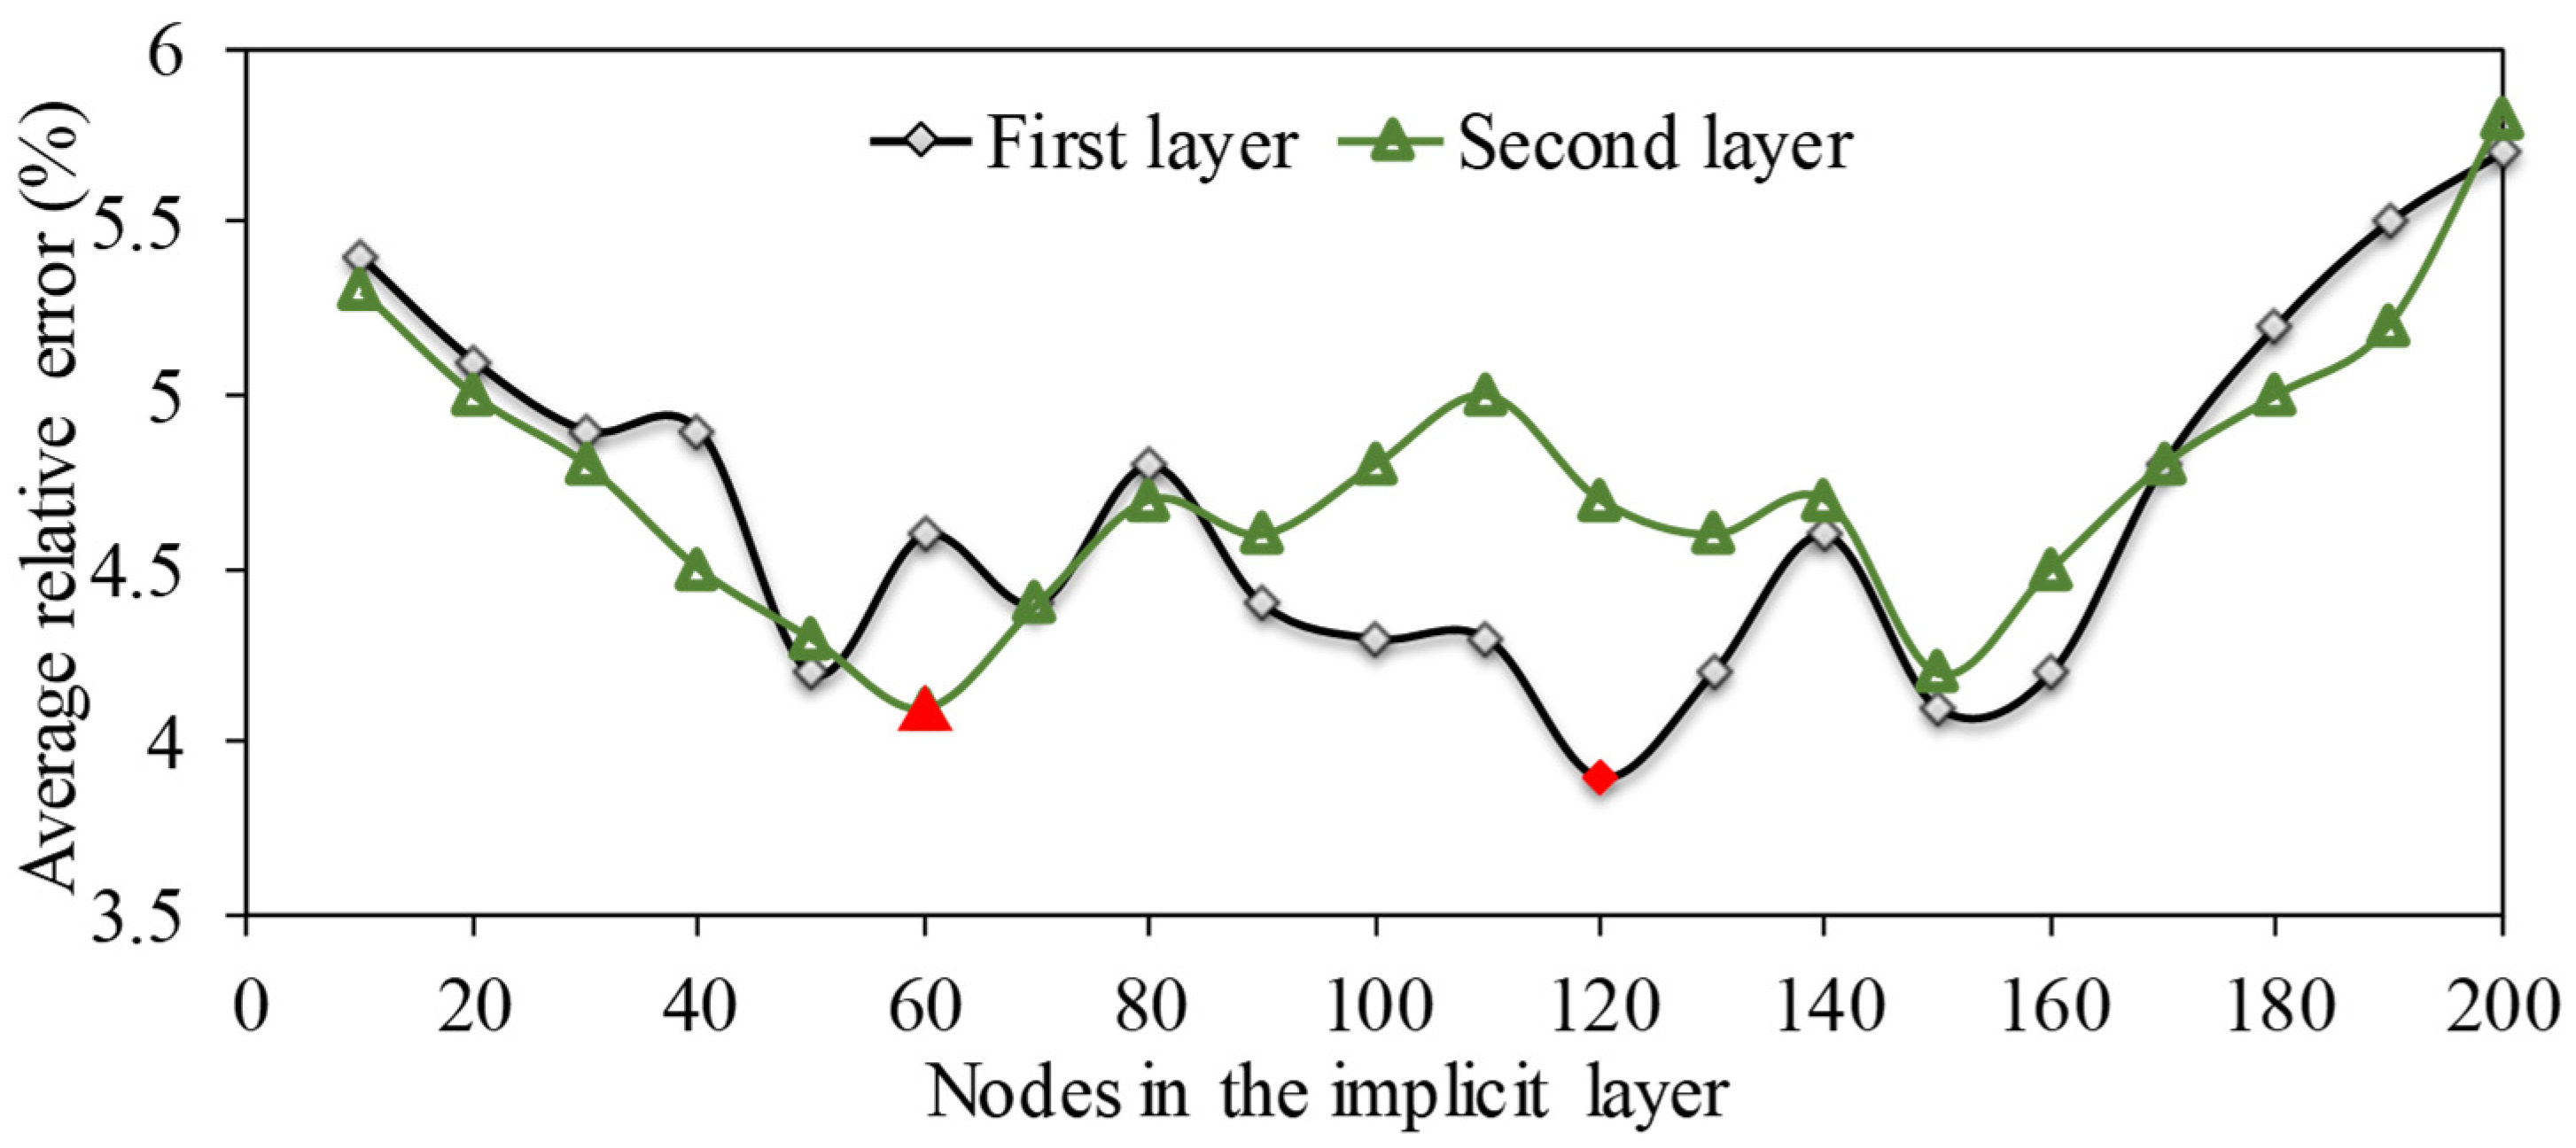
Figure 11.
Fitted and predicted values of the SOA-LSTM model.
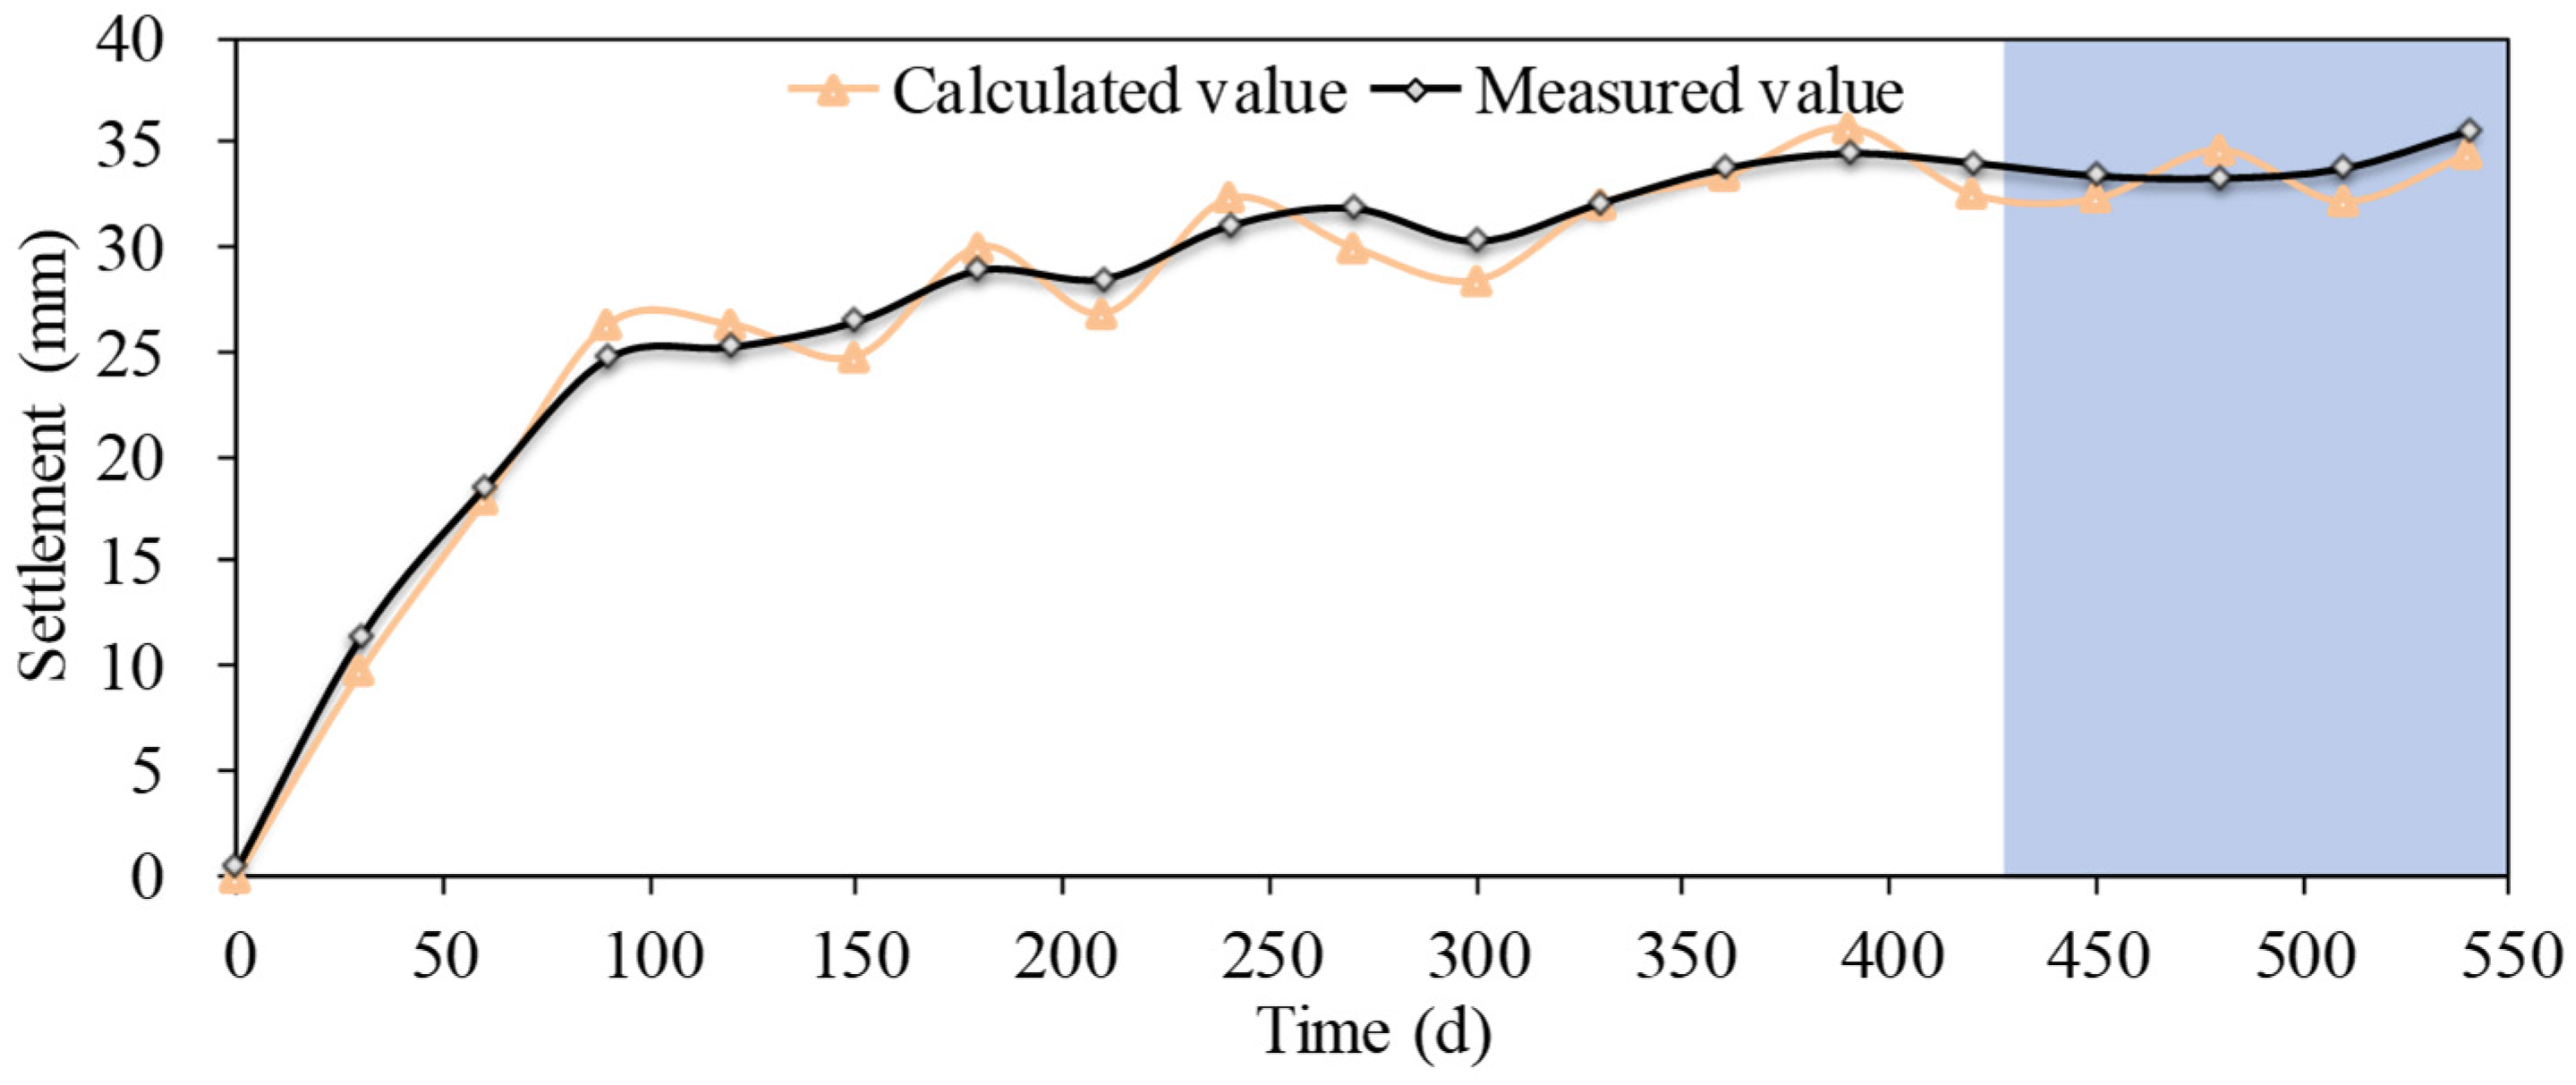
Figure 12.
Comparison of the fitted and predicted values of three models.

Figure 13.
Some of the absolute relative errors of three models.
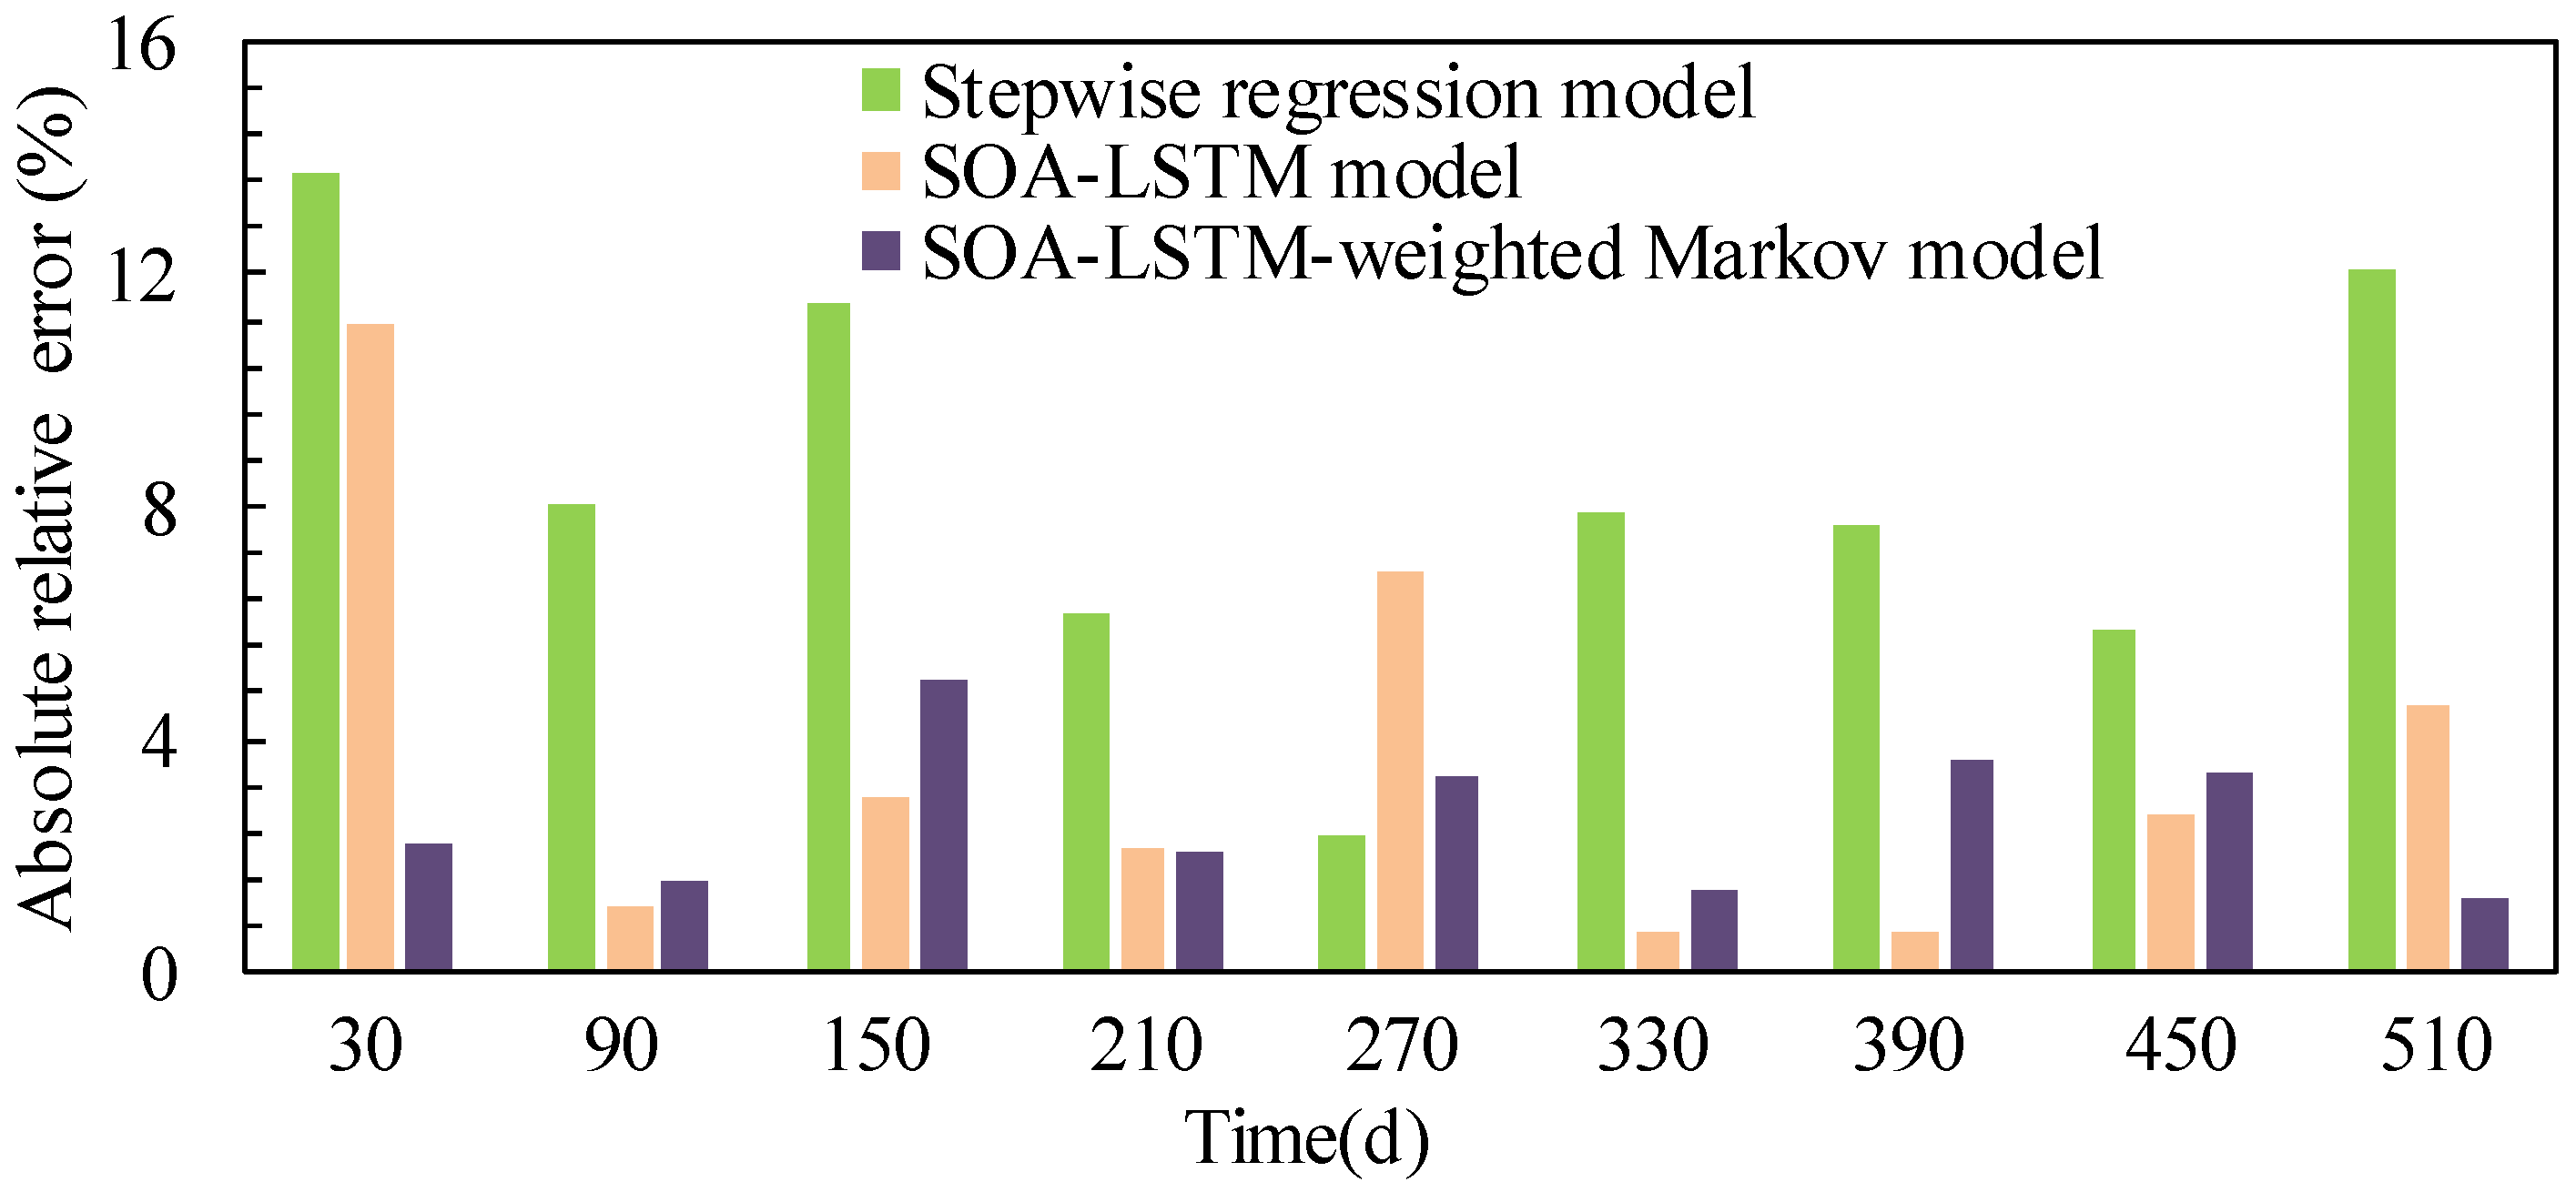
Figure 14.
Comparison results of the fitting and prediction results of different models based on measured data of four monitoring points.
Figure 14.
Comparison results of the fitting and prediction results of different models based on measured data of four monitoring points.
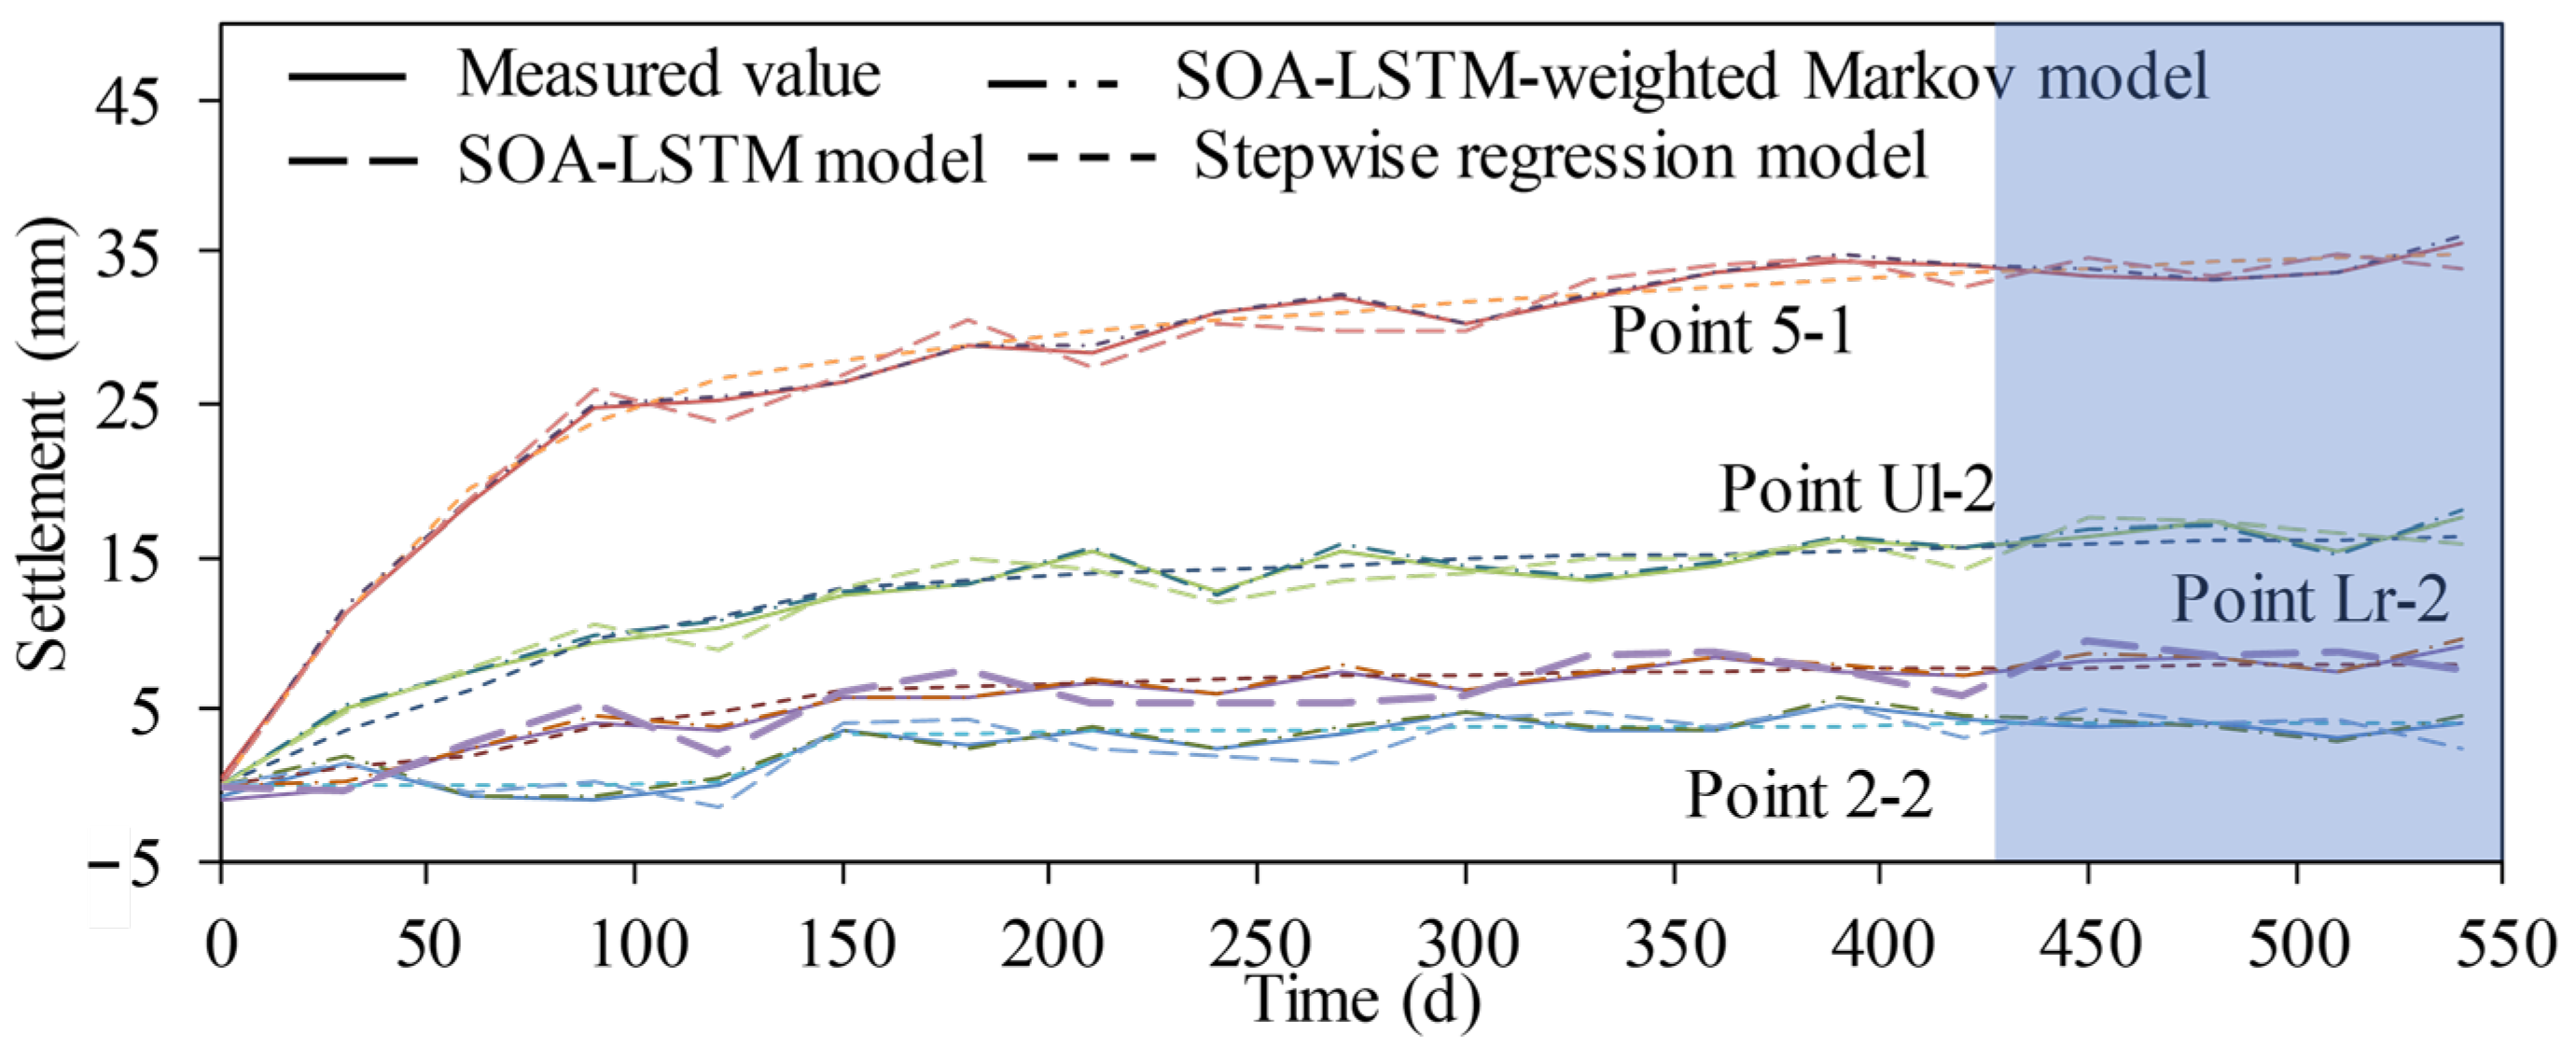
Figure 15.
R2 and RMSE of different prediction models.

Table 1.
The settlement eigenvalues of the regulating sluice with 12 holes.
| Project Site | Maximum Average Variation (mm) | Minimum Settlement (mm) | Maximum Settlement (mm) | Maximum Settlement Variation (mm) | ||
|---|---|---|---|---|---|---|
| Point | Settlement | Point | Settlement | |||
| Upper left-wing wall | −14.99 | Ul-6 | −12.71 | Ul-2 | −16.33 | 3.62 |
| Lower left-wing wall | −14.95 | Ll-6 | −9.80 | Ll-4 | −17.82 | 8.02 |
| Upper right-wing Wall | −16.80 | Ur-1 | −14.14 | Ur-2 | −18.37 | 4.23 |
| Lower right-wing wall | −18.11 | Lr-2 | −8.03 | Lr-5 | −28.71 | 20.68 |
| Upper sluice pier | −13.52 | 1-3 | −0.21 | 3-4 | −31.80 | 31.59 |
| Lower sluice pier | −14.30 | 2-2 | −4.19 | 5-1 | −35.75 | 31.56 |
| Abutment pier | −8.45 | Right pier | −7.59 | Left pier | −9.32 | 1.73 |
Note: In the table, “−” means the sinking settlement.
Table 2.
Settlement monitoring data of monitoring point 5-1.
| Time (d) | Monitoring Data (mm) | Time (d) | Monitoring Data (mm) | Time (d) | Monitoring Data (mm) |
|---|---|---|---|---|---|
| 0 | 1.43 | 210 | 29.14 | 420 | 34.71 |
| 30 | 11.72 | 240 | 30.83 | 450 | 33.20 |
| 60 | 17.74 | 270 | 29.32 | 480 | 33.43 |
| 90 | 23.85 | 300 | 29.72 | 510 | 36.25 |
| 120 | 26.79 | 330 | 32.21 | 540 | 35.75 |
| 150 | 28.95 | 360 | 34.41 | ||
| 180 | 28.56 | 390 | 33.06 |
Table 3.
The fitted and predicted values of the stepwise regression model.
| Time (d) | Monitoring Data | Predicted Value (mm) | Relative Error (%) | Time | Monitoring Data | Predicted Value (mm) | Relative Error (%) |
|---|---|---|---|---|---|---|---|
| 0 | 1.43 | 1.431 | 0 | 300 | 29.72 | 29.17 | −1.85 |
| 30 | 11.72 | 10.87 | −7.23 | 330 | 32.21 | 29.66 | −7.91 |
| 60 | 17.74 | 17.99 | 1.46 | 360 | 34.41 | 30.10 | −12.53 |
| 90 | 23.85 | 21.93 | −8.01 | 390 | 33.06 | 30.51 | −7.69 |
| 120 | 26.79 | 24.48 | −8.61 | 420 | 34.71 | 30.89 | −11.00 |
| 150 | 28.95 | 25.63 | −11.48 | 450 | 33.20 | 31.24 | −5.89 |
| 180 | 28.56 | 26.56 | −7.02 | 480 | 33.43 | 31.57 | −5.56 |
| 210 | 29.14 | 27.35 | −6.16 | 510 | 36.25 | 31.88 | −12.04 |
| 240 | 30.83 | 28.03 | −9.09 | 540 | 35.75 | 32.18 | −10.01 |
| 270 | 29.32 | 28.63 | −2.33 |
Table 4.
Upper bound and lower bound of the parameters set in SOA, and the optimized results of the LSTM model.
Table 4.
Upper bound and lower bound of the parameters set in SOA, and the optimized results of the LSTM model.
| Time (d) | Hidden Layers | Nodes in First Layer | Nodes in Second Layer | Learning Rate |
|---|---|---|---|---|
| Upper bound | 10 | 200 | 200 | 0.1 |
| Lower bound | 1 | 10 | 10 | 0.001 |
| Optimized parameters | 2 | 120 | 60 | 0.005 |
Table 5.
Calculation results of chi-square statistics.
| Status | Marginal Probability | Total | |||||
|---|---|---|---|---|---|---|---|
| 1 | 0.127 | 10.768 | 5.410 | 1.94 | 0.961 | 0.000 | 19.079 |
| 2 | 0.158 | 0.575 | 0.062 | 2.010 | 0.867 | 0.851 | 4.365 |
| 3 | 0.436 | 2.083 | 0.972 | 7.210 | 0.439 | 1.836 | 12.54 |
| 4 | 0.157 | 0.000 | 0.087 | 1.521 | 0.247 | 1.957 | 3.842 |
| 5 | 0.122 | 0.723 | 0.000 | 2.513 | 4.984 | 6.745 | 14.965 |
| Total | 1 | 14.149 | 6.531 | 15.194 | 7.498 | 11.389 | 54.761 |
Table 6.
Autocorrelation coefficients and transfer weights of each order.
| Project | Order | ||||
|---|---|---|---|---|---|
| 1 | 2 | 3 | 4 | 5 | |
| rk | 0.568 | 0.354 | 0.248 | 0.126 | 0.139 |
| wk | 0.416 | 0.245 | 0.168 | 0.081 | 0.105 |
Table 7.
Some state-weighted predictions of relative error for settlement of the monitoring point.
| Initial Time (d) | Status | Lag Time | Weights | Status | ||||
|---|---|---|---|---|---|---|---|---|
| 1 | 2 | 3 | 4 | 5 | ||||
| 60 | 3 | 1 | 0.4106 | 0.0771 | 0.1328 | 0.5587 | 0.1528 | 0.0759 |
| 120 | 3 | 2 | 0.2514 | 0.0979 | 0.1757 | 0.4892 | 0.1363 | 0.0978 |
| 180 | 3 | 3 | 0.1659 | 0.1000 | 0.2000 | 0.4785 | 0.1000 | 0.1207 |
| 240 | 4 | 4 | 0.0824 | 0.1581 | 0.0000 | 0.6296 | 0.1043 | 0.1062 |
| 300 | 5 | 5 | 0.1021 | 0.0657 | 0.0657 | 0.4000 | 0.2678 | 0.1985 |
| Pj (Weighted sum) | 0.0922 | 0.1315 | 0.5249 | 0.0901 | 0.1447 | |||
Disclaimer/Publisher’s Note: The statements, opinions and data contained in all publications are solely those of the individual author(s) and contributor(s) and not of MDPI and/or the editor(s). MDPI and/or the editor(s) disclaim responsibility for any injury to people or property resulting from any ideas, methods, instructions or products referred to in the content. |
© 2023 by the authors. Licensee MDPI, Basel, Switzerland. This article is an open access article distributed under the terms and conditions of the Creative Commons Attribution (CC BY) license (https://creativecommons.org/licenses/by/4.0/).
Share and Cite
MDPI and ACS Style
Peng, J.; Xie, W.; Wu, Y.; Sun, X.; Zhang, C.; Gu, H.; Zhu, M.; Zheng, S. Prediction for the Sluice Deformation Based on SOA-LSTM-Weighted Markov Model. Water 2023, 15, 3724. https://doi.org/10.3390/w15213724
AMA Style
Peng J, Xie W, Wu Y, Sun X, Zhang C, Gu H, Zhu M, Zheng S. Prediction for the Sluice Deformation Based on SOA-LSTM-Weighted Markov Model. Water. 2023; 15(21):3724. https://doi.org/10.3390/w15213724
Chicago/Turabian StylePeng, Jianhe, Wei Xie, Yan Wu, Xiaoran Sun, Chunlin Zhang, Hao Gu, Mingyuan Zhu, and Sen Zheng. 2023. "Prediction for the Sluice Deformation Based on SOA-LSTM-Weighted Markov Model" Water 15, no. 21: 3724. https://doi.org/10.3390/w15213724
Note that from the first issue of 2016, this journal uses article numbers instead of page numbers. See further details here.