
Landscape Ecological Risk Assessment and Driving Force Analysis of the Heihe River Basin in the Zhangye Area of China
1
School of Architecture and Urban Planning, Lanzhou Jiaotong University, Lanzhou 730070, China
2
Faculty of Geomatics, Lanzhou Jiaotong University, Lanzhou 730070, China
*
Author to whom correspondence should be addressed.
Water 2023, 15(20), 3588; https://doi.org/10.3390/w15203588
Submission received: 4 September 2023
/
Revised: 9 October 2023
/
Accepted: 12 October 2023
/
Published: 13 October 2023
(This article belongs to the Special Issue Assessment of Watershed Ecosystem Services under Climate Change and Urbanization)
Abstract
:Watershed ecosystems are crucial to the overall sustainable development of a region, and a scientific and effective grasp of the characteristics of land-use change in a watershed, and the factors affecting land change, is an important prerequisite for the high-quality construction of watershed ecology, which needs to be emphasized. As the second largest inland river in the arid zone of Western China, the Heihe River Basin (HRB) has been affected by human and natural factors in recent years, and the ecological environment is relatively fragile, and there is an urgent need to analyze the ecological characteristics of the basin and to explore the relevant influencing factors in order to provide a basis for subsequent ecological management. Therefore, this article applies the landscape index, the landscape ecological risk index (ERI) model and the geodetector tools to analyze the land-use data from 2000 to 2020 in the Zhangye area of the HRB to study the characteristics of the ecological risk evolution and the driving forces affecting the ecological risk differentiation. The results show the following: (1) the area of the regional land-use change accounts for 4.99% of the total area, and the landscape pattern as a whole shows an increasing degree of fragmentation and a decreasing trend of aggregation; (2) the distribution of the ERI in the region shows a trend of being low in the center and high in the periphery, with an increase of 2.11% in the area of the lowest and lower risk and a decrease of 1.77% in the highest and higher, and the temporal change shows an increase followed by a significant decrease; (3) the human interference degree is the dominant factor influencing the spatial differentiation of the ERI in the basin area. There are significant differences between social factors, climate factors and land factors.
1. Introduction
As an important part of the natural ecosystem of a region, the relative stability of the structure and function of the watershed ecosystem determines the sustainable development and high-quality construction of the regional ecological environment. However, with the frequent human development and construction activities in the watershed area in recent years, the ecological risks in the watershed area have begun to intensify, seriously affecting the overall ecosystem quality of the area. According to the Global Remote Sensing of Ecosystems report, the total volume of water in rivers and lakes in the arid zones of the Asian and African continents has continued to shrink over the past two decades, and the river area affected by human activities is equivalent to 40% of the world’s land surface area, and the length of the river affected accounts for 37% of the total length of the world’s rivers [1], and the ecosystems of watersheds have become precarious, affecting the ecological sustainability of major regions. Meanwhile, statistics from the Chinese Academy of Engineering and the Ministry of Ecology and Environment show that, over the past 60 years, China has suffered soil erosion of 3.67 million square kilometers, the amount of sewage discharged from various watersheds has continued to increase and grasslands, forests and wetlands around the watersheds have shrunk severely, with the ecologically fragile areas accounting for more than 60% of the country’s total land area [2]. In response to severe ecological problems in watershed areas, China’s Development and Reform Commission issued the “14th Five-Year Plan for Comprehensive Management of Water Environment in Key Watersheds” in 2022, which mentions the need to vigorously promote ecological protection and high-quality development of China’s watersheds. Since then, the ecological problems in the watershed area have become real ecological problems that need to be solved in the context of the current high-quality development of each city.
As one of the important factors restricting and influencing the economic development and high-quality construction of the watershed area, timely analysis and exploration of the watershed ecological risk can effectively grasp the regional ecological situation, solve the ecological problems and safeguard the environmental security of the watershed area. Ecological risk in a watershed refers to the possibility of negative impacts on the structure and functioning of the ecosystem in the watershed area caused by factors such as natural changes or human activities, as well as the loss of such impacts. The research results of current scholars on the ecological risk assessment of watersheds can be broadly categorized into two types: regional ecological risk assessment and landscape ecological risk assessment. Regional ecological risk assessment focuses on evaluating the extent of damage caused by human activities, environmental damage and other factors to multiple risk receptors at the regional scale [3,4], which includes social, economic, ecological and other factors, and is characterized by its regional and comprehensive nature. Landscape ecological risk assessment, on the other hand, is based on the evolution of landscape patterns, analyzing the intrinsic risk sources and external disturbance responses and evaluating the impacts of human activities and environmental damage on the ecology and landscape of the study area [5]. Compared with regional ecological risk assessment, landscape ecological risk assessment focuses on the dimensions of landscape vulnerability, resilience and stability, and the results of the assessment focus on the integrated reflection of multiple sources of risk, and the results can be visualized [6], which can provide an objective basis for decision makers to follow up the ecological management of the watershed area, and therefore has become the mainstream methodology of watershed ecological risk research. The theoretical basis for the evaluation of ecological risk in watershed landscapes is to emphasize the connection between regional landscape patterns and regional ecology, to study the spatial and temporal differentiation characteristics of ecological risk [7] and to evaluate and reflect the regional ecological impacts brought about by changes in landscape patterns. The research methodology mainly utilizes the traditional risk “source-collection” approach and the landscape index approach. The “source-collection” approach is suitable for evaluating specific ecological risks with significant impact factors in a watershed area [8], and is often combined with methods such as load comparison indices and minimum cumulative resistance surfaces [9]. However, the methodology does not adequately evaluate the integrated characterization of landscape ecological risks and does not allow an exploratory analysis of landscape heterogeneity. The landscape index method is suitable for multi-scale landscape ecological risk evaluation in the watershed area to realize the integrated characteristics of multi-source risk and spatial-temporal variability reflection, and at the same time, because land-use data are the core of the landscape index method [10,11], it is more convenient to obtain the data without the need to carry out a large number of experiments for the actual measurement. Therefore, the landscape index method is often used in the landscape ecological risk assessment of watersheds. However, it can be summarized through the relevant research reading that although scholars have carried out in-depth studies on the ecological risk assessment of watersheds, most of the studies still have the following deficiencies: (1) Regarding the selection of the study area, most of the existing studies have taken large regional rivers and lakes as the study object for landscape ecological risk assessment, while the ecological studies on inland river basins in arid and semi-arid regions are rare. (2) In terms of research content, many studies focus on a landscape ecological risk exploration of the current state of the region [12,13], pay less attention to changes in land-use types and lack research on ecological risk changes from the time dimension. (3) In terms of research methodology, most of the existing studies directly summarize the influential factors affecting regional ecological changes after evaluating the ecological risks of regional landscapes and lack the weight of specific factors affecting ecological changes through quantitative analysis. Therefore, to address the shortcomings of the above studies, this study selects a typical inland river located in the arid zone of China to conduct a watershed ecological risk study, analyzes the characteristics of land and ecological risk changes in the watershed across multiple time dimensions, and at the same time selects the actual driving factors influencing the changes in the ecological risk level of the watershed in the light of the actual ecological conditions of the watershed and conducts a quantitative analysis of each factor. This research can complement and deepen ecosystem research in the arid zone watershed area and help with the management of watershed ecology in the arid zone.
The Heihe River Basin (HRB) is located in the arid region of Western China, and the population in the middle reaches of the basin accounts for more than 80% of the total basin population, and the GDP accounts for more than 90% of the total basin GDP. The data show that the middle reaches are the most important part of the whole basin, and the ecological protection and high-quality development of the middle reaches are related to the social construction and ecological development of the whole basin region and even Western China. As a typical city in the middle reaches of the HRB, the Zhangye area has experienced frequent human activities over the past decades, and the ecological environment has become increasingly fragile, and regional development has been seriously affected by the deterioration of ecological quality. There is an urgent need to analyze the ecological situation of the region in order to grasp the core ecological problems that constrain the development of the region. Therefore, in the context of China’s current efforts to build the “Silk Road Economic Belt” in the western region and emphasize “high-quality development”, it is typical to study the landscape ecosystem of the HRB, taking the Zhangye area as an example.
In summary, based on the background of the construction of high-quality development in China’s watershed areas and the urgent need for watershed ecological optimization in Zhangye, this study takes the Zhangye area in the HRB as an example for watershed ecological research after analyzing the contents and shortcomings of related studies. Based on the data of the area’s land-use types from 2000 to 2020 to compute the distribution of the landscape indices and the landscape ecological risk class, this study uses geodetector to identify the difference in the impacts of the driving factors on the spatial variation of the area’s ecological space. The aim of this study is to provide a scientific basis for the ecological evaluation and remediation and protection of the Zhangye area while complementing and deepening the ecological study of the arid zone watershed area.
2. Study Area and Data Sources
2.1. Study Area
As the second largest inland river basin in Western China, the HRB borders Mongolia in the north, is connected to the Wuwei basin by the Dahuangshan Mountains in the east and is adjacent to the Shule River basin by the Heishan Mountains in the west [14], between 98°–101°30′ E and 38°–42° N. It flows through Qinghai, Gansu and Inner Mongolia provinces, with a basin area of about 142,900 km2. However, in recent years, the basin area has been affected by human activities and natural factors, and its ecological risks and problems are becoming more and more prominent. According to the information released by the HRB Management Bureau of the Yellow River Water Conservancy Commission: (1) It can be seen that the mountainous areas in the upper reaches of the HRB have weak specialization studies on water-sourcing forests and grasses and biodiversity conservation, and the mountainous areas have ecological problems such as bald patches of steppe and sandy meadows and the reduction in glacier area. (2) In the midstream area, due to the lack of perfect detection and prevention measures, the desertification of the land in the midstream area such as Jinta and Gaotai has been gradually expanding since 1990, and the salinized land area continues to increase. At the same time, the area of grassland in the region has been greatly reduced due to a large number of land reclamation operations, and the existing grassland has been seriously degraded due to high-intensity grazing operations; serious ecological problems in the region constrain the sustainable development of the midstream region. (3) The downstream area is the most fragile area of the ecological environment of the HRB, and ecological problems such as the disappearance of lakes at the basin terminals, the blockage and abandonment of river channels, and the rapid desertification of land are seriously affecting the stable development of the downstream area’s economy and society, and they have even threatened the environmental security of the national defense construction in northwest China.
The Zhangye area in the middle reaches of the HRB was selected as the study area (Figure 1), which is between 1254 and 5544 m above sea level, with better hydrological conditions than other areas and with two types of natural landscapes: desert and oasis. The region has low precipitation, with annual precipitation ranging from 112.3 to 354 mm and annual evaporation as high as 1623–1765 mm, and the natural vegetation is dominated by cold-tolerant small shrubs and semi-shrubs desert vegetation. The lower part of the alluvial fan in front of the mountain and the alluvial plain of the river in the middle reaches are distributed with irrigated oasis cultivated crops and forest trees, showing an oasis landscape with mainly artificial vegetation, which is a famous grain production base in China [15]. Meanwhile, the Zhangye area has a total population of about 1,199,500, with 37 ethnic minorities, and the main economic indicators of the region are higher than the average level of Gansu Province, which is a key development city and a hub of commerce and trade circulation in Gansu Province. In addition, as a rare oasis city in the arid region of Western China and an important ecological reserve in the middle reaches of the Hexi Corridor region, Zhangye’s ecological environment affects the overall ecological development and construction of Western China to a certain extent. The middle reaches of the HRB, as an important source of water for production and living in the Zhangye area, the ecological quality of its watershed is extremely important to the development of all aspects of the region. In recent years, the long-term irrational development and transformation activities in the watershed area have seriously affected the ecological quality of the watershed [16], leading to ecological problems such as the imbalance in the deployment of water use, the decline in the capacity of grasslands and forests to contain water and the decrease in the groundwater level and other ecological problems, which are seriously threatening the ecological security of the region. Thus, it is important and urgent to carry out a study of ecological protection in the Zhangye area of the HRB.
2.2. Data Sources
The research data include three parts: (1) the basic information: the scope of the study area and the data of the HRB; (2) the landscape ecological evaluation: the land-use data from 2000 to 2020 were selected, and with reference to the existing relevant studies, it was determined to take the six land-use types of cropland, forest land, grassland, water area, built-up land and unused land as the types of landscapes for ecological evaluation; (3) the driving force analysis: the influence factors selected by the existing relevant studies were summarized and integrated, and at the same time, after the field research in Zhangye, the three aspects of climate, land and society were finally selected as the driving factors according to the actual situation of the Zhangye area (Table 1).
3. Research Methods
The general framework of this study is shown in Figure 2. Firstly, the regional land-use data from 2000 to 2020 were analyzed through the landscape index to grasp the changing characteristics of the land use and landscape pattern in the Zhangye area of the HRB; secondly, the ERI model was applied to identify the spatial and temporal differentiation characteristics of the regional ERI; finally, using the geodetector tools, the relevant drivers were analyzed to explore the weight of influence of each driver that leads to regional landscape ecological risk differentiation.
3.1. Landscape Index
The landscape index is a quantitative index used to reflect the structure and spatial characteristics of landscape patches and to find patterns and characteristics from disordered landscape patches [17]. The study reviewed the integration of current relevant studies in the HRB, and combined with the actual ecological characteristics of the HRB, selected the Percentage of Landscape (PLAND), Patch Density (PD), Largest Patch Index (LPI), Landscape Shape Index (LSI) and Aggregation Index (AI) as evaluation criteria to calculate the index values of each time period to characterize the evolution of the landscape features of each site in the region. The formulas of each index are as follows (Table 2).
3.2. Landscape Ecological Risk Index (ERI) Model
The ERI model was selected to evaluate the ERI status of the Zhangye area from 2000 to 2020. The evaluation plots of the Zhangye area were divided into evaluation plots, and the indices such as landscape loss index (LLi) were calculated for each evaluation plot, and then the ecological risk values of each evaluation plot were derived [18], and the ERI of the Zhangye area was spatially interpolated using the Kriging interpolation method.
When constructing the evaluation model, the study refers to related studies and selects the indices of the landscape crush index (Ci), landscape separation index (Si), landscape dimensional index (Di), landscape upset index (Ui) and landscape loss index (LLi) as the evaluation criteria [19,20]. The formulas and ecological meanings of its indices are as follows (Table 3):
3.3. Geodetector-Based Driver Analysis
Geodetector is a statistical method used to detect spatial dissimilarity and the driving forces behind it. It can not only detect the explanatory power of a single factor on the spatial variability of the dependent variable but also quantitatively determine the explanatory power of a two-factor interaction on the spatial variability of the dependent variable and identify whether there is a difference in the influence of factors on spatial variability, and it is widely used in the analysis of the influencing factors of natural and economic and social phenomena [21]. This study uses factor detection and interaction detection to quantify the spatial impact drivers of ecological risk based on the ecological evaluation of the Zhangye area.
- (1)
- Factor detection is to investigate the spatial heterogeneity of the dependent variable Y and the extent to which the independent variable X explains its divergence, with the following formula:where h is the partition number of the independent variable X, L is the number of partitions, N is the total number of grids in the region, Nh is the number of grids in each partition, is the variance of ecological risk within the region, is the variance of each partition, SSW is the sum of variance within layers and SST is the total variance of the whole region. the larger the value of q, the more prominent its Y spatial differentiation; for the stratification produced by the independent variable X, the larger the value of q, the stronger the explanatory power of its independent variable X on Y [22].
- (2)
- Interaction detection is to analyze the interaction between different factors; the values of q(X1) and q(X2) for single-factor interaction and q(X1 ∩ X2) for two-factor interaction were compared to analyze the degree of influence of factor interactions on ecological risk. When q(X1 ∩ X2) < min(q(X1), q(X2)), it indicates a nonlinear weakening of the explanatory power of the interaction; when min(q(X1), q(X2)) < q(X1 ∩ X2) < max(q(X1), q(X2)), it indicates a single-factor nonlinear weakening; when q(X1 ∩ X2) > max(q(X1), q(X2)), it indicates a two-factor enhancement; when q(X1 ∩ X2) = q(X1) + q(X2), it indicates that the two factors act independently on the Y-space divergence and are two-factor independent; when q(X1 ∩ X2) > q(X1) + q(X2), it indicates that the single-factor interaction is nonlinearly enhanced on the Y-space divergence.
4. Study Results
4.1. Landscape Ecological Patterns
Through the land-use data map of the Zhangye area in 2000, 2010 and 2020 (Figure 3), it is known that the area of land-use change in the Zhangye area from 2000 to 2020 accounted for 4.99% of the total area, during which the area of grassland decreased by 89.88 km2, the area of non-utilized land decreased by 874.12 km2, and the ratio of the two types of land use decreased by 0.23% and 2.26%, respectively, and the area of construction land use was increasing, with an area growth of 119.35 km2. In order to further obtain the detailed characteristics of various types of land in Zhangye, the raster data of Figure 3 were analyzed by applying Fragstats according to the formula of each index in Section 3.1.
The results in Table 4 show the following: (1) In PLAND and PD, the PLAND size of each landscape patch in the Zhangye area is in the order of cropland > forest land > built-up land > unused land > grassland > water area, where PLAND of cropland is the largest at 21.94, which constitutes the whole landscape matrix. The small PLAND of grassland and water area indicates that the influence of grassland and water area on the overall landscape of the Zhangye area is relatively small. Meanwhile, during 2000–2020, grassland, built-up land and unused land PLAND decreased by 0.18, 1.42 and 0.84, and PD increased by 0.002 4, 0.003 7 and 0.002 3, indicating a continuing decline in the area of grassland, built-up land and unused land and a trend towards fragmentation, but the trend is not significant. (2) Among LPI, the LPI of built-up land and forest land is above 5, followed by cropland, unused land and grassland, and the LPI of the water area is the lowest, fluctuating around 0.2, indicating that built-up land and forest land have the highest degree of dominance and are more centrally distributed compared to other types of land. (3) In the LSI, the LSI of the Zhangye area increased by 4.84 during 2000–2020, indicating that the landscape characteristics of the area tend to be diverse and complex, in which the indices are grassland, forest land, cropland, water area and unused land in descending order. The LSI of grassland is the largest, indicating that the boundary value of grassland is the largest per unit area, which reflects the natural characteristics of grassland landscape patches. The LSI of forest land, cropland and water area are the second highest, indicating that the patches of these types in Zhangye have a more mixed shape and a higher degree of landscape fragmentation, which is related to the increase in population and human activities such as land reclamation in the region in the past 20 years. The LSI of grassland and forest land increased by 2.15 and 2.04, respectively, indicating that the patches of grassland and forest land tend to be fragmented due to the limitation of human intervention planning during the last 20 years in the Zhangye area. (4) Among the AI of the Zhangye area, the AI index of built-up land was the highest at 98.10, indicating that the patches of built-up land in the area were the most aggregated and evenly distributed. The AI index of water area is the lowest, 92.19, indicating that water area patches are less aggregated than other patches, and their distribution is more dispersed, with better accessibility to patches. (5) Overall the degree of fragmentation of each type of land use in the Zhangye area shows an increasing trend, and the degree of aggregation shows a decreasing trend, but the magnitude of change is not large, and the gap between the indices is relatively small, indicating that the degree of aggregation of each type of land use patch within the Zhangye area of the HRB is relatively balanced.
4.2. ERI Analysis
The Zhangye area of the HRB is divided into several evaluation units, and the land-use raster data in 2000, 2010 and 2020 were processed by GIS. According to the formula of each index in Section 3.2, Fragstats and Excel were used to calculate the Ci, Si, Di, Ui, LLi and ERIi indices for different time periods, and ordinary kriging interpolation was utilized to obtain the regional spatial distribution maps of the ecological risk of the landscape in the Zhangye area of the HRB in the years 2000, 2010 and 2020. Meanwhile, according to the natural breakpoint method, the ERI level of the region was classified into five levels: lowest risk, lower risk, medium risk, higher risk and highest risk according to the natural break point method (Figure 4).
4.2.1. Spatial Differences in the ERI
From the spatial distribution, it can be seen that the distribution pattern of the ERI in the Zhangye area of the HRB is similar over 20 years, showing an overall distribution pattern of the lowest risk level in the central basin area and gradually increasing in other areas. The lowest risk areas are concentrated in the central and eastern parts of the region, mainly in Linze County, the Zhangye area and the southern part of Ganzhou District, Minle County and Shandan County, which are rich in water resources and various land uses, including cropland, grassland, forest land and water area, and are more resistant to disturbance and self-recovery than other areas; thus, the ecological risk level is low; the highest risk areas are concentrated in the west, north and south, mostly in Gaotai County, Sunan Yugu Autonomous County, Linze County and northern Ganzhou District of the Zhangye area. Gaotai County, Linze County and northern Ganzhou District are mostly deserts and Gobi unused land, and Sunan Yugu Autonomous County is mostly grassland, all of which have a single land-use type, resulting in a fragile ecological environment, weak resistance to disturbance and high risk level.
4.2.2. Temporal Changes in the ERI
The area of each ERI level area was counted, and the change of each ERI area in the Zhangye area of the HRB during 2000–2020 could be derived (Table 5). From the change of area, it can be seen that during 2000–2010, the area of the lowest risk zone in the Zhangye area showed a decreasing trend, from 2.42% to 2.22%; the area of the lower risk zone and medium risk zone showed an increasing trend, from 12.10% to 12.53% and from 26.20% to 27.29%, respectively; the area of higher and the highest risk zone decreased; the area of each level of ecological risk area changed significantly. During 2010–2020, the area of both the lowest risk area and lower risk area within the Zhangye area showed a rapidly increasing trend, from 2.22% to 3.14% and from 12.53% to 13.49%, respectively, with a more obvious increasing trend; decrease was observed in the area of medium risk zones, from 27.29% to 25.86; The areas of higher risk and the highest risk also showed a decreasing trend, but the changes were smaller, from 32.38% to 32.30% and from 25.58% to 25.20%. It is mainly due to the influence of the national trend of strengthening ecological environment protection and high-quality construction that the region began to emphasize the improvement and protection of the ecological environment of the watershed. The increase in the area of forest land and grassland types in the southern part of the basin, as well as adjustments in regional irrigation and cropping patterns and structures, have led to a continued increase in the area of low ecological risk zones in the basin area. Between 2000 and 2020, the ecological risk situation of the landscape in the Zhangye area of the HRB showed a trend of gradual transformation to good. The area of its regional lowest risk zone increased by 275.19 km2, and the proportion increased by 0.72%; the area of lower risk area increased by 535.7 km2, and the proportion increased by 1.39%; the area of medium risk area decreased by 130.79 km2, and the proportion decreased by 0.34%; the area of higher and the highest risk areas decreased by 680.1 km2, and the proportion decreased by 1.77%.
In summary, the ERI level in the Zhangye area of the HRB mainly shifted from low to high during 2000–2010. The area of the lowest risk increased in the Linze and Minle counties of Zhangye; the area of the highest risk increased in Sunan Yugu Autonomous County and Shandan County, among which the area of Sunan Yugu Autonomous County increased significantly, showing a trend of gradual expansion of the area of high ecological risk in local areas. During 2010–2020, the area of the ERI level changed significantly, and the areas of lower and lowest risk increased significantly, and the spatial distribution was dominated by Linze County; Ganzhou District and Shandan County are the main areas, and the decrease in the higher and highest risk areas is mainly in Sunan Yugu Autonomous County. Overall, the ERI level in the Zhangye area of the HRB showed a trend of increasing and then decreasing during 2000–2020, indicating that the area began to gradually pay attention to ecological environmental protection and increase ecological control and improvement, and the ecological environment quality of the area began to change for the better.
4.3. Analysis of Drivers Affecting Changes in the ERI
In order to accurately analyze the spatial heterogeneity of the ERI and the explanatory power of influencing factors in the Zhangye area of the HRB, the article applies the factor detection and interaction detection of geodetector probes to quantitatively analyze the driving force and adopts the method of natural discontinuities to delineate five intervals and then superimpose them with the ERI. Considering the data calculation problem, X1–X8 were used to replace annual precipitation, average annual temperature, elevation, slope, normalized vegetation index, population density, per capita GDP and human interference degree, respectively, and Y is the ERI. The results are measured by q-values, which measure spatial dissimilarity, detect explanatory factors and analyze the interaction between variables, with the larger q-values indicating that the more the factor explains, the stronger and more influential it is. For the one-way analysis, a larger q-value of the factor indicates a greater degree of influence of the factor on the spatial differentiation of the regional ERI. For the factor interaction analysis, the larger the q-values are after the interaction of two factors indicates that the combined influence of the two factors is larger than the influence of a single factor, and at the same time, the larger the combined influence on the spatial differentiation of the regional ERI.
4.3.1. One-Factor Explanatory Degree Analysis
The factor detector can detect the explanatory power of the spatial variability of the ERI; the results of the analysis based on equation 1 (Figure 5) show that the explanatory power (q-values) of each factor on the spatial variability of the ERI in the Zhangye area in 2000 was X8 > X2 > X5 > X7 > X6 > X1 > X3 > X4 in descending order, and the single factor human interference degree was the main factor affecting the spatial variability of the ERI in the Zhangye area of the HRB with 58.43%, the second factor was the annual average temperature, followed by the normalized vegetation index, GDP per capita, population density, annual precipitation and elevation, and the slope is the weakest factor in explaining the spatial variation of the ERI. The q-values in 2010 were ranked as X8 > X5 > X6 > X1 > X7 > X3 > X2 > X4, with the human interference degree also being the dominant influence on the ERI change in Zhangye, followed by the normalized vegetation index and population density factors. In 2020, the q-values are X8 > X6 > X1 > X2 > X5 > X7 > X3 > X4. Human disturbance is still the main controlling factor for the change of the regional ERI, and its explanatory power decreases compared with 2000 and 2010, while the explanatory power of population density and annual precipitation factors increases, the elevation and slope q-values are low, and their values are less than 0.1. This indicates that the single-factor explanatory power of the elevation and slope factors on the spatial variation of the ERI is low.
By comparing the q-values of the factors in the three periods (Figure 6), we can see that the explanatory power of each factor changes with time, among which the explanatory power of the annual precipitation, elevation, slope, population density and GDP per capita factors show a gradual increase from 2000 to 2020, and the annual precipitation, population density and GDP per capita factors have a larger increase from 2000 to 2010; the annual precipitation factor showed a “V”-shaped change, and its explanatory power was small in 2010; the normalized vegetation index factor showed a trend of increasing and then decreasing, and its explanatory power was large in 2010; the human interference degree factor was the main factor affecting the spatial variation of the ERI from 2000 to 2020, and its explanatory power showed a gradual decrease.
4.3.2. Factor Interaction Analysis
The interaction detection can analyze whether the interaction of the two factors enhances or weakens the explanatory power of the spatial differentiation of landscape ecological risks in the region [23]. The results of the interaction detection of the driving factors of the spatial variation of the ERI in the Zhangye area of the HRB are shown in Figure 6. The analysis results show that among the eight selected factors, the explanatory power of any two factors starts to increase after interaction, and it is greater than that of a single factor, and the types of enhancement after interaction are two-factor enhancement and nonlinear enhancement, respectively, indicating that the spatial variation of the regional ERI is the result of the joint influence of many factors. Among them, in 2000, the trend of the q-value change after the interaction of each factor with the human interference degree was larger; with the q-values above 0.5, the increase in the q-values of other factors after the interaction was relatively small but still indicated that the explanatory power of the interaction of the driving factors was greater than that of the single factor. In 2010, the explanatory power of human disturbance and the normalized vegetation index increased after interacting with other factors, and their q-values were all greater than 0.5, which significantly increased their influence; trends in the interaction changes in 2020 are broadly consistent with those in 2010; during 2000–2020, the normalized vegetation index and human interference degree interaction have the strongest impact, with q-values reaching 0.63159, 0.66295 and 0.63732, respectively, which have a greater influence on the spatial variation of the regional landscape ecological risk, while the explanatory power of each factor and the human interference degree factor increases when they interact, with q-values greater than 0.5, indicating that the interaction between human activities and natural factors has a stronger explanatory power for the ERI differentiation in the Zhangye area of the HRB, which plays a crucial role in the regional ERI differentiation.
5. Discussion
5.1. Characterizing Spatial and Temporal Variability in the ERI
Land-use changes in the region cause changes in landscape ecological patterns, and changes in landscape ecological patterns lead to ecological risks in the region’s landscapes [24]. Therefore, when evaluating the ERI of the Zhangye area in this study, the landscape ecological pattern of the area was first analyzed, and then it was used as a medium to evaluate the ERI of the area, emphasizing the correlation between the regional land-use change and the ERI divergence.
During the period of 2000–2020, the spatial distribution of the ERI in the Zhangye area of the HRB showed a pattern of being low in the central area and high in the peripheral area, with the lowest, lower and medium ecological risk zones mainly located in Ganzhou District, the southern part of Linze County, Minle County and the northern part of Shandan County, and the highest and higher ecological risk zones were mainly distributed in Gautai County, Su’nan Yugu Autonomous County and the southern part of Shandan County. The counties and districts in the central region are flat, dominated by arable land, grassland and forest land, and with the Zhangye Wetland National Nature Reserve and a number of reservoirs such as Caojia Lake and Erba Reservoir, the natural conditions are more favorable, which are conducive to the maintenance of the ecological quality and ecological vitality of the region, and thus the ecological risks in the central region are generally low. The peripheral areas, on the other hand, are more undulating and have a larger proportion of unutilized land area, and the ecological risk of the landscape is significantly higher than that of the central area. The low and lower ecological risk zones in the whole region are mainly affected by cropland, woodland and grassland, while the high and higher ecological risk zones are mainly affected by unutilized land and built-up land, which is also consistent with the findings of Qiao et al. [25] and Zhang et al. [26]. This differentiation of regional landscape ecological space requires decision-makers to optimize the regional ecological risk space by proposing targeted management strategies based on the actual ecological risk level of the region [27].
Between 2000 and 2020, the temporal evolution of the ERI in the Zhangye area of the HRB showed an increasing and then decreasing trend, and the change in the regional ERI was mainly influenced by relevant policies. As can be seen from the relevant policies (Figure 7), both at the national and regional levels, the importance attached to watershed ecological management is higher in the 2010–2020 period than in the 2000–2010 period, and its importance is highly correlated with the trend in the temporal evolution of the regional ERI. In 2000, the “Western Development” policy was deployed by the State Council’s Western Region Development Leading Group, and the region was affected by the national development policy, which began to expand urban land, and human activities were more frequent, which affected the ecological quality of the region to a certain extent and increased the ecological risk of the landscape. This is also evidenced in the related land study of the Zhangye area [28]. Since 2010, the policy of “ecological civilization construction” has been widely implemented in China [29]. Under the background of the national policy, the Zhangye area has started to pay attention to the improvement and protection of the ecological environment of the watershed and has improved the policies and regulations, such as the “Overall Plan of Gansu Zhangye Heihe Wetland National Nature Reserve”, the “Measures for the Management of Wetlands in the Heihe Watershed of Zhangye Area”, the “Measures for the Management of the National Wetland Park of Zhangye”, etc. Its effect on the ecological environment of the region is significant, thus reducing the ecological risk of the region’s landscape.
5.2. Exploring the Driving Forces Affecting the Ecospatial Distribution of Landscapes
This study analyzes the driving factors in the Zhangye area of the HRB through geodetector, accurately grasps the degree of influence of the driving forces affecting the spatial differentiation of regional ERI and provides a basis for targeted management of the ecological environment in the subsequent areas. A one-factor analysis of variance and an interaction analysis were conducted by analyzing each driver in Zhangye over the past 20 years. The results from the one-factor analysis show that social factors are the main factors affecting the spatial differentiation of the ERI in the Zhangye area of the HRB (Figure 5) and that the factor of the human disturbance degree has strong explanatory power, a result similar to that analyzed in related studies [30,31]. However, the influence of land factors on the ERI changes in Zhangye analyzed in this study is small and the slope is the weakest driving factor, unlike the conclusions reached in some studies [32]. Detailed reading and analysis of the study can analyze the reasons; in the current emphasis on rapid urbanization and high-quality development of the region, human activities are more frequent, resulting in more active social factors, and the impact on the regional landscape ecological risk is naturally greater than the region’s natural factors. It also demonstrates that the drivers of changes in ecological risk significantly affect regional landscape changes as the study area varies; The results from the factor interactions show that each factor has a stronger explanatory power for the spatial differentiation of ecological risk after the interaction than the single-factor interaction, indicating that there is a certain connection between the effects of each factor on the ecological risk of regional landscapes and that they are not completely independent of each other, and this result confirms the findings in the studies of Karimian et al. [33] and Hu et al. [34]. Meanwhile, as far as the factors are concerned, the degree of human interference is significant after interacting with other factors, which to some extent indicates that limiting human activities is more important to maintaining or reducing the ecological risk level of the region.
5.3. Control Strategies for Optimizing the ERI
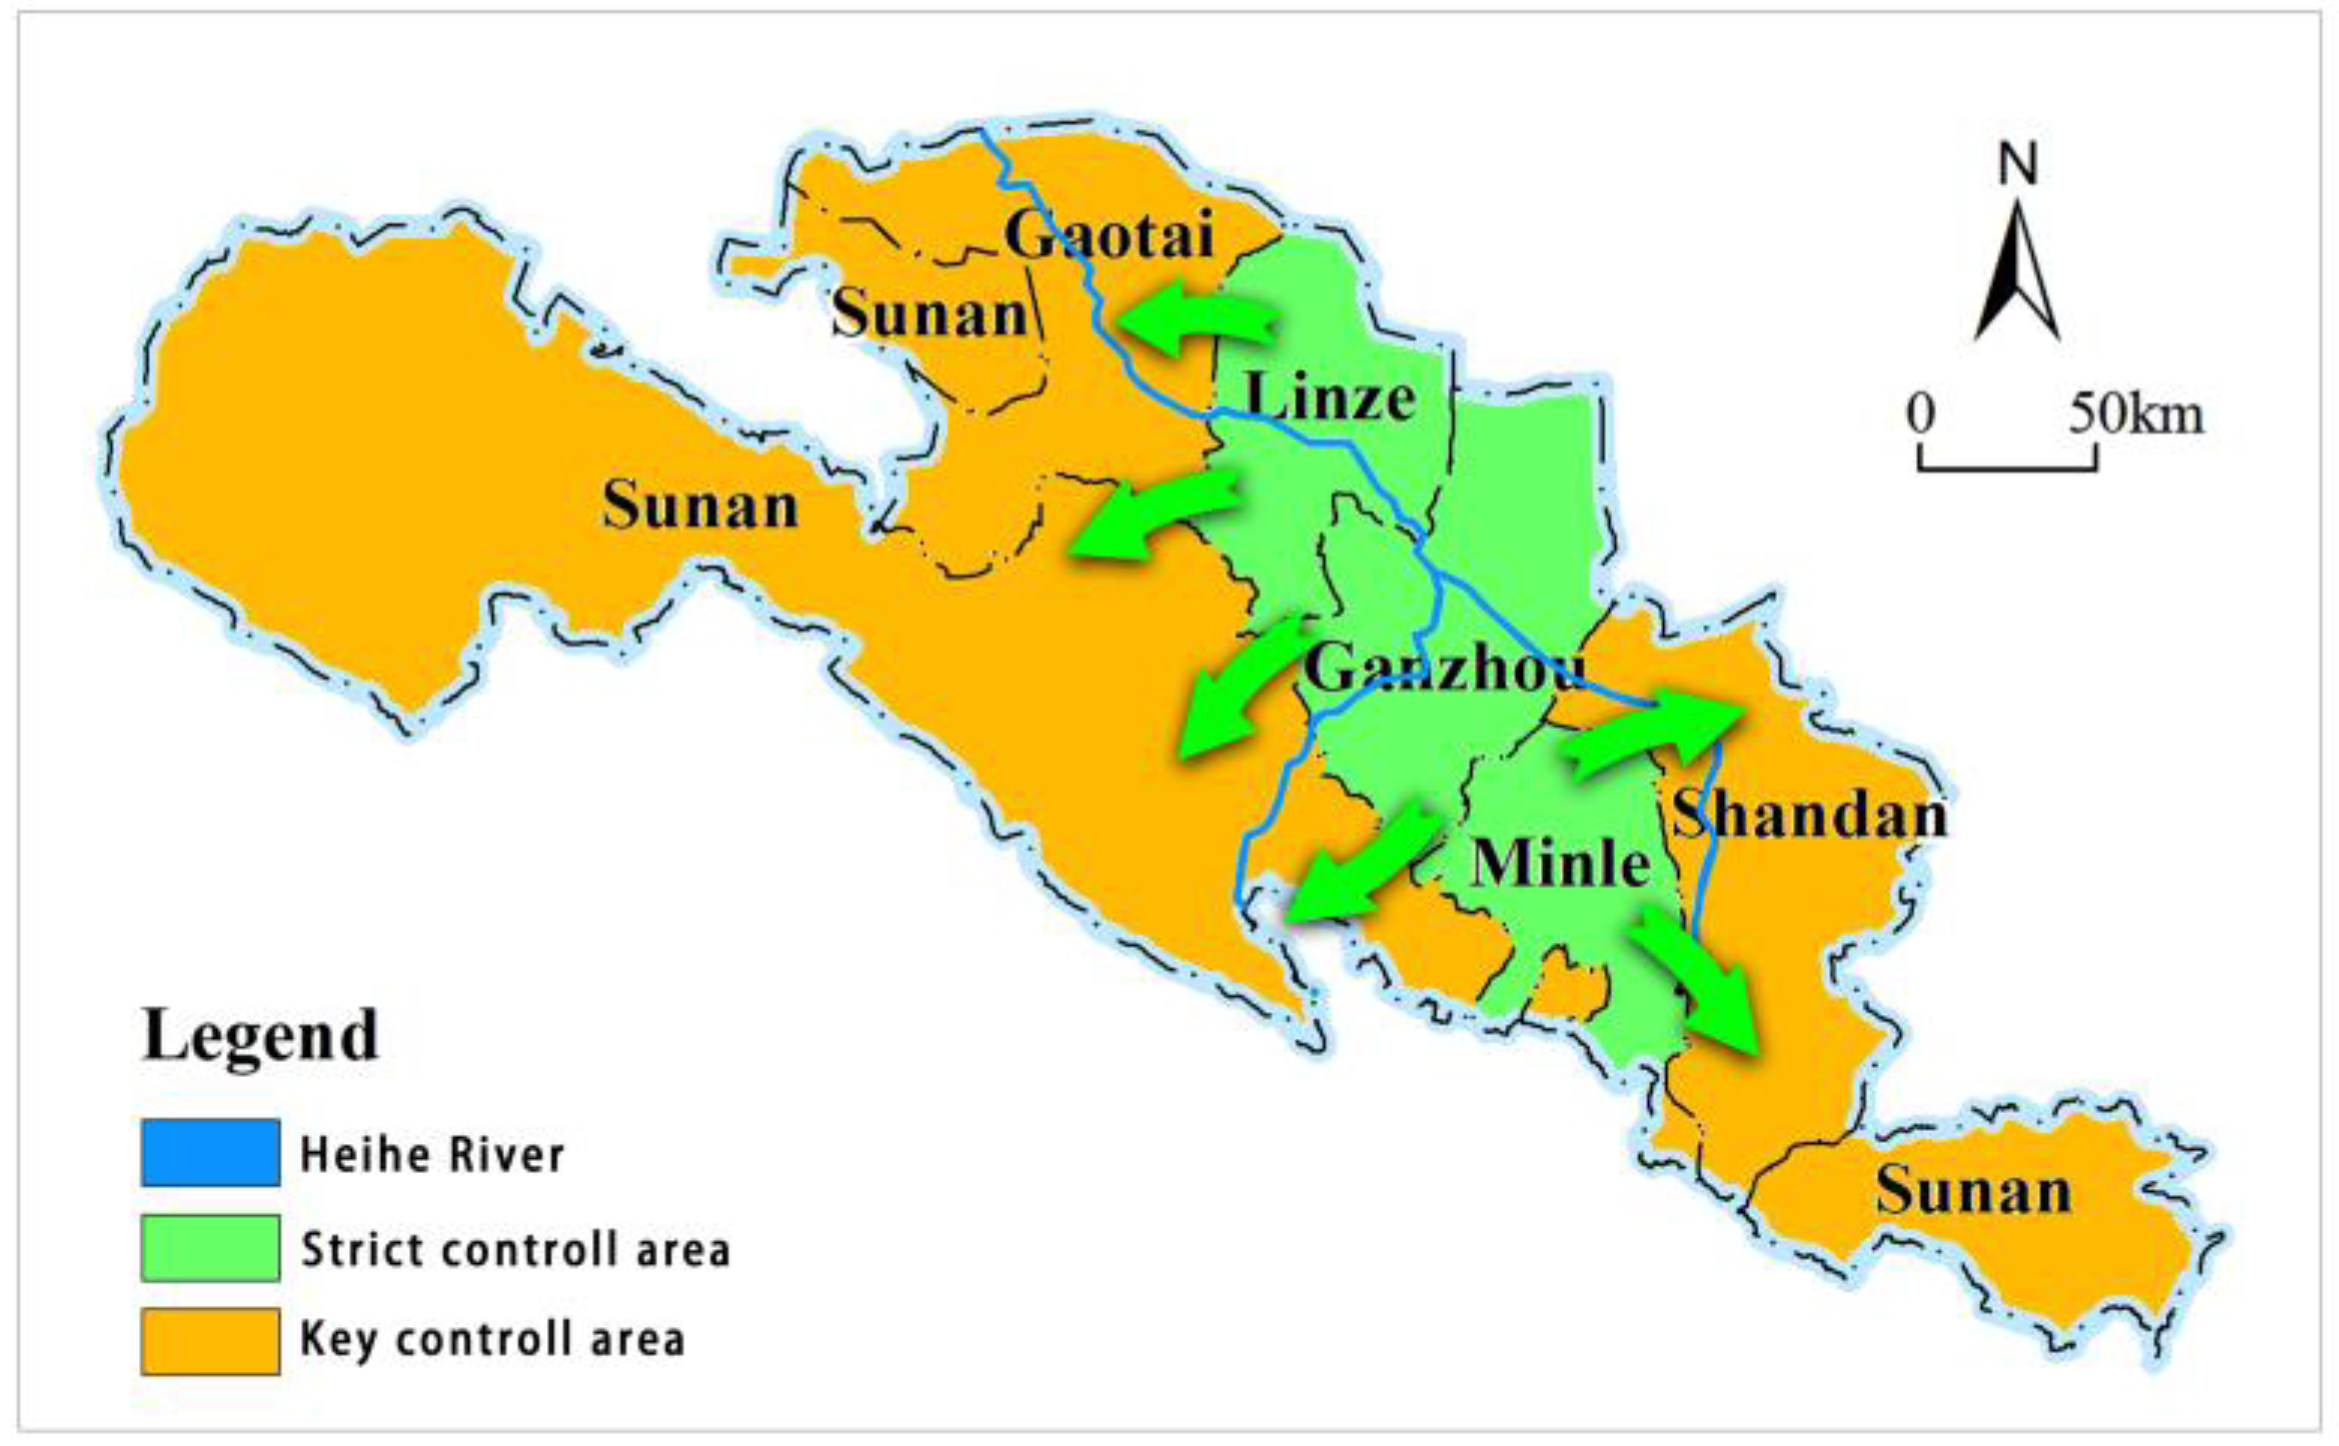
Through the results of the study, it can be seen that the distribution of the ERI level in the Zhangye area of the HRB presents a trend of being low in the central area and high in the other areas; therefore, to reduce the regional ERI, we can adopt the optimization idea of central control and peripheral management and divide the area into the central strict control area and the peripheral key control area (Figure 8). This localized, small-scale zoning governance can create synergies at larger spatial scales [35].
The central strict control area contains Ganzhou District, Linze County and Minle County areas, which are basically the lowest, lower and medium ecological risk areas with excellent ecological resources. It is pointed out in related studies that these grade areas are the key to controlling the overall regional ecological security and stability [32], so the central strict control area should actively coordinate the balance between various types of land, optimize the land use pattern and make full use of the advantages and influence of the central geographic location to drive the ecological protection of the surrounding areas. At the same time, attention should be paid to the protection of various types of landscapes and water bodies, relying on the region’s existing reservoirs and wetland parks, delineating a certain range of watershed protection zones, expanding the area of forested and grassed land and concentrating it into a single area, further optimizing the level of the ERI in the central region, and reducing the degree of fragmentation of various types of land in the central region.
The outer critical control area contains Gaotai County, Sunan Yugu Autonomous County and Shandan County, which have a relatively large area of the highest and higher ecological risk zones. For the peripheral key control areas, it is necessary to actively protect and utilize arable farmland and return some of the poorer quality arable land to forests. At the same time, it is necessary to efficiently renew the stock of built-up land to avoid the reduction in the area of cropland, forest land and grassland. In addition, the peripheral regions should further focus on regional ecological and environmental management, strengthen synergistic linkages with ecological control in the central region and reduce the ERI.
5.4. Limitations and Future Research Directions
This study analyzes the landscape ecological pattern and ERI change characteristics and driving forces in the Zhangye area of the HRB, and the analysis results not only provide scientific guidance for the subsequent ecological management of the area but also provide certain references for the ecological evaluation and control guidance in other arid zone watershed areas in the world. However, this study still has some limitations due to methodological and data limitations. First of all, this study only analyzes the data after 2000 because it is more difficult to obtain detailed land-use data for the early years in the Zhangye area of the HRB; thus, the study years need to be further deepened and improved. Secondly, the research scale is relatively single scale, as it is only from the county scale through the ecological risk evaluation, and it did not carry out multi-scale spatial validation; the follow-up needs to further carry out multi-scale analysis and research to strengthen the scientific nature of the analysis results. Finally, for the analysis of driving force factors, only a few more typical factors were selected for the actual situation of the region, and the comprehensive analysis and grasp of the driving force of ecological changes affecting the regional landscape need to be further improved.
In this study, landscape ecological evaluation and driving force analysis were carried out in the Zhangye area of the HRB as an example, and the future research direction is to further deepen the ecological analysis of the area after refining the above limitations. At the same time, the scope of the study area will be expanded to synthesize the multi-source data of the HRB, to analyze and predict the future development of the ecological situation of the HRB and to provide support for the ecological maintenance and construction of the basin area in the western arid zone.
6. Conclusions
Based on the 2000–2020 land-use data of the Zhangye area, this study analyzes its ERI and conducts a driving force study and draws the following conclusions:
- (1)
- Between 2000 and 2020, various land types in the Zhangye area of the HRB changed significantly, and the landscape pattern as a whole showed an increasing degree of fragmentation and a decreasing trend of aggregation.
- (2)
- The distribution of the ERI of the Zhangye area counties and districts has obvious differences, and the whole shows the distribution pattern of a low ecological risk level in the central area and a high level in the peripheral area. At the same time, the ecological risk level of the region changed from low to high in the period of 2000–2010 and from high to low in the period of 2010–2020. It can be seen that the rising awareness of ecological protection and the strengthening of ecological control in the second time period have an important influence on the reduction in the ERI.
- (3)
- In the driving force analysis, the degree of human disturbance was the main driving factor affecting the spatial differentiation of ecological risk in Zhangye, followed by the Normalized Vegetation Index factor, while the slope factor had the least driving force. At the same time, each factor presents a stronger driving force than a single factor driving force after interaction, which is a two-factor or nonlinear enhancement, in which the driving force of human interference degree factor after interaction with each factor is significant, indicating that human activities are the dominant factor influencing the ecological spatial differentiation in the Zhangye area.
- (4)
- In view of the distribution characteristics of the landscape and ecological risks in the Zhangye area, this study proposes strategies for control in the central area and governance in the peripheral area, divides the area into the central strict control area and the peripheral key control area, and puts forward targeted control strategies for each control area, which will help to articulate with the subsequent territorial spatial planning of the Zhangye area and make clear directions and focuses for the ecological governance and control in the area.
Author Contributions
Conceptualization, J.L. and X.T.; methodology, J.L.; software, J.L.; validation, X.T. and Z.C.; formal analysis, J.L.; resources, J.L.; data curation, J.L.; writing—original draft preparation, J.L. and X.T.; writing—review and editing, Z.C. and X.W.; visualization, J.L. and X.T.; supervision, Z.C. and X.W.; funding acquisition, X.T. and X.W. All authors have read and agreed to the published version of the manuscript.
Funding
This research was funded by the National Natural Science Foundation of China Project (Grant No. 52068040) and the Outstanding Postgraduate Project in Gansu Province (Grant No. 2023CXZX-575).
Data Availability Statement
Not applicable.
Acknowledgments
Thanks to all experts for their help in the building of the model in this study. All individuals included in this section have consented to the acknowledgment.
Conflicts of Interest
The authors declare no conflict of interest.
References
- China National Remote Sensing Center. Global Ecological Remote Sensing Detection Report. Available online: http://www.chinageoss.cn/geoarc/,2022/,2023-01-17/2021-12-20 (accessed on 20 April 2023).
- Ministry of Ecology and Environment of China. China Ecological Environment Status Bulletin. Available online: https://www.mee.gov.cn/hjzl/,2023-05-24/2022-05-26 (accessed on 20 April 2023).
- Na, L.; Zhao, Y.; Feng, C.C.; Guo, L. Regional ecological risk assessment based on multi-scenario simulation of land use changes and ecosystem service values in Inner Mongolia, China. Ecol. Indic. 2023, 155, 111013. [Google Scholar] [CrossRef]
- Xu, X.; Lin, H.; Fu, Z. Probe into the method of regional ecological risk assessment—A case study of wetland in the Yellow River Delta in China. J. Environ. Manag. 2004, 70, 253–262. [Google Scholar] [CrossRef]
- Serveiss, V.B. Applying Ecological Risk Principles to Watershed Assessment and Management. Environ. Manag. 2002, 29, 145–154. [Google Scholar] [CrossRef]
- Wang, K.; Zheng, H.; Zhao, X.; Sang, Z.; Yan, W.; Cai, Z.; Xu, Y.; Zhang, F. Landscape ecological risk assessment of the Hailar River basin based on ecosystem services in China. Ecol. Indic. 2023, 147, 109795. [Google Scholar] [CrossRef]
- Liang, T.; Yang, F.; Huang, D.; Luo, Y.; Wu, Y.; Wen, C. Land-use transformation and landscape ecological risk assessment in the Three Gorges Reservoir region based on the “production–living–ecological space” Perspective. Land 2022, 11, 1234. [Google Scholar] [CrossRef]
- Liu, Y.-W.; Li, J.-K.; Xia, J.; Hao, G.-R.; Teo, F.-Y. Risk assessment of non-point source pollution based on landscape pattern in the Hanjiang River basin, China. Environ. Sci. Pollut. Res. 2021, 28, 64322–64336. [Google Scholar] [CrossRef]
- Ma, B.; Wu, C.; Ding, F.; Zhou, Z. Predicting basin water quality using source-sink landscape distribution metrics in the Danjiangkou Reservoir of China. Ecol. Indic. 2021, 127, 107697. [Google Scholar] [CrossRef]
- Li, S.; He, W.; Wang, L.; Zhang, Z.; Chen, X.; Lei, T.; Wang, S.; Wang, Z. Optimization of landscape pattern in China Luojiang Xiaoxi basin based on landscape ecological risk assessment. Ecol. Indic. 2023, 146, 109887. [Google Scholar] [CrossRef]
- Gong, J.; Cao, E.; Xie, Y.; Xu, C.; Li, H.; Yan, L. Integrating ecosystem services and landscape ecological risk into adaptive management: Insights from a western mountain-basin area, China. J. Environ. Manag. 2021, 281, 111817. [Google Scholar] [CrossRef]
- Zhang, Z.; Liu, S.; Dong, S. Ecological Security Assessment of Yuan River Watershed Based on Landscape Pattern and Soil Erosion. Procedia Environ. Sci. 2010, 2, 613–618. [Google Scholar] [CrossRef]
- Zhang, X.; Du, H.; Wang, Y.; Chen, Y.; Ma, L.; Dong, T. Watershed landscape ecological risk assessment and landscape pattern optimization: Take Fujiang River Basin as an example. Hum. Ecol. Risk Assess. Int. J. 2021, 27, 2254–2276. [Google Scholar] [CrossRef]
- Li, X.; Cheng, G.; Ge, Y.; Li, H.; Han, F.; Hu, X.; Tian, W.; Tian, Y.; Pan, X.; Nian, Y.; et al. Hydrological Cycle in the Heihe River Basin and Its Implication for Water Resource Management in Endorheic Basins. J. Geophys. Res. Atmos. 2018, 123, 890–914. [Google Scholar] [CrossRef]
- Xiao, X.; Fan, L.; Li, X.; Tan, M.; Jiang, T.; Zheng, L.; Jiang, F. Water-Use Efficiency of Crops in the Arid Area of the Middle Reaches of the Heihe River: Taking Zhangye City as an Example. Water 2019, 11, 1541. [Google Scholar] [CrossRef]
- Wang, C.; Jiang, Q.; Shao, Y.; Sun, S.; Xiao, L.; Guo, J. Ecological environment assessment based on land use simulation: A case study in the Heihe River Basin. Sci. Total Environ. 2019, 697, 133928. [Google Scholar] [CrossRef]
- Reddy, C.S.; Sreelekshmi, S.; Jha, C.; Dadhwal, V. National assessment of forest fragmentation in India: Landscape indices as measures of the effects of fragmentation and forest cover change. Ecol. Eng. 2013, 60, 453–464. [Google Scholar] [CrossRef]
- Xu, W.; Wang, J.; Zhang, M.; Li, S. Construction of landscape ecological network based on landscape ecological risk assessment in a large-scale opencast coal mine area. J. Clean. Prod. 2021, 286, 125523. [Google Scholar] [CrossRef]
- Li, J.; Pu, R.; Gong, H.; Luo, X.; Ye, M.; Feng, B. Evolution Characteristics of Landscape Ecological Risk Patterns in Coastal Zones in Zhejiang Province, China. Sustainability 2017, 9, 584. [Google Scholar] [CrossRef]
- Li, W.; Wang, Y.; Xie, S.; Sun, R.; Cheng, X. Impacts of landscape multifunctionality change on landscape ecological risk in a megacity, China: A case study of Beijing. Ecol. Indic. 2020, 117, 106681. [Google Scholar] [CrossRef]
- Deng, X.; Hu, S.; Zhan, C. Attribution of vegetation coverage change to climate change and human activities based on the geographic detectors in the Yellow River Basin, China. Environ. Sci. Pollut. Res. 2022, 29, 44693–44708. [Google Scholar] [CrossRef]
- Liu, C.; Li, W.; Zhu, G.; Zhou, H.; Yan, H.; Xue, P. Land Use/Land Cover Changes and Their Driving Factors in the Northeastern Tibetan Plateau Based on Geographical Detectors and Google Earth Engine: A Case Study in Gannan Prefecture. Remote Sens. 2020, 12, 3139. [Google Scholar] [CrossRef]
- Cao, F.; Ge, Y.; Wang, J.-F. Optimal discretization for geographical detectors-based risk assessment. GIScience Remote Sens. 2013, 50, 78–92. [Google Scholar] [CrossRef]
- Jiang, S.; Meng, J.; Zhu, L.; Cheng, H. Spatial-temporal pattern of land use conflict in China and its multilevel driving mechanisms. Sci. Total Environ. 2021, 801, 149697. [Google Scholar] [CrossRef]
- Qiao, F.; Bai, Y.; Xie, L.; Yang, X.; Sun, S. Spatio-Temporal Characteristics of Landscape Ecological Risks in the Ecological Functional Zone of the Upper Yellow River, China. Int. J. Environ. Res. Public Health 2021, 18, 12943. [Google Scholar] [CrossRef] [PubMed]
- Zhang, S.; Zhong, Q.; Cheng, D.; Xu, C.; Chang, Y.; Lin, Y.; Li, B. Coupling Coordination Analysis and Prediction of Landscape Ecological Risks and Ecosystem Services in the Min River Basin. Land 2022, 11, 222. [Google Scholar] [CrossRef]
- Lu, S.S.; Tang, X.; Guan, X.L.; Qin, F.; Liu, X.; Zhang, D.H. The assessment of forest ecological security and its determining indicators: A case study of the Yangtze River Economic Belt in China. J. Environ. Manag. 2020, 258, 110048. [Google Scholar] [CrossRef] [PubMed]
- Bai, Y.; Zhao, Z.; Weng, C.; Wang, W.; Hu, Y. Scenario-Based Analysis of Land Use Competition and Sustainable Land Development in Zhangye of the Heihe River Basin, China. Int. J. Environ. Res. Public Health 2021, 18, 10501. [Google Scholar] [CrossRef]
- Ma, K.; Wei, F. Ecological civilization: A revived perspective on the relationship between humanity and nature. Natl. Sci. Rev. 2021, 8, nwab112. [Google Scholar] [CrossRef]
- Ai, J.; Yu, K.; Zeng, Z.; Yang, L.; Liu, Y.; Liu, J. Assessing the dynamic landscape ecological risk and its driving forces in an island city based on optimal spatial scales: Haitan Island, China. Ecol. Indic. 2022, 137, 108771. [Google Scholar] [CrossRef]
- Shi, Y.; Feng, C.-C.; Yu, Q.; Han, R.; Guo, L. Contradiction or coordination? The spatiotemporal relationship between landscape ecological risks and urbanization from coupling perspectives in China. J. Clean. Prod. 2022, 363, 132557. [Google Scholar] [CrossRef]
- Wang, H.; Liu, X.; Zhao, C.; Chang, Y.; Liu, Y.; Zang, F. Spatial-temporal pattern analysis of landscape ecological risk assessment based on land use/land cover change in Baishuijiang National nature reserve in Gansu Province, China. Ecol. Indic. 2021, 124, 107454. [Google Scholar] [CrossRef]
- Karimian, H.; Zou, W.; Chen, Y.; Xia, J.; Wang, Z. Landscape ecological risk assessment and driving factor analysis in Dongjiang river watershed. Chemosphere 2022, 307, 135835. [Google Scholar] [CrossRef] [PubMed]
- Hu, Y.; Gong, J.; Li, X.; Song, L.; Zhang, Z.; Zhang, S.; Zhang, W.; Dong, J.; Dong, X. Ecological security assessment and ecological management zoning based on ecosystem services in the West Liao River Basin. Ecol. Eng. 2023, 192, 106973. [Google Scholar] [CrossRef]
- Cheng, X.; Zhang, Y.; Yang, G.; Nie, W.; Wang, Y.; Wang, J.; Xu, B. Landscape ecological risk assessment and influencing factor analysis of basins in suburban areas of large cities—A case study of the Fuchunjiang River Basin, China. Front. Ecol. Evol. 2023, 11, 1184273. [Google Scholar] [CrossRef]
Figure 1.
Study area.

Figure 2.
Study framework.
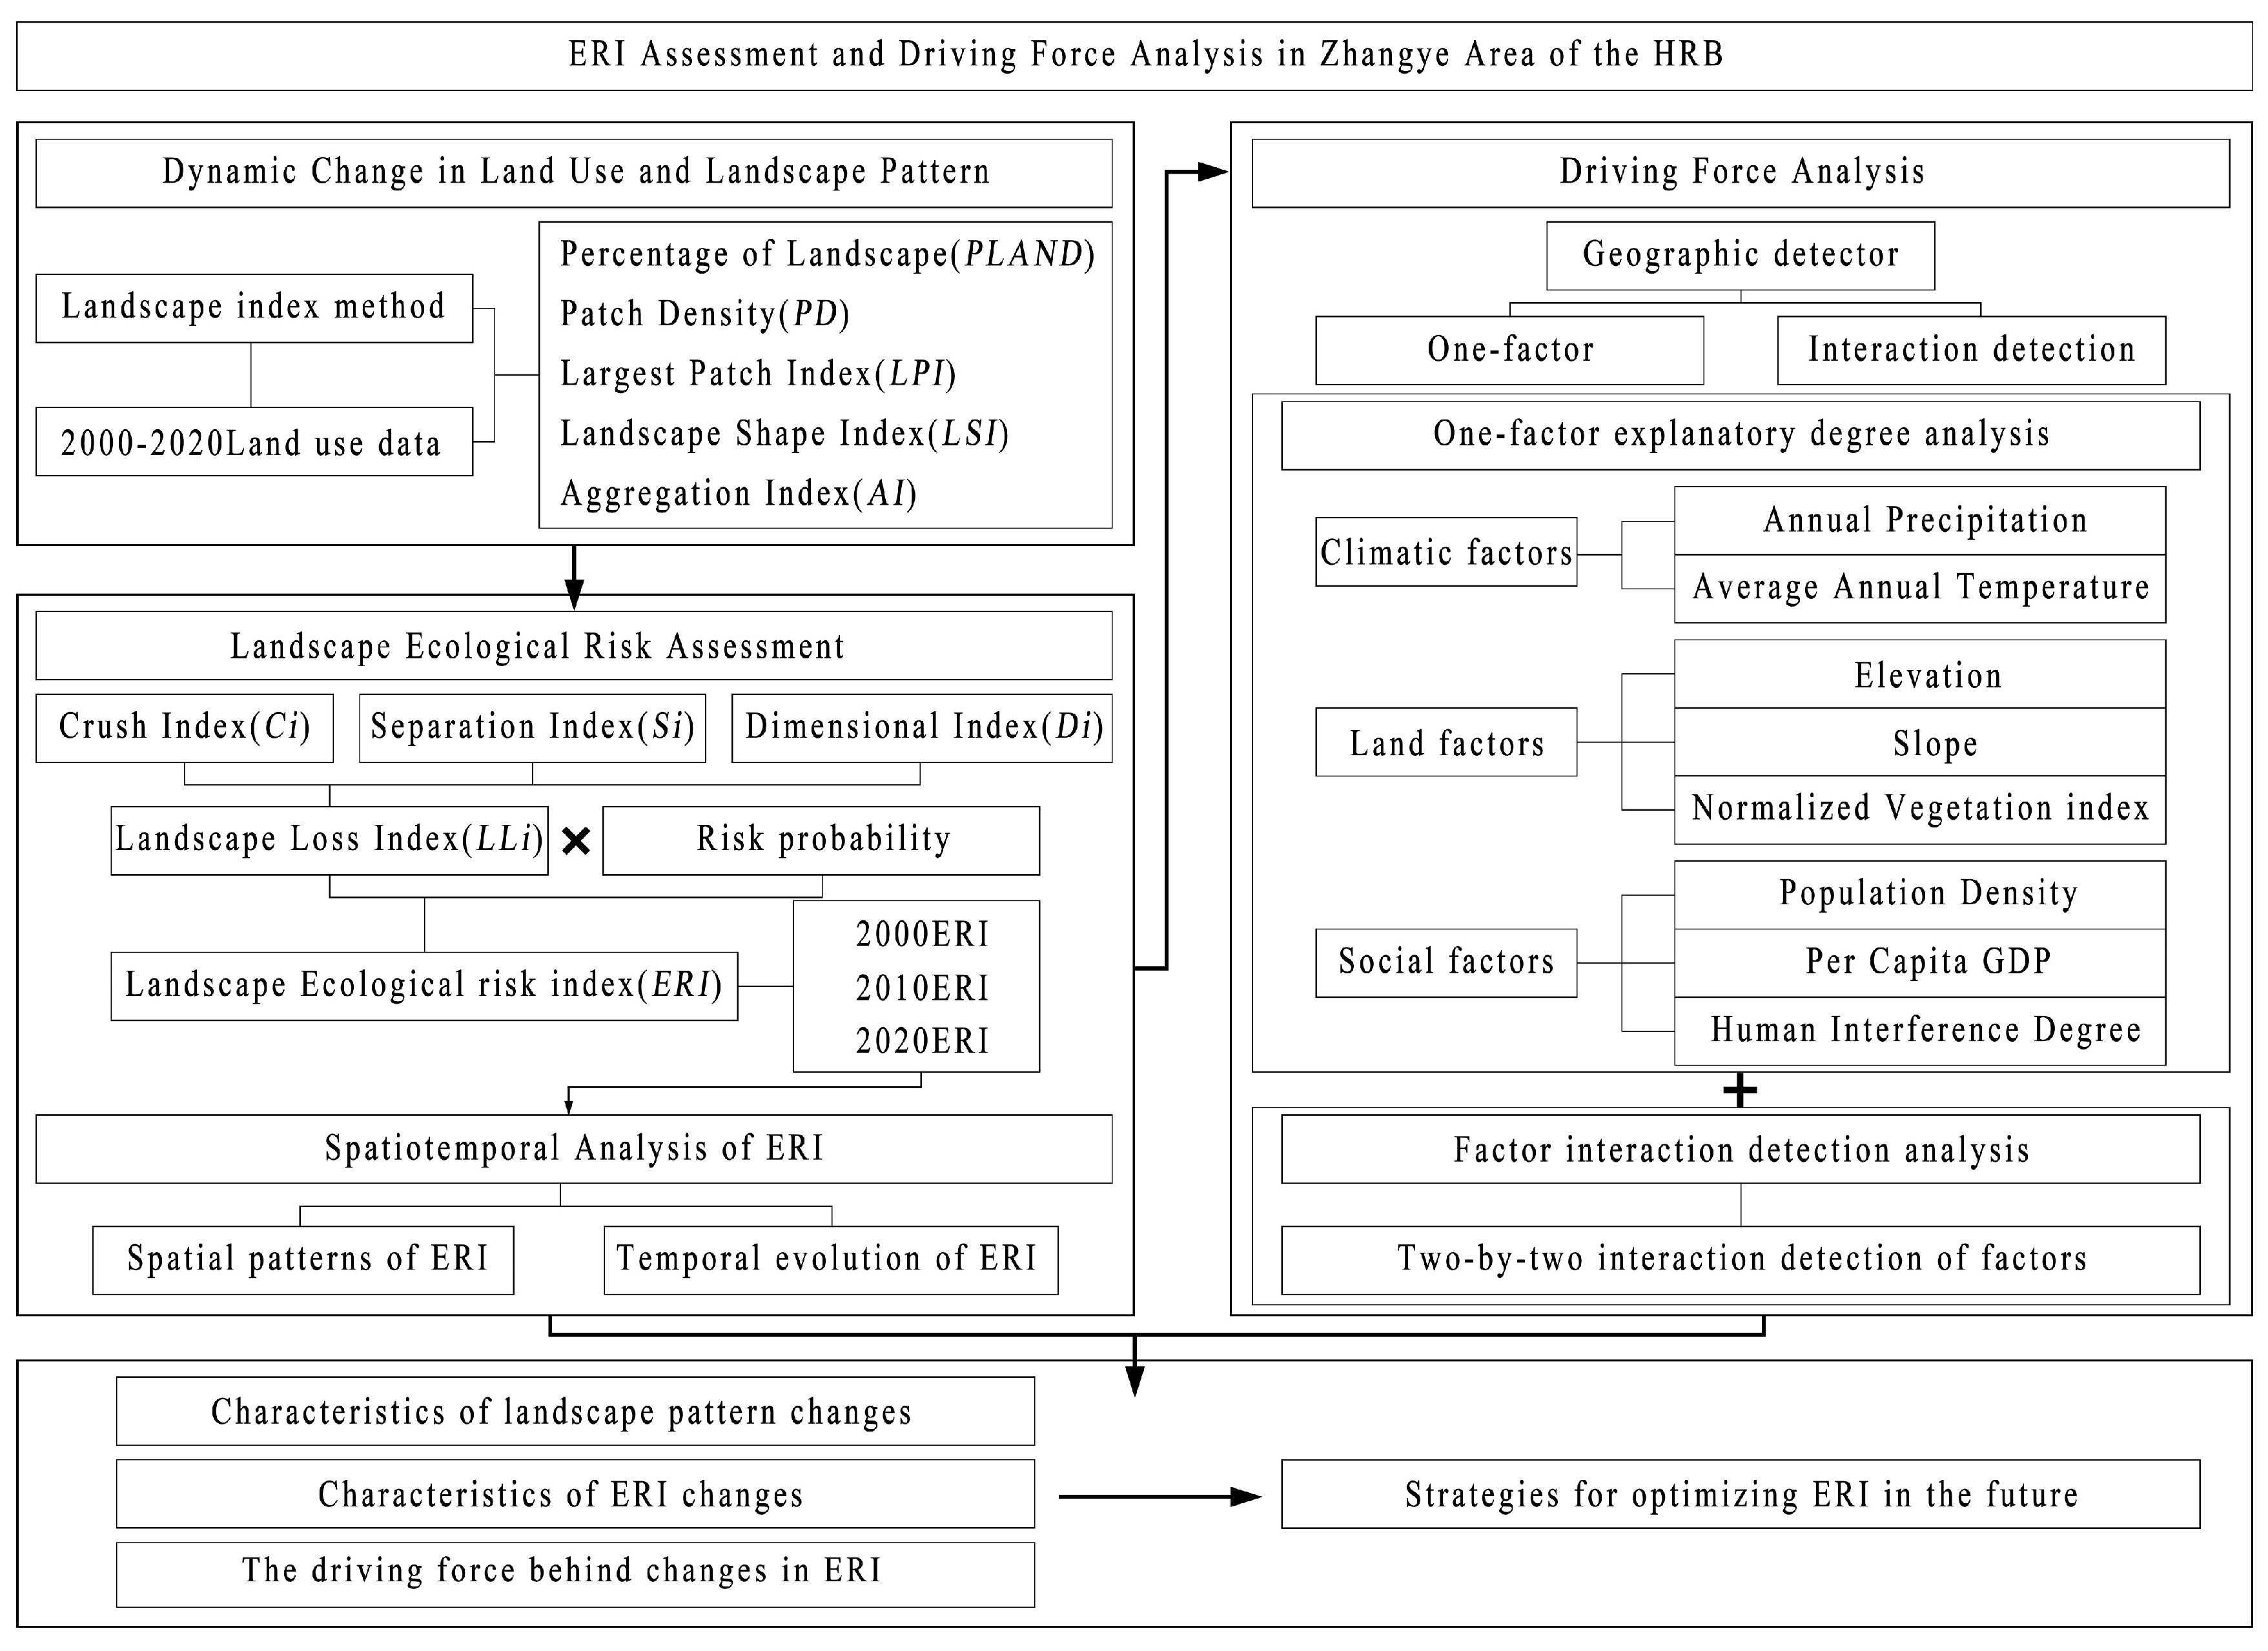
Figure 3.
Land use in the Zhangye area of the HRB from 2000 to 2020.
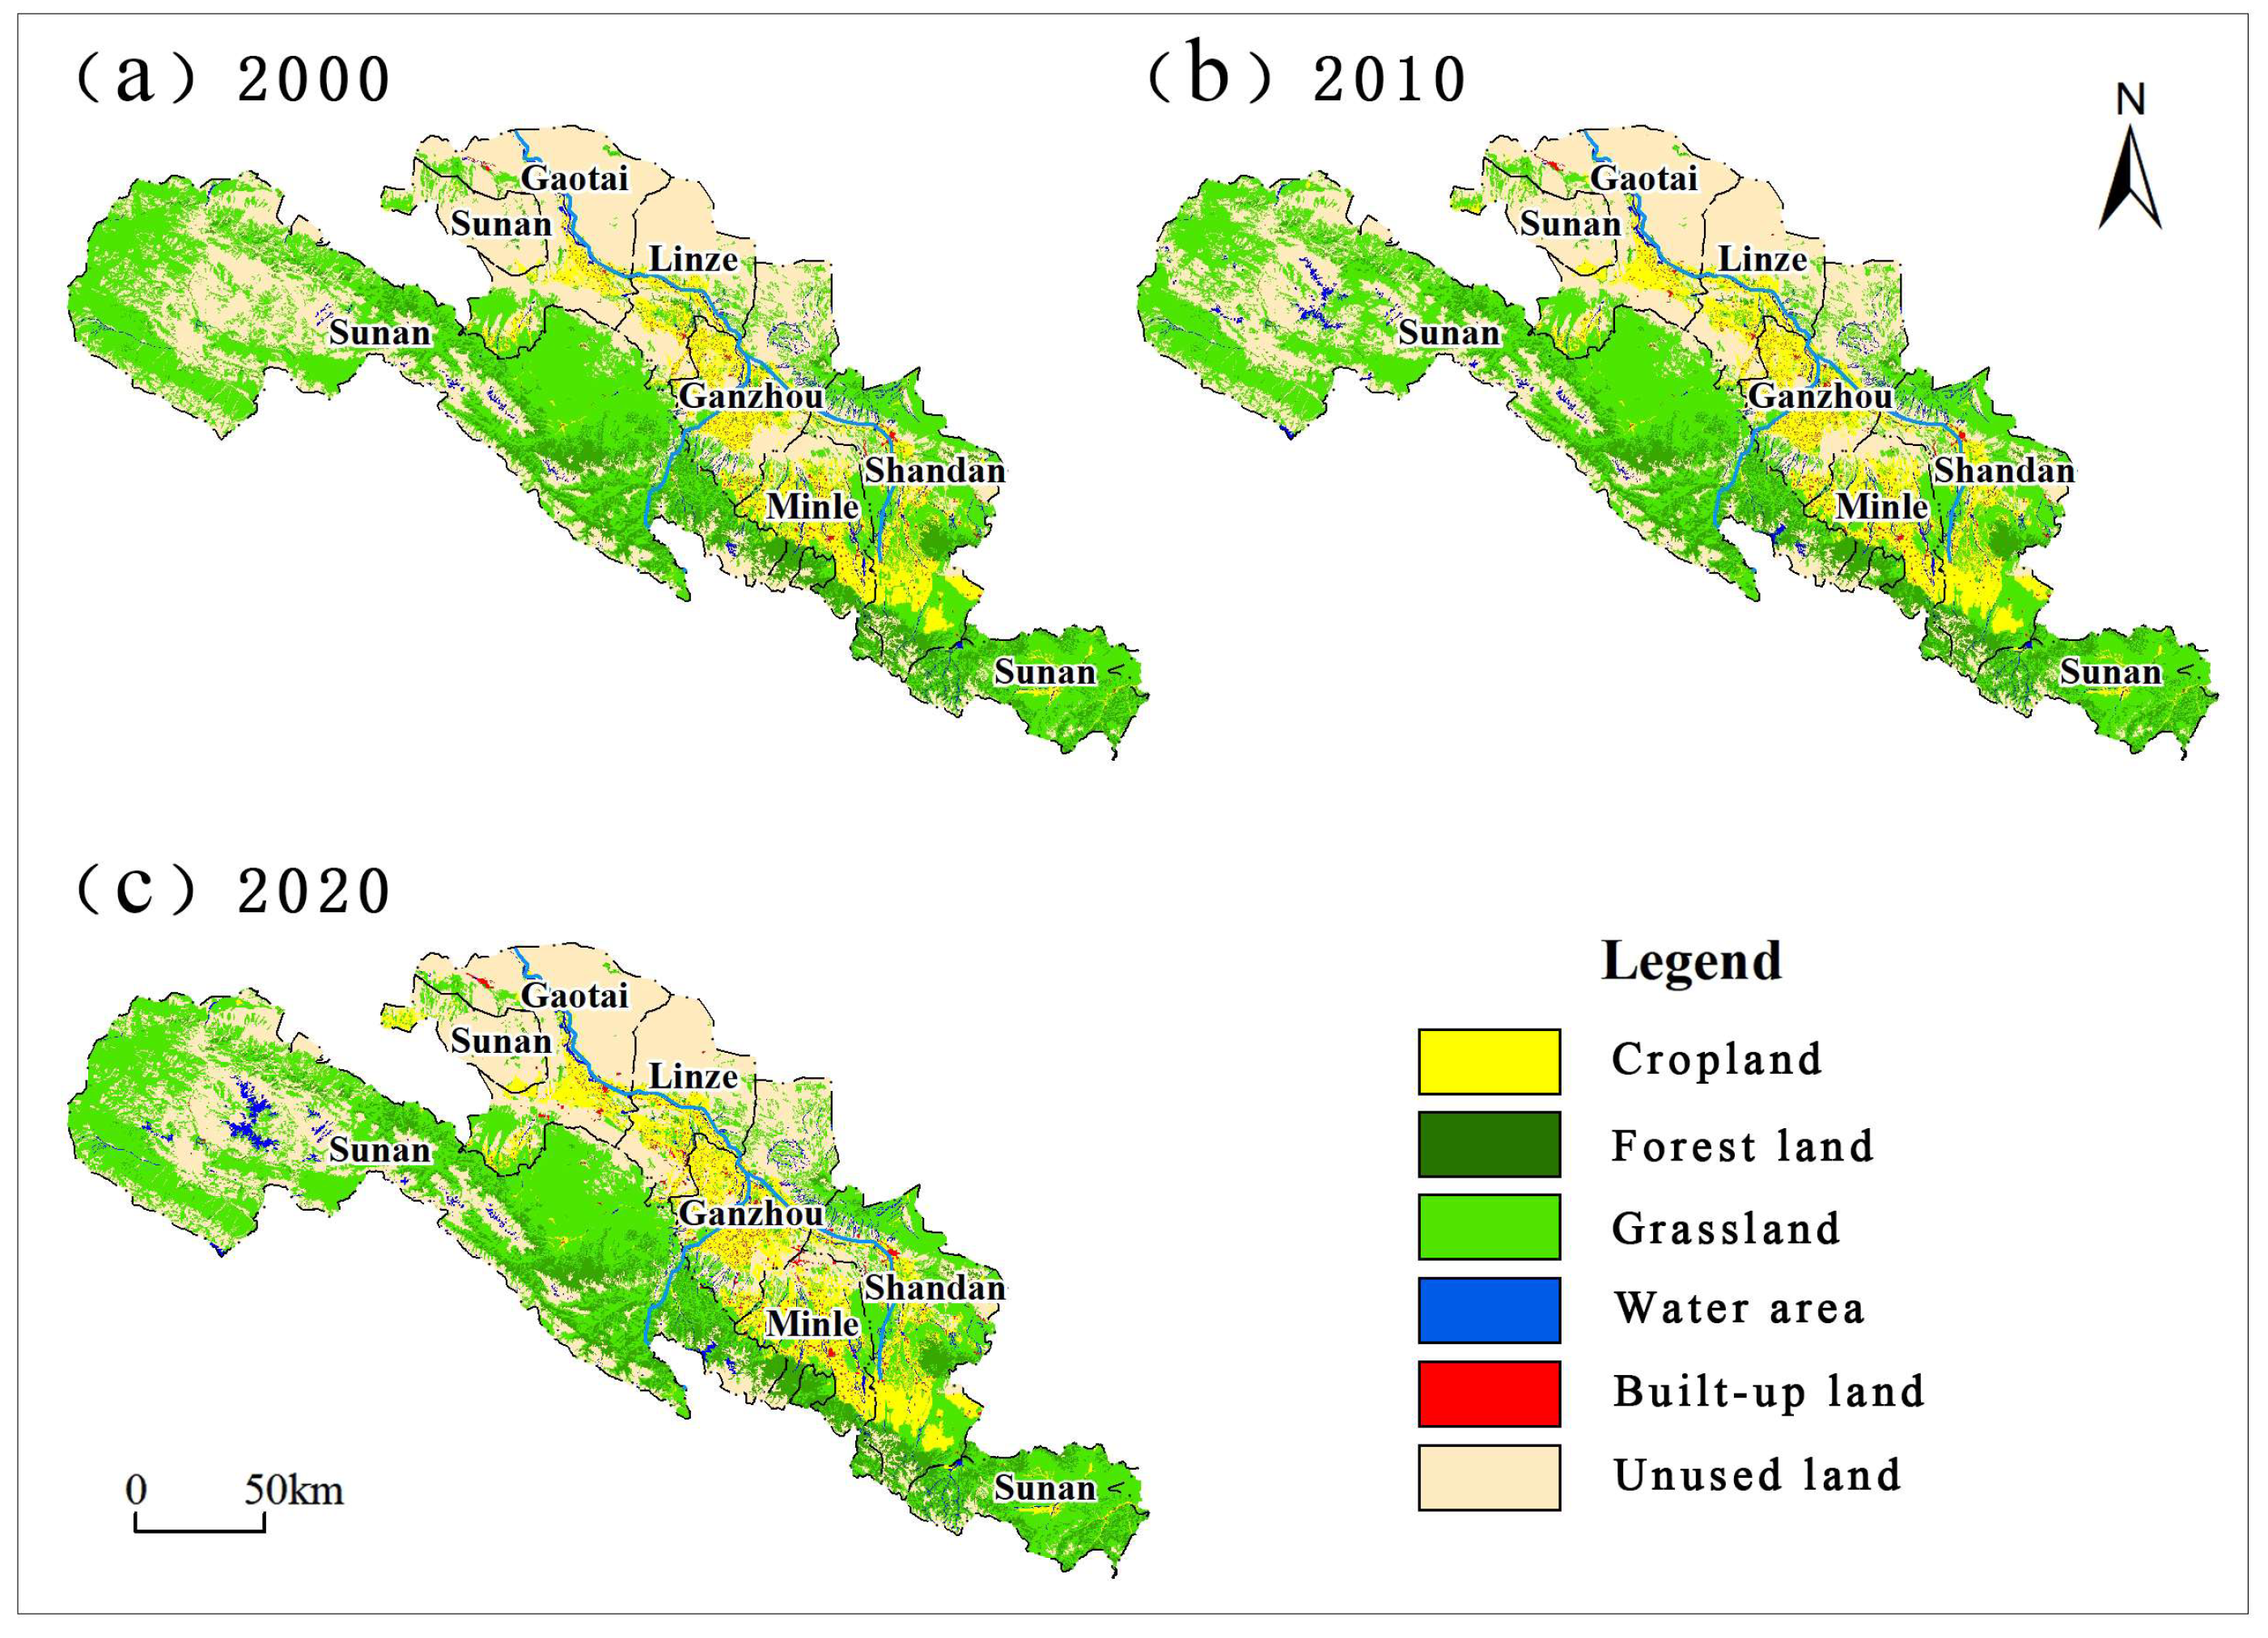
Figure 4.
Distribution of the ERI levels in the Zhangye area of the HRB.
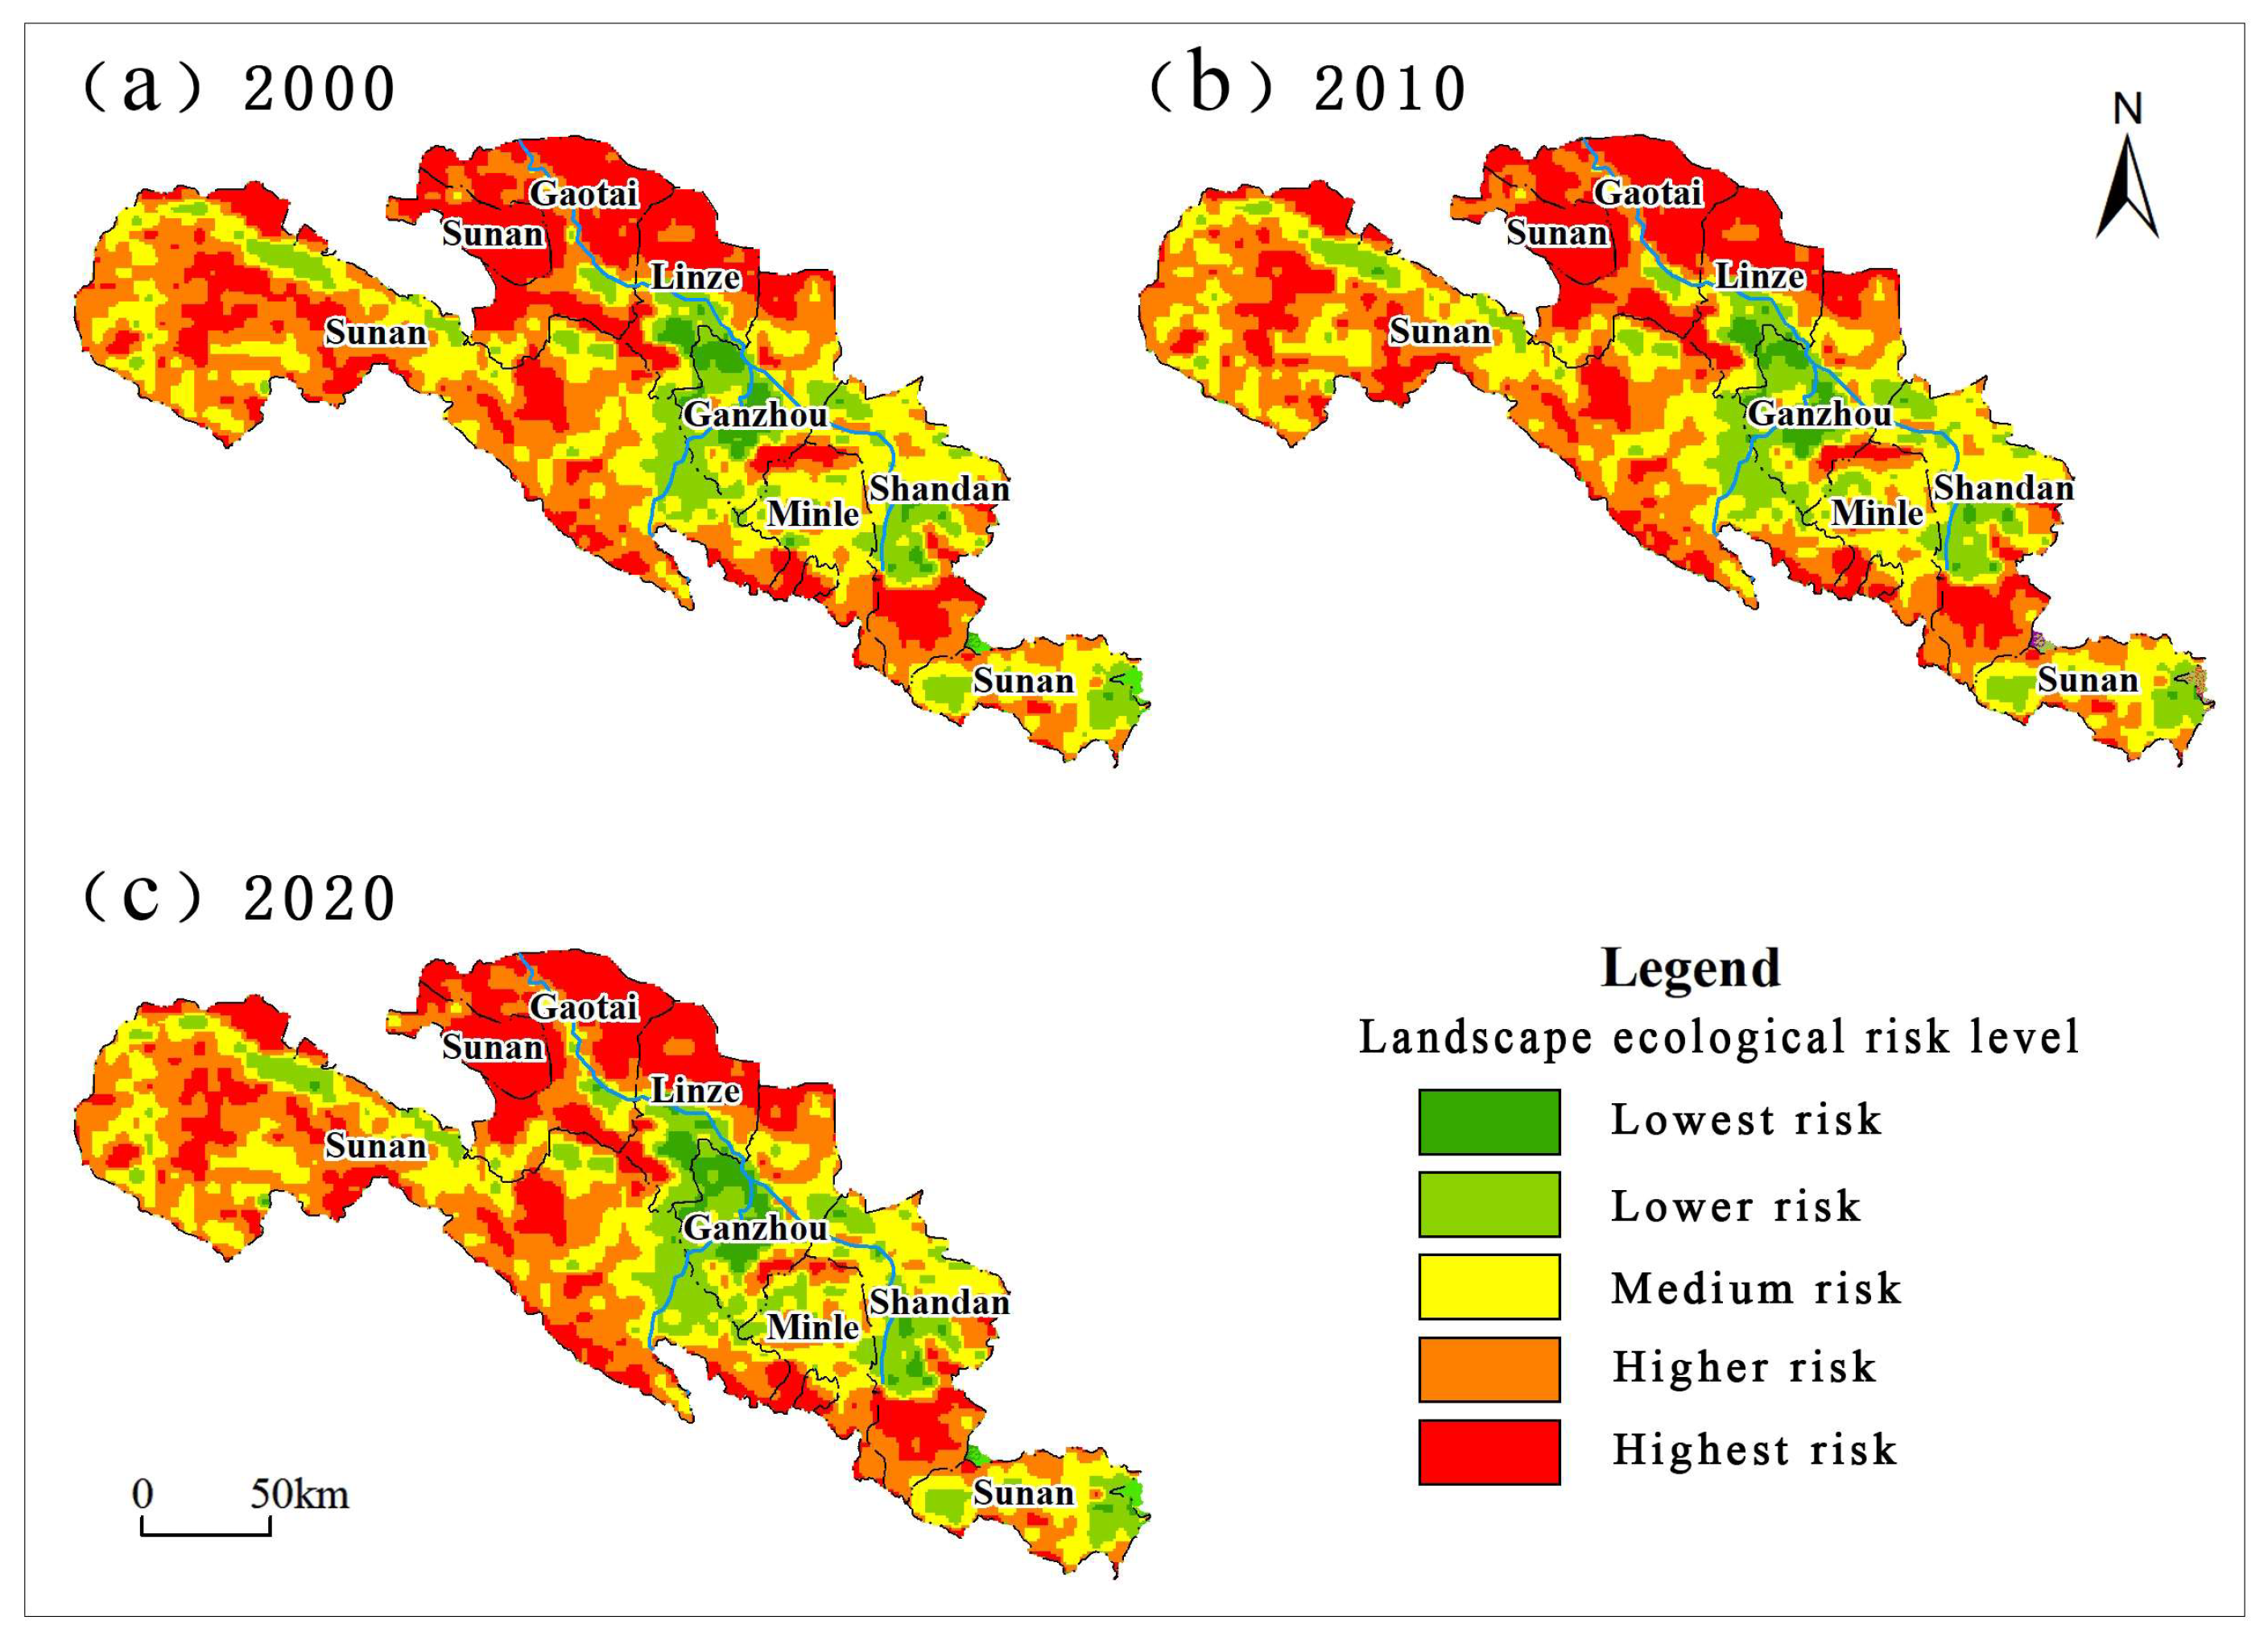
Figure 5.
The explanatory power of ERI factors in the Zhangye area of the HRB from 2000 to 2020.
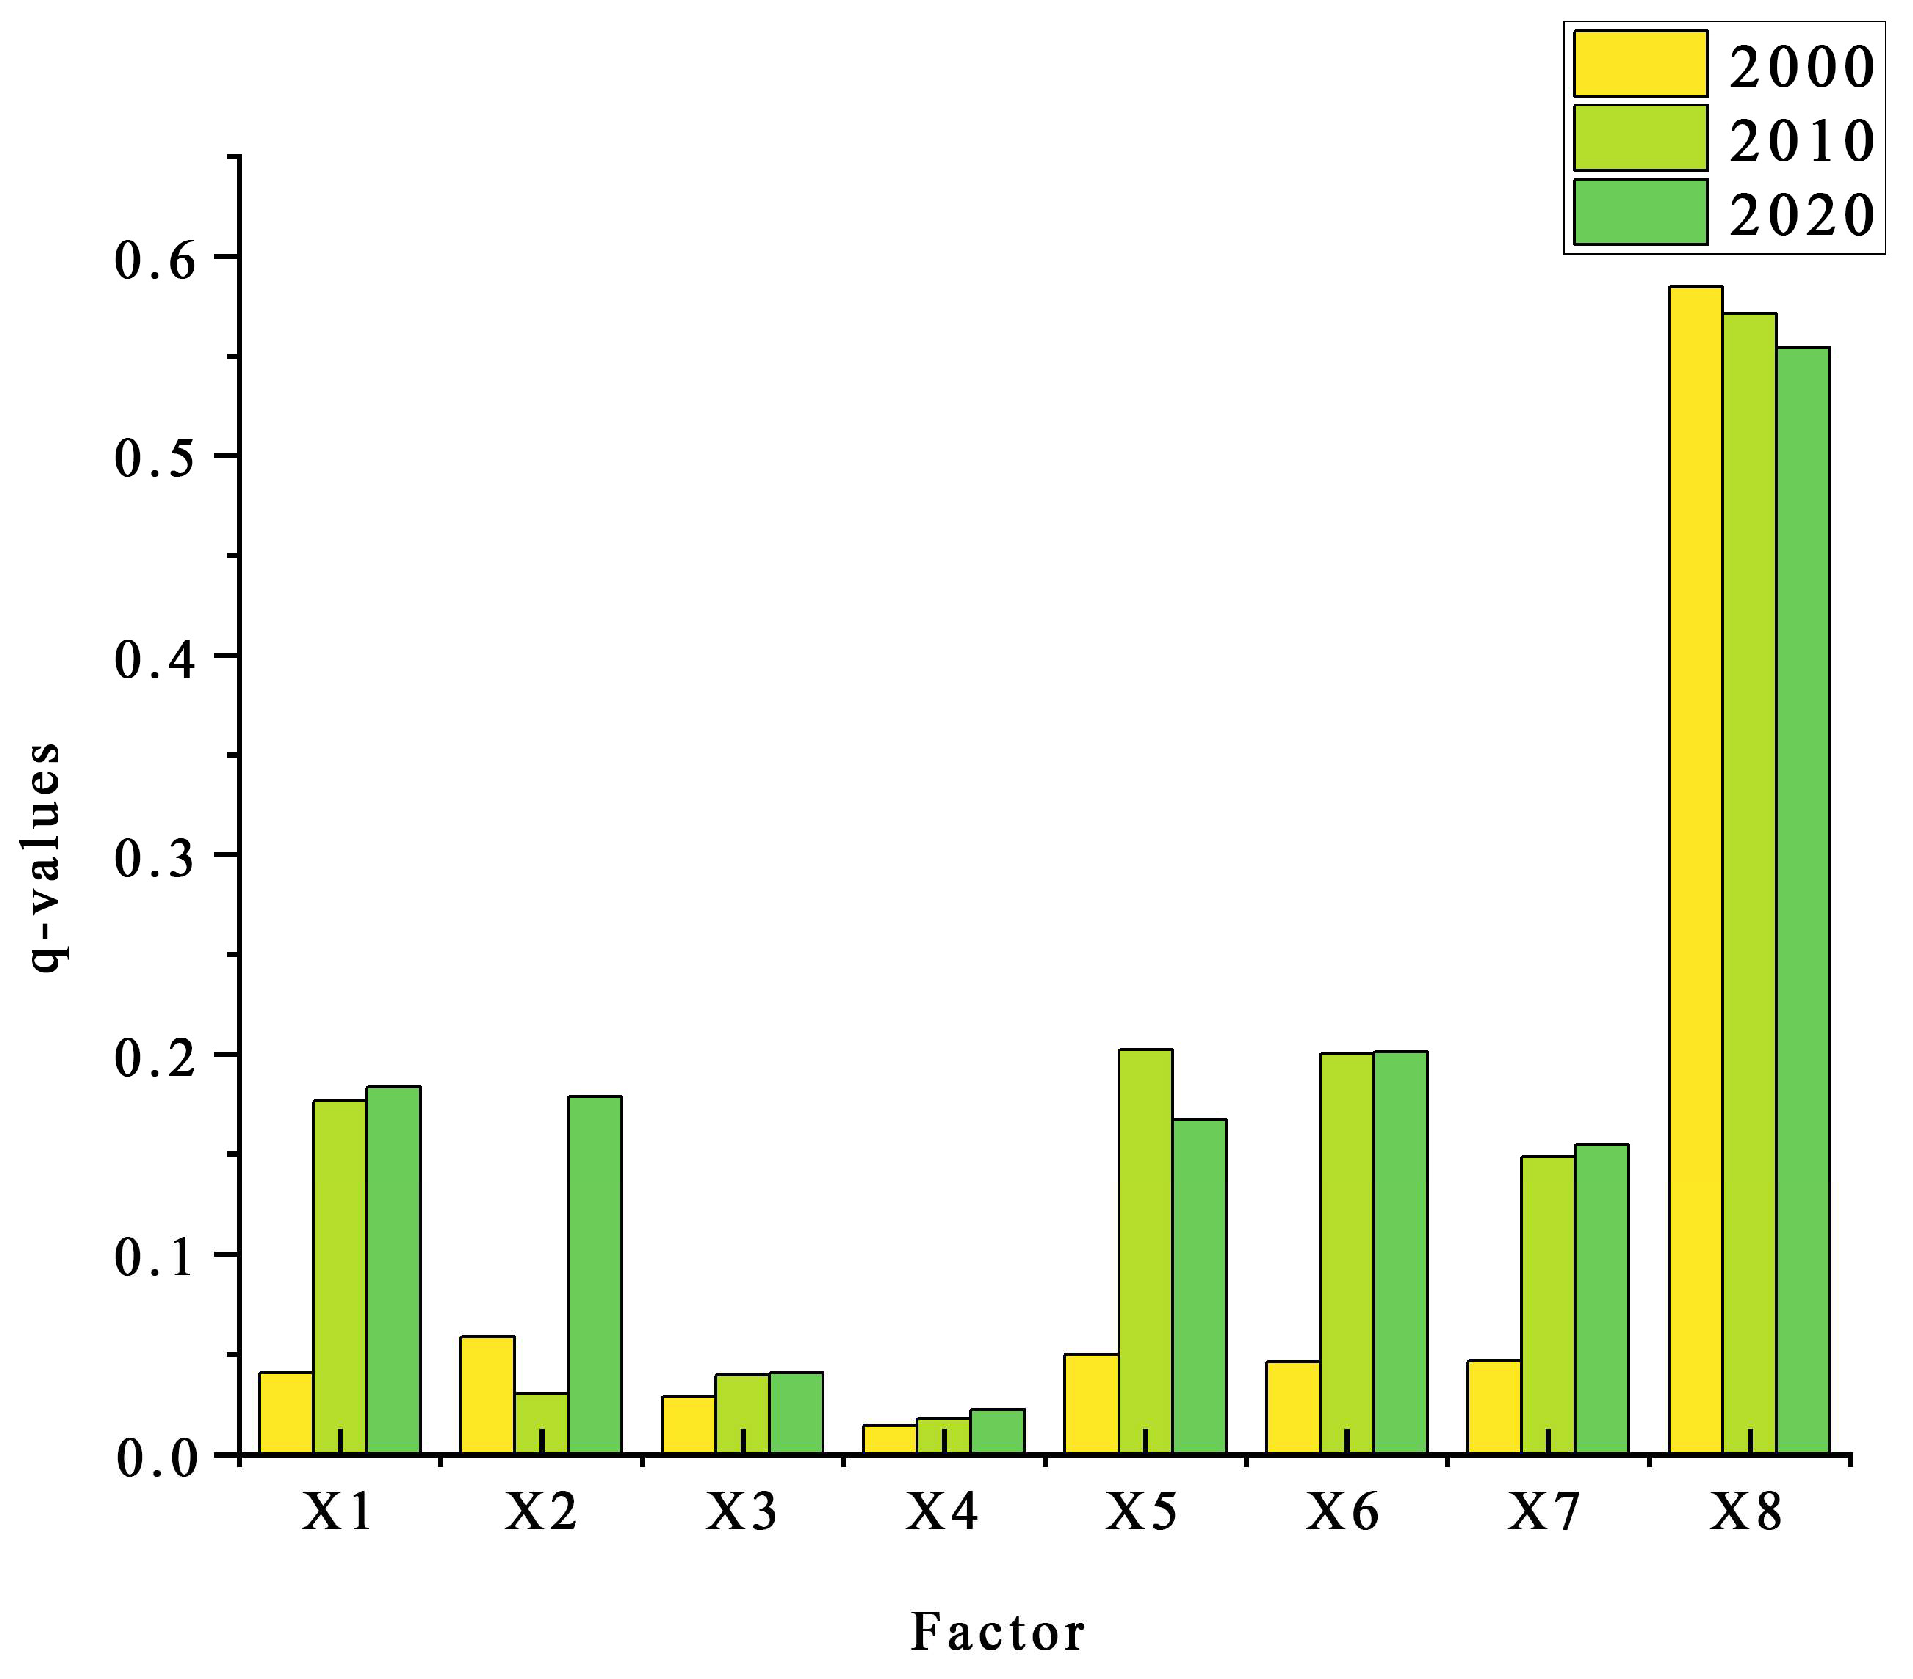
Figure 6.
Interaction detection results of ERI factors in the Zhangye area of the HRB from 2000 to 2010. Note: + stands for two-factor enhancement; * stands for nonlinear enhancement.
Figure 6.
Interaction detection results of ERI factors in the Zhangye area of the HRB from 2000 to 2010. Note: + stands for two-factor enhancement; * stands for nonlinear enhancement.
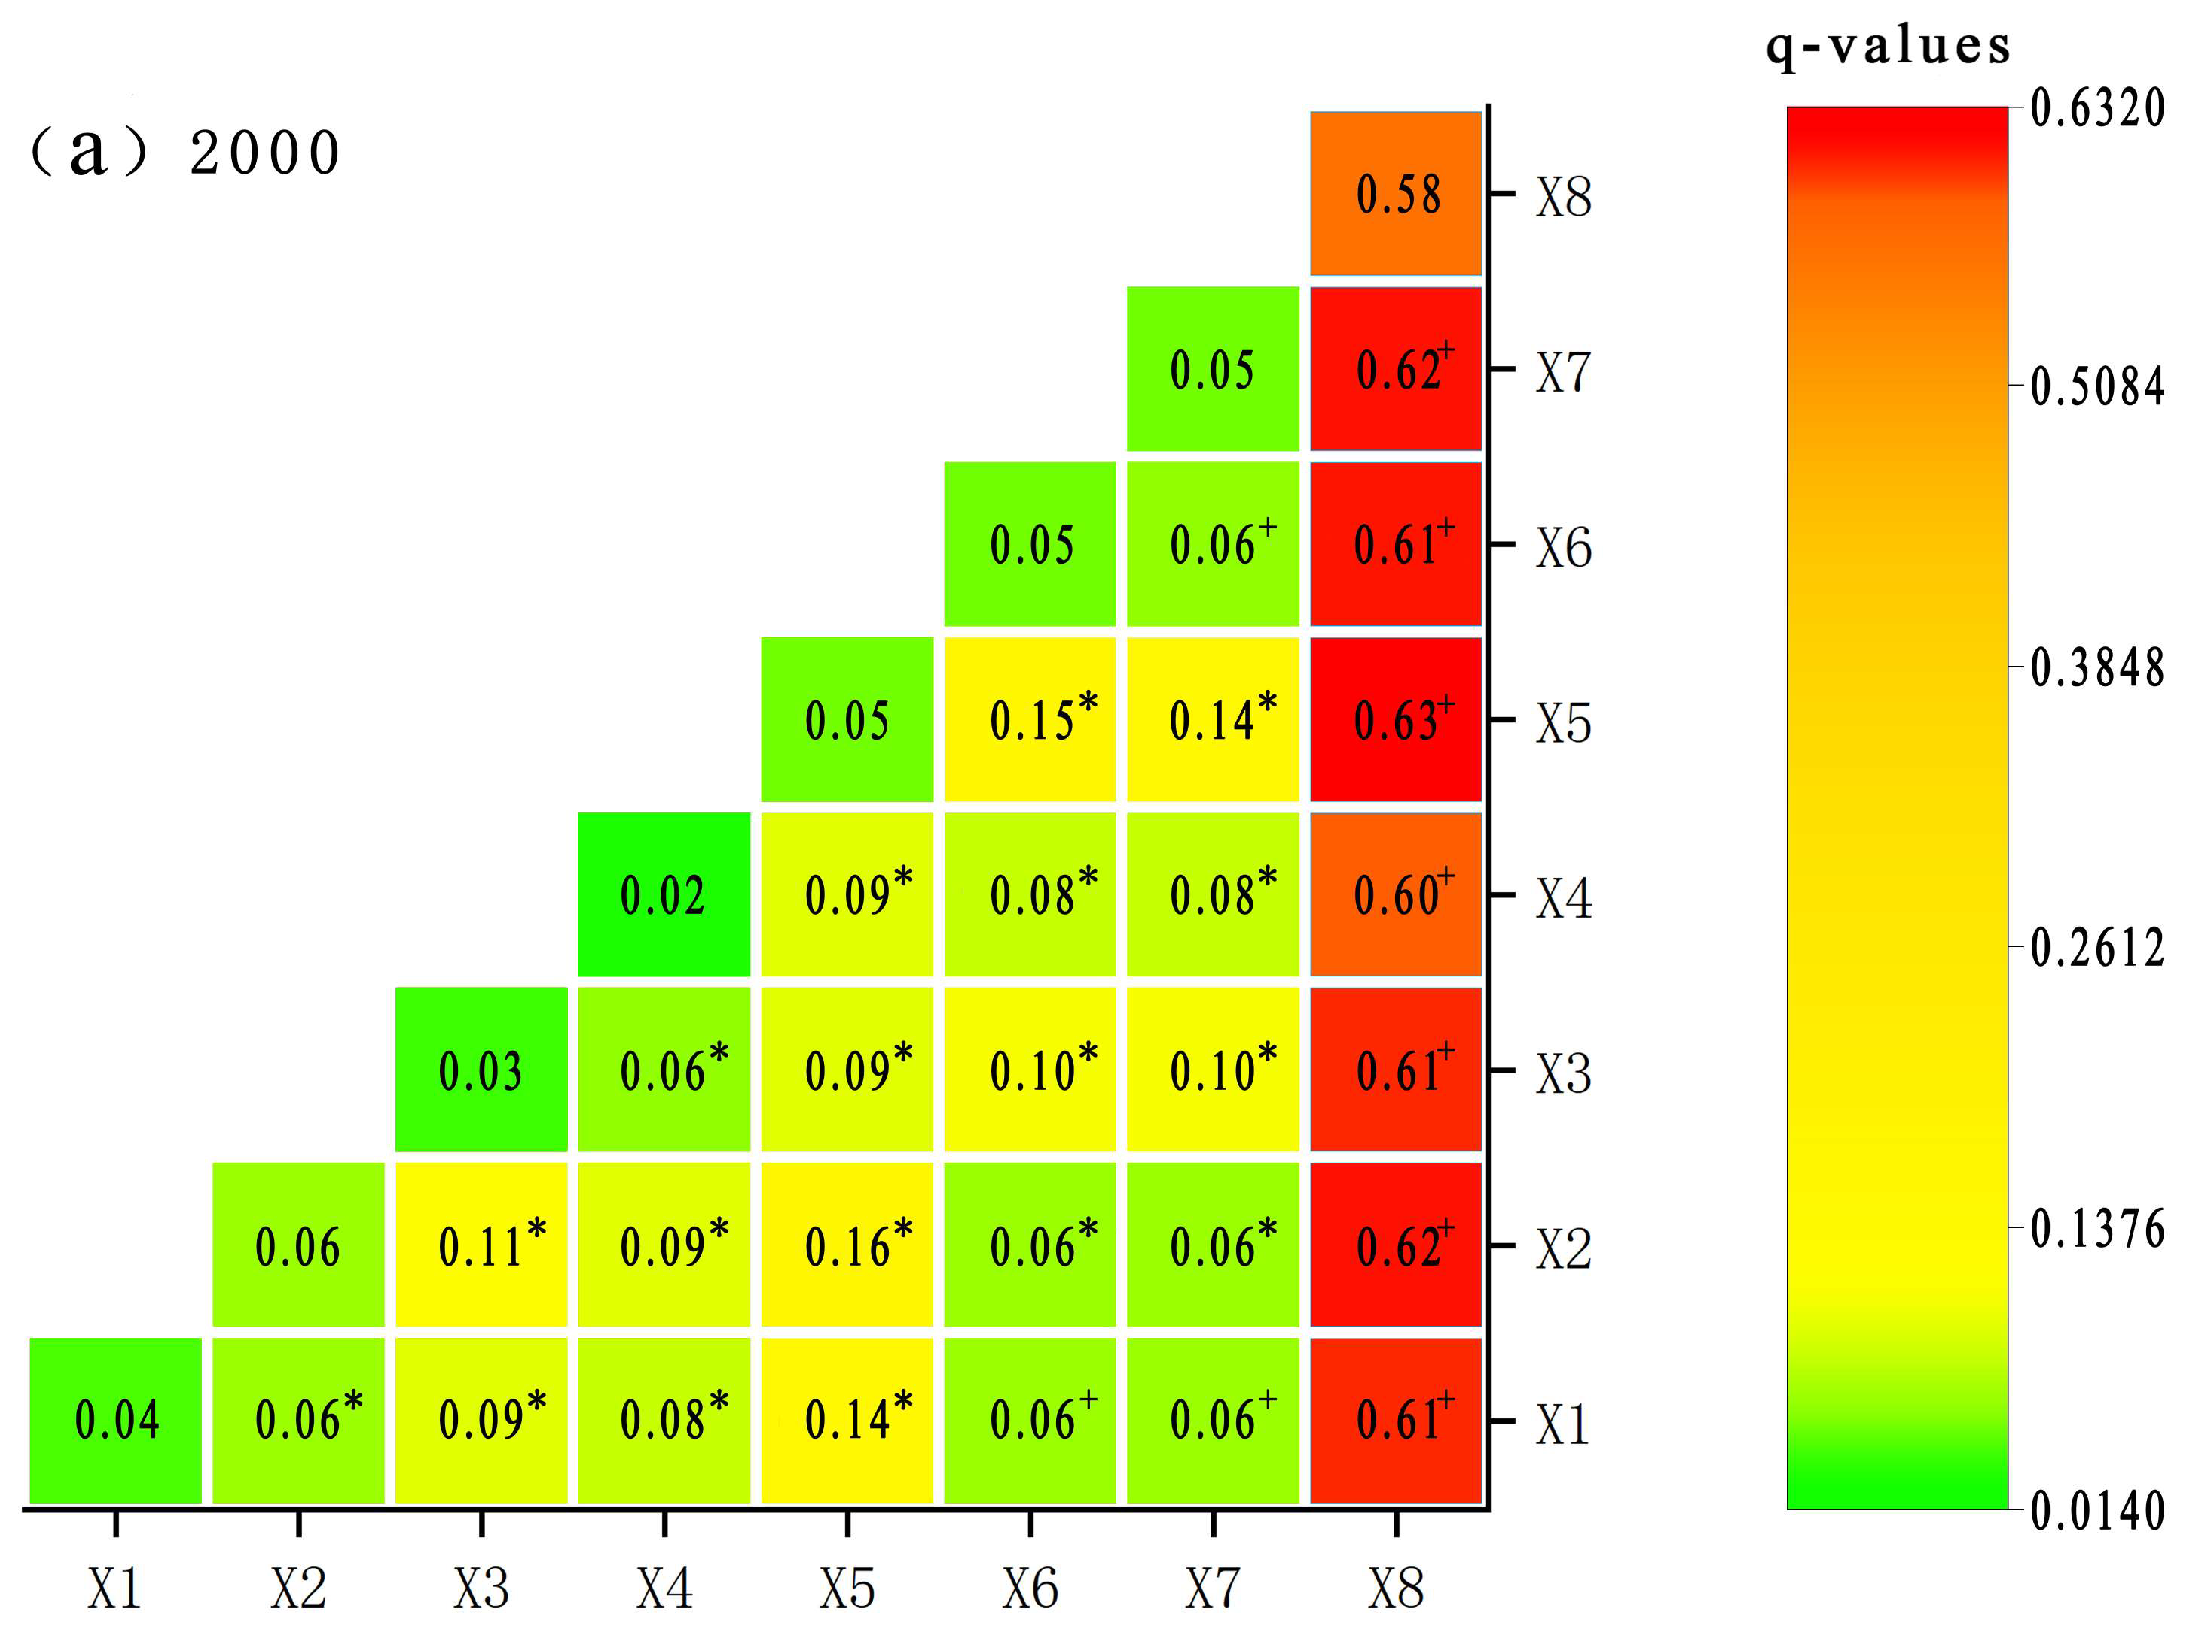
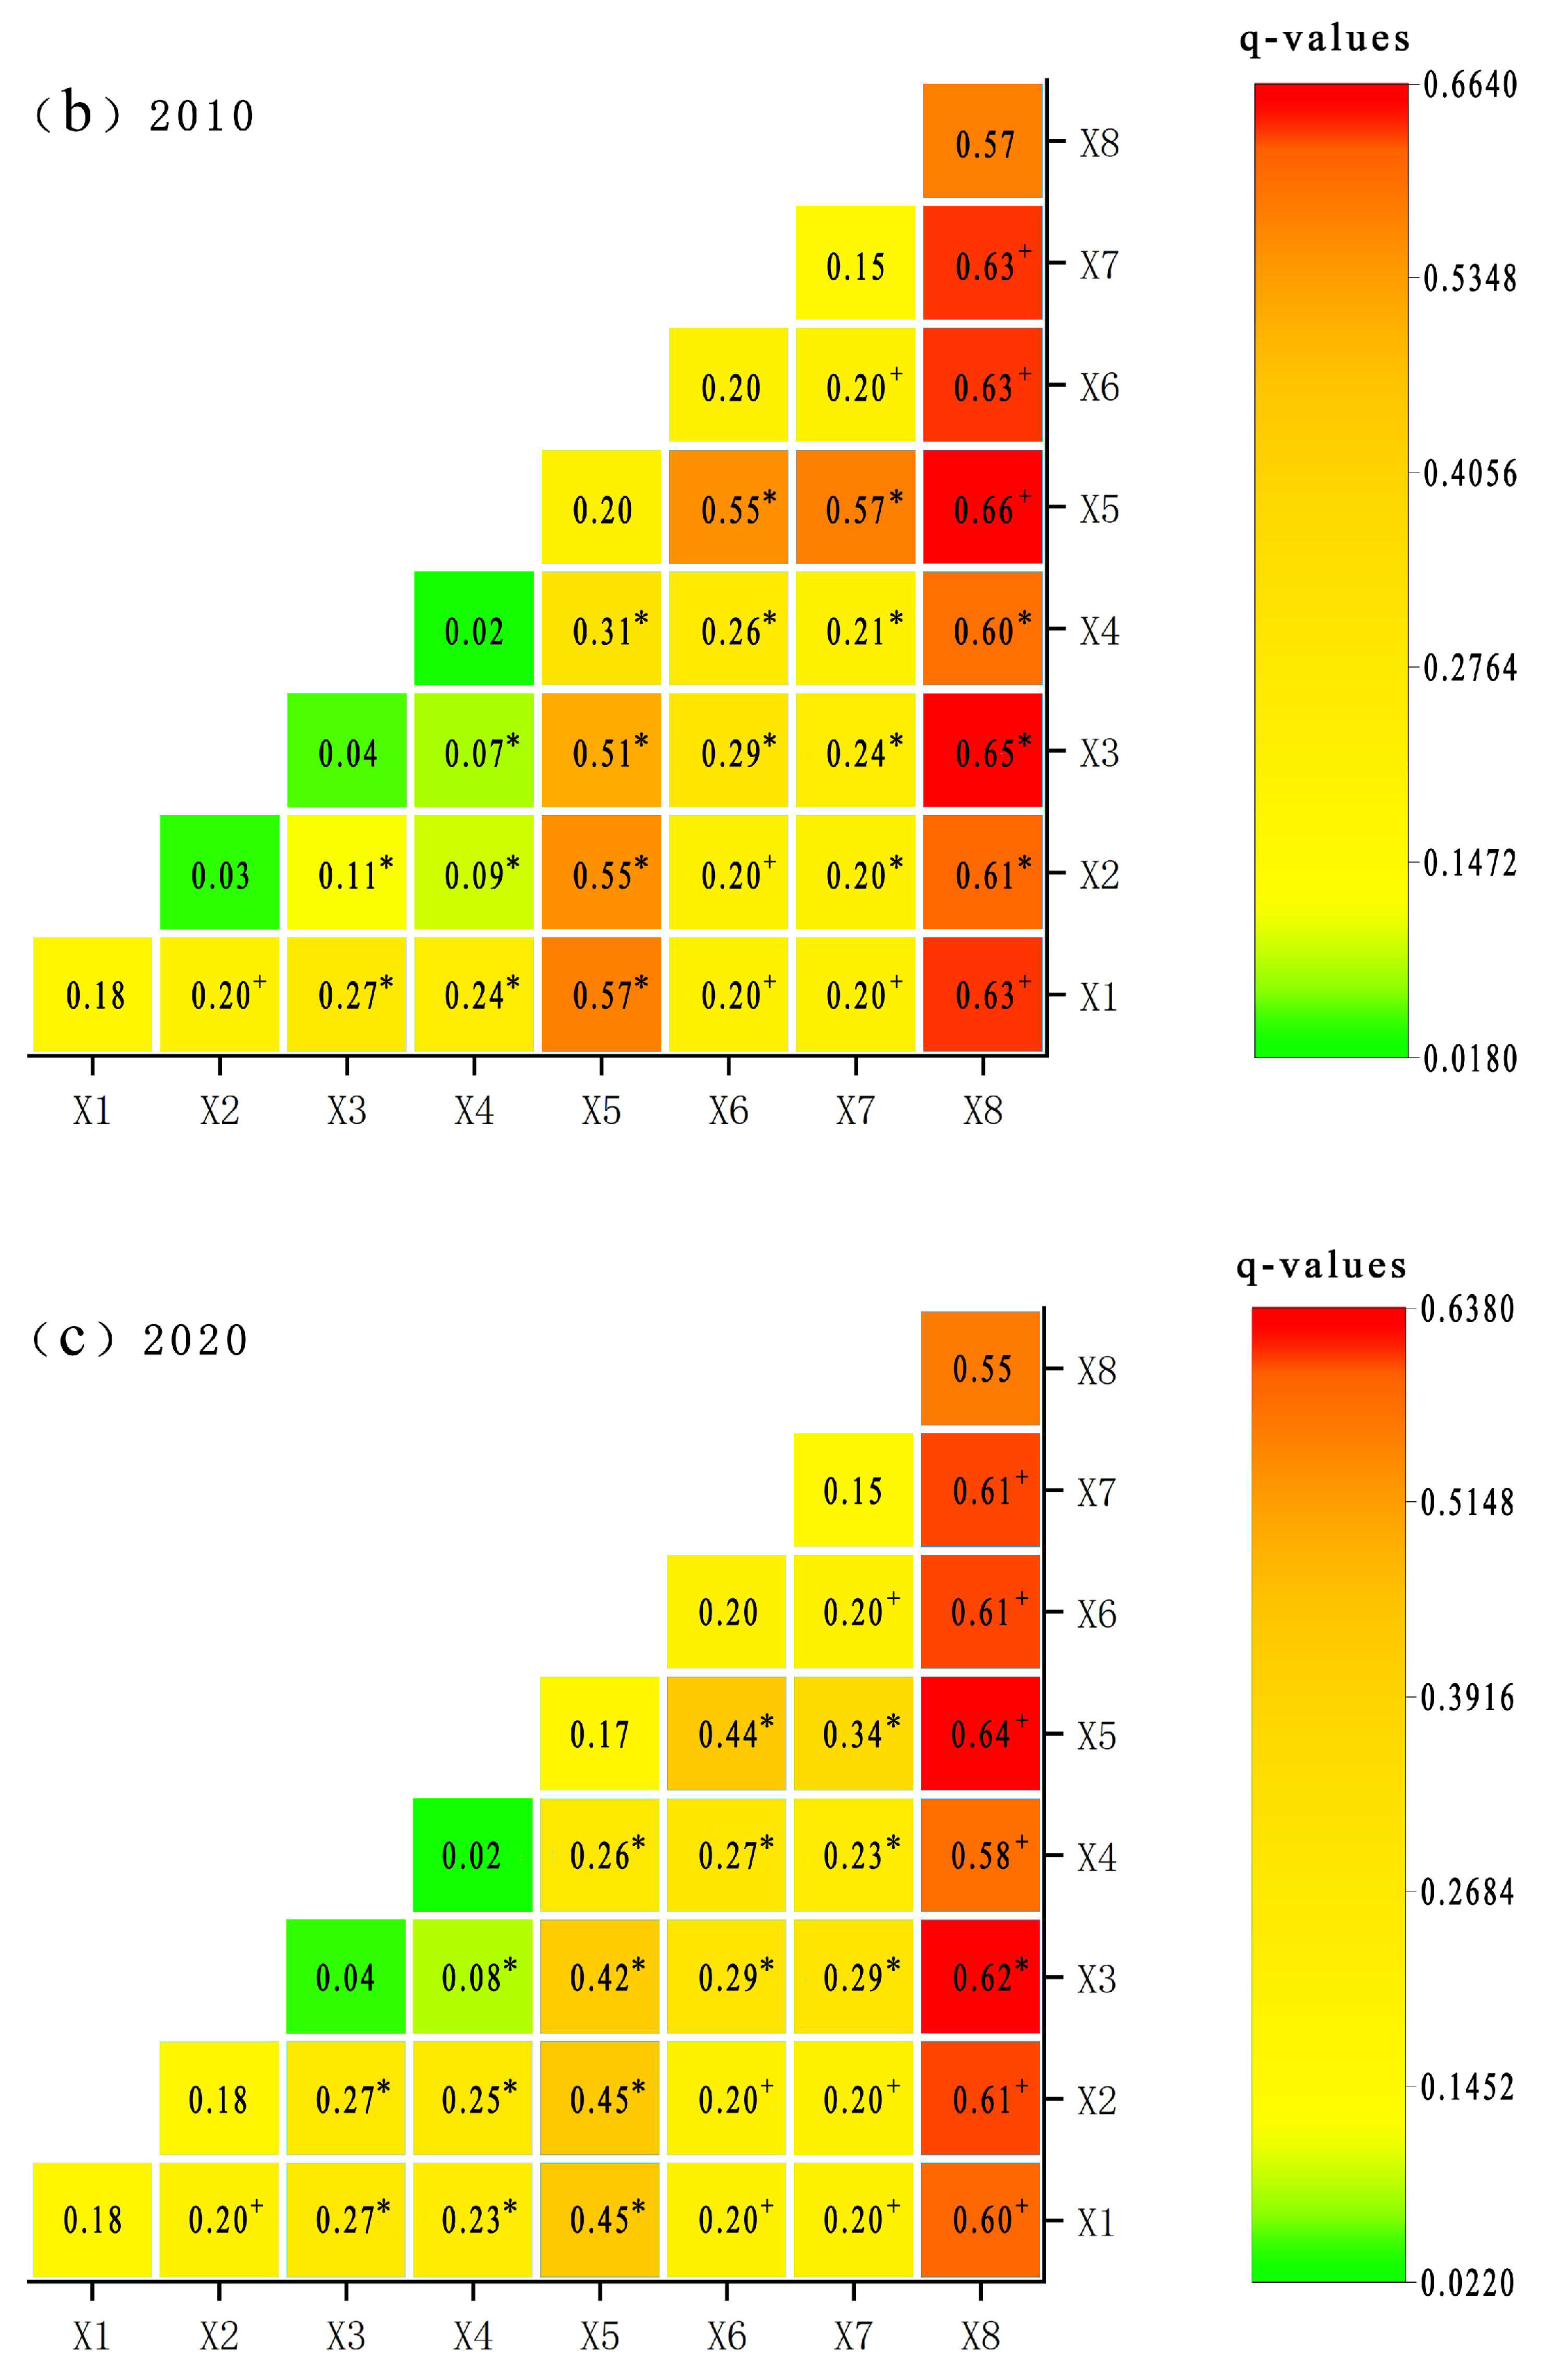
Figure 7.
Policies and measures involving the Western Region.
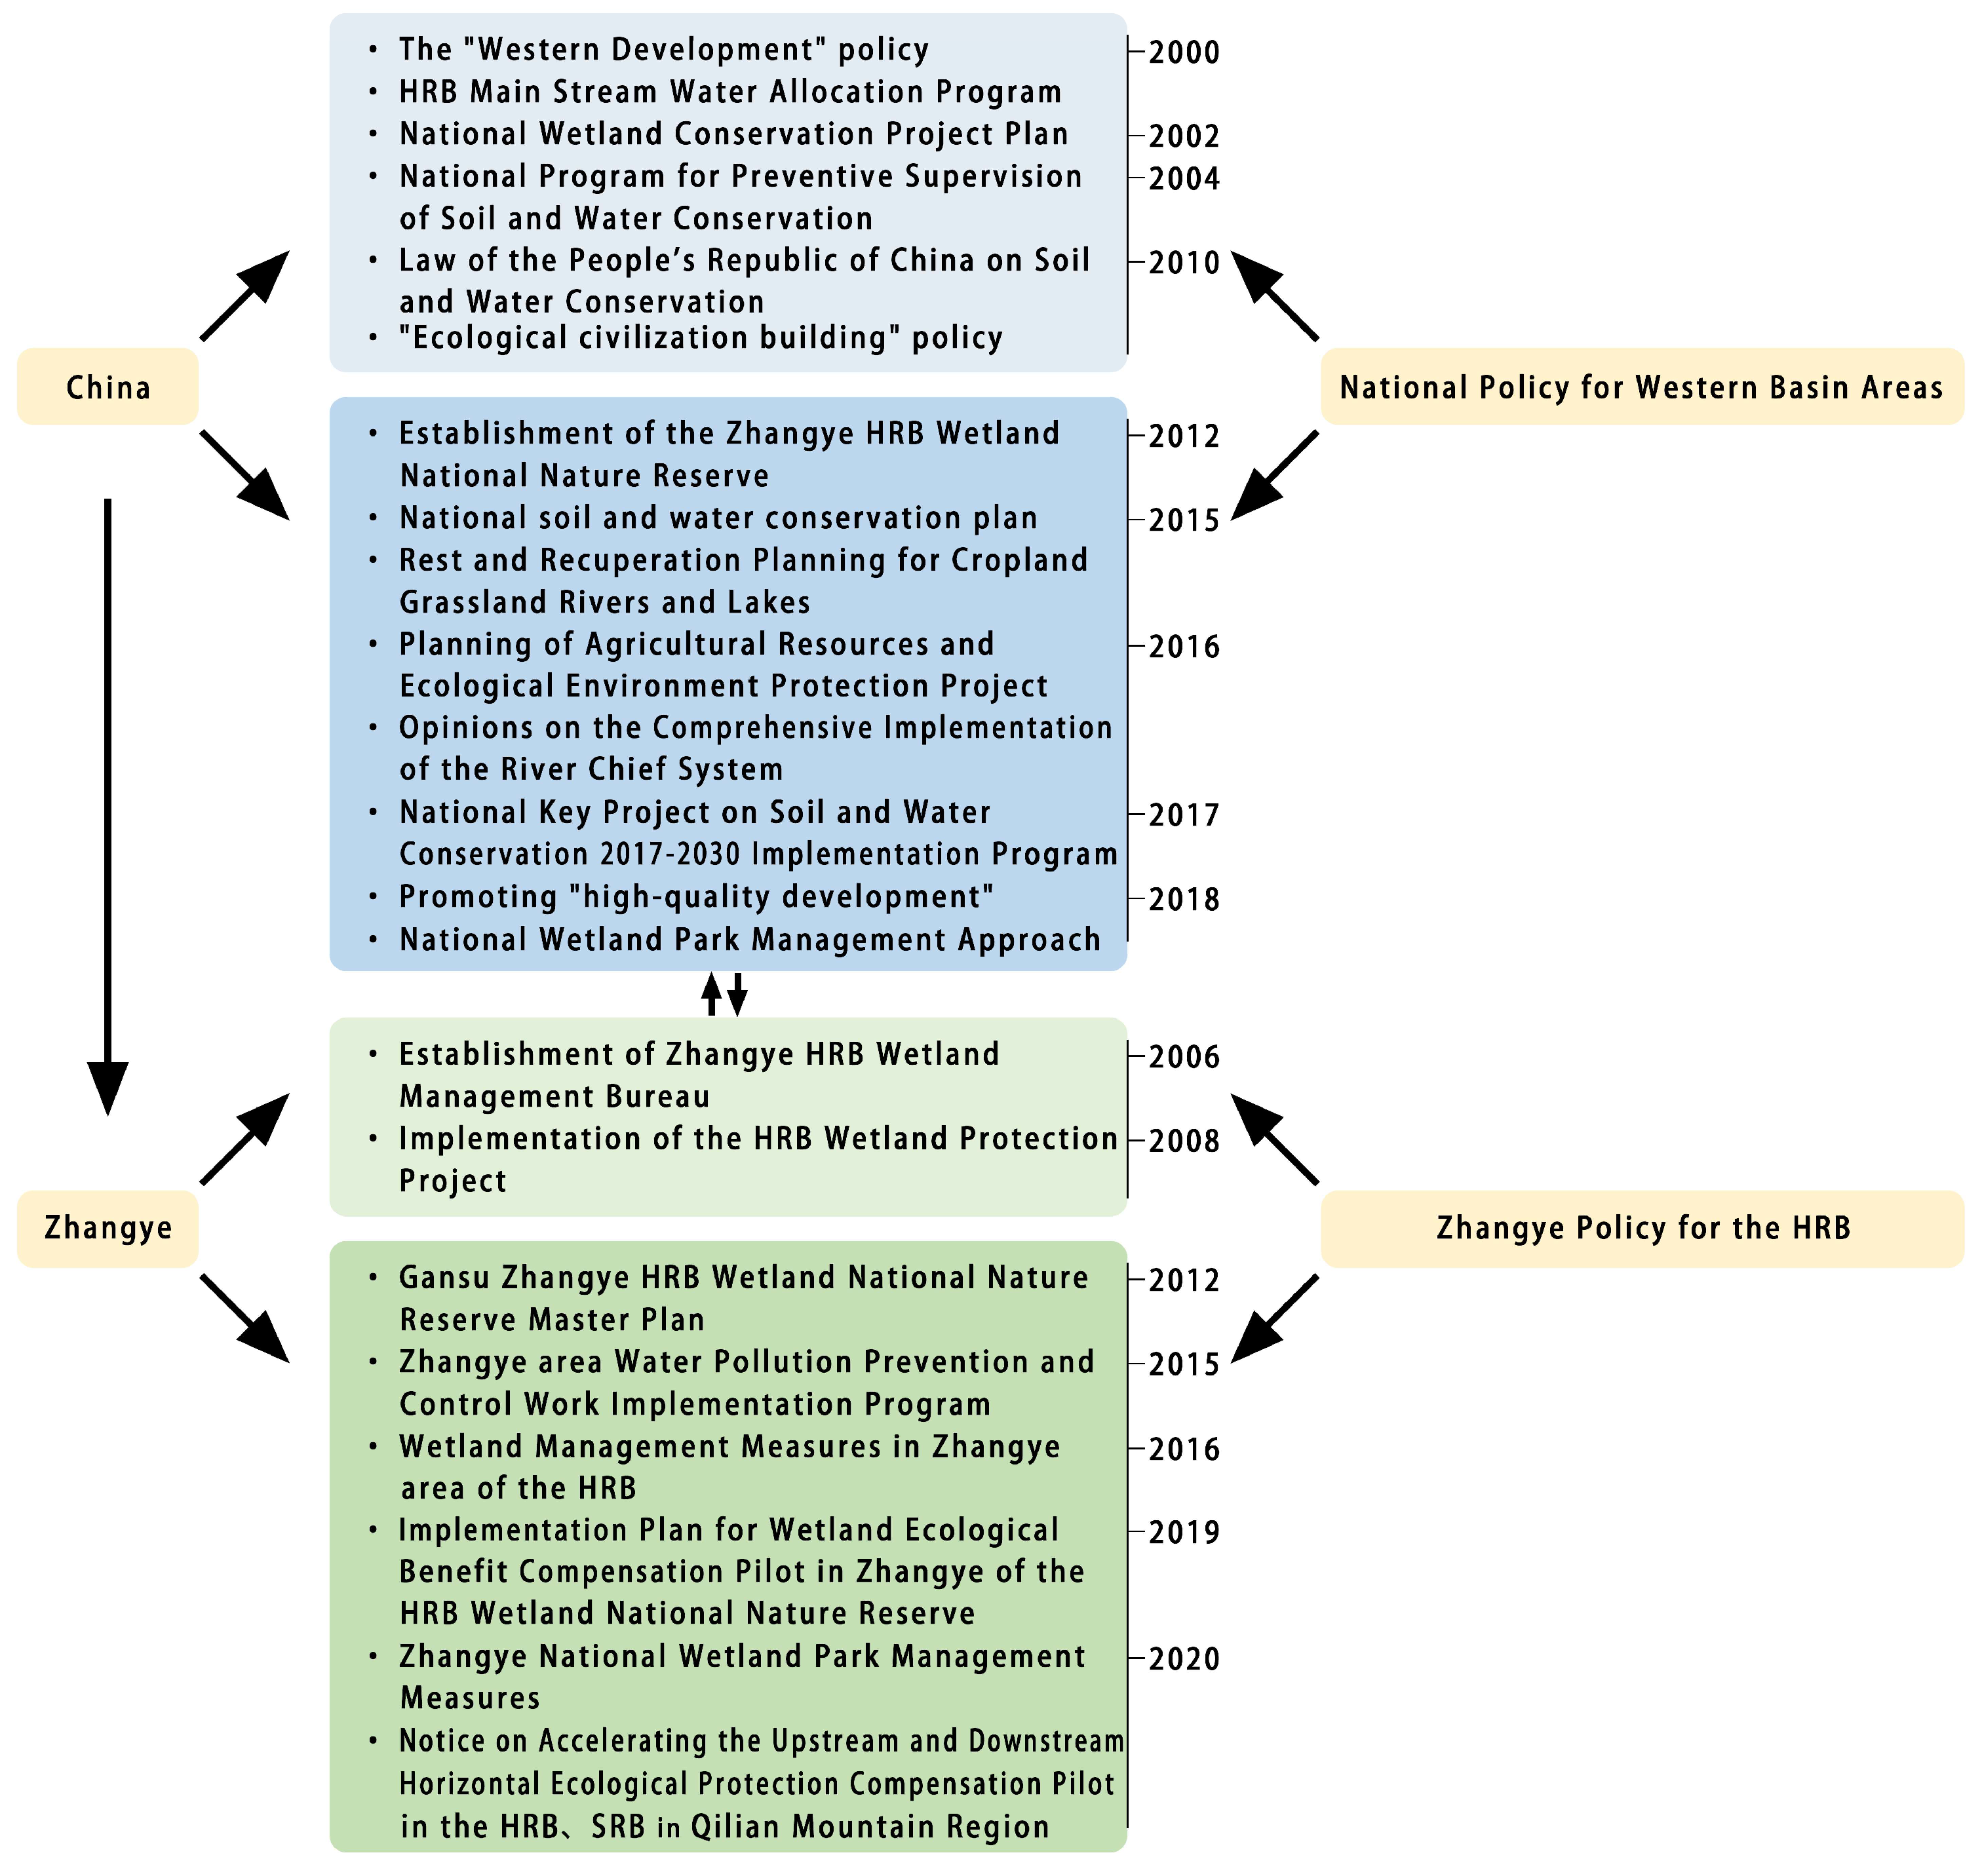
Figure 8.
Zonal management map in the Zhangye area of the HRB.

Table 1.
Study data categories and sources.
| Category | Content | Source |
|---|---|---|
| Basic Information | Study Area Scope | China Geographic Information Resource Catalog Service System (https://www.webmap.cn/; accessed on 13 April 2023.) |
| HRB Data | China Geographic Information Resource Catalog Service System (https://www.webmap.cn/; accessed on 13 April 2023.) | |
| Landscape Ecological Assessment | Status of land use in the Zhangye area of the HRB in 2000 | Resource and Environmental Science and Data Center Platform of Chinese Academy of Sciences (https://www.resdc.cn/; accessed on 13 April 2023.) |
| Status of land use in the Zhangye area of the HRB in 2010 | Resource and Environmental Science and Data Center Platform of Chinese Academy of Sciences (https://www.resdc.cn/; accessed on 13 April 2023.) | |
| Status of land use in Zhangye area of the HRB in 2020 | Resource and Environmental Science and Data Center Platform of Chinese Academy of Sciences (https://www.resdc.cn/; accessed on 13 April 2023.) | |
| Drive Analysis | Climate data (annual precipitation, average annual temperature) | China National Meteorological Science Data Center (http://data.cma.cn/; accessed on 3 June 2023.) |
| Land data (DEM, slope, NDVI) | DEM and NDVI were obtained from the Resource and Environmental Science and Data Center Platform of the Chinese Academy of Sciences (https://www.resdc.cn; accessed on 3 June 2023.); the slope was obtained from DEM processing in GIS | |
| Social data (population density, GDP per capita, degree of human disturbance) | Population density and GDP per capita were obtained from the statistical yearbook of the Zhangye area in previous years (https://www.zhangye.gov.cn/tjj/; accessed on 3 June 2023.); the degree of human disturbance was obtained by the formula , where m is the number of land types, UIi represents the value of landscape disturbance of type i, Si represents the area of type i land type, and S is the area of the evaluation plot. |
Table 2.
Landscape index formula and meaning.
| Index | Formula | Meaning |
|---|---|---|
| Percentage of Landscape (PLAND) | It represents the ratio of the area of a patch type to the whole landscape. The larger the value, the more the patch type is in the landscape. A is the total area of the landscape; M is the number of landscape types; aij is the area of patch ij. | |
| Patch Density (PD) | It represents the number of landscape patches per unit area. The larger the value, the higher the fragmentation of the patch type. P is the total length of the landscape-type boundary. | |
| Largest Patch Index (LPI) | It represents the proportion of the largest patch area to the total landscape area; the larger the value, the higher the patch landscape dominance. an is the area of each patch. | |
| Landscape Shape Index (LSI) | It represents the complexity of the shape of a certain type of patch. The larger the value, the more fragmented and complex the shape of the patch type in the landscape. E is the sum of the boundary lengths of all patches in the landscape. | |
| Aggregation Index (AI) | It represents the degree of aggregation of patches in the landscape, and the larger the value, the more concentrated the patches are. gii is the number of neighboring patches of the corresponding landscape type. |
Table 3.
Equation and meaning of the ERI model.
| Index | Formula | Meaning |
|---|---|---|
| Landscape Crush Index (Ci) | It represents the spatial change of plaques from continuous to discontinuous under the influence of exogenous factors. Higher values indicate higher risk values and more unstable patterns. | |
| Landscape Separation Index (Si) | It represents the spatial dispersion of patches, and the larger the value, the higher the ecological risk value. A is the total area of landscape; Ai is the total area of landscape i; ni is the number of landscape i patches. | |
| Landscape Dimensional Index (Di) | It is a non-integer dimensional value representing the complexity of the patch shape. Qi is the perimeter of landscape i; Ai is the total area of landscape i. | |
| Landscape Upset Index (Ui) | It represents the degree of difference between different types of being affected by exogenous factors and their ability to resist disturbance. The larger the value, the more its plaque is affected by exogenous factors and the higher the risk value. a, b and c are the weights of each index, a + b + c = 1, and the values of 0.5, 0.3 and 0.2 are assigned to them with reference to related studies. | |
| Landscape Loss Index (LLi) | The landscape loss degree is the multiplication of the Landscape Crush Index and Landscape Upset Index. | |
| Ecological Risk Index (ERI) | It represents the ecological risk index of evaluation plot i. The larger the value, the higher the degree of ecological risk. N is the number of land types, Aki is the area of land type i in the kth evaluation plot, and Ak is the area of the kth evaluation plot. |
Table 4.
Changes in landscape pattern in the Zhangye area of the HRB from 2000 to 2020.
| PLAND | PD | LPI | LSI | AI | |||||||||||
|---|---|---|---|---|---|---|---|---|---|---|---|---|---|---|---|
| 2000 | 2010 | 2020 | 2000 | 2010 | 2020 | 2000 | 2010 | 2020 | 2000 | 2010 | 2020 | 2000 | 2010 | 2020 | |
| Cropland | 20.37 | 21.55 | 21.94 | 0.06 | 0.06 | 0.06 | 2.76 | 2.96 | 3.03 | 117.26 | 113.31 | 114.75 | 96.06 | 96.30 | 96.29 |
| Forest | 21.18 | 22.15 | 21.14 | 0.05 | 0.04 | 0.05 | 5.13 | 5.12 | 5.11 | 123.59 | 123.84 | 125.63 | 95.93 | 96.01 | 95.86 |
| Grass | 17.17 | 15.95 | 16.98 | 0.06 | 0.07 | 0.07 | 1.81 | 1.48 | 1.81 | 133.92 | 135.15 | 136.07 | 95.10 | 94.87 | 94.99 |
| Water | 2.57 | 2.99 | 3.49 | 0.08 | 0.09 | 0.09 | 0.25 | 0.22 | 0.22 | 99.82 | 98.56 | 96.41 | 90.58 | 91.38 | 92.19 |
| Built-up | 20.44 | 19.75 | 19.02 | 0.01 | 0.01 | 0.01 | 7.20 | 6.74 | 6.34 | 51.15 | 51.74 | 55.20 | 98.31 | 98.26 | 98.10 |
| Unused | 18.27 | 17.61 | 17.43 | 0.03 | 0.03 | 0.03 | 4.61 | 2.71 | 2.96 | 77.52 | 77.62 | 80.04 | 97.26 | 97.21 | 97.11 |
Table 5.
Area and proportion of ERI level in the Zhangye area of the HRB from 2000 to 2020.
| ERI Level | 2000 | 2010 | 2020 | |||
|---|---|---|---|---|---|---|
| Area/km2 | Proportion/% | Area/km2 | Proportion/% | Area/km2 | Proportion/% | |
| Lowest risk | 932.25 | 2.42 | 854.83 | 2.22 | 1207.44 | 3.14 |
| Lower risk | 4653.96 | 12.10 | 4819.27 | 12.53 | 5189.66 | 13.49 |
| Medium risk | 10,077.99 | 26.20 | 10,496.51 | 27.29 | 9947.20 | 25.86 |
| Higher risk | 12,625.74 | 32.83 | 12,452.05 | 32.38 | 12,422.75 | 32.30 |
| Highest risk | 10,170.06 | 26.44 | 9837.34 | 25.58 | 9692.95 | 25.20 |
Disclaimer/Publisher’s Note: The statements, opinions and data contained in all publications are solely those of the individual author(s) and contributor(s) and not of MDPI and/or the editor(s). MDPI and/or the editor(s) disclaim responsibility for any injury to people or property resulting from any ideas, methods, instructions or products referred to in the content. |
© 2023 by the authors. Licensee MDPI, Basel, Switzerland. This article is an open access article distributed under the terms and conditions of the Creative Commons Attribution (CC BY) license (https://creativecommons.org/licenses/by/4.0/).
Share and Cite
MDPI and ACS Style
Lan, J.; Chai, Z.; Tang, X.; Wang, X. Landscape Ecological Risk Assessment and Driving Force Analysis of the Heihe River Basin in the Zhangye Area of China. Water 2023, 15, 3588. https://doi.org/10.3390/w15203588
AMA Style
Lan J, Chai Z, Tang X, Wang X. Landscape Ecological Risk Assessment and Driving Force Analysis of the Heihe River Basin in the Zhangye Area of China. Water. 2023; 15(20):3588. https://doi.org/10.3390/w15203588
Chicago/Turabian StyleLan, Jitao, Zonggang Chai, Xianglong Tang, and Xi Wang. 2023. "Landscape Ecological Risk Assessment and Driving Force Analysis of the Heihe River Basin in the Zhangye Area of China" Water 15, no. 20: 3588. https://doi.org/10.3390/w15203588
Note that from the first issue of 2016, this journal uses article numbers instead of page numbers. See further details here.