
Lag Time and Cumulative Effects of Climate Factors on Drought in North China Plain
by
Zezhong Zhang
1, 
Zipeng Wang
1,
Hexin Lai
1,
Fei Wang
1,*,
Yanbin Li
1,
Kai Feng
1,
Qingqing Qi
1 and
Danyang Di
2,* 1
School of Water Conservancy, North China University of Water Resources and Electric Power, Zhengzhou 450046, China
2
School of Water Conservancy and Transportation, Zhengzhou University, Zhengzhou 450001, China
*
Authors to whom correspondence should be addressed.
Water 2023, 15(19), 3428; https://doi.org/10.3390/w15193428
Submission received: 25 August 2023
/
Revised: 20 September 2023
/
Accepted: 27 September 2023
/
Published: 29 September 2023
(This article belongs to the Special Issue Drought Monitoring and Risk Assessment)
Abstract
:The growing concern surrounding climate change has gradually drawn attention to the influence of climate factors on drought occurrence. In order to effectively prevent the occurrence of drought and reasonably utilize water resources, the vegetation health index (VHI) was used to characterize drought in North China Plain (NCP) in this study. Furthermore, six climate factors: air temperature (AT), precipitation (P), evapotranspiration (ET), specific humidity (SH), soil moisture (SM), and soil temperature (ST) were selected. The pole symmetric mode decomposition (PSMD) and improved gridded trend test (IGT) were used to analyze the spatial–temporal characteristics of drought and climate factors in NCP from 1982 to 2020. By calculating the cumulative climatic factors of 0 months, 1 month, 2 months, and 3 months, the correlation between drought and the climatic factors with different cumulative scales was analyzed. The results showed that: (1) from 1982 to 2020, the drought in NCP showed a downward trend and the climate factors showed an upward trend; (2) with the increase in AT, P, ET, SH, SM, and ST, VHI showed an upward trend, and SM showed the strongest correlation with VHI; (3) the optimal cumulative lag time (CLT) for AT, P, ET, SH, SM, and ST were 1.67 months, 1.48 months, 1.95 months, 1.69 months, 0.89 months, and 1.81 months, respectively; and (4) AT was the main driving factor of drought in NCP. This study contributes to the early warning and prediction of drought events, providing a scientific basis for water management authorities in drought management and decision making, and mitigating the negative impacts of drought on socio-economic aspects.
1. Introduction
Due to the intensifying impacts of global climate change, the occurrence and intensity of droughts are progressively on the rise, resulting in unfavorable consequences [1,2,3]. Droughts inflict significant economic losses and ecological damage annually, exerting considerable adverse impacts on agricultural, ecological, and socio-economic systems, particularly on terrestrial ecosystems [4,5]. Vegetation, as a crucial element of land-based ecosystems, is considered highly susceptible to the impacts of climate change [6]. Global climate change alters climate patterns and profoundly affects vegetation patterns and dynamics [7,8]. While climate warming enhances vegetation productivity [9,10], the concurrent occurrence of regional heatwaves and drought events severely impedes vegetation growth [11,12,13]. Since 2000, there has been a 29% increase in the global number of droughts and their duration [14]. Three quarters of the global population are currently being affected by drought. Concurrently, intensified human activities have exacerbated the existing climate system changes. It is projected that by the end of this century, global temperatures could rise by 0.3–4.8 °C, leading to significant adverse impacts on global socio-economic systems due to associated drought events [15,16,17]. Given the continuously evolving climate conditions, the 21st century will be confronted with escalating drought risks. Consequently, it is of the utmost importance and urgency to investigate the effects of climate factors on vegetation, and to enhance our understanding of the underlying mechanisms linking them to drought occurrences.
Over the past few decades, remote sensing data have been instrumental in enabling extensive vegetation monitoring, leading to the emergence of diverse remote-sensing-based drought indices, such as the normalized difference vegetation index (NDVI), vegetation drought response index (VegDRI) [18], vegetation condition index (VCI) [19], temperature condition index (TCI) [20], vegetation supply water index (VSWI) [21], and vegetation health index (VHI). The VHI used in this study was proposed by Kogan based on the linearly weighted TCI and VCI, which comprehensively reflects changes in water and temperature within ecosystems [22]. Bhuiyan et al. monitored drought dynamics in the Aravalli region by calculating the TCI, VCI, and VHI, and their findings demonstrated that combining the VCI and TCI yielded superior performance compared to their individual utilization, suggesting the advantages of the VHI in detecting drought dynamics [23]. Javed et al. compared the standardized precipitation index, standardized soil moisture index, multivariate standardized drought index, and VHI, and observed that the VHI better captured changes in soil moisture [24]. Moreover, the VHI has been widely employed for drought mapping in numerous regions [25,26]. Thus, the VHI amalgamates information on vegetation growth and vegetation water conditions, rendering it a more suitable remote sensing index for monitoring drought impacts.
Moreover, it is essential to consider the time lag effect when examining the interplay between climate factors and vegetation. When climate factors surpass vegetation tolerance thresholds, there is delayed feedback in the vegetation growth response to climate changes, implying that climate changes occurring several months ago can also influence plant growth [27,28]. Currently, there is a growing recognition among studies regarding the significance of the lag time effect. Wu et al. investigated the time lag effect of the global vegetation response to different climate factors by developing multiple linear regression models and partial correlation models [29]. Their results revealed that considering the time lag effect improved the explanation of the global vegetation change by 11% compared to not considering the time lag effect. Kong et al. employed linear regression to determine the lag time between precipitation, temperature changes, and NDVI responses on a daily scale, and discovered that the lag time varied across vegetation zones and land cover types [30]. Therefore, by accounting for the time lag effect, a more comprehensive understanding of drought response to climate factors can be attained. Although numerous studies have considered the time lag effect, they have neglected another crucial temporal aspect, namely the cumulative effect. As climate factors accumulate over time, different accumulation durations exert distinct impacts on drought. The omission of cumulative climate effects oversimplifies the actual interaction between vegetation and drought [31]. Furthermore, previous studies have seldom addressed the differential driving effects of various climate factors on drought, which hinders a deeper understanding of the underlying mechanisms through which climate factors influence drought. Therefore, it is essential to calculate the contribution rates of different climate factors to drought considering the cumulative effects. This approach aids in identifying the primary climate factor with the greatest impact on drought and provides valuable insights into the precise mechanisms by which climate factors affect drought.
North China Plain (NCP) plays a significant role in China’s agricultural sector, particularly in the cultivation of crops such as grains, cotton, and oil, experiences frequent drought occurrences, and exhibits sensitivity and vulnerability to climate change. There has been a significant increase in the frequency of drought occurrence in NCP in recent decades, leading to severe water shortages that impede agricultural development [32]. Simultaneously, studies on the intensity and characteristics of drought in NCP have been conducted [33]. However, the existing research often overlooks the temporal continuity of climate factors when summarizing historical drought patterns based on observational data, thereby resulting in an insufficient understanding of the time lag and cumulative effects of climate factors, as well as the underlying mechanisms through which climate factors influence drought. Examining the influence of climate factors on drought in NCP is of paramount importance for establishing a robust drought prevention system, and facilitating informed planning and sustainable utilization of water resources. Consequently, this study aims to analyze the spatiotemporal characteristics of drought and climate factors in NCP and to investigate the impact of climate factors, along with their cumulative effects on drought. The main objectives of this study are as follows: (1) to investigate the changing characteristics of drought and climate factors in NCP from 1982 to 2020; (2) to examine the impact of climate factors at different accumulation scales on drought; (3) to explore the optimal lag time of cumulative climate factors on drought; (4) to identify the key driving cumulative climate factors for drought.
2. Materials and Methods
2.1. Study Region
Covering an expansive area of around 540,000 km2, NCP, or Huang-Huai-hai Plain, stands as the second largest plain in China (Figure 1). Located between 31° N–43° N and 110° E–122° E, it has an average elevation of less than 50 m and a semi-humid, temperate continental monsoon climate [34]. The proportions of cropland, forest, grassland, water, urban areas, and bare areas in NCP are 55.9%, 15.5%, 9.5%, 4.1%, 14.2%, and 0.5%, respectively. Additionally, the annual average temperature and precipitation are 8–15 °C and 400–600 mm, respectively. With the rapid economic and social growth, the level of urbanization continues to improve, and the population of NCP continues to grow rapidly. It is the main grain-, oil-, and cotton-producing area in China. However, in recent years, NCP has faced intensified drought, ecological fragility, and water shortage issues, which have significantly impacted the region’s sustainable economic and social development [35]. Moreover, it is important to note that the severity of drought varies across different regions within NCP. For the purpose of this study, NCP is divided into five regions: Beijing (BJ), Tianjin (TJ), Shandong (SD), Hebei (HB), and Henan (HN).
2.2. Dataset
2.2.1. FLDAS Dataset
The FLDAS dataset, available through the Famine Early Warning Systems Network Land Data Assimilation System V001, combines information from the CHIRPS and MERRA-2 remote sensing satellite data. It encompasses various climate-related variables such as evaporation, soil moisture, heat flux, surface radiation, and total rainfall rate. By integrating multiple satellite precipitation data sources, the FLDAS dataset utilizes a global-scale, high-resolution land surface data assimilation system. Notably, the FLDAS dataset offers a superior spatial resolution (0.1° × 0.1°).
2.2.2. STAR Dataset
The STAR dataset, provided by the National Oceanic and Atmospheric Administration (NOAA) through their Shuttle Radar Topography Mission (STAR) program, offered a remote sensing dataset of monthly VHI for the years 1982–2020. The spatial resolution of this dataset was 4 km. Prior to analysis, the data were clipped and preprocessed using ArcGIS software 10.2, allowing the generation of monthly, quarterly, and annual VHI spatial datasets specifically tailored to NCP. In order to facilitate subsequent analysis and research, the resolution of the VHI data was adjusted to 0.1° × 0.1° through the process of resampling. This adjustment was made to ensure that the VHI data matched the resolution of the FLDAS data, thereby allowing for compatibility and ease of comparison in further analysis.
2.3. Methods
2.3.1. Pole Symmetric Mode Decomposition (PSMD)
The pole symmetric mode decomposition (PSMD) method, developed by Wang Jinliang and Li Zongjun in 2013, is a data-driven, adaptive, nonlinear, time-variable decomposition technique [36,37]. Building upon the principles of empirical mode decomposition (EMD), PSMD enables the extraction of change trends and periods within nonlinear and non-stationary time series. This method overcomes the issue of “mode aliasing” encountered in EMD and exhibits several advantages for climate analysis. It excels in detecting change trends, allowing for the separation of inter-annual change trends and overall trends within a data series. PSMD is also effective at anomaly diagnosis, facilitating the identification of abnormal time frequency bands within each data series mode. Moreover, this method enables a time frequency analysis, utilizing a direct interpolation approach to analyze frequency changes across various time scales.
2.3.2. Improved Gridded Trend Test
The improved gridded trend test (IGT), an enhanced version of the traditional Mann–Kendall method, is a non-parametric test method specifically designed for autocorrelation sequences. It surpasses the traditional method in terms of accuracy in significance level testing without compromising efficacy [38,39]. Particularly suitable for trend testing within hydrological and meteorological time series, the IGT method follows several calculation steps:
Each data point is normalized within the time series XT by dividing it by the series’ mean value. This generates a new time series Xt, from which the rank trend estimator β is calculated.
Here, a positive β indicates an upward trend, while a negative β signifies a downward trend.
Assuming the trend term of the new time series Xt is linear Tt, the corresponding stationary series is derived Yt by removing the trend term.
The autocorrelation coefficient ri is calculated for the rank sequence corresponding to the stationary series Yt.
Here, Ri represents the rank of yi, is the mean value of the rank.
The variance (var*(S)) of the trend statistic S of the autocorrelation series is computed using the autocorrelation coefficient ri.
The IGT statistic S is evaluated as greater than zero, equal to zero, or less than zero according to the following conditions:
In this paper, the IGT method was employed to test the gridding trend of the VHI, thus revealing the dynamic change characteristics of drought within NCP. If Z ≥ 1.96, then the VHI sequence exhibited a significant increasing trend (p < 0.05). If 0 < Z < 1.96, then the VHI sequence demonstrated no significant increasing trend (p > 0.05). When −1.96 < Z < 0, the VHI sequence indicated no significant decreasing trend (p > 0.05). Finally, if Z ≤ −1.96, then the VHI sequence displayed a significant decreasing trend (p < 0.05).
2.3.3. Cumulative Climate Factors
To represent the cumulative effect of climate factors, the cumulative values of air temperature (AT), precipitation (P), evapotranspiration (ET), specific humidity (SH), soil moisture (SM), and soil temperature (ST) were calculated. These cumulative climate factors encompass the sum of the difference between each climate factor and its base value over the cumulative period [31]. The cumulative period duration is determined as the assumed lag time relative to drought caused by cumulative climate factors. The calculation method is as follows:
Here, m represents the month sequence from January 1982 to December 2020, k is the time interval of the current month, i denotes the assumed cumulative time lag (CLT), n signifies the maximum CLT (defined as 3), and CC refers to the climate factor from January 1982 to December 2020. If a climate factor’s value falls below the base value, then its cumulative value remains unchanged.
2.3.4. Correlation Analysis
In this paper, a correlation analysis based on grid scale was conducted to examine the correlation between the VHI and cumulative climate factors within NCP [40]. The month corresponding to the maximum correlation coefficient (r) was considered the optimal lag time of cumulative climate factors relative to the VHI. The calculation method is as follows:
Here, Rxy represents the r between variables x and y, xi and yi signify the cumulative climate factor or the VHI for the corresponding month, n denotes the sample size, and and represent the average of variables x and y, respectively.
2.3.5. Standardized Multiple Linear Regression
To assess the impact of various independent variables on the dependent variable, the standardized regression coefficient can be utilized to evaluate the contribution of each variable to the dependent variable [41]. Standardizing the data eliminates discrepancies in dimension and magnitude and can facilitate the comparison of different variables. Hence, the study utilized the standardized multiple regression method at the grid scale to assess the contribution rate (CR) of cumulative climate factors to drought occurrences. The specific methods are as follows:
The independent variables (cumulative climate-driven subset) and dependent variable (VHI) are normalized:
Here, Zij represents the standardized variable value, xij is the original variable value, xi is the expected value of the variable, and si is the standard deviation of the variable.
A multiple linear regression equation for the standardized independent variables and dependent variable is constructed:
Here, ZVHI denotes the standardized VHI index, zj represents the standardized independent variable (each cumulative climate factor), βj signifies the regression coefficient corresponding to each variable, B represents the constant term, and ε represents the residual term.
The CR of each driving factor to VHI is calcluated:
Here, Cj represents the CR of cumulative climate factors, expressed as a percentage. A higher CR indicates a greater driving effect of the cumulative climate factor on drought.
The methodology flow chart in this study is shown in Figure 2.
3. Results
3.1. Spatiotemporal Variation Characteristics of Drought and Climate Factors
Figure 3 shows the trend characteristics of the VHI series in BJ, TJ, SD, HN, HB, and NCP based on PSMD. It can be seen that the original series after PSMD is composed of 3–4 IMF trend components and a trend item R. From 1982 to 2020, the linear tendency rates of the VHI in BJ, TJ, SD, HN, HB, and NCP were 0.025/10a (p < 0.01), 0.015/10a (p < 0.01), 0.015/10a (p = 0.031), 0.032/10a (p < 0.01), 0.027/10a (p < 0.01), and 0.025/10a (p < 0.01), respectively, indicating that the overall drought in each sub-region and NCP showed a slowdown trend during the whole study period. The average value of the VHI in BJ, TJ, SD, HN, HB, and NCP during the whole study period was 0.55, 0.52, 0.55, 0.56, 0.56, and 0.55, respectively, and the minimum value of the VHI appeared in 1986 (0.43), 1986 (0.39), 1989 (0.41), 1989 (0.39), 1989 (0.42), and 1989 (0.39), respectively. The maximum value of the VHI in BJ, TJ, SD, HN, HB, and NCP appeared in 2005, 2004, 2005, 2005, 2004, and 2004, respectively, and its value was 0.66, 0.62, 0.64, 0.64, 0.66, and 0.64. Obviously, the most severe drought years in NCP during the whole study period were 1986 and 1989, and the least severe drought years were 2004 and 2005. The variance CRs of IMF1, IMF2, IMF3, and R in NCP were 44.81%, 10.81%, 1.45%, and 42.93%, respectively. Thus, IMF1 and trend term R can explain 44.81% and 42.93% of the VHI changes, respectively. In addition, we used fast Fourier transform to calculate the average period of each component, and it can be concluded that the average periods of IMF1, IMF2, IMF3, and R in NCP were 3.6 years, 6.5 years, 13.4 years, and 39.2 years, respectively. The VHI had the periodic characteristics of 3.6 years and 6.5 years on an inter-annual scale, and 13.4 years and 39.2 years on an inter-decadal scale.
Similarly, the time series of climate factors were decomposed by PSMD to reveal the changes of climate factors in NCP from 1982 to 2020, as shown in Figure 4. During the research period, AT, P, SM, ET, SH, and ST all showed an increasing trend, with linear tendency rates of 0.24 °C/10a, 23.27 mm/10a, 0.004 m3·m−3/10a, 14.77 mm/10a, 0.12 g·kg−1/10a, and 0.17 °C/10a, respectively. The trend term R obtained from PSMD showed good consistency with the changes in the original climate factor sequence, which can reflect the dynamic changes of climate factors. Overall, climate factors showed an upward trend that aligned with the changing pattern of drought.
Figure 5 shows the statistical Zs value and significance level p-value of the VHI in NCP based on the IGT method. Overall, the drought occurrences in NCP exhibited a decreasing trend during the whole study period. The average Zs of the VHI’s gridding trend feature was 1.87, and the area percentage showing a reduction trend was 75.55%. During the whole study period, drought in some regions of NCP showed significant changes, and the area of drought showing significant changes (p < 0.05) accounted for 67.22% of the total area. The percentage of areas showing significant reduction and significant aggravation were 55.60% and 11.62%, respectively. It can be seen that the IGT-based drought gridded trend in NCP showed a certain spatial heterogeneity.
Figure 6 shows the statistical Zs value of each climate factor in NCP based on the IGT method. The average Zs values of AT, P, ET, SH, SM, and ST were 2.49, 1.39, 1.58, 2.16, 2.01, and 1.96, respectively. Therefore, the overall climate factors in NCP showed an upward trend, which was consistent with the PSMD results. Similarly, various climate factors also exhibited certain spatial heterogeneity. The percentage of areas with significant increases in AT, P, ET, SH, SM, and ST were 84.65%, 25.02%, 33.99%, 52.64%, 53.10%, and 45.47%, respectively. It is worth noting that among the various climate factors, only P (4.80%), ET (5.21%), and SM (4.47%) showed a certain downward trend, and their proportions were very small.
3.2. Correlation Analysis between Drought and Climate Factors at Different Cumulative Scales
Figure 7 shows the correlations between climate factors and the VHI without the effects of time accumulation. The percentage of areas where AT, P, ET, SH, SM, and ST inhibited the VHI were 17.24%, 8.00%, 8.01%, 13.00%, 5.82%, and 18.55%, respectively. The percentage of areas where AT, P, ET, SH, SM, and ST promoted the VHI were 82.76%, 92.00%, 91.99%, 87.00%, 94.18%, and 81.45%, respectively. Overall, various climate factors had varying degrees of promoting effects on the VHI, indicating that with the increase in AT, P, ET, SH, SM, and ST, the VHI will show an upward trend and the degree of drought will decrease.
Figure 8 shows the r between the climate factors and VHI under the cumulative influence of 1-, 2-, and 3-month periods in NCP. The percentage of areas where AT, P, ET, SH, SM, and ST exerted promoting effects on the VHI under the cumulative influence of the 1-month period was 80.78%, 90.61%, 90.15%, 86.09%, 93.16%, and 79.08%, respectively. Under the cumulative influence of the 2-month period, the percentage of areas with AT, P, ET, SH, SM, and ST exerting promoting effects on the VHI was 80.92%, 90.16%, 89.47%, 85.62%, 93.90%, and 77.32%, respectively. Similarly, under the cumulative influence of the 3-month period, the percentage of areas where AT, P, ET, SH, SM, and ST exerted promoting effects on the VHI was 78.38%, 89.19%, 87.36%, 83.61%, 94.01%, and 73.38%, respectively. It can be seen that all the climate factors showed positive correlations with the VHI as a whole, although the cumulative time scales were different (1-month, 2-month, and 3-month). As the climatic factors increased, the VHI showed a consistent upward trend. This finding was in line with the results presented in Section 3.1 of the study. Additionally, SM exhibited the strongest correlation with the VHI, with an average r of 0.320, 0.352, 0.367, and 0.380 under the cumulative influence of 0-, 1-, 2-, and 3-month periods, respectively. On the other hand, ST showed the weakest correlation with the VHI, with an average r of 0.240, 0.232, 0.225, and 0.217 under the cumulative influence of 0-, 1-, 2-, and 3-month periods, respectively. Specifically, in BJ, TJ, SD, HB, and HN, the average r between the SM and VHI under different cumulative periods was 0.328, 0.370, 0.361, 0.286, and 0.340, respectively. The average r between the ST and VHI under different cumulative periods was 0.223, 0.227, 0.203, 0.225, and 0.222, respectively. Moreover, it is worth noting that for certain climate factors, such as SM, the r gradually increased with longer cumulative periods, indicating that time accumulation may enhance the promoting effect of SM on the VHI to some extent. However, for other climate factors, such as ST, changes in the length of cumulative time did not result in a monotonic increase or decrease in the correlation coefficients. This showed that the optimal CLT for the VHI was not the same for different climate factors.
3.3. Time Lag Analysis of Drought on Climate Factors
To investigate the response lag of drought relative to cumulative climate factors, based on the correlation analysis between cumulative climate factors and the VHI within the 0–3 month period, the duration corresponding to the maximum r was selected as the optimal lag time for drought with respect to cumulative climate factors, as illustrated in Figure 9 and Figure 10. The average optimal lag time of the VHI in response to AT in NCP was 1.67 months, with 43.98% of pixels exhibiting a 3-month CLT and 33.34% of pixels exhibiting a 0-month CLT. The average optimal lag time of the VHI in response to P was 1.48 months, with 36.25% of pixels exhibiting a 2-month CLT and 25.46% of pixels exhibiting a 0-month CLT. The average optimal lag time of the VHI in response to ET was 1.94 months, with 48.47% of pixels exhibiting a 3-month CLT and 21.56% of pixels exhibiting a 0-month CLT. The average optimal lag time of the VHI in response to SH was 1.69 months, with 39.54% of pixels exhibiting a 3-month CLT and 28.52% of pixels exhibiting a 0-month CLT. The average optimal lag time of the VHI in response to SM was 0.89 months, with 62.52% of pixels exhibiting a 0-month CLT and 19.42% of pixels exhibiting a 3-month CLT. The average optimal lag time of the VHI in response to ST was 1.81 months, with 49.28% of pixels exhibiting a 3-month CLT and 29.71% of pixels exhibiting a 0-month CLT.
3.4. Driving Effect of Cumulative Climate Factors on Drought
The CR of driving effects of different climate factors (AT, P, ET, SH, SM, and ST) to drought in NCP is shown in Figure 11. By using the standardized multiple linear regression method, the average CT of climate factors to the VHI under the optimal CLT was 23.06%, 15.22%, 16.31%, 18.38%, 7.02%, and 20.01%, respectively. In conclusion, AT was the climate factor with the highest average CR to VHI. The key cumulative climate factors of drought in NCP are shown in Figure 12. Among them, the area percentages of AT, P, ET, SH, SM, and ST were 31.90%, 10.29%, 12.98%, 19.92%, 0.61%, and 24.30%, respectively. On the whole, the main driving factor of drought in NCP was AT, with the area percentage reaching 31.90%.
4. Discussion
In the context of global climate change, it is imperative to deepen our comprehension of how diverse climate factors affect drought. Remote-sensing-based vegetation indices offer a means to explore and assess these impacts. Among the commonly employed satellite-based drought-monitoring indices, the VHI stands out for its ability to consider local soil climate conditions, making it effective at monitoring plant drought [23,42,43,44]. In this study, we selected the VHI to characterize drought and analyzed the spatial and temporal variation of both drought and climate factors in NCP using PSMD and the IGT method. Our findings indicated a decreasing trend in drought occurrence in NCP from 1982 to 2020, which aligned with the results of Li et al. [45]. Additionally, Zhang et al. assessed the changes in climate factors in typical locations within NCP, and the results revealed a significant upward trend in average AT for the following year, while precipitation showed no significant upward trend [46]. Moreover, the increase in AT may have led to an increase in potential evaporation [47]. The research results presented in this paper support the overall upward trend of climate factors in NCP, providing additional evidence to support the previous research.
Furthermore, considering the cumulative effects of different time scales (0 months, 1 month, 2 months, and 3 months), we analyzed the correlations between climate factors at different cumulative scales and drought. Ma et al. discovered that considering the cumulative effects of time lag can enhance the explanatory power of climate factors on vegetation growth, when studying the impact of climate and human activities on vegetation cover changes [28]. Ding’s study also emphasized the significant temporal accumulation effect of precipitation during the growing season in northern China [48]. The results of our study indicated that over time, the r of P with the VHI increased gradually, highlighting the significant temporal accumulation effect of P. Moreover, Ma et al. analyzed the time effects of different climate factors (AT, solar radiation, and P) on NDVI in the Xinjiang region, and the results showed that P dominated the accumulation of NDVI for 1–2 months [49]. In this article, we compared the cumulative effects of climate factors on VHI at different scales (1 month, 2 months, and 3 months). Without considering cumulative time effects, the area experiencing inhibitory effects on the VHI by climate factors showed the highest percentage change at 7.86%, followed by 2 months with a percentage of 7.4%. This finding maintained some consistency with the aforementioned research results.
In addition, we explored the optimal lag time for drought response to cumulative climate factors by selecting the duration corresponding to the maximum r between cumulative climate factors and the VHI. Li et al. discovered a significant positive correlation between the VCI, TCI, rainfall condition index (RCI), and SM [50]. They established a multi-source, remote sensing, drought-monitoring model based on SM, which demonstrated sufficient accuracy as an agricultural drought-monitoring model. This paper discovered that the optimal lag time of SM on drought was minimal (0.89 months) compared to other climate factors. This observation partly explained the rationale behind the variable selection in the model. Furthermore, it indicated spatial heterogeneity in the optimal lag time of climate factors among different regions, with the lag effect of climate factors displaying some spatial variation.
To identify the climate factors with the greatest impact on drought, we adopted multiple linear regression to explore the driving effect of cumulative climate factors on drought. Previous studies [51,52,53] have emphasized precipitation as the main driving factor of drought in NCP. However, our study revealed that AT was the primary driving factor of drought in NCP. This difference may arise from the fact that previous studies have not considered the effect of climate factors, despite their significant cumulative impact on vegetation growth [31]. Numerous studies [54,55,56,57] have shown that considering the cumulative effect of time can enhance the explanatory power of climate factors on vegetation health changes by 3.4% to 10.8%. Moreover, this cumulative effect varies among different climate factors, potentially leading to variations in the main driving factors of drought. Therefore, future research on the impact of climate factors on drought should incorporate this cumulative effect using remote sensing indices.
This study has limitations and uncertainties. Firstly, remote sensing datasets are susceptible to cloud cover and adverse weather conditions [58,59,60]. Although efforts have been made to mitigate these effects through denoising and filtering, the uncertainty of remote sensing data could still potentially impact the accuracy of the study. Moreover, we only investigated the linear development pattern between climate factors and drought using standardized multiple linear regression. It is worth noting that climate factors are inter-related, and their relationships can be complex. Therefore, by neglecting the interference of nonlinear factors in the process, some degree of error may be introduced. Additionally, this research focuses on the response of vegetation to climate factors. However, human activities, extreme weather events, and other non-climatic factors also have significant implications for vegetation growth [61,62,63]. A comprehensive understanding of vegetation responses to different types of disturbances would contribute to effective vegetation monitoring.
5. Conclusions
In this paper, the time lag and cumulative effects of climate factors on drought in NCP from 1982 to 2020 were studied. The temporal and spatial variation characteristics of drought and climate factors were revealed, and the correlation between climate factors and drought on different cumulative scales were explored. On the basis of the correlation analysis, the optimal lag time of drought for climate factors was determined, and the main driving factors of drought in NCP were identified. Based on the obtained results, several key conclusions can be drawn, which are summarized as follows:
(1) During 1982 to 2020, the drought in each sub-region and NCP showed a decreasing trend, and the climate factors showed an upward trend. The most serious drought in all sub-regions and NCP was concentrated in 1986 and 1989. Meanwhile, based on the IGT method, it was found that both drought and climate factors exhibited certain spatial heterogeneity.
(2) With the increase in AT, P, ET, SH, SM, and ST, the VHI showed an upward trend. Additionally, SM showed the strongest correlation with the VHI, and ST showed the weakest correlation with the VHI. Overall, the VHI responded differently to climate factors under various cumulative time periods.
(3) The optimal lag time for each climate factor was 1.67 months, 1.48 months, 1.95 months, 1.69 months, 0.89 months, and 1.81 months in NCP, TJ, SD, HN, and HB, respectively.
(4) The main driving factor of drought was AT in NCP, with an area percentage of 31.90%.
Author Contributions
Conceptualization, F.W. and Z.Z.; data interpretation and methodology, H.L. and Z.W.; validation, K.F.; software, Q.Q.; original draft preparation, Z.W.; funding acquisition, Y.L. and D.D. All authors have read and agreed to the published version of the manuscript.
Funding
This research was supported by Key Special Project of the “Science and Technology Revitalization of Mongolia” Action (grant number 2022EEDSKJXM004-4), Major Science and Technology Projects in Henan Province (grant number 201300311400), and the China Postdoctoral Science Foundation (2022TQ0304).
Data Availability Statement
Data can be requested from the corresponding author upon request.
Acknowledgments
Thanks for the help provided by Qingqing Tian in data collection.
Conflicts of Interest
The authors declare no conflict of interest.
References
- Li, Y.; Xie, Z.; Qin, Y.; Xia, H.; Zheng, Z.; Zhang, L.; Pan, Z.; Liu, Z. Drought Under Global Warming and Climate Change: An Empirical Study of the Loess Plateau. Sustainability 2019, 11, 1281. [Google Scholar] [CrossRef]
- Keyantash, J.; Dracup, J.A. The Quantification of Drought: An Evaluation of Drought Indices. Bull. Am. Meteorol. Soc. 2002, 83, 1167–1180. [Google Scholar] [CrossRef]
- Mishra, A.K.; Singh, V.P. A review of drought concepts. J. Hydrol. 2010, 391, 202–216. [Google Scholar] [CrossRef]
- Dai, A. Drought under global warming: A review. WIREs Clim. Chang. 2011, 2, 45–65. [Google Scholar] [CrossRef]
- Marvel, K.; Cook, B.I.; Bonfils, C.J.W.; Durack, P.J.; Smerdon, J.E.; Williams, A.P. Twentieth-century hydroclimate changes consistent with human influence. Nature 2019, 569, 59–65. [Google Scholar] [CrossRef]
- Wang, F.; Lai, H.X.; Li, Y.B.; Feng, K.; Tian, Q.Q.; Guo, W.X.; Zhang, W.J.; Di, D.Y.; Yang, H.B. Dynamic variations of terrestrial ecological drought and propagation analysis with meteorological drought across the mainland China. Sci. Total Environ. 2023, 896, 165314. [Google Scholar] [CrossRef]
- Qi, X.; Jia, J.; Liu, H.; Lin, Z. Relative importance of climate change and human activities for vegetation changes on China’s silk road economic belt over multiple timescales. Catena 2019, 180, 224–237. [Google Scholar] [CrossRef]
- Shi, Y.; Jin, N.; Ma, X.; Wu, B.; He, Q.; Yue, C.; Yu, Q. Attribution of climate and human activities to vegetation change in China using machine learning techniques. Agric. For. Meteorol. 2020, 294, 108146. [Google Scholar] [CrossRef]
- Ostberg, S.; Lucht, W.; Schaphoff, S.; Gerten, D. Critical impacts of global warming on land ecosystems. Earth Syst. Dynam. 2013, 4, 347–357. [Google Scholar] [CrossRef]
- Nemani, R.R.; Keeling, C.D.; Hashimoto, H.; Jolly, W.M.; Piper, S.C.; Tucker, C.J.; Myneni, R.B.; Running, S.W. Climate-Driven Increases in Global Terrestrial Net Primary Production from 1982 to 1999. Science 2003, 300, 1560–1563. [Google Scholar] [CrossRef]
- Ciais, P.; Reichstein, M.; Viovy, N.; Granier, A.; Ogée, J.; Allard, V.; Aubinet, M.; Buchmann, N.; Bernhofer, C.; Carrara, A.; et al. Europe-wide reduction in primary productivity caused by the heat and drought in 2003. Nature 2005, 437, 529–533. [Google Scholar] [CrossRef] [PubMed]
- Gatti, L.V.; Gloor, M.; Miller, J.B.; Doughty, C.E.; Malhi, Y.; Domingues, L.G.; Basso, L.S.; Martinewski, A.; Correia, C.S.C.; Borges, V.F.; et al. Drought sensitivity of Amazonian carbon balance revealed by atmospheric measurements. Nature 2014, 506, 76–80. [Google Scholar] [CrossRef] [PubMed]
- Zhao, M.; Running, S.W. Drought-Induced Reduction in Global Terrestrial Net Primary Production from 2000 Through 2009. Science 2010, 329, 940–943. [Google Scholar] [CrossRef] [PubMed]
- Ling, Z.; Shu, L.; Wang, D.; Lu, C.; Liu, B. Assessment and projection of the groundwater drought vulnerability under different climate scenarios and land use changes in the Sanjiang Plain, China. J. Hydrol. Reg. Stud. 2023, 49, 101498. [Google Scholar] [CrossRef]
- Sun, J.; Chen, W.; Hu, B.; Xu, Y.J.; Zhang, G.; Wu, Y.; Hu, B.; Song, Z. Roles of reservoirs in regulating basin flood and droughts risks under climate change: Historical assessment and future projection. J. Hydrol. Reg. Stud. 2023, 48, 101453. [Google Scholar] [CrossRef]
- Jiang, L.; Jiapaer, G.; Bao, A.; Guo, H.; Ndayisaba, F. Vegetation dynamics and responses to climate change and human activities in Central Asia. Sci. Total Environ. 2017, 599–600, 967–980. [Google Scholar] [CrossRef]
- Ge, W.; Deng, L.; Wang, F.; Han, J. Quantifying the contributions of human activities and climate change to vegetation net primary productivity dynamics in China from 2001 to 2016. Sci. Total Environ. 2021, 773, 145648. [Google Scholar] [CrossRef]
- Brown, J.F.; Wardlow, B.D.; Tadesse, T.; Hayes, J.H.; Reed, B.C. The Vegetation Drought Response Index (VegDRI): A new integrated approach for monitoring drought stress in vegetation. Gisci. Remote Sens. 2008, 45, 16–46. [Google Scholar] [CrossRef]
- Kogan, F.N. Remote sensing of weather impacts on vegetation in non homogeneous areas. Int. J. Remote Sens. 1990, 11, 1405–1419. [Google Scholar] [CrossRef]
- Kogan, F.N. Application of vegetation index and brightness temperature for drought detection. Adv. Space Res. 1995, 15, 91–100. [Google Scholar] [CrossRef]
- Arlson, T.N.; Gillies, R.R.; Perry, E.M. A method to make use of thermal infrared temperature and NDVI measurements to infer surface soil water content and fractional vegetation cover. Remote Sens. Rev. 1994, 9, 161–173. [Google Scholar] [CrossRef]
- Kogan, F.; Salazar, L.; Roytman, L. Forecasting crop production using satellite-based vegetation health indices in Kansas, USA. Int. J. Remote Sens. 2012, 33, 2798–2814. [Google Scholar] [CrossRef]
- Bhuiyan, C.; Singh, R.P.; Kogan, F.N. Monitoring drought dynamics in the Aravalli region (India) using different indices based on ground and remote sensing data. Int. J. Appl. Earth Obs. 2006, 8, 289–302. [Google Scholar] [CrossRef]
- Javed, T.; Li, Y.; Rashid, S.; Li, F.; Hu, Q.; Feng, H.; Chen, X.; Ahmad, S.; Liu, F.; Pulatov, B. Performance and relationship of four different agricultural drought indices for drought monitoring in China’s mainland using remote sensing data. Sci. Total Environ. 2021, 759, 143530. [Google Scholar] [CrossRef] [PubMed]
- Dalezios, N.R.; Blanta, A.; Spyropoulos, N.V.; Tarquis, A.M. Risk identification of agricultural drought for sustainable Agroecosystems. Nat. Hazards Earth Syst. Sci. 2014, 14, 2435–2448. [Google Scholar] [CrossRef]
- Ghaleb, F.; Mario, M.; Sandra, A.N. Regional Landsat-Based Drought Monitoring from 1982 to 2014. Climate 2015, 3, 563–577. [Google Scholar] [CrossRef]
- Zhao, J.; Huang, S.; Huang, Q.; Wang, H.; Leng, G.; Fang, W. Time-lagged response of vegetation dynamics to climatic and teleconnection factors. Catena 2020, 189, 104474. [Google Scholar] [CrossRef]
- Ma, M.; Wang, Q.; Liu, R.; Zhao, Y.; Zhang, D. Effects of climate change and human activities on vegetation coverage change in northern China considering extreme climate and time-lag and -accumulation effects. Sci. Total Environ. 2023, 860, 160527. [Google Scholar] [CrossRef]
- Wu, D.; Zhao, X.; Liang, S.; Zhou, T.; Huang, K.; Tang, B.; Zhao, W. Time-lag effects of global vegetation responses to climate change. Glob. Chang. Biol. 2015, 21, 3520–3531. [Google Scholar] [CrossRef]
- Kong, D.; Miao, C.; Wu, J.; Zheng, H.; Wu, S. Time lag of vegetation growth on the Loess Plateau in response to climate factors: Estimation, distribution, and influence. Sci. Total Environ. 2020, 744, 140726. [Google Scholar] [CrossRef]
- Wen, Y.; Liu, X.; Xin, Q.; Wu, J.; Xu, X.; Pei, F.; Li, X.; Du, G.; Cai, Y.; Lin, K.; et al. Cumulative Effects of Climatic Factors on Terrestrial Vegetation Growth. J. Geophys. Res.-Biogeo. 2019, 124, 789–806. [Google Scholar] [CrossRef]
- Ma, Z.; Fu, C. Some evidence of drying trend over northern China from 1951 to 2004. Chin. Sci. Bull. 2006, 51, 2913–2925. [Google Scholar] [CrossRef]
- Yuan, Z.; Yan, D.H.; Yang, Z.Y.; Yin, J.; Yuan, Y. Temporal and spatial variability of drought in Huang-Huai-Hai River Basin, China. Theor. Appl. Climatol. 2015, 122, 755–769. [Google Scholar] [CrossRef]
- Ji, S.; Ren, S.; Li, Y.; Dong, J.; Wang, L.; Quan, Q.; Liu, J. Diverse responses of spring phenology to preseason drought and warming under different biomes in the North China Plain. Sci. Total Environ. 2021, 766, 144437. [Google Scholar] [CrossRef] [PubMed]
- Wu, X.; Wang, L.; Yao, R.; Luo, M.; Li, X. Identifying the dominant driving factors of heat waves in the North China Plain. Atmos. Res. 2021, 252, 105458. [Google Scholar] [CrossRef]
- Wang, J.L.; Li, Z.J. Extreme-point symmetric mode decomposition method for data analysis. Adv. Adapt. Data Anal. 2013, 5, 1350015. [Google Scholar] [CrossRef]
- Lin, Q.; Wu, Z.; Singh, V.P.; Sadeghi, S.H.R.; He, H.; Lu, G. Correlation between hydrological drought, climatic factors, reservoir operation, and vegetation cover in the Xijiang Basin, South China. J. Hydrol. 2017, 549, 512–524. [Google Scholar] [CrossRef]
- Hamed, K.H.; Ramachandra Rao, A. A modified Mann-Kendall trend test for autocorrelated data. J. Hydrol. 1998, 204, 182–196. [Google Scholar] [CrossRef]
- Guo, Y.; Huang, S.; Huang, Q.; Wang, H.; Fang, W.; Yang, Y.; Wang, L. Assessing socioeconomic drought based on an improved Multivariate Standardized Reliability and Resilience Index. J. Hydrol. 2019, 568, 904–918. [Google Scholar] [CrossRef]
- Sakao, T.; Lindahl, M. A method to improve integrated product service offerings based on life cycle costing. CIRP Ann. 2015, 64, 33–36. [Google Scholar] [CrossRef]
- Li, C.; Chen, J.; Wu, X.; Zhou, M.; Wei, Y.; Liu, Y.; Liu, L.; Peng, L.; Dou, T.; Li, L. Persistent effects of global warming on vegetation growth are regulated by water in China during 2001–2017. J. Clean. Prod. 2022, 381, 135198. [Google Scholar] [CrossRef]
- Bento, V.A.; Gouveia, C.M.; DaCamara, C.C.; Trigo, I.F. A climatological assessment of drought impact on vegetation health index. Agric. For. Meteorol. 2018, 259, 286–295. [Google Scholar] [CrossRef]
- Li, Y.; Strapasson, A.; Rojas, O. Assessment of El Niño and La Niña impacts on China: Enhancing the Early Warning System on Food and Agriculture. Weather Clim. Extrem. 2020, 27, 100208. [Google Scholar] [CrossRef]
- Hu, T.; van Dijk, A.I.J.M.; Renzullo, L.J.; Xu, Z.; He, J.; Tian, S.; Zhou, J.; Li, H. On agricultural drought monitoring in Australia using Himawari-8 geostationary thermal infrared observations. Int. J. Appl. Earth Obs. 2020, 91, 102153. [Google Scholar] [CrossRef]
- Li, X.; Ju, H.; Liu, Q.; Li, Y.; Qin, X. Analysis of drought characters based on the SPEI-PM index in Huang-Huai-Hai Plain. Acta Ecol. Sin. 2017, 37, 2054–2066. [Google Scholar]
- Zhang, H.L.; Zhao, X.; Yin, X.G.; Liu, S.L.; Xue, J.F.; Wang, M.; Pu, C.; Lal, R.; Chen, F. Challenges and adaptations of farming to climate change in the North China Plain. Clim. Chang. 2015, 129, 213–224. [Google Scholar] [CrossRef]
- Ma, Z.; Fu, C. Interannual characteristics of the surface hydrological variables over the arid and semi-arid areas of northern China. Glob. Planet Chang. 2003, 37, 189–200. [Google Scholar] [CrossRef]
- Ding, Y.; Li, Z.; Peng, S. Global analysis of time-lag and -accumulation effects of climate on vegetation growth. Int. J. Appl. Earth Obs. 2020, 92, 102179. [Google Scholar] [CrossRef]
- Ma, Y.J.; Shi, F.Z.; Hu, X.; Li, X.Y. Climatic Constraints to Monthly Vegetation Dynamics in Desert Areas Over the Silk Road Economic Belt. Remote Sens. 2021, 13, 995. [Google Scholar] [CrossRef]
- Li, H.; Kaufmann, H.; Xu, G. Modeling Spatio-temporal Drought Events Based on Multi-temporal, Multi-source Remote Sensing Data Calibrated by Soil Humidity. Chin. Geogr. Sci. 2022, 32, 127–141. [Google Scholar] [CrossRef]
- Chen, L.; Duan, J.; Ma, Z. Objective analysis on large-scale circulation type and its links to precipitation over China. Adv. Earth Sci. 2018, 33, 396–403. [Google Scholar]
- Huang, H.; Cao, M.; Song, J.; Han, Y.; Chen, S. Temporal and spatial changes of potential evapotranspiration and its influencing factors in China from 1957 to 2012. J. Nat. Resour. 2015, 30, 315–326. [Google Scholar]
- Ma, Z.; Fu, C.; Yang, Q.; Zheng, Z.; Lv, M.; Li, M.; Duan, Y.; Chen, L. Drying trend in northern China and its shift during 1951–2016. Chin. J. Atmos. Sci. 2018, 42, 951–961. [Google Scholar]
- Shi, S.; Wang, P.; Zhang, Y.; Yu, J. Cumulative and time-lag effects of the main climate factors on natural vegetation across Siberia. Ecol. Indic. 2021, 133, 108446. [Google Scholar] [CrossRef]
- Yuan, Y.; Bao, A.; Jiapaer, G.; Jiang, L.; De Maeyer, P. Phenology-based seasonal terrestrial vegetation growth response to climate variability with consideration of cumulative effect and biological carryover. Sci. Total Environ. 2022, 817, 152805. [Google Scholar] [CrossRef]
- Bertrand, R.; Lenoir, J.; Piedallu, C.; Riofrío-Dillon, G.; de Ruffray, P.; Vidal, C.; Pierrat, J.C.; Gégout, J.C. Changes in plant community composition lag behind climate warming in lowland forests. Nature 2011, 479, 517–520. [Google Scholar] [CrossRef]
- Mulder, C.P.H.; Iles, D.T.; Rockwell, R.F. Increased variance in temperature and lag effects alter phenological responses to rapid warming in a subarctic plant community. Glob. Chang. Biol. 2017, 23, 801–814. [Google Scholar] [CrossRef]
- Huang, W.H.; Wang, H.L. Drought and intensified agriculture enhanced vegetation growth in the central Pearl River Basin of China. Agr. Water Manag. 2021, 256, 107077. [Google Scholar] [CrossRef]
- Chen, H.; Zhang, W.C.; Nie, N.; Guo, Y.D. Long-term groundwater storage variations estimated in the Songhua River Basin by using GRACE products, land surface models, and in-situ observations. Sci. Total Environ. 2019, 649, 372–387. [Google Scholar] [CrossRef]
- Sun, Z.L.; Zhu, X.F.; Pan, Y.Z.; Zhang, J.S.; Liu, X.F. Drought evaluation using the GRACE terrestrial water storage deficit over the Yangtze River Basin, China. Sci. Total Environ. 2018, 634, 727–738. [Google Scholar] [CrossRef]
- Flower, C.E.; Gonzalez-Meler, M.A. Responses of Temperate Forest Productivity to Insect and Pathogen Disturbances. Annu. Rev. Plant Biol. 2015, 66, 547–569. [Google Scholar] [CrossRef] [PubMed]
- Huang, M.; Wang, X.; Keenan, T.F.; Piao, S. Drought timing influences the legacy of tree growth recovery. Glob. Chang. Biol. 2018, 24, 3546–3559. [Google Scholar] [CrossRef] [PubMed]
- Liu, X.; Liang, X.; Li, X.; Xu, X.; Ou, J.; Chen, Y.; Li, S.; Wang, S.; Pei, F. A future land use simulation model (FLUS) for simulating multiple land use scenarios by coupling human and natural effects. Landsc. Urban Plan. 2017, 168, 94–116. [Google Scholar] [CrossRef]
Figure 1.
(a) Administrative sub-zones and (b) land use types in NCP.
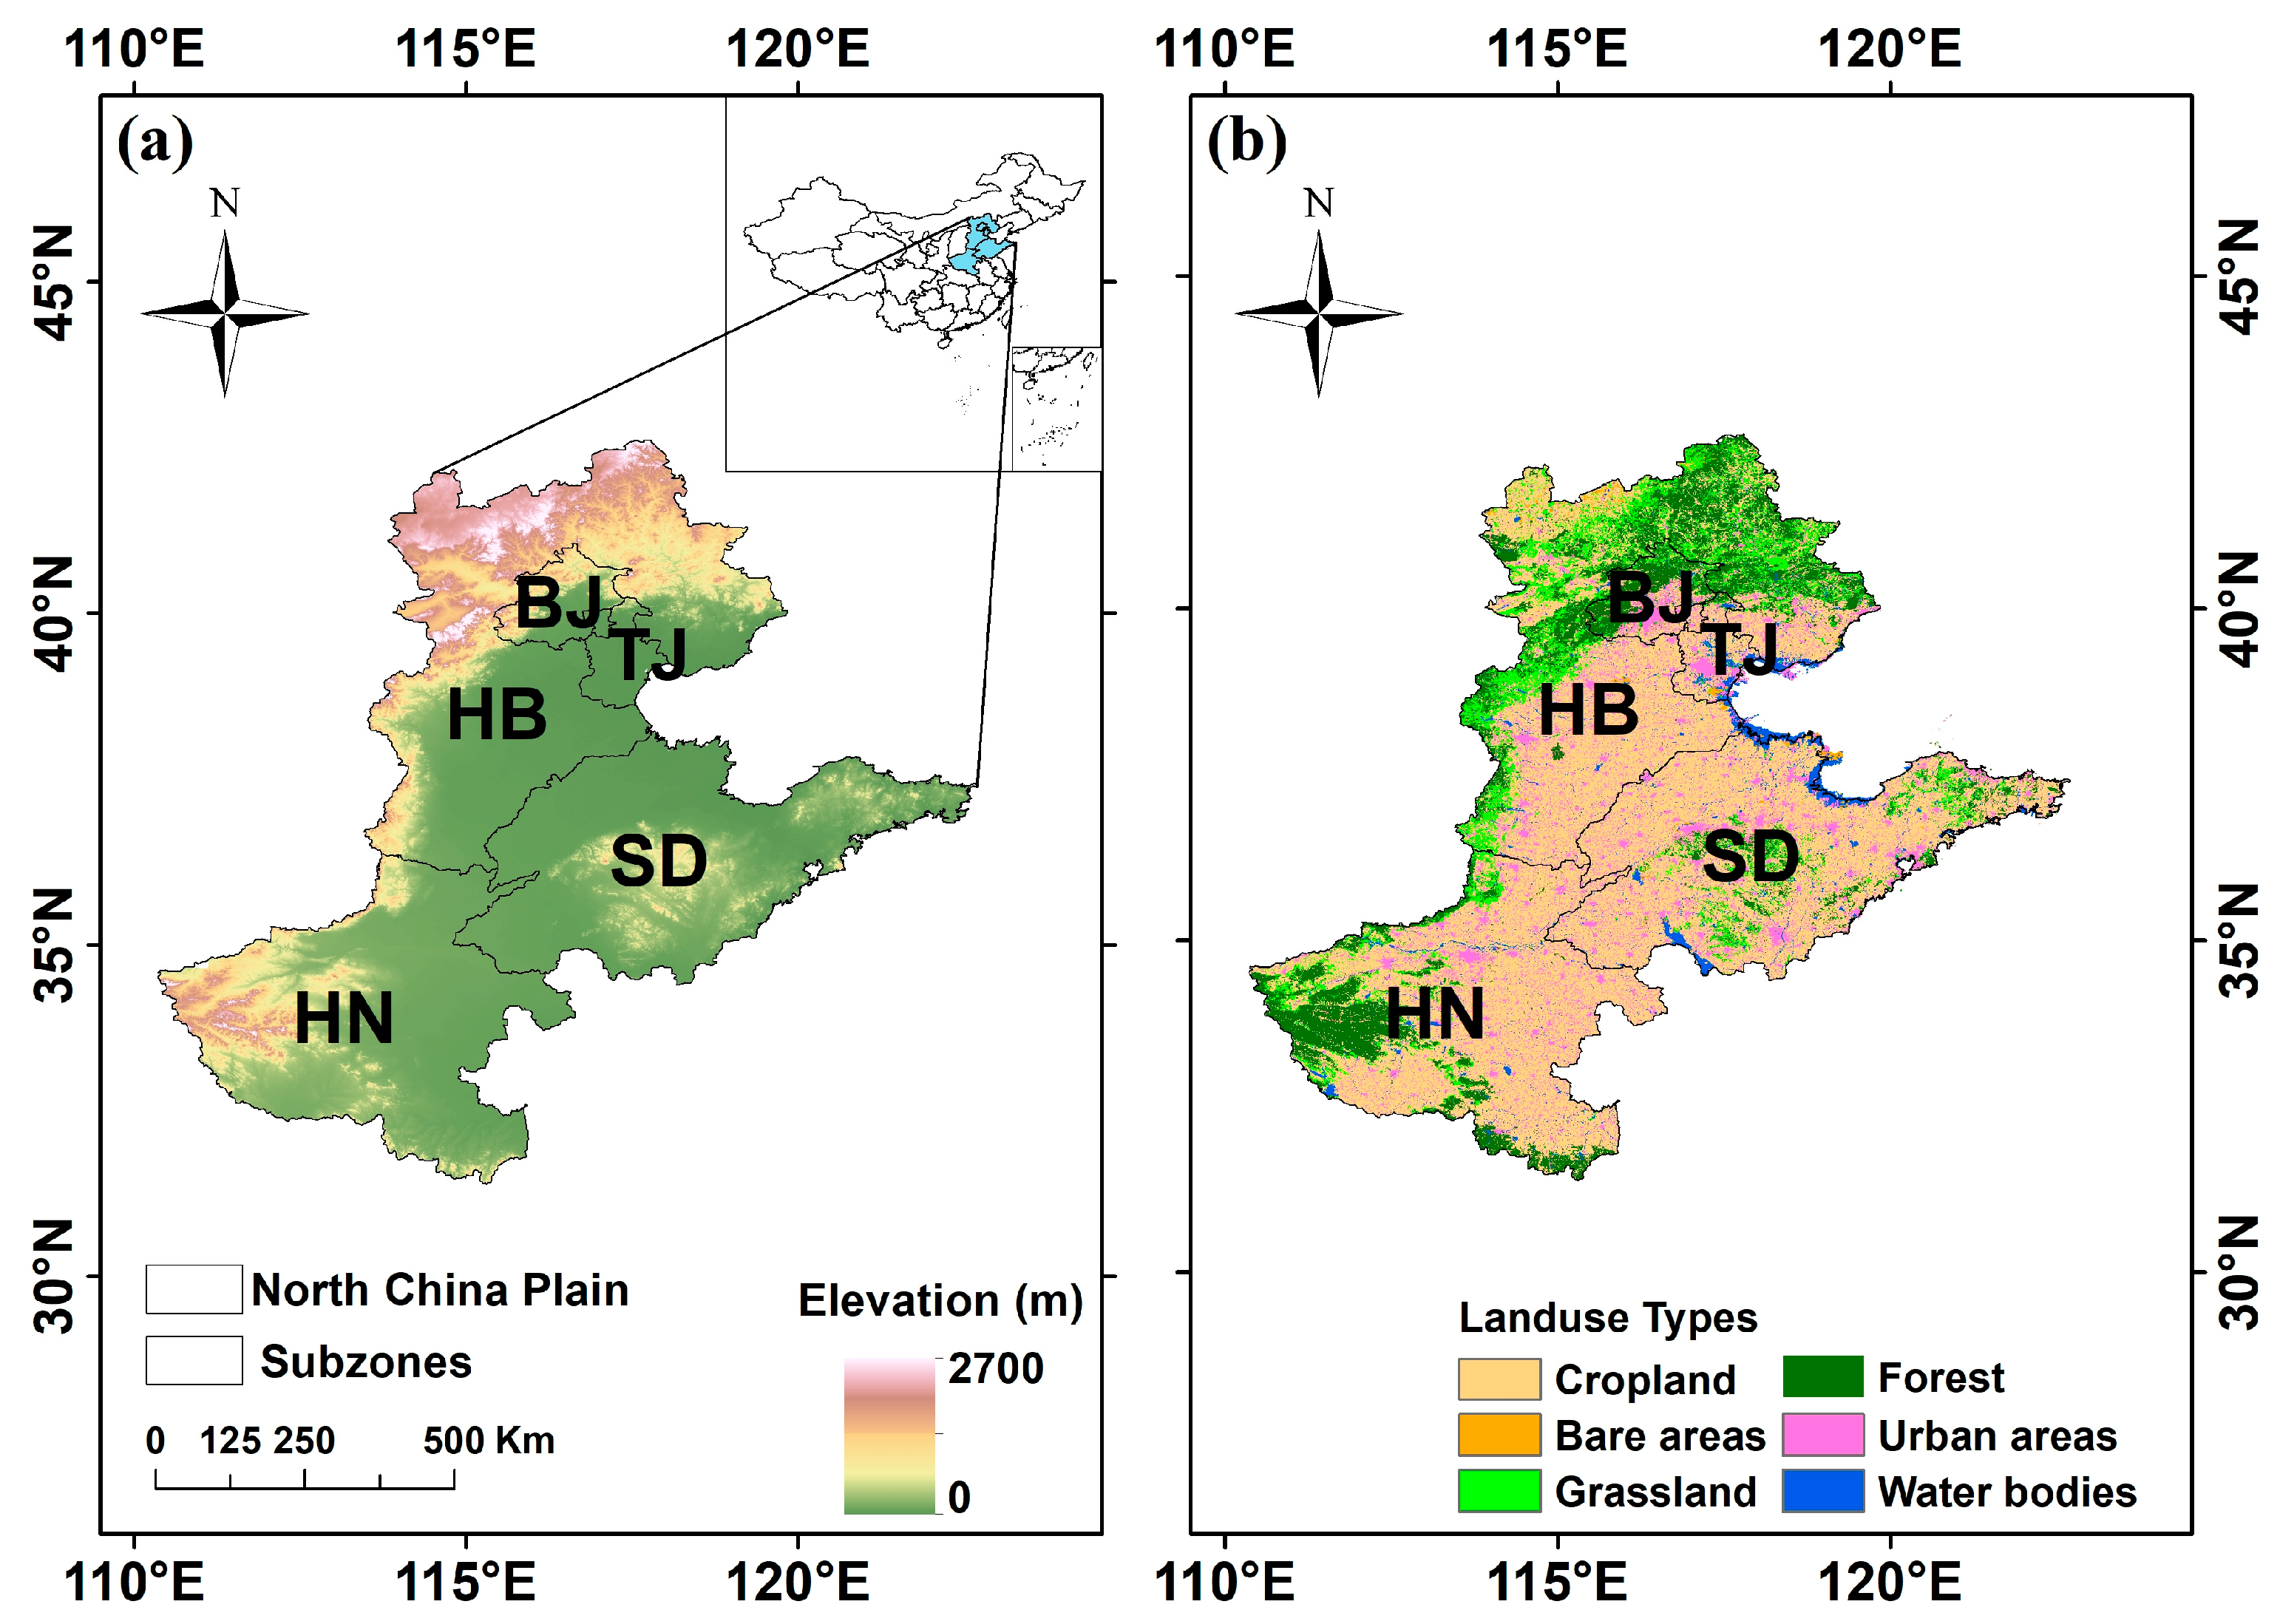
Figure 2.
The methodology flow chart in this study.

Figure 3.
PSMD of VHI sequence in (a) BJ, (b) TJ, (c) SD, (d) HN, (e) HB, and (f) NCP.
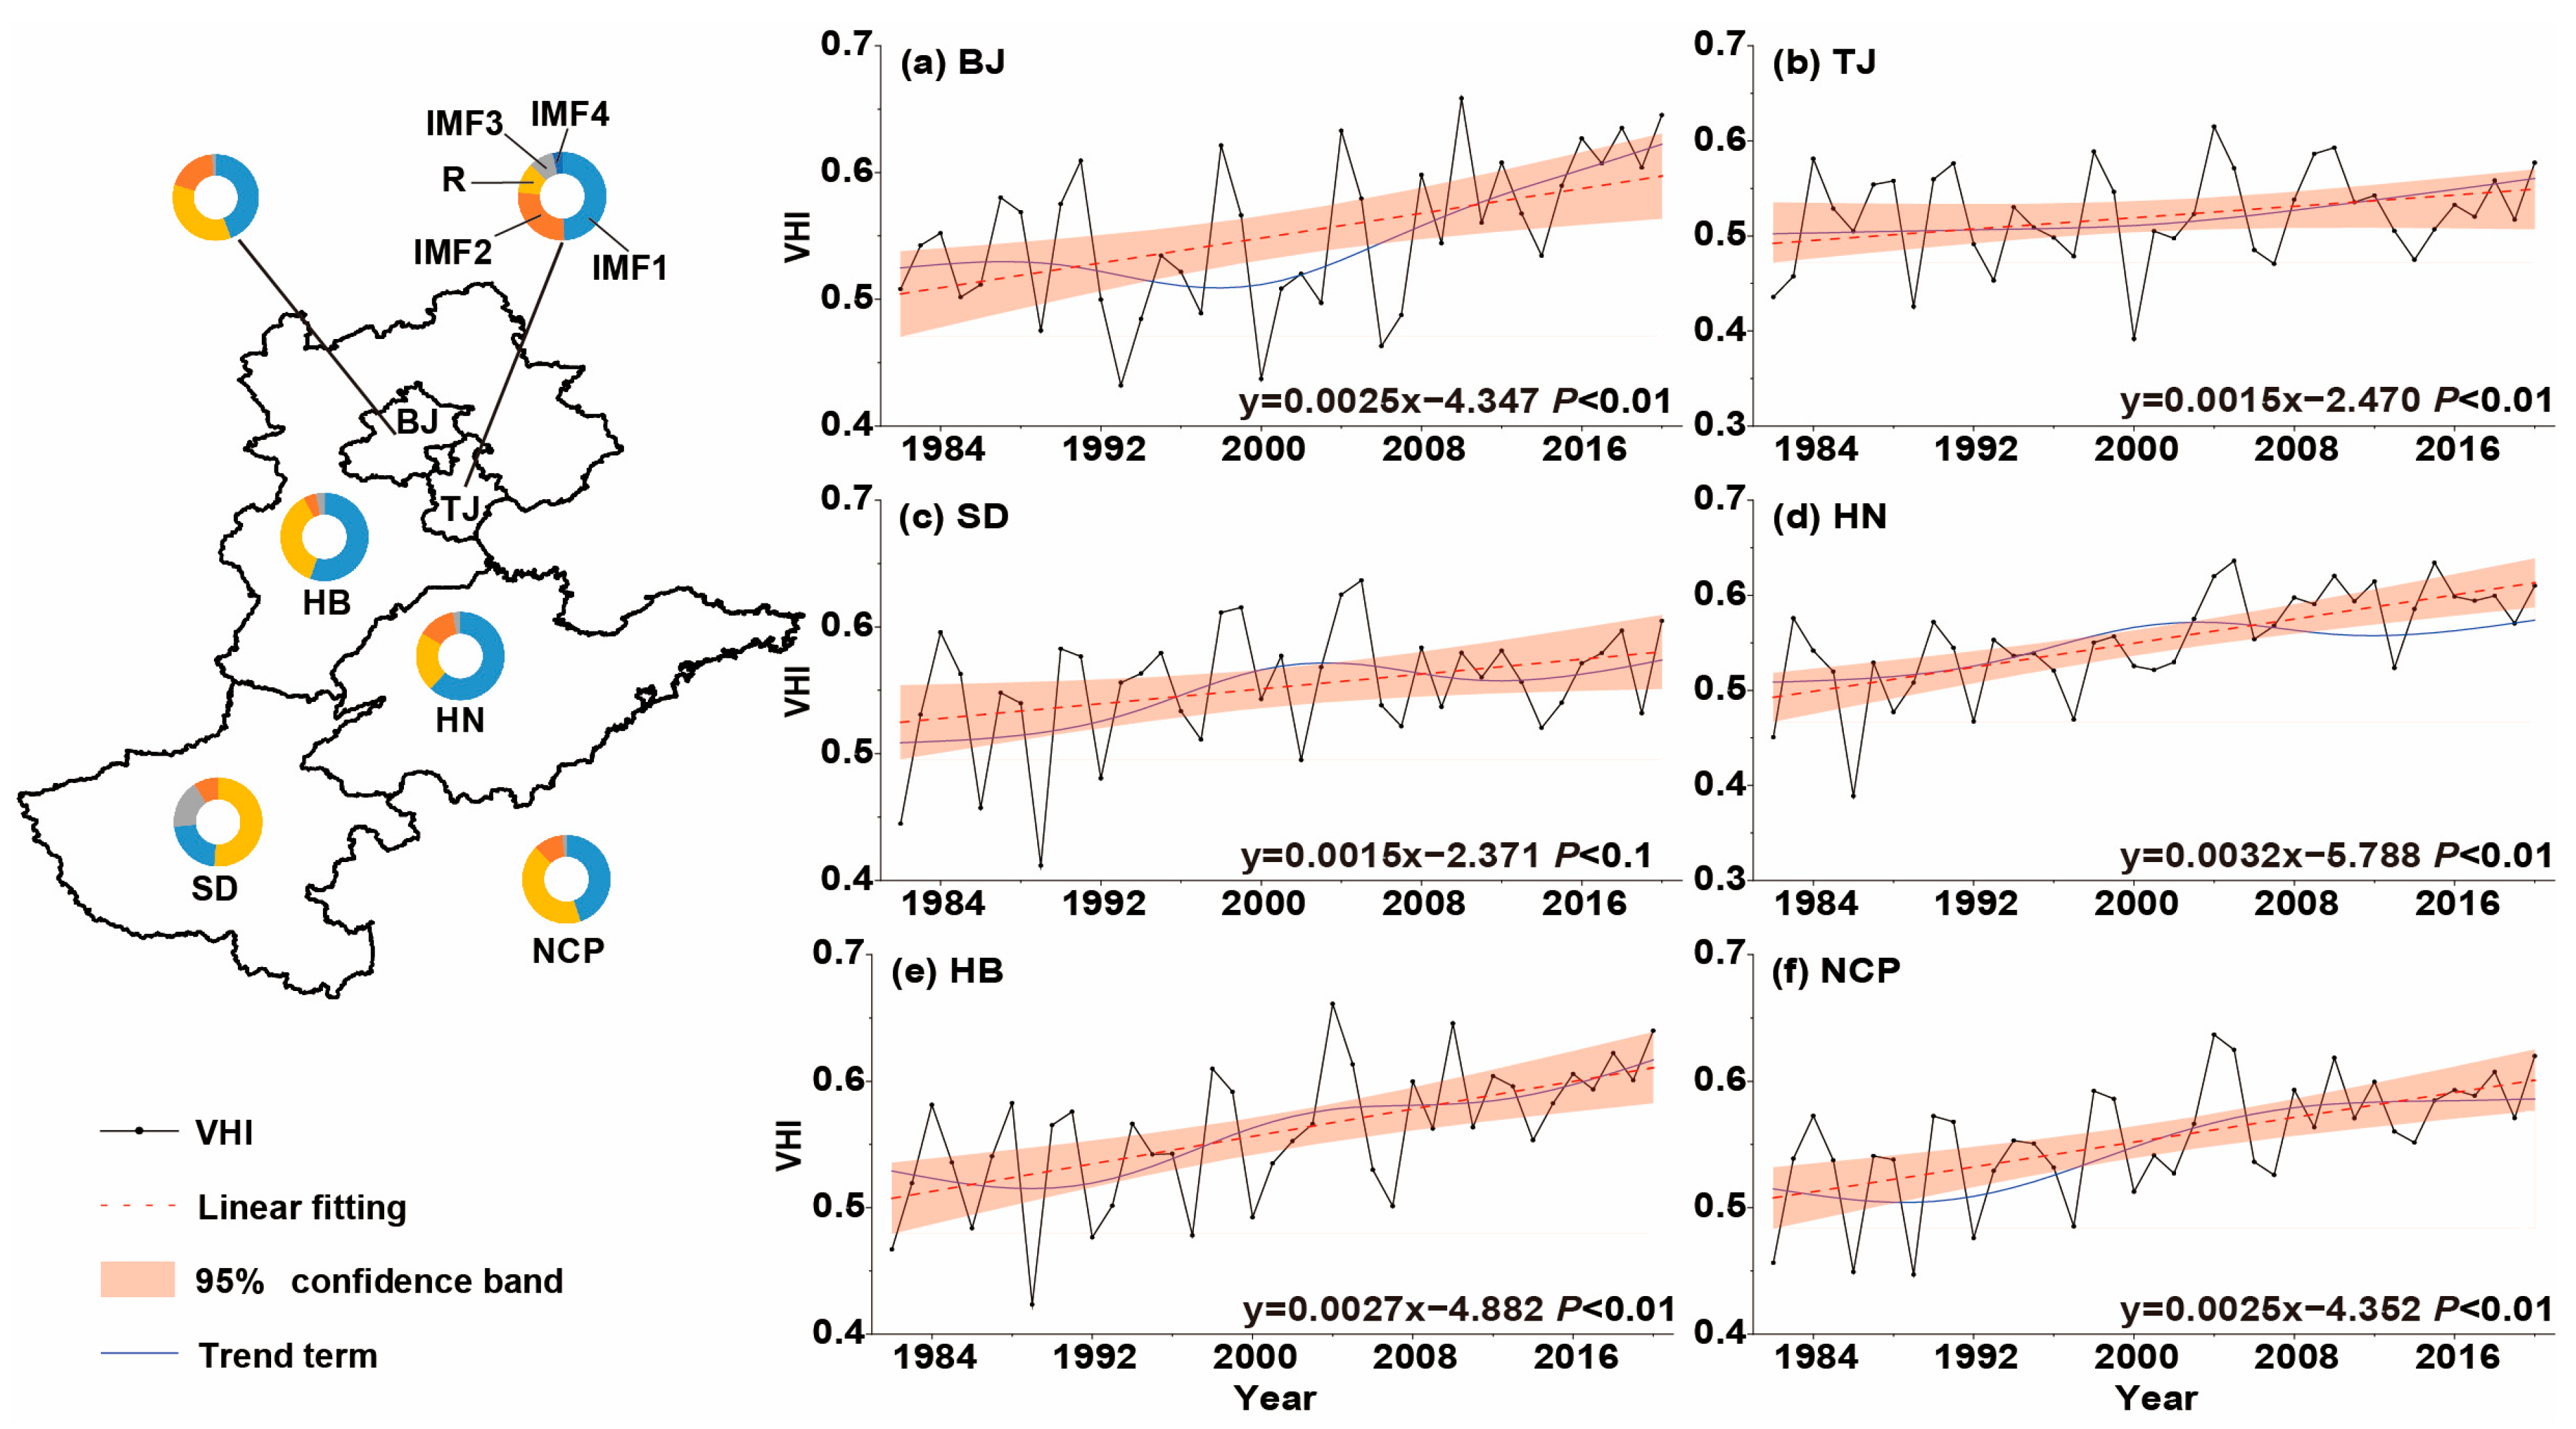
Figure 4.
Original sequence and trend term R of climate factors.

Figure 5.
(a) The statistical Zs value and (b) significance level p-value of VHI in NCP.
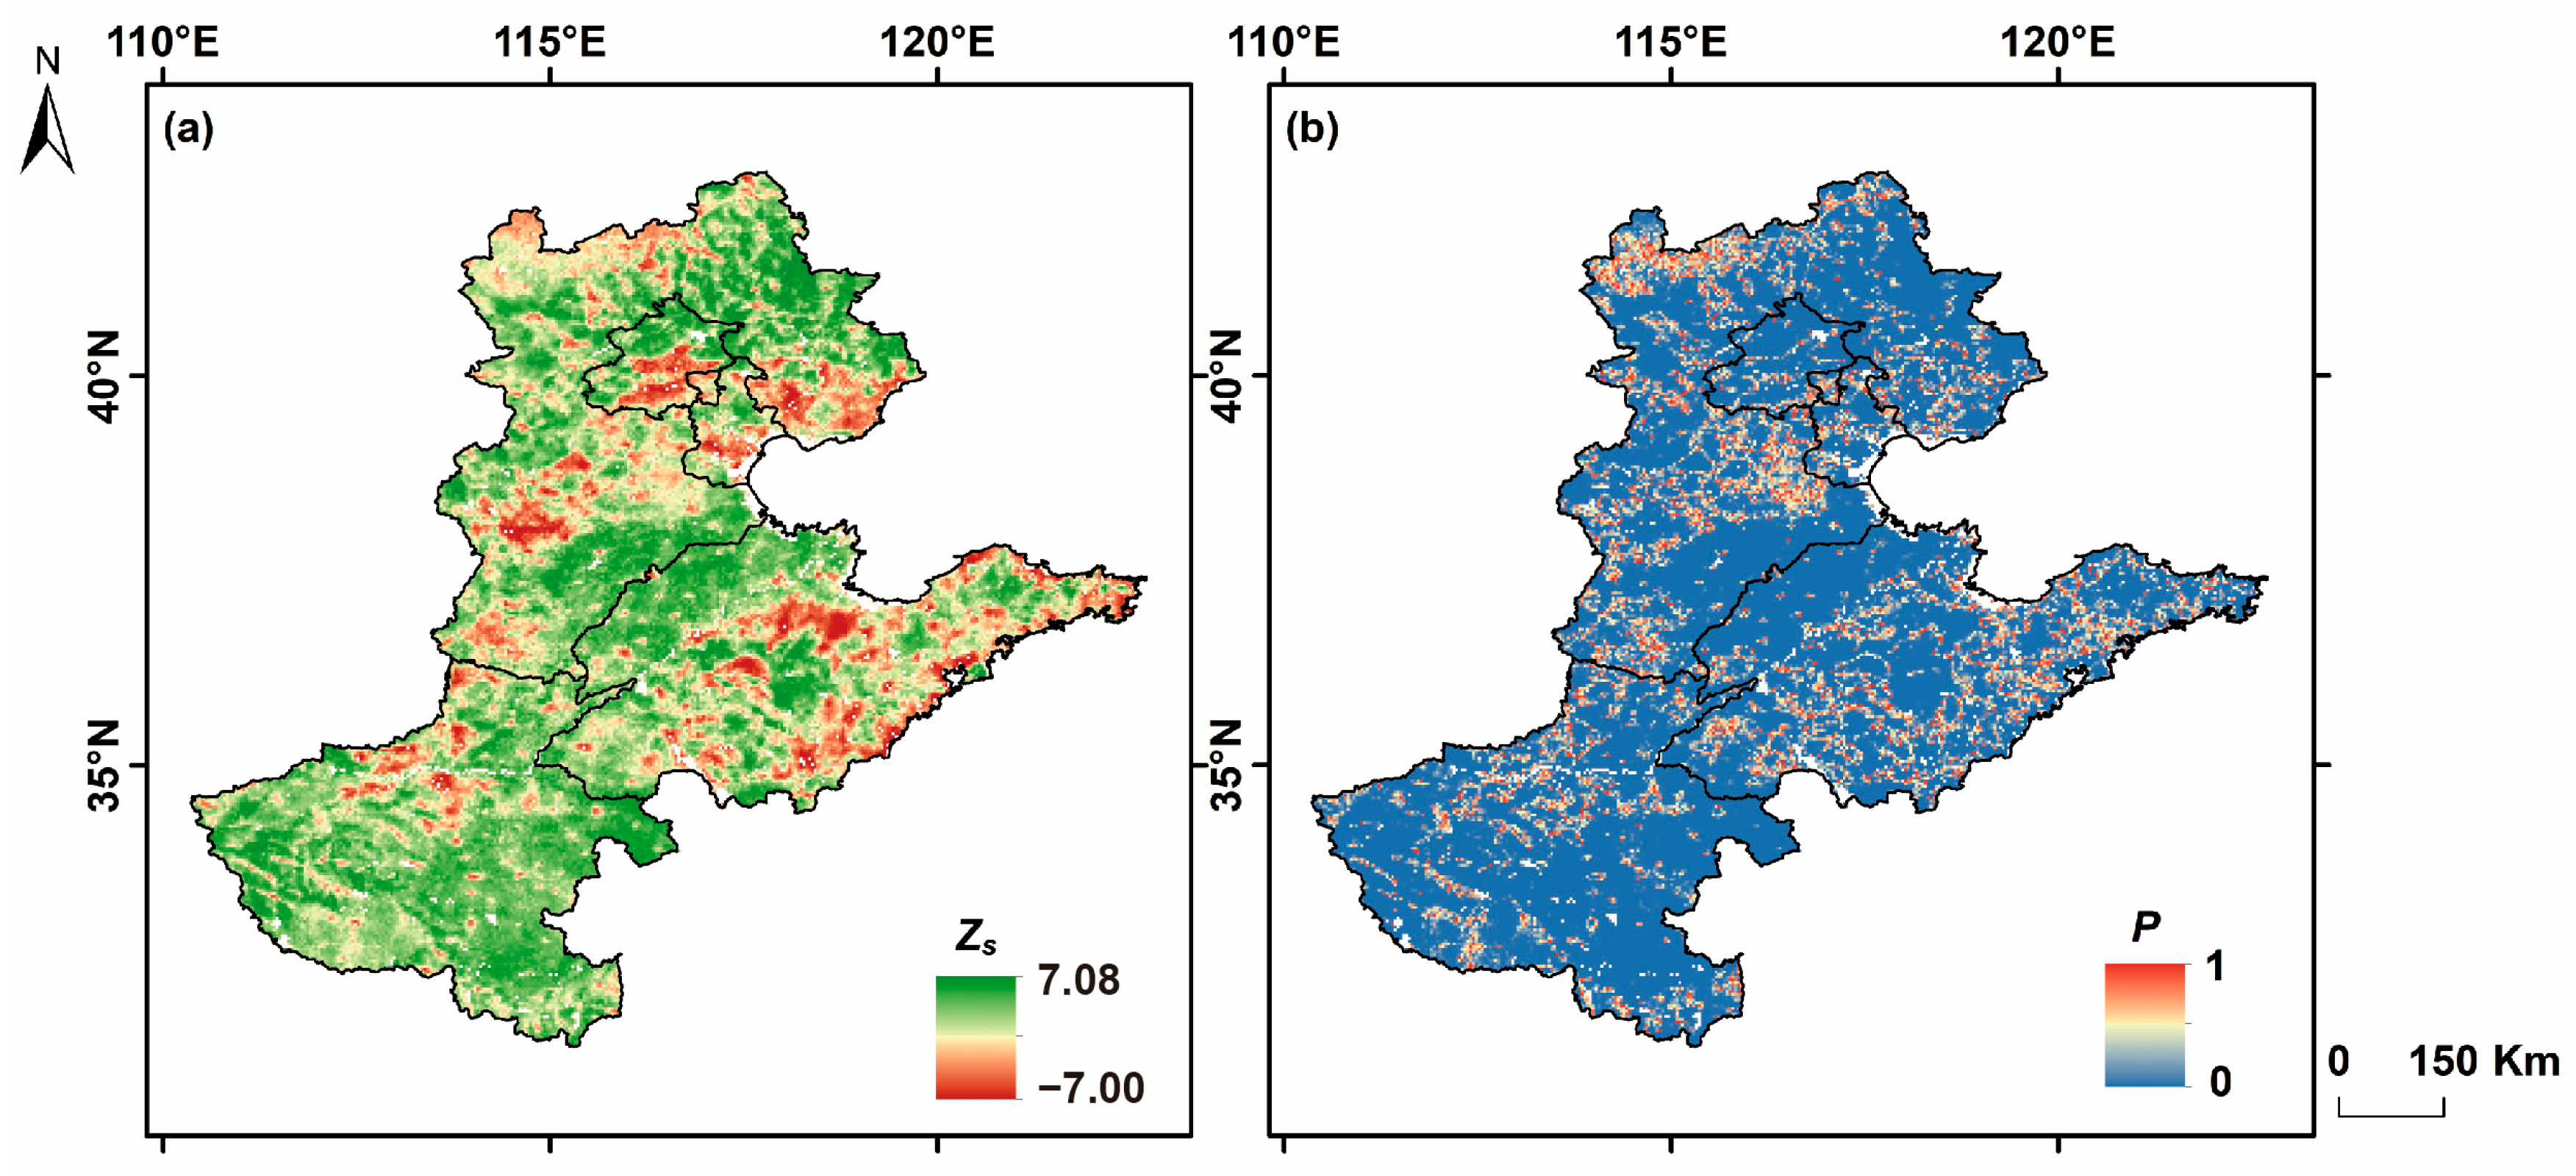
Figure 6.
The trend test of climatic factors (a) AT, (b) P, (c) ET, (d) SH, (e) SM, and (f) ST based on IGT method.
Figure 6.
The trend test of climatic factors (a) AT, (b) P, (c) ET, (d) SH, (e) SM, and (f) ST based on IGT method.
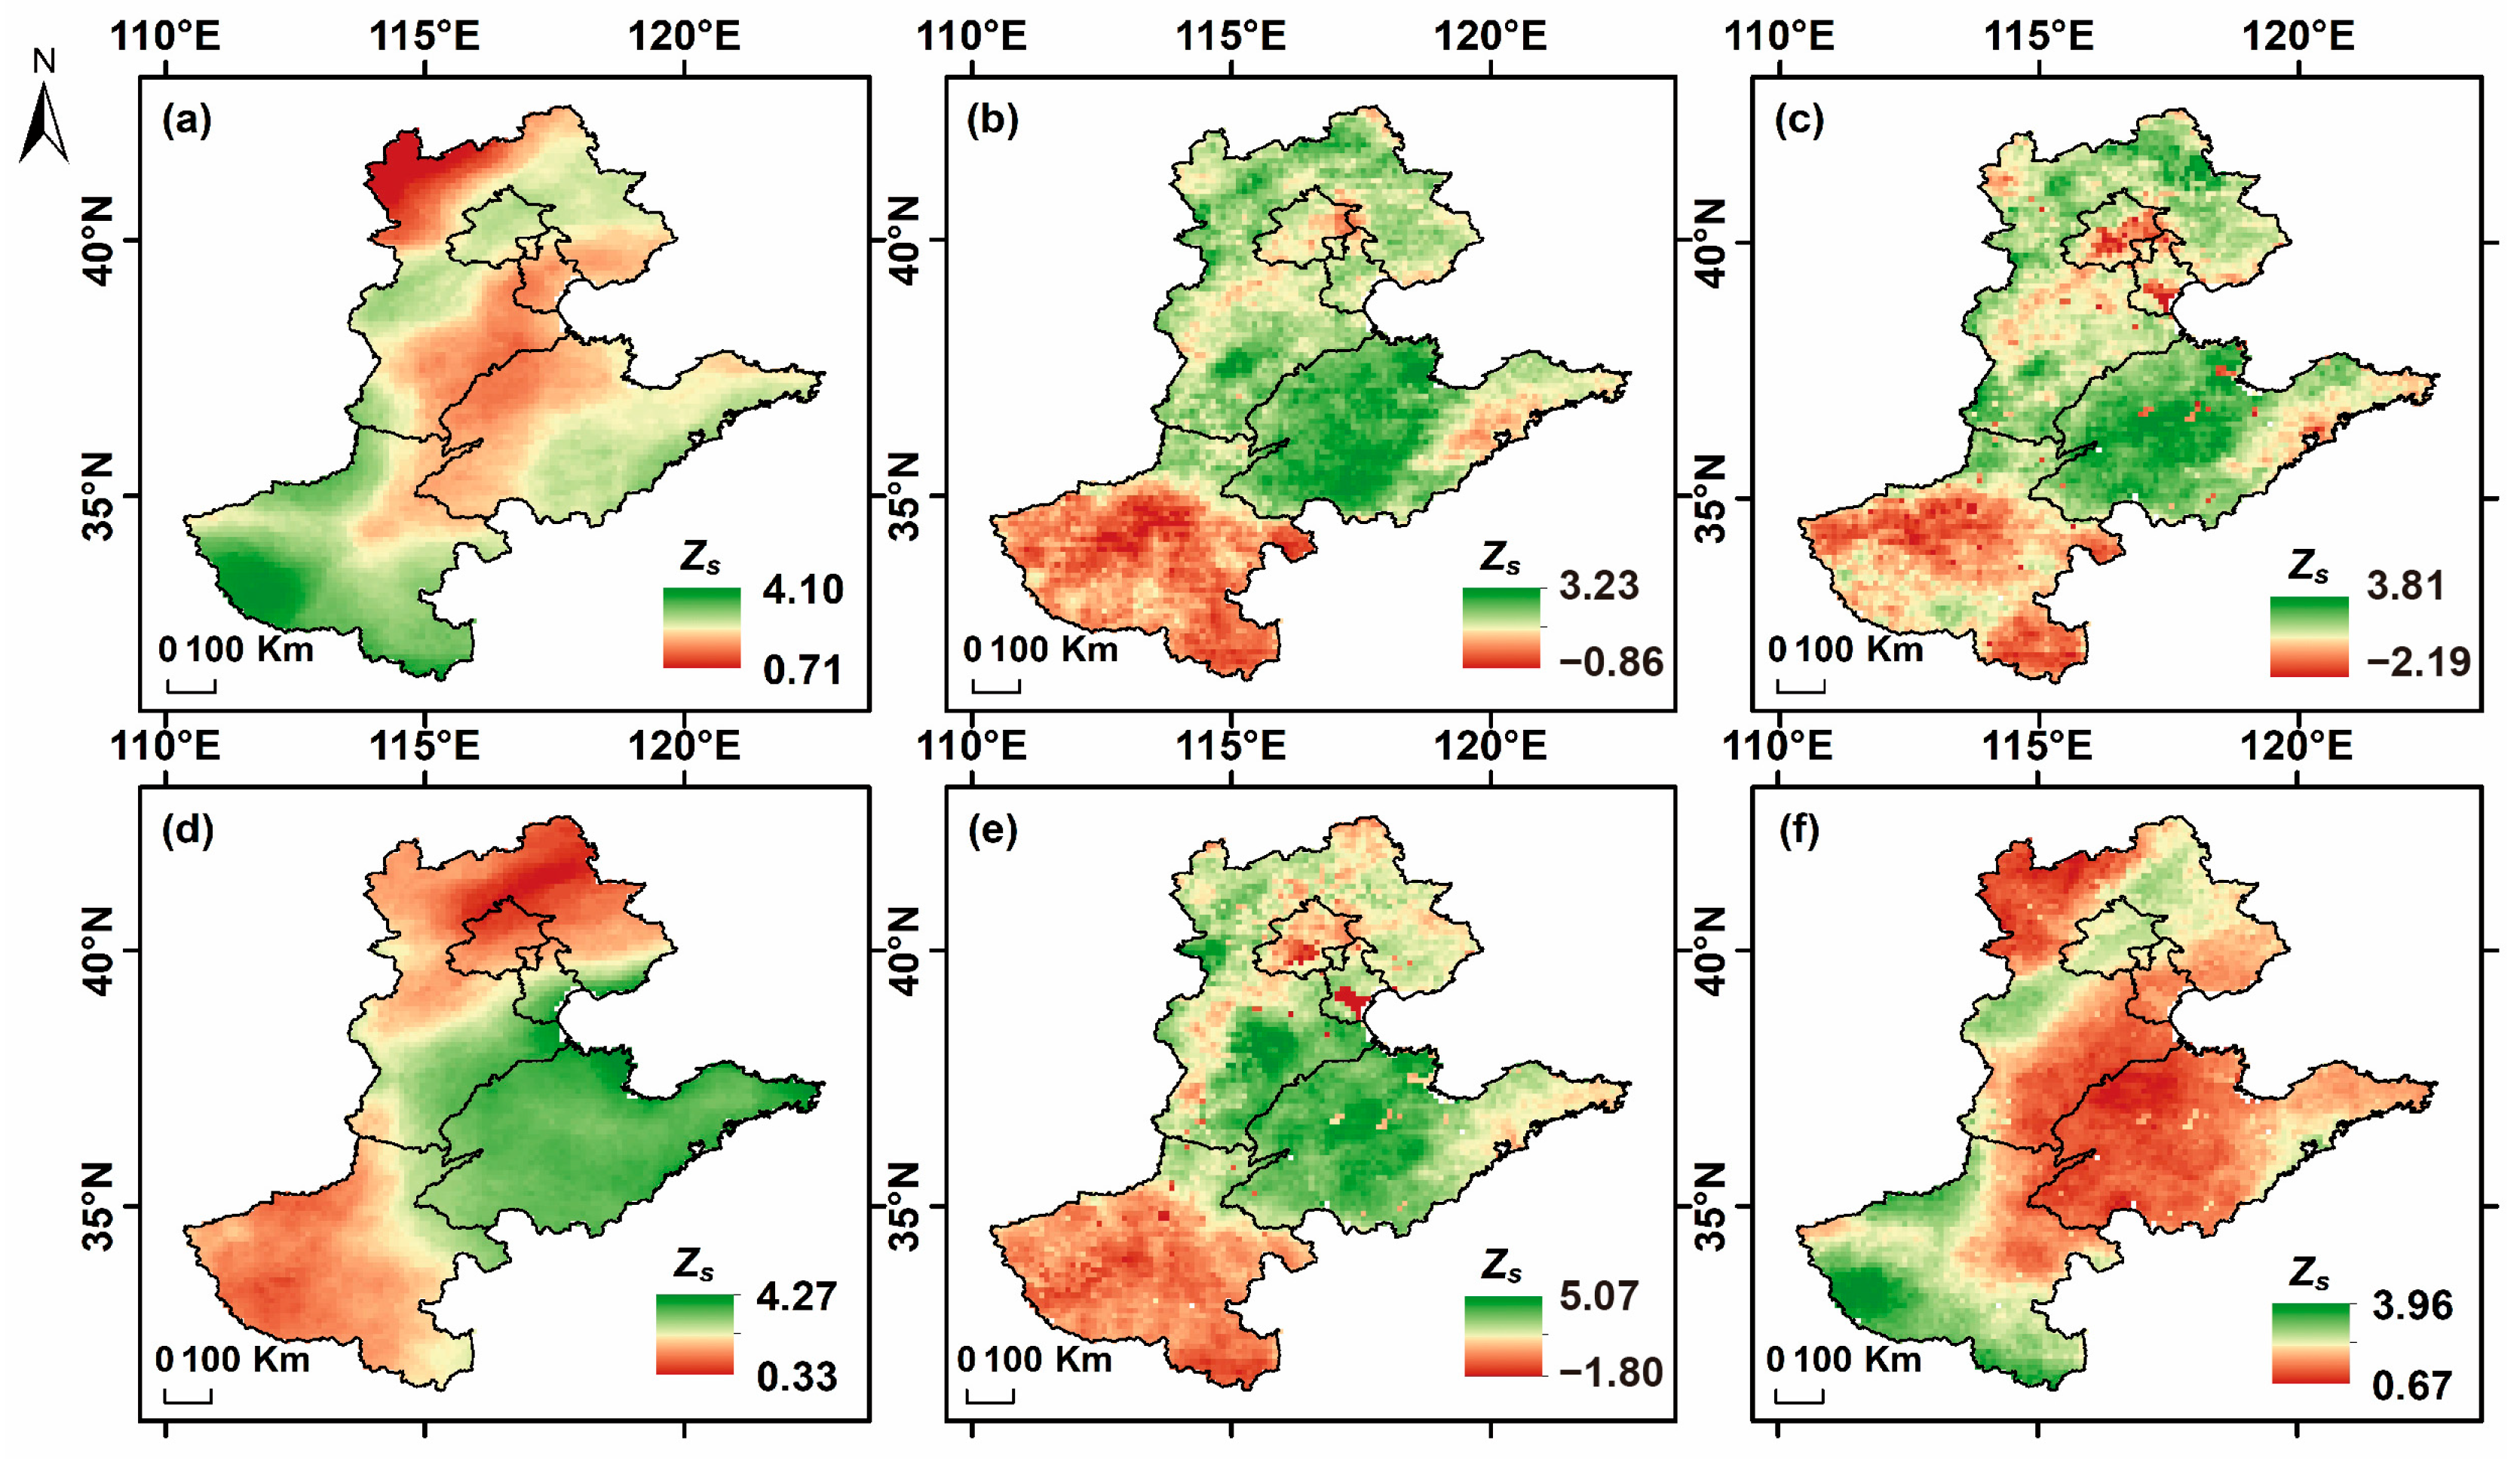
Figure 7.
The correlations between climate factors (a) AT, (b) P, (c) ET, (d) SH, (e) SM, and (f) ST and VHI without time accumulation.
Figure 7.
The correlations between climate factors (a) AT, (b) P, (c) ET, (d) SH, (e) SM, and (f) ST and VHI without time accumulation.
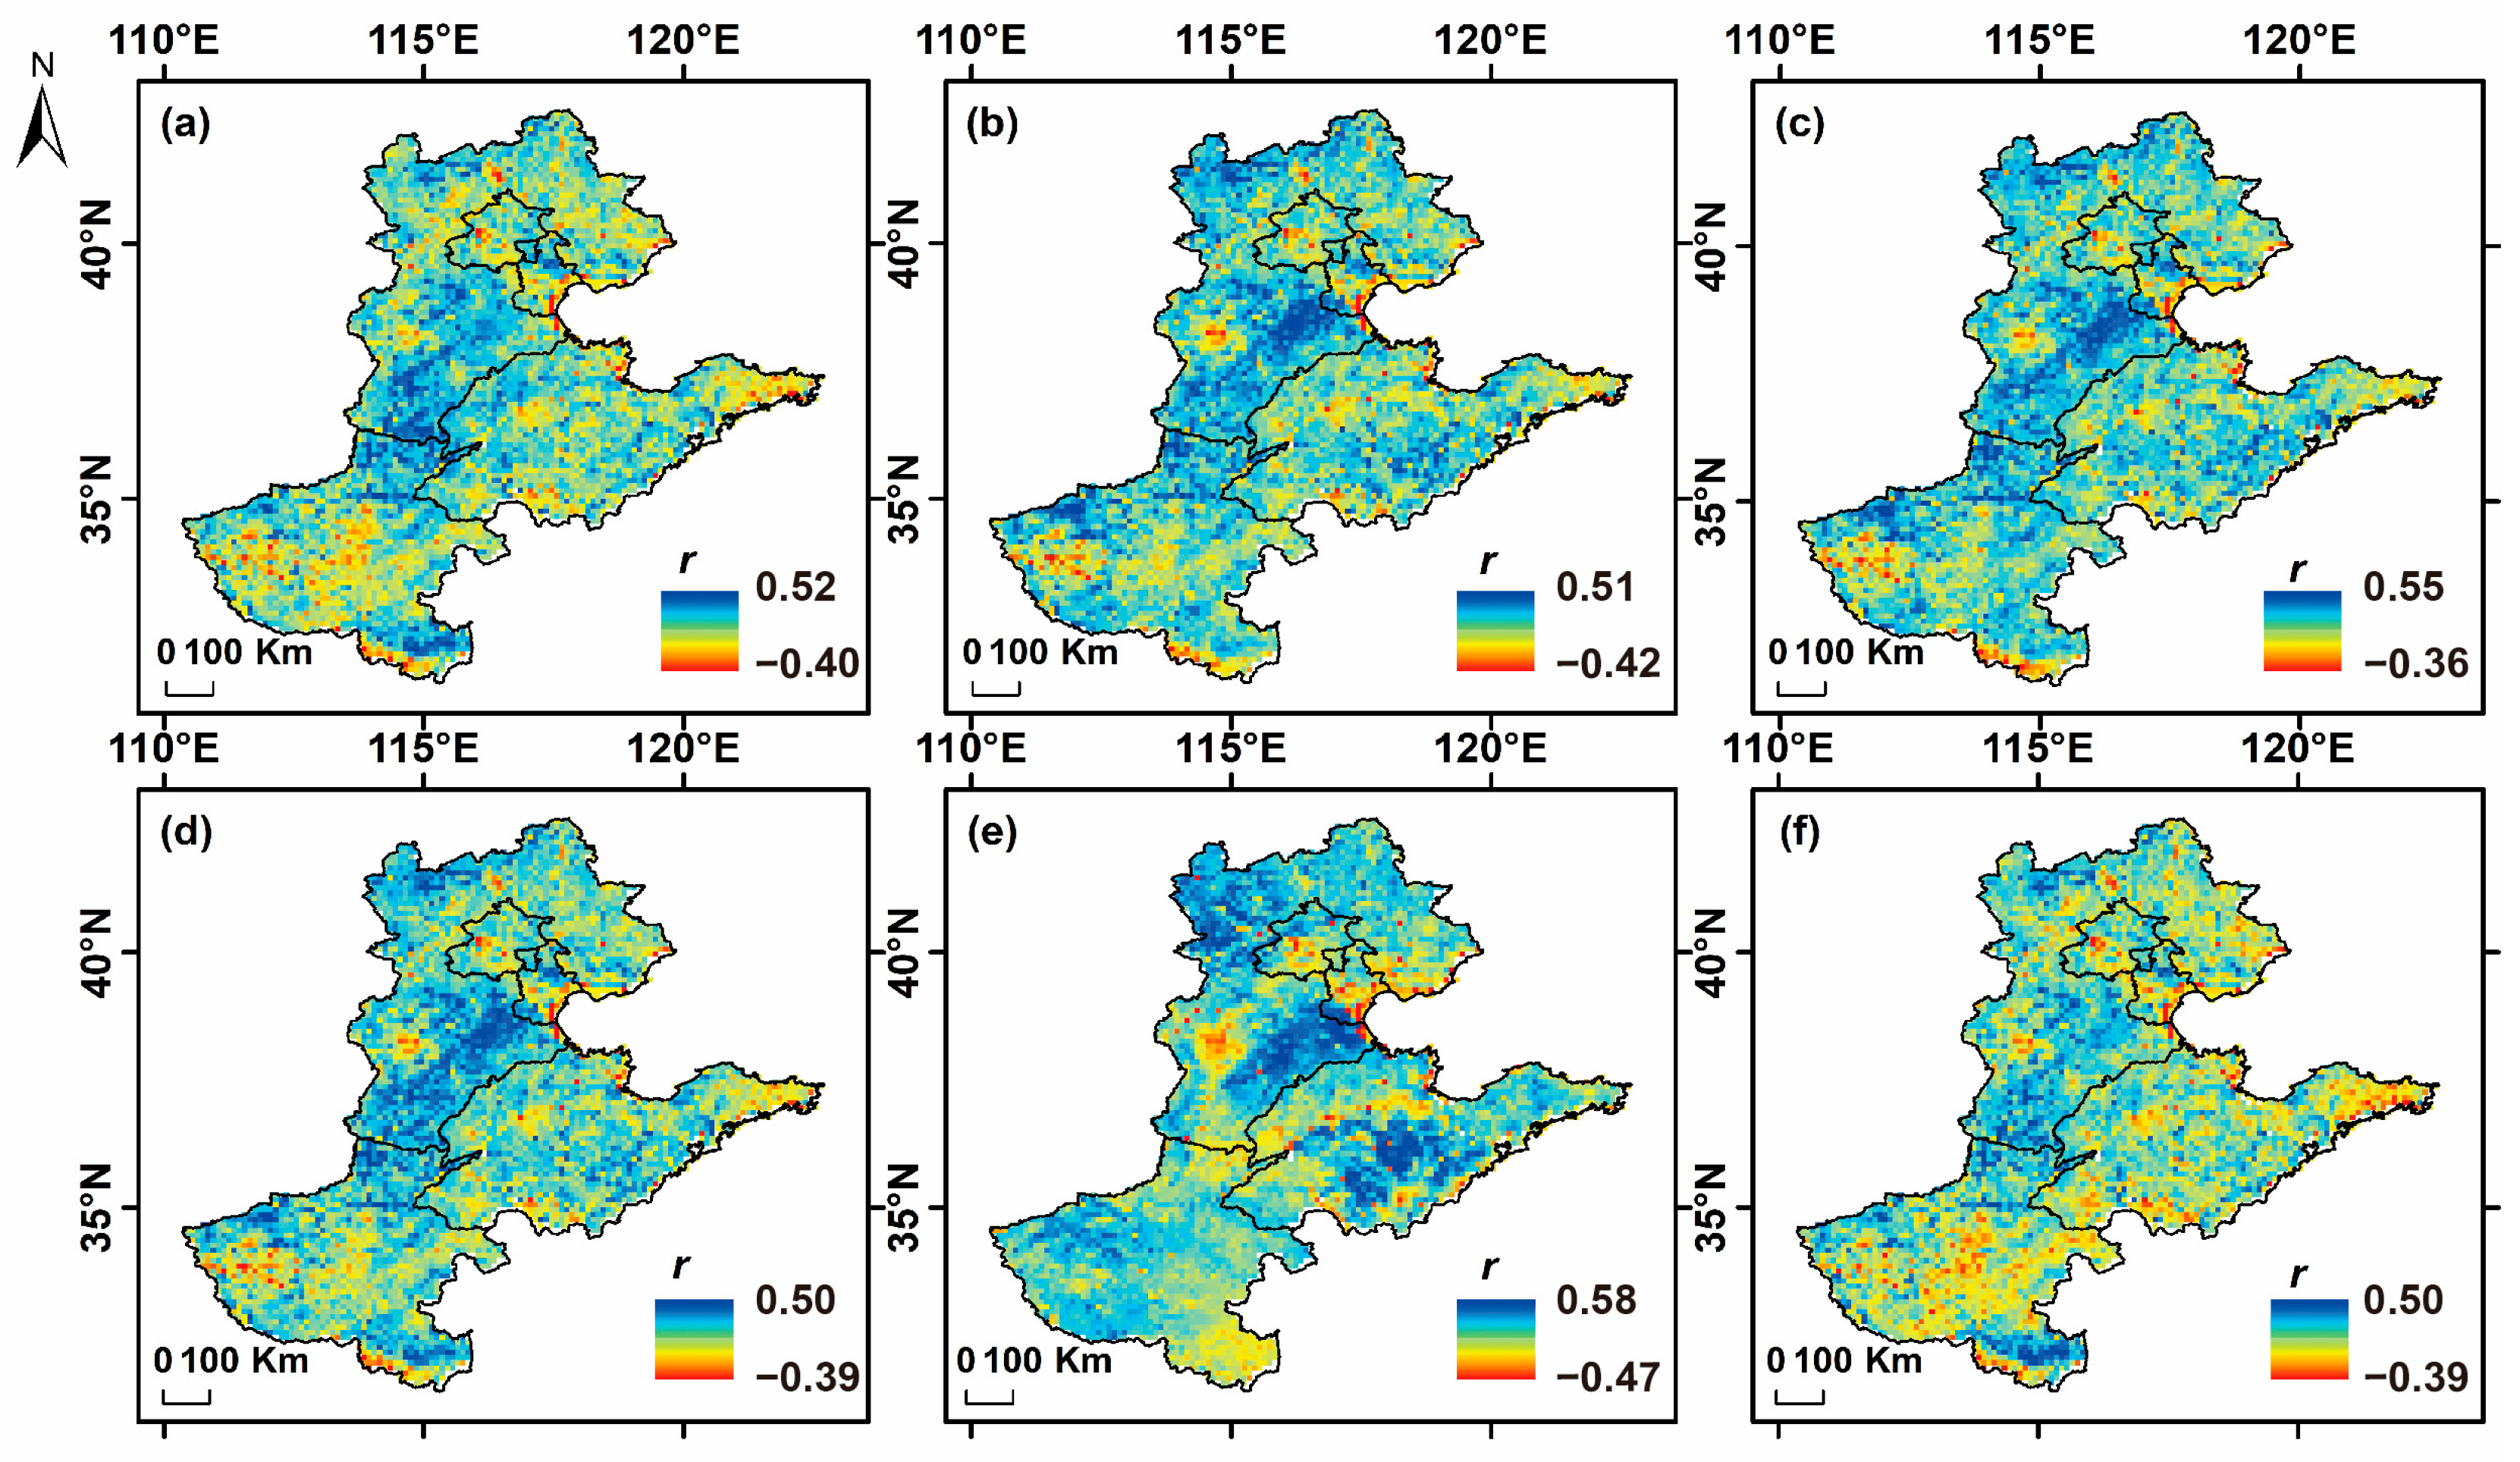
Figure 8.
The correlations between climate factors accumulated for 1, 2, and 3 months and VHI. (a–f) denote climate factors accumulated for 1 month, (g–l) denote climate factors accumulated for 2 months, and (m–r) denote climate factors accumulated for 3 months.
Figure 8.
The correlations between climate factors accumulated for 1, 2, and 3 months and VHI. (a–f) denote climate factors accumulated for 1 month, (g–l) denote climate factors accumulated for 2 months, and (m–r) denote climate factors accumulated for 3 months.
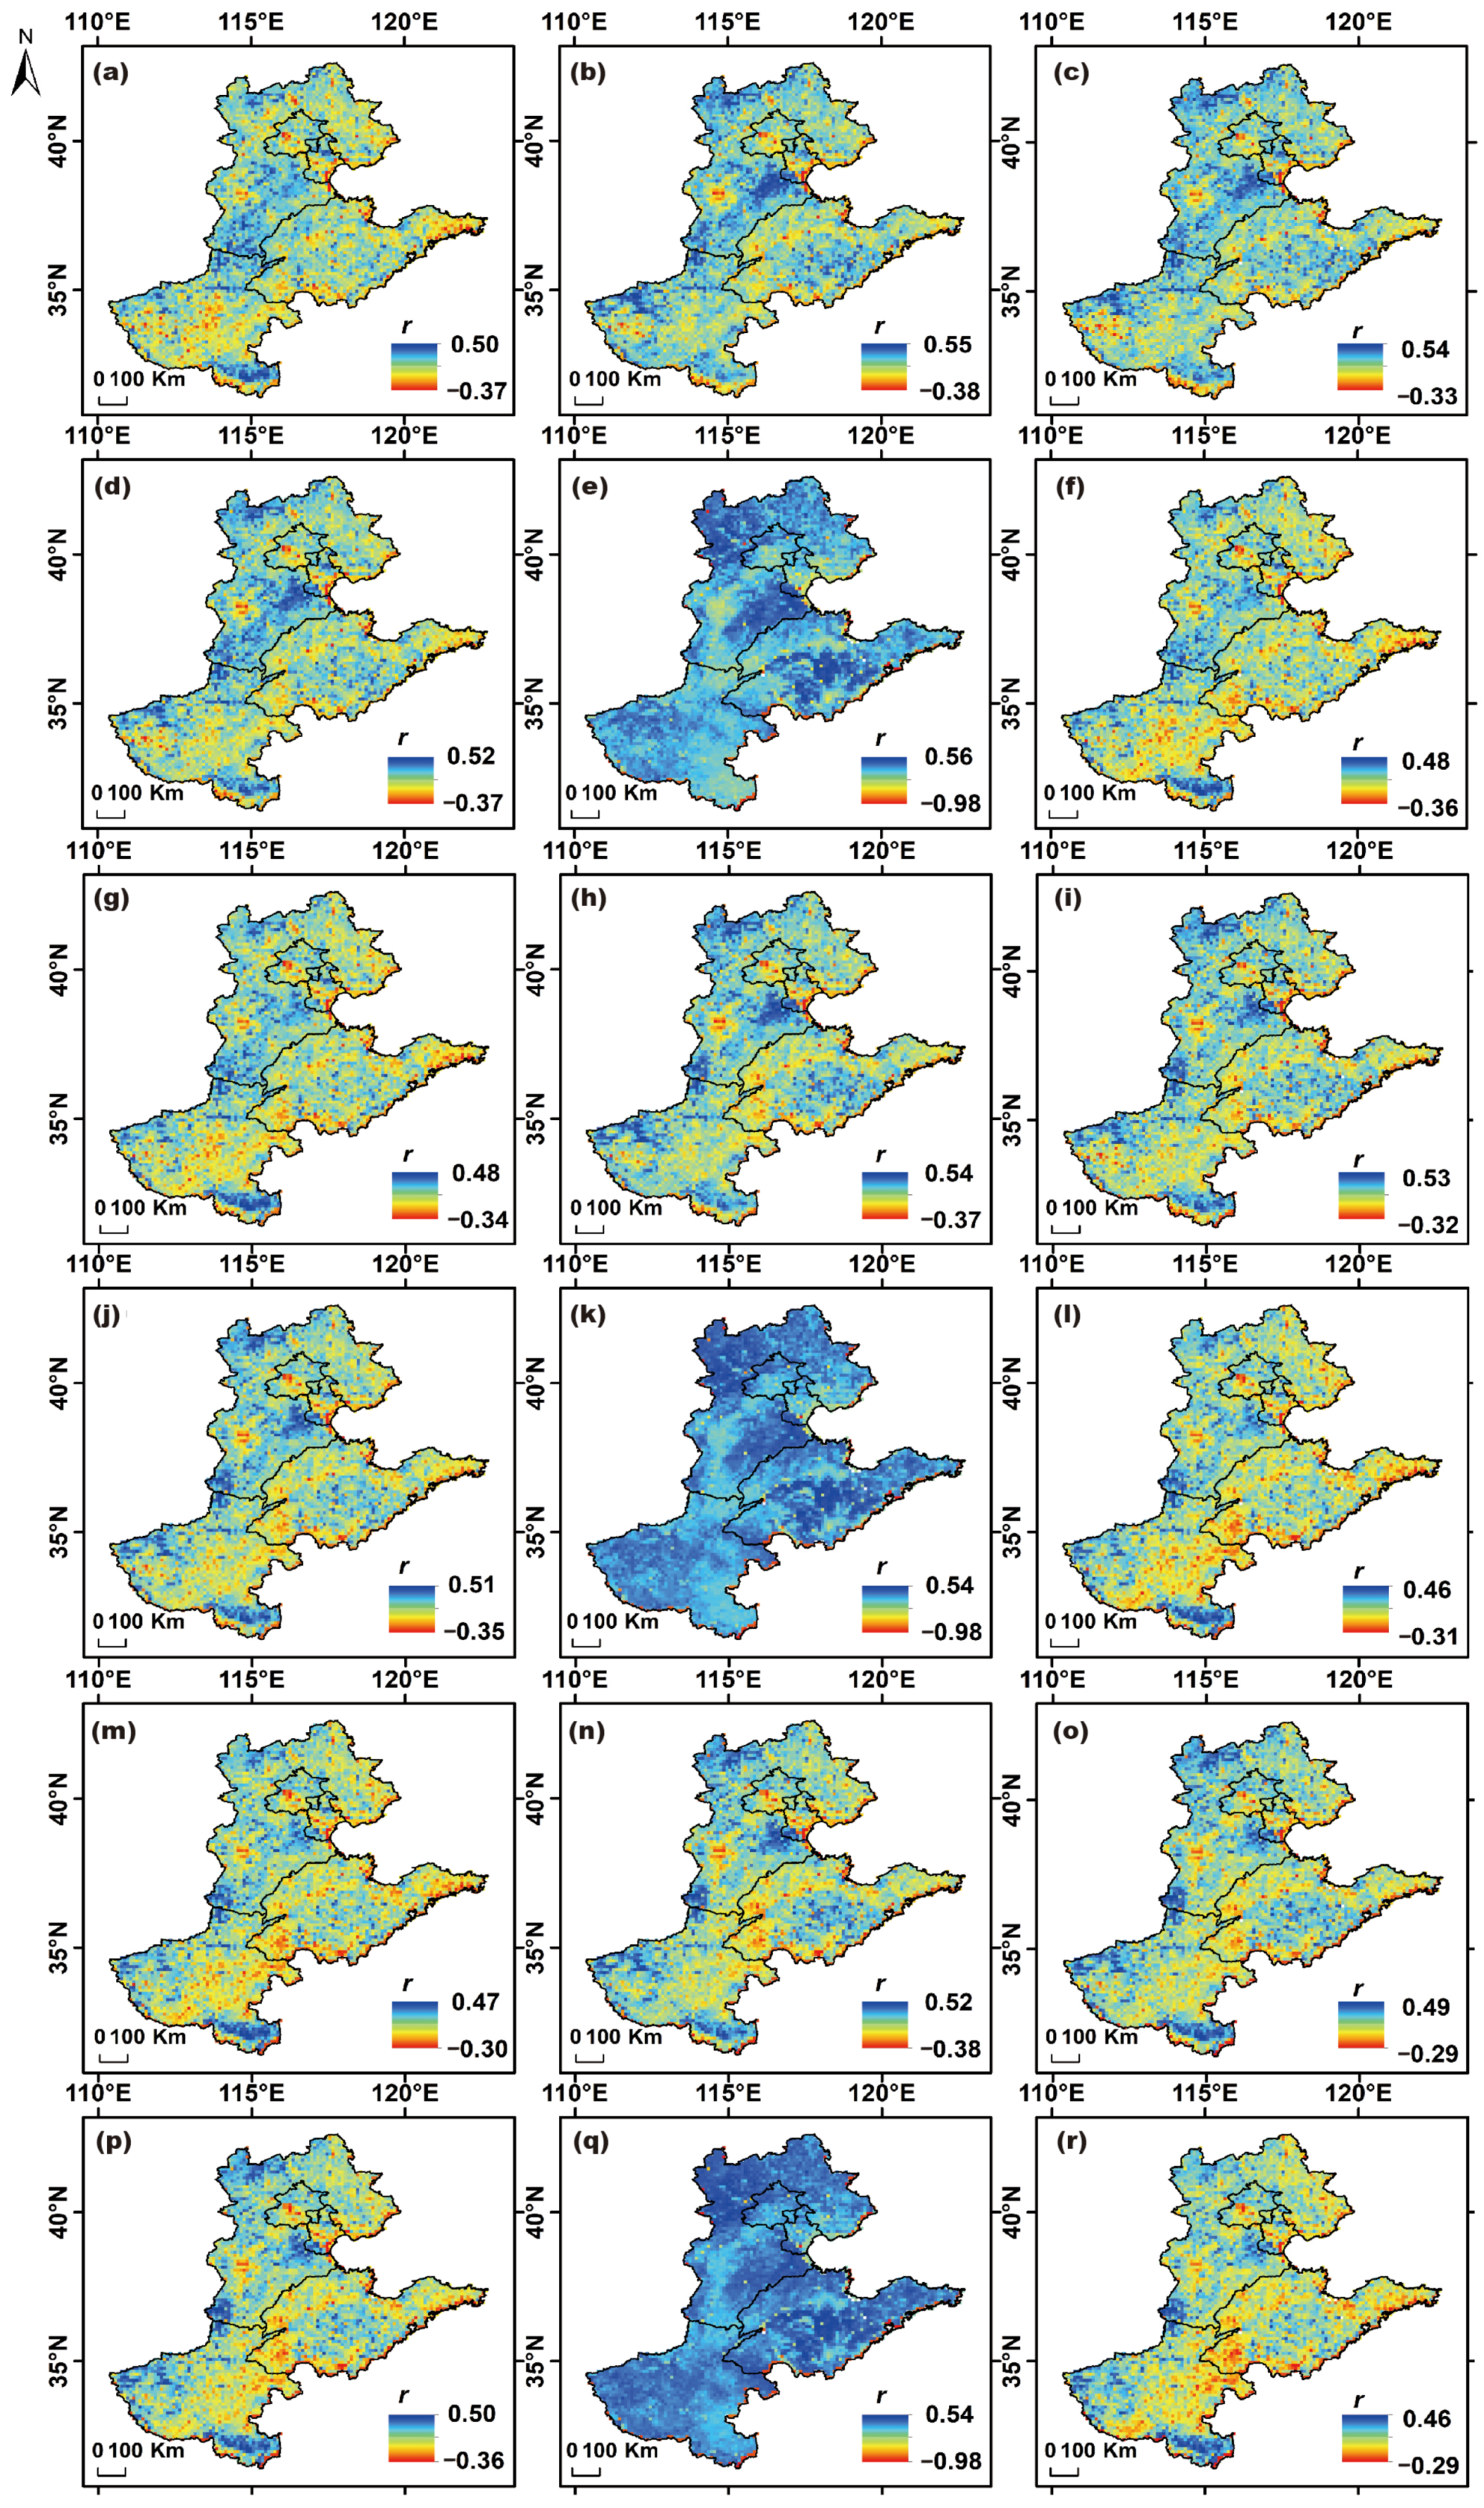
Figure 9.
Optimal lag time of cumulative climate factors (a) AT, (b) P, (c) ET, (d) SH, (e) SM, and (f) ST for VHI.
Figure 9.
Optimal lag time of cumulative climate factors (a) AT, (b) P, (c) ET, (d) SH, (e) SM, and (f) ST for VHI.
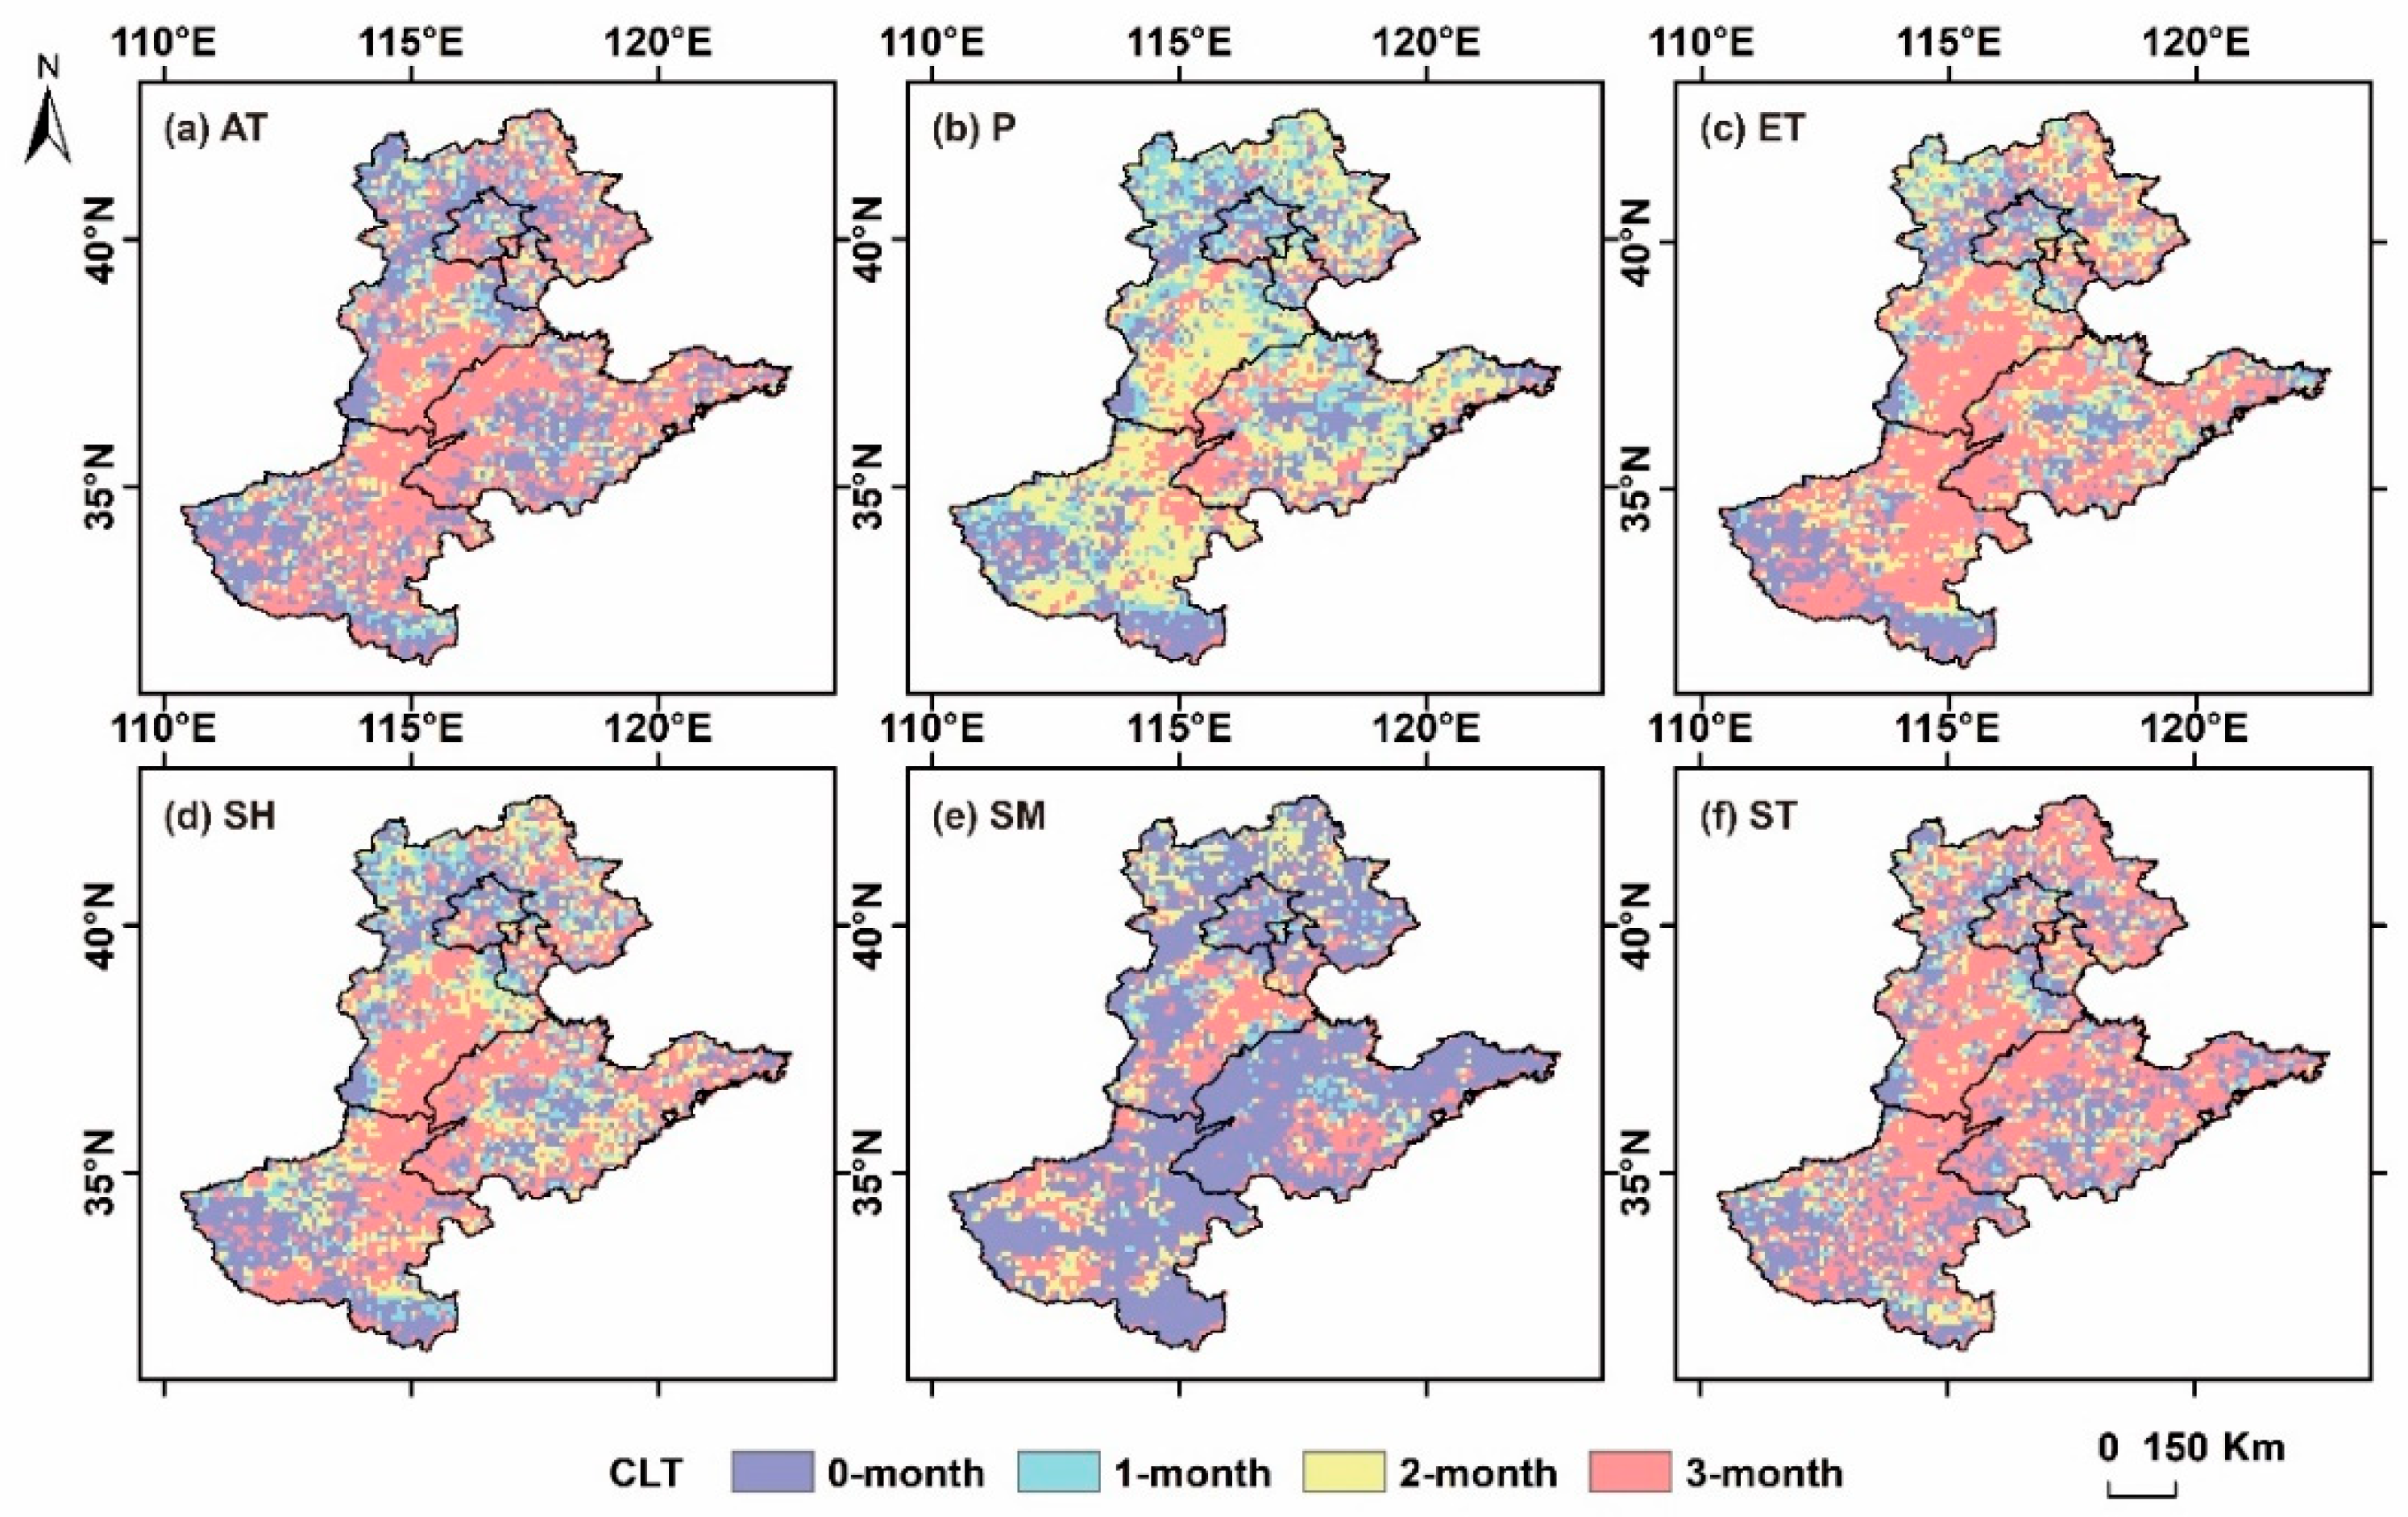
Figure 10.
Area percentage of the optimal lag time of cumulative climate factors (a) AT, (b) P, (c) ET, (d) SH, (e) SM, and (f) ST for VHI in NCP and each sub-region.
Figure 10.
Area percentage of the optimal lag time of cumulative climate factors (a) AT, (b) P, (c) ET, (d) SH, (e) SM, and (f) ST for VHI in NCP and each sub-region.
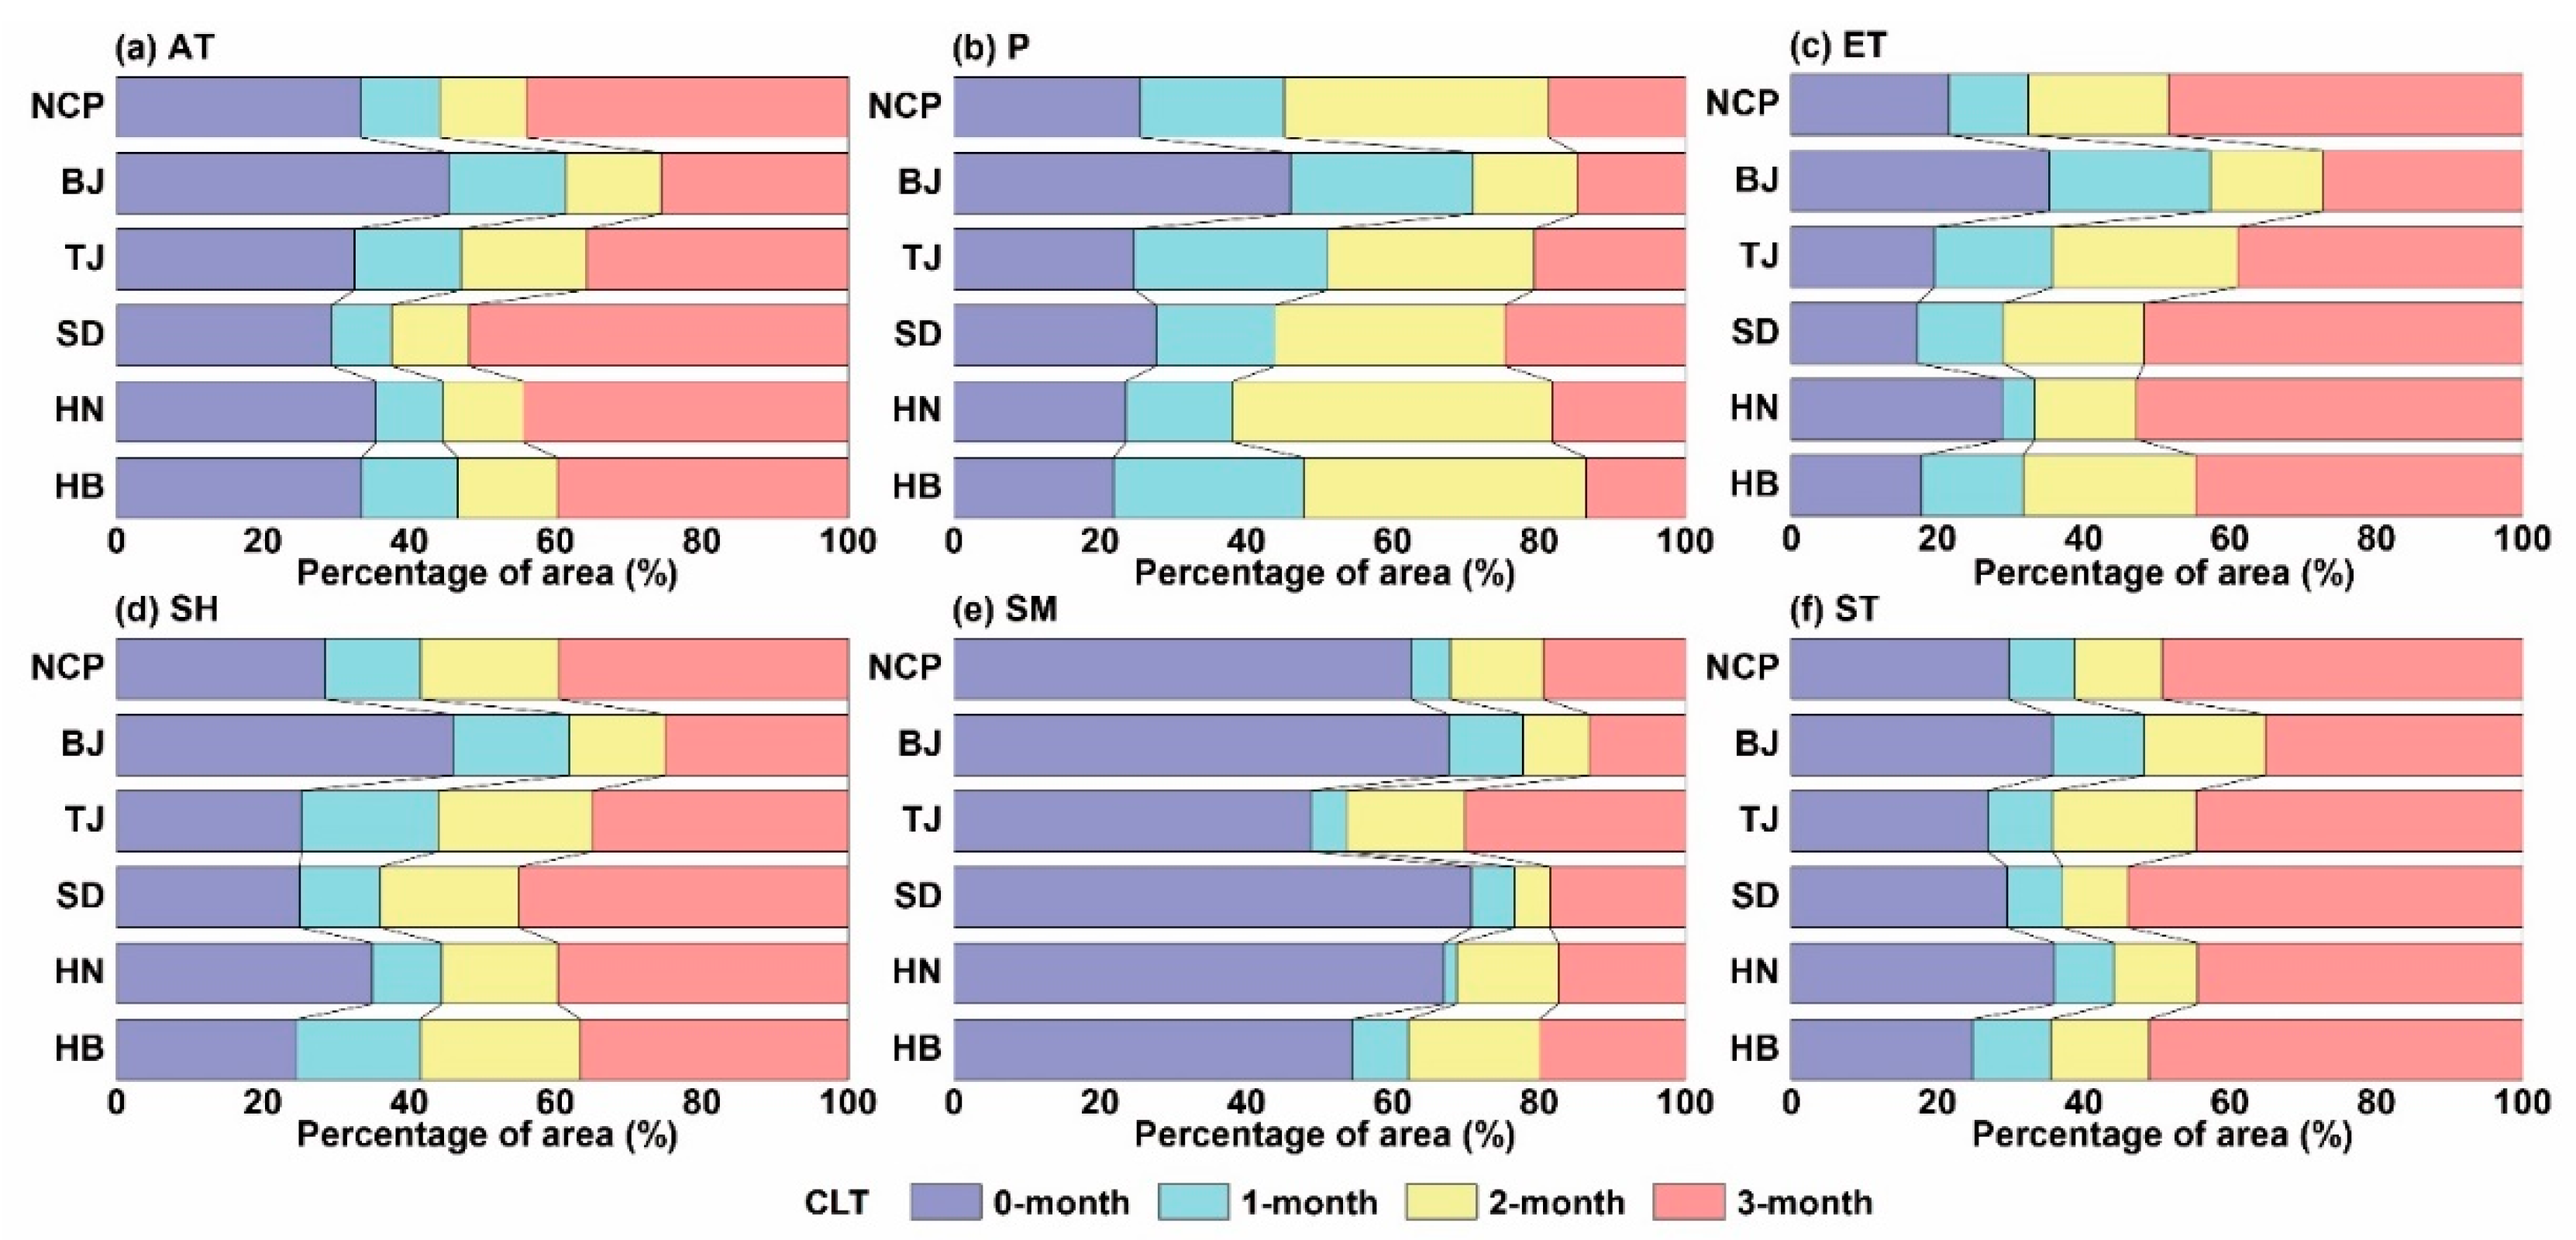
Figure 11.
CR of cumulative climate factors (a) AT, (b) P, (c) ET, (d) SH, (e) SM and (f) ST to VHI under optimal lag time.
Figure 11.
CR of cumulative climate factors (a) AT, (b) P, (c) ET, (d) SH, (e) SM and (f) ST to VHI under optimal lag time.
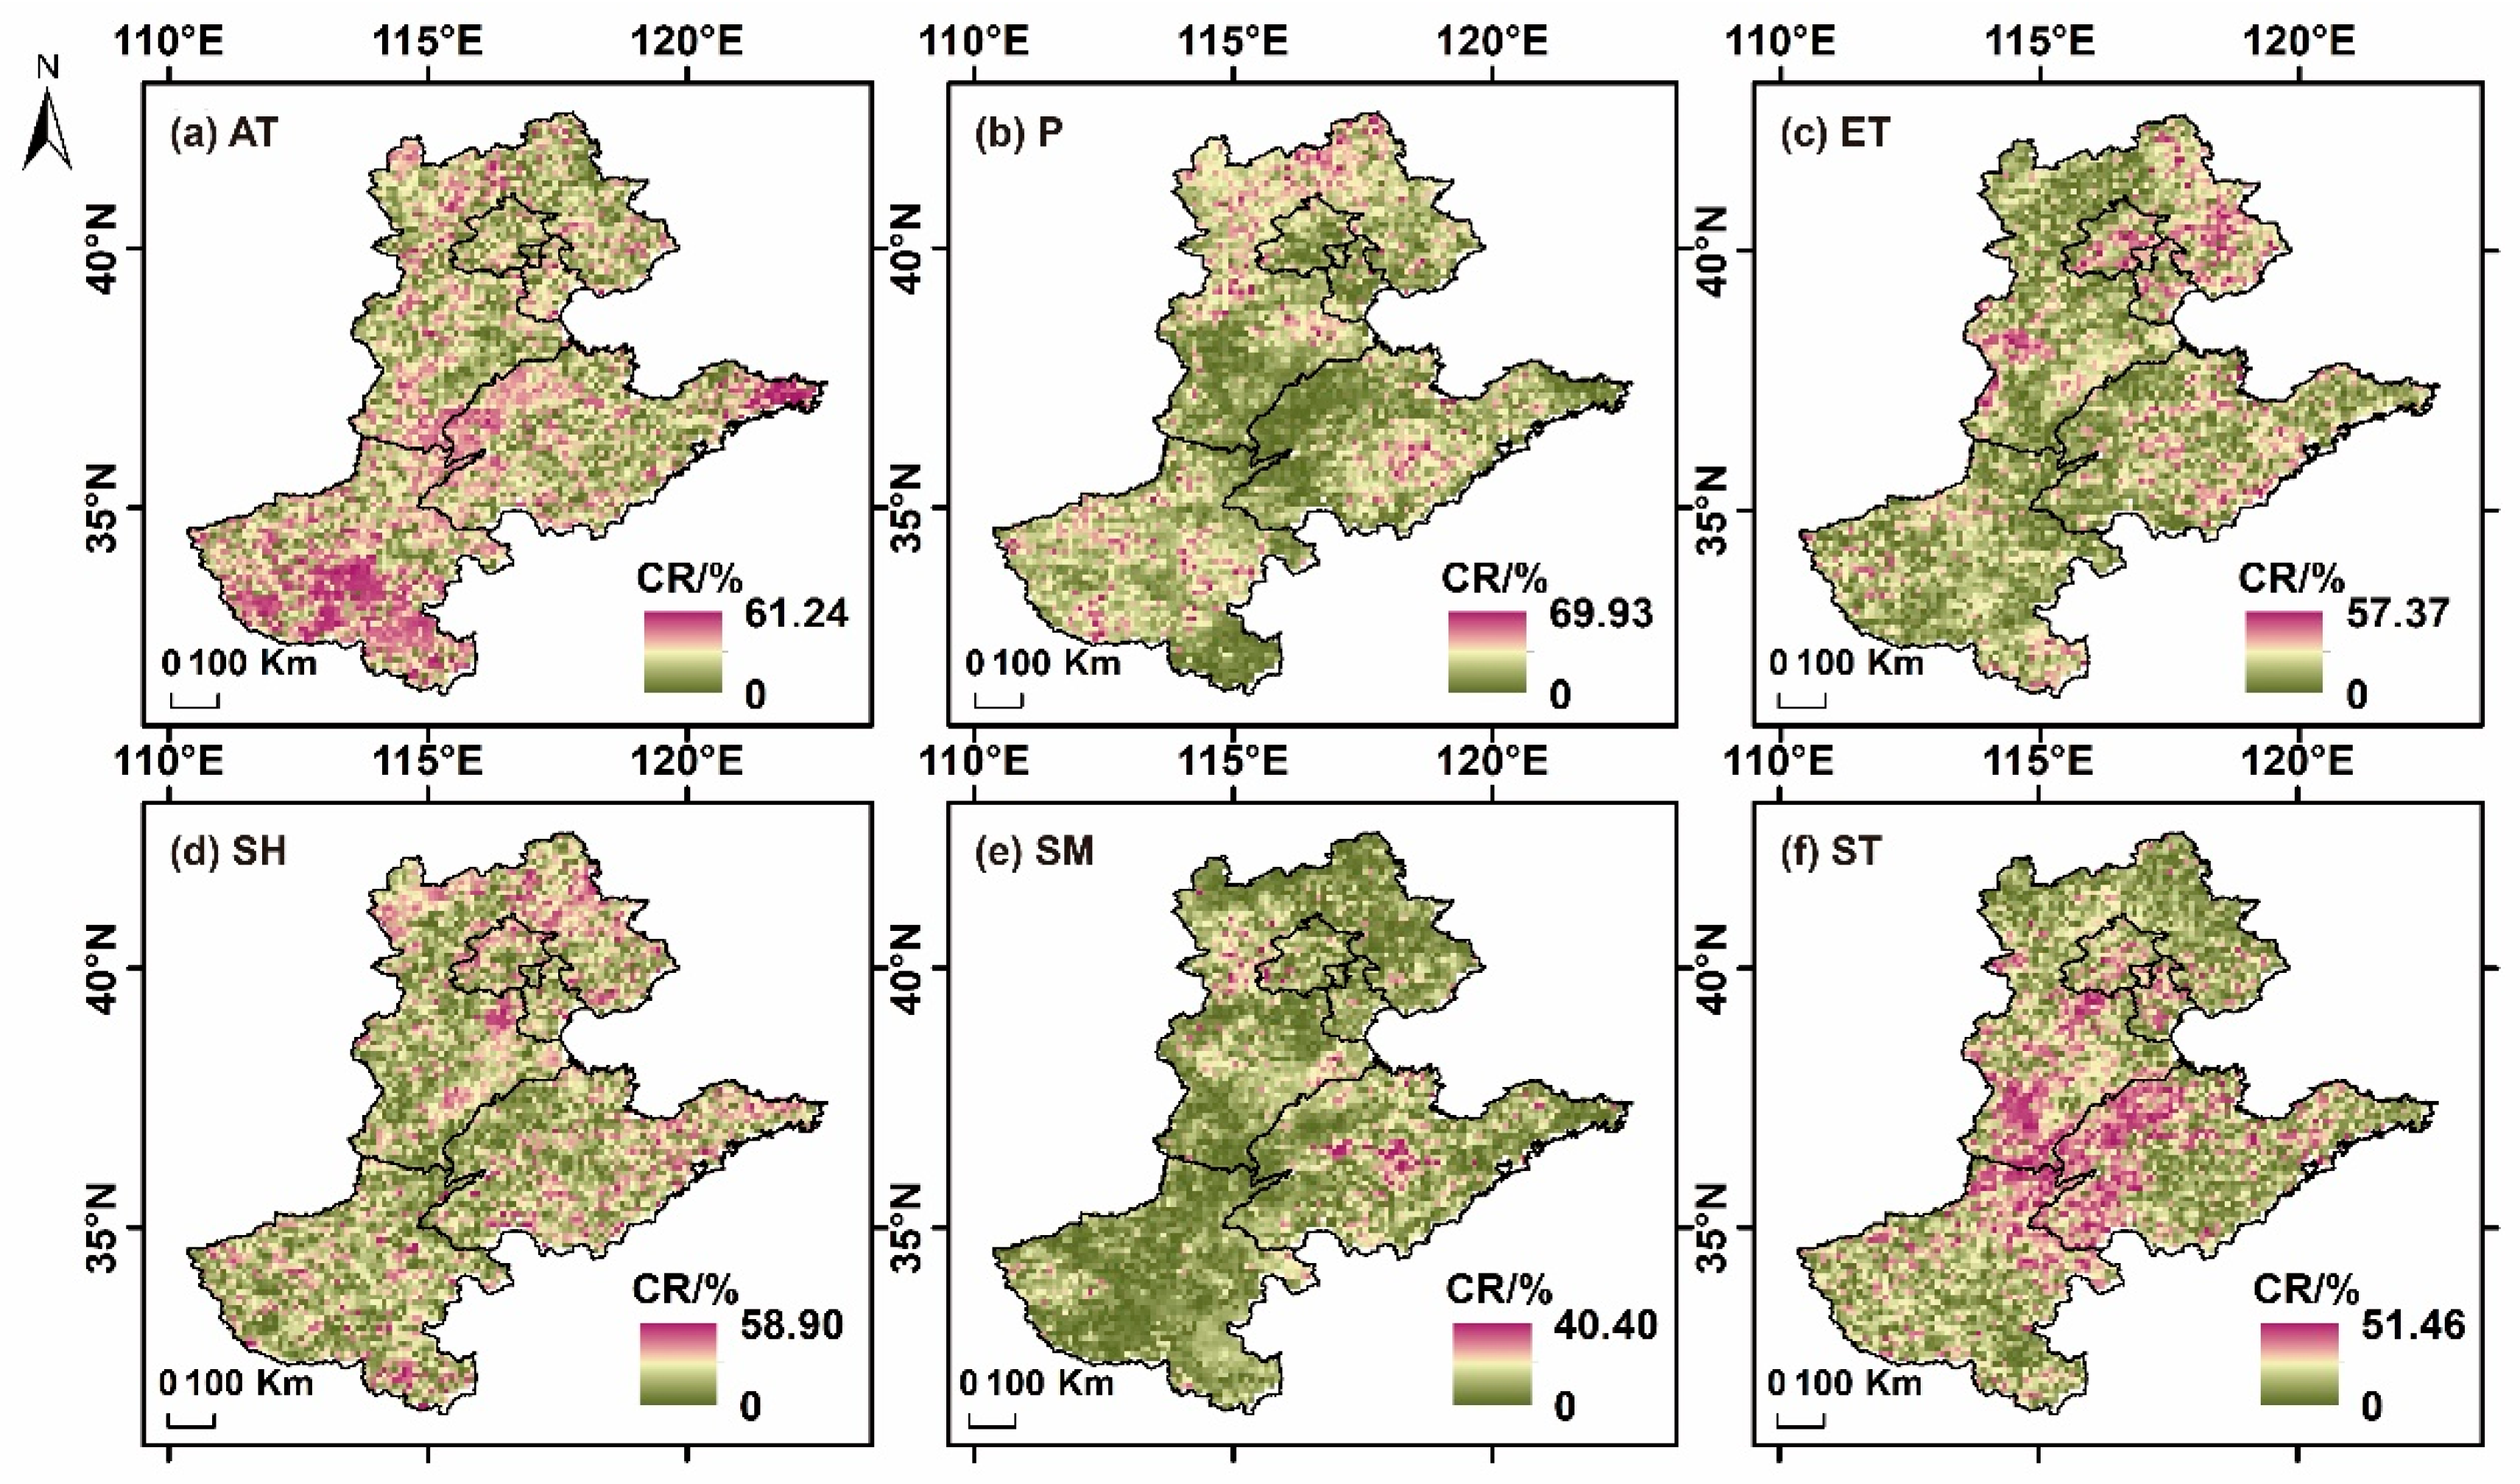
Figure 12.
(a) The maximum CR (CR_max) and (b) key cumulative climate driving factors.

Disclaimer/Publisher’s Note: The statements, opinions and data contained in all publications are solely those of the individual author(s) and contributor(s) and not of MDPI and/or the editor(s). MDPI and/or the editor(s) disclaim responsibility for any injury to people or property resulting from any ideas, methods, instructions or products referred to in the content. |
© 2023 by the authors. Licensee MDPI, Basel, Switzerland. This article is an open access article distributed under the terms and conditions of the Creative Commons Attribution (CC BY) license (https://creativecommons.org/licenses/by/4.0/).
Share and Cite
MDPI and ACS Style
Zhang, Z.; Wang, Z.; Lai, H.; Wang, F.; Li, Y.; Feng, K.; Qi, Q.; Di, D. Lag Time and Cumulative Effects of Climate Factors on Drought in North China Plain. Water 2023, 15, 3428. https://doi.org/10.3390/w15193428
AMA Style
Zhang Z, Wang Z, Lai H, Wang F, Li Y, Feng K, Qi Q, Di D. Lag Time and Cumulative Effects of Climate Factors on Drought in North China Plain. Water. 2023; 15(19):3428. https://doi.org/10.3390/w15193428
Chicago/Turabian StyleZhang, Zezhong, Zipeng Wang, Hexin Lai, Fei Wang, Yanbin Li, Kai Feng, Qingqing Qi, and Danyang Di. 2023. "Lag Time and Cumulative Effects of Climate Factors on Drought in North China Plain" Water 15, no. 19: 3428. https://doi.org/10.3390/w15193428
Note that from the first issue of 2016, this journal uses article numbers instead of page numbers. See further details here.