Article

Heavy Metals and Microbial Diversity: A Comparative Analysis of Rivers Swat and Kabul

1
Centre for Biotechnology and Microbiology, University of Swat, Swat 19120, Pakistan
2
Department of Environmental and Conservation Sciences, University of Swat, Swat 19120, Pakistan
3
Department of Horticultural Science, Mokpo National University, Jeonnam 58554, Republic of Korea
4
Department of Horticulture, The University of Agriculture Peshawar, Peshawar 25130, Pakistan
5
School of Environmental Studies, China University of Geosciences, Wuhan 430078, China
6
State Key Laboratory of Biogeology and Environmental Geology, China University of Geosciences, Wuhan 430078, China
7
Department of Zoology, College of Science, King Saud University, P.O. Box 2455, Riyadh 11451, Saudi Arabia
*
Author to whom correspondence should be addressed.
Water 2023, 15(18), 3297; https://doi.org/10.3390/w15183297
Submission received: 14 August 2023 / Revised: 7 September 2023 / Accepted: 11 September 2023 / Published: 19 September 2023

Abstract

:
Water contamination with heavy metals seriously affects water and sediment quality and may affect the aquatic biota. This study assessed the impact of heavy metals on the morphological characteristics of aquatic microorganisms in potentially contaminated water. Different physicochemical parameters and heavy metals contents were analyzed for toxicological assessment along with microbial diversity in the rivers Swat and Kabul. The pH of River Swat water was neutral to slightly alkaline, while River Kabul was neutral to slightly acidic. The results showed substantial variations in heavy metal concentration across different sampling points. In both River Swat and River Kabul water samples, Cu and Zn concentrations were below the permissible limits for surface and drinking water qualities while the rest of the heavy metals exceeded the permissible limit with Cd being the most abundant heavy metal. Similarly, in sediment samples all the heavy metals were below the permissible limits except for Cd that exceeded the Environment Canada (EC) limits in River Swat and EC and NOVA limits in River Kabul. The rest of the heavy metals concentrations were within the permissible limits, with few exceptions. The results showed that in River Swat, most of the contamination was of geogenic origin, while the main source of contamination in River Kabul was anthropogenic. Results of microbial analysis showed that River Swat has more diversity than River Kabul, which may be due to the low contamination profile of River Swat. It was further observed that high heavy metal concentrations negatively impact the morphological characteristics of microorganisms. The heavy metals concentration and microbial diversity were closely related to each other.

1. Introduction

Rivers play a crucial role in freshwater environments, and most ancient civilizations and cities flourished on both sides of rivers, such as the Indus Valley civilization. Rivers are the main water source for different purposes like soil fertility, irrigation, drinking, transport, and food. Rivers flowing through cities are the key source of agricultural water and are sometimes used for drinking. These rivers generally serve as a sink for dispersing industrial sewage, urban sewage, and other municipal wastes [1]. Therefore, human beings are discarding solid and liquid wastes into these watercourses. The water bodies are contaminated with organic pollutants [2] and heavy metals either naturally or through anthropogenic sources. Mainly, water pollution by heavy metals comes from anthropogenic sources such as mining, industries, electrical wastes, soil erosion, industrial plants, agricultural wastes, chemicals, sewage water, etc. [1,3,4]. Contamination of drinking water with toxic heavy metals is hazardous to human health and the environment [5,6,7]. Most heavy metals are highly soluble in water [8].
During the discharge of pollutants into a river system, they are distributed between the aqueous phase and the bed sediments [9]. Heavy metals are non-biodegradable, bioaccumulative, and harmfully affect aquatic flora and fauna [7,10,11]. Once in the water bodies, heavy metals may be adsorbed on sediments. Consequently, the accumulated concentration of heavy metals in sediment is higher than that of water [12]. Rivers contribute to coastal water pollution as most heavy metals reach the oceans through these rivers [13]. Some of these heavy metals are cytotoxic and their bioaccumulation may result in damaging of vital organs [8]. This seriously challenges the survival of all aquatic life types, including fishes, mollusks, other invertebrates, aquatic plants, and microorganisms.
Most microbes use these water bodies as a home and are the base of their lifecycle. Microbes, particularly bacteria, are found throughout these natural aquatic habitats. They are natural and necessary components of all freshwater ecosystems and are key in various biological activities [14].
The inhibiting microflora of these ecosystems play an important role in biodegradation, nutrient cycling of organic matter balancing, and ecosystem recovery [15]. It is well documented that microorganisms inhabiting river systems are taxonomically different at temporal and spatial scales [16]. Rivers are contaminated by sewage which affects the function and diversity of the microbial community of the rivers [17]. Tolerance can be developed by aquatic organisms, including microorganisms, in response to toxic concentrations of heavy metals [18]. Microorganisms play a role in various critical activities in water habitats, such as self-purification and material recycling; the growth of metal tolerance by the microorganisms would allow these vital functions to continue despite heavy metal inputs [19].
Microorganisms are important in demineralizing and restoring nutrients and in degrading organic pollutants [14]. Despite numerous new studies in microbiology, very few have examined the extent to which stochastic or deterministic procedures structure microbial community variation and how these processes relate to variations in local environmental parameters (physical and chemical ecosystem, climatic conditions, overlying plant community, and disruption regime) or evolutionary events. In freshwater, intertidal wetland, and marine sediments, microbial communities’ variance is substantially associated with water temperature, conductivity, pH, and dissolved oxygen (DO) concentrations [20].
The diversity and spatial distribution of microbial communities in river ecosystems are very important. These communities are bioindicators of river contamination. Microbial communities, the perspective of their spatial arrangement, and their diversity in a river’s ecosystem are very important to understand, as the aquatic microbial communities are greatly affected by alterations in the physiochemical parameters of river water due to anthropogenic and geogenic inputs.
Furthermore, microorganisms are very susceptible to any change in environmental conditions. Hence, they indicate local changes in terms of environmental circumstances [21]. Previous literature showed that increased concentrations of toxic metals negatively impact microbial communities [22]. The distinctiveness and exact functions of diverse microbial communities still need to be well studied [23].
Heavy metal concentration and microbial diversity of river water and sediments may vary depending upon the water source, geology of the area, and anthropogenic inputs. In urban areas, rivers are mostly polluted with industrial effluents, while in rural areas, the major contamination source is geogenic. Several studies have been conducted on various aspects of heavy metals contamination in river water and sediments. However, to our knowledge, no comprehensive study has been conducted on comparative analysis of heavy metals contamination and its effects on microbial diversity in water and sediments from rivers with different sources of contamination. Therefore, the present study is designed to assess heavy metals concentration and its effects on microbial diversity in River Swat and River Kabul.

2. Materials and Methods
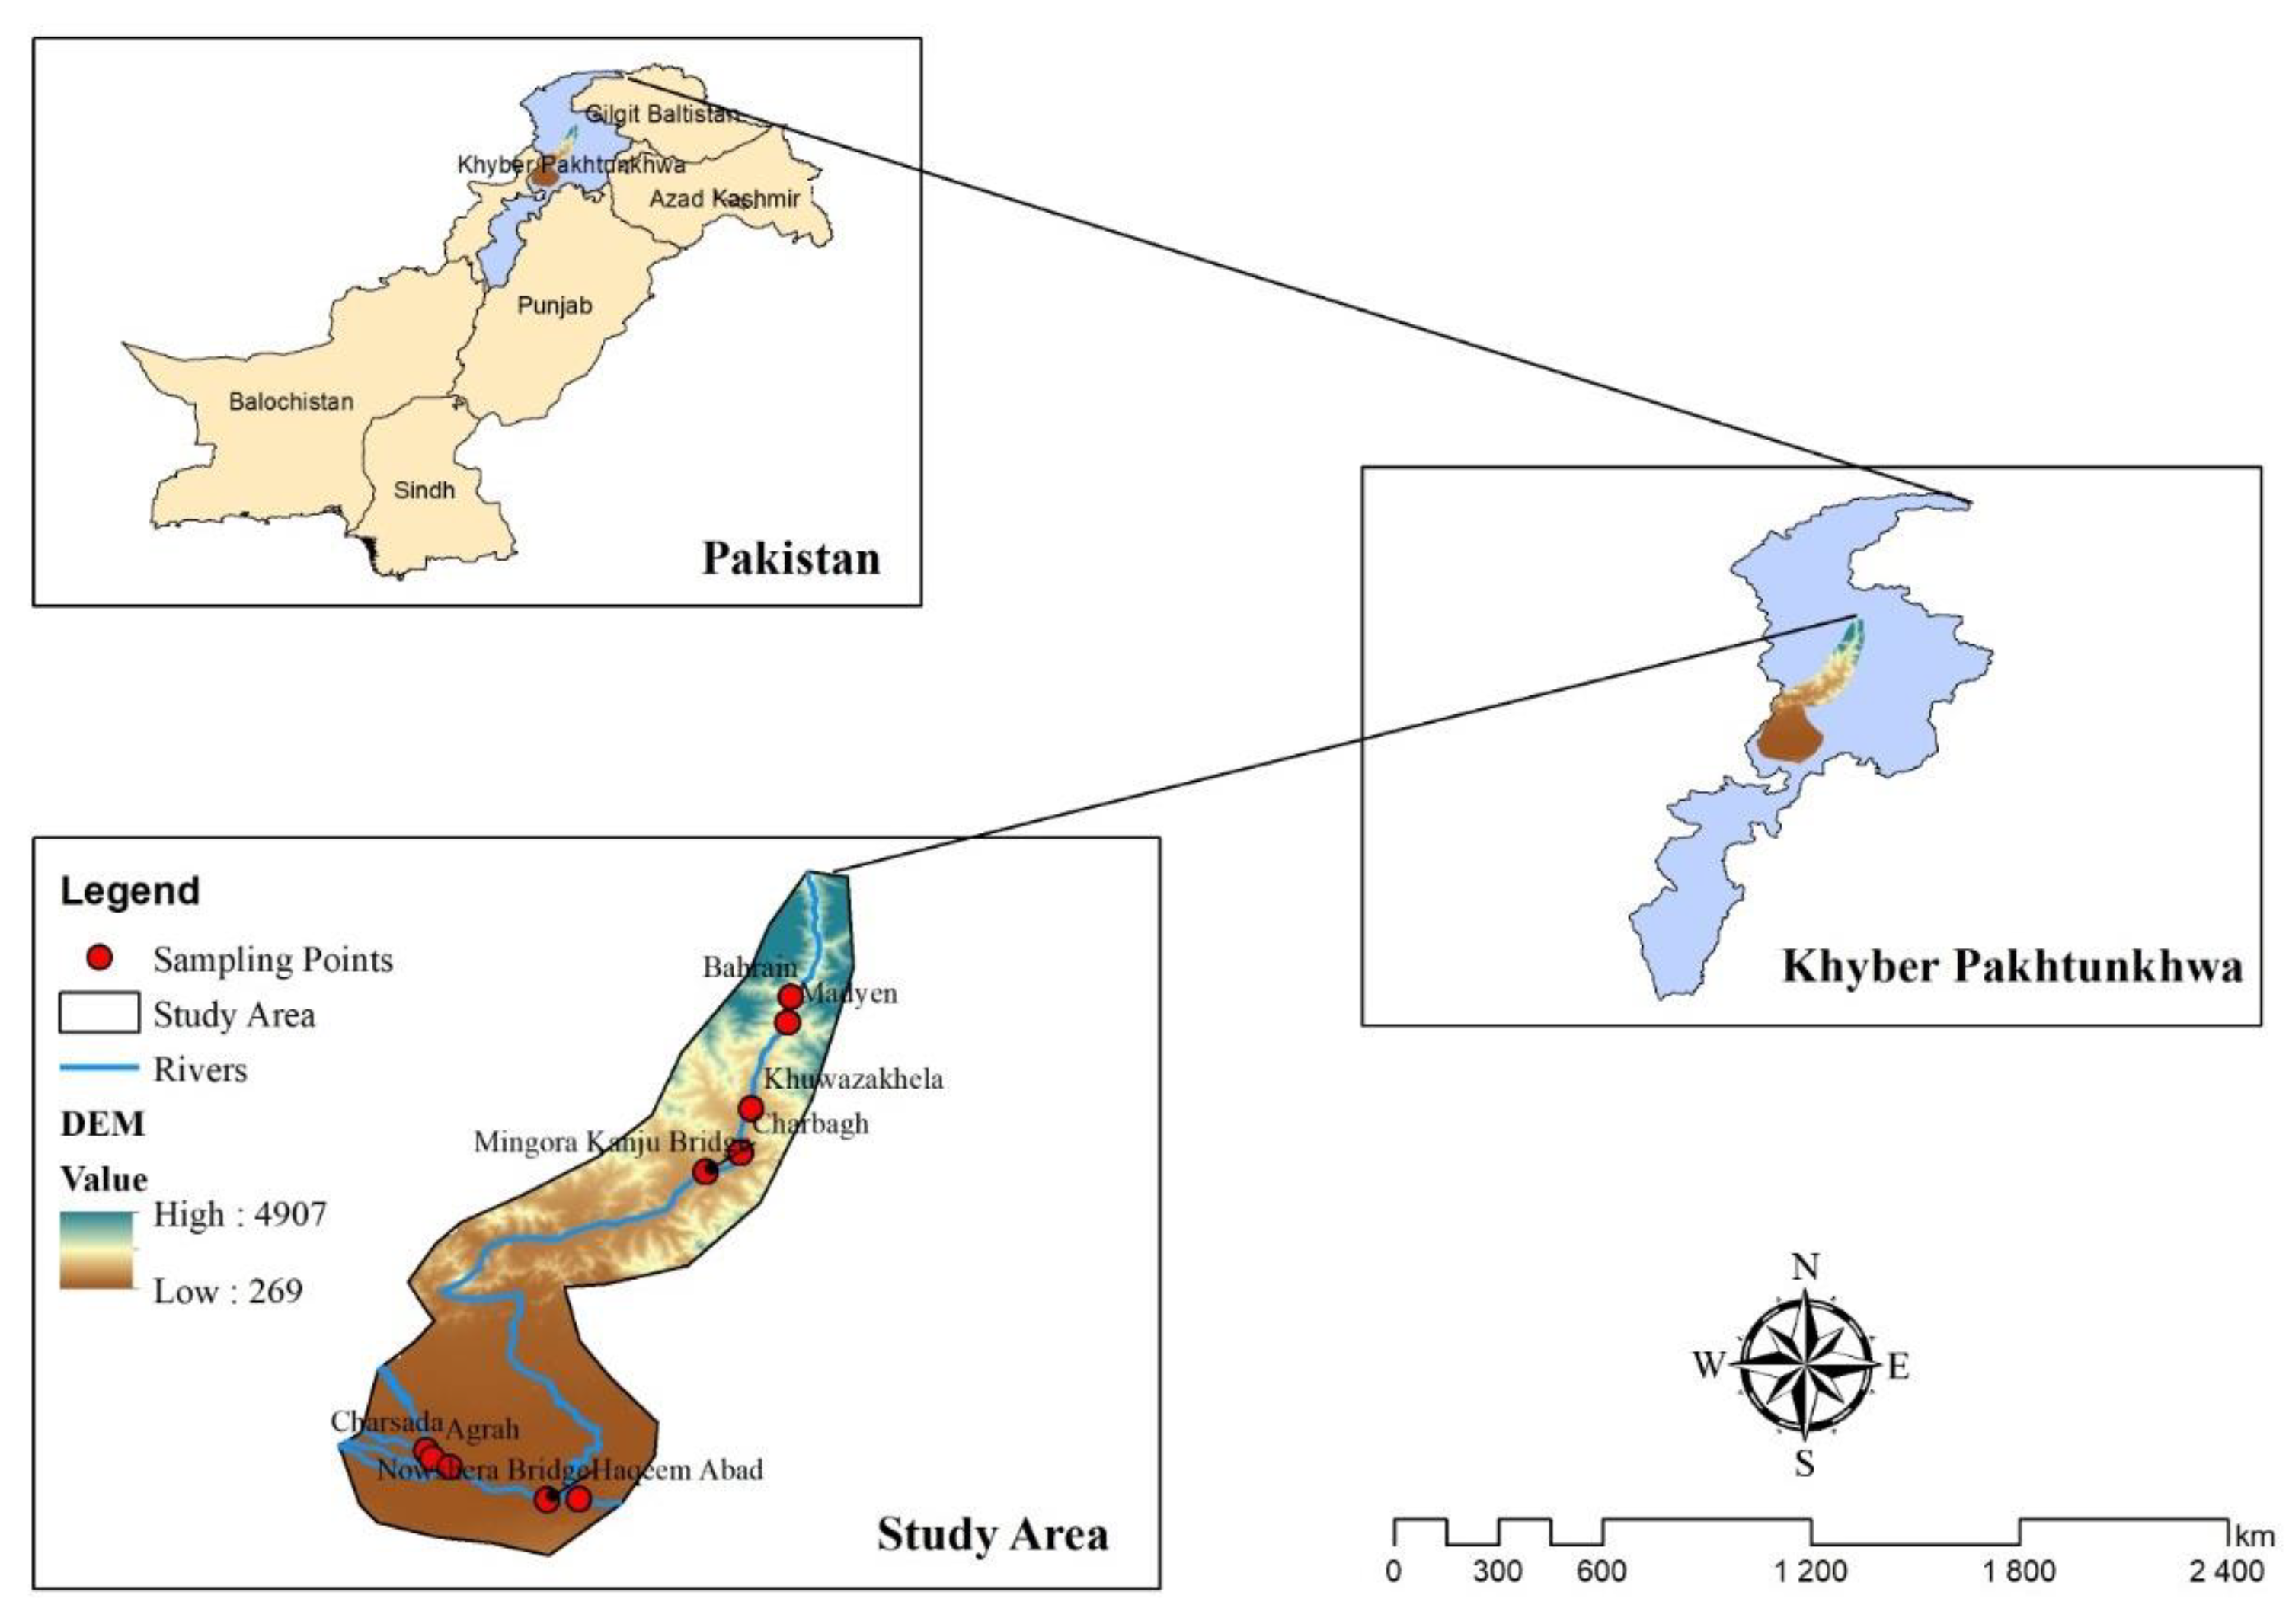
2.1. Study Area

River Swat (34.1167° N and 71.7167° E) and River Kabul (34.357° N and 68.8392° E) were selected for this research activity, which are northern Pakistan’s main freshwater reservoir (Figure 1). The two different rivers were selected based on their location, contamination profile, and anthropogenic interventions. For instance, River Swat has low anthropogenic intervention and most of the heavy metals pollution is of a geogenic nature, while River Kabul flows through big cities and is anthropogenically contaminated. River Swat is 240 km long and has a 14,000 square km basin. It flows for 160 km in the Swat Valley to Chakdara in the Dir Lower district. At Bosaq, near the convergence of the districts Malakand, Dir Lower, and Bajaur Agency, the river then enters the Panjkora River. It runs downstream as River Swat before joining the Kabul River in the district Charsadda. From Afghanistan, the River Kabul enters Pakistan at Shalman, Khyber Agency. River Chitral and River Swat are the two primary tributaries of the Kabul River [24]. The River Kabul and its branches acquire crude oil from industrial wastes and home sewage from the neighboring areas, polluting the river organically and inorganically [25,26]. Effluents from factories near Nowshera enter the River Kabul, affecting the water quality [27,28]. Nearly 80 different industries are said to discharge untreated wastewater into this river, either directly or indirectly. These industrial units include oil, ghee, textiles, paper, soap, sugar, pharmaceuticals, and tanneries. The discharge of industrial effluents into this river has resulted in a decline in fish populations, particularly in Mahaseer and Tor putitora populations.

2.2. Water and Sediment Sampling

Five sample sites were selected from both rivers, including Mingora Kanju pull, Charbagh, Khawaza Khela, Madyan, and Bahrain at River Swat and Sardaryab Charsadda, Agrah, Motorway pull, Nowshehra pull, and Haqeem Abad at River Kabul. From each river, ten samples of water and sediment were collected. For each sampling site, 3 sediment sub-samples were collected using a stainless steel corer, while water samples were collected at 10 to 20 cm depth of the surface water. Approximately 500 mL of water and 500 g of sediment samples were collected from every sampling site. The water and sediment samples were transferred to the laboratory in sterile bottles and clean polythene bags in ice-packed containers. After transportation to the laboratory, these samples were stored at 4 °C for assessment of physiochemical parameters and −80 °C for microbial assessment. Then, 1 mL of water and 5 g of sediment sample were used to isolate bacteria through serial dilution and agar plate culture. During sample collection, pH, electrical conductivity, and temperature were determined in situ by a HANNA HI129 pH meter. Before further analysis, water samples were kept at 4 °C and immediately transported to the laboratory of the University of Swat.
Water samples were acidified with analytical grade HNO3 for heavy metals analysis to avoid chemical reactions and were filtered through Whatman filter paper. (Toyo Roshi Kaisha, Ltd., Tokyo, Japan).

2.3. Sediment Sample Preparation

The sediment samples were dried at room temperature. These dried samples were ground and sieved to a size of <2 mm. Heavy metals from the sediment samples were extracted using the standard procedure described by Khan et al. [3]. For this purpose, a 0.5 g sample was digested with aqua regia (HCl:HNO3 at 3:1). The samples were kept overnight, and the next day, all the samples were heated on a hot plate at 120 °C till complete digestion. After digestion, the samples were cooled and filtered, and the volume was adjusted to 50 mL with deionized water. Heavy metal concentrations were determined by an atomic absorption spectrophotometer.

2.4. Quality Control

For quality assurance and data accuracy, the calibration of the instruments was carried out by using standards. Before sample analysis, blanks and standards were evaluated in triplicate. The same procedure was repeated with each set of samples.

2.5. Microbial Diversity Analysis

2.5.1. Medium Preparation

One liter of nutrient agar (NA) media was prepared for the isolation of bacteria. To prepare 1 L of medium, 28 g nutrient agar containing 0.5% peptone, 0.25% glucose, 0.3% yeast extract, and 0.5% NaCl was dissolved in 1000 mL of distilled water at pH 7 at room temperature. The medium was then autoclaved at a temperature of 121 °C, which was stable for 15 min. After autoclaving, the medium was allowed to cool. Then, a few drops of nystatin (antifungal) were added to prevent fungal growth. The medium was poured onto sterile Petri plates within a laminar flow hood (LFH). First, the LFH was cleaned with ethanol to avoid contamination. UV light was used for 3 min. Then, the medium was poured, and after pouring the medium, NA plates were kept for 24 h for contamination growth.

2.5.2. Isolation of Bacteria

Materials for the isolation of bacteria were sterile distilled water, tubes, a spreader, micropipette tubes, and NA media plates. The samples contain many microorganisms, including bacteria, fungi, and protozoa. Therefore, the sample was first serially diluted with distilled water to reduce the number of microbes until pure colonies were obtained. The diluted sample was poured onto a nutrient agar plate through micropipette tubes, and after spreading the sample, the media plates were covered and incubated for 24 h at 37 °C. After 24 h, the bacterial colonies were cultured in nutrient agar slants. The slants were incubated at a specific temperature (37 °C) for proper growth. Finally, the samples were preserved in glycerol vials (20%) and stored at −80 °C for further work.

2.5.3. Plate Counting

Plate counting was carried out using the procedure described by IBERS (http://users.aber.ac.uk/hlr/mpbb/index_files/Page299.html, accessed on 4 March 2023). Three dilutions, i.e., 1/10, 1/100, and 1/1000th of the original sample, were prepared; 1 mL of the sample was pipetted onto the agar surface and spread around using a sterile glass rod for all the dilutions. The plates were then incubated at 37 °C, and the colonies were counted to determine the number of available microorganisms in the original sample.

2.6. Bacterial Culture Characterization

2.6.1. Morphological Studies

Gram Staining of Bacteria

The identification and differentiation of the Gram-negative and Gram-positive bacteria was carried out through Gram staining. Bacteria were obtained and fixed on a glass slide to prepare a smear. The smear was stained first with crystal violet, Gram’s iodine, 95% C2H5OH, and safranin for 60, 60, 20, and 40 s, respectively. The slides were rinsed clean with distilled water and air-dried. The dried slide was then observed under a microscope using imergin oil to show Gram-positive and Gram-negative bacteria.

Size, Shape, and Color

Morphological characteristics, including size, shape, and color, were determined microscopically. The bacterial colonies mostly occurred in rod, round, and coccid shapes; their elevations and margins were observed to define the shape of the bacterial colony. An Electron—A microscope in millimicrons determined the microorganisms’ size.

2.7. Biochemical Characterization

2.7.1. Urease Test

For biochemical characterization, a urease test was performed. Christensen’s urea agar was used for the urease test, which was prepared. The ingredients of Christensen agar were urea (20 g), mono potassium phosphate (2 g), sodium chloride (5 g), dextrose (1 g), peptone (1 g), phenol red (0.012 g), and agar (15 g).
The ingredients were properly dissolved in 0.1 L of distilled water and filter sterilized. The agar was suspended in 900 mL of distilled water and boiled until completely dissolved, autoclaved in standard conditions, and then cooled at 50–55 °C. Then, 100 mL of filter-sterilized urea base was poured on agar media and mixed thoroughly. Then, 4 or 5 mL of the solution was added to a sterile tube and cooled till completely solidified.
The urea agar slant was streaked with a portion of inoculated slant. For this purpose, 1 to 2 drops of an overnight brain–heart infusion broth culture were added to the slant. The loosely capped tubes were incubated at a specific temperature (35–37 °C) in ambient air for seven days. The tubes were examined carefully until a pink color developed.

2.7.2. Acid Phosphatase Assay

Acid phosphatase was extracted in a conical flask (250 mL) using sterilized NBRIP broth (100 mL). The flasks were inoculated with bacterial solution (100 μL) in triplicate. The inoculated flasks were incubated at 37 °C for up to 192 h. The samples were extracted every 24 h and were centrifuged at 10,000 rpm at 4 °C for 10 min. The cell-free supernatant was assayed for acid phosphatase activity following a standard procedure [29]. Briefly, 1 mL of bacterial culture supernatant was homogenized with universal buffer (4 mL) having pH 6.5, followed by 1 mL of disodium p-nitrophenyl phosphate (0.025 mm). The extracts were incubated for 1 h at 37 °C. To inhibit bacterial growth, toluene (1 drop) was added. After 1 h of incubation, the reaction was stopped by adding 1 mL of CaCl2 (0.5 M) and 4 mL of NaOH (0.5 M). Finally, the contents were filtered using Whatman filter paper.
The p-nitrophenol concentration was measured in triplicate on a UV–Vis spectrophotometer. The obtained values were extrapolated on a standard curve using p-nitrophenol solution. From the results, one unit (U) of phosphatase activity was equal to the number of enzymes required to release 1 μmol of p-nitrophenol per ml per min from disodium p-nitrophenyl phosphate under the assay conditions.

2.8. Statistical Analysis

The data were statistically analyzed using statistical software packages (SPSS). Graphs were prepared with Sigma plot 10.0.

3. Results and Discussion

3.1. Physicochemical Parameters

Water and sediments samples (5 each) were collected from five different sites of River Swat and River Kabul. pH and EC of water and sediment samples from River Swat were within permissible limits of the WHO [30]. The maximum pH was reported for sample S3, while the minimum was reported for S5. All the pH values were slightly alkaline.
Similarly, the maximum and minimum EC values were recorded for S3 and S4, respectively (Table 1). Unlike River Swat, great variation was observed in the pH and EC of River Kabul, and the pH of River Kabul was slightly acidic to neutral (Table 1). The change in the pH of River Kabul may be due to anthropogenic inputs like the discharge of municipal and industrial wastewater.

3.2. Heavy Metals in Water

The heavy metals concentrations (Cd, Ni, Fe, Zn, Mn, Cu, Cr, and Pb) in water samples collected from five sites of River Swat in the Swat District is given in Table S1. The mean Cd, Cr, Cu, Fe, Mn, Ni, Pb, and Zn concentrations in River Swat water samples were 0.02, 0.07, 0.04, 0.36, 0.07, 0.24, 0.07, and 0.96 mg/L, respectively (Figure 2). In the case of water samples collected from River Swat, the Cd concentrations found for S1, S2, S3, S4, and S5 were 0.01, 0.04, 0.02, 0.04, and 0.01 mg/L, respectively (Table S1). The Cd concentrations exceeded the drinking water standards (0.005 mg/L) for all the sample sites. Similarly, Cd concentrations exceeded the surface water standards (0.01 mg/L). Ni concentrations for all the samples were higher than the given surface water standard (0.144 mg/L) and WHO limit (0.07 mg/L). It has been reported that Ni forms complexes with humic materials [30], thus reducing its bioavailability and toxicity to aquatic flora and fauna and associated human health risk. The concentrations of Fe were found below the drinking water standard (0.3 mg/L) for S1 and S4 and those of the rest of the samples were higher than the given standards. Zn concentrations were below the drinking water standards (5.00 mg/L) for all the samples. Similarly, concentrations of Mn were found above the drinking water standard, while those of S1, S2, and S3 were found below the WHO limits. Cu concentration was found under the drinking water standards (1.3 mg/L) for all the samples. In the case of Cr, the concentrations were found under the drinking and surface water standards for all the samples except for sample 4. Compared to the WHO standard [30] for Cr (0.05 mg/L), the concentrations were lower for S1 and higher for the rest of the samples. This could have happened due to the tannery’s wastewater mixing with the River Swat. Pb concentrations were found to be higher than the drinking water standards (0.00 mg/L) and surface water standards (0.05 mg/L) for S3, S4, and S5 and were lower for S1 and S2 (Table S1).
The heavy metals concentrations in River Kabul water samples are given in Table S2. The mean Cd, Cr, Cu, Fe, Mn, Ni, Pb, and Zn concentrations in River Kabul water samples were 0.01, 0.21, 0.02, 0.21, 0.19, 0.16, 0.05, and 0.10 mg/L, respectively (Figure 2). In the case of water samples collected from these five sites of River Kabul, the Cd concentration for samples K1, K2, K3, K4, and K5 were 0.01, 0.02, 0.01, 0.02, and 0.01 mg/L, respectively (Table S2). The Cd concentration was higher than the drinking water standards (0.005 mg/L) for all the sample sites. Similarly, Cd concentration exceeded the surface water standards (0.01 mg/L) for samples K2 and K4, while K1, K3, and K5 were within the limits. Ni concentrations of samples K1, K3, and K5 were found to be higher than the given surface water standard (0.144 mg/L), and K2 and K4 were within limits, while for WHO guidelines (0.07 mg/L), all the samples were within the permissible limit. The concentration of Fe was found below the drinking water standard (0.3 mg/L) for samples K1 and K2, and those of the rest of the samples were higher than the given standards. Zn concentrations were below the drinking water standards (5.00 mg/L) for all water samples from River Kabul. At the same time, concentrations of Mn were high compared to the drinking water standard (0.5 mg/L), surface water standards (0.1 mg/L), and WHO standards (0.1 mg/L) for all the samples. High concentrations of Mn may be due to dumping pharmaceutical industry effluents into the river [31].
All the samples had a Cu concentration under the drinking water standards (1.3 mg/L). In the case of Cr concentrations, only sample K2 was within the permissible limit for drinking water standards (0.1 mg/L), surface water standards (0.16 mg/L), and WHO standards (0.05 mg/L), while all remaining samples exceeded the limits. This could have happened due to the tannery’s wastewater mixing with the River Kabul. Pb concentrations were higher than the drinking (0.00 mg/L) and surface water standards (0.05 mg/L) for samples K1, K2, and K5 and were lower for samples K3 and K4. The higher concentration of Pb in water samples was previously reported by Khan et al. [3].

3.3. Heavy Metals in Sediments

The heavy metal concentrations in sediment samples collected from River Swat and River Kabul are given in Figure 2 and Tables S1 and S2. The mean Cd, Cr, Cu, Fe, Mn, Ni, Pb, and Zn concentrations in River Swat sediment samples were 0.65, 17.55, 11.75, 1036.70, 145.44, 3.80, 4.75, and 31.65 mg/kg, respectively (Figure 2). Cd concentrations for samples S1, S2, S3, S4, and S5 were 1.5, 0.5, 0.25, 0.25, and 0.75 mg/kg, respectively (Table S1). The Cd concentration was higher than the Environment Canada standard [32] (0.68 mg/kg) for samples 1 and 5, while samples 2, 3, and 4 were found in the range. Similarly, Cd concentration exceeded the NOAA limit (1.2 mg/kg) [33] for sample S1, while S2, S3, S4, and S5 were within the limits. Additionally, all the samples were found within the permissible limit of USEPA (>6 mg/kg). Ni concentrations for all the samples were within permissible limits of Environment Canada standards (15.9 mg/kg), NOAA guidelines (20.9 mg/kg), and USEPA guidelines. Zn concentrations were also found within the permissible limit of Environment Canada (124 mg/kg), NOAA (150 mg/kg), and USEPA (>200 mg/kg). Other heavy metals, including Cu, Cr, and Pb concentrations, were within the permissible limits of Environment Canada [32], NOAA [33], and USEPA [34] guidelines for all five samples.
The mean Cd, Cr, Cu, Fe, Mn, Ni, Pb, and Zn concentrations in River Kabul sediment samples were 1.20, 16.95, 6.60, 1070.00, 151.25, 11.05, 4.95, and 42.50 mg/kg, respectively (Figure 2). The Cd concentration was higher than the Environment Canada standard (0.68 mg/kg) for all the sample sites, exceeded the NOAA guidelines (1.2 mg/kg) for samples K4 and K5, while samples K1, K2, and K3 were within the limits. Similarly, all the samples were found within the permissible limit of USEPA (>6 mg/kg). Ni concentrations of samples K1 and K2 were found to be higher, while samples K3, K4, and K5 were within permissible limits of the Environment Canada standard (15.9 mg/kg). For NOAA guidelines, only sample K1 was in the polluted range and the rest of the samples were within the permissible limit (20.9 mg/kg). Likewise, according to USEPA guidelines, all the samples were within the permissible limit (>50 mg/kg). Zn, Cu, and Pb concentrations for all the samples were within permissible limits of Environment Canada standards [32], NOAA standards [33], and USEPA [34].
The comparative analysis of heavy metals of both the rivers revealed that heavy metals concentration in River Kabul was higher than in River Swat. River Swat is situated at a high altitude with low anthropogenic intervention, while River Kabul flows in low-lying areas and passes through the major cities, where municipal and industrial effluents are thrown in the river. Thus, the higher heavy metals concentration in River Kabul may be attributed to anthropogenic inputs [3]. In a previous study, Khan et al. [3] reported that the source of heavy metals in River Kabul was mainly anthropogenic, particularly sewage sludge. The higher heavy metals concentrations have significant negative effects on aquatic flora and fauna [35]. Afzaal et al. [35] reported higher heavy metals concentration in fish tissues of River Kabul. Consumption of contaminated fish results in bioaccumulation of heavy metals in the human body, resulting in various health disorders.

3.4. Heavy Metals and Microbial Diversity

Presently, the effect of heavy metals on microbial flora and fauna of river sediments is of great scientific concern because microbes play a vital role in nutrient cycling and the decomposition of organic matter. The negative impacts of toxic metal on sediment microbiota may affect the nutrient cycling and other micro- and macroflora and fauna within the ecosystem. Linking heavy metals contamination with microbial enzymatic activities in the aquatic ecosystem may be a key indicator for assessing anthropogenic stressors on a regional scale. Efforts have been made to reveal the microbial ecosystems in freshwater sediments based on traditional cultivation methods. Microorganisms are important in the demineralization and restoration of nutrients and the degradation of organic pollutants. Heavy metal concentration and microbial diversity of river water and sediments may vary depending upon the water source, the geology of the area, and anthropogenic inputs. In urban areas, rivers are mostly polluted with industrial effluents, while in rural areas, the major source of contamination is of a geogenic nature.

3.5. Isolation of Bacteria from Water and Sediments

A total of 20 water and sediment samples were taken from two separate rivers in Khyber Pakhtunkhwa, the River Swat and River Kabul. In the lab, samples were serially diluted and spread out on nutrient agar media. At 37 °C, the plates were incubated for 24 h. Distant colonies appeared on plates, and pure colonies were obtained by streaking them on nutrient agar media (Table 2). Twenty-seven different colonies were isolated from water and sediment samples of River Swat and seventeen colonies were isolated from River Kabul and were identified based on morphological characteristics and biochemical tests.

3.6. Morphological and Biochemical Identification of Isolates

A total of four bacterial strains were isolated from sample S1, seven from S2, six from S3, four from S4, and six from S5 of River Swat. Similarly, four bacterial strains were isolated from sample K1, three from sample K2, four from sample K3, four from sample K4, and two from sample K5 of River Kabul.

3.6.1. Morphological Characteristics

Morphological characteristics are important and must be determined in the isolation and characterization of microbial colonies. These characteristics to identify microbial colonies include color, shape, elevation, and Gram staining. In the present study, microbial colonies were carefully observed for morphological characteristics, i.e., shape and color (Table 3). For S1, the shape of isolates S1a and S1b was round, isolate S1c was a straight rod, and isolate S1d was round-ended (Figure S1). Isolates S1a and S1b were yellow, isolate S1c was gray, and isolate S1d was white. The shape of isolates S2a and S2b from S2 was round while isolates S2c, S2d, and S2f were rods, isolate S2e was a curved rod shape, and isolate S2g was a coccobacillus. Isolates S2a and S2b were yellow, isolate S2c was dark pink, isolate S2d was cream in color, isolate S2e was grayish, isolate S2f was white, and isolate S2g was colorless.
For sample S3, the shape of isolate S3a was round, while isolate S3b was a coccobacillus, and isolates S3c, S3d, S3e, and S3f were curved rods. Isolate S3a was pink, isolate S3b was colorless, isolates S3c and S3f were red, and isolates S3d and S3e were purple (Table 3).
In sample S4, isolate S4a was a rod, isolates S4b and S4c were curved rods, and isolate S4d was round. Isolate S4a was orange, isolates S4b and S4c were purple, and isolate S4d was red. Similarly, for S5, isolate S5a was round while isolates S5b, S5c, and S5e were rods, isolate S5d was a coccobacillus, and isolate S5f was a short rod shape (Figure S1). Isolate S5a was pink in color, isolates S5b and S5c were green in color, isolate S5d was colorless, isolate S5e was purple, and isolate S5f was yellow.
For sample K1, isolates K1a and K1c were rod-shaped, while isolate K1b was round and isolate K1d was a curved rod. Isolate K1a was cream in color, isolates K1b and K1d were red, and isolate K1c was white. In the case of sample K2, isolates K2a, K2b, and K2c were round. Isolates K2a, K2b, and K2c were yellow. For sample K3 collected near the motorway pull, the shape of isolates K3a, K3b, and K3d was round, while isolate K3c was a rod (Table 3). Isolate K3a was pink, K3b and K3d were yellow, and isolate K3c was cream. Colonies of sample K4 showed that isolates K4a and K4b were round, while isolates K4c and K4d were rod-shaped. Isolate K4a was yellow, isolate K4b was pink, isolate K4c was white, and isolate K4d was cream in color. Similarly, sample K5’s morphological characteristics revealed rod-shaped isolates K5a and K5b. Isolate K5a was pink, while isolate K5b was gray (Table 3, Figure S2). The identified bacteria showed substantial variation in shape and colors. The results of the isolates showed that in River Swat samples three different shapes and ten different colors of bacteria were identified including round, rod, and coccobacillus, where the round shape was dominant. Similarly, in River Kabul only round and rod-shaped bacteria were reported with six different colors including yellow, pink, and cream. River Swat showed more diversity in shape and color compared to River Kabul, which is associated with low heavy metals contamination. The microbes identified sought to have the ability to survive in the metal-contaminated environment.

3.6.2. Identification of Isolated Bacteria

Gram staining and different biochemical tests were used to identify the bacteria. Gram staining results revealed that all the isolates of samples S1, S2, S4, and S5 were Gram-negative, while among the six isolates of sample S3, isolate S3a was Gram-positive and the remaining ones were Gram-negative (Table 4). Gram staining revealed that all the isolates of River Kabul were Gram-negative (Table 5).

3.6.3. Biochemical Characteristics

A total of 44 isolates, 27 from River Swat and 17 from River Kabul, were characterized by performing different biochemical tests, i.e., urease (URE), citrate (CIT), hydrogen sulfide (H2S), tryptophan deaminase (TDA), lysine decarboxylase (LDC), ornithine decarboxylase (ODC), glucose (GLU), ONPG, inositol (INO), sorbitol (SOR), arabinose (ARA), ONPG, indole (IND), Voges–Proskauer (VP), gelatinase (GEL), mannose (MAN), rahmnose (RHA), sucrose (SAC), melibiose (MEL), and amygdalin AMY). An analytical profile index (Biomerurix API 20C strips) was used for biochemical tests. Based on biochemical tests, isolates were identified online (www.microrao.com) as E. agglomerans, E. agglomerans, Hafnia alvei, and Plesiomona shigelloides.
From Sample, S1, a total of four bacteria were isolated. Isolate S1a showed positive results for GLU, ONPG, IND, VP, GEL, MAN, RHA, SAC, MEL, and AMY, while the remaining ADH, LDC, ODC, CIT, H2S, TDA, INO, SOR, ARA, and URE were negative (Table 4). Isolate S1b presented positive results for CIT, TDA, ARA, VP, and MEL, and the remaining ADH, LDC, ODC, H2S, GLU, INO, SOR, ONPG, IND, GEL, MAN, RHA, SAC, AMY, and URE showed negative results. Isolate S1c revealed positive results for ADH, LDC, ODC, GLU, IND, and VP and was negative for ODC, CIT, H2S, TDA, GLU, INO, SOR, ONPG, IND, GEL, MAN, RHA, SAC, MEL, AMY, and URE. Similarly, isolate S1d presented positive results for ADH, LDC, ODC, GLU, IND, and VP and was negative for CIT, H2S, TDA, INO, SOR, ARA, ONPG, GEL, MAN, RHA, SAC, MEL, AMY, and URE.
From sample S2, seven bacteria were isolated. These isolates were identified as E. agglomerans, E. agglomerans, Y. intermedia, P. mirabilis, V. metschnikovii, V. splendidus, and P. leiognathi. Isolate S2a showed positive results for IND and VP only and was negative for the remaining H2S, TDA, GLU, INO, SOR, ADH, LDC, ODC, CIT, ARA, ONPG, GEL, MAN, RHA, SAC, MEL, AMY, and URE (Table 4). Isolate S2b presented positive results for GLU, SOR, IND, VP, GEL, MAN, SAC, and AMY and was negative for ADH, LDC, ODC, CIT, H2S, TDA, INO, ARA, ONPG, RHA, MEL, and URE. Isolate S2c revealed positive results for GLU, ARA, IND, VP, GEL, MAN, and AMY and was negative for ADH, LDC, ODC, CIT, H2S, TDA, INO, SOR, ONPG, RHA, SAC, MEL, and URE. Isolate S2d showed positive results for IND and VP while negative ones for the rest of the tests. Likewise, isolate S2e was positive for ADH, INO, ONPG, IND, VP, GEL, and RHA and negative for other tests, including URE. Isolate S2f showed positive results for ADH, TDA, GLU, ONPG, IND, VP, GEL, MAN, RHA, and SAC, while negative ones for LDC, ODC, CIT, H2S, INO, SOR, ARA, MEL, AMY, and URE. Lastly, isolate S2g showed positive results for ADH, GLU, SOR, ONPG, IND, VP, and MAN and negative ones for LDC, ODC, CIT, H2S, TDA, INO, ARA, GEL, RHA, SAC, MEL, AMY, and URE.
From sample S3, six bacteria including Y. ruckeri, P. leiognathi, V. gazogenes, V. metschnikovii, V. metschnikovii, and V. gazogenes were isolated. All these isolates showed variable responses to different test chemicals; for instance, isolates S3a, S3d, and S3e showed positive results for VP only, and the remaining results were negative. Isolate S3b presented positive results for GLU, ONPG, and VP and negative results for the rest of the chemical tests. Isolate S3c revealed positive results only for CIT, GLU, ARA, and VP, while isolate S3f showed positive results for CIT, TDA, GLU, SOR, ONPG, VP, MAN, RHA, MEL, and AMY and showed negative ones for ADH, LDC, ODC, H2S, INO, ARA, IND, GEL, and URE (Table 4).
From sample S4, four bacteria were isolated, including E. cloacae, V. metschnikovii, V. metschnikovii, and S. marcescens. Isolate S4a showed positive results for 50% of the test chemicals, including ADH, CIT, GLU, INO, SOR, ARA, VP, MAN, SAC, and AMY. Isolate S4b presented positive results for 25% of the biochemical tests, including ADH, CIT, IND, VP, and GEL, and negative responses for 75%. Isolate S4c revealed positive results in 45% of biochemical tests and negative responses in 55%. In comparison, isolate S4d showed a positive responses to 20% of biochemical tests, including CIT, ONPG, VP, and GEL, and a negative response to the rest (Table 4).
From sample S5, six bacteria were isolated. These isolates were Y. ruckeri, V. hollisae, V. hollisae, P. leiognathi, V. damse, and V. alginolyticus.
Isolates S5a (Y. ruckeri), S5b (V. hollisae), and S5d (P. leiognathi) showed positive results for ARA and VP only, while negative ones for H2S, TDA, GLU, INO, SOR, ADH, LDC, ODC, CIT, ONPG, IND, GEL, MAN, RHA, SAC, MEL, AMY, and URE. Isolate S5c (V. hollisae) revealed positive results for H2S, ARA, and VP and showed negative results for H2S, TDA, GLU, INO, SOR, ADH, LDC, ODC, CIT, ONPG, IND, GEL, MAN, RHA, SAC, MEL, AMY, and URE. Meanwhile, isolate S5e (V. damse) was found positive for VP and URE and was found negative for ADH, LDC, ODC, CIT, ARA, H2S, TDA, GLU, INO, SOR, ONPG, IND, GEL, MAN, RHA, SAC, MEL, and AMY. Isolate S5f (V. alginolyticus) showed positive results for CIT, VP, and GEL and negative ones for ADH, ARA, LDC, ODC, H2S, TDA, GLU, INO, SOR, ONPG, IND, MAN, RHA, SAC, MEL, AMY, and URE (Table 4). In River Swat samples, among the different biochemical tests VP showed a positive response in all isolates collected from all sampling sites, except for Bahrain in isolate S3, while the rest of the biochemical tests showed variable responses in different isolates. Similarly, GLU and ARA are the other most effective biochemical tests to show positive responses. ODC and URE showed negative responses in all isolates except one, followed by LDC, H2S, and TDA.
From sample K1 of River Kabul, four bacteria were isolated; these isolates were P. mirabilis, S. marcescens, V. proteolyticus, and V. gazogenes.
Isolates K1a showed positive results for IND and VP while remaining negative for H2S, TDA, GLU, INO, SOR, ADH, LDC, ODC, CIT, ARA, ONPG, GEL, MAN, RHA, SAC, MEL, AMY, and URE. Isolate K1b presented positive results for ONPG, IND, VP, GEL, MAN, and SAC while showing negative ones for H2S, TDA, GLU, INO, SOR, ADH, LDC, ODC, CIT, ARA, AMY, MEL, RHA, and URE. Isolate K1c revealed positive results for ADH, LDC, CIT, TDA, GLU, ARA, IND, VP, and MEL and negative ones for ODC, H2S, INO, SOR, ONPG, GEL, MAN, RHA, SAC, AMY, and URE. Meanwhile, isolate K1d presented positive results for ODC, CIT, GLU, ARA, ONPG, IND, VP, GEL, MAN, SAC, MEL, and AMY and showed negative results for ADH, LDC, H2S, TDA, INO, SOR, RHA, and URE (Table 5).
From sample K2, three isolates were isolated, including E. agglomerans, E. agglomerans, and E. agglomerans. All three isolates showed positive results for CIT, TDA, IND, and VP, while they showed negative results for ADH, LDC, ODC, H2S, GLU, INO, SOR, ARA, ONPG, GEL, MAN, RHA, SAC, MEL, AMY, and URE.
From sample K3, four isolates were isolated, including Y. ruckeri, E. agglomerans, P. mirabilis, and E. agglomerans.
Table 5 shows the test results of isolate K3a, which showed positive results for IND and VP and showed negative results for H2S, TDA, GLU, INO, SOR, ADH, LDC, ODC, CIT, ARA, ONPG, GEL, MAN, RHA, SAC, MEL, AMY, and URE. In contrast, isolate K3b presented positive results for ONPG, IND, VP, GEL, MAN, and SAC and presented negative results for H2S, TDA, GLU, INO, SOR, ADH, LDC, ODC, CIT, ARA, AMY, MEL, RHA, and URE. Isolate K3c revealed positive results for ADH, LDC, CIT, TDA, GLU, ARA, IND, MEL, and VP showed negative results for ODC, H2S, INO, SOR, ONPG, GEL, MAN, RHA, SAC, AMY, and URE. In contrast, isolate K3d presented positive results for ODC, CIT, GLU, ARA, ONPG, IND, VP, GEL, MAN, SAC, MEL, and AMY and showed negative results for ADH, LDC, H2S, TDA, INO, SOR, RHA, and URE.
From sample K4, a total of four bacteria were isolated. These bacteria were identified as E. agglomerans, Y. ruckeri, E. americana, and P. mirabilis.
Isolate K4a showed positive results for IND and VP, isolates K4b and K4c showed positive results for VP only, and isolate K4d for TDA, IND, VP, and GEL. The rest of the treatments showed negative results for all the isolates. From sample K5, only two bacteria (Y. ruckeri and P. fontium) were isolated, among which isolate K5a showed positive results for VP and GEL and showed negative results for H2S, TDA, GLU, INO, SOR, ADH, LDC, ODC, CIT, ARA, ONPG, IND, MAN, RHA, SAC, MEL, AMY, and URE. Similarly, isolate K5b presented positive results only for VP and negative results for all other biochemical tests (Table 5). In the case of River Kabul samples, VP showed positive response for all isolates collected from all sampling sites. The rest of the biochemical tests showed variable responses to different isolates. In addition, IND was the second most responsive followed by CIT and TDA, while H2S, INO, SOR, and URE showed negative responses for all isolates.

3.7. Discussion

In the present study, the source of heavy metals in River Swat (upstream) is mainly geogenic, while the downstream has some anthropogenic inputs, including municipal wastewater. On the contrary, River Kabul has been polluted anthropogenically with municipal and industrial waste that results in higher concentrations of heavy metals in both water and sediments of River Kabul. Culturing of the samples taken from River Swat showed 27 different colonies and 17 colonies were isolated from River Kabul. The morphological characteristics and results of different biochemical tests of the analytical profile index (Biomerurix API 20C strips) confirmed E. agglomerans, H. alvei, P. shigelloides, Y. intermedia, P. mirabilis, E. faecalis V. metschnikovii, V. splendidus, P. leiognathi, V. gazogenes, G. arilaitensis, B. transgenic, E. cloacae, S. marcescens, V. hollister, V. adams, V. alginolyticus, V. proteolytic, Brevibacterium, Y. ruckeri, E. americana, P. okeanokoites, and P. folium. The microbial diversity obtained from River Swat and River Kabul suggests that these species are closely related phylogenetically and are nested within Bacillus, Planomicrobium, Enterococcus, Arthrobacter, Brevibacterium, and Glutamicibacter.
The comparative analysis of heavy metals and microbial diversity shows an inverse relationship, with an increase in heavy metals concentration a decrease in microbial diversity observed. As evident from the results, River Kabul, which is more contaminated than River Swat, has less microbial diversity compared to River Swat. In River Swat, seven isolates were identified, while in River Kabul four isolates were identified, which showed the impact of higher heavy metals concentration on microbial diversity. Furthermore, the diversity of both rivers differed, with E. agglomerans as the most common species, followed by Y. ruckeri, found in two sampling sites of River Swat and three sampling sites of River Kabul. Based on the results, it can be assumed that E. agglomerans is a heavy-metals-resistant species. This assumption is only based on the diversity and distribution of the species, and no specific study was conducted on E. agglomerans. Previous studies reported E. agglomerans as a metal-tolerant isolate. Mohite et al. [36] reported that E. agglomerans showed mucoid growth in As-, Cd-, Cr-, Cu-, Hg-, and Pb-contaminated soil.
Similarly, other studies reported that E. agglomerans secretes specific enzymes that affect heavy metals’ mobility and bioavailability in microorganisms [37]. In other studies, Kumar et al. [38] and Acioly et al. [39] reported that E. agglomerans is a good bioremediation agent and can effectively remove Cd from contaminated environments. Similarly, P. mirabilis is another isolate found in River Swat and River Kabul samples. P. mirabilis is a nitrate reducer and can remediate heavy-metals-polluted environments [40,41]. Other species, like S. marcescens [42,43] and Hafnia alvei [44], also resisted heavy metals. It is worth mentioning that in the present study a single medium, nutrient agar, was used for isolation of bacteria, thus the results may not be representative of the two rivers. In future, different culture media may be used to comprehensively assess the toxicological effects of environmental pollutants on microbial diversity.

4. Conclusions

The present study investigated heavy metals concentration and microbial diversity in water and sediments of the rivers Swat and Kabul. The physiochemical properties revealed that the pH of River Swat was neutral to slightly alkaline, while River Kabul water was slightly acidic to neutral. This change in pH can be attributed to anthropogenic interventions in River Kabul as people have dumped their municipal wastes directly into River Kabul. The results revealed that most of the heavy metals were within their respective permissible limits in both water and sediment samples, with a few exceptions. Among the selected heavy metals, the highest concentration was found for Zn in River Swat, while for Fe and Cr in River Kabul. Similarly, in sediment samples, the highest heavy metals concentration was reported for Fe and Mn in both River Swat and River Kabul sediments. The results of the microbial analysis revealed a strong relationship with heavy metal concentrations. For instance, in River Swat seven different isolates were identified, while in River Kabul two to four isolates were identified. The rich diversity in River Swat may be attributed to a low contamination profile and less anthropogenic intervention. From the findings of this study, it can be revealed that anthropogenic intervention strongly influences heavy metals contamination of water and sediments, which, in turn, has a strong influence on microbial diversity in those particular media. A further comprehensive study, with comparative analysis of organic and inorganic pollutants, is recommended using different culture media.

Supplementary Materials

The following supporting information can be downloaded at: https://www.mdpi.com/article/10.3390/w15183297/s1, Figure S1: Images showing the morphologies of bacteria of River Swat; SK1: Mingora Kanju pull, SC2: Charbagh, SH3: Khawaza Khela, SM4: Madyan, SB5: Bahrain; Figure S2: Images showing the morphologies of bacteria of River Kabul. K1: Sardaryab Charsada, K2: Agrah Charsada, K3: Motorway pull, K4: Nowshehra pull, K5: Haqeem Abad. Table S1: Heavy metals concentration in water and sediments of River Swat; Table S2: Heavy metals concentration in water and sediments of River Kabul.

Author Contributions

Methodology, B.A., A.K., S.S.A. and H.K.; Software, M.H.A.; Formal analysis, B.A. and A.A.; Investigation, A.K., S.S.A., M.A. and A.A.; Resources, A.F.A.; Writing—original draft, B.A.; Writing—review & editing, A.K. and K.I.K.; Visualization, H.K.; Supervision, A.K. and S.S.A.; Funding acquisition, A.F.A. All authors have read and agreed to the published version of the manuscript.

Funding

The APC was funded by Researchers Supporting Project (No. RSP2023R218), King Saud University, Riyadh, Saudi Arabia.

Data Availability Statement

The analyzed data are included as figures and tables in the main text as well as supporting information.

Acknowledgments

We appreciate the Researchers Supporting Project (No. RSP2023R218), King Saud University, Riyadh, Saudi Arabia. We also acknowledge Pakistan’s Higher Education Commission (HEC) for partial financial support under the SRGP project (No. 21-1795/SRGP/R&D/HEC/2017).

Conflicts of Interest

The authors have no conflict of interest.

References

  1. Ilyas, M.; Ahmad, W.; Khan, H.; Yousaf, S.; Yasir, M.; Khan, A. Environmental and health impacts of industrial wastewater effluents in Pakistan: A review. Rev. Environ. Health 2019, 34, 171–186. [Google Scholar] [CrossRef] [PubMed]
  2. Li, X.; Liu, T.; Zhang, Y.; Cai, J.; He, M.; Li, M.; Chen, Z.; Zhang, L. Growth of BiOBr/ZIF-67 nanocomposites on carbon fiber cloth as filter-membrane-shaped photocatalyst for degrading pollutants in flowing wastewater. Adv. Fiber Mater. 2022, 4, 1620–1631. [Google Scholar] [CrossRef]
  3. Khan, B.; Ullah, H.; Khan, S.; Aamir, M.; Khan, A.; Khan, W. Sources and Contamination of Heavy Metals in Sediments of Kabul River: The Role of Organic Matter in Metals Retention and Accumulation. Soil Sediment Contam. 2016, 25, 891–904. [Google Scholar] [CrossRef]
  4. Singh, V.; Singh, J.; Mishra, V. Sorption kinetics of an eco-friendly and sustainable Cr (VI) ion scavenger in a batch reactor. J. Environ. Chem. Eng. 2021, 9, 105125. [Google Scholar] [CrossRef]
  5. Avino, P.; Capannesi, G.; Rosada, A. Ultra-trace nutritional and toxicological elements in Rome and Florence drinking waters determined by Instrumental Neutron Activation Analysis. Microchem. J. 2011, 97, 144–153. [Google Scholar] [CrossRef]
  6. Singh, V.; Singh, N.; Rai, S.N.; Kumar, A.; Singh, A.K.; Singh, M.P.; Sahoo, A.; Shekhar, S.; Vamanu, E.; Mishra, V. Heavy Metal Contamination in the Aquatic Ecosystem: Toxicity and Its Remediation Using Eco-Friendly Approaches. Toxics 2023, 11, 147. [Google Scholar] [CrossRef]
  7. Li, S.; Cai, M.; Wang, C.; Liu, Y. Ta3N5/CdS core–shell S-scheme heterojunction nanofibers for efficient photocatalytic removal of antibiotic tetracycline and Cr (VI): Performance and mechanism insights. Adv. Fib. Mater. 2023, 5, 994–1007. [Google Scholar] [CrossRef]
  8. Singh, V.; Singh, N.; Verma, M.; Kamal, R.; Tiwari, R.; Chivate, M.S.; Rai, S.N.; Kumar, A.; Singh, A.; Singh, M.P.; et al. Hexavalent-chromium-induced oxidative stress and the protective role of antioxidants against cellular toxicity. Antioxidants 2022, 11, 2375. [Google Scholar] [CrossRef]
  9. Sin, S.N.; Chua, H.; Lo, W.; Ng, L.M. Assessment of heavy metal cations in sediments of Shing Mun River, Hong Kong. Environ. Int. 2001, 26, 297–301. [Google Scholar] [CrossRef]
  10. Khan, A.; Khan, S.; Khan, M.A.; Qamar, Z.; Waqas, M. The uptake and bioaccumulation of heavy metals by food plants, their effects on plants nutrients, and associated health risk: A review. Environ. Sci. Pollut. Res. 2015, 22, 13772–13799. [Google Scholar] [CrossRef]
  11. Li, S.; Cai, M.; Liu, Y.; Wang, C.; Yan, R.; Chen, X. Constructing Cd0.5Zn0.5S/Bi2WO6 S-scheme heterojunction for boosted photocatalytic antibiotic oxidation and Cr (VI) reduction. Adv. Powder Mater. 2023, 2, 100073. [Google Scholar] [CrossRef]
  12. Miranda, L.S.; Ayoko, G.A.; Egodawatta, P.; Goonetilleke, A. Adsorption-desorption behavior of heavy metals in aquatic environments: Influence of sediment, water and metal ionic properties. J. Hazard. Mater. 2022, 421, 126743. [Google Scholar] [CrossRef] [PubMed]
  13. Geng, J.; Wang, Y.; Luo, H. Distribution, sources, and fluxes of heavy metals in the Pearl River Delta, South China. Mar. Pollut. Bull. 2015, 101, 914–921. [Google Scholar] [CrossRef] [PubMed]
  14. Joshi, P.; Pande, V.; Joshi, P. Microbial diversity of aquatic ecosystem and its industrial potential. J. Bacteriol. Mycol. 2016, 3, 00048. [Google Scholar]
  15. Panizzon, J.P.; Pilz, H.L.; Knaak, N.; Ramos, R.C.; Ziegler, D.R.; Fiuza, L.M. Microbial diversity: Relevance and relationship between environmental conservation and human health. Braz. Arc. Biol. Technol. 2015, 58, 137–145. [Google Scholar] [CrossRef]
  16. Du, X.; Gu, S.; Zhang, Z.; Li, S.; Zhou, Y.; Zhang, Z.; Zhang, Q.; Wang, L.; Ju, Z.; Yan, C.; et al. Spatial distribution patterns across multiple microbial taxonomic groups. Environ. Res. 2023, 223, 115470. [Google Scholar] [CrossRef]
  17. Xie, Y.; Liu, X.; Wei, H.; Chen, X.; Gong, N.; Ahmad, S.; Lee, T.; Ismail, S.; Ni, S.Q. Insight into impact of sewage discharge on microbial dynamics and pathogenicity in river ecosystem. Sci. Rep. 2022, 12, 6894. [Google Scholar] [CrossRef]
  18. Klerks, P.L.; Weis, J.S. Genetic adaptation to heavy metals in aquatic organisms: A review. Environ. Pollut. 1987, 45, 173–205. [Google Scholar] [CrossRef]
  19. Duke, C.V.A.; Williams, C.D. Soil Pollution Chemistry for Environment and Earth Sciences; CRC Press; Taylor and Francis Group: Boca Raton, FL, USA, 2008. [Google Scholar]
  20. Wang, J.; Fan, Y.; Yao, Z. Isolation of a Lysinibacillus fusiformis strain with tetrodotoxin-producing ability from puffer fish Fugu obscurus and the characterization of this strain. Toxicon 2010, 56, 640–643. [Google Scholar] [CrossRef]
  21. Sagova-Mareckova, M.; Boenigk, J.; Bouchez, A.; Cermakova, K.; Chonova, T.; Cordier, T.; Eisendle, U.; Elersek, T.; Fazi, S.; Fleituch, T.; et al. Expanding ecological assessment by integrating microorganisms into routine freshwater biomonitoring. Water Res. 2021, 191, 116767. [Google Scholar] [CrossRef]
  22. Yin, H.; Niu, J.; Ren, Y.; Cong, J.; Zhang, X.; Fan, F.; Xiao, Y.; Zhang, X.; Deng, J.; Xie, M.; et al. An integrated insight into the response of sedimentary microbial communities to heavy metal contamination. Sci. Rep. 2015, 5, 14266. [Google Scholar] [CrossRef] [PubMed]
  23. Keshri, J.; Yousuf, B.; Mishra, A.; Jha, B. The abundance of functional genes, cbbL, nifH, amoA and apsA, and bacterial community structure of intertidal soil from Arabian Sea. Microbiol. Res. 2015, 175, 57–66. [Google Scholar] [CrossRef] [PubMed]
  24. Ahmad, H.; Yousafzai, A.M.; Siraj, M.; Ahmad, R.; Ahmad, I.; Nadeem, M.S.; Ahmad, W.; Akbar, N.; Muhammad, K. Pollution problem in river kabul: Accumulation estimates of heavy metals in native fish species. BioMed Res. Int. 2015, 2015, 537368. [Google Scholar] [CrossRef] [PubMed]
  25. Yousafzai, A.M.; Khan, A.R.; Shakoori, A.R. An assessment of chemical pollution in River Kabul and its possible impacts on fisheries. Pak. J. Zool. 2008, 40, 199. [Google Scholar]
  26. Yousafzai, A.M.; Khan, A.R.; Shakoori, A.R. Heavy metal pollution in River Kabul affecting the inhabitant fish population. Pak. J. Zool. 2008, 40, 331–339. [Google Scholar]
  27. Khan, S.; Khan, A.M.; Khan, M.N. Investigation of pollutants loads in waste water of Hayatabad Industrial Estate, Peshawar, Pakistan. J. App. Sci. 2002, 2, 457–461. [Google Scholar]
  28. Khan, S.; Shahnaz, M.; Jehan, N.; Rehman, S.; Shah, M.T.; Din, I. Water quality and human health risk in Charsadda district. Pakistan. J. Clean. Prod. 2012, 10, 10–16. [Google Scholar]
  29. Tabatabai, M.A.; Bremner, J.M. Use of p-nitrophenyl phosphate for assay of soil phosphatase activity. Soil Biol. Biochem. 1969, 1, 301–307. [Google Scholar] [CrossRef]
  30. WHO. Guidelines for Drinking-Water Quality (Electronic Resource), Incorporating 1st and 2nd Addenda; WHO: Geneva, Switzerland, 2008. [Google Scholar]
  31. Ahmed, M.K.; Baki, M.A.; Islam, M.S.; Kundu, G.K.; Habibullah-Al-Mamun, M.; Sarkar, S.K.; Hossain, M.M. Human health risk assessment of heavy metals in tropical fish and shellfish collected from the river Buriganga, Bangladesh. Environ. Sci. Pollut. Res. 2015, 22, 15880–15890. [Google Scholar] [CrossRef]
  32. CCME. Canadian Sediment Quality Guidelines for the Protection of Aquatic Life; Canadian Council of Ministers of the Environment: Winnipeg, MB, Canada, 2001. [Google Scholar]
  33. Buchman, M. NOAA Screening Quick Reference Tables. NOAA HAZMAT Report 99-1; Coastal Protection and Restoration Division, National Oceanic and Atmospheric Administration: Seattle, WA, USA, 1999. [Google Scholar]
  34. USEPA. United States Environmental Protection Agency. Ecological Risk Assessment Guidance for Superfund: Process for Designing and Conducting Ecological Risk Assessments; Environmental Response Team: Edison, NJ, USA, 1997. [Google Scholar]
  35. Afzaal, M.; Hameed, S.; Liaqat, I.; Khan, A.M.A.; Manan, H.A.; Shahid, R.; Altaf, M. Heavy metals contamination in water, sediments and fish of freshwater ecosystems in Pakistan. Water Pract. Technol. 2022, 17, 1253–1272. [Google Scholar] [CrossRef]
  36. Mohite, B.V.; Koli, S.H.; Patil, S.V. Heavy metal stress and its consequences on exopolysaccharide (EPS)-producing Pantoea agglomerans. App. Biochem. Biotechnol. 2018, 186, 199–216. [Google Scholar] [CrossRef] [PubMed]
  37. Staninska-Pięta, J.; Czarny, J.; Piotrowska-Cyplik, A.; Juzwa, W.; Wolko, Ł.; Nowak, J.; Cyplik, P. Heavy metals as a factor increasing the functional genetic potential of bacterial community for polycyclic aromatic hydrocarbon biodegradation. Molecules 2020, 25, 319. [Google Scholar] [CrossRef] [PubMed]
  38. Kumar, A.; Subrahmanyam, G.; Mondal, R.; Cabral-Pinto, M.M.S.; Shabnam, A.A.; Jigyasu, D.K.; Malyan, S.K.; Fagodiya, R.K.; Khan, S.A.; Yu, Z.-G. Bio-remediation approaches for alleviation of cadmium contamination in natural resources. Chemosphere 2021, 268, 128855. [Google Scholar] [CrossRef] [PubMed]
  39. Acioly, L.M.; Cavalcanti, D.; Luna, M.C.; Júnior, J.C.; Andrade, R.F.; Silva, T.A.D.L.; Campos-Takaki, G.M. Cadmium removal from aqueous solutions by strain of Pantoea agglomerans UCP1320 isolated from laundry effluent. Open Microbiol. J. 2018, 12, 297–307. [Google Scholar] [CrossRef]
  40. Eltarahony, M.; Zaki, S.; Abd-El-Haleem, D. Aerobic and anaerobic removal of lead and mercury via calcium carbonate precipitation mediated by statistically optimized nitrate reductases. Sci. Rep. 2020, 10, 4029. [Google Scholar] [CrossRef] [PubMed]
  41. Eltarahony, M.; Zaki, S.; ElKady, M.; Abd-El-Haleem, D. Biosynthesis, characterization of some combined nanoparticles, and its biocide potency against a broad spectrum of pathogens. J. Nanomat. 2018, 2018, 5263814. [Google Scholar] [CrossRef]
  42. Edet, U.O.; Bassey, I.U.; Joseph, A.P. Heavy metal co-resistance with antibiotics amongst bacteria isolates from an open dumpsite soil. Heliyon 2023, 9, e13457. [Google Scholar] [CrossRef]
  43. Lin, H.; Zhou, M.; Li, B.; Dong, Y. Mechanisms, application advances and future perspectives of microbial-induced heavy metal precipitation: A review. Int. Biodeterior. Biodeg. 2023, 178, 105544. [Google Scholar] [CrossRef]
  44. Kalkan, S. Heavy metal resistance of marine bacteria on the sediments of the Black Sea. Marine Pollut. Bull. 2022, 179, 113652. [Google Scholar] [CrossRef]
Figure 1. Map of River Swat and River Kabul indicating the sample collection points.
Water 15 03297 g001
Figure 2. Mean heavy metals concentration in water and sediments of River Swat and River Kabul.
Water 15 03297 g002
Table 1. Mean (±SD) and range of physiochemical parameters of River Swat and River Kabul.
SwatKabul
Parameters RangeMean ± SDRangeMean ± SDWHO Limit
Water
pH8.10–8.488.28 ± 0.166.77–7.947.52 ± 0.476.5–8.5
EC (µS/cm)233.6–662.1420.16 ± 179.571.99–114.8043.72 ± 56.821500
Sediments
pH6.77–7.947.62 ± 0.236.79–7.547.28 ± 0.316.5–8.5
EC (µS/cm)450.1–950.6769.76 ± 193.672.53–175.8116.47 ± 70.181500
Table 2. Number of isolates isolated from River Swat and River Kabul.
Swat SampleNo of IsolatesKabul SampleNo of Isolates
Mingora Kanju pull (S1)4Sardaryab Charsada (K1)4
Charbagh (S2)7Agrah (K2)3
Khawaza Khela (S3)6Motorway pull (K3)4
Madyan (S4)4Nowshehra pull (K4)4
Bahrain (S5)6Hakeem Abad (K5)2
Table 3. Morphological characteristics of microbial isolates of River Swat and River Kabul.
SampleCharacteristicsabcDefg
River Swat
Mingora Kanju pull (S1)NameE. agglomeransE. agglomeransHafnia alveiPlesiomona shigelloides
ShapeRoundRoundStraight rodRound-ended------
ColorYellowYellowGrayWhite------
Charbagh (S2)NameE. agglomeransE. agglomeransY. intermedia,P.MirabilisV. metschnikoviiV. splendidusP. leiognathi
ShapeRoundRoundRodRodCurved rodRodCoccobacillus
ColorYellowYellowDark pinkCreamGrayishWhiteColorless
Khawaza Khela (S3)NameY. ruckeriP. leiognathi,V. gazogenesV. metschnikoviiV. metschnikoviiV. gazogenes
ShapeRoundCoccobacillusCurved rodCurved rodCurved rodCurved rod--
ColorPinkColorlessRedPurplePurpleRed--
Madyan (S4)NameE. cloacaeV. metschnikoviiV. metschnikoviiS. marcescens
ShapeRodCurved rodCurved rodRound------
ColorOrangePurplePurpleRed------
Bahrain (S5)NameY. ruckeriV. hollisaeV. hollisaeP. leiognathiV. damseV. alginolyticus
ShapeRoundRodRodCoccobacillusRodShort rod--
ColorPinkGreenGreenColorlessPurpleYellow--
River Kabul
Sardaryab Charsada (K1)NameP. mirabilisS. marcescensV. proteolyticusV. gazogenes
ShapeRodRoundRodCurved rod
ColorCreamRedWhiteRed
Agrah (K2)NameE. agglomeransE. agglomeransE. agglomerans
ShapeRoundRoundRound--
ColorYellowYellowYellow--
Motorway pull (K3)NameY. ruckeriE. agglomeransP. mirabilisE. agglomerans
ShapeRoundRoundRodRound
ColorPinkYellowCreamYellow
Nowshehra pull (K4)NameE. agglomeransY. ruckeriE. americanaP. mirabilis
ShapeRoundRoundRodRod
ColorYellowPinkWhiteCream
Hakeem Abad (K5)NameY. ruckeriP. fontium
ShapeRodRod----
ColorPinkGray----
Table 4. Biochemical characteristics of microbial isolates from River Swat.
CharacteristicsMicrobial Isolates
1234567
Gram StainingG-Negative *G-NegativeG-NegativeG-NegativeG-NegativeG-NegativeG-Negative
Arginine dihydrolase (ADH)K−, C−, H−, M+, B−K−, C−, H−, M+, B−K+, C−, H−, M+, B−K+, C−, H−, M−, B−C+, H−, B−C+, H−, B−C+
Lysine decarboxylase (LDC)K−, C−, H−, M−, B−K−, C−, H−, M−, B−K+, C−, H−, M−, B−K+, C−, H−, M−, B−C−, H−, B−C−, H−, B−C−
Ornithine decarboxylase (ODC)K−, C−, H−, M−, B−K−, C−, H−, M−, B−K−, C−, H−, M−, B−K+, C−, H−, M−, B−C−, H−, B−C−, H−, B−C−
Citrate (CIT)K−, C−, H−, M+, B−K+, C−, H−, M+, B−K−, C−, H+, M−, B−K−, C−, H−, M+, B−C−, H−, B−C−, H+, B+C−
Hydrogen sulfide (H2S)K−, C−, H−, M−, B−K−, C−, H−, M−, B−K−, C−, H−, M−, B+K−, C−, H−, M−, B+C−, H−, B−C−, H−, B−C−
Tryptophan deaminase (TDA)K−, C−, H−, M−, B−K+, C−, H−, M−, B−K−, C−, H−, M−, B−K−, C−, H−, M−, B−C−, H−, B−C+, H+, B−C−
Glucose (GLU)K+, C−, H−, M+, B−K−, C+, H+, M−, B−K−, C+, H+, M+, B−K+, C−, H−, M−, B−C−, H−, B−C+, H+, B−C+
Inositol (INO)K−, C−, H−, M+, B−K−, C−, H−, M−, B−K−, C−, H−, M+, B−K−, C−, H−, M−, B−C+, H−, B−C−, H−, B−C−
Sorbitol (SOR)K−, C−, H−, M+, B−K−, C+, H−, M−, B−K−, C−, H−, M+, B−K−, C−, H−, M−, B−C−, H−, B−C−, H+, B−C+
Arabinose (ARA)K−, C−, H−, M+, B+K+, C−, H−, M−, B+K+, C+, H+, M+, B+K−, C−, H−, M−, B−C−, H−, B−C−, H−, B−C−
ONPGK+, C−, H−, M−, B−K−, C−, H+, M−, B−K−, C−, H−, M−, B−K−, C−, H−, M+, B−C+, H−, B−C+, H+, B−C+
Indole (IND)K+, C+, H−, M−, B−K−, C+, H−, M+, B−K−, C+, H−, M−, B−K+, C+, H−, M−, B−C+, H−, B−C+, H−, B−C+
Voges–Proskauer (VP)K+, C+, H+, M+, B+K+, C+, H+, M+, B+K+, C+, H+, M+, B−K+, C+, H+, M+, B+C+, H+, B+C+, H+, B+C+
Gelatinase (GEL)K+, C−, H−, M−, B−K−, C+, H−, M+, B−K−, C+, H−, M−, B−K−, C−, H−, M+, B−C+, H−, B−C+, H−, B+C−
Mannose (MAN)K+, C−, H−, M+, B−K−, C+, H−, M−, B−K−, C+, H−, M+, B−K−, C−, H−, M−, B−C−, H−, B−C+, H+, B−C+
Rahmnose (RHA)K+, C−, H−, M−, B−K−, C−, H−, M−, B−K−, C−, H−, M−, B−K−, C−, H−, M−, B−C+, H−, B−C+, H+, B−C−
Sucrose (SAC)K+, C−, H−, M+, B−K−, C+, H−, M−, B−K−, C−, H−, M+, B−K−, C−, H−, M−, B−C−, H−, B−C+, H+, B−C−
Melibiose (MEL)K+, C−, H−, M−, B−K+, C−, H−, M−, B−K−, C−, H−, M−, B−K−, C−, H−, M−, B−C−, H−, B−C−, H+, B−C−
Amygdalin (AMY)K+, C−, H−, M+, B−K−, C+, H−, M−, B−K−, C+, H−, M+, B−K−, C−, H−, M−, B−C−, H−, B−C−, H+, B−C−
Urease (URE)K−, C−, H−, M−, B−K−, C−, H−, M−, B−K−, C−, H−, M−, B−K−, C−, H−, M−, B−C−, H−, B+C−, H−, B−C−
Notes: K: Mingora Kanju pull, C: Charbagh, H: Khawaza Khela, M: Madyan, B: Bahrain. * Gram staining was G-positive for isolate 1 of Khawaza Khela sample point.
Table 5. Biochemical characteristics of isolates from River Kabul.
CharacteristicsMicrobial Isolates
1234
Gram stainingG-NegativeG-NegativeG-NegativeG-Negative
Arginine dihydrolase (ADH)S−, A−, M−, N−, H−S−, A−, M−, N−, H−S+, A−, M+, N−S−, M−, N−
Lysine decarboxylase (LDC)S−, A−, M−, N−, H−S−, A−, M−, N−, H−S+, A−, M+, N−S−, M−, N−
Ornithine decarboxylase (ODC)S−, A−, M−, N−, H−S−, A−, M−, N−, H−S−, A−, M−, N−S+, M+, N−
Citrate (CIT)S−, A+, M−, N−, H−S−, A+, M−, N−, H−S+, A+, M+, N−S+, M+, N−
Hydrogen sulfide (H2S)S−, A−, M−, N−, H−S−, A−, M−, N−, H−S−, A−, M−, N−S−, M−, N−
Tryptophan deaminase (TDA)S−, A+, M−, N−, H−S−, A+, M−, N−, H−S+, A+, M+, N−S−, M−, N+
Glucose (GLU)S−, A−, M−, N−, H−S−, A−, M−, N−, H−S+, A−, M+, N−S+, M+, N−
Inositol (INO)S−, A−, M−, N−, H−S−, A−, M−, N−, H−S−, A−, M−, N−S−, M−, N−
Sorbitol (SOR)S−, A−, M−, N−, H−S−, A−, M−, N−, H−S−, A−, M−, N−S−, M−, N−
Arabinose (ARA)S−, A−, M−, N−, H−S−, A−, M−, N−, H−S+, A−, M+, N−S+, M+, N−
ONPGS−, A−, M−, N−, H−S+, A−, M+, N−, H−S−, A−, M−, N−S+, M+, N−
Indole (IND)S+, A+, M+, N+, H−S+, A+, M+, N−, H−S+, A+, M+, N−S+, M+, N+
Voges–Proskauer (VP)S+, A+, M+, N+, H+S+, A+, M+, N+, H+S+, A+, M+, N+S+, M+, N+
Gelatinase (GEL)S−, A−, M−, N−, H+S+, A−, M+, N−, H−S−, A−, M−, N−S+, M+, N+
Mannose (MAN)S−, A−, M−, N−, H−S+, A−, M+, N−, H−S−, A−, M−, N−S+, M+, N−
Rahmnose (RHA)S−, A−, M−, N−, H−S−, A−, M−, N−, H−S−, A−, M−, N−S−, M−, N−
Sucrose (SAC)S−, A−, M−, N−, H−S+, A−, M+, N−, H−S−, A−, M−, N−S+, M+, N−
Melibiose (MEL)S−, A−, M−, N−, H−S−, A−, M−, N−, H−S+, A−, M+, N−S+, M+, N−
Amygdalin (AMY)S−, A−, M−, N−, H−S−, A−, M−, N−, H−S−, A−, M−, N−S+, M+, N−
Urease (URE)S−, A−, M−, N−, H−S−, A−, M−, N−, H−S−, A−, M−, N−S−, M−, N−
Notes: S: Sardaryab Charsada, A: Agrah Charsada, M: Motorway pull, N: Nowshehra pull, H: Haqeem Abad.
Disclaimer/Publisher’s Note: The statements, opinions and data contained in all publications are solely those of the individual author(s) and contributor(s) and not of MDPI and/or the editor(s). MDPI and/or the editor(s) disclaim responsibility for any injury to people or property resulting from any ideas, methods, instructions or products referred to in the content.

