
A New Tool for Mapping Water Yield in Cold Alpine Regions

1
Qilian Alpine Ecology and Hydrology Research Station, Key Laboratory of Ecological Safety and Sustainable Development in Arid Lands, Northwest Institute of Eco-Environment and Resources, Chinese Academy of Sciences, Lanzhou 730000, China
2
University of Chinese Academy of Sciences, Beijing 100049, China
3
College of Geography and Tourism, Hengyang Normal University, Hengyang 421200, China
*
Author to whom correspondence should be addressed.
Water 2023, 15(16), 2920; https://doi.org/10.3390/w15162920
Submission received: 6 July 2023
/
Revised: 4 August 2023
/
Accepted: 8 August 2023
/
Published: 13 August 2023
(This article belongs to the Special Issue Impact of Climate and Socio-Economic on Irrigation Water Management and Agricultural Water Productivity)
Abstract
:Watershed management requires reliable information about hydrologic ecosystem services (HESs) to support decision-making. In cold alpine regions, the hydrology regime is largely affected by frozen ground and snow cover. However, existing special models of ecosystem services usually ignore cryosphere elements (such as frozen ground and snow cover) when mapping water yield, which limits their application and promotion in cold alpine regions. By considering the effects of frozen ground and snow cover on water yield, a new version of the Seasonal Water Yield model (SWY) in the Integrated Valuation of Ecosystem Services and Trade-offs (InVEST) was presented and applied in the Three-River Headwaters Region (TRHR) in southeastern Qinghai-Tibetan Plateau (QTP). Our study found that incorporating the effects of frozen ground and snow cover improved model performance. Frozen ground acts as a low permeable layer, reducing water infiltration, while snow cover affects water yield through processes of melting and sublimation. Both of these factors can significantly impact the distribution of spatial and temporal quickflow and baseflow. The annual average baseflow and water yield of the TRHR would be overestimated by 13 mm (47.58 × 10⁸ m3/yr) and 14 mm (51.24 × 10⁸ m3/yr), respectively, if the effect of snow cover on them is not considered. Furthermore, if the effect of frozen ground on water yield were not accounted for, there would be an average of 6 mm of quickflow misestimated as baseflow each year. Our study emphasizes that the effects of frozen ground and snow cover on water yield cannot be ignored, particularly over extended temporal horizons and in the context of climate change. It is crucial to consider their impacts on water resources in cold alpine regions when making water-related decisions. Our study widens the application of the SWY and contributes to water-related decision-making in cold alpine regions.
1. Introduction
Hydrologic ecosystem services (HESs) are the goods and services that ecosystems provide to people related to various uses of water, and include the provision of water for municipal, agricultural, and commercial purposes, mitigation of flow peaks to prevent inundations, reduction of sediment and nutrient loads in water, and the intrinsic value of natural hydrological systems for recreational activities [1,2]. HESs influence land management decisions through both regulations and investments aimed at safeguarding and enhancing water resources, and HES information is critical for water management and political decision-making [3,4]. Water yield is an important index for the assessment of water supply capacity and its assessment and improvement is often a priority for watershed management [5,6,7]. Decision-makers must have a clear understanding of how much water a parcel can yield and be able to identify regions that are vulnerable to floods or droughts. This will allow them to implement measures that benefit downstream residents [3]. In cold alpine regions, the vast expanses of frozen ground and snow cover have significant and far-reaching impacts on the ecological and hydrological processes within the basin [8,9,10]. As a result, there is a high demand for spatially explicit models to assess water yield in these regions.
The models used to evaluate water yield can be mainly classified into two categories: traditional hydrological models and special models of ecosystem services [3,4,11]. Traditional hydrological models are based on complex hydrological processes and often require specialized training for the operators, making it difficult for users to apply them accurately to watershed management, especially over a short period. Thus, they have been limited in their application in HES assessments. Although there are many hydrological models applied in the field of HES assessment, the methods are mostly the Soil and Water Assessment Tool (SWAT), while a few studies have also employed the Variable Infiltration Capacity model (VIC) model [12,13,14,15,16,17]. Similar to many process-based land surface models and hydrological models in cold alpine regions, although VIC can explain hydrological processes resulting from frozen ground and snow cover, it typically used for hydrology modeling and rarely for HESs due to its requirement for strong computing ability and specialized hydrological knowledge [18,19,20,21,22,23]. Even in cold alpine regions, many users without strong hydrological knowledge tend to ignore the impact of cryosphere elements and focus more on the impact of land use on HESs [24,25,26]. In contrast, models specifically designed for HESs are easy to use and contain fewer comprehensive algorithms [11]. However, changes in cryosphere elements will have an undeniable impact on hydrological ecosystems, including water yield [8,9,10]. Therefore, there is an urgent need to develop a model that is relatively easy to operate, requires relatively low specialized hydrological knowledge, and is more reliable for use in the assessment of HESs in cold alpine regions. Incorporating cryosphere elements into the special models of ecosystem services is a good choice. The Integrated Valuation of Ecosystem Services and Trade-offs tool (InVEST) was specifically developed for ecosystem services and has gained popularity in recent years [27,28,29,30,31,32,33]. The Annual Water Yield Model (AWY) of InVEST has been widely used to evaluate HESs [34,35]. Nonetheless, the influence of snow cover and frozen ground on water yield is highly seasonal, and inputting annual data makes it difficult to consider the effects of frozen ground and snow cover on hydrological processes by model revision. Although the AWY solely simulates the aggregate water yield, numerous applications necessitate an understanding of the seasonal water yield, which entails the differentiation between quickflow and baseflow [36].
Based on the Curve Number and water balance method, the Seasonal Water Yield model (SWY) of InVEST identifies differences between quickflow and baseflow [6]. It has been used in various geographical contexts, but its performance was found to be poorer in snow-dominated regions, based on evaluation [6,10,27,37]. Furthermore, incorporating the effects of the thickness and hydraulic conductivity of soil and topography makes it possible to take the effect of frozen ground into account according to temperature. Similarly, monthly inputs can be used to account for the effect of snow cover. Hamel et al. found that the model performance improved after incorporating snowmelt from the SWAT model into the baseflow output from the SWY [27]. However, this approach may not be feasible for all users if the SWAT snowmelt data is not available. On the other hand, Scordo et al. coupled a snow accumulation and ablation model to the SWY and found that it significantly improved the accuracy of predictions [10]. It should be noted that Scordo et al.’s study specified the quickflow and did not consider the baseflow component [10]. One of the main challenges for the current work is to integrate the effects of frozen ground and snow cover on water yield into the SWY to make it applicable in cold alpine regions.
The Three-River Headwaters Region (TRHR), as a crucial part of the Qinghai-Tibetan Plateau (QTP), is a typical cold alpine region with large areas of frozen ground and snow cover [38,39]. As a part of ‘the Asian water tower’, this region is essential to the human livelihood and ecological security of countries around the QTP [40,41]. In the past few decades, frozen ground and snow cover were degrading under climate warming [42,43,44]. In recent years, with climate change and ecosystem degradation, water resource management has become the priority task for decision-makers in the TRHR. Most HESs researched in this region were based on the traditional AWY, which focused on the total water yield instead of baseflow and quickflow. Pan et al. showed that the water supply in the TRHR was decreasing from 1980 to 2005 based on the AWY model [45]. It was found that the average annual water conservation of the QTP and the TRHR decreased from southeast to northwest using AWY [46,47]. However, the research above ignored the effects of the two cryosphere elements on the hydrological process. SWAT, with a snowmelt module, was applied in the TRHR to estimate the annual average water yield during the period of 1961–2010 but it ignored the effect of the frozen ground and the spatiotemporal change in water yield [48]. Hence, it is imperative to modify and implement the SWY in the TRHR to investigate and assess its applicability in cold alpine areas.
Given the limitations of the existing studies, and taking the TRHR as a case study, we directed our efforts towards refining the SWY by considering the impact of frozen ground and snow cover on water yield. The analyses aim at (1) developing a new version of SWY suitable for cold alpine regions and (2) learning how the frozen ground and snow cover affect water yield. The descriptions of the SWY and model revision are presented in the following section. Then, the characteristics of the study area, data, and methods for running, calibrating, and evaluating the new version of SWY and for sensitivity analyses of parameters are introduced. In addition, the results section also shows the effects of frozen ground and snow cover on water yield. Finally, the model performance of the new version of SWY and limitations of our study are discussed. There are two points that need clarification: (1) this model is not a traditional hydrological model but rather a special model of ecosystem services. The estimation of cryosphere elements in this model is relatively rough compared to traditional cold region hydrological models. Its advantage lies in its relatively simplicity in application. It is expected to provide a useful tool for watershed management decision-makers and to help to enhance ecological protection and construction in cold alpine regions. (2) When discussing the effect of frozen ground on water yield, the term “frozen ground” mainly refers to seasonal frozen ground and the active layer, without considering the effects of permafrost and its influence on water yield.
2. Methodology
2.1. Seasonal Water Yield Model
The SWY was computed through InVEST (https://naturalcapitalproject.stanford.edu/software/invest) (accessed on 5 March 2020) [36]. The SWY generates several outputs, including monthly and annual quickflow and annual baseflow rasters for the watershed. Quickflow refers to direct runoff reaching streams during or shortly after rain events. Baseflow is water that reaches streams later, between precipitation/snowmelt events that can have residence times of months or even years.
Firstly, the model calculates monthly quickflow (QF) on each pixel based on a modification curve number (CN) approach [36]:
where ai,m is the mean rain depth on a rainy day at pixel i on month m (in), ni,m is the number of events at pixel i in month m, and Pi,m is the monthly precipitation for pixel I at month m (mm). Si is the potential maximum soil moisture retention after runoff begins (in). CNi is the curve number for pixel i, tabulated as a function of the local land use land cover (LULC) and soil type. The figure 25.4 is a conversion factor from inches (used by the equation) to millimeters.
Thus, the annual quickflow QFi can be calculated from the sum of monthly QFi,m values:
Next, the model partitions the monthly available water between local recharge and evapotranspiration. The local recharge of a pixel is computed from the local water balance:
where Pi and Pi,m are the annual and monthly precipitation, respectively. αm is the fraction of the upgradient subsidy that is available in month m (with a default value of 1/12). βi is a spatial availability parameter (0–1) which represents the fraction of the upslope subsidy that is available for downslope evapotranspiration. Lsum.avail, i is the sum of upgradient subsurface water that is potentially available at pixel i:
where pij ∈ [0, 1] is the proportion of flow from cell i to j, and Lavail,i is the available recharge to a pixel, which is Li whenever Li is negative, and a proportion γ of Li when it is positive. γ is the fraction of pixel recharge that is available to downslope pixels.
Finally, the model computes the baseflow index. The baseflow index represents the contribution of a pixel to baseflow (i.e., water that reaches the stream during the dry season). If the local recharge is negative, B is set to zero. Otherwise, B is a function of the amount of flow leaving the pixel and of the relative contribution to recharge of this pixel.
For a pixel that is not adjacent to the stream channel, the cumulative baseflow, Bsum,i, is proportional to the cumulative baseflow leaving the adjacent downslope pixels minus the cumulative baseflow that was generated on that same downslope pixel:
Lsum, i is the cumulative upstream recharge defined by:
The baseflow, Bi can be directly derived from the proportion of the cumulative baseflow leaving cell i, with respect to the available recharge to the upstream cumulative recharge:
Details of the SWY assumption, equation, and workflow are described in the model documentation [36].
2.2. Model Revision
2.2.1. Considering the Effect of Frozen Ground on Water Yield
The impermeability of frozen ground is linked to the presence of unfrozen water and ground ice in the frozen ground [48]. Experiments conducted in the field showed that hydraulic conductivities decrease as temperature decreases [49]. When negative temperature occurs, the saturated hydraulic conductivity (SHC) is found to decrease by approximately 4 orders of magnitude near 0 °C, and then decreases slowly as the temperature decreases [50,51,52]. The soil water is liquid when the temperature of soil is positive, completely frozen when the soil temperature is lower than a critical temperature threshold (Tf), and partially frozen when the local temperature is between 0 °C and Tf. The saturated hydraulic conductivity (SHC) of soil is different in the three frozen states (Equation (13)).
where k′0 is the SHC (cm/d) after correction by soil temperature, k0 is the SHC (cm/d) before correction, Ts is the temperature of the soil, and Tf denotes the temperature threshold of soil freezing.
The first step was to revise the monthly soil SHC of the TRHR to account for frozen ground using Equation (13). Then, the average hydraulic conductivity value for 12 months was calculated since the soil group data used in the model were on an annual scale. The soil groups were then divided into four categories (A, B, C, and D) based on the range of soil SHC using the method in chapter 7 of the United States Department of Agriculture (USDA), as shown in Figure 1a [53].
2.2.2. Considering the Effect of Snow Cover on Water Yield
Firstly, the precipitation was divided into rainfall, snowfall, and mixed by the temperature threshold method [54,55]. When the temperature is higher than the threshold temperature for differentiating rain and sleet (T1), the precipitation form is rainfall; when the temperature is lower than the threshold temperature for differentiating snow and sleet (T2), the precipitation form is snowfall; when the temperature is between the two threshold values, the precipitation is characterized sleet (mixed). Next, a positive degree-day factor method was used to calculate the snow melt amount [56] (Equation (14)). The estimation of snow sublimation is a rough approximation for the entire region and can be referenced from relevant literature on snow sublimation in the study area. Finally, the monthly liquid precipitation was obtained (Figure 1b).
where M is the snow melt (mm); DDF is the degree-day factor; PDD is the sum of the mean cumulative positive temperature over a period named positive degree-day.
When precipitation reaches the threshold temperature, it transforms from a solid to a liquid state [54]. However, snow may not completely melt in the current month and instead accumulate and persist depending on the temperature. The sublimation of snow cover can lead to a decrease in precipitation amount on the underlying surface, and the melting of snow cover at different times can alter the annual distribution of precipitation [57,58].
2.2.3. Model Calibration, Validation, and Evaluation
There are two tasks that we need to complete in this section:
- Determine if the model performance improves after the model revision.
- Conduct sensitivity analysis (α, β, and γ) to identify the optimal parameter combination.
We established four different scenarios to compare their performance. The scenario that does not consider the impact of the cryosphere elements is referred to as SWY1. The scenario that considers the impact of frozen ground is referred to as SWY2. The scenario that considers the impact of snow cover is referred to as SWY3. Finally, the scenario that considers both the effects of frozen ground and snow cover on baseflow is referred to as SWY4. Considering the difficulty in obtaining observed quickflow and baseflow data, we validated the total water yield using observed annual streamflow data from the Yangtze River Source Region (YAR), Yellow River Source Region (YER), and Lantsang-Mekong River Source Region (LAR). To obtain the quickflow and baseflow data, we used the results of the Eckhardt filter method (Equations (15) and (16)) [59,60]. The Eckhardt filter is a widely used baseflow separation method that partitions streamflow into two components, quickflow and baseflow, and has been validated in many baseflow separation analyses [60,61,62].
where y is the total streamflow; f denotes the quickflow; b represents the baseflow; and k is the time step.
where α represents the recession constant, while BFImax represents the maximum baseflow index (BFI). Three representative BFImax values for different hydrological and hydrogeological conditions were introduced: 0.80 for perennial streams with porous aquifers; 0.50 for ephemeral streams with porous aquifers; and 0.25 for perennial streams with hard rock aquifers [59]. α is 0.98 for perennial streams, 0.963 for ephemeral streams with porous aquifers, and 0.955 for perennial streams with hard rock aquifers. Above all, we selected the suggested values of 0.98 for α and 0.80 for BFImax [59].
To evaluate the model performance, we used three indicators: determination coefficient (R2), Nash–Sutcliffe efficiency (NSE), and percent bias (PBIAS). R2 determines the strength of correlation between the modeled and observed data (Equation (17)). NSE compares the residual variance of the modeled data to the measured data variance (Equation (18)). PBIAS compares the average tendency of the modeled data and observed data (Equation (19)) [63].
where n denotes the number of time steps, and represent the observed/the results of the Eckhardt filter method and modeled results of the SWY, respectively, on the ith time step. and are the mean of observed data/the results of the Eckhardt filter method and modeled results of the SWY ( and ) across the n evaluation time steps.
The steps for model calibration, validation, and evaluation are shown in Figure 2 and are as follows:
- Since α, β, and γ only affect baseflow and not quickflow, we compared the monthly quickflow values of SWY1, SWY2, SWY3, and SWY4 with those obtained from the Eckhardt filter method to select the best SWY for modeling quickflow at the preliminary stage (we calculated daily quickflow based on the Eckhardt filter method, then summed them into monthly).
- We employed the method of Hamel et al. to analyze the sensitivity of parameters in YAR, YER, and LAR [27]. We started by using the default value for α (1/12) and γ (1) and changed β from 0 to 1 with the increments of 0.2 to analyze parameter sensitivity. Similarly, we set 1 for β and γ and adjusted α equal to 1/12, 1/6, and 1/3. We also repeated the previous analyses for γ by varying γ from 0 to 1 in increments of 0.2.
- Using the various parameter combinations obtained from the best SWY for modeling quickflow, as determined in the first step, we compared the annual water yield values. First, we summed the 12 quickflow outputs of SWY to obtain the annual quickflow, and then added the annual quickflow and baseflow to calculate the annual water yield. We subsequently compared this to the observed streamflow data to determine the optimal parameter combination.
- Using the optimal parameter combination obtained from the third step, we applied it to SWY1, SWY2, SWY3, and SWY4. We then compared the annual baseflow values obtained from these models with those from the Eckhardt filter method. To accomplish this, we initially computed the daily baseflow using the observed daily runoff data with the Eckhardt filter method. Subsequently, we summed the daily baseflow of the Eckhardt filter method to obtain the annual baseflow. This allowed us to investigate whether the best SWY for modeling baseflow was also the optimal choice for simulating quickflow.
3. Case Study
In the model setup, SWY1, SWY2, SWY3, and SWY4 were run at 1 × 1 km2 resolutions in the study area from 1981 to 2020. The output data generated by the models consisted of annual baseflow and monthly quickflow.
3.1. Study Area
The TRHR (31°39′−36°12′ N, 89°45′−102°23′ E) (the headwater region of the Yangtze River, the Yellow River, and the Lantsang-Mekong River), covers an area of 3.66 × 10⁵ km2 on the QTP, which is the largest National Natural Reserve in China (Figure 3a). It includes the YAR, YER, and LAR (Figure 3a). The study area is located within a region characterized by frozen ground, including areas of seasonal frozen ground and permafrost (Figure 3c). The mean maximum frozen depth of seasonal frozen ground in the TRHR from 1980 to 2014 was 132 cm (ranging from 48 cm to 213 cm), and the average of the active layer thickness in the permafrost zone from 2000 to 2015 was 215 cm (ranging from 134 cm to 410 cm) [64,65]. It should be clarified that the effect of permafrost change on water yield was not considered here. The area is characterized by a complex mountainous terrain with continuous and steep slopes, and an elevation range spanning from 2062 m to 6788 m, with an average elevation of 4400 m. The region experiences a typical continental plateau climate, characterized by intense radiation and cold, dry weather. Significantly, there is a discernible gradient of decreasing heat and water from the southeastern to the northwestern regions [39,66]. The annual average temperature in the study area is −3.94 °C, and the annual precipitation recorded between 1981 and 2020 is 463.4 mm. Grasslands account for 72% of the TRHR area, mainly including alpine grassland and alpine steppe [41] (Figure 3b). The study area is home to an abundance of rivers, lakes, and mountain snow cover, which serve as important sources of water for downstream regions (Figure 3c). The study area supplies a significant portion of the water for downstream regions, including 25% of the total water for the Yangtze River, 49% of the total water for the Yellow River, and 15% of the total water for the Lantsang-Mekong River [67]. Given its unique geographical location, abundant natural resources, and critical ecological functions, the study area serves as an important ecological barrier for the surrounding regions of the QTP.
3.2. Datasets
The data used in this study consisted of two main types: model input data (including revised model data) and validation data for the model results.
3.2.1. Meteorological Data
The meteorological data were the monthly average temperature, monthly precipitation, and pan evaporation of E601 during 1981–2020. In addition to the data from China Meteorological Data Service Center (http://data.cma.cn) (accessed on 1 January 2021), meteorological data from the hydrological station were also used. These station data were interpolated by the professional meteorological interpolation software ANUSPLIN version 4.4. Additionally, the monthly reference evapotranspiration (ET0) was estimated by the method of Allen et al. [68].
3.2.2. Hydrological Data
The observed annual streamflow data of the YAR, YER, and LAR during 1981–2012, 1981–2015, and 1981–2010, respectively, were used to validate the annual water yield modeled by the SWY. The observed daily streamflow data of the YAR and YER were used for baseflow separation by the Eckhardt filter method to validate the monthly quickflow and annual baseflow modeled by the SWY. Notably, the daily data of the YAR cover the years 1981–1984, 1986, 2006–2009, and 2013–2014, and the daily data of the YER cover the years 1981–1997 and 2007–2014. Unfortunately, we have not obtained the daily streamflow data of the LAR.
3.2.3. Land Use/Land Cover (LULC) Data
The LULC dataset was downloaded from the Chinese Academy of Environmental Science data center (https://www.resdc.cn/) (accessed on 5 June 2021). It covered the years 1980, 1990, 1995, 2000, 2005, 2010, 2015, and 2020, with a spatial resolution of 1 km. It should be pointed out that according to the classification of this model (i.e., grass, forest, plowland, water, glacier, urban, and unused land), the LULC has not changed much in the past 40 years.
3.2.4. Soil Data
The InVEST User’s Guide provides several soil parameter data and the ones used here are as follows:
- (1)
- Hydrologic Soil Group raster (used as the soil group before revision) and Saturate Hydraulic Conductivity rasters (used to revise the soil group) from FutureWater (https://www.futurewater.eu/2015/07/soil-hydraulic-properties/) (accessed on 4 May 2021).
- (2)
- China meteorological assimilation datasets for the SWAT model-soil temperature version 1.0 (http://data.tpdc.ac.cn/) (accessed on 5 November 2020) [69].
- (3)
3.3. Parameters
The critical temperature threshold of soil freezing (Tf) was set as −8 °C according to observation in northeast Tibetan Plateau [72]. The threshold temperature for differentiating rain and sleet (T1) is 5 °C according to the study of precipitation type estimation and validation in China [54], and the threshold temperature for differentiating snow and sleet (T2) is 2 °C according to research in the YER [55]. Simultaneously, the amount of snow sublimation was estimated according to observation in northeast Tibetan Plateau [73]. Threshold Flow Accumulation (TFA) was adjusted repeatedly by the user until the river in the TFA raster generated by the model was very close to reality, and the TFA was set as 3000. The details of the settings for α, β, and γ parameters can be found in Section 2.2.3.
4. Results
4.1. Sensitivity Analyses
Elevated values of α, β, and γ signify a heightened potential for the absorption of recharge from upslope pixels by evapotranspiration in downslope pixels, which may consequently result in a decline in baseflow. Our sensitivity analysis of α and β was consistent with the findings of Hamel et al., although they did not examine the sensitivity of baseflow to γ [27]. The results of our study showed that in both regions, baseflow decreased as α, β, and γ increased (Figure 4). In the TRHR region, we found that baseflow was most sensitive to changes in γ and least sensitive to changes in α. Varying α between 1/12 and 1/3 resulted in a reduction of baseflow in the YAR, YER, and LAR regions by 13.12% (7.32 mm), 6.90% (7.92 mm), and 2.25% (3.92 mm), respectively (Figure 4a). Varying β between 0 and one led to a reduction in baseflow in the YAR, YER, and LAR regions by 49.51% (54.74 mm), 36.93% (67.19 mm), and 35.67% (96.65 mm), respectively (Figure 4b). Varying γ between 0 and one resulted in a reduction in baseflow in the YAR, YER, and LAR regions by 84.80% (311.49 mm), 79.12% (434.85 mm), and 77.53% (601.54 mm), respectively (Figure 4b). However, when γ was lower than 0.8, the baseflow values for all three regions were higher than the observed water yield values.
4.2. Model Calibration, Validation, and Evaluation
The value of β in the best parameter combinations was different in the three regions. For the YAR, the best parameter combination for modeling water yield was α = 1/12, β = 0.2, γ = 1, of which the R2, NSE, and PBIAS were 0.47, 0.41, and −0.14, respectively. The best parameter combination for the YER and LAR was α = 1/12, β = 0.4, γ = 1, among which the R2, NSE, and PBIAS of the YER were 0.76, 0.72, and 0.50, and 0.62, 0.32, and 1.02 in the LAR, respectively (Table 2). A value of 1/12 for α means there will be 1/12 of upslope annual available for local recharge each month. When γ is equal to one, nearly all the local recharge in a pixel is accessible to down-gradient pixels, which could occur in a steep watershed that rapidly releases water. A value of 0.2/0.4 for β indicates that 20%/40% of the up-gradient subsidy is available for down-gradient evapotranspiration.
Table 3 shows that the SWY4 model had the best performance in modeling quickflow, baseflow, and water yield in all three regions, while SWY2 and SWY3 performed better than SWY1 in modeling quickflow and baseflow. SWY1 and SWY2 had the same performance in modeling water yield, as did SWY3 and SWY4. The R2 values between the modeled results of SWY4 and the observed data/the results of the Eckhardt filter passed the significance test (p < 0.01). For SWY4 in the YAR, the R2, NSE, and PBIAS values for quickflow were 0.77, 0.76, and 1.25, respectively. The corresponding values for baseflow were 0.61, 0.55, and 3.73, and for water yield were 0.47, 0.41, and 0.54. For SWY4 in the YER, the R2, NSE, and PBIAS values for quickflow were 0.72, 0.65, and 1.34, respectively. The corresponding values for baseflow were 0.82, 0.80, and −1.00, and for water yield were 0.76, 0.72, and 1.04. For the SWY4 model in the LAR, the R2, NSE, and PBIAS values for water yield were 0.62, 0.32, and 1.02, respectively. Figure 5 illustrates the changing trends of the modeled results using SWY4 and the observed streamflow data/the results of the Eckhardt filter in the three regions.
The performance of the SWY scenarios improved as we moved from SWY1 to SWY4. Specifically, in the YAR and YER, the R2 values for quickflow increased from 0.56 to 0.77 and from 0.53 to 0.72, respectively. The NSE values also improved from 0.54 to 0.76 and from 0.47 to 0.65, respectively, and the PBIAS values decreased from 17.62 to 1.25 and from 23.45 to 1.34, respectively. In the same regions, the R2 values for baseflow increased from 0.52 to 0.61 and from 0.62 to 0.82, respectively. The NSE values increased from −0.02 to 0.55 and from 0.18 to 0.80, respectively, and the PBIAS values changed from −14.08 to 3.73 and from −17.39 to −1.00, respectively. Finally, for water yield in the YAR, YER, and LAR, the R2 values increased from 0.41 to 0.47, from 0.70 to 0.76, and from 0.57 to 0.62, respectively. The NSE values increased from −0.02 to 0.41, from 0.63 to 0.72, and from 0.18 to 0.80, respectively, and the PBIAS values changed from −10.94 to 0.54, from 0.53 to 0.72, and from −8.30 to 1.02, respectively.
4.3. Effects of Frozen Ground and Snow Cover
Based on the Hydrologic Soil Groups of FutureWater, the soil group in the TRHR region was mainly composed of group C. When considering the effect of frozen ground, 47% of the area originally classified as group C was reclassified as group D (Figure 6a,b). The criteria for assigning hydrologic soil groups indicate that the SHC decreases from group A to group D, and low SHC can reduce infiltration. Frozen ground can act as a low permeable layer, which can limit the movement of water through the soil layers.
Sublimation and melting of snow cover have opposite effects on liquid water. Sublimation reduces liquid water, while melting of snow cover increases it. After model revision, the amount of liquid water reaching the surface each month decreased (Figure 6c). Generally, the decrease in liquid water showed a downward trend from January to July and increased from September to December, except for August, when liquid water increased. Changes in the annual distribution of liquid water resulting from sublimation and melting of snow cover have a significant effect on the amount and spatiotemporal distribution of water yield.
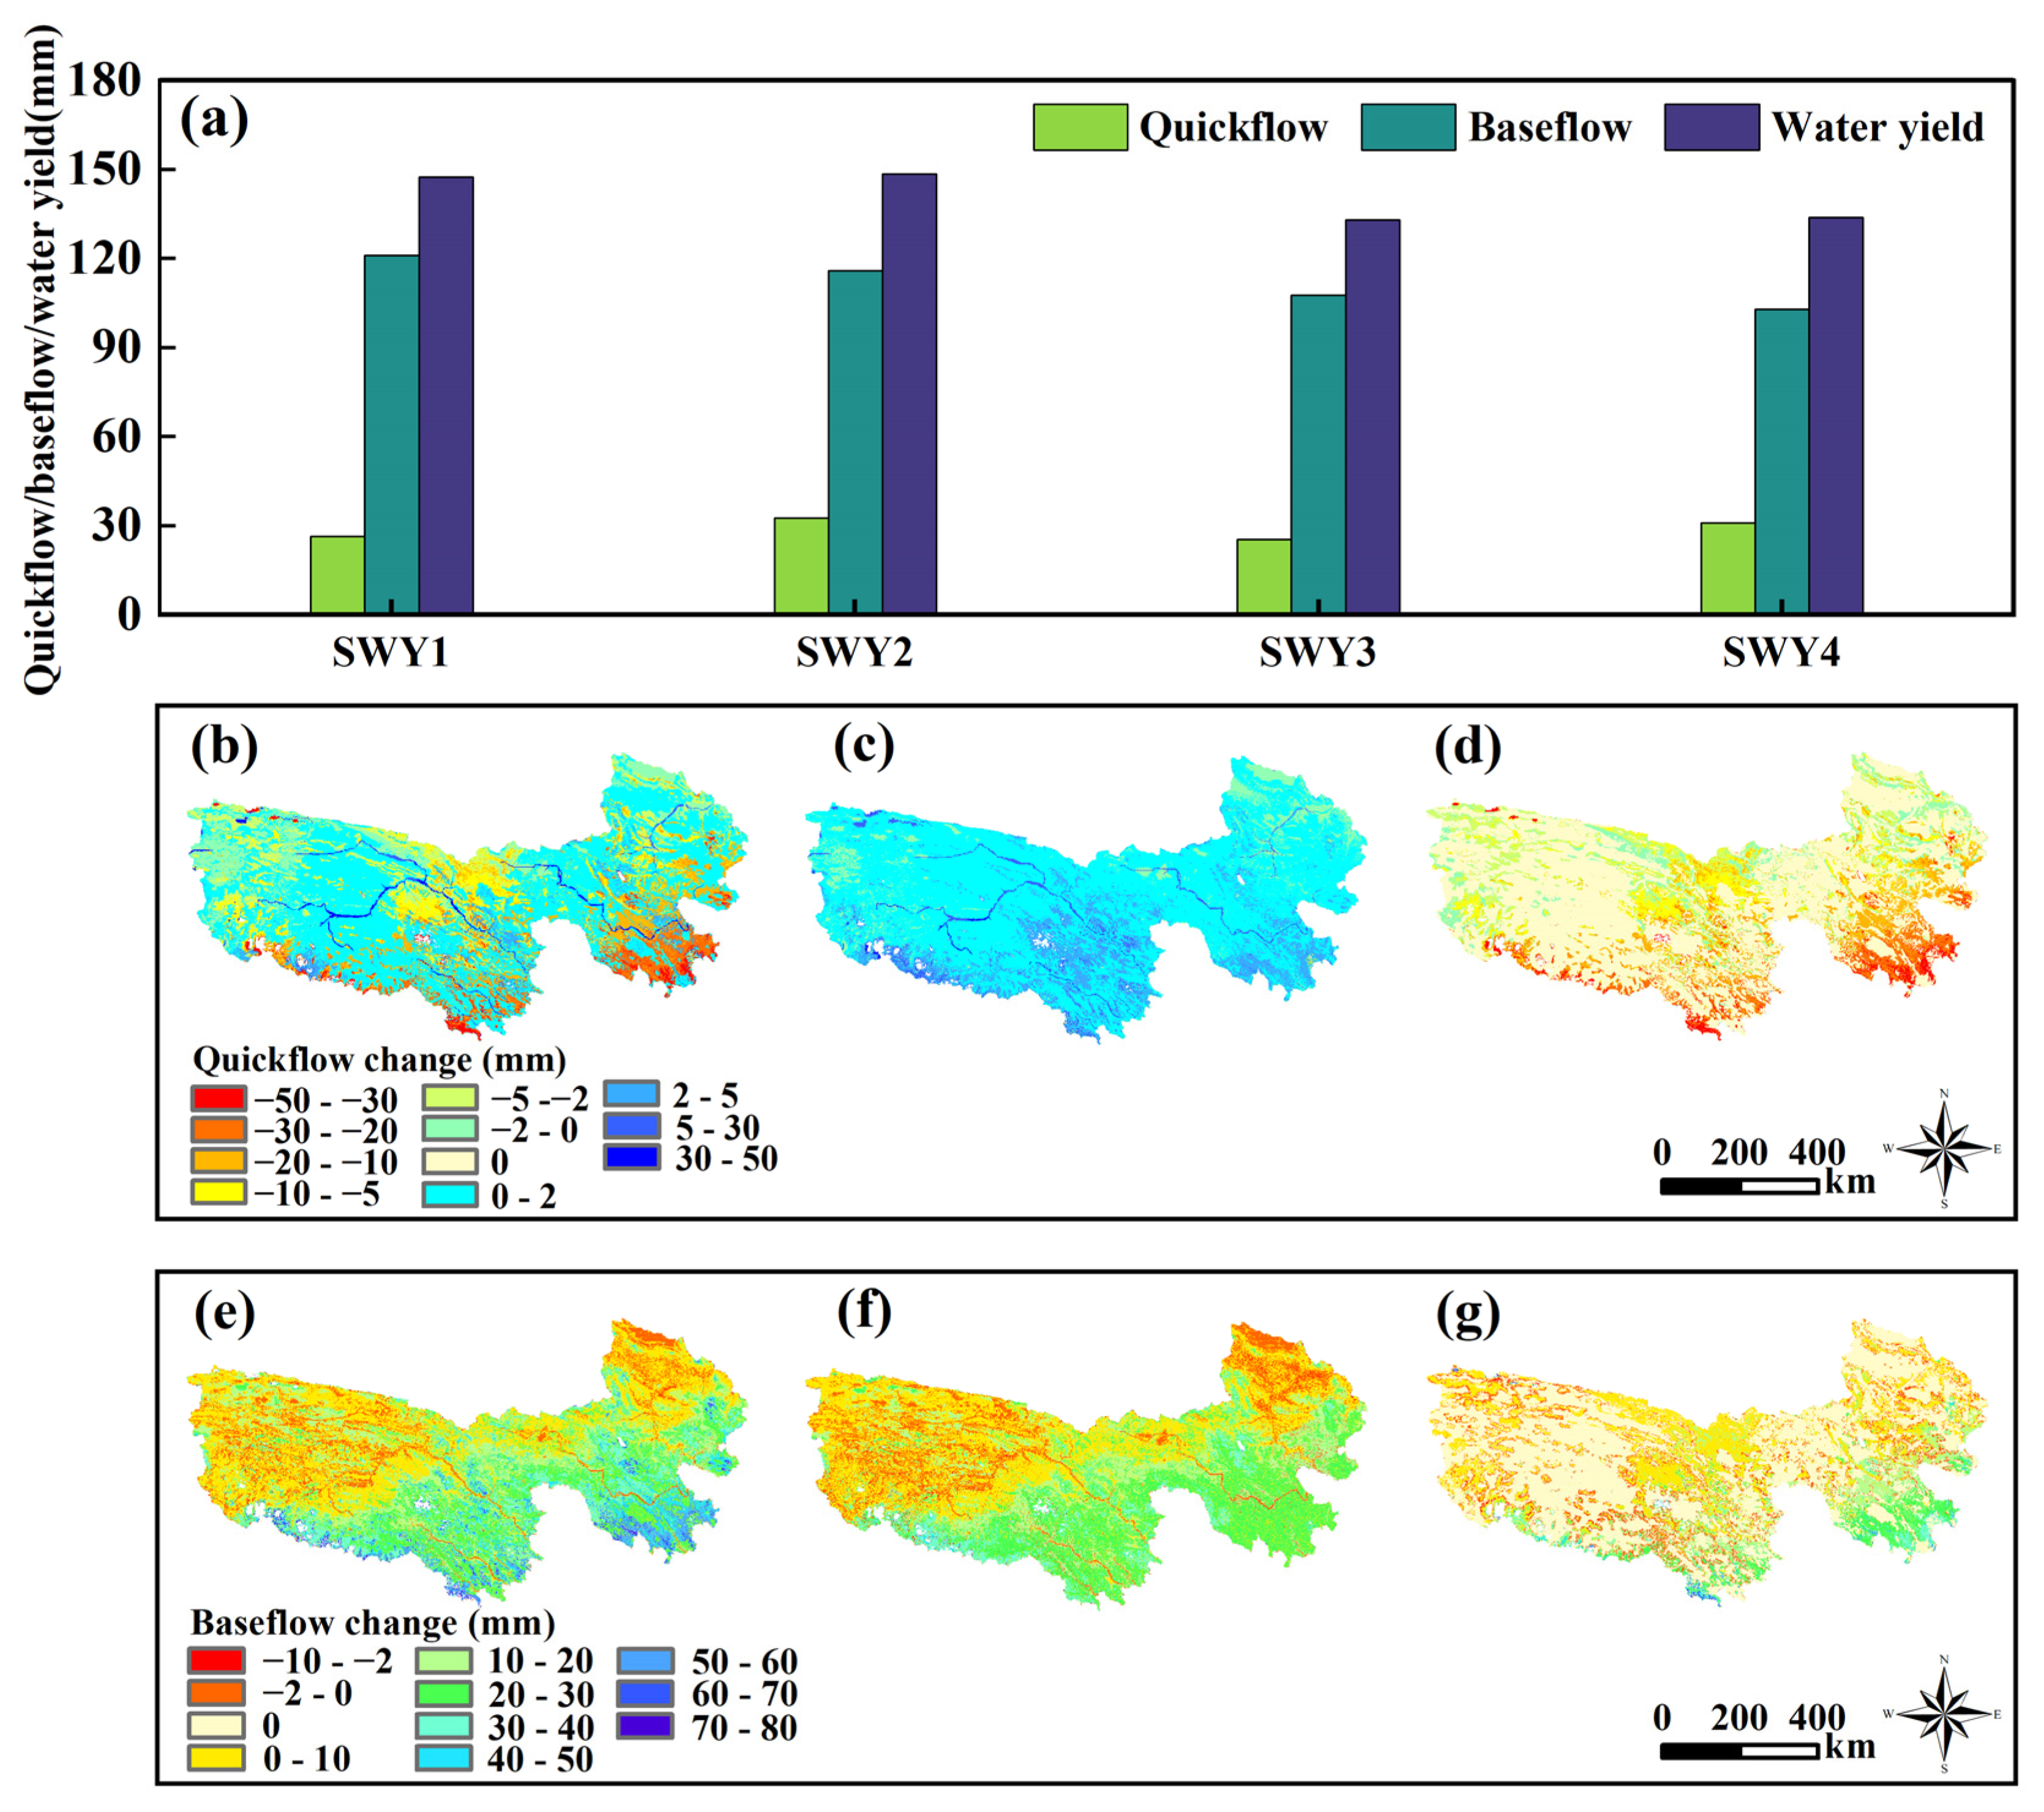
From 1981 to 2020, the annual average quickflow of SWY1, SWY2, SWY3, and SWY4 was 26.04 mm (95.31 × 10⁸ m3/yr), 25.04 mm (91.65 × 10⁸ m3/yr), 32.64 mm (119.46 × 10⁸ m3/yr), and 31.04 mm (113.61 × 10⁸ m3/yr), respectively. The annual average baseflow of SWY1, SWY2, SWY3, and SWY4 was 121.8 mm (445.79 × 10⁸ m3/yr), 108.8 mm (398.21 × 10⁸ m3/yr), 115.8 mm (423.83 × 10⁸ m3/yr), and 121.8 mm (445.79 × 10⁸ m3/yr), respectively. The annual average water yield of SWY1, SWY2, SWY3, and SWY4 was 133.8 mm (489.71 × 10⁸ m3/yr), 133.8 mm, 147.8 mm (540.95 × 10⁸ m3/yr), and 147.8 mm, respectively (Figure 7a). The differences between the results of SWY1, SWY2, SWY3, and SWY4 show that if the effect of frozen ground were not considered, the annual average quickflow would be underestimated by 6 mm (21.96 × 10⁸ m3/yr), baseflow would be overestimated by 6 mm (21.96 × 10⁸ m3/yr), and water yield would be unaffected. If the effect of snow cover were not considered, the annual average quickflow, baseflow, and water yield would be overestimated by 1 mm (3.66 × 10⁸ m3/yr), 13 mm (47.58 × 10⁸ m3/yr), and 14 mm (51.24 × 10⁸ m3/yr), respectively. If the effects of the frozen ground and snow cover were not considered, the three annual average flows would be underestimated by 5 mm (18.30 × 10⁸ m3/yr), overestimated by 18 mm (65.88 × 10⁸ m3/yr), and overestimated by 13 mm (47.58 × 10⁸ m3/yr).
Figure 7 shows the spatial differences between SWY1, SWY2, and SWY3, compared to SWY4. In terms of quickflow, the underestimation of SWY1 was mainly observed in areas where the soil type changed from type C to type D, with a range of 5–50 mm. The rest of the area was overestimated, with a range of 0–2 mm (Figure 7b). SWY2 was generally overestimated, with a relatively small range of 0–2 mm (Figure 7c). In the areas where the soil type remained unchanged after the model revision, the quickflow of SWY3 was not affected. In the rest of the area, it was underestimated with a range of 2–10 mm in the north and 10–50 mm in the south (Figure 7d). In terms of baseflow, SWY1 was generally overestimated, with the range increasing from the northwest (0–10 mm) to the southeast (70–80 mm). The underestimated area was mainly located in a small area of the northwest of the TRHR (Figure 7e). The difference between SWY2 and SWY4 was similar to that of SWY1 and SWY4, with the overestimation range increasing from the northwest (0–10 mm) to the southeast (30–40 mm), but with a slightly smaller range (Figure 7f). In the areas where the soil type remained unchanged after the model revision, the baseflow of SWY3 was not affected. However, in other areas, it was overestimated with the same range as the underestimated SWY3 (Figure 7g).
Based on the results presented above, it can be concluded that the effect of sublimation of snow in the study area was stronger than melting, and it mainly affected baseflow. Frozen ground acted as an aquitard, weakening the effect of infiltration. However, it did not affect the amount of total water yield.
5. Discussion
5.1. Incorporating Frozen Ground and Snow Cover Improved Model Performance
The revised SWY can be considered a useful tool for water resource management and decision-making in cold alpine regions. The effects of frozen ground and snow cover on water yield should be considered when using the model in these regions for accurate results. The improved model performance also highlights the importance of continuously revising and updating models to account for changing environmental conditions and to improve their accuracy and reliability. Further evaluation of the revised SWY showed that incorporating both the effects of frozen ground and snow cover led to optimal model performance. The improvements in model performance were lower when only one of these cryosphere elements was considered, but still higher than when neither were considered. Specifically, the performance improvements of SWY2 were higher than that of SWY3 for quickflow, while the opposite was observed for baseflow. The incorporation of snow cover improved the changing trend of quickflow, while the monthly average amount remained almost unchanged. However, both the changing trend and annual average amount of baseflow were improved after considering the effect of snow cover. The performance of SWY1 was similar to that of SWY2 in terms of water yield, while the performance of SWY3 was similar to that of SWY4. These results indicate that accounting for the effects of frozen ground and snow cover is crucial for accurately modeling water yield in cold alpine regions.
The results of the study can be explained from the perspective of how snow cover and frozen ground affect water yield, including quickflow and baseflow. Snow cover affects water yield by melting and sublimation. The melting of snow cover will increase water yield, while sublimation will cause snow loss, resulting in a decrease in water yield [74,75]. The effect of sublimation is greater than melting in the study area, resulting in a decrease in water yield. Quickflow is less affected by snow cover as it occurs during or shortly after rain events. The amount of annual sublimation almost offsets the amount of melting during the short period of quickflow generation. On the other hand, frozen ground acts as an aquitard, weakening water infiltration and affecting the proportion distribution of quickflow and baseflow. This results in a larger proportion of quickflow than that of the non-frozen ground underlying the surface, but it does not affect the total water yield. It is important to note that the phase of snow cover will not change immediately when the climate warms, indicating that appropriate temperature conditions must be met for changes to occur. However, the effects of snow cover and frozen ground on water yield should be taken seriously, especially in the long term and in the context of climate warming. The study found that the baseflow and water yield of the study area were overestimated by 13 mm (47.58 × 10⁸ m3/yr) and 14 mm (51.24 × 10⁸ m3/yr), respectively, without considering the effect of snow cover on them. Similarly, without considering the effect of frozen ground on water yield, there would be about 6 mm of quickflow misestimated as baseflow every year. The overestimation will be more obvious with the increase in precipitation (Figure 7e,f). Therefore, the effects of the two cryosphere elements on water yield should be considered for accurate results in water resource management and decision-making.
Scordo et al. showed that coupling the SNOW-17 model with SWY significantly improved the model performance by considering the effect of snow on water yield [10]. The principle of the SNOW-17 model is similar to the degree-day model used in this study, which calculates sublimation and melting based on temperature data to determine the proportion of snow in precipitation. However, the SNOW-17 model does not consider the effect of frozen ground and is more suitable for regions where snow has a greater impact. The advantage of this research is that it covers 749 watersheds in five climate zones of North America, providing a broad scope for study. Consequently, we plan to investigate the applicability of the revised SWY model in cold regions of China. This is also supported by the results of Hamel et al., in which the snowmelt data was derived from the SWAT, making it difficult for many users to obtain for their area of interest [27]. Our revised model can quantify the impact of snow cover on water yield using conventional temperature and precipitation data, which is more accessible for users. Hamel et al.’s research is more inclined to simulate and evaluate baseflow, which characterizes water supply in dry season and is particularly important in arid regions. In the next step, we can focus on the impact of the change in climate, cryosphere, and land use on regional baseflow and water yield to comprehensively evaluate the HESs in cold alpine regions.
5.2. Limitations of the Modeling Approach
Despite the improvement in model performance resulting from the incorporation of the effects of frozen ground and snow cover in the SWY when applied in the TRHR, a typical cold alpine region, there remain some limitations that require future improvement. Firstly, although spatially explicit models are generally appropriate for mapping ecosystem services, they have certain limitations in their application, as noted by [26]. Despite the SWY being based on a physically based approach, the equations employed are overly simplified, leading to a significant increase in the uncertainty of absolute values produced, particularly when using α, β, and γ to control flow routing. These parameters are not readily available for any given watershed, rendering them difficult to set accurately, thus further compounding uncertainties in the model outputs [3]. This study employed sensitivity analysis to set the values of α, β, and γ, which required constant parameter adjustments to arrive at the optimal combination (α = 1/12, β = 0.2 for the YAR, and 0.4 for the YEA and LAR, γ = 1), resulting in a significant increase in our workload. A value of 1/12 for α indicates that each month of the year has a similar fraction of upslope annual available recharge, which is an ideal situation. Furthermore, variations in the optimal β across different regions within the TRHR suggest that it is necessary to set the optimal β for each sub-region when the study area is large. The value of γ in our optimal parameter combination is “1”, which implies that all pixel recharge is available to downslope pixels, but there is no empirically based evidence to support its rationality. It is strongly recommended that the model developer provide a reference guide for setting the values of these three parameters, such as instructions for determining the optimal values based on terrain, soil properties, or other relevant factors using appropriate functions. Secondly, the lack of appropriate data poses a challenge to the validation of the tool. Although the new version of the SWY demonstrated an overall satisfactory performance following comprehensive evaluation, the validation of the model using observed data was limited to total water yield, without consideration of baseflow or quickflow. Furthermore, while the meteorological input of SWY was monthly, the output of baseflow was on an annual scale, which fails to reflect the variation characteristics of water yield during the year, including flood and dry periods. It is recommended that baseflow be calculated on a monthly scale instead, which is crucial for practical decision-making implications. Although some traditional hydrological models, such as SWAT and VIC, can overcome some of these limitations, they are difficult to operate and require more specialized hydrological knowledge and calculation ability, which increases the difficulty of using the models [3,4,11]. A more optimal approach could be for the developers of ecosystem service models to engage in deep collaboration with hydrologists to create HES models that are both simple to operate and consider critical hydrological physical processes and characteristics.
In addition to the inherent limitations of the model itself, there are also shortcomings in the improvement aspects of the SWY model. Although we have considered the effect of seasonal frozen ground and the active layer on water yield, we have overlooked the effect of permafrost and its changes on water yield. The method of revising soil saturated hydraulic conductivity based on soil temperature only reflects the effect of the low permeability of frozen ground on water yield. However, apart from being a low permeable layer, the storage capacity of the active layer also plays a significant role in water yield. Degradation of the permafrost leads to an increase in the thickness of the active layer, consequently increasing its storage capacity and resulting in a decrease in water yield [76]. Therefore, in future work, it is necessary to incorporate the effects of permafrost change on water yield into the SWY model to enhance its physical processes and improve its performance. One possible direction is to utilize satellite data, such as the Grace gravity satellite, to address the limitations.
6. Conclusions
To illustrate the application of the SWY in the TRHR, a new version was developed to account for the effects of frozen ground and snow cover on water yield, with the aim of supporting decision-making in cold alpine regions. In the first step, we set up four scenarios for the SWY, including a scenario that did not consider the effects of frozen ground and snow cover, a scenario that only considered the effect of frozen ground, a scenario that only considered the effect of snow cover, and a scenario that considered the effects of both frozen ground and snow cover. Subsequently, we evaluated and validated the four scenarios by comparing the results with observed streamflow data and those obtained using the Eckhardt filter method. Further analysis was conducted to elucidate how snow cover and frozen ground affect water yield. The results showed that:
- (1)
- The performance of the SWY was best in the scenario that accounted for the effects of both frozen ground and snow cover, while the scenario that did not consider these effects had the worst performance. Furthermore, the model performance improved when considering the effects of frozen ground or snow cover on water yield.
- (2)
- Snow cover affects water yield through processes of melting and sublimation, while frozen ground acts as an aquitard, reducing infiltration and thus affecting the distribution of both spatial and temporal quickflow and baseflow.
- (3)
- Without considering the effect of snow cover on water yield, the annual average baseflow and water yield of the TRHR would be overestimated by 13 mm (47.58 × 10⁸ m3/yr) and 14 mm (51.24 × 10⁸ m3/yr), respectively. Similarly, if the effect of frozen ground on water yield were not considered, there would be an annual overestimation of about 6 mm of quickflow as baseflow.
A critical future research avenue in the field of water resource management is to evaluate and predict the impact of climate change on the spatiotemporal distribution of water yield in cold alpine regions. This research will be useful for decision-makers who are involved in the management of water-related ecosystem services programs in these regions. By understanding how climate change will affect water resources, policymakers can develop appropriate strategies to adapt to the changing conditions and ensure sustainable use of water resources in the future.
Author Contributions
Conceptualization, L.Z. and R.C.; methodology, L.Z.; software, G.L.; validation, L.Z.; data curation, Y.Y.; writing—original draft preparation, L.Z.; writing—review and editing, Y.Y. and X.W.; funding acquisition, R.C. All authors have read and agreed to the published version of the manuscript.
Funding
This research was funded by the Joint Research Project of Three-River Headwaters National Park, Chinese Academy of Sciences and the People’s Government of Qinghai Province (LHZX-2020-11), the National Natural Sciences Foundation of China (42171145), the Key Talent Program of Gansu Province, and the Gansu Provincial Science and Technology Program (22ZD6FA005).
Institutional Review Board Statement
Not applicable.
Informed Consent Statement
Not applicable.
Data Availability Statement
Not applicable.
Conflicts of Interest
The authors declare that they have no known competing financial interests or personal relationships that could have appeared to influence the work reported in this paper.
References
- Brauman, K.A.; Daily, G.C.; Duarte, T.K.; Mooney, H.A. The Nature and Value of Ecosystem Services: An Overview Highlighting Hydrologic Services. Annu. Rev. Environ. Resour. 2007, 32, 67–98. [Google Scholar] [CrossRef]
- Brauman, K.A. Hydrologic ecosystem services: Linking ecohydrologic processes to human well-being in water research and watershed management. WIREs Water 2015, 2, 345–358. [Google Scholar] [CrossRef]
- Dennedy-Frank, P.J.; Muenich, R.L.; Chaubey, I.; Ziv, G. Comparing two tools for ecosystem service assessments regarding water resources decisions. J. Environ. Manag. 2016, 177, 331–340. [Google Scholar] [CrossRef] [PubMed] [Green Version]
- Vigerstol, K.L.; Aukema, J.E. A comparison of tools for modeling freshwater ecosystem services. J. Environ. Manag. 2011, 92, 2403–2409. [Google Scholar] [CrossRef]
- Fan, M.; Shibata, H. Spatial and Temporal Analysis of Hydrological Provision Ecosystem Services for Watershed Conservation Planning of Water Resources. Water Resour. Manag. 2014, 28, 3619–3636. [Google Scholar] [CrossRef]
- Benra, F.; De Frutos, A.; Gaglio, M.; Álvarez-Garretón, C.; Felipe-Lucia, M.; Bonn, A. Mapping water ecosystem services: Evaluating InVEST model predictions in data scarce regions. Environ. Model. Softw. 2021, 138, 104982. [Google Scholar] [CrossRef]
- Wang, Y.; Wang, H.; Liu, G.; Zhang, J.; Fang, Z. Factors driving water yield ecosystem services in the Yellow River Economic Belt, China: Spatial heterogeneity and spatial spillover perspectives. J. Environ. Manag. 2022, 317, 115477. [Google Scholar] [CrossRef]
- Ward, R.C.; Robinson, M. Principles of Hydrology; McGraw Hill Book Company: London, UK, 1990; pp. 139–183. [Google Scholar]
- Apurv, T.; Cai, X. Impact of Droughts on Water Supply in U.S. Watersheds: The Role of Renewable Surface and Groundwater Resources. Earth’s Futur. 2020, 8, e2020EF001648. [Google Scholar] [CrossRef]
- Scordo, F.; Lavender, T.M.; Seitz, C.; Perillo, V.L.; Rusak, J.A.; Piccolo, M.C.; Perillo, G.M.E. Modeling Water Yield: Assessing the Role of Site and Region-Specific Attributes in Determining Model Performance of the InVEST Seasonal Water Yield Model. Water 2018, 10, 1496. [Google Scholar] [CrossRef] [Green Version]
- Cong, W.; Sun, X.; Guo, H.; Shan, R. Comparison of the SWAT and InVEST models to determine hydrological ecosystem service spatial patterns, priorities and trade-offs in a complex basin. Ecol. Indic. 2020, 112, 106089. [Google Scholar] [CrossRef]
- Francesconi, W.; Srinivasan, R.; Pérez-Miñana, E.; Willcock, S.P.; Quintero, M. Using the Soil and Water Assessment Tool (SWAT) to model ecosystem services: A systematic review. J. Hydrol. 2016, 535, 625–636. [Google Scholar] [CrossRef]
- Aznarez, C.; Jimeno-Sáez, P.; López-Ballesteros, A.; Pacheco, J.P.; Senent-Aparicio, J. Analysing the Impact of Climate Change on Hydrological Ecosystem Services in Laguna del Sauce (Uruguay) Using the SWAT Model and Remote Sensing Data. Remote Sens. 2021, 13, 2014. [Google Scholar] [CrossRef]
- Uniyal, B.; Kosatica, E.; Koellner, T. Spatial and temporal variability of climate change impacts on ecosystem services in small agricultural catchments using the Soil and Water Assessment Tool (SWAT). Sci. Total. Environ. 2023, 875, 162520. [Google Scholar] [CrossRef] [PubMed]
- Zhang, C.; Li, J.; Zhou, Z.; Sun, Y. Application of ecosystem service flows model in water security assessment: A case study in Weihe River Basin, China. Ecol. Indic. 2021, 120, 106974. [Google Scholar] [CrossRef]
- Troin, M.; Caya, D. Evaluating the SWAT’s snow hydrology over a Northern Quebec watershed. Hydrol. Process. 2014, 28, 1858–1873. [Google Scholar] [CrossRef]
- Wu, Q.; Song, J.; Sun, H.; Huang, P.; Jing, K.; Xu, W.; Wang, H.; Liang, D. Spatiotemporal variations of water conservation function based on EOF analysis at multi time scales under different ecosystems of Heihe River Basin. J. Environ. Manag. 2023, 325, 116532. [Google Scholar] [CrossRef]
- Agnihotri, J.; Behrangi, A.; Tavakoly, A.; Geheran, M.; Farmani, M.A.; Niu, G. Higher Frozen Soil Permeability Represented in a Hydrological Model Improves Spring Streamflow Prediction from River Basin to Continental Scales. Water Resour. Res. 2023, 59, e2022WR033075. [Google Scholar] [CrossRef]
- Gädeke, A.; Krysanova, V.; Aryal, A.; Chang, J.; Grillakis, M.; Hanasaki, N.; Koutroulis, A.; Pokhrel, Y.; Satoh, Y.; Schaphoff, S.; et al. Performance evaluation of global hydrological models in six large Pan-Arctic watersheds. Clim. Chang. 2020, 163, 1329–1351. [Google Scholar] [CrossRef]
- Sapriza-Azuri, G.; Gamazo, P.; Razavi, S.; Wheater, H.S. On the appropriate definition of soil profile configuration and initial conditions for land surface–hydrology models in cold regions. Hydrol. Earth Syst. Sci. 2018, 22, 3295–3309. [Google Scholar] [CrossRef] [Green Version]
- Walvoord, M.A.; Kurylyk, B.L. Hydrologic Impacts of Thawing Permafrost—A Review. Vadose Zone J. 2016, 15, 1–20. [Google Scholar] [CrossRef] [Green Version]
- Hiyama, T.; Park, H.; Kobayashi, K.; Lebedeva, L.; Gustafsson, D. Contribution of summer net precipitation to winter river discharge in permafrost zone of the Lena River basin. J. Hydrol. 2023, 616, 128797. [Google Scholar] [CrossRef]
- Park, H.; Dibike, Y.; Su, F.; Shi, J.X. Cold Region Hydrologic Models and Applications. In Arctic Hydrology, Permafrost and Ecosystems; Yang, D., Kane, D.L., Eds.; Springer: Cham, Switzerland, 2021. [Google Scholar] [CrossRef]
- Li, S.; Zhang, Y.; Wang, Z.; Li, L. Mapping human influence intensity in the Tibetan Plateau for conservation of ecological service functions. Ecosyst. Serv. 2018, 30, 276–286. [Google Scholar] [CrossRef]
- Liu, J.; Qin, K.; Xie, G.; Xiao, Y.; Huang, M.; Gan, S. Is the ‘water tower’ reassuring? Viewing water security of Qinghai-Tibet Plateau from the perspective of ecosystem services ‘supply-flow-demand’. Environ. Res. Lett. 2022, 17, 094043. [Google Scholar] [CrossRef]
- Lü, D.; Lü, Y.; Gao, G.; Liu, S.; Wu, B.; Fu, B. Existent nature reserves not optimal for water service provision and conservation on the Qinghai-Tibet Plateau of China. Glob. Ecol. Conserv. 2021, 32, e01945. [Google Scholar] [CrossRef]
- Hamel, P.; Valencia, J.; Schmitt, R.; Shrestha, M.; Piman, T.; Sharp, R.P.; Francesconi, W.; Guswa, A.J. Modeling seasonal water yield for landscape management: Applications in Peru and Myanmar. J. Environ. Manag. 2020, 270, 110792. [Google Scholar] [CrossRef]
- Qin, H.; Chen, Y. Spatial non-stationarity of water conservation services and landscape patterns in Erhai Lake Basin, China. Ecol. Indic. 2023, 146, 109894. [Google Scholar] [CrossRef]
- Posner, S.; Verutes, G.; Koh, I.; Denu, D.; Ricketts, T. Global use of ecosystem service models. Ecosyst. Serv. 2016, 17, 131–141. [Google Scholar] [CrossRef]
- Dai, E.; Zhu, J.; Wang, X.; Xi, W. Multiple ecosystem services of monoculture and mixed plantations: A case study of the Huitong experimental forest of Southern China. Land Use Policy 2018, 79, 717–724. [Google Scholar] [CrossRef]
- Bai, Y.; Wong, C.P.; Jiang, B.; Hughes, A.C.; Wang, M.; Wang, Q. Developing China’s Ecological Redline Policy using ecosystem services assessments for land use planning. Nat. Commun. 2018, 9, 3034. [Google Scholar] [CrossRef] [Green Version]
- Sun, S.; Shi, Q. Global Spatio-Temporal Assessment of Changes in Multiple Ecosystem Services Under Four IPCC SRES Land-use Scenarios. Earth’s Futur. 2020, 8, e2020EF001668. [Google Scholar] [CrossRef]
- Measho, S.; Chen, B.; Pellikka, P.; Trisurat, Y.; Guo, L.; Sun, S.; Zhang, H. Land Use/Land Cover Changes and Associated Impacts on Water Yield Availability and Variations in the Mereb-Gash River Basin in the Horn of Africa. J. Geophys. Res. Biogeosci. 2020, 125, e2020JG005632. [Google Scholar] [CrossRef]
- Gao, J.; Jiang, Y.; Wang, H.; Zuo, L. Identification of Dominant Factors Affecting Soil Erosion and Water Yield within Ecological Red Line Areas. Remote Sens. 2020, 12, 399. [Google Scholar] [CrossRef] [Green Version]
- Daneshi, A.; Brouwer, R.; Najafinejad, A.; Panahi, M.; Zarandian, A.; Maghsood, F.F. Modelling the impacts of climate and land use change on water security in a semi-arid forested watershed using InVEST. J. Hydrol. 2021, 593, 125621. [Google Scholar] [CrossRef]
- Sharp, R.; Douglass, J.; Wolny, S.; Arkema, K.; Bernhardt, J.; Bierbower, W.; Chaumont, N.; Denu, D.; Fisher, D.; Glowinski, K.; et al. InVEST 3.9.0. User’s Guide; The Natural Capital Project, Stanford University: Stanford, CA, USA, 2020. [Google Scholar]
- Gaglio, M.; Aschonitis, V.; Pieretti, L.; Santos, L.; Gissi, E.; Castaldelli, G.; Fano, E. Modelling past, present and future Ecosystem Services supply in a protected floodplain under land use and climate changes. Ecol. Model. 2019, 403, 23–34. [Google Scholar] [CrossRef]
- Immerzeel, W.W.; Lutz, A.F.; Andrade, M.; Bahl, A.; Biemans, H.; Bolch, T.; Hyde, S.; Brumby, S.; Davies, B.J.; Elmore, A.C.; et al. Importance and vulnerability of the world’s water towers. Nature 2020, 577, 364–369. [Google Scholar] [CrossRef] [PubMed]
- Wang, T.; Yang, D.; Yang, Y.; Piao, S.; Li, X.; Cheng, G.; Fu, B. Permafrost thawing puts the frozen carbon at risk over the Tibetan Plateau. Sci. Adv. 2020, 6, eaaz3513. [Google Scholar] [CrossRef]
- Han, Z.; Song, W.; Deng, X.; Xu, X. Grassland ecosystem responses to climate change and human activities within the Three-River Headwaters region of China. Sci. Rep. 2018, 8, 9079. [Google Scholar] [CrossRef] [Green Version]
- Bai, Y.; Guo, C.; Degen, A.A.; Ahmad, A.A.; Wang, W.; Zhang, T.; Li, W.; Ma, L.; Huang, M.; Zeng, H.; et al. Climate warming benefits alpine vegetation growth in Three-River Headwater Region, China. Sci. Total. Environ. 2020, 742, 140574. [Google Scholar] [CrossRef]
- Gao, Z.; Lin, Z.; Niu, F.; Luo, J. Soil water dynamics in the active layers under different land-cover types in the permafrost regions of the Qinghai–Tibet Plateau, China. Geoderma 2020, 364, 114176. [Google Scholar] [CrossRef]
- Thapa, S.; Zhang, F.; Zhang, H.; Zeng, C.; Wang, L.; Xu, C.-Y.; Thapa, A.; Nepal, S. Assessing the snow cover dynamics and its relationship with different hydro-climatic characteristics in Upper Ganges river basin and its sub-basins. Sci. Total. Environ. 2021, 793, 148648. [Google Scholar] [CrossRef]
- Pan, T.; Wu, S.-H.; Dai, E.-F.; Liu, Y.-J. Spatiotemporal variation of water source supply service in Three Rivers Source Area of China based on InVEST model. J. Appl. Ecol. 2013, 24, 183–189. (In Chinese) [Google Scholar]
- Wang, Y.; Ye, A.; Peng, D.; Miao, C.; Di, Z.; Gong, W. Spatiotemporal variations in water conservation function of the Tibetan Plateau under climate change based on InVEST model. J. Hydrol. Reg. Stud. 2022, 41, 101064. [Google Scholar] [CrossRef]
- Xue, J.; Li, Z.; Feng, Q.; Gui, J.; Zhang, B. Spatiotemporal variations of water conservation and its influencing factors in ecological barrier region, Qinghai-Tibet Plateau. J. Hydrol. Reg. Stud. 2022, 42, 101164. [Google Scholar] [CrossRef]
- Qiao, F.; Fu, G.; Xu, X.; An, L.; Lei, K.; Zhao, J.; Hao, C. Assessment of water conservation Function in the Three-River Headwaters Region. Res. Environ. Sci. 2018, 31, 1010–1018. (In Chinese) [Google Scholar]
- Woo, M. Permafrost Hydrology; Springer Science & Business Media: Berlin/Heidelberg, Germany, 2012; pp. 16–17. [Google Scholar]
- Luo, D.; Jin, H.; Bense, V.F.; Jin, X.; Li, X. Hydrothermal processes of near-surface warm permafrost in response to strong precipitation events in the Headwater Area of the Yellow River, Tibetan Plateau. Geoderma 2020, 376, 114531. [Google Scholar] [CrossRef]
- Burt, T.P.; Williams, P.J. Hydraulic conductivity in frozen soils. Earth Surf. Process. Landforms 1976, 1, 349–360. [Google Scholar] [CrossRef]
- Walvoord, M.A.; Voss, C.I.; Wellman, T.P. Influence of permafrost distribution on groundwater flow in the context of climate-driven permafrost thaw: Example from Yukon Flats Basin, Alaska, United States. Water Resour. Res. 2012, 48, 1–17. [Google Scholar] [CrossRef]
- Ming, F.; Chen, L.; Li, D.; Wei, X. Estimation of hydraulic conductivity of saturated frozen soil from the soil freezing characteristic curve. Sci. Total. Environ. 2020, 698, 134132. [Google Scholar] [CrossRef] [PubMed]
- NRCS-USDA. Chapter 7: Hydrologic Soil Groups. In National Engineering Handbook; USDA: Washington, DC, USA, 2009. [Google Scholar]
- Chen, R.-S.; Liu, J.-F.; Song, Y.-X. Precipitation type estimation and validation in China. J. Mt. Sci. 2014, 11, 917–925. [Google Scholar] [CrossRef]
- Shiyin, L.; Yong, Z.; Yingsong, Z.; Yongjian, D. Estimation of glacier runoff and future trends in the Yangtze River source region, China. J. Glaciol. 2009, 55, 353–362. [Google Scholar] [CrossRef] [Green Version]
- Chen, R.; Wang, G.; Yang, Y.; Liu, J.; Han, C.; Song, Y.; Liu, Z.; Kang, E. Effects of Cryospheric Change on Alpine Hydrology: Combining a Model with Observations in the Upper Reaches of the Hei River, China. J. Geophys. Res. Atmos. 2018, 123, 3414–3442. [Google Scholar] [CrossRef]
- Hancock, S.; Baxter, R.; Evans, J.; Huntley, B. Evaluating global snow water equivalent products for testing land surface models. Remote Sens. Environ. 2013, 128, 107–117. [Google Scholar] [CrossRef] [Green Version]
- Winstral, A.; Marks, D. Simulating wind fields and snow redistribution using terrain-based parameters to model snow accumulation and melt over a semi-arid mountain catchment. Hydrol. Process. 2002, 16, 3585–3603. [Google Scholar] [CrossRef]
- Eckhardt, K. How to construct recursive digital filters for baseflow separation. Hydrol. Process. 2005, 19, 507–515. [Google Scholar] [CrossRef]
- Eckhardt, K. A comparison of baseflow indices, which were calculated with seven different baseflow separation methods. J. Hydrol. 2008, 352, 168–173. [Google Scholar] [CrossRef]
- Ahiablame, L.; Chaubey, I.; Engel, B.; Cherkauer, K.; Merwade, V. Estimation of annual baseflow at ungauged sites in Indiana USA. J. Hydrol. 2013, 476, 13–27. [Google Scholar] [CrossRef]
- Ahiablame, L.; Sheshukov, A.Y.; Rahmani, V.; Moriasi, D. Annual baseflow variations as influenced by climate variability and agricultural land use change in the Missouri River Basin. J. Hydrol. 2017, 551, 188–202. [Google Scholar] [CrossRef] [Green Version]
- Ngo, T.S.; Nguyen, D.B.; Rajendra, P.S. Effect of land use change on runoff and sediment yield in Da River Basin of Hoa Binh province, Northwest Vietnam. J. Mt. Sci. 2015, 12, 1051–1064. [Google Scholar] [CrossRef]
- Luo, S.; Fang, X.; Lyu, S.; Ma, D.; Chang, Y.; Song, M.; Chen, H. Frozen ground temperature trends associated with climate change in the Tibetan Plateau Three River Source Region from 1980 to 2014. Clim. Res. 2016, 67, 241–255. [Google Scholar] [CrossRef] [Green Version]
- Ni, J.; Wu, T.; Zhu, X.; Hu, G.; Zou, D.; Wu, X.; Li, R.; Xie, C.; Qiao, Y.; Pang, Q.; et al. Simulation of the Present and Future Projection of Permafrost on the Qinghai-Tibet Plateau with Statistical and Machine Learning Models. J. Geophys. Res. Atmos. 2021, 126, e2020JD033402. [Google Scholar] [CrossRef]
- Shen, X.; An, R.; Feng, L.; Ye, N.; Zhu, L.; Li, M. Vegetation changes in the Three-River Headwaters Region of the Tibetan Plateau of China. Ecol. Indic. 2018, 93, 804–812. [Google Scholar] [CrossRef]
- Zhang, Y.; Zhang, S.; Zhai, X.; Xia, J. Runoff variation and its response to climate change in the Three Rivers Source Region. J. Geogr. Sci. 2012, 22, 781–794. [Google Scholar] [CrossRef]
- Allen, R.G.; Pereira, L.S.; Raes, D.; Smith, M. Crop evapotranspiration-Guidelines for computing crop water requirements-FAO Irrigation and drainage paper 56. FAO Rome 1998, 300, D05109. [Google Scholar]
- Meng, X.; Wang, H. China Meteorological Assimilation Datasets for the SWAT Model-Soil Temperature Version 1.0 (2009–2013); National Tibetan Plateau Data Center: Beijing, China, 2018. [Google Scholar] [CrossRef]
- NRCS-USDA. Chapter 9: Hydrologic Soil-Cover Complexes. In National Engineering Handbook; USDA: Washington, DC, USA, 2009. [Google Scholar]
- Wei, Y. The Boundaries of the Source Regions in Sanjiangyuan Region; National Tibetan Plateau Data Center: Beijing, China, 2018. [Google Scholar] [CrossRef]
- Chen, R.; Ding, Y.; Kang, E. Some knowledge on and parameters of China’s alpine hydrology. Adv. Water Sci. 2014, 25, 307–317. (In Chinese) [Google Scholar]
- Guo, S.; Chen, R.; Li, H. Surface Sublimation/Evaporation and Condensation/Deposition and Their Links to Westerlies during 2020 on the August-One Glacier, the Semi-Arid Qilian Mountains of Northeast Tibetan Plateau. J. Geophys. Res. Atmos. 2022, 127, e2022JD036494. [Google Scholar] [CrossRef]
- Suzuki, K.; Liston, G.E.; Matsuo, K. Estimation of Continental-Basin-Scale Sublimation in the Lena River Basin, Siberia. Adv. Meteorol. 2015, 2015, 286206. [Google Scholar] [CrossRef]
- Gascoin, S. Snowmelt and Snow Sublimation in the Indus Basin. Water 2021, 13, 2621. [Google Scholar] [CrossRef]
- Suzuki, K.; Park, H.; Makarieva, O.; Kanamori, H.; Hori, M.; Matsuo, K.; Matsumura, S.; Nesterova, N.; Hiyama, T. Effect of Permafrost Thawing on Discharge of the Kolyma River, Northeastern Siberia. Remote Sens. 2021, 13, 4389. [Google Scholar] [CrossRef]
Figure 1.
Methodological flowcharts considering the effect of frozen ground (a) and snow cover (b) on water yield (k′0 is the saturated hydraulic conductivity (cm/d) after correction by soil temperature, k0 is the saturated hydraulic conductivity (cm/d) before correction, Ts is the temperature of the soil, Tf denotes the temperature threshold of soil freezing, T1 is the threshold temperature for differentiating rain and sleet, and T2 is the threshold temperature for differentiating snow and sleet).
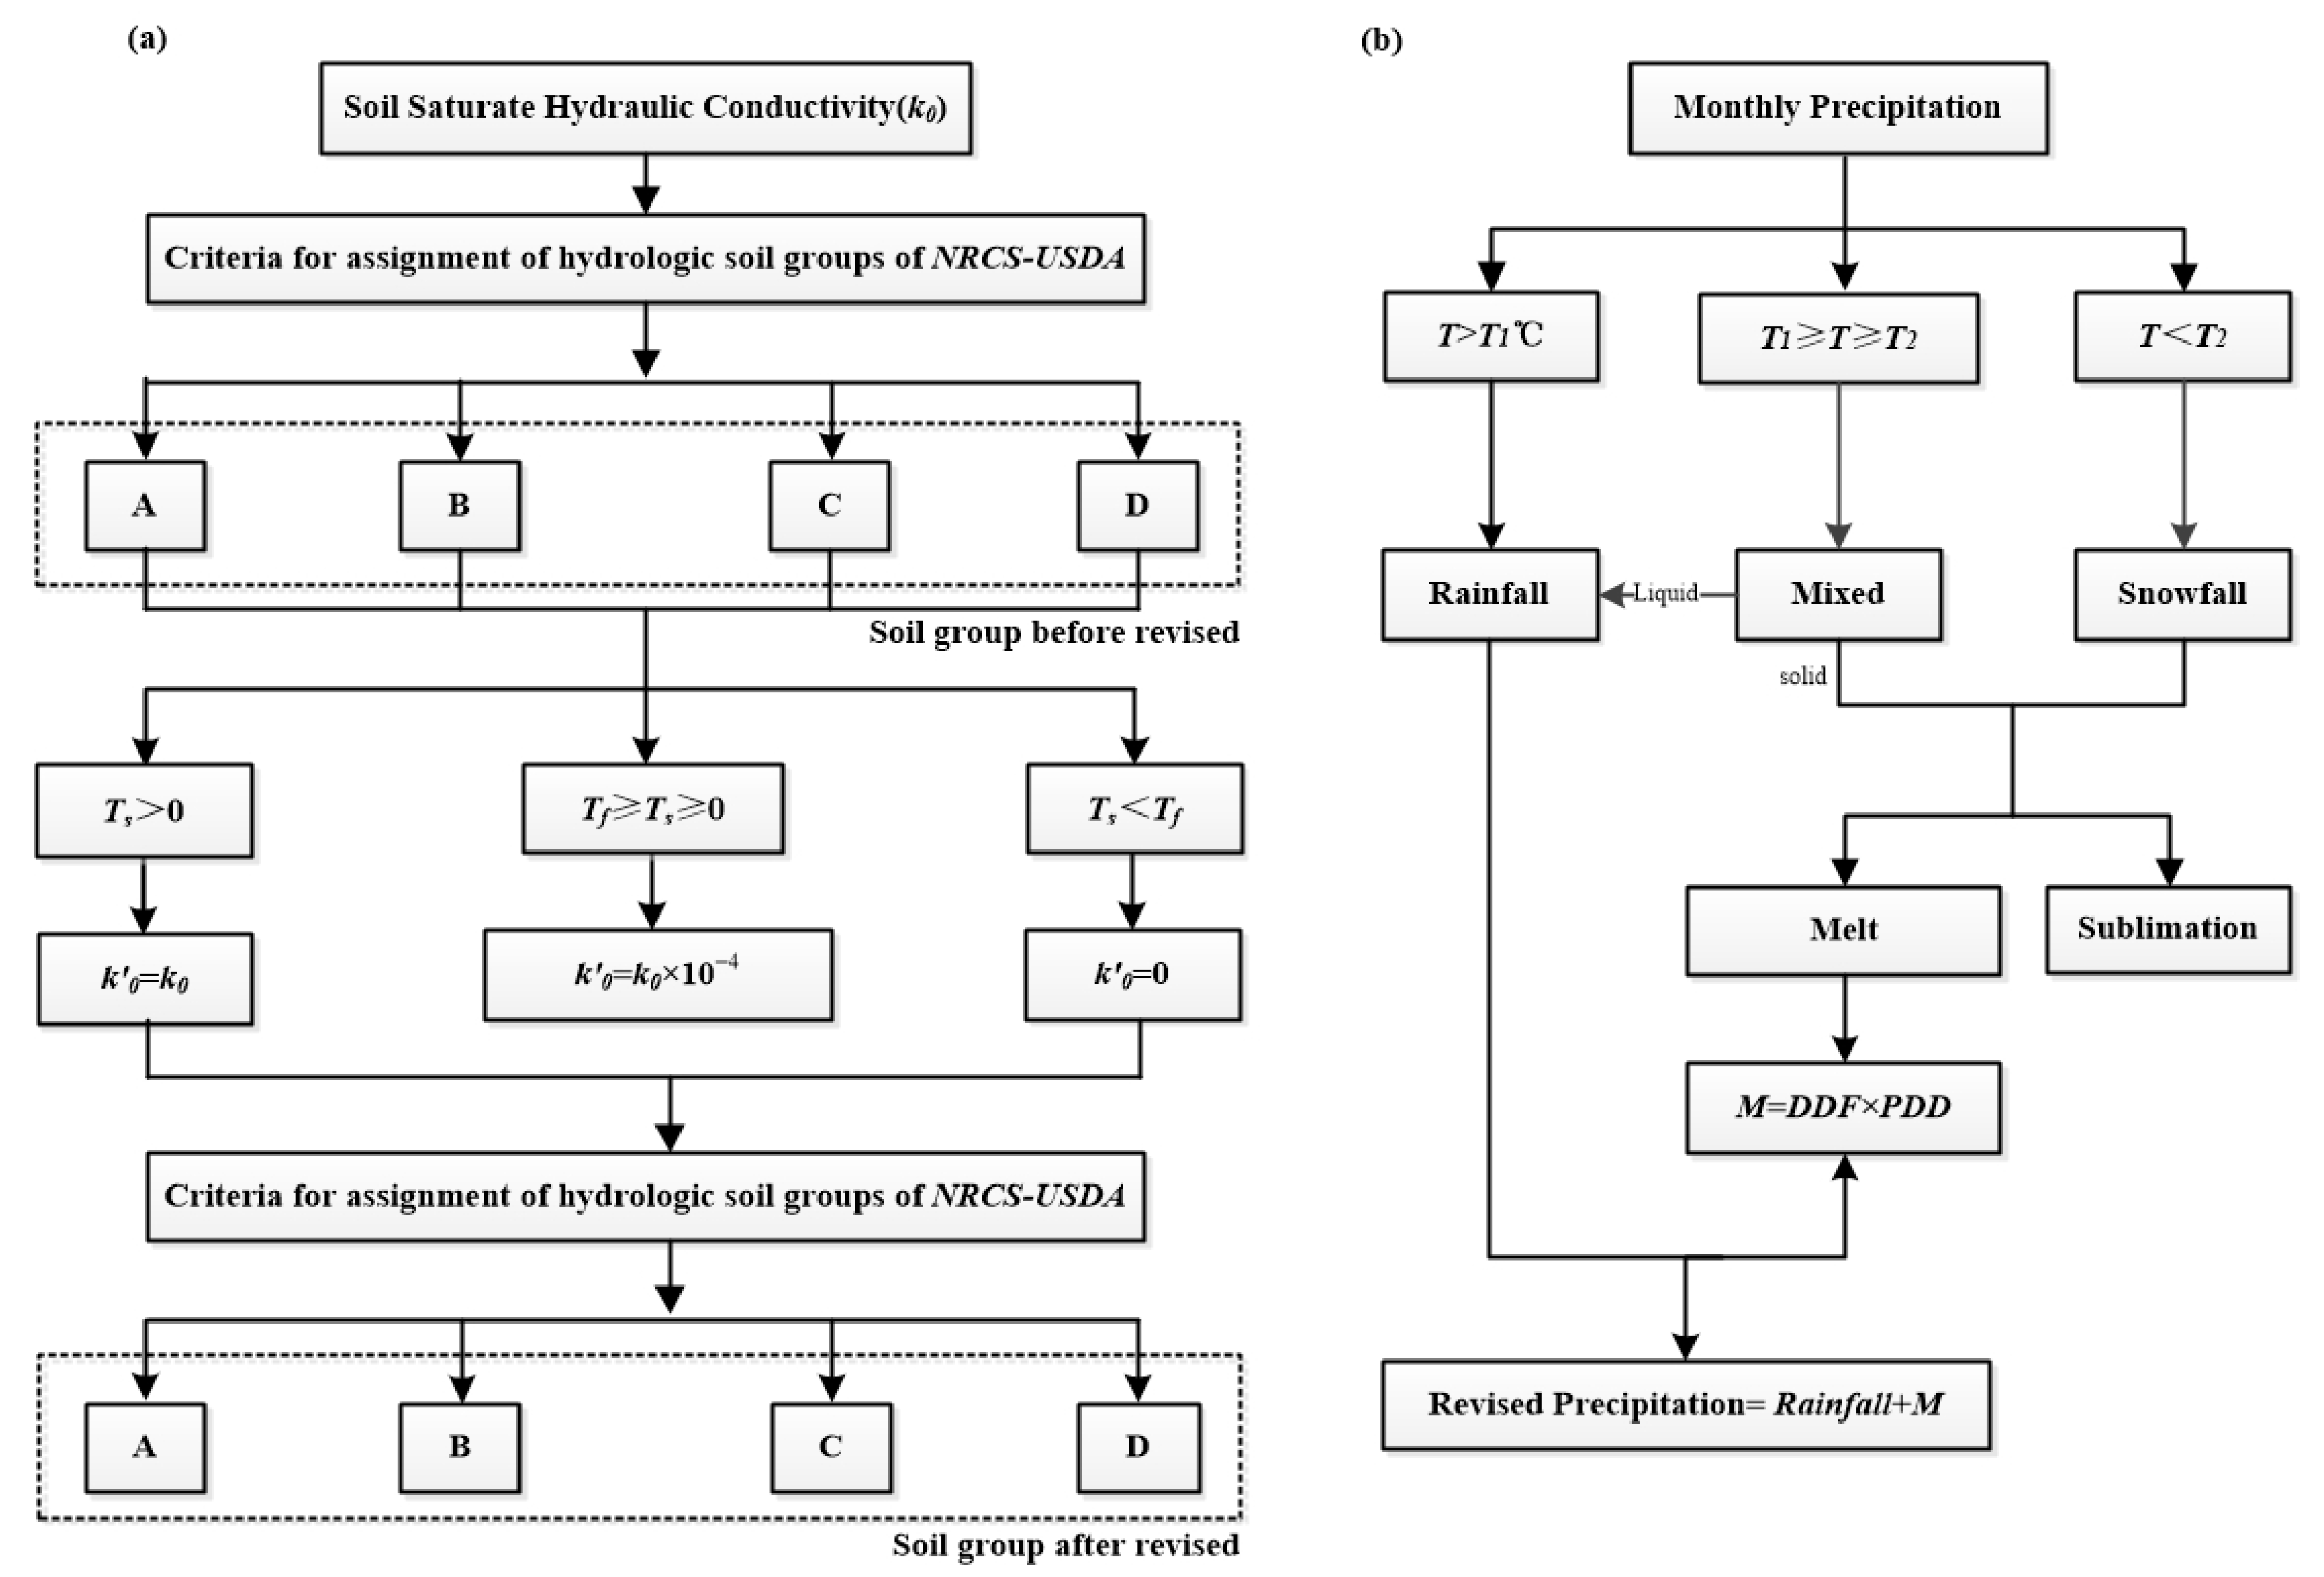
Figure 2.
Flowcharts of model calibration, validation, and evaluation.
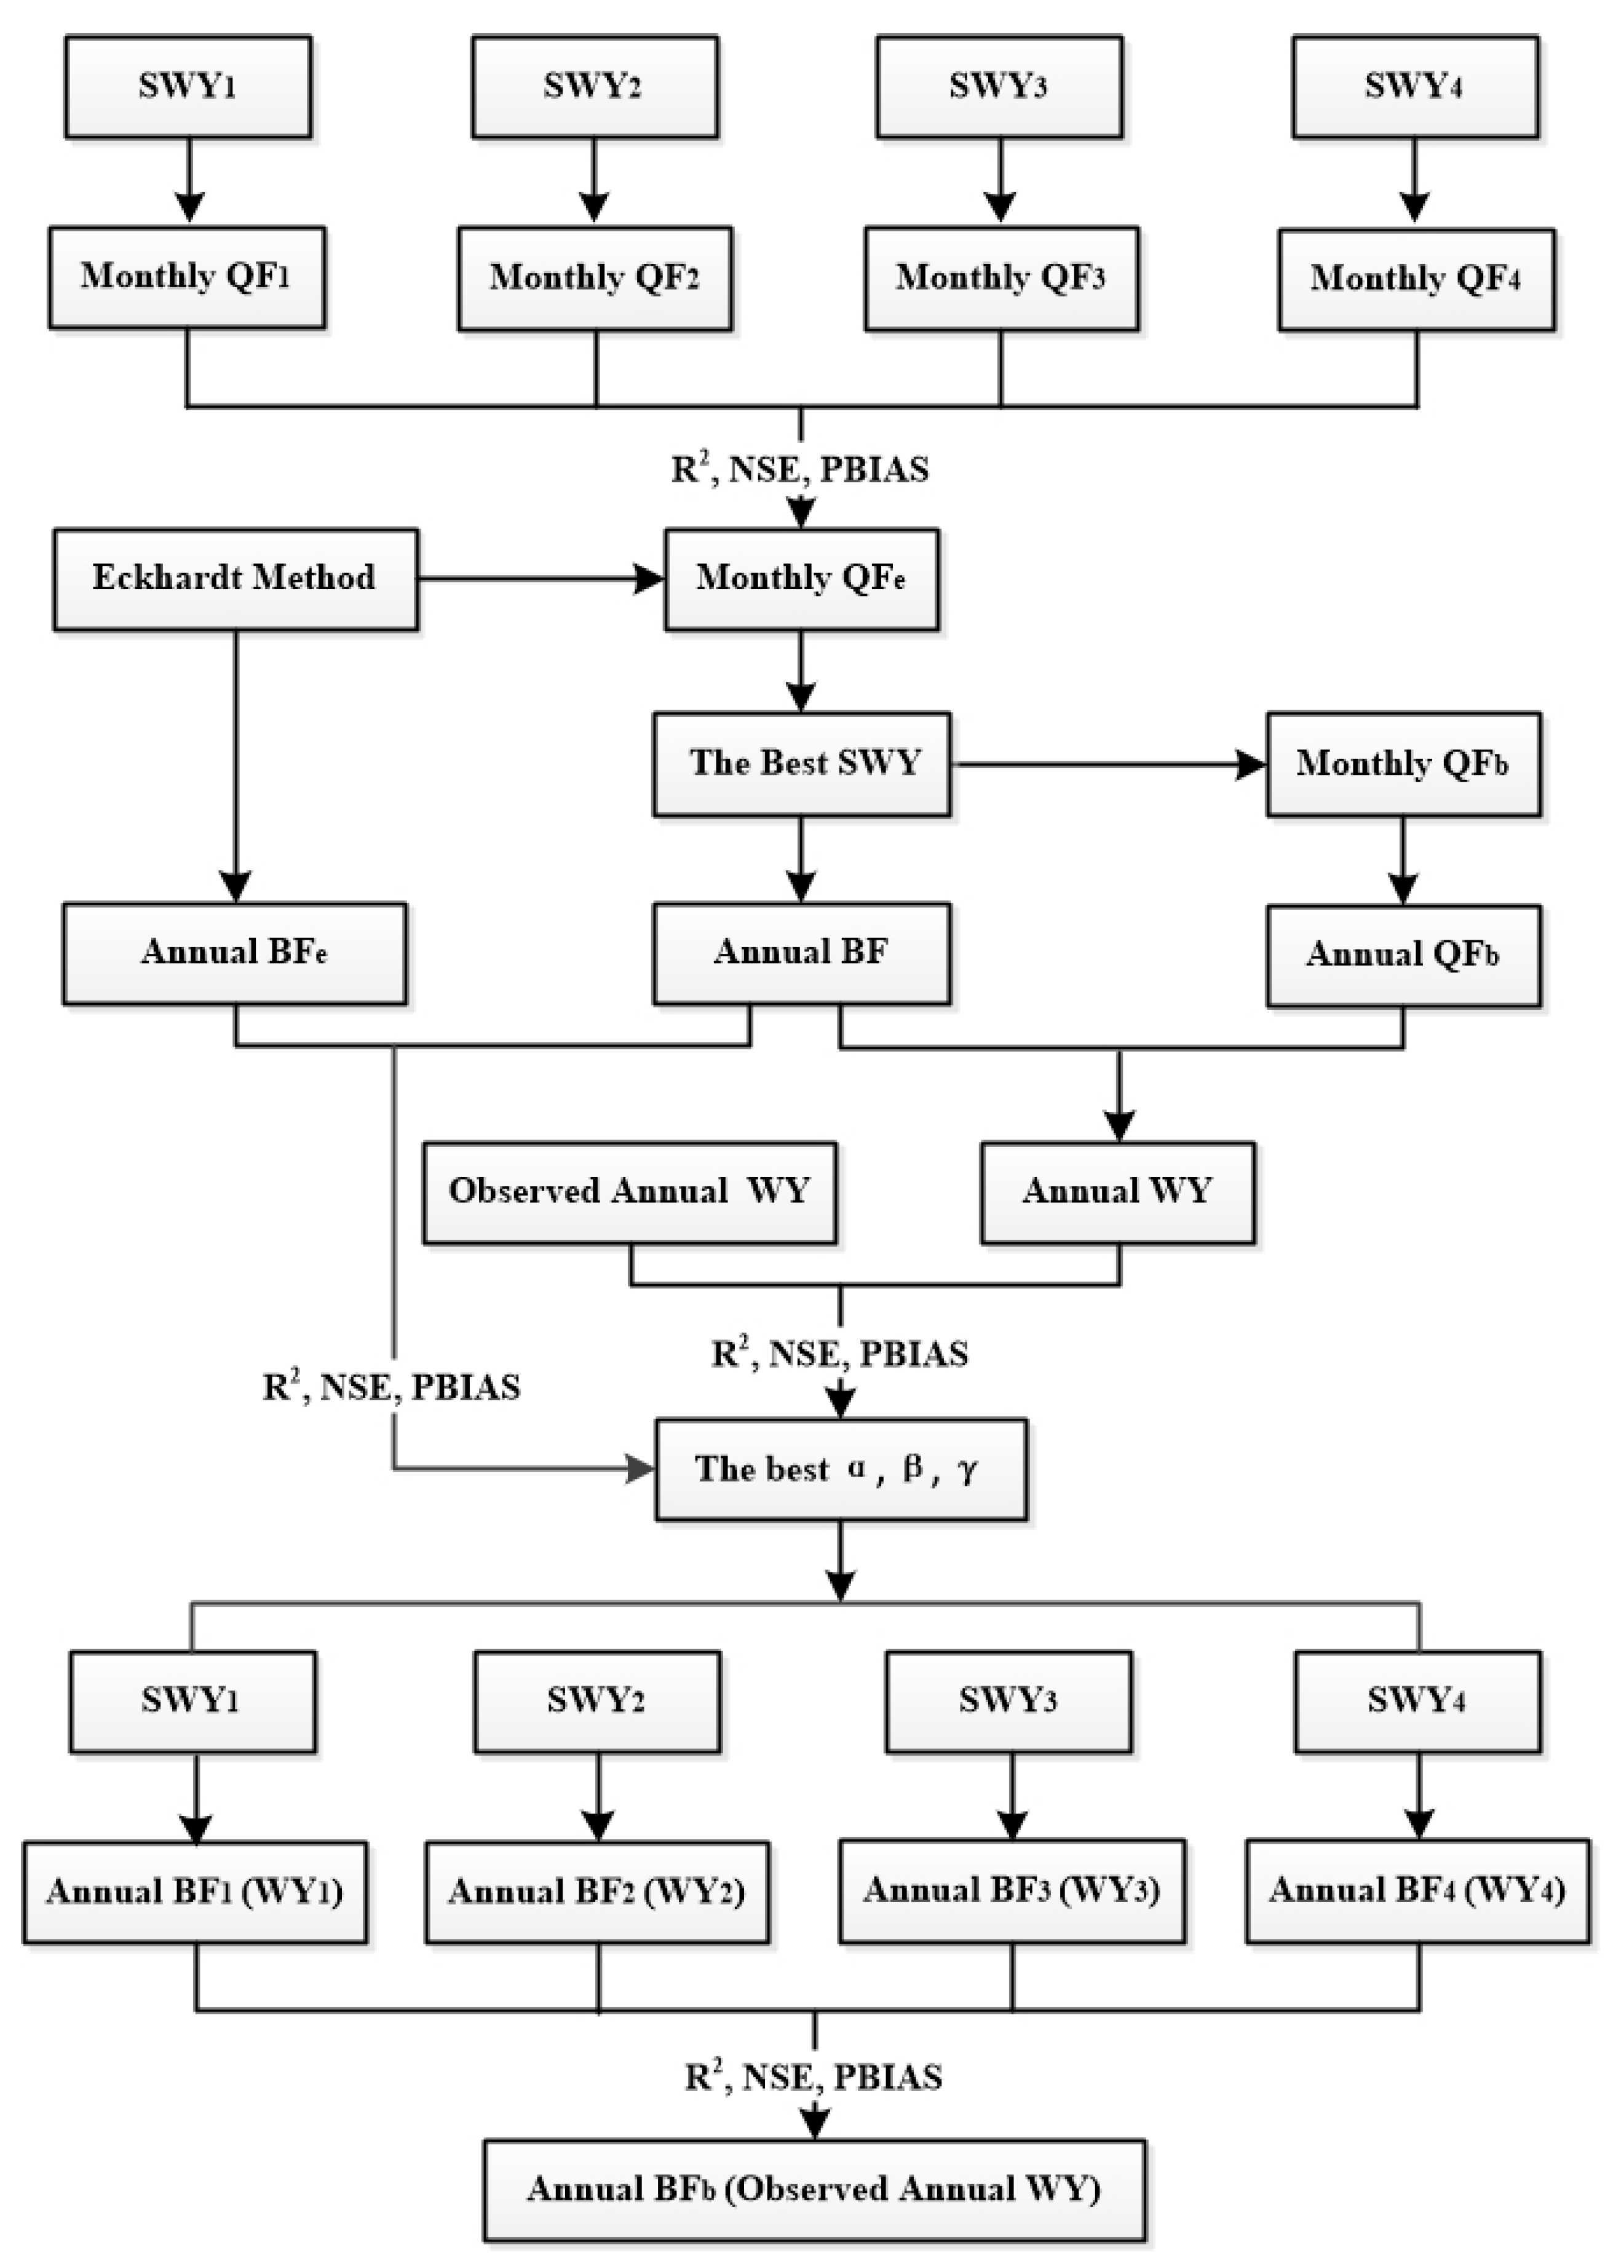
Figure 3.
Location and topography (a), land use land cover (b), frozen ground distribution (c) of the TRHR.
Figure 3.
Location and topography (a), land use land cover (b), frozen ground distribution (c) of the TRHR.

Figure 4.
Sensitivity analyses of the baseflow modeled by SWY to α (a), β (b), and γ (c) parameters.
Figure 4.
Sensitivity analyses of the baseflow modeled by SWY to α (a), β (b), and γ (c) parameters.
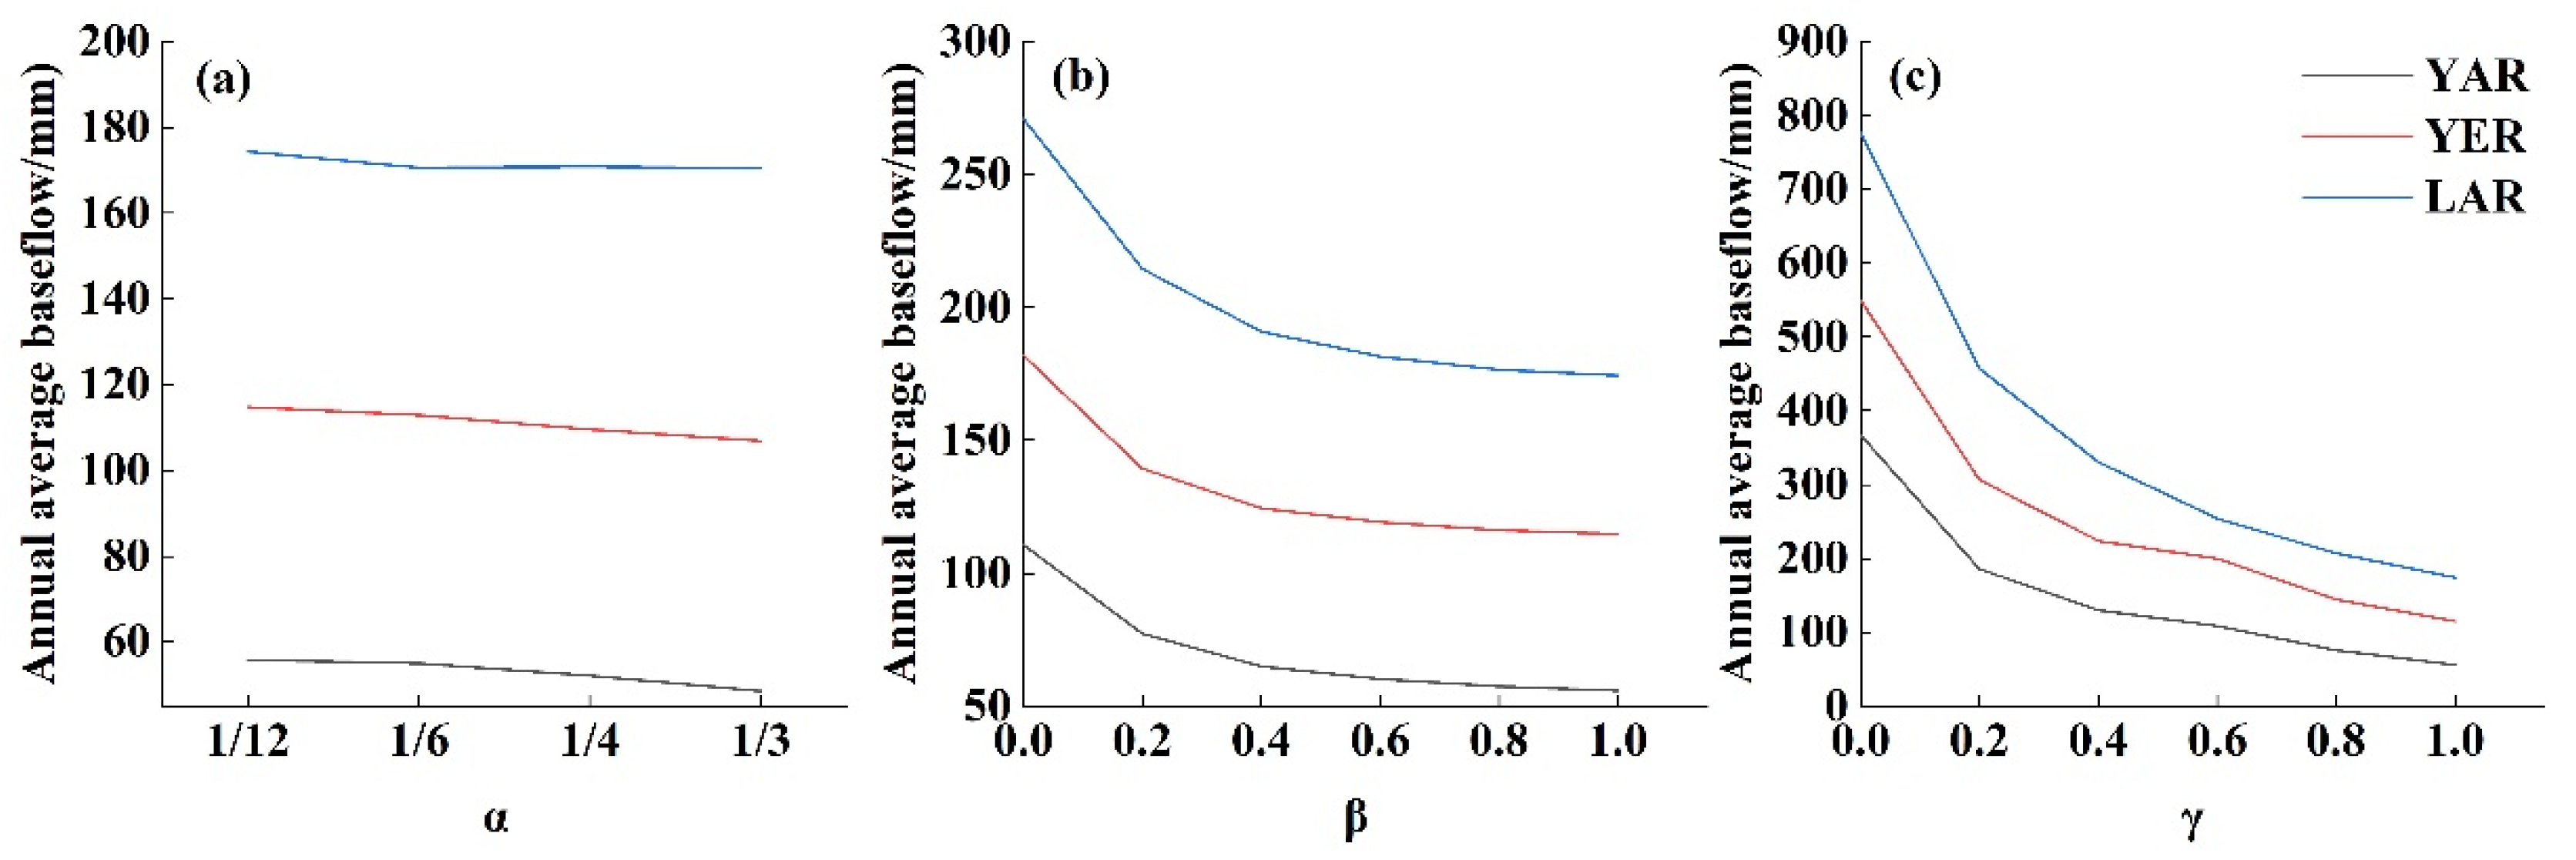
Figure 5.
Comparisons of baseflow, quickflow, and water yield between modeled (SWY4) and observed data/the result of the Eckhardt filter method ((a,b) are the annual baseflow of the YAR of YER, (c,d) are the monthly quickflow of the YAR and YER, (e–g) are the annual water yield of the YAR, YER, and LAR, respectively).
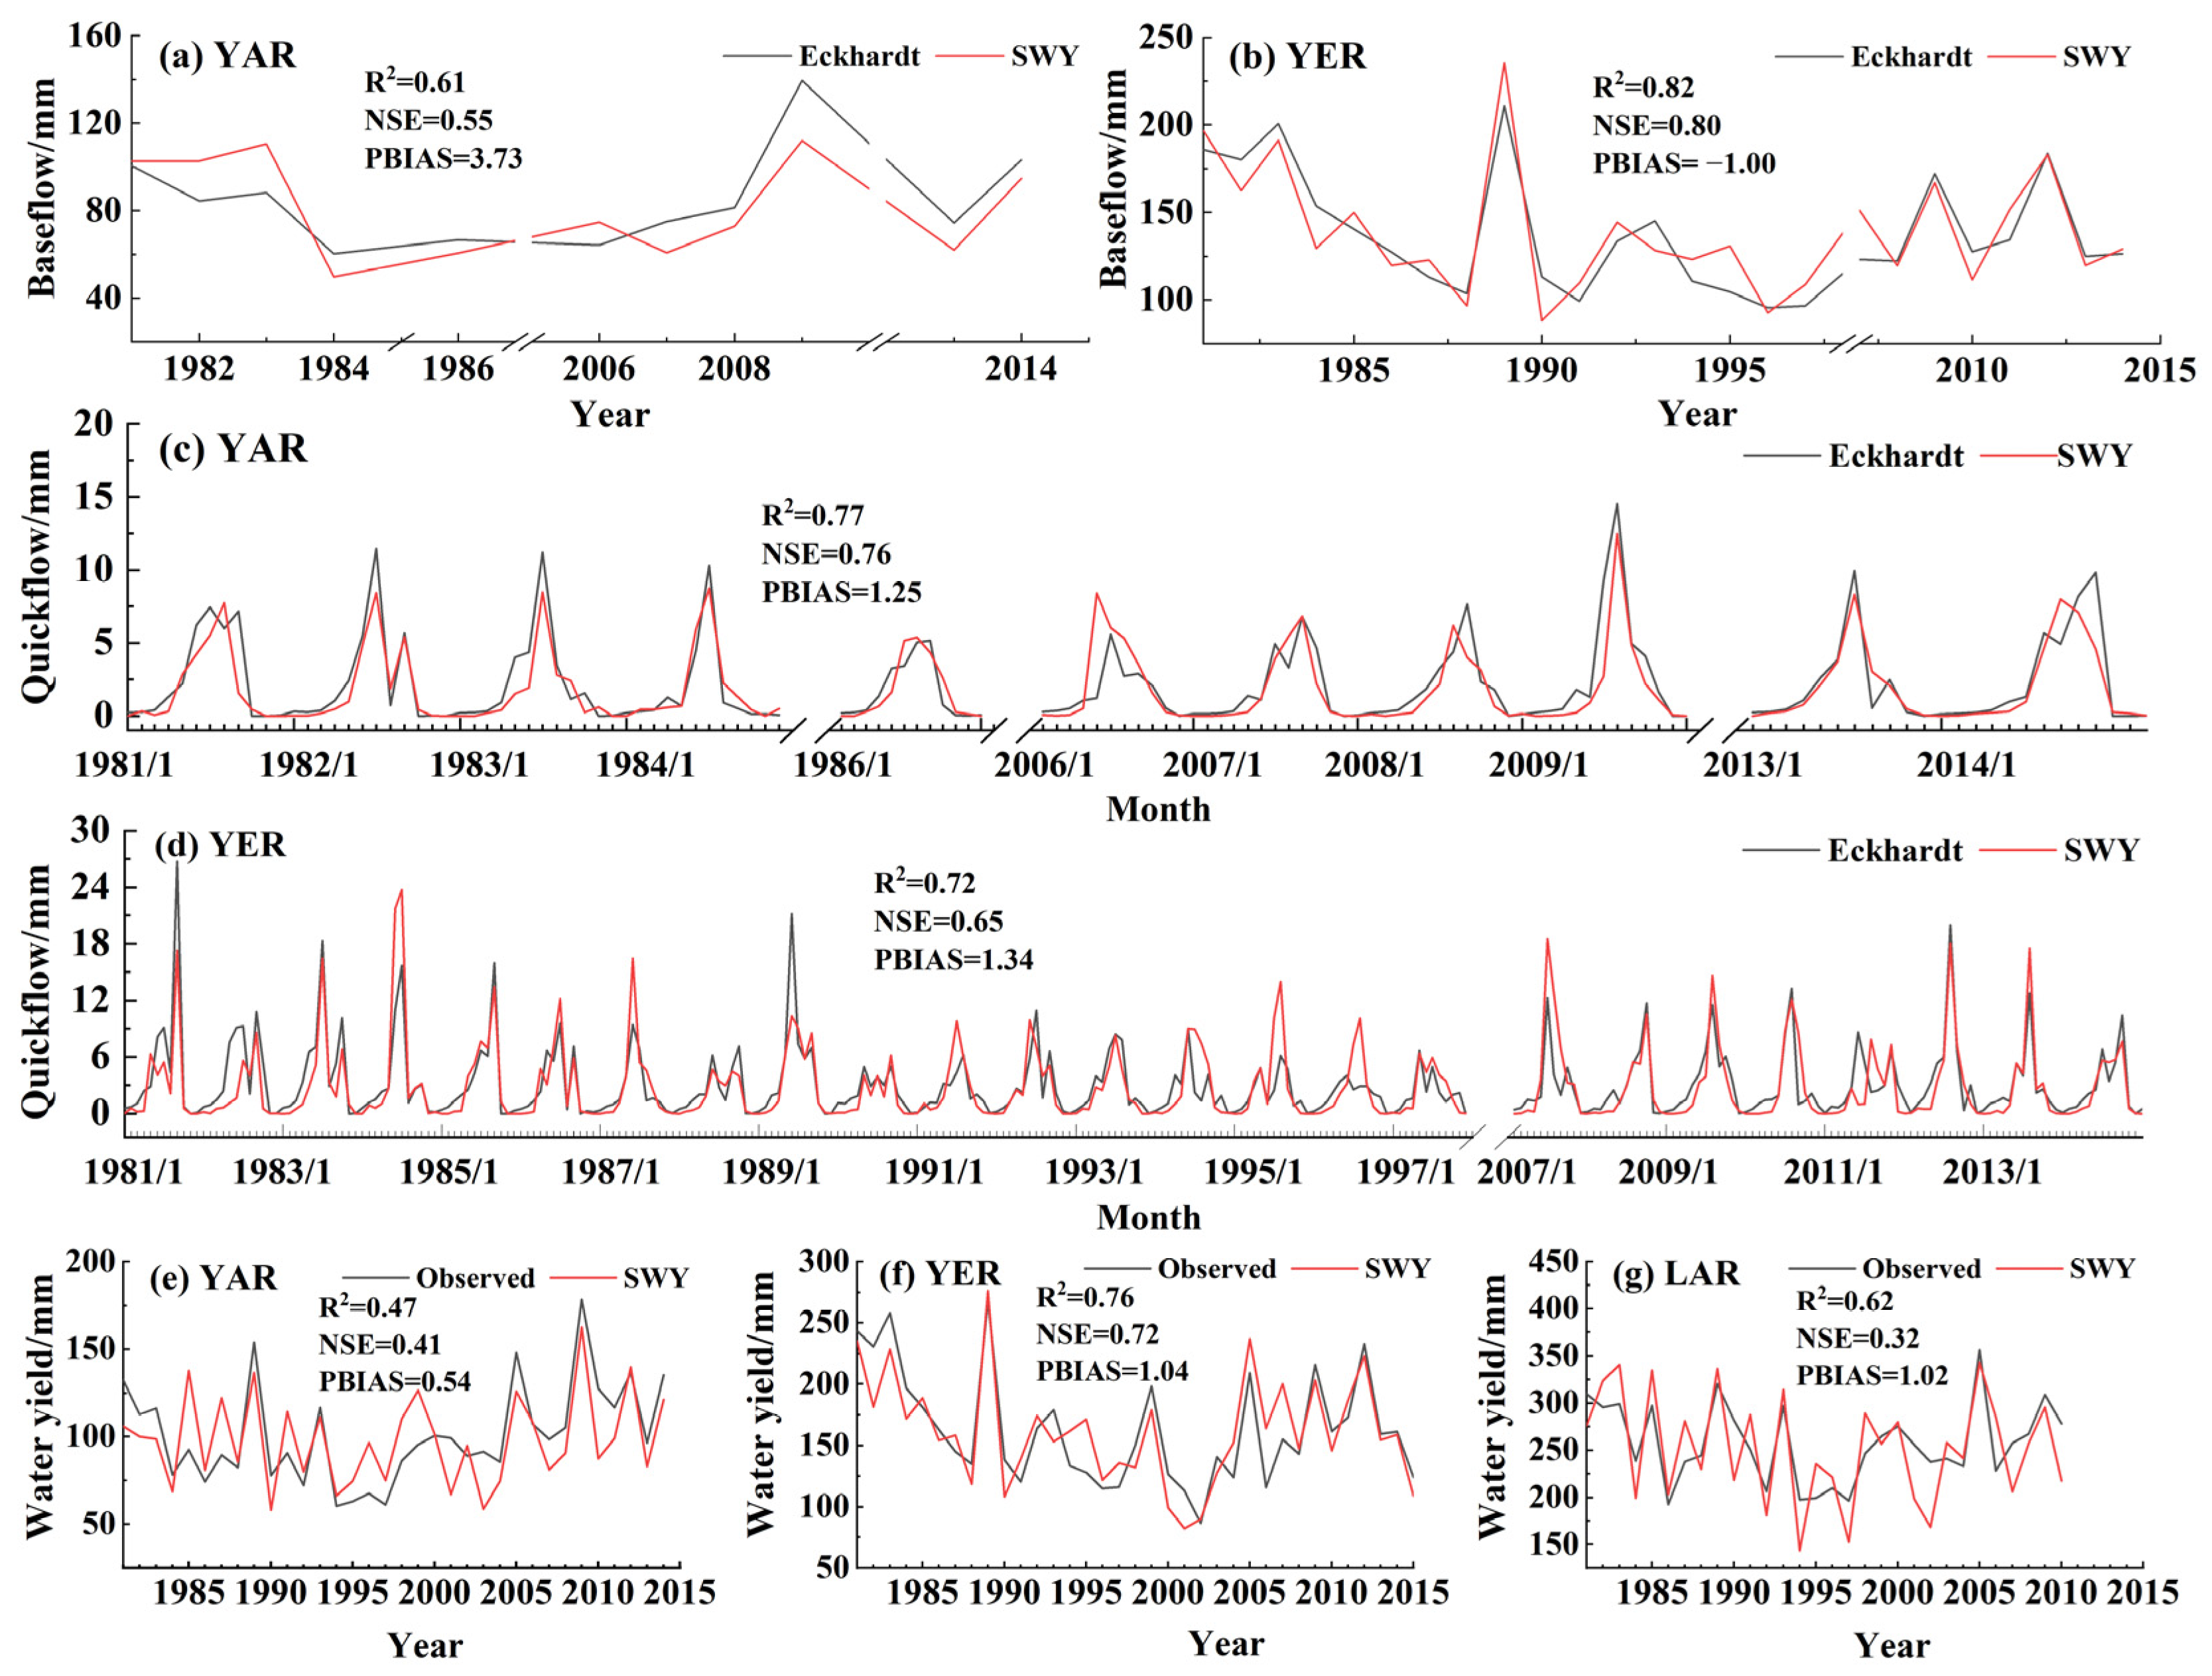
Figure 6.
Soil groups of the TRHR before (a) and after (b) considering the effect of frozen ground and annual distribution of precipitation, and before and after considering the effect of snow cover (c).
Figure 6.
Soil groups of the TRHR before (a) and after (b) considering the effect of frozen ground and annual distribution of precipitation, and before and after considering the effect of snow cover (c).
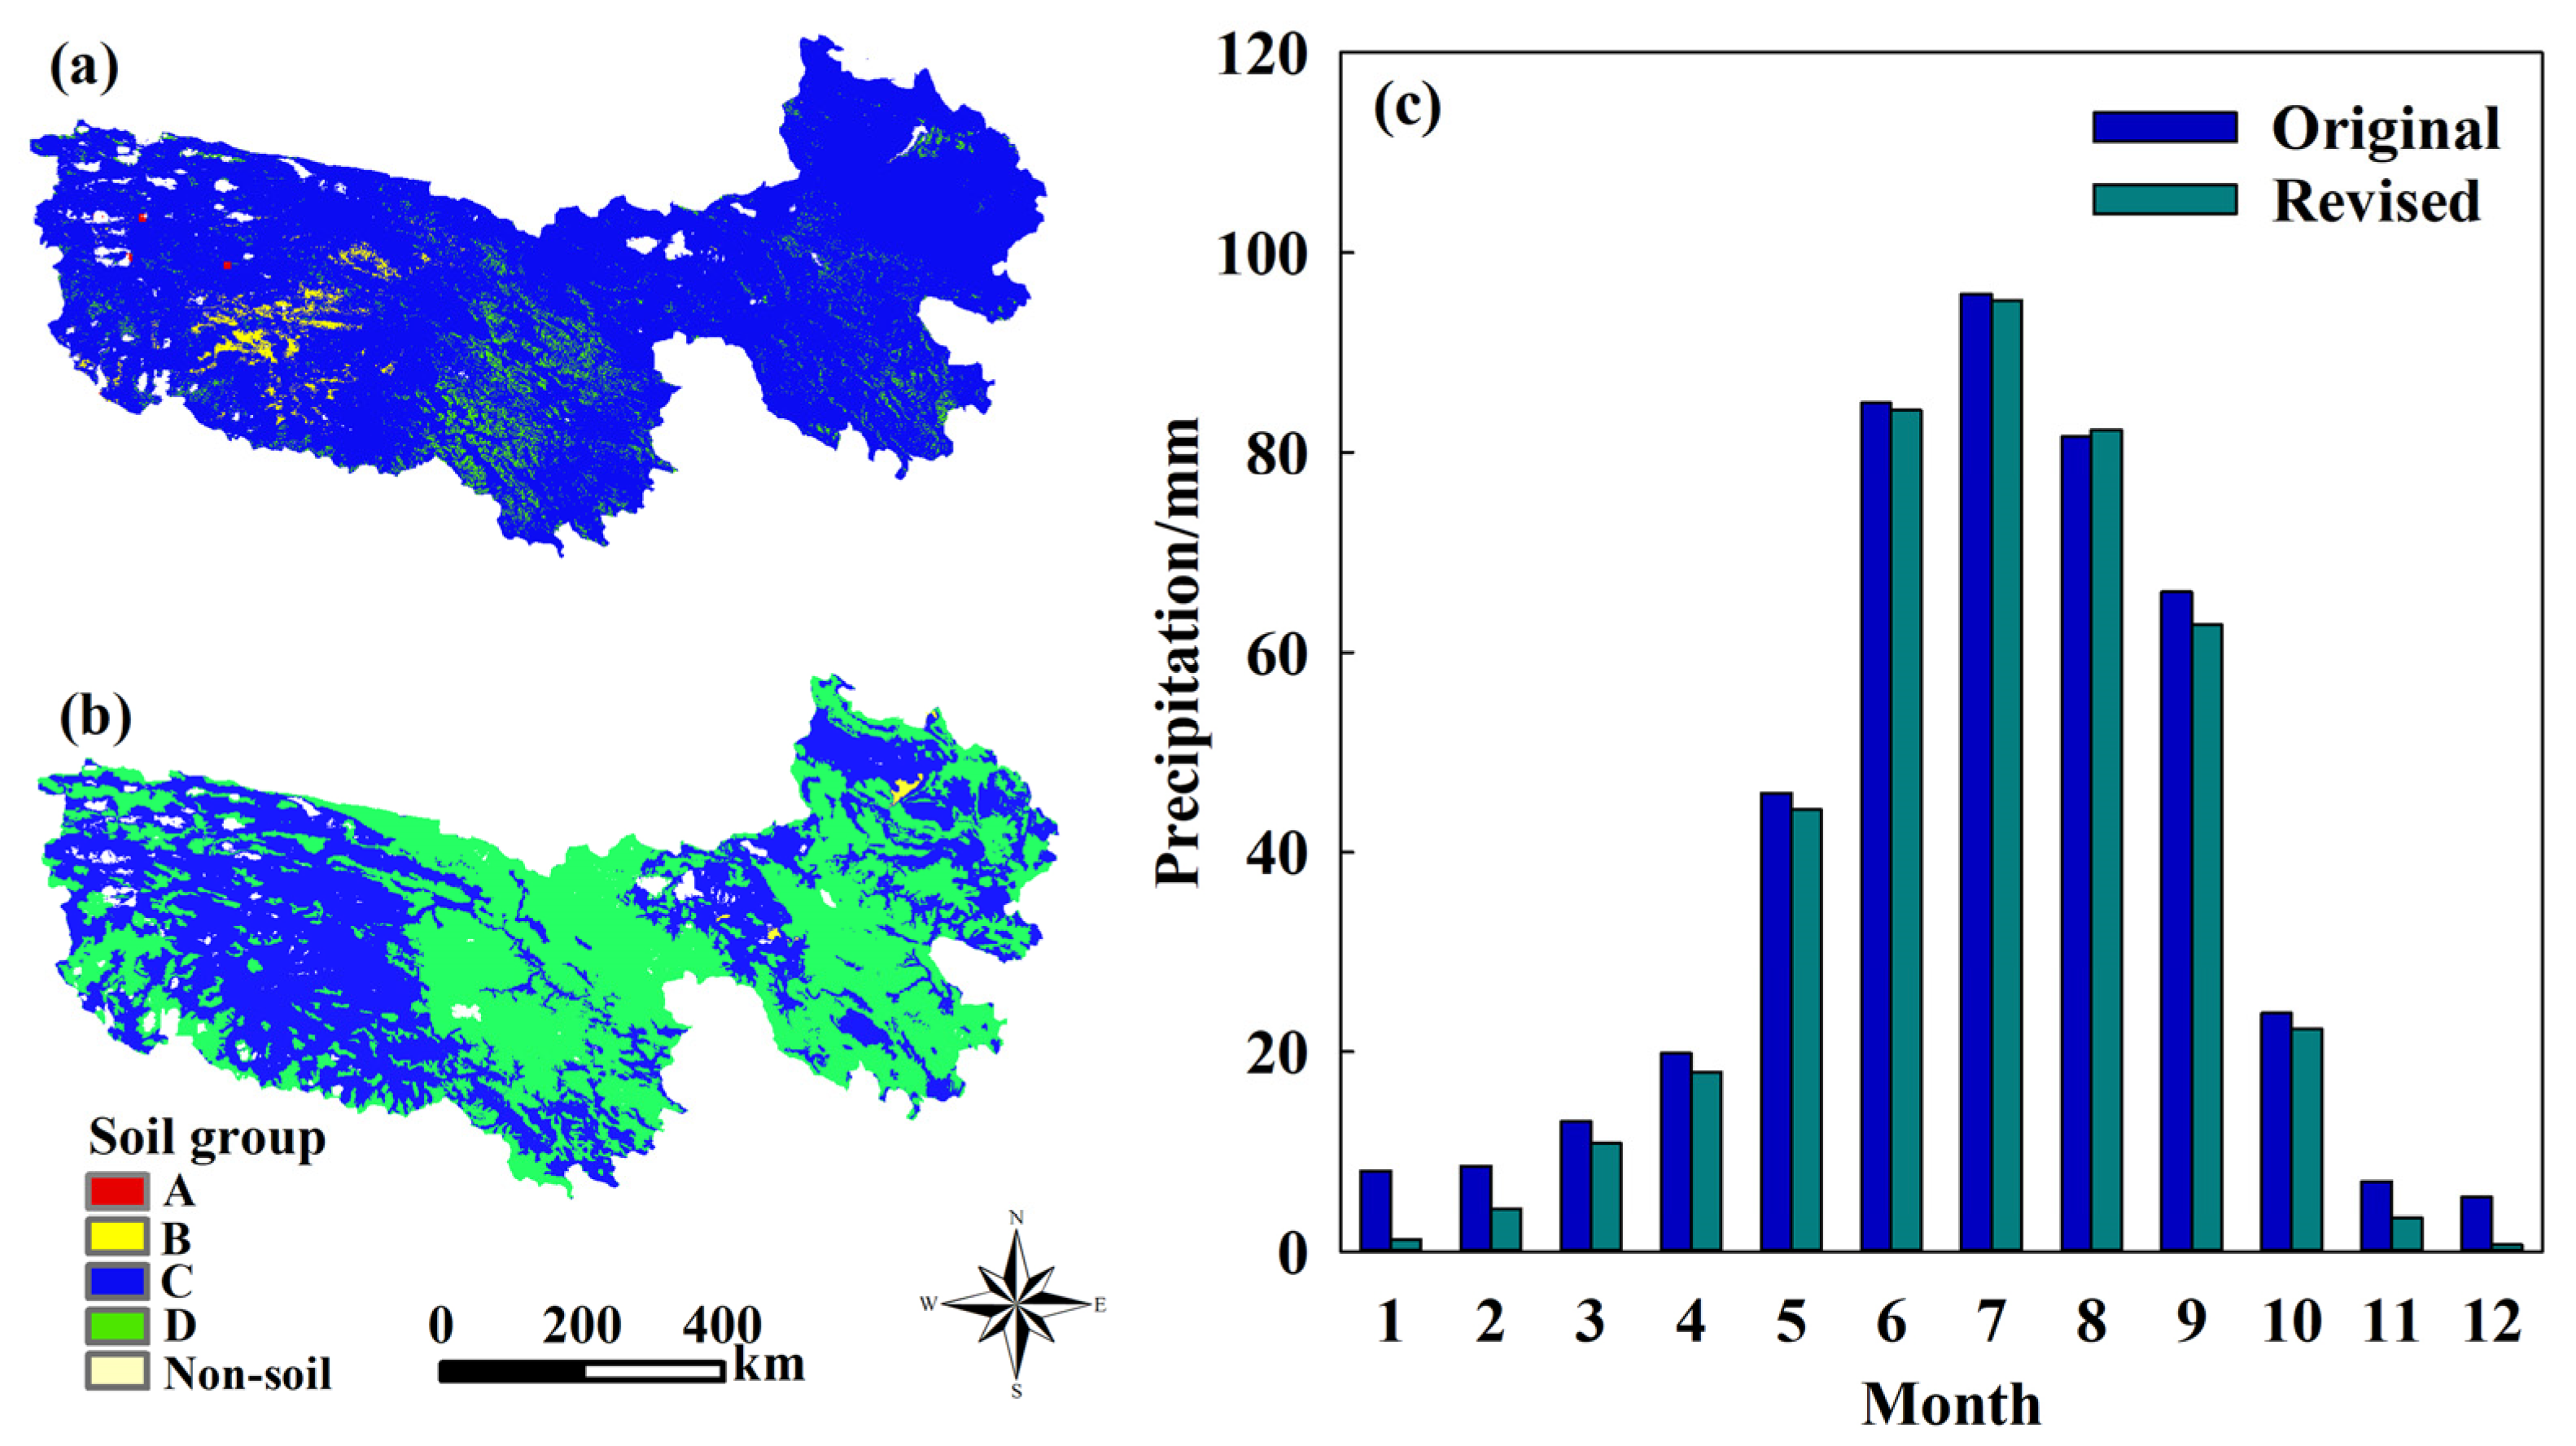
Figure 7.
Annual average quickflow, baseflow, and water yield of SWY1, SWY2, SWY3, and SWY4 from 1981 to 2020 (a), and the spatial differences of quickflow and baseflow of SWY1, SWY2, and SWY3 compared with SWY4 ((b–d) are the spatial differences of quickflow of SWY1, SWY2, and SWY3 compared with SWY4; (e–g) are the spatial differences of baseflow of SWY1, SWY2, and SWY3 compared with SWY4).

Table 1.
Data sources and format used as inputs of the SWY.
| Data Inputs | Format | Source (before Processing into Model Inputs) |
|---|---|---|
| Monthly Precipitation (revised by the method shown in Figure 1b.) | Raster (1 km) | China Meteorological Data Service Center (http://data.cma.cn) (accessed on 1 January 2021). |
| Monthly Reference Evapotranspiration (ET0) | Raster (1 km) | China Meteorological Data Service Center (http://data.cma.cn) (accessed on 1 January 2021). |
| Annual LULC Maps | Raster (1 km) | Chinese Academy of Environmental Science Data Center (https://www.resdc.cn/) (accessed on 5 June 2021). |
| Annual Soil Group (revised by the method shown in Figure 1a.) | Raster (1 km) | The soil temperature data was downloaded from the National Tibetan Plateau Data Center (http://data.tpdc.ac.cn/) (accessed on 5 November 2020) [69]. Hydrologic Soil Group raster (used as the soil group before revision) and Saturate Hydraulic Conductivity rasters (used to revise the soil group) from FutureWater (https://www.futurewater.eu/2015/07/soil-hydraulic-properties/) (accessed on 4 May 2021). |
| Biophysical Table (12 months in a CSV) | CSV | CN was downloaded from the United States Department of Agriculture [70]. Kc values were from FAO [68]. |
| Rain Events (12 months in a CSV) | CSV | China Meteorological Data Service Center (http://data.cma.cn) (accessed on 1 January 2021). |
| DEM | Raster (1 km) | Geospatial Data Cloud http://www.gscloud.cn/ (accessed on 5 November 2020). |
| AOI (Area of Interest) | Vector | National Tibetan Plateau Data Center (http://data.tpdc.ac.cn/) (accessed on 5 November 2020) [71]. |
| The Critical Temperature Threshold of Soil Freezing (Tf) 1 | - | −8 °C [72]. |
| The Threshold Temperature For Differentiating Rain and Sleet (T1) 1 | 5 °C [54]. | |
| The Threshold Temperature For Differentiating Snow and Sleet (T2) 1 | 2 °C [55]. | |
| TFA (Threshold Flow Accumulation) 1 | - | 3000 |
| α; β; γ 1 | - | Default (1/12; 1; 1) |
Note: 1 represents the parameters of the model, while the other ones in the table represent the model inputs.
Table 2.
Model performance of the SWY with different parameter combinations.
| Parameters | YAR | YER | LAR | ||||||
|---|---|---|---|---|---|---|---|---|---|
| R2 | NSE | PBIAS | R2 | NSE | PBIAS | R2 | NSE | PBIAS | |
| α = 1/6, β = 1, γ = 1 | 0.40 | −0.30 | 21.67 | 0.75 | 0.61 | 7.43 | 0.55 | −0.49 | 9.80 |
| α = 1/4, β = 1, γ = 1 | 0.40 | 0.07 | 14.69 | 0.74 | 0.68 | 3.77 | 0.55 | −0.49 | 9.73 |
| α = 1/3, β = 1, γ = 1 | 0.37 | 0.36 | −1.56 | 0.73 | 0.69 | −2.81 | 0.55 | −0.46 | 9.54 |
| α = 1/12, β = 0, γ = 1 | 0.43 | −1.42 | −32.66 | 0.69 | −0.88 | −33.03 | 0.56 | −3.46 | −28.96 |
| α = 1/12, β = 0.2, γ = 1 | 0.47 | 0.41 | −0.14 | 0.73 | 0.59 | −7.98 | 0.57 | 0.12 | −6.99 |
| α = 1/12, β = 0.4, γ = 1 | 0.42 | 0.18 | 11.32 | 0.76 | 0.72 | 0.50 | 0.62 | 0.32 | 1.02 |
| α = 1/12, β = 0.6, γ = 1 | 0.41 | −0.02 | 16.57 | 0.75 | 0.68 | 3.98 | 0.59 | 0.03 | 5.53 |
| α = 1/12, β = 0.8, γ = 1 | 0.41 | −0.16 | 19.39 | 0.75 | 0.65 | 5.73 | 0.56 | −0.20 | 7.66 |
| α = 1/12, β = 1, γ = 0 | 0.45 | −121.84 | −286.37 | 0.71 | −95.48 | −260.84 | 0.60 | −212.67 | −224.99 |
| α = 1/12, β = 1, γ = 0.2 | 0.51 | −16.93 | −107.33 | 0.77 | −18.76 | −113.03 | 0.61 | −44.49 | −101.77 |
| α = 1/12, β = 1, γ = 0.4 | 0.34 | −3.53 | −47.22 | 0.77 | −5.27 | −62.10 | 0.60 | −12.06 | −50.84 |
| α = 1/12, β = 1, γ = 0.6 | 0.32 | −1.06 | −23.75 | 0.73 | −12.09 | −48.07 | 0.60 | −2.92 | −22.50 |
| α = 1/12, β = 1, γ = 0.8 | 0.42 | 0.21 | 0.67 | 0.70 | 0.32 | −12.51 | 0.57 | −0.49 | −4.75 |
| α = 1/12, β = 1, γ = 1 | 0.40 | −0.27 | 21.16 | 0.74 | −0.44 | 7.44 | 0.56 | −0.33 | 8.62 |
Table 3.
Model performance of quickflow (QF), baseflow (BF), and water yield (WY) of SWY1, SWY2, SWY3, and SWY4.
Table 3.
Model performance of quickflow (QF), baseflow (BF), and water yield (WY) of SWY1, SWY2, SWY3, and SWY4.
| YAR | YER | LAR | ||||||||
|---|---|---|---|---|---|---|---|---|---|---|
| R2 | NSE | PBIAS | R2 | NSE | PBIAS | R2 | NSE | PBIAS | ||
| QF | SWY1 | 0.56 | 0.54 | 17.62 | 0.53 | 0.47 | 23.45 | - | - | - |
| SWY2 | 0.71 | 0.69 | −5.91 | 0.65 | 0.55 | −2.55 | - | - | - | |
| SWY3 | 0.65 | 0.62 | 21.57 | 0.62 | 0.53 | 23.34 | - | - | - | |
| SWY4 | 0.77 | 0.76 | 1.25 | 0.72 | 0.65 | 1.34 | - | - | ||
| BF | SWY1 | 0.52 | −0.02 | −14.08 | 0.62 | 0.18 | −17.39 | - | - | |
| SWY2 | 0.56 | 0.26 | −8.62 | 0.74 | 0.45 | −12.41 | - | - | - | |
| SWY3 | 0.58 | 0.50 | −1.30 | 0.77 | 0.70 | −5.66 | - | - | - | |
| SWY4 | 0.61 | 0.55 | 3.73 | 0.82 | 0.80 | −1.00 | - | - | - | |
| WY | SWY1 | 0.41 | −0.02 | −10.94 | 0.70 | 0.53 | −8.80 | 0.57 | −0.15 | −8.30 |
| SWY2 | 0.41 | −0.02 | −10.94 | 0.70 | 0.53 | −8.80 | 0.57 | −0.15 | −8.30 | |
| SWY3 | 0.47 | 0.41 | 0.54 | 0.76 | 0.72 | 1.04 | 0.62 | 0.32 | 1.02 | |
| SWY4 | 0.47 | 0.41 | 0.54 | 0.76 | 0.72 | 1.04 | 0.62 | 0.32 | 1.02 | |
Disclaimer/Publisher’s Note: The statements, opinions and data contained in all publications are solely those of the individual author(s) and contributor(s) and not of MDPI and/or the editor(s). MDPI and/or the editor(s) disclaim responsibility for any injury to people or property resulting from any ideas, methods, instructions or products referred to in the content. |
© 2023 by the authors. Licensee MDPI, Basel, Switzerland. This article is an open access article distributed under the terms and conditions of the Creative Commons Attribution (CC BY) license (https://creativecommons.org/licenses/by/4.0/).
Share and Cite
MDPI and ACS Style
Zhao, L.; Chen, R.; Yang, Y.; Liu, G.; Wang, X. A New Tool for Mapping Water Yield in Cold Alpine Regions. Water 2023, 15, 2920. https://doi.org/10.3390/w15162920
AMA Style
Zhao L, Chen R, Yang Y, Liu G, Wang X. A New Tool for Mapping Water Yield in Cold Alpine Regions. Water. 2023; 15(16):2920. https://doi.org/10.3390/w15162920
Chicago/Turabian StyleZhao, Linlin, Rensheng Chen, Yong Yang, Guohua Liu, and Xiqiang Wang. 2023. "A New Tool for Mapping Water Yield in Cold Alpine Regions" Water 15, no. 16: 2920. https://doi.org/10.3390/w15162920
Note that from the first issue of 2016, this journal uses article numbers instead of page numbers. See further details here.