
Dynamic Risk Assessment of Landslide Hazard for Large-Scale Photovoltaic Power Plants under Extreme Rainfall Conditions

1
Huadong Engineering Corporation Limited, Power China, Hangzhou 311122, China
2
Zijin School of Geology and Mining, Fuzhou University, Fuzhou 350116, China
*
Author to whom correspondence should be addressed.
Water 2023, 15(15), 2832; https://doi.org/10.3390/w15152832
Submission received: 20 July 2023
/
Revised: 2 August 2023
/
Accepted: 3 August 2023
/
Published: 5 August 2023
Abstract
:Large-scale photovoltaic power plants located in highland mountainous areas are vulnerable to landslides due to extreme rainfall, posing a significant threat to the normal operation of photovoltaic power plants. However, limited research has been conducted on landslide risk assessment specifically tailored to large photovoltaic power plants, with most studies focusing on static assessments that lack long-term sustainability in risk assessment and prediction. In this paper, a dynamic study on landslide risk at a large photovoltaic power plant project under extreme rainfall conditions is conducted. Firstly, the factors in landslide susceptibility assessment based on typical landslide characteristics in the study area are selected and an assessment index database using mapping units to extract the relevant factors is established. Subsequently, the ANP-FBN model is employed to evaluate the landslide susceptibility of large photovoltaic power plant sites. Furthermore, an assessment index system for landslide hazard vulnerability is developed by considering population, economic, and material vulnerabilities, and the AHP method is adapted to assess landslides vulnerability in the study area. Finally, the landslide rainfall threshold with the susceptibility and vulnerability assessment results are coupled to achieve a dynamic assessment of landslide hazard risk at large photovoltaic power plant sites under extreme rainfall conditions. The findings highlight that the central valley and the eastern steep slope of the study area are the primary “high” and “very high” risk areas. Moreover, with the increase in rainfall duration, the risk level of landslide hazards in the study area also rises.
1. Introduction
Photovoltaic power generation, as a significant renewable energy source, has witnessed remarkable global development. However, challenges associated with power generation efficiency and land limitations have led to the construction of large photovoltaic power plants in highland mountains. Simultaneously, recent years have witnessed a surge in extreme weather events, including high temperatures and heavy rainfall. These conditions inevitably give rise to geological disasters such as landslides in large-scale photovoltaic power plants situated in highland mountains, posing a serious threat to the regular operation of photovoltaic power plants. Hence, conducting research on landslide risk assessment for these large-scale photovoltaic power plants under extreme rainfall conditions becomes imperative.
Risk is commonly defined as the multiplication of susceptibility by vulnerability. Landslide hazard susceptibility is assessed by analyzing the typical characteristics of landslides and analyzing the combination of factors and values that are highly susceptible to landslides based on the assessment model, so as to estimate the probability of landslide occurrence. The assessment of landslide hazard vulnerability considers three main aspects: population vulnerability [1,2] and economic and physical vulnerability [3,4].
Landslide susceptibility assessment commonly employs three major categories of quantitative methods: physical models, statistical models, and machine learning models. Physical models utilize physical parameters and mechanical equations to determine the occurrence of landslides [5,6]. Numerous studies have been conducted in this domain, including research by Michel et al. Additionally, specific physical models include time-variant slope stability (TIVASS) [7], integration of the coupled routing and excess storage CREST model and TRIGRS (iCRESTRIGRS) [8], erosion–deposition debris flow analysis (EDDA) [9,10], smoothed-particle hydrodynamics (SPH) [11], and the hydro-geotechnical predictive approach for rockfall mountain hazard (HPARMH) [12], among others.
Statistical models have gained widespread usage in landslide risk assessment due to their computational simplicity and practicality. Sharma et al. [13] conducted a landslide susceptibility zoning study in the Himalayan basin by comparing the accuracy of the frequency ratio method, information quantity method, and analytic hierarchy process. Chen et al. [14] integrated the analytic hierarchy process with deterministic coefficients to investigate landslide susceptibility zoning in Baoji city. Similarly, Kadi et al. [15] employed the analytic hierarchy process to examine local landslide susceptibility zoning.
Machine learning models offer distinct advantages over physical and statistical models in terms of objective factor weight acquisition and high operational efficiency, making them well-suited for landslide susceptibility mapping. Fuzzy Bayesian networks (FBN) have been widely applied [16,17,18], as have support vector machines (SVM) [19,20,21], logistic regression (LR) [22,23,24] and random forests (RF) [25,26,27]. Back propagation neural networks (BPNN) have also been utilized [28,29,30,31]. Moreover, deep learning models, including convolutional neural networks, recurrent neural networks, and multi-layer perception models, have found widespread application in regional landslide susceptibility mapping [32,33,34,35]. In addition to this, machine learning methods have been widely applied to the prediction of physical parameters of geotechnical materials [36].
Despite numerous valuable attempts by scholars to assess landslide risk using various methods, there is a dearth of research specifically focused on landslide risk assessment for large-scale photovoltaic power plants. Furthermore, most existing studies on landslide assessment predominantly concentrate on static factors, such as topography and geological structure, while disregarding the impact of dynamic factors like rainfall. Consequently, a comprehensive assessment of landslide hazard risk in the study area remains elusive. On the other hand, over time, human activities are becoming more and more intensive, and the degree of influence on the natural environment is also getting bigger and bigger. Therefore, in the process of landslide susceptibility and risk assessment of large engineering sites, human engineering activities are one of the indispensable influencing factors [37,38]. In particular, as China is the primary producer of renewable energy, photovoltaic power plants play a crucial role in ensuring uninterrupted production. Hence, when selecting vulnerability assessment factors for photovoltaic power plants, priority should be given to considering production and economic losses resulting from landslide disasters. Subsequently, these factors can be combined with quantitative assessment indices such as local population and materials to establish a rational construction of the assessment index system.
In order to achieve these objectives, this paper focuses on a large-scale photovoltaic power plant project and undertakes the following investigations: (1) employing a combination of statistical models and machine learning models to conduct landslide hazard vulnerability zoning in the study area; (2) developing a vulnerability assessment index specifically tailored for landslide hazards in large photovoltaic power plant power plants and determining the probability value of landslide vulnerability; and (3) utilizing the empirical rainfall threshold model of the study area, incorporating daily updated rainfall data as dynamic indicators, and constructing a dynamic risk assessment model for landslide hazards in the study area. It is hoped that the above study will provide some theoretical support for the construction and stable operation of photovoltaic power plants. At the same time, it can also provide methodological references for the disaster prevention and management of similar large engineering sites.
2. Study Area of Photovoltaic Power Plants
The photovoltaic power plants are situated in the western part of Yajiang County, Sichuan Province (Figure 1). This region encompasses a plateau mountainous terrain characterized by erosion and permafrost as the primary geological phenomena. The power plants’ elevation ranges from 4235.00 m to 4487.92 m, exhibiting varying slope undulations, with a maximum relative height difference of approximately 200 m. Generally, the topography of the area is wide and gently sloping, with an average topographic slope of about 20°. However, the central and eastern parts feature relatively steep slopes ranging from 30 to 60°. Positioned on the eastern fringe of the Tibetan Plateau, the proposed project falls within the western Sichuan Plateau climate zone, influenced primarily by the high westerly circulation and southwest monsoon, resulting in distinct dry and wet seasons. Rainfall is predominantly concentrated in the summer, contributing to an average annual precipitation of 964.6 mm. These climatic conditions provide favorable circumstances for the occurrence of geological disasters, including landslides.
3. Method
Landslide risk assessment involved two key components: susceptibility assessment and vulnerability assessment. During the landslide susceptibility assessment stage, the primary focus was on identifying the main factors contributing to landslide hazards, including topographic, geological, and meteorological factors. Building upon the susceptibility assessment, further consideration was given to the potential impact on the elements at risk when a landslide event occurs, referred to as vulnerability assessment. These two assessments were combined to comprehensively assess the overall landslide risk.
Figure 2 illustrates the dynamic assessment process for assessing landslide hazard risk at photovoltaic power plants under extreme rainfall conditions. Firstly, the assessment factors for landslide susceptibility were determined based on the characteristics of typical landslides in the power plants area. These factors were then extracted at the mapping unit level to establish an assessment index database. Secondly, the landslide susceptibility assessment was conducted using the analytic network process–fuzzy Bayesian network (ANP-FBN) method and the susceptibility assessment index system. Subsequently, the susceptibility of the photovoltaic plant power plants was assessed by selecting assessment factors related to population, economy, and materials, and utilizing the analytic hierarchy process (AHP) method. Finally, the local rainfall thresholds were determined using an empirical rainfall threshold model. These thresholds were then used to assign values to rainfall maps for each time point within the assessment period. By multiplying the assigned rainfall zoning maps with the risk zoning of the study area, dynamic landslide risk zoning maps could be generated for different time periods. This enabled the dynamic assessment of landslide hazard risk under extreme rainfall conditions at the photovoltaic plant power plants.
3.1. Landslide Susceptibility Assessment Index System
Using the results of the engineering geological survey in the study area, 10 factors were selected from four aspects, including topography and geomorphology, stratigraphic lithology, hydro-meteorology and human engineering activities, combined with DEM (the digital elevation model), remote sensing images and land use data. Landslide susceptibility assessment was carried out based on these factors, and the specific information on each index (Table 1) and the classification zones (Figure 3) are shown below.
3.2. Calculation of Factor Weights Using ANP
The analytic network process (ANP) is an advanced decision-making method that builds upon the foundation of the analytic hierarchy process (AHP). ANP offers an advantage over AHP by accounting for the interdependencies among factors through the construction of a network of relationships. This enhancement addresses the limitation of AHP, which fails to capture the mutual influences between elements. A standard ANP structure comprises a control layer and a network layer, and Figure 4 depicts the network hierarchy model established for this study.
Utilizing the network hierarchical model structure depicted in Figure 4, the weights of the indicators belonging to the criterion layer and the network layer in the index system of landslide susceptibility assessment were computed. By multiplying these weights, the comprehensive weights were derived, as presented in Table 2.
3.3. Building Fuzzy Bayesian Networks
Although ANP addresses the limitation of AHP by considering the mutual influence among elements, it still inherits some of the drawbacks associated with AHP, such as subjectivity and unsuitability for constructing complex index systems or providing improvement recommendations. To overcome these limitations, this study introduced fuzzy mathematical theory and Bayesian networks to develop an assessment method that combines statistical and machine learning models. This method retained the simplicity and efficiency of the network hierarchical analysis while incorporating the advantages of the Bayesian network approach. Additionally, it reduced the calculation of conditional probabilities within the network, leading to significant improvements in computational speed. The proposed approach not only provided training samples for Bayesian networks but also enhanced the objectivity and practicality of the assessment process [39].
A Bayesian network is a probabilistic model that captures uncertain causal relationships based on Bayes’ theorem. It comprises a directed acyclic graph structure that represents the causal connections between nodes. Each node corresponds to a random variable, and the directed edges connecting the nodes depict the causal relationships between these variables. The node at the starting point of an edge is referred to as the parent, while the node at the endpoint is the child. Each node incorporates a conditional probability, which quantifies the strength of the causal relationship between the variable it represents and its parent node. Equation (1) presents the formula used to calculate the conditional probability.
where is the probability of occurrence of event A under the condition of occurrence of event B; P(B) is the total probability of occurrence of event B; and P(A) is the total probability of occurrence of event A.
No parent node represents the state of the variables with prior probability, and in the traditional Bayesian network, there is a shortage of the prior probability of each node commonly used to describe the exact value. To address this limitation, fuzzy theory is employed to convert the initial data of the nodes into probability values in a more reasonable manner. Fuzzy theory offers various membership functions, including triangular, trapezoidal, and normal membership functions. Among these, the triangular membership function (Figure 5) is adopted in this study due to its simplicity and reasonable partitioning properties. Consequently, a fuzzy subset (Equation (2)) corresponding to the susceptibility level is constructed using the triangular membership function. Subsequently, the normalized index values are substituted into the fuzzy function to determine the prior probabilities of the relevant nodes.
After analyzing the feedback and dependency relationships among the nodes, the global weights obtained from ANP were utilized to conduct an initial assessment of landslide susceptibility. The assessment outcomes were then employed to establish a training set and a test set through a ten-fold cross-validation method. Figure 6 displays the trained Bayesian network, where the different ranks of each factor represent the favorable degree of a single factor on landslide formation, and the values corresponding to the different ranks represent the corresponding prior probabilities and conditional probabilities.
The assessment indexes represented by parentless nodes in the fuzzy Bayesian network were normalized using ArcGIS, providing the assessment index parameters for each assessment unit. Utilizing the previously constructed triangular fuzzy affiliation function (Equation (2)), the affiliation degree of each indicator of the assessment unit was calculated for different rank intervals, and then converted into probabilities. Subsequently, the prior probability of input fuzzy Bayes for each assessment unit was determined and substituted into the trained Bayesian network, resulting in the probability distribution of landslide susceptibility for each assessment unit. To thoroughly evaluate the rationality and accuracy of the Bayesian network, ten-fold cross-validation and receiver operating characteristic (ROC) analysis were conducted. The Bayesian model exhibiting the highest assessment accuracy was selected to carry out the landslide susceptibility zoning of the study area.
3.4. Selection of Landslide Hazard Vulnerability Assessment Factors
The assessment of landslide hazard vulnerability is heavily influenced by the selection of assessment indicators. In this study, appropriate indicators were chosen for quantitative assessment, taking into account the obtained data and the most probable landslide damage in the study area. The indicators were selected from three categories of characteristics, namely population, economy, and material, in order to establish a comprehensive landslide vulnerability assessment index system (Figure 7).
3.4.1. Economic Vulnerability Factors
The study area is proposed for the development of a 1 million kW photovoltaic power plant and as a plateau landscape integration economic zone. A key objective of disaster prevention and mitigation for photovoltaic power plants, particularly since it serves as the starting point of the central channel for west–east power transmission, is to ensure the stability of power generation capacity. Hence, the focus should be on assessing the potential loss of power generation capacity resulting from the occurrence of disasters.
During the construction and operation of photovoltaic power plants, the orientation of slopes plays a significant role in determining the amount of solar radiation received by the photovoltaic power plants. Additionally, in terms of time, the duration needed for repairing photovoltaic power plants damaged by landslides is a crucial factor directly linked to power generation losses. Therefore, this study defines power generation loss (PGL) as:
In Equation (3), k is the slope direction coefficient, and the slope direction is reassigned through the raster reclassification tool in ArcGIS software, with its assignment corresponding to Table 3. L is the distance of the photovoltaic power plant damaged by a landslide that needs to be repaired from the site road, while v is the repair response speed.
Furthermore, the occurrence of disasters is commonly accompanied by substantial damage to buildings and the environment. Therefore, this study incorporates two additional assessment indices, namely the construction price and the environmental treatment cost, into the assessment of capacity loss.
3.4.2. Population Vulnerability Factors
Population vulnerability refers to the potential risk of causing harm or casualties to individuals residing in the study area during the occurrence of geological disasters. Considering the specific characteristics of the study area, this paper identifies population distribution as a crucial assessment index for assessing population vulnerability.
3.4.3. Physical Vulnerability Factors
The material vulnerability index represents the ability of the elements at risk in the study area to withstand or recover from landslide hazards. In this paper, the quantification of the material vulnerability index is accomplished using an expert scoring method based on land use zoning.
3.5. Calculating Landslide Vulnerability Using AHP
In view of the relative independence of each factor in the previously established assessment index system of landslide vulnerability, this study proposes using analytic hierarchy process (AHP) to calculate the weights of each assessment index.
First, the hierarchical model of landslide susceptibility assessment is constructed based on the landslide susceptibility assessment index system (Figure 8).
Second, construction of the judgment matrix is a critical step in the AHP method. To mitigate subjectivity, the judgment matrix is derived by fitting the data of the landslide vulnerability assessment index system in the study area and incorporating the opinions of domain experts in landslides. In this process, in order to ensure transparency and avoid conflicts of interest, five domain experts were selected with extensive experience and qualifications in landslide research. In terms of sharing their opinions, a structured questionnaire was used to gather their insights. The questionnaire was designed to elicit detailed responses related to landslide vulnerability factors and their importance. (Here is the link to the questionnaire: https://www.wjx.cn/vm/e0QFKyT.aspx# (accessed on 23 May 2023)).
Meanwhile, the elements within the judgment matrix underwent a consistency test and demonstrated a reasonable structure. The results of the consistency test for the AHP judgment matrix are presented in Table 4, serving as the basis for calculating the comprehensive weights (Table 5).
Finally, calculation of landslide vulnerability results based on weights involves the utilization of the raster calculator tool in the ArcGIS software. The comprehensive weights, as presented in Table 5, are applied to each factor, resulting in the generation of landslide vulnerability assessment outcomes for the study area.
3.6. Determination of Rainfall Thresholds
Empirical rainfall threshold models are mainly used to determine landslide triggering or non-triggering states. The current commonly used rainfall-based landslide warning models are mainly: ① intensity–duration of rainfall (I–D) [40]; ② cumulative–duration of rainfall (E–D) [41]; ③ cumulative–intensity of rainfall (E–I); and ④the mean annual precipitation (MAP) or other parameters for specification of thresholds [42]. One of the advantages of the I–D rainfall threshold curve is its applicability and simplicity, and its expression is as follows:
where I is the intensity of rainfall; D is the duration of rainfall accumulation; and a and b are I–D rainfall threshold model coefficients, c ≥ 0.
In this study, using the data disclosed in the rainfall threshold analysis of landslides in Sichuan Province carried out by Shen et al. [43], the rainfall threshold ephemeral analysis of 56 landslides was carried out through the hourly rainfall intensity data of the occurrence of previous disasters. Figure 9 presents the fitting results based on the hourly rainfall criteria, and Equation (5) represents the I–D threshold equation corresponding to various probabilities of landslide occurrence. The equation is expressed as follows:
3.7. Dynamic Assessment Model Based on Coupling Risk Zoning and Rainfall Thresholds
To facilitate the dynamic assessment of rainfall-based landslide risk in the study area, a classification system for rainfall thresholds based on the probability of landslide occurrence was proposed. The classification consisted of five grades: very low (A1), low (A2), moderate (A3), high (A4), and very high (A5). The cumulative rainfall value, denoted as E, associated with each grade can be determined using Equation (5).
The rainfall maps at each time point in the proposed assessment period are assigned according to the zoning probabilities in Table 6. Subsequently, these rainfall maps are multiplied by the risk mapping of the study area, resulting in landslide risk zoning maps at different times. This comprehensive process effectively achieves the dynamic assessment of landslide hazard risk in the study area.
4. Results and Discussion
4.1. Landslide Susceptibility Zoning of Photovoltaic Power Plants
By training and testing the fuzzy Bayesian network established in the previous section, the corresponding confusion matrix is obtained, and the statistical parameter metrics of each model in the ten-fold cross-validation process are calculated. The reasonableness and accuracy of the fuzzy Bayesian network are analyzed in detail based on these parameters.
Table 7 shows the resulting values of the 10-fold cross-validation parameters of the Bayesian network susceptibility assessment model. As can be seen from the table, the prediction accuracy of the trained fuzzy Bayesian network under different susceptibility classes has obvious variability. Combined with the area of susceptibility partitioning, it is easy to see that the prediction accuracy shows a decreasing trend as the percentage of susceptibility classes increases. Nevertheless, during the 10-fold cross-validation process, each grade zoning achieved a prediction accuracy higher than 70.1%, with some even exceeding 88.5% in terms of AUC values. Additionally, both accuracy validation parameters exhibited small standard deviations, indicating that the ANP-fuzzy Bayesian network developed in this study demonstrates improved prediction accuracy and robustness.
The training model with the highest prediction accuracy in the ten-fold cross-validation was utilized to generate the mapping of landslide susceptibility zones within the study area, as depicted in Figure 10. Analysis of Figure 10 reveals that the majority of the landslide susceptibility zones in the photovoltaic power plant construction area fall below the moderate level. However, the areas with very high and high susceptibility are predominantly situated in the southeastern valley area and seasonal river area near the construction power plants. In the southeastern valley area, characterized by steep slopes ranging from 30–60°, the loose soil surface is highly susceptible to deformation under adverse conditions like earthquakes or heavy rainfall. Furthermore, the south-facing slope orientation in this region exposes the soil to prolonged sunlight, leading to permafrost thawing and sinking, thereby creating favorable conditions for landslide formation. Along the seasonal rivers, the slopes experience an increase in inclination due to river undercutting, resulting in shallow groundwater depths. Moreover, the catchment surface and the continuous scouring and erosion by surface water flow during rainfall contribute to the occurrence of small-scale slumping disasters in the river valley’s vicinity.
In conclusion, while the likelihood of landslides around photovoltaic power plants is low, it is crucial to acknowledge the importance of implementing suitable engineering measures to address adverse geological conditions before undertaking the construction of photovoltaic plants and their associated facilities in the southeastern valley and seasonal river areas.
The confusion matrix of landslide susceptibility assessment results in the study area was utilized to generate a receiver operating characteristic curve (ROC) for each susceptibility class sub-area, as shown in Figure 11. The area under the curve (AUC) was calculated to assess the accuracy of the landslide susceptibility prediction. Figure 11 illustrates that the AUC values for each susceptibility class exceed 0.85, indicating the ANP-FBN approach yields highly accurate susceptibility prediction results. This outcome establishes a robust basis for the subsequent dynamic assessment of landslide risk.
4.2. Landslide Vulnerability Zoning of Photovoltaic Power Plants
The vulnerability map of photovoltaic power plants in the study area, as shown in Figure 12, was obtained based on the landslide vulnerability calculation process described in Section 3.1. The figure reveals distinct regional variations in vulnerability: (a) areas lacking human modifications, such as grassland, bare land, and woodland, exhibit “very low” and “low” vulnerability. This is attributed to the homogeneity of elements in these areas, resulting in fewer elements susceptible to destruction by disasters and consequently lower vulnerability grades compared to human-engineered areas. (b) Within areas with human structures, the photovoltaic booster station in the northwest corner, densely populated central area, and photovoltaic panel construction area in the east exhibit a high vulnerability class. These regions contribute significantly to the three assessment factors of construction cost, population distribution, and power generation loss. Consequently, they demand focused attention in disaster prevention and control efforts.
4.3. Dynamic Zoning of Photovoltaic Site Risk with Coupled Extreme Rainfall
Using the probability distribution curve of 24 h maximum accumulated rainfall in Sichuan Province (Figure 13), extreme rainfall conditions were established for the photovoltaic power plants by selecting the 1-day accumulated maximum rainfall extremes of 182 mm and 135 mm, corresponding to recurrence periods of 50 years and 10 years, respectively (Figure 14).
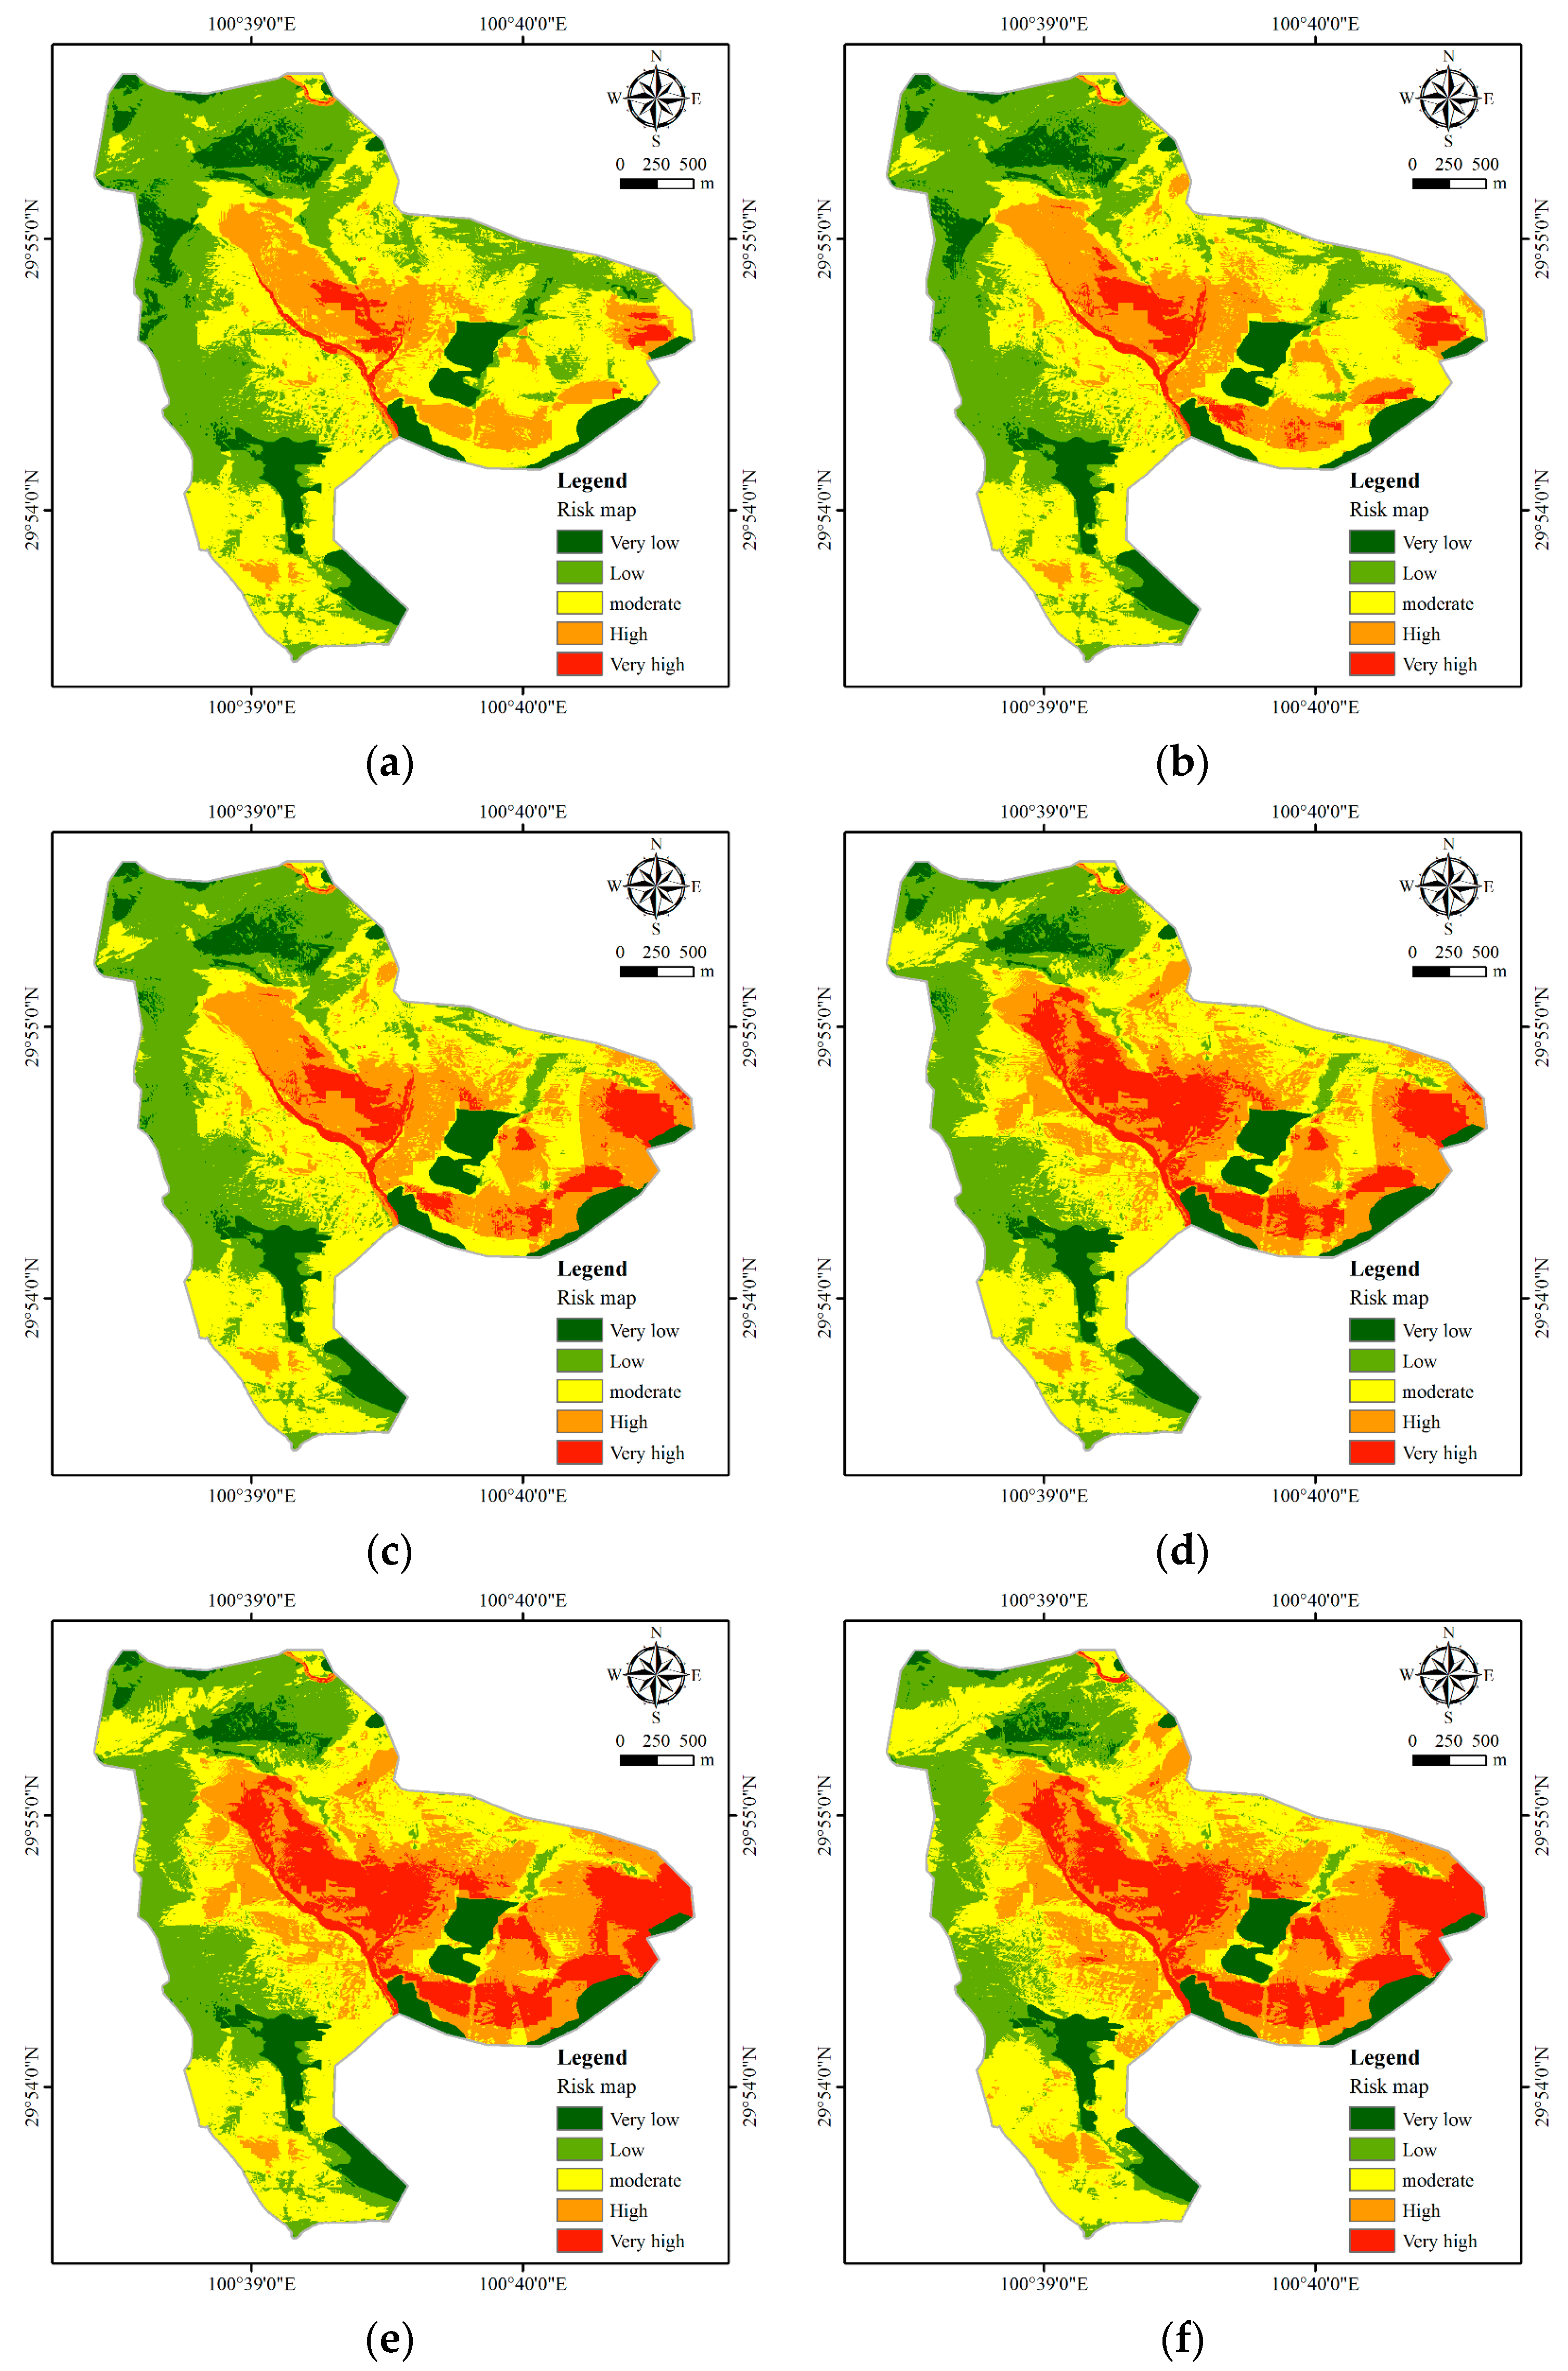
The accumulated rainfall at each time point during extreme rainfall conditions is converted into probability values using the zoning probabilities provided in Table 6, considering a time interval of 1 day. The resulting rainfall probability map is overlaid with the risk zoning of the study area, resulting in the dynamic zoning of landslide risk under extreme rainfall conditions, as illustrated in Figure 15.
The analysis of Figure 15 reveals that prior to the onset of rainfall, the overall landslide risk level in the study area was low. The majority of the areas exhibited a “moderate” or “low” landslide risk level, while only a limited number of areas demonstrated a “high” and “very high” risk classification, mainly concentrated in the central valley and eastern steep slope regions. However, as the extreme rainfall commenced and the duration of accumulated rainfall increased, the extent of areas categorized as “high” and “very high” risk gradually expanded. This expansion encompassed the slopes flanking the river valley and extended throughout the eastern area.
Table 8 provides a comprehensive comparison and analysis of the landslide risk assessment results at different time points during extreme rainfall conditions. The table clearly illustrates that the extent of “high” and “very high” risk areas expands as the duration of rainfall accumulation increases. Specifically, the area classified as “high” risk rises from 13.50% prior to the rainfall to 24.48% upon its culmination. Similarly, the area designated as “very high” risk surges from 2.39% before the rainfall to 15.58% at its conclusion. These findings indicate a sudden escalation in landslide risk within the photovoltaic power plants due to the impact of extreme rainfall.
Based on the above analysis, and combined with the local natural environment and the actual construction of photovoltaic power plants, the authors put forward some targeted disaster prevention and mitigation recommendations, as follows: (1) focused monitoring is required for the central valley and eastern steep slope areas of the photovoltaic power plants, which are “very high” risk areas, and disaster risk inspections of these areas are conducted several times during the rainfall period, with a view to carrying out appropriate de-risking treatments before a disaster occurs. (2) Where conditions permit, emergency material storage nodes should be set up in advance in the study area, and research on emergency material storage management should be carried out to set up optimal paths for the transfer of personnel and the transportation of materials. The shortest possible time should be used to transfer injured personnel and repair damaged facilities after a disaster occurs, and emergency plans should be used to minimize losses. (3) The photovoltaic power plants construction department should cooperate with the disaster management department to establish a number of disaster monitoring stations in disaster-prone areas, and formulate targeted disaster prevention and management plans according to the specific conditions of the disaster-bearing body. They should also improve the protection programs for photovoltaic power modules, ancillary buildings, roads and other facilities within the site to improve disaster prevention capabilities and reduce the vulnerability of disaster-bearing bodies.
5. Conclusions
This paper takes a large-scale photovoltaic power plant as the research object. On the basis of the evaluation results of landslide susceptibility and vulnerability of photovoltaic power plants, combined with the local empirical rainfall threshold model, and using the daily updated rainfall data as the dynamic index, the dynamic risk evaluation model of landslide disaster of photovoltaic power plants is constructed, and the following conclusions are obtained:
- (1)
- In the evaluation results of landslide disaster susceptibility obtained by using the ANP-FBN combined model, the AUC value of each grade zoning is higher than 88.5%, and the standard deviation is less than 0.01. This shows that the method has good accuracy and robustness and can reduce the negative influence of subjective factors on the evaluation results to a certain extent.
- (2)
- Considering the unique attributes of engineering construction in large photovoltaic power plants, novel quantitative indicators are introduced to assess economic vulnerability, specifically focusing on power generation loss. By integrating the vulnerability of population and material characteristics, a comprehensive and objective assessment index system for assessing the vulnerability of large photovoltaic power plants is constructed in a rational and systematic manner.
- (3)
- During the dynamic assessment of landslide hazards, as the duration of rainfall increases, the percentage of the area of “high and higher” risk zones grows from 15.89% before the rainfall to 40.06% at the end of the rainfall. The areas of “high” and “very high” risk are predominantly concentrated in the central valley and the eastern steep slopes. It is imperative to prioritize landslide prevention and monitoring efforts in these specific areas.
- (4)
- In this study, due to the subjectivity of the AHP method, the assessment results of the vulnerability of photovoltaic sites are easily affected by subjective errors, and there are shortcomings such as using only the rainfall intensity–duration threshold (I–D) as a discriminating criterion for the probability of landslide occurrence. Subsequently, multiple evaluation methods were used with rainfall threshold curves to carry out the dynamic risk assessment of landslides, and we selected the most accurate and reasonable evaluation methods by comparing the evaluation results.
Author Contributions
Conceptualization, R.L. and S.H.; methodology, H.D.; validation, S.H.; Formal analysis, R.L.; Data curation, R.L. and S.H.; writing—original draft preparation, R.L. and S.H.; writing—review and editing, H.D.; visualization, R.L. and S.H.; All authors have read and agreed to the published version of the manuscript.
Funding
This research was funded by the Science and Technology Project of Huadong Engineering Corporation Limited, Power China (2023022701).
Data Availability Statement
Not applicable.
Conflicts of Interest
The authors declare no conflict of interest.
References
- Maletta, R.; Mendicino, G. A methodological approach to assess the territorial vulnerability in terms of people and road characteristics. Georisk Assess. Manag. Risk Eng. Syst. Geohazards 2022, 16, 301–314. [Google Scholar] [CrossRef]
- Zhang, S.; Zhang, L.M. Human vulnerability to quick shallow landslides along road: Fleeing process and modeling. Landslides 2014, 11, 1115–1129. [Google Scholar] [CrossRef]
- Eidsvig, U.M.; McLean, A.; Vangelsten, B.V.; Kalsnes, B.; Ciurean, R.L.; Argyroudis, S.; Winter, M.G.; Mavrouli, O.C.; Fotopoulou, S.; Pitilakis, K. Assessment of socioeconomic vulnerability to landslides using an indicator-based approach: Methodology and case studies. B. Eng. Geol. Environ. 2014, 73, 307–324. [Google Scholar] [CrossRef]
- Hearn, G.J.; Pongpanya, P. Developing a landslide vulnerability assessment for the national road network in Laos. Q. J. Eng. Geol. Hydroge. 2021, 54, qjegh2020-110. [Google Scholar] [CrossRef]
- Chen, X.; Zhang, L.; Chen, L.; Li, X.; Liu, D. Slope stability analysis based on the Coupled Eulerian-Lagrangian finite element method. B. Eng. Geol. Environ. 2019, 78, 4451–4463. [Google Scholar] [CrossRef]
- Wang, H.J.; Xiao, T.; Li, X.Y.; Zhang, L.L.; Zhang, L.M. A novel physically-based model for updating landslide susceptibility. Eng. Geol. 2019, 251, 71–80. [Google Scholar] [CrossRef]
- An, H.; Viet, T.T.; Lee, G.; Kim, Y.; Kim, M.; Noh, S.; Noh, J. Development of time-variant landslide-prediction software considering three-dimensional subsurface unsaturated flow. Environ. Modell. Softw. 2016, 85, 172–183. [Google Scholar] [CrossRef]
- Zhang, K.; Xue, X.; Hong, Y.; Gourley, J.J.; Lu, N.; Wan, Z.; Hong, Z.; Wooten, R. iCRESTRIGRS: A coupled modeling system for cascading flood–landslide disaster forecasting. Hydrol. Earth Syst. Sci. 2016, 20, 5035–5048. [Google Scholar] [CrossRef] [Green Version]
- Shen, P.; Zhang, L.; Chen, H.; Fan, R. EDDA 2.0: Integrated simulation of debris flow initiation and dynamics considering two initiation mechanisms. Geosci. Model Dev. 2018, 11, 2841–2856. [Google Scholar] [CrossRef] [Green Version]
- Chen, H.X.; Zhang, L.M. EDDA 1.0: Integrated simulation of debris flow erosion, deposition and property changes. Geosci. Model Dev. 2015, 8, 829–844. [Google Scholar] [CrossRef] [Green Version]
- Onyelowe, K.C.; Sujatha, E.R.; Aneke, F.I.; Ebid, A.M. Solving geophysical flow problems in Luxembourg: SPH constitutive review. Cogent Eng. 2022, 9, 2122158. [Google Scholar] [CrossRef]
- Mehmood, E.; Rashid, I.; Ahmed, F.; Farooq, K.; Tufail, A.; Ebid, A.M. Hydrogeotechnical Predictive Approach for Rockfall Mountain Hazard Using Elastic Modulus and Peak Shear Stress at Soil–Rock Interface in Dry and Wet Phases at KKH Pakistan. Sustainability 2022, 14, 16740. [Google Scholar] [CrossRef]
- Sharma, S.; Mahajan, A.K. A comparative assessment of information value, frequency ratio and analytical hierarchy process models for landslide susceptibility mapping of a Himalayan watershed, India. Bull. Eng. Geol. Environ. 2018, 78, 2431–2448. [Google Scholar] [CrossRef]
- Chen, W.; Li, W.; Chai, H.; Hou, E.; Li, X.; Ding, X. GIS-based landslide susceptibility mapping using analytical hierarchy process (AHP) and certainty factor (CF) models for the Baozhong region of Baoji City, China. Environ. Earth Sci. 2015, 75, 63. [Google Scholar] [CrossRef]
- Kadi, F.; Yildirim, F.; Saralioglu, E. Risk analysis of forest roads using landslide susceptibility maps and generation of the optimum forest road route: A case study in Macka, Turkey. Geocarto Int. 2021, 36, 1612–1629. [Google Scholar] [CrossRef]
- Chen, W.; Zhang, S. GIS-based comparative study of Bayes network, Hoeffding tree and logistic model tree for landslide susceptibility modeling. Catena 2021, 203, 105344. [Google Scholar] [CrossRef]
- Lee, S.; Lee, M.; Jung, H.; Lee, S. Landslide susceptibility mapping using Naïve Bayes and Bayesian network models in Umyeonsan, Korea. Geocarto Int. 2020, 35, 1665–1679. [Google Scholar] [CrossRef]
- Song, Y.; Gong, J.; Gao, S.; Wang, D.; Cui, T.; Li, Y.; Wei, B. Susceptibility assessment of earthquake-induced landslides using Bayesian network: A case study in Beichuan, China. Comput. Geosci. 2012, 42, 189–199. [Google Scholar] [CrossRef]
- Chen, W.; Pourghasemi, H.R.; Panahi, M.; Kornejady, A.; Wang, J.; Xie, X.; Cao, S. Spatial prediction of landslide susceptibility using an adaptive neuro-fuzzy inference system combined with frequency ratio, generalized additive model, and support vector machine techniques. Geomorphology 2017, 297, 69–85. [Google Scholar] [CrossRef]
- Marjanovi, M.; Kova Evi, M.; Ba Jat, B.; Enílek, V.V. Landslide susceptibility assessment using SVM machine learning algorithm. Eng. Geol. 2011, 123, 225–234. [Google Scholar] [CrossRef]
- Zhou, C.; Yin, K.; Cao, Y.; Ahmed, B.; Li, Y.; Catani, F.; Pourghasemi, H.R. Landslide susceptibility modeling applying machine learning methods: A case study from Longju in the Three Gorges Reservoir area, China. Comput. Geosci. 2018, 112, 23–37. [Google Scholar] [CrossRef] [Green Version]
- Bai, S.; Wang, J.; Lü, G.; Zhou, P.; Hou, S.; Xu, S. GIS-based logistic regression for landslide susceptibility mapping of the Zhongxian segment in the Three Gorges area, China. Geomorphology 2010, 115, 23–31. [Google Scholar] [CrossRef]
- Ayalew, L.; Yamagishi, H. The application of GIS-based logistic regression for landslide susceptibility mapping in the Kakuda-Yahiko Mountains, Central Japan. Geomorphology 2005, 65, 15–31. [Google Scholar] [CrossRef]
- Umar, Z.; Pradhan, B.; Ahmad, A.; Jebur, M.N.; Tehrany, M.S. Earthquake induced landslide susceptibility mapping using an integrated ensemble frequency ratio and logistic regression models in West Sumatera Province, Indonesia. Catena 2014, 118, 124–135. [Google Scholar] [CrossRef]
- Hong, H.; Pourghasemi, H.R.; Pourtaghi, Z.S. Landslide susceptibility assessment in Lianhua County (China): A comparison between a random forest data mining technique and bivariate and multivariate statistical models. Geomorphology 2016, 259, 105–118. [Google Scholar] [CrossRef]
- Chen, W.; Xie, X.; Peng, J.; Shahabi, H.; Hong, H.; Bui, D.T.; Duan, Z.; Li, S.; Zhu, A.X. GIS-based landslide susceptibility evaluation using a novel hybrid integration approach of bivariate statistical based random forest method. Catena Interdiscip. J. Soil Sci. Hydrol.-Geomorphol. Focus. Geoecology Landsc. Evol. 2018, 164, 135–149. [Google Scholar] [CrossRef]
- Kim, J.C.; Lee, S.; Jung, H.S.; Lee, S. Landslide susceptibility mapping using random forest and boosted tree models in Pyeong-Chang, Korea. Geocarto Int. 2018, 33, 1000–1015. [Google Scholar] [CrossRef]
- Pradhan, B.; Lee, S. Landslide susceptibility assessment and factor effect analysis: Backpropagation artificial neural networks and their comparison with frequency ratio and bivariate logistic regression modelling. Environ. Modell. Softw. 2010, 25, 747–759. [Google Scholar] [CrossRef]
- Pradhan, B.; Lee, S. Regional landslide susceptibility analysis using back-propagation neural network model at Cameron Highland, Malaysia. Landslides 2010, 7, 13–30. [Google Scholar] [CrossRef]
- Pradhan, B.; Lee, S.; Buchroithner, M.F. A GIS-based back-propagation neural network model and its cross-application and validation for landslide susceptibility analyses. Comput. Environ. Urban Syst. 2010, 34, 216–235. [Google Scholar] [CrossRef]
- Xu, K.; Guo, Q.; Li, Z.; Xiao, J.; Qin, Y.; Chen, D.; Kong, C. Landslide susceptibility evaluation based on BPNN and GIS: A case of Guojiaba in the Three Gorges Reservoir Area. Int. J. Geogr. Inf. Sci. 2015, 29, 1111–1124. [Google Scholar] [CrossRef]
- Dong, V.D.; Jaafari, A.; Bayat, M.; Gholami, D.M.; Pham, B.T. A spatially explicit deep learning neural network model for the prediction of landslide susceptibility. Catena 2020, 188, 104451. [Google Scholar]
- Lv, L.; Chen, T.; Dou, J.; Plaza, A. A hybrid ensemble-based deep-learning framework for landslide susceptibility mapping. Int. J. Appl. Earth Obs. 2022, 108, 102713. [Google Scholar] [CrossRef]
- Mandal, K.; Saha, S.; Mandal, S. Applying deep learning and benchmark machine learning algorithms for landslide susceptibility modelling in Rorachu river basin of Sikkim Himalaya, India. Geosci. Front. 2021, 12, 17. [Google Scholar] [CrossRef]
- Sameen, M.I.; Pradhan, B.; Lee, S. Application of convolutional neural networks featuring Bayesian optimization for landslide susceptibility assessment. Catena 2020, 186, 104249. [Google Scholar] [CrossRef]
- Ebid, A.M.; Onyelowe, K.C.; Arinze, E.E. Estimating the ultimate bearing capacity for strip footing near and within slopes using AI (GP, ANN, and EPR) techniques. J. Eng. 2021, 2021, 3267018. [Google Scholar] [CrossRef]
- Zhong, C.; Guo, H.; Swan, I.; Gao, P.; Yao, Q.; Li, H. Evaluating trends, profits, and risks of global cities in recent urban expansion for advancing sustainable development. Habitat Int. 2023, 138, 102869. [Google Scholar] [CrossRef]
- Mateos, R.M.; López-Vinielles, J.; Poyiadji, E.; Tsagkas, D.; Sheehy, M.; Hadjicharalambous, K.; Liscák, P.; Podolski, L.; Laskowicz, I.; Iadanza, C. Integration of landslide hazard into urban planning across Europe. Landsc. Urban Plan. 2020, 196, 103740. [Google Scholar] [CrossRef]
- Yan, C.L.; Zheng, D.F.; Nian, Y.K.; Wang, J.B.; Jiao, H.B.; Sun, S.H.; Yan, B.Y. Fuzzy Bayesian network model based on ANP and its application to coastal zone geohazard risk assessment. J. Eng. Geol. 2021, 29, 1862–1868. [Google Scholar]
- Caine, N. The rainfall intensity-duration control of shallow landslides and debris flows. Geogr. Ann. Ser. A Phys. Geogr. 1980, 62, 23–27. [Google Scholar]
- Zhao, B.; Dai, Q.; Han, D.; Dai, H.; Mao, J.; Zhuo, L. Probabilistic thresholds for landslides warning by integrating soil moisture conditions with rainfall thresholds. J. Hydrol. 2019, 574, 276–287. [Google Scholar] [CrossRef]
- Tien Bui, D.; Pradhan, B.; Lofman, O.; Revhaug, I.; Dick, Ø.B. Regional prediction of landslide hazard using probability analysis of intense rainfall in the Hoa Binh province, Vietnam. Nat. Hazards. 2013, 66, 707–730. [Google Scholar] [CrossRef]
- Shen, L.L.; Liu, L.Y.; Yang, W.T.; Xu, C.; Wang, J.P. Rainfall Threshold Analysis for the Initiation of Geological Disasters in Sichuan Province Based on TRMM Data. J. Catastrophology 2015, 30, 220–227. [Google Scholar]
Figure 1.
Location map of the study area.
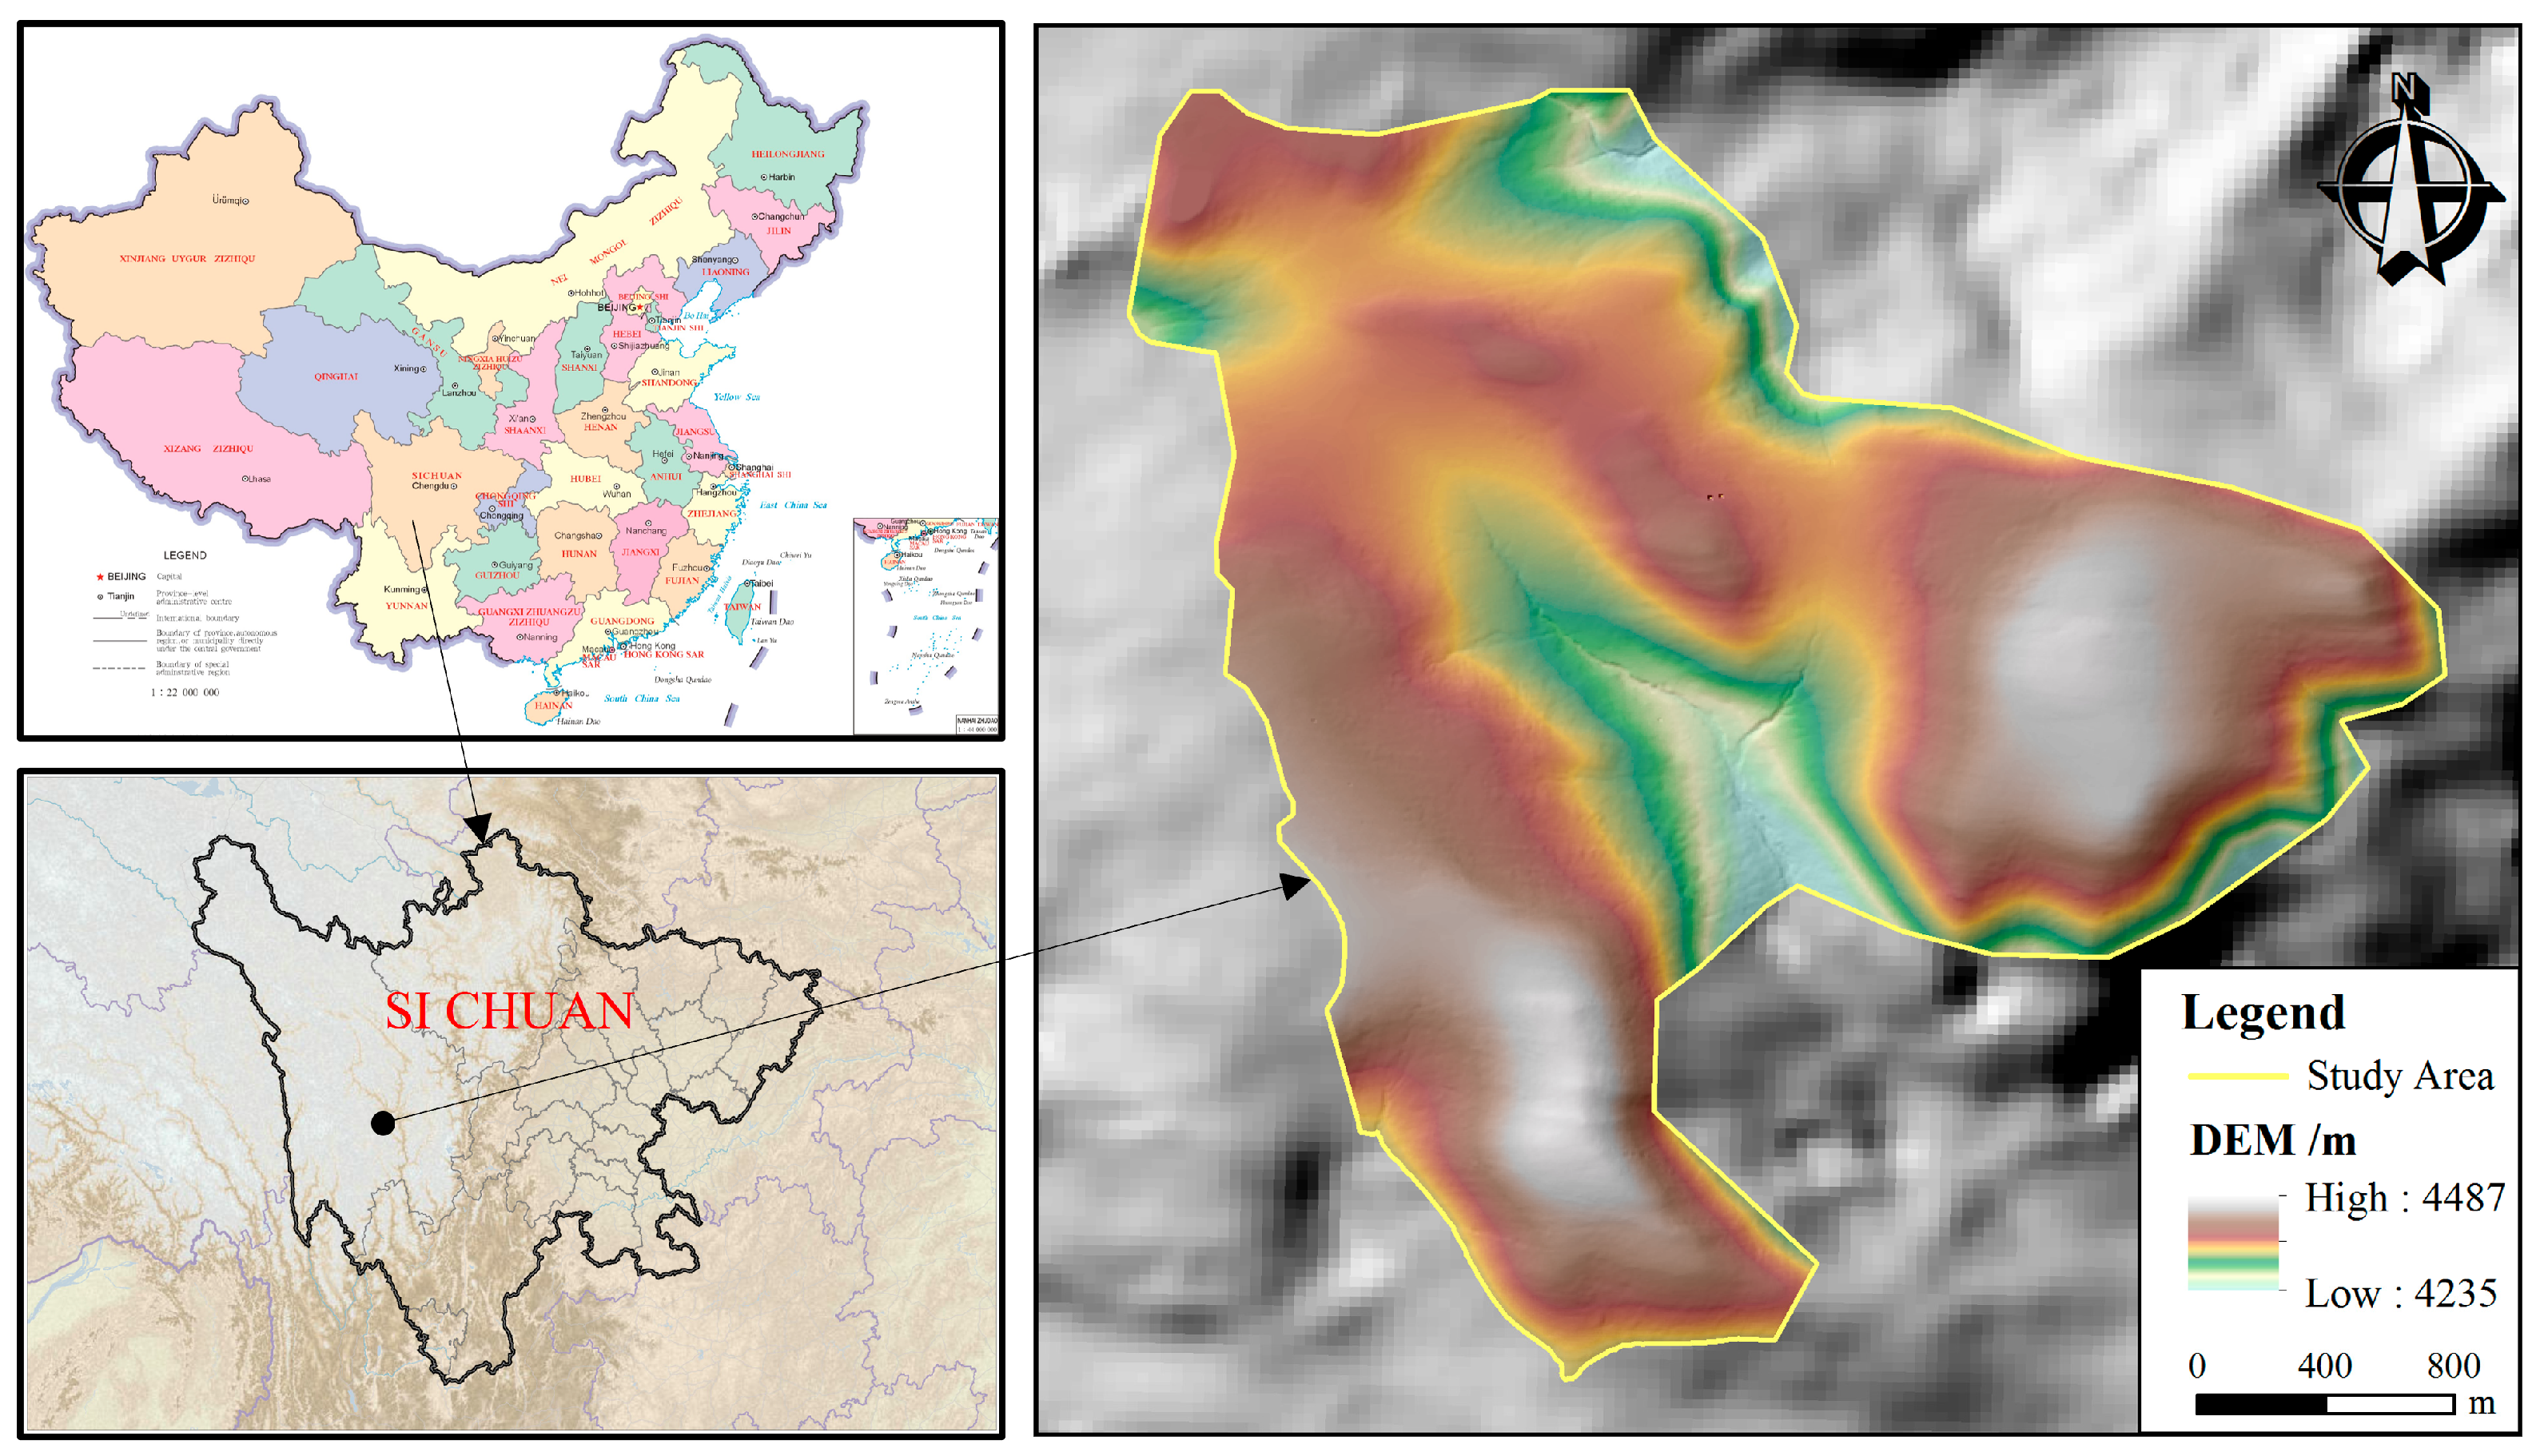
Figure 2.
The dynamic assessment process for assessing landslide hazard risk.

Figure 3.
Landslide susceptibility assessment factor maps. (a) Elevation; (b) slope angle; (c) slope direction; (d) lithology; (e) thickness of soil; (f) distance to fault; (g) rainfall; (h) TWI; (i) distance to river; (j) land use.
Figure 3.
Landslide susceptibility assessment factor maps. (a) Elevation; (b) slope angle; (c) slope direction; (d) lithology; (e) thickness of soil; (f) distance to fault; (g) rainfall; (h) TWI; (i) distance to river; (j) land use.
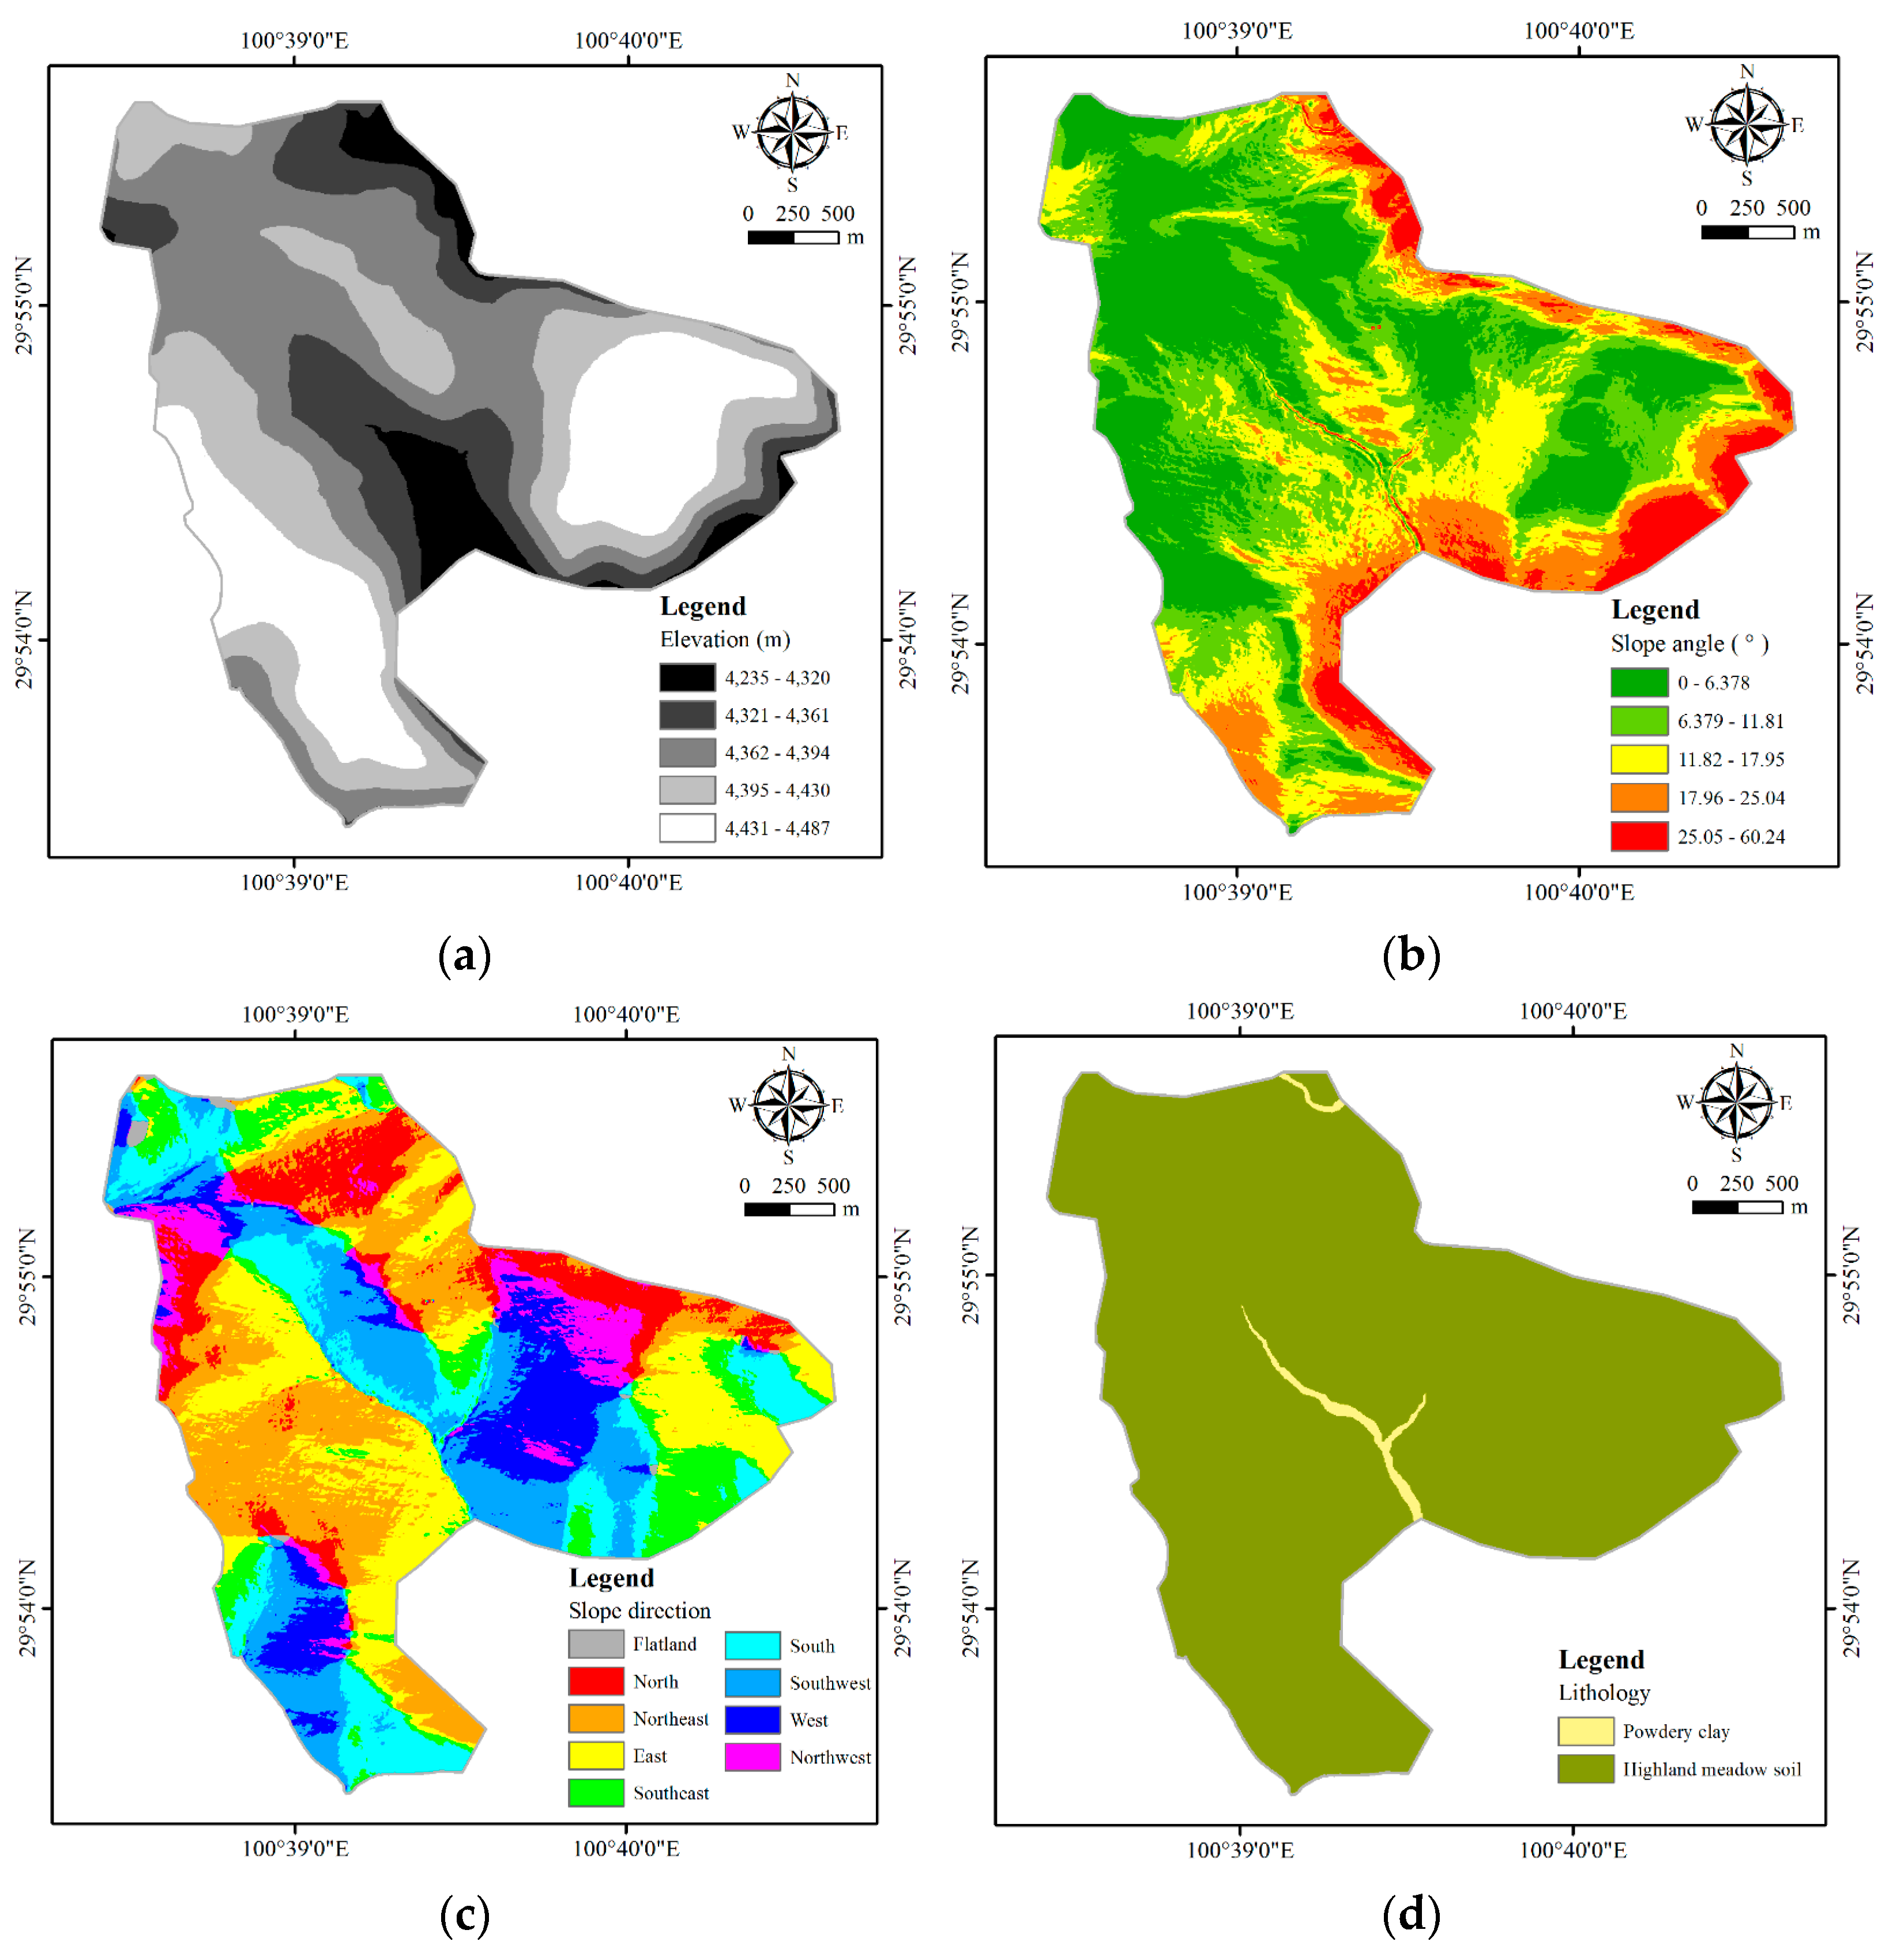

Figure 4.
Network hierarchy model based on the landslide susceptibility assessment index system.
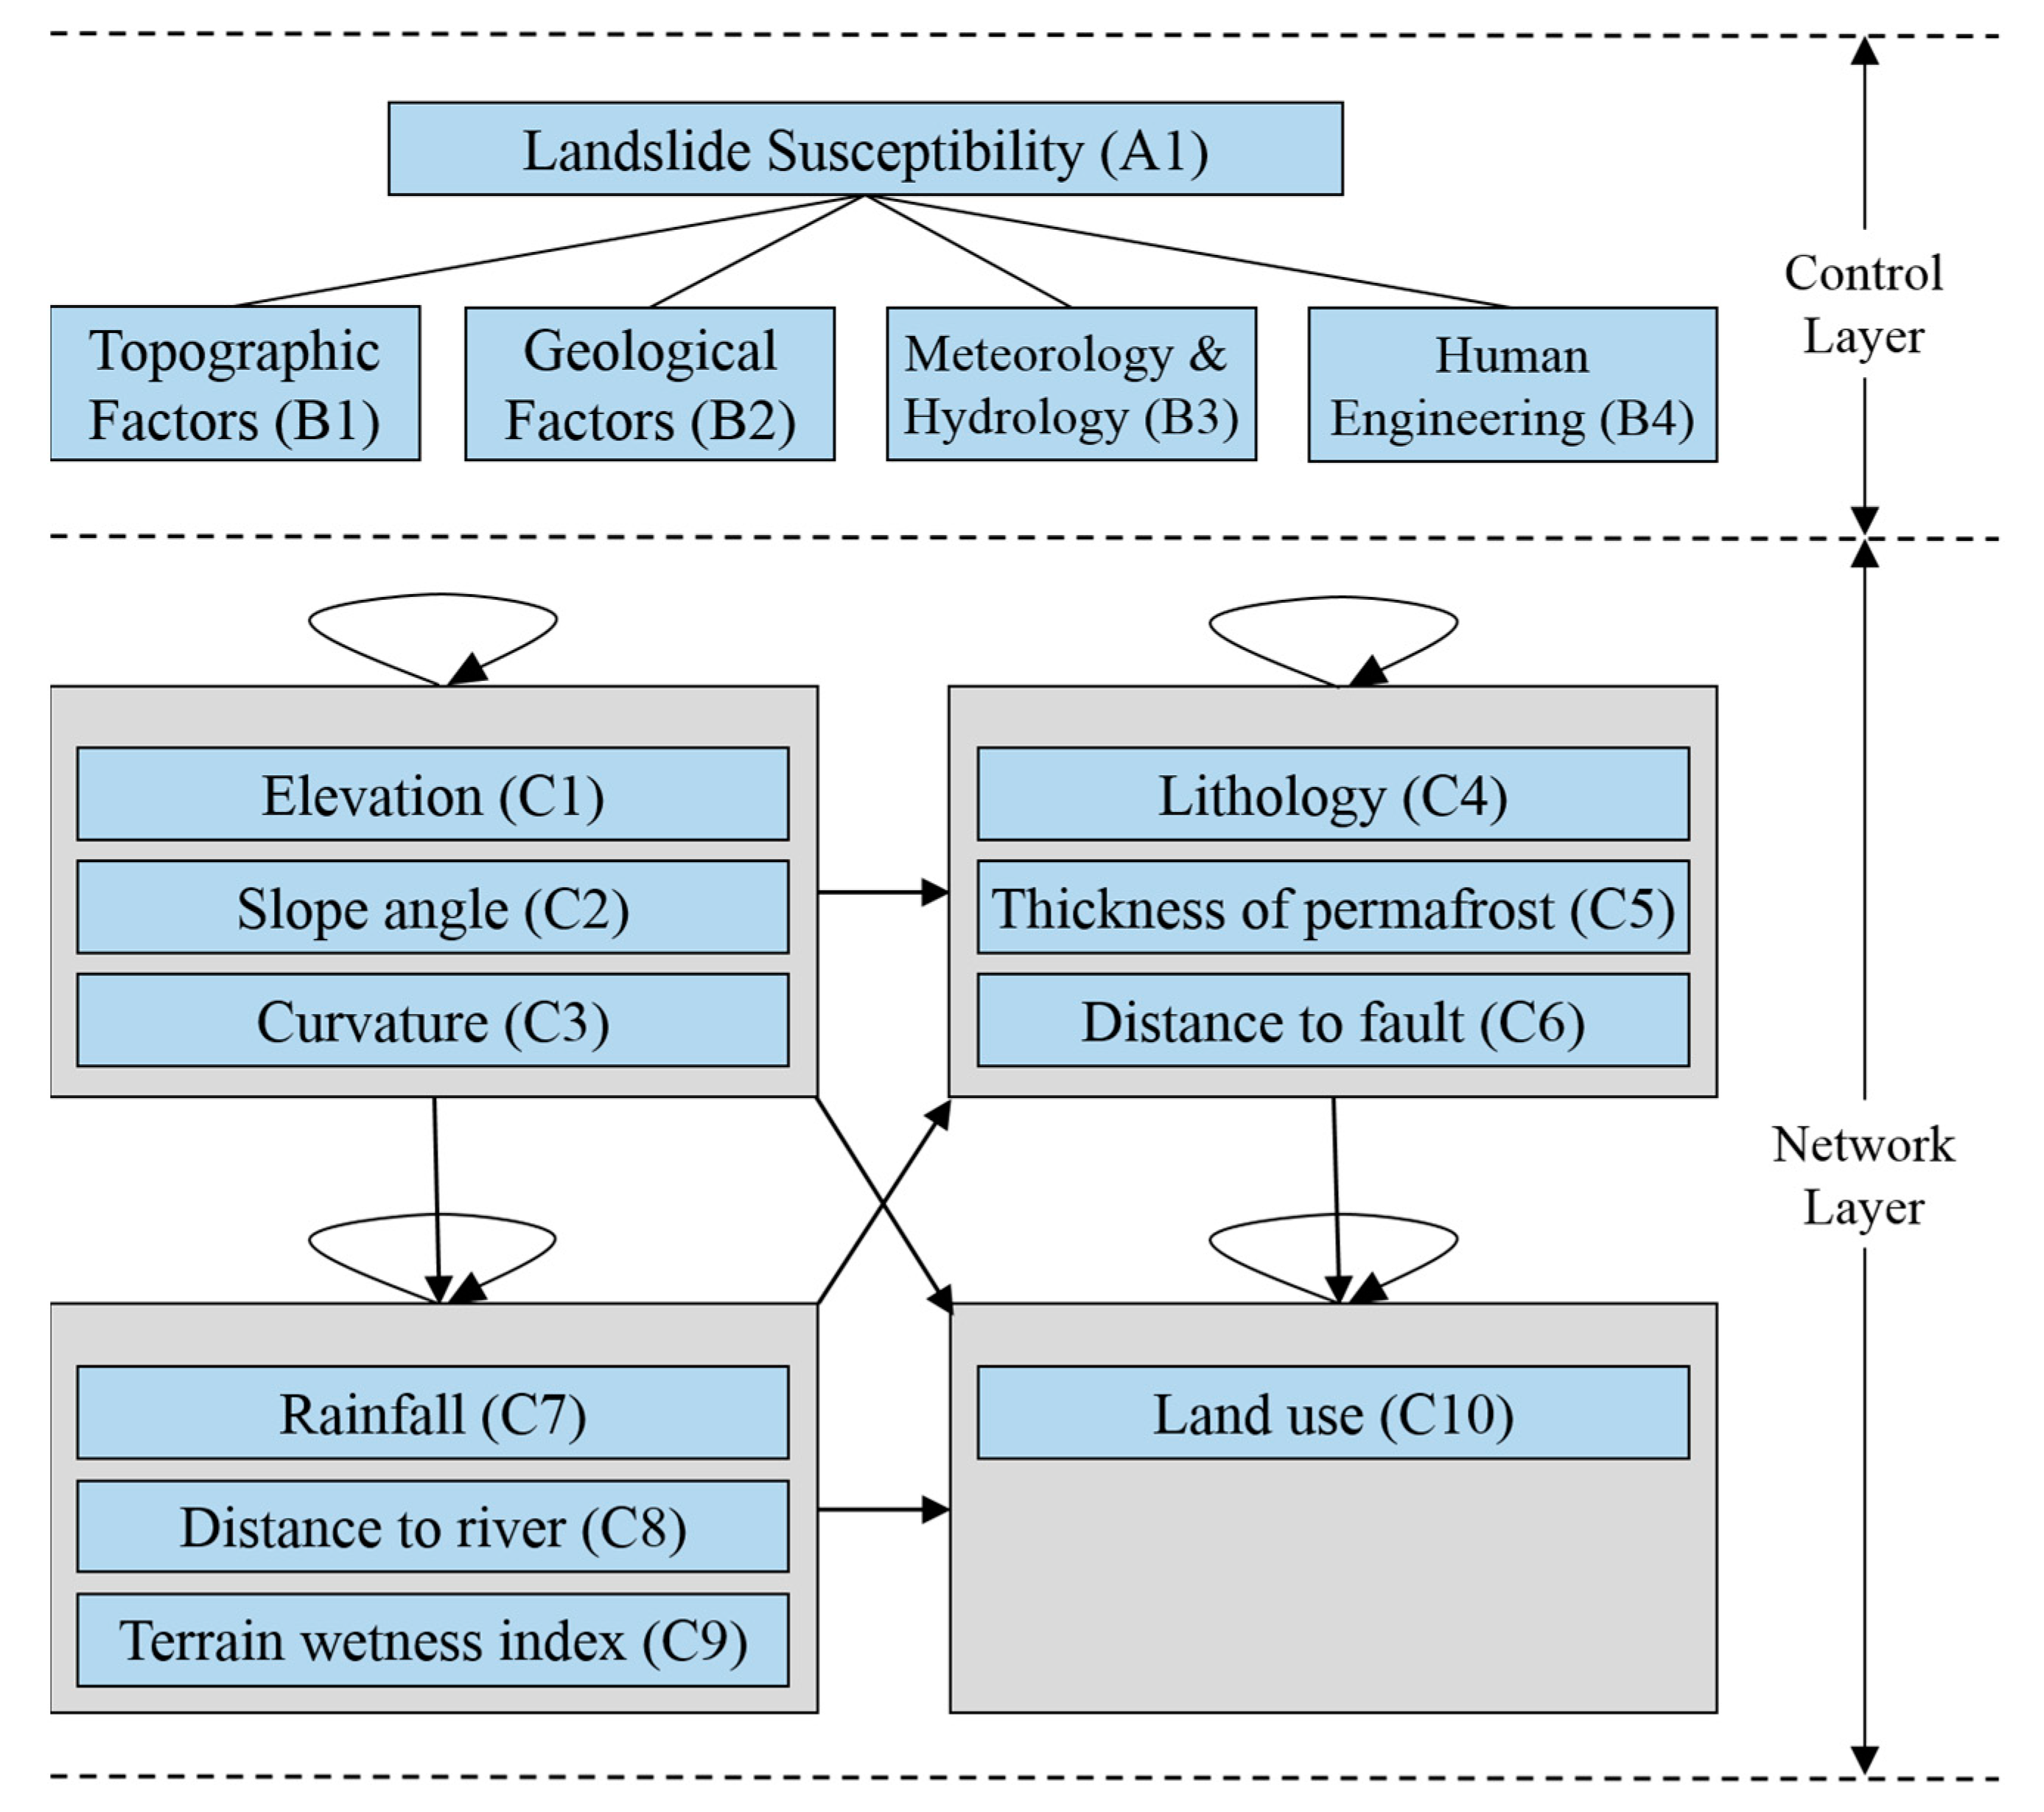
Figure 5.
Triangular membership function.

Figure 6.
Landslide susceptibility assessment using the Bayesian network model (training stage).
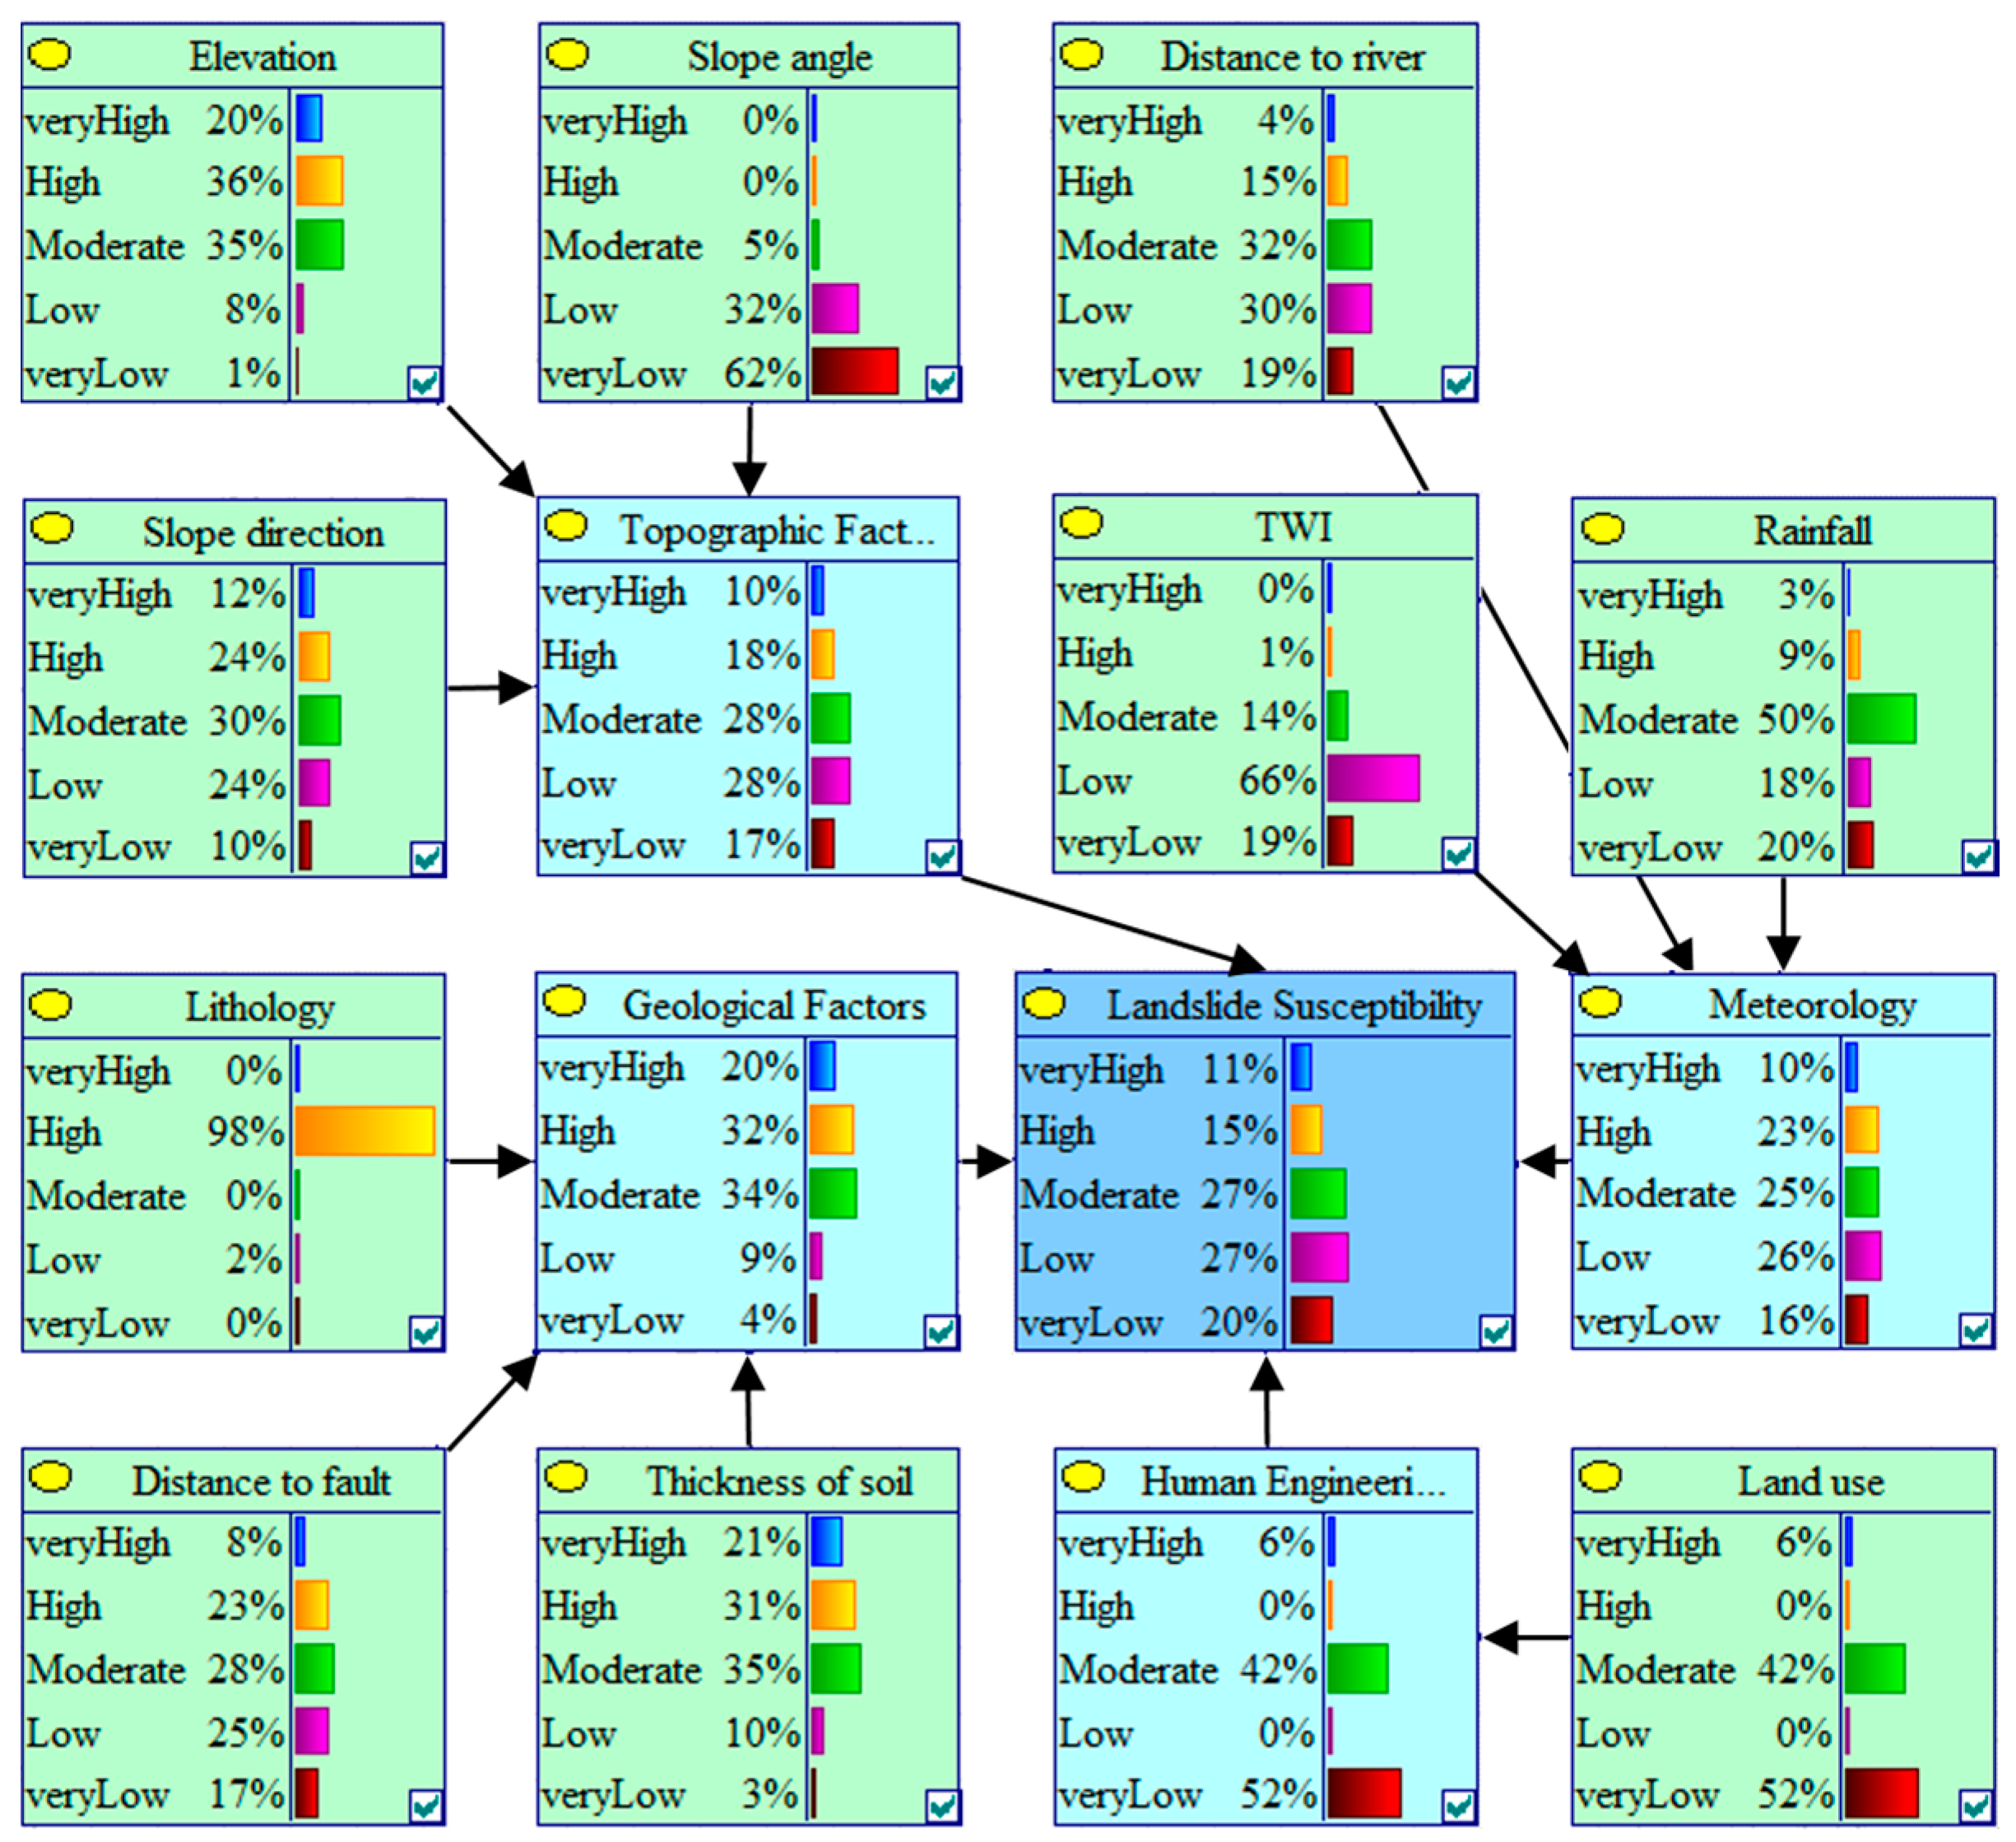
Figure 7.
Landslide vulnerability assessment factor map. (a) Population distribution; (b) power generation loss; (c) construction prices; (d) environmental treatment cost; (e) land use.
Figure 7.
Landslide vulnerability assessment factor map. (a) Population distribution; (b) power generation loss; (c) construction prices; (d) environmental treatment cost; (e) land use.


Figure 8.
Hierarchical structure of landslide vulnerability assessment.

Figure 9.
Rainfall intensity–duration (I–D) curve of landslide disasters in Sichuan Province.

Figure 10.
Landslide susceptibility map using the ANP-FBN model.

Figure 11.
ROC for each susceptibility class sub-area.

Figure 12.
Landslide vulnerability map using the AHP model.
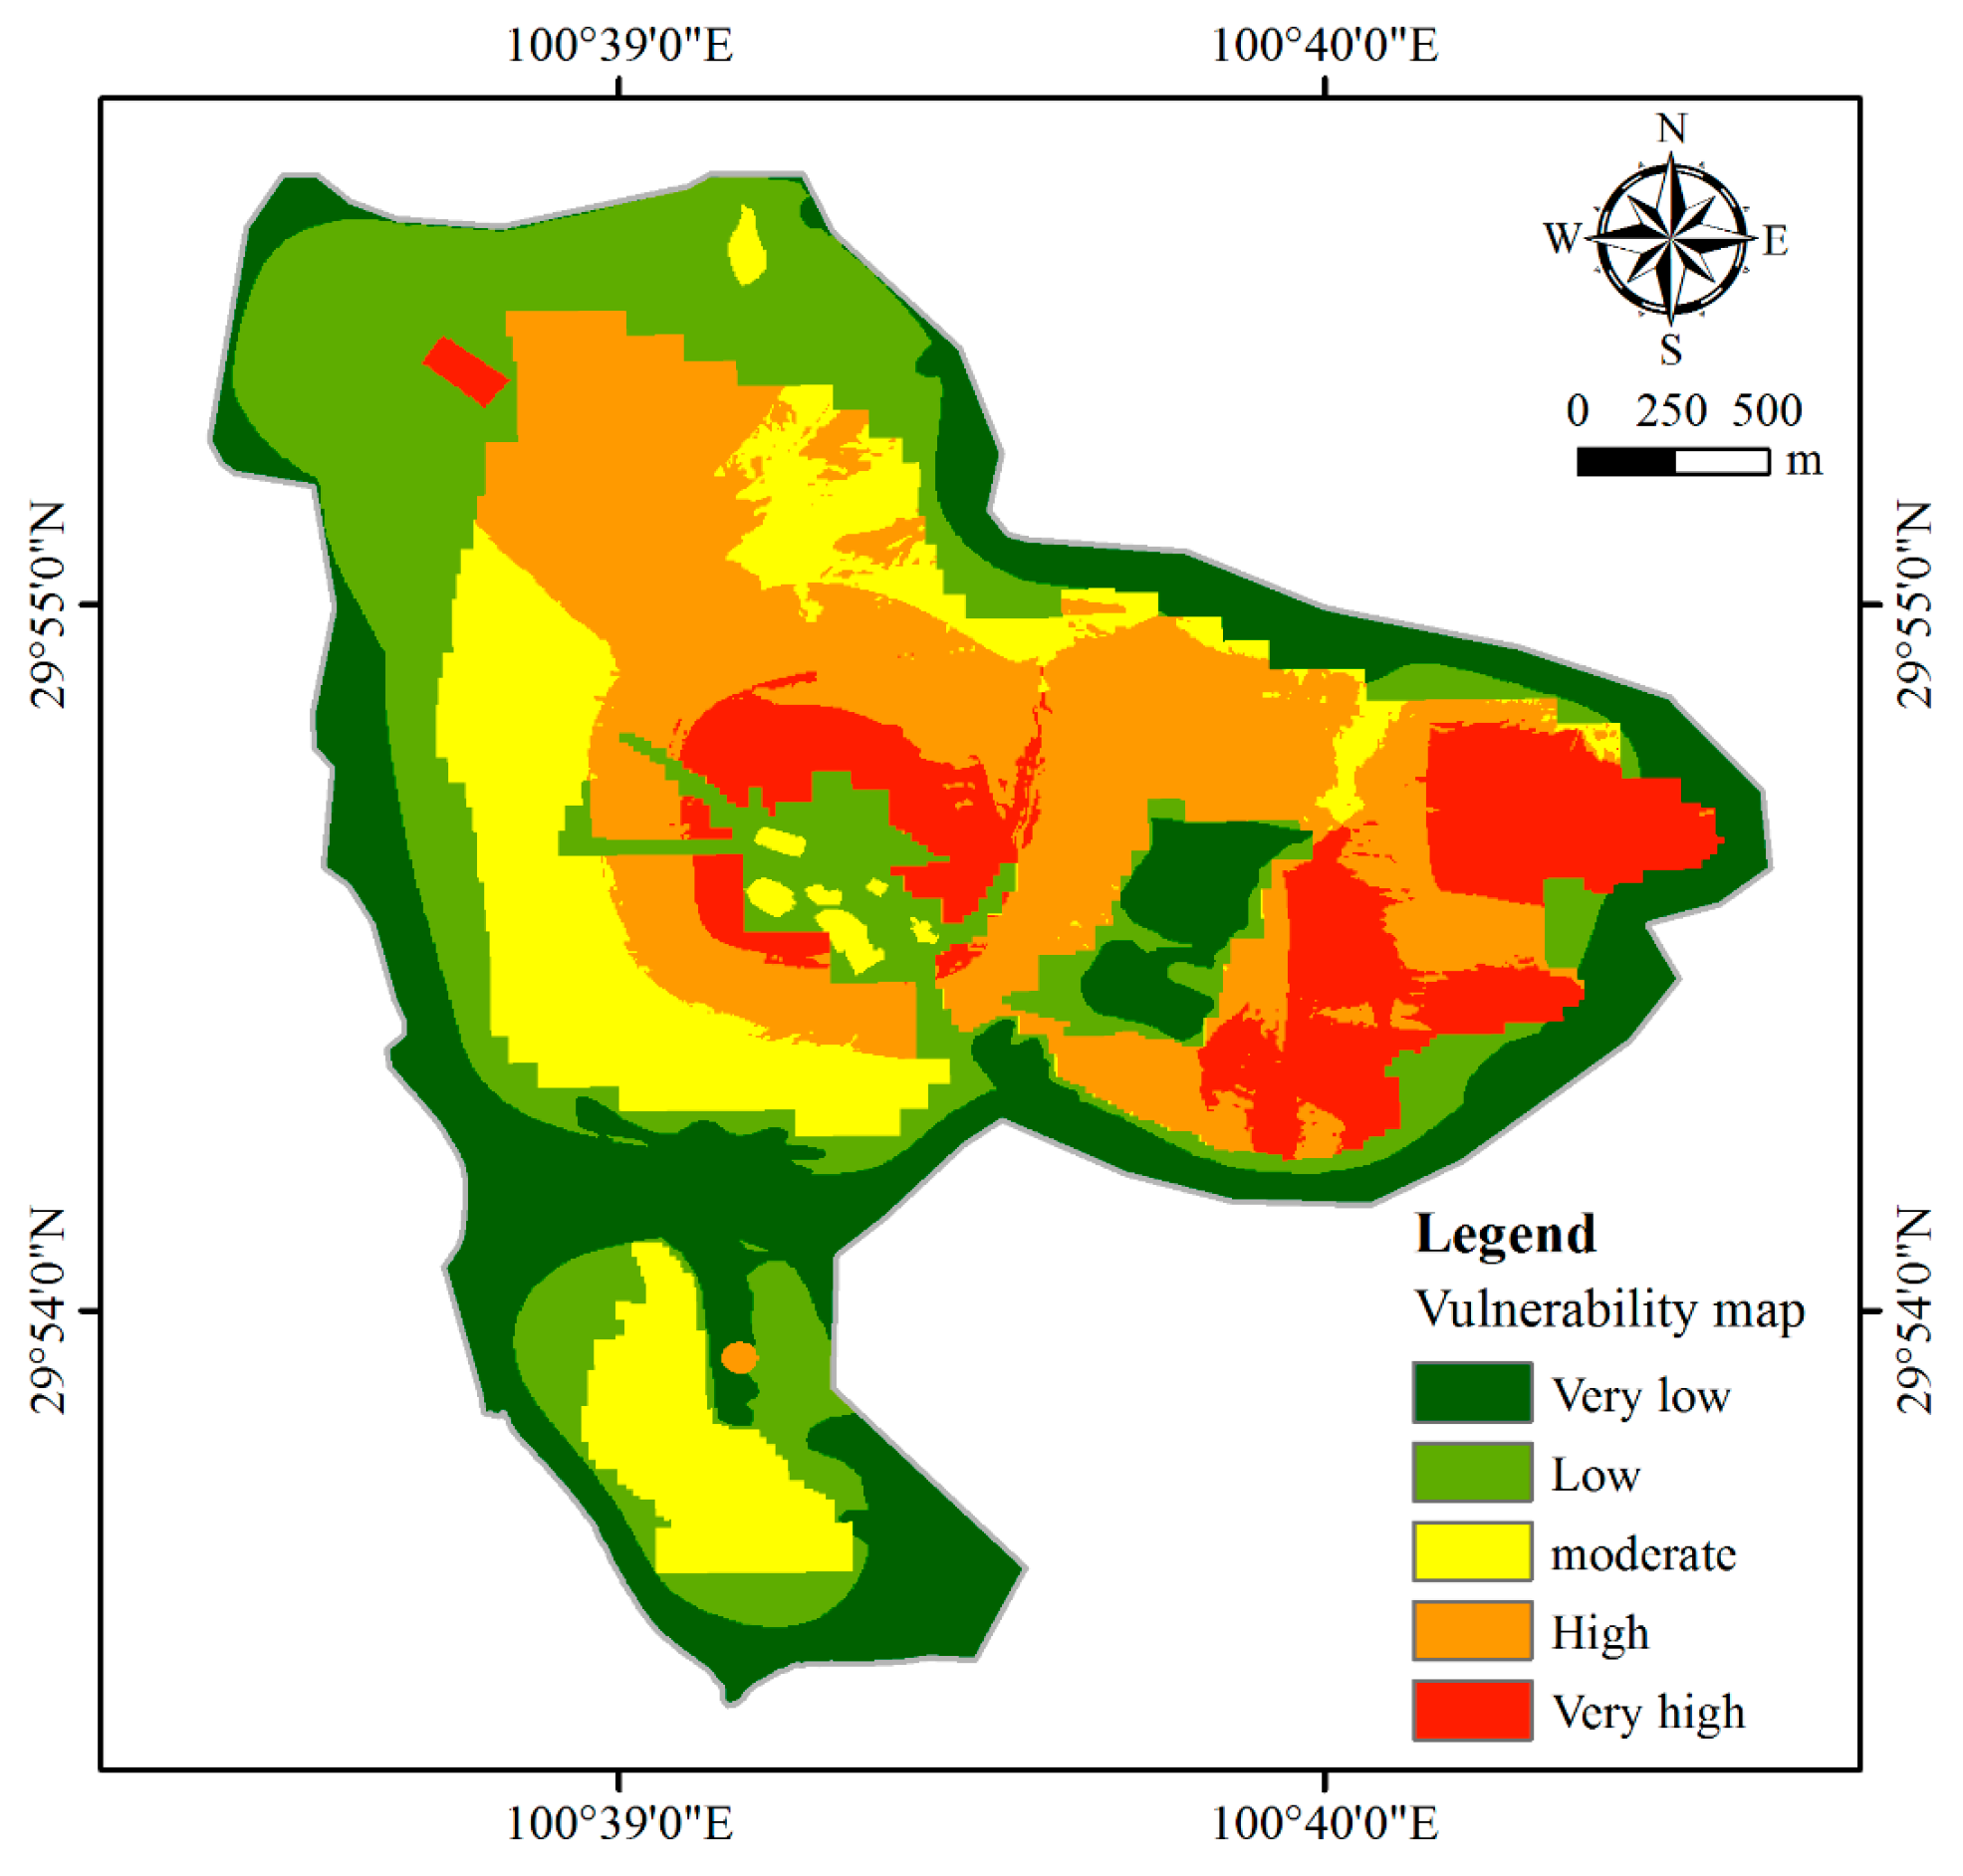
Figure 13.
Probability distribution curve of 1 d maximum cumulative rainfall in Sichuan.
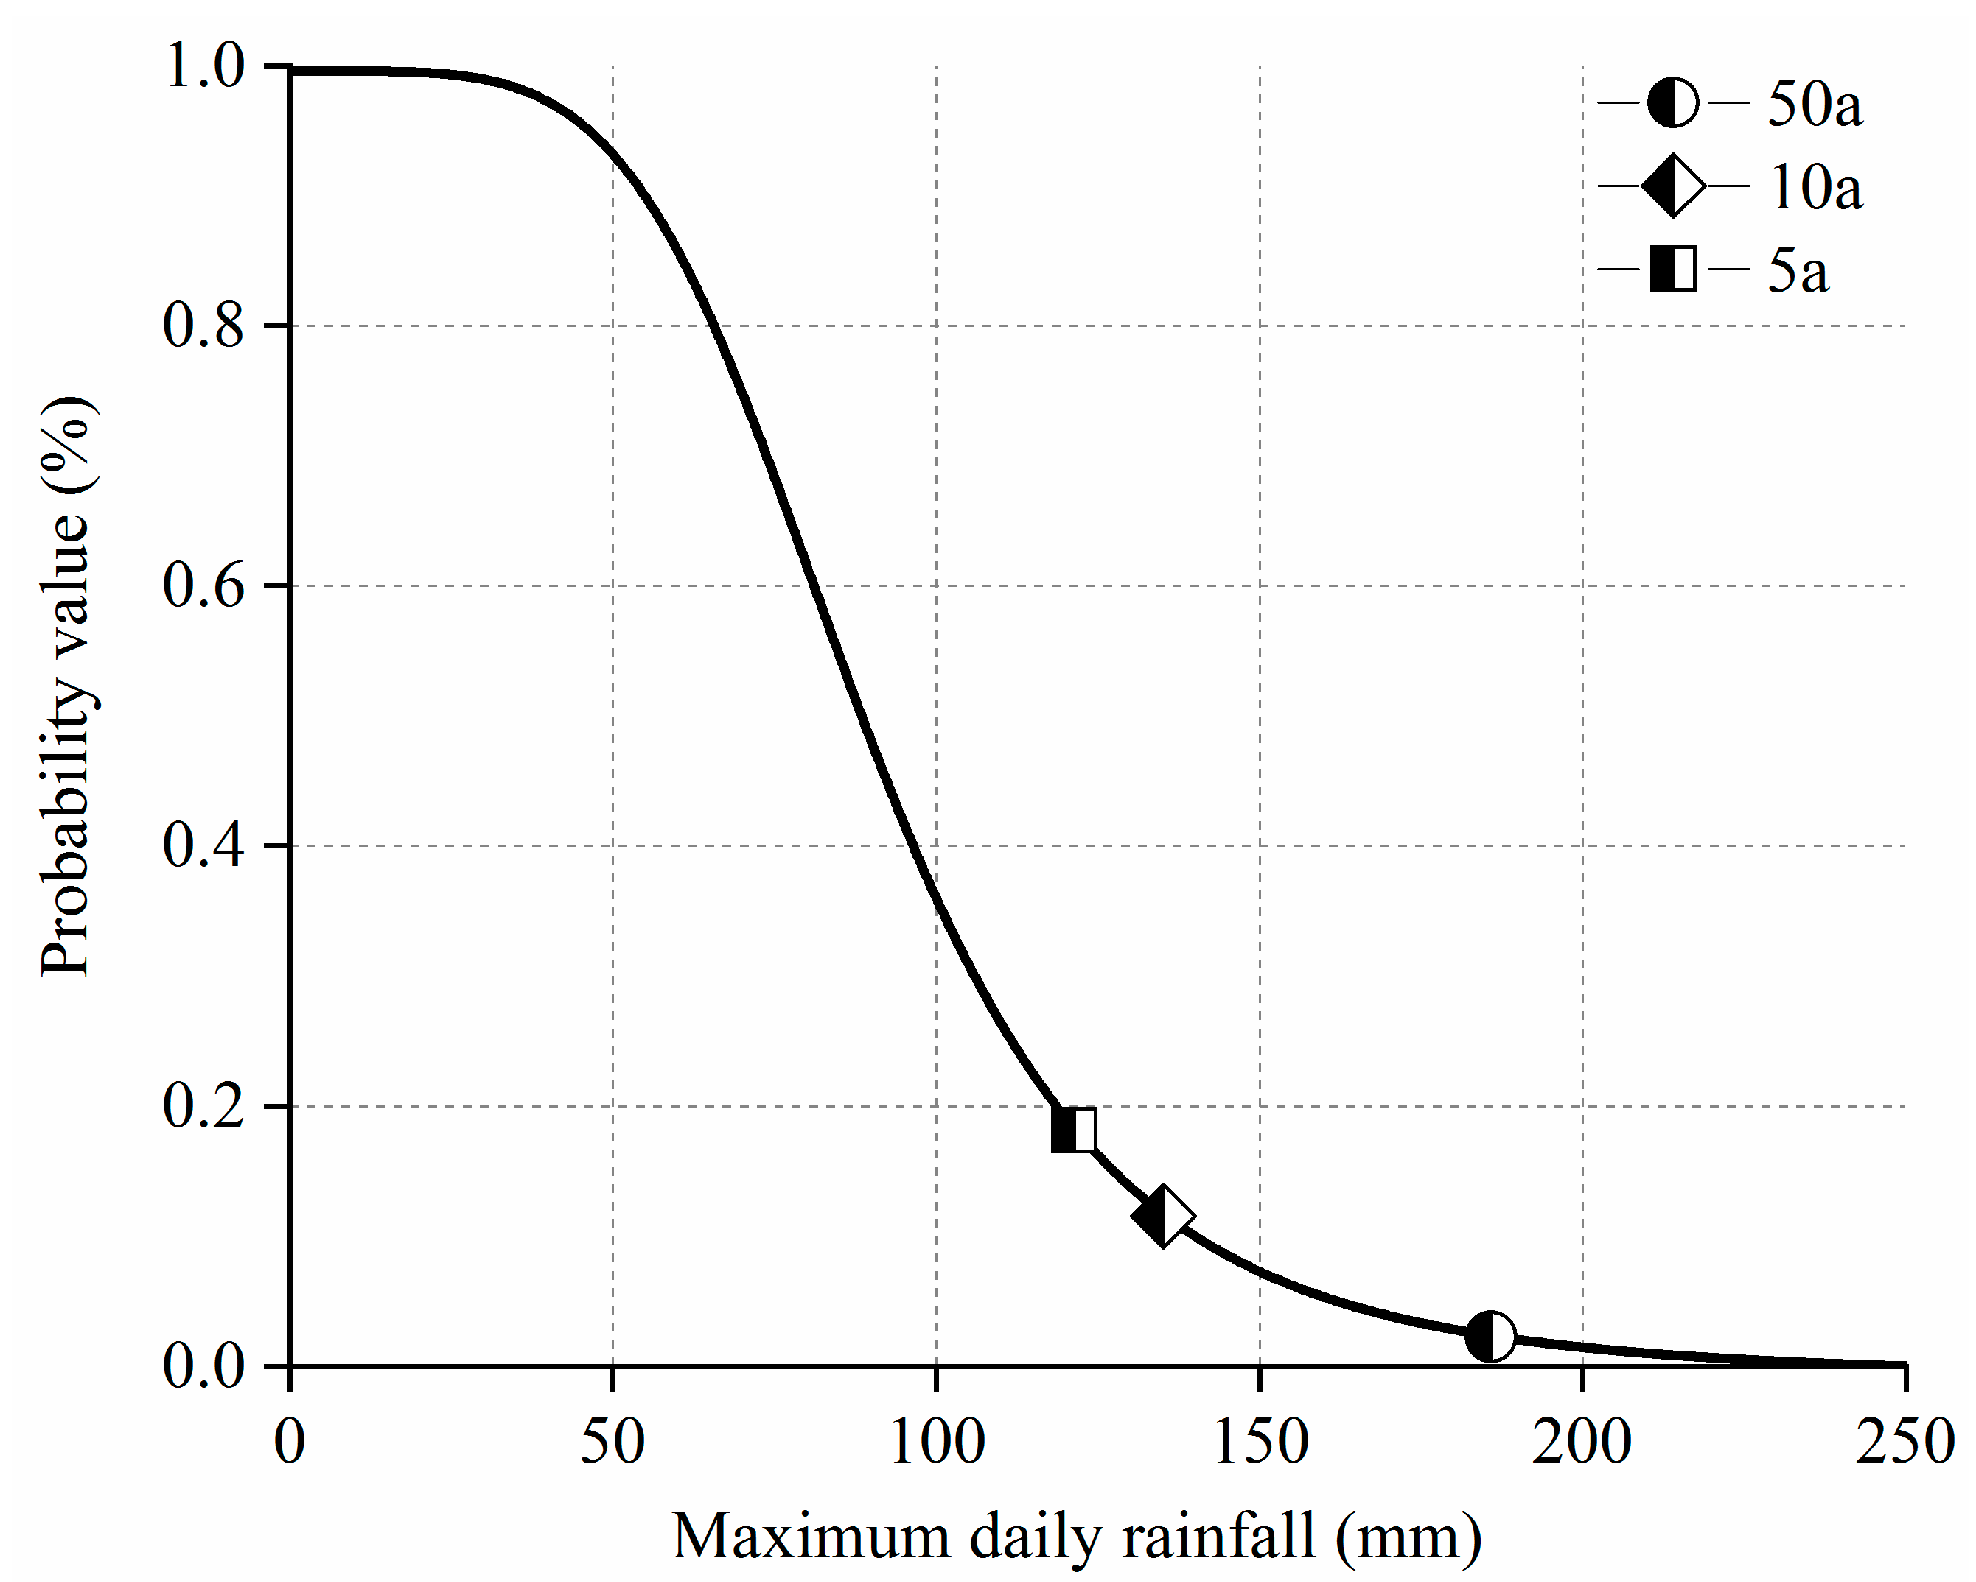
Figure 14.
I-D curve of extreme rainfall conditions.

Figure 15.
Landslide risk dynamic mapping. (a) Before rain; (b) 1 day after rain; (c) 2 days after rain; (d) 3 days after rain; (e) 4 days after rain; (f) 5 days after rain.
Figure 15.
Landslide risk dynamic mapping. (a) Before rain; (b) 1 day after rain; (c) 2 days after rain; (d) 3 days after rain; (e) 4 days after rain; (f) 5 days after rain.

Table 1.
Information on susceptibility assessment factors.
| Number | Condition Factor | Data Source | Variable Type | Method to Get the Value in the Slope Unit |
|---|---|---|---|---|
| C1 | Elevation | Digital Elevation Model (form the topographic contour map, 5 m) | Continues | Average value |
| C2 | Slope angle | Continues | Average value | |
| C3 | Slope direction | Continues | Average value | |
| C4 | Lithology | From the site engineering geological survey report | Categorical | Most frequent value |
| C5 | Thickness of soil | Continues | Minimum value | |
| C6 | Distance to fault | Geological survey map (1:50,000 scale) | Continues | Minimum value |
| C7 | Rainfall | Sichuan Meteorological Bureau | Continues | Average value |
| C8 | TWI | Digital Elevation Model | Continues | Average value |
| C9 | Distance to river | Google image (6 February 2021 date) | Continues | Average value |
| C10 | Land use | From the on-site mapping | Categorical | Most frequent value |
Note(s): TWI = Terrain Wetness Index.
Table 2.
Comprehensive weight acquired via the ANP.
| Criterion Layer | Criterion Layer Weight W1 | Network Layer | Network Layer Weight W2 | Comprehensive Weight W3 = W1 × W2 |
|---|---|---|---|---|
| B1 | 0.414 | C1 | 0.128 | 0.053 |
| C2 | 0.596 | 0.247 | ||
| C3 | 0.276 | 0.114 | ||
| B2 | 0.320 | C4 | 0.536 | 0.172 |
| C5 | 0.357 | 0.114 | ||
| C6 | 0.107 | 0.034 | ||
| B3 | 0.107 | C7 | 0.389 | 0.042 |
| C8 | 0.304 | 0.032 | ||
| C9 | 0.307 | 0.033 | ||
| B4 | 0.159 | C10 | 1.000 | 0.159 |
Table 3.
The value of the slope direction coefficient k.
| Slope Direction | South and Flatland | Southeast and Southwest | East and West | Northeast and Northwest | Northwest |
|---|---|---|---|---|---|
| Value | 9.0 | 6.0 | 5.0 | 2.0 | 1.0 |
Table 4.
The pairwise comparison matrix and factor weights.
| Pairwise Comparison Matrix | ||||
|---|---|---|---|---|
| Criterion and Index Layers | [1] | [2] | [3] | Weights |
| Criterion layer | ||||
| [1] Population vulnerability (B1) | 1 | 1/2 | 1 | 0.234 |
| [2] Economic vulnerability (B2) | 2 | 1 | 2 | 0.561 |
| [3] Material vulnerability (B3) | 1 | 1/2 | 1 | 0.205 |
| = 3.0000, CR = 0.0001 | ||||
| Index layer | ||||
| Economic vulnerability (B2) | ||||
| [1] construction prices (C2) | 1 | 1/3 | 1/2 | 0.286 |
| [2] power generation loss (C3) | 3 | 1 | 2 | 0.514 |
| [3] environmental treatment cost (C4) | 2 | 1/2 | 1 | 0.200 |
| = 3.0055, CR = 0.0028 | ||||
Table 5.
Comprehensive weight acquired via the AHP.
| Criterion Layer | Criterion Layer Weight W1 | Index Layer | Index layer Weight W2 | Comprehensive Weight W3 = W1 × W2 |
|---|---|---|---|---|
| B1 | 0.234 | C1 | 1.000 | 0.234 |
| B2 | 0.561 | C2 | 0.286 | 0.161 |
| C3 | 0.514 | 0.288 | ||
| C4 | 0.200 | 0.112 | ||
| B3 | 0.205 | C5 | 1.000 | 0.205 |
Table 6.
Classification of critical rainfall threshold.
| Grades | A1 | A2 | A3 | A4 | A5 |
|---|---|---|---|---|---|
| Probability of landslide P | ≤10% | 10~30% | 30~50% | 50~80% | ≥80% |
| Intensity of rainfall I (mm/d) | 1.52 | 2.28 | 55.0 | 80.8 | 189.7 |
| Cumulative rainfall E (mm) | 71.29 | 107.17 | 257.84 | 378.21 | 889.44 |
Table 7.
The result of ACC and AUC for 10-fold cross-validation.
| Grade | Validation Index | Ten-Fold Cross-Validation | Mean | Standard Deviation | |||||||||
|---|---|---|---|---|---|---|---|---|---|---|---|---|---|
| K = 1 | K = 2 | K = 3 | K = 4 | K = 5 | K = 6 | K = 7 | K = 8 | K = 9 | K = 10 | ||||
| Very high | ACC | 0.990 | 0.971 | 0.987 | 0.959 | 0.956 | 0.984 | 0.984 | 0.984 | 0.993 | 0.981 | 0.979 | 0.012 |
| AUC | 0.977 | 0.975 | 0.976 | 0.973 | 0.980 | 0.976 | 0.976 | 0.973 | 0.979 | 0.972 | 0.976 | 0.002 | |
| High | ACC | 0.793 | 0.807 | 0.828 | 0.795 | 0.789 | 0.771 | 0.795 | 0.780 | 0.829 | 0.789 | 0.798 | 0.018 |
| AUC | 0.929 | 0.954 | 0.933 | 0.939 | 0.934 | 0.945 | 0.930 | 0.931 | 0.948 | 0.952 | 0.940 | 0.009 | |
| Moderate | ACC | 0.800 | 0.809 | 0.779 | 0.780 | 0.806 | 0.742 | 0.775 | 0.785 | 0.759 | 0.730 | 0.777 | 0.025 |
| AUC | 0.892 | 0.917 | 0.922 | 0.896 | 0.891 | 0.905 | 0.874 | 0.903 | 0.915 | 0.930 | 0.905 | 0.016 | |
| Low | ACC | 0.744 | 0.714 | 0.727 | 0.712 | 0.704 | 0.760 | 0.719 | 0.701 | 0.726 | 0.709 | 0.722 | 0.018 |
| AUC | 0.896 | 0.896 | 0.871 | 0.874 | 0.889 | 0.887 | 0.877 | 0.885 | 0.898 | 0.877 | 0.885 | 0.009 | |
| Very low | ACC | 0.755 | 0.789 | 0.792 | 0.803 | 0.804 | 0.795 | 0.770 | 0.789 | 0.796 | 0.802 | 0.790 | 0.015 |
| AUC | 0.946 | 0.946 | 0.934 | 0.948 | 0.935 | 0.930 | 0.944 | 0.933 | 0.950 | 0.938 | 0.940 | 0.007 | |
Note(s): ACC = accuracy; AUC = area under curve.
Table 8.
The proportion of landslide risk area at different time nodes.
| Grade | 0 d | 1 d | 2 d | 3 d | 4 d | 5 d | ||||||
|---|---|---|---|---|---|---|---|---|---|---|---|---|
| Area | Scale | Area | Scale | Area | Scale | Area | Scale | Area | Scale | Area | Scale | |
| Very low | 0.92 | 12.84 | 0.86 | 11.90 | 0.79 | 11.05 | 0.74 | 10.25 | 0.73 | 10.13 | 0.66 | 9.23 |
| Low | 2.44 | 33.94 | 2.15 | 29.97 | 2.07 | 28.75 | 1.69 | 23.58 | 1.64 | 22.81 | 1.31 | 18.27 |
| Moderate | 2.68 | 37.32 | 2.70 | 37.59 | 2.41 | 33.58 | 2.35 | 32.75 | 2.16 | 30.03 | 2.33 | 32.44 |
| High | 0.97 | 13.50 | 1.14 | 15.90 | 1.44 | 19.98 | 1.51 | 21.01 | 1.55 | 21.61 | 1.76 | 24.48 |
| Very high | 0.17 | 2.39 | 0.33 | 4.64 | 0.48 | 6.65 | 0.89 | 12.41 | 1.11 | 15.41 | 1.12 | 15.58 |
Disclaimer/Publisher’s Note: The statements, opinions and data contained in all publications are solely those of the individual author(s) and contributor(s) and not of MDPI and/or the editor(s). MDPI and/or the editor(s) disclaim responsibility for any injury to people or property resulting from any ideas, methods, instructions or products referred to in the content. |
© 2023 by the authors. Licensee MDPI, Basel, Switzerland. This article is an open access article distributed under the terms and conditions of the Creative Commons Attribution (CC BY) license (https://creativecommons.org/licenses/by/4.0/).
Share and Cite
MDPI and ACS Style
Li, R.; Huang, S.; Dou, H. Dynamic Risk Assessment of Landslide Hazard for Large-Scale Photovoltaic Power Plants under Extreme Rainfall Conditions. Water 2023, 15, 2832. https://doi.org/10.3390/w15152832
AMA Style
Li R, Huang S, Dou H. Dynamic Risk Assessment of Landslide Hazard for Large-Scale Photovoltaic Power Plants under Extreme Rainfall Conditions. Water. 2023; 15(15):2832. https://doi.org/10.3390/w15152832
Chicago/Turabian StyleLi, Ru, Siyi Huang, and Hongqiang Dou. 2023. "Dynamic Risk Assessment of Landslide Hazard for Large-Scale Photovoltaic Power Plants under Extreme Rainfall Conditions" Water 15, no. 15: 2832. https://doi.org/10.3390/w15152832
Note that from the first issue of 2016, this journal uses article numbers instead of page numbers. See further details here.