
Photodegradation of Rhodamine B and Phenol Using TiO2/SiO2 Composite Nanoparticles: A Comparative Study
by
 and
and
Maria-Anna Gatou
1,*,†,
Evangelos Fiorentis
1,†,
Nefeli Lagopati
2,3 and
Evangelia A. Pavlatou
1,*
1
Laboratory of General Chemistry, School of Chemical Engineering, National Technical University of Athens, Zografou Campus, 15772 Athens, Greece
2
Laboratory of Biology, Department of Basic Medical Sciences, Medical School, National and Kapodistrian University of Athens, 11527 Athens, Greece
3
Biomedical Research Foundation, Academy of Athens, 11527 Athens, Greece
*
Authors to whom correspondence should be addressed.
†
These authors contributed equally to this work.
Water 2023, 15(15), 2773; https://doi.org/10.3390/w15152773
Submission received: 17 June 2023
/
Revised: 16 July 2023
/
Accepted: 28 July 2023
/
Published: 31 July 2023
(This article belongs to the Special Issue Advanced Applications of Nanoparticles in Water and Wastewater)
Abstract
:Organic pollutants found in industrial effluents contribute to significant environmental risks. Degradation of these pollutants, particularly through photocatalysis, is a promising strategy ensuring water purification and supporting wastewater treatment. Thus, photodegradation of rhodamine B and phenol under visible-light irradiation using TiO2/SiO2 composite nanoparticles was within the main scopes of this study. The nanocomposite was synthesized through a wet impregnation method using TiO2 and SiO2 nanopowders previously prepared via a facile sol–gel approach and was fully characterized. The obtained results indicated a pure anatase phase, coupled with increased crystallinity (85.22%) and a relative smaller crystallite size (1.82 nm) in relation to pure TiO2 and SiO2 and an enhanced specific surface area (50 m2/g) and a reduced energy band gap (3.18 eV). Photodegradation of rhodamine B upon visible-light irradiation was studied, showing that the TiO2/SiO2 composite reached total (100%) degradation within 210 min compared to pure TiO2 and SiO2 analogues, which achieved a ≈45% and ≈43% degradation rate, respectively. Similarly, the composite catalyst presented enhanced photocatalytic performance under the same irradiation conditions towards the degradation of phenol, leading to 43.19% degradation within 210 min and verifying the composite catalyst’s selectivity towards degradation of rhodamine B dye as well as its enhanced photocatalytic efficiency towards both organic compounds compared to pure TiO2 and SiO2. Additionally, based on the acquired experimental results, ●O2−, h+ and e− were found to be the major reactive oxygen species involved in rhodamine B’s photocatalytic degradation, while ●OH radicals were pivotal in the photodegradation of phenol under visible irradiation. Finally, after the TiO2/SiO2 composite catalyst was reused five times, it indicated negligible photodegradation efficiency decrease towards both organic compounds.
1. Introduction
According to the World Water Development Report (2020) [1], the preservation of water resources linked to worldwide climate change has emerged as a crucial environmental concern within the realm of significant contemporary global issues. Presently, natural water ecosystems face susceptibility to an array of perilous chemical and biological compounds originating from various sources, such as civil society, the public sector, and notably, the industrial sector.
Numerous industries including textile, pharmaceutical, papermaking, printing, cosmetics, and food processing generate a vast quantity of wastewater containing diverse organic pollutants including dyes, thereby causing contamination. In the context of the textile industry, it is estimated that approximately 200,000 tons of dyes are discharged into water reservoirs annually throughout dyeing and finishing operations, primarily given the inefficiencies in the dyeing procedure [2].
Rhodamine B (RhB) and phenol, which are widely employed, represent a significant peril to freshwater ecosystems and human vitality. The aforementioned dyes are known for their mutagenic, toxic, chemically stable, and non-biodegradable properties, making them particularly hazardous even at concentrations below 1 mg/L [3], and they carry a high risk of carcinogenicity [4,5]. The presence of organic dyes, even in trace amounts, can lead to various ailments including abdominal disorders, irritations, anemia, etc. [6]. Consequently, pollutant dyes’ elimination from wastewater is imperative.
Currently, several treatment methods are employed, including chemical precipitation, separation, adsorption, and coagulation techniques [7]. However, these approaches often result in partial dye degradation and merely shift the contaminants from one phase to another, leading to the generation of secondary pollutants that necessitate additional treatment [8,9]. At present, there is growing attention towards advanced oxidation processes (AOPs) that utilize semiconducting materials as a viable alternative to traditional methods [10]. These processes offer several advantages, including simplified equipment requirements, non-selective oxidation, facile operational control, cost effectiveness, and thorough decomposition of organic dyes into benign byproducts [11]. A distinctive characteristic of AOPs is the generation of reactive species like hydroxyl radicals, which enable rapid and non-selective oxidation of organic contaminants. Heterogeneous photocatalysis, which employs nanomaterials based on oxides, is particularly intriguing, as it can effectively remove water-soluble organic pollutants from both water and wastewater when exposed to light irradiation [12].
In general, the process of photocatalytic degradation involves the use of suspended particles in a water solution, which serve as photocatalysts and are exposed to light. The photocatalyst plays a crucial role in this process. These materials constitute semiconductors that possess an electronic band structure, with a clear separation between the highest occupied energy band, known as the valence band (VB), and the lowest unoccupied band, the conduction band (CB), which is determined by an energy band gap (Eg). When photons with energies equal to or larger than the semiconductor’s bandgap are absorbed, electron–hole (e−−h+) pairs are generated within the semiconductor’s particles. As these photoproduced carriers migrate, charge separation occurs, resulting in the formation of various compounds (e.g., H2O, ●OH, and 1O2). It is important to note that electrons and holes can also recombine with each other unless undergoing any chemical reactions. The oxidizing agents initiate the degradation of the organic pollutants that exist on or near the catalytic surface, ultimately leading to their complete mineralization into harmless substances [13].
Metal oxide semiconductors like TiO2 have exceptional adsorption capabilities and act as efficient catalysts due to their high reactivity, enhanced photosensitivity, large specific surface area, cost effectiveness, non-toxicity, and improved catalytic efficiency in dye photodegradation [14].
Titanium dioxide (TiO2) is considered as within the most commonly utilized photocatalysts. TiO2 has been thoroughly studied and extensively applied in photocatalytic processes due to its favorable properties, including enhanced photocatalytic activity, chemical robustness, cost efficiency, and abundance [15,16]. TiO2 exists in different crystal structures, with the most studied being anatase and rutile. These crystal structures have different bandgaps and surface properties, influencing their photocatalytic activity and selectivity. Anatase TiO2 is generally considered the most active form of TiO2 [16,17]. Due to its wide application and extensive research, TiO2-based forms have been optimized and chemically modified in various ways to improve their efficiency and expand their range of applications. For instance, efforts have been conducted at enhancing the visible-light absorption of TiO2 via doping it with transition metal ions or coupling it with other semiconductor materials [18,19].
Silicon dioxide (SiO2), commonly known as silica, is not typically used as a photocatalyst for efficient photocatalysis; however, SiO2 can still contribute to photocatalysis as a support material for other photocatalysts. SiO2 nanoparticles or films are often used as substrates or matrices to immobilize and stabilize other photocatalytic semiconductors such as TiO2 or zinc oxide (ZnO) [20]. In such composite systems, SiO2 provides an enhanced specific surface area (SSA) and can increase the active photocatalyst’s dispersion, leading to an improved photocatalytic performance [20,21].
Within the framework of the present research, TiO2 and SiO2 nanopowders were initially prepared utilizing a facile sol–gel approach and were further utilized to prepare a TiO2/SiO2 composite material through a wet impregnation approach [22]. The physical aspects of the as-mentioned TiO2/SiO2 composite material were thoroughly investigated using various techniques like FESEM, XRD, micro-Raman, FTIR, BET, DLS, as well as DRS. Subsequently, the composite material’s photocatalytic efficiency towards the degradation of rhodamine B and phenol was evaluated under visible-light irradiation and compared, aiming to highlight the potential selectivity of the as-produced TiO2/SiO2 towards degradation of a specific organic dye.
Finally, the present research aimed also to elucidate, to some extent, the phenol’s photocatalytic degradation mechanism under visible-light irradiation via the quantitative study of certain phenol intermediates (p-benzoquinone and hydroquinone) using the fabricated TiO2/SiO2 composite material, as, according to authors’ best knowledge, the photodegradation mechanism of phenol and its derivatives under visible-light irradiation has not been fully established until now.
2. Materials and Methods
2.1. Synthesis of SiO2 Powder
The SiO2 sol–gel synthesis was performed according to the approach reported by Moji et al., 2020 [23]. SiO2 was synthesized through the utilization of tetraorthosilicate (TEOS, Si(OC2H5)4, 98%, Sigma-Aldrich, Darmstadt, Germany), ethanol (C2H5OH, 99.8%, Sigma-Aldrich, Darmstadt, Germany), nitric acid (HNO3, 65%, Penta, Prague, Czech Republic), and lab-distilled water. TEOS (10 mL) and ethanol (10 mL) were mixed and also stirred for approximately 30 min. Nitric acid (5 mL) and double-distilled water (14 mL) were subsequently poured into the Si(OC2H5)4 alcoholic solution. The mixture was stirred at ambient temperature until the formation of a gel. The volume ratio of TEOS:ethanol:H2O:HNO3 remained consistent and equal with 1:1:1.4:0.5. Then, the produced gel was air-dried at room temperature for 24 h. Afterwards, the air-dried gel was crushed to create powder and heat-treated at 100 °C for 2 h in order to eliminate solvent and organic ligands and for acquiring full densification. The powder underwent a process of re-crushing and was subjected to annealing at 800 °C for 2 h in a nitrogen environment. Finally, the obtained powder was further crushed to produce fine powder.
2.2. Synthesis of TiO2 Powder
For synthesizing TiO2 powder, 100 mL of double-distilled water was then acidified using nitric acid (HNO3, 65%, Penta, Prague, Czech Republic) to properly adjust the pH (pH < 2), ensuring the progression of hydrolysis using a pH meter possessing accuracy equal to ±0.01 (ISOLAB Laborgeräte GmbH, Eschau, Germany). Next, 15 mL of titanium (IV) butoxide (C16H36O4Ti, 97%, Sigma-Aldrich, Darmstadt, Germany) was poured into the acidified aqueous solution under potent stirring, and then, 30 mL of 2-propanol (C3H8O, 99.8%, Sigma-Aldrich, Darmstadt, Germany) was poured into to yield a translucent TiO2 sol-gel. Afterwards, the solution was heated until the solvent was entirely evaporated. Then, the yielded gel was calcinated at 450 °C for 4 h, while the arising white powder was triturated and purified through rinsing and centrifugation to omit possible contingent impurities [17].
2.3. Synthesis of TiO2/SiO2 Composite Powder
The TiO2/SiO2 nanocomposites, possessing a 7:1 (TiO2:SiO2) molar ratio, were produced base on the impregnation approach described by Eddy et al., 2021 [22] The chosen molar ratio was based on existing experimental results [22], indicating the enhanced photocatalytic activity of TiO2/SiO2 nanocomposites with molar ratio equal to 7:1, with respect to other examined molar ratios (1:1 and 3:1). More specifically, 2.3263 g of TiO2 powder was mixed with 80 mL of ethanol (C2H5OH, 99.8%, Sigma-Aldrich, Darmstadt, Germany) and sonicated for approximately 30 min. Afterwards, 0.25 g of the as-synthesized SiO2 powder was added, followed also again by sonication (30 min). The produced mixture was stirred under heating (70 °C) until a white-colored paste was then formed. Subsequently, the as-developed paste was dried at 100 °C for 2 h and then calcinated at 500 °C for 5 h. Finally, the acquired powder was crushed into fine powder.
2.4. Characterization of the TiO2/SiO2 Composite Powder
The morphology of the TiO2/SiO2 composite powder was evaluated through field emission SEM (FESEM, JSM-7401F, JEOL, Tokyo, Japan).
For the XRD analysis and study of the as-synthesized composite powder, a Brucker D8 Advance (Brucker, Germany) X-ray diffractometer was used, employing a CuΚα radiation (λ = 1.5406 Å) (40 kV, 40 mA). The measurement was performed at a 2 theta (2θ) angle characterized by a range 20°–90°, with a counting diffraction intensity step equal to 0.01° per 0.8 s.
Raman spectroscopy was performed utilizing a micro-Raman system (inVia, Renishaw, Wotton-under-Edge, Gloucester, UK) using a λ = 532 nm laser line as the excitation source. Raman spectra were collected at 25 °C. An internal Si reference was used for calibrating the frequency shift value. 3–10 spots were acquired in total for the studied powder. The following parameters were set in order to record the Raman spectra: laser power: 1%; exposure time: 30 s; accumulations: 3; spectral range 100–1000 cm−1; spectral resolution: 2 cm−1. In order to support the Raman data, FTIR spectra were also collected in the 400–4000 cm−1 range, with a 4 cm−1 resolution at ambient temperature using a FTIR JASCO4200 apparatus (Oklahoma City, OK, USA) with a Ge crystal.
N2 adsorption of the prepared powder was performed in a ChemBET 3000 Instrument (Yumpu, Diepoldsau, Switzerland) in order to ascertain the SSA BET. Prior to measurements, TiO2/SiO2 powder underwent a degassing procedure at 80 °C for 24 h.
Dynamic light scattering (DLS) (Malvern Zetasizer Nano ZS, Malvern Panalytical Ltd., Malvern, UK) was used to evaluate the hydrodynamic diameter and distribution of the powder’s particles in the aquatic dispersion. A 633 nm laser and a scattering angle of 173° was determined for recording scattering intensity.
Energy band-gap (Eg) values were assessed utilizing an ultraviolet–visible (UV–vis) spectrometer (Jasco UV/Vis/NIR Model name V-770, Interlab, Athens, Greece) equipped with an integrating sphere, thus allowing the recording of diffuse reflectance measurements.
The mineralization of rhodamine B (RhB) and phenol was ascertained through total organic carbon (TOC) analysis (TOC-LCSH/CSN, Shimadzu Scientific Instruments, Columbia, MD, USA), taking measurements at the same timepoints that were selected for the photocatalytic study experiments.
2.5. Photocatalytic Activity Study of the TiO2/SiO2 Composite Powder
The effectiveness of the visible-light photocatalytic activity of the as-synthesized TiO2/SiO2 composite was initially examined towards RhB degradation using 0.005 g of the composite in 10 mg·L−1 RhB (C28H31CIN2O3, Penta-Chemicals Unlimited, Prague, Czech Republic) aqueous solution (250 mL) at ambient temperature and pH equal to 6.63 ± 0.01. Before each of the photocatalytic experiments (cycles), saturation of RhB solution for 1h was performed through extra-pure O2 (99.999%) flow.
The evaluation of the composite’s photocatalytic activity was also evaluated under visible-light irradiation towards phenol degradation. More specifically, 0.005 g of the composite in 10 mg·L−1 phenol (C6H5OH, 99.5%, Sigma-Aldrich, Darmstadt, Germany) aqueous solution (250 mL) at 25 °C and pH = 7.32 ± 0.01 was used. Prior to the photocatalytic tests, the phenol solution was also saturated with extra-pure O2 (99.999%) for 1 h.
The photoreactor used was endowed with a system of four parallel lamps placed at a distance of 10 cm over the powder’s surface [17]. Furthermore, 15 W visible-light lamps of 900 lumens (made by Osram, OSRAM GmbH, Munich, Germany) with a 400 nm cutoff filter were used, and all the experiments were carried out under conditions of ambient temperature.
The photocatalytic degradation of RhB was estimated under visible light. The derived absorbance of the as-prepared TiO2/SiO2 composite powder was estimated at 554 nm using a spectrometer (Thermo Fisher Scientific Evolution 200 Spectrometer (Thermo Fisher Scientific, Waltham, MA, USA). The ratio C/C0, where C stands for the RhB concentration after a certain time of photocatalysis, and C0 constitutes the initial concentration of RhB, was obtained indirectly through the assessment of the measured A (absorption at each time) to the initial (Ainitial) [17].
Finally, high-performance liquid chromatography (HPLC, LC2050, Shimadzu Scientific Instruments, Columbia, MD, USA) integrated with a UV–vis detector for the identification of the degradation products was employed to evaluate the photocatalytic degradation of phenol under visible light over TiO2/SiO2 nanocomposites. A C-18 column as the stationary phase and a mixture of distilled water and methanol (H2O:methanol = 70:30) as the mobile phase were used. The mobile phase was delivered at a flow rate equal to 1 mL/min, and the detection wavelength was set at 254 nm. A volume of 0.5 mL was received every 30 min and filtered via a cellulosic filter (0.45 μm pore size) before each injection into the HPLC chromatography, and the concentration was then estimated.
3. Results
3.1. Characterization of the TiO2/SiO2 Composite Powder
3.1.1. XRD Analysis
XRD analysis was applied to study the crystallinity of the as-synthesized TiO2/SiO2 composite powder. Figure 1 shows the diffraction diagrams that eventuated for the studied powder along with that of pure TiO2 as reference. The dominant crystal phase of pure TiO2 is anatase, while in the case of TiO2/SiO2, only crystal phase is spotted. The highest intensity diffraction peak of anatase (IA) in TiO2/SiO2 as well as reference TiO2 is at 2θ = 25.26°, corresponding to (101) crystal plain, and all the other peaks of anatase indexed are in accordance with the PDF No. 03-065-5714 [24]. Rutile is also observed in the case of pure TiO2 at 2θ = 27.36° (IR), 36.02°, 41.16°, and 54.25°, corresponding to (110), (101), (111), and (211) crystal planes, respectively (PDF No. 03-065-5714) [25]. Table 1 presents the percentage of the rutile phase that was calculated according to Equation (1) [26].
The average crystallite size of the as-produced TiO2/SiO2 powder was determined using the Debye–Scherrer equation and the interplanar of TiO2 and TiO2/SiO2 according to Bragg’s Law Equation, as previous studies have already analytically presented [27].
The crystallinity index (CI%) was calculated according to Equation (2):
There are no significant changes detected in the peak positions, as it is obvious in all the XRD diffractograms. Additionally, no peaks of SiO2 are indexed in composite powder, indicating that SiO2 possesses an amorphous phase. According to Eddy et al. [29], the highest (100%) anatase phase percentage in the case of TiO2/SiO2 powder could be potentially attributed to the fact that little amounts of SiO2 can efficiently inhibit the anatase phase from rutile phase transformation. Table 4 indicates that the presence of SiO2 might reduce the crystallite size. The decreased crystallite size in the case of TiO2/SiO2 powder implies potential compressive strain [29]. The Williamson–Hall plot between βcosθ/λ and sinθ/λ (Figure S1) is provided for validating the presence of compressive strain. In general, the negative slope in the plot points out the presence of compressive strain [30], while the positive slope denotes the potential presence of tensile strain [31]. Through the Williamson–Hall plot, we also calculated the lattice micro-strain of the prepared samples utilizing the following equation (Equation (4)):
where β constitutes the full width at half maximum (FWHM), λ is the X-rays’ wavelength, θ is the diffraction angle, D is the particle size, and ε is the micro-strain [31]. According to the plot, the TiO2 powder indicates a positive slope, and as a result, tensile strain is present, while the composite TiO2/SiO2 powder presents a negative slope, thus affirming the existence of compressive strain.
3.1.2. Micro-Raman Analysis
The Raman spectra derived from the composite TiO2/SiO2 powder are presented in Figure 2. In the spectra of both TiO2 and TiO2/SiO2 composite powders, the dominant Raman active modes can be allocated to the anatase TiO2 phase. More specifically, a peak with strong intensity appears at approximately 144 cm−1 (Eg(1)), followed by peaks of lower intensity at 197 (Eg(2)), 398 (B1g(1)), 515 (combination of A1g and B1g(2) that overlaps at ambient temperature), and 639 cm−1 (Eg(3)) (see Figure 2). The position of Eg(1) Raman mode for the reference TiO2 powder and the studied TiO2/SiO2 powder varies from 144 to 145 cm−1, as seen in Figure S2. Several parameters such as strain, phonon confinement, non-homogeneity of the particle size distribution, defects, and anharmonic and non-stoichiometry effects might lead to the position’s shift of the Eg(1) Raman mode of anatase TiO2. Despite this, the division among the aforementioned factors is not perspicuous [33]. The prevalence of one or more of these factors, which is observable in the Raman spectra of TiO2 and TiO2/SiO2 powders, is ascertained via the structural properties of the studied sample, such as crystallite size and crystallite size distribution, presence of a combination of phases (anatase combined with rutile and/or brookite phases), value and type of the strain (compressive or tensile), type of defects, etc. The main factors that affect Eg(1) Raman mode in the studied composite powder in relation to the reference TiO2 powder could be ascribed to crystallite size and also the presence of an adequate amount of rutile TiO2 phase combined with anatase in the case of pure TiO2. These are verified by the plot that is presented in Figure S2, as the Eg(1) peak of the TiO2/SiO2 powder appears at ≈145 cm−1, which is contrary to TiO2, where the peak’s position appears to 144.53 cm−1 given the fact that the as-synthesized composite powder owns the smallest crystallite size, and the rutile phase is not detected.
Additionally, the Eg(1) peak is significantly sensitive to anatase content, even in cases with low percentages of anatase (<50%). As the anatase content increases, the peak’s intensity becomes extremely strong, while the intensities of the other observed peaks are relatively low. This is also certified by the obtained Raman spectra (see Figure 2 and Figure S2), as TiO2/SiO2 composite powder consists of 100% anatase phase, while pure TiO2 powder consists of 73.22% anatase phase. Taking into account the strong intensity of the Eg(1) peak of the composite powder, a magnification in the 350–700 cm−1 range is provided (see Figure S3). As for pure TiO2 powder, apart from the Raman active modes ascribed to the anatase TiO2 phase, the Eg(R) and A1g(R) modes of rutile phase are spotted at 447 and 612 cm−1, respectively.
According to Zanatta, 2017 [34] and Jassinski et al., 2022 [35], the data provided by the Raman spectra analysis can be exploited in order to estimate the percentage of the rutile TiO2 phase. The intensity and integrated intensity values of rutile bands at 447 and 612 cm−1 (R3 and R4) and anatase bands at 398, 515, and 638 cm−1 (A3, A4, and A5) were used to calculate the rutile phase percentage according to Equation (5), facilitating a semi-quantitative analysis:
where Int(x) corresponds to the intensity (maximum or integral) of particular rutile (R) or anatase (A) bands.
3.1.3. FTIR Analysis
The FTIR study of the synthesized composite TiO2/SiO2 powder presents the characteristics of the formation of TiO2 of high purity. According to the FIIR spectra, several peaks at 490.01, 1390.27, 1622.87, 2852.84, 2919.08, and 3409.86 cm−1 are depicted (Figure 3).
The broad absorption band present in the 400–1000 cm−1 region is ascribed to the Ti–O stretching of the Ti–O–Ti linkages within TiO2’s particles [36]. The peak at 1390.27 can be attributed to the asymmetric stretching mode of Ti-carboxylate [37]. Additionally, the peak spotted at 1622.87 cm−1 and the wide band between 3200 and 3600 cm−1 represent the O–H bending and stretching modes of hydroxyl groups respectively, verifying the existence of moisture in the studied powder [38]. Two weak bands present at 2852.84 and 2919.08 cm−1, in the case of pure TiO2, are associated with the characteristic frequencies of residual organic species emanating from the utilized precursors during the synthesis that were not completely eliminated after rinsing the as-prepared TiO2 powders with distilled water. Thus, the aforementioned bands can be attributed to C–H stretching vibrations of alkane groups [37]. As for the composite powder, the strong and dominant absorption peak spotted at wave number 1102–1105 cm−1 can be attributed to the asymmetric stretching vibration of the Si–O–Si (siloxane) bond [39].
3.1.4. BET Analysis
The photocatalytic effectiveness of a powder can be strongly affected by their texture and structure properties. The received plots from the BET technique are depicted in Figure 4. Both composite and pure TiO2 powders are characterized by type IV isotherms with H3-like hysteresis loops (observed in the P/P0 range of 0.8–0.95), indicating that the powders have a mesoporous texture (pores in the range 2–50 nm) with slits-like pores [40]. The SSA calculated by the BET method was found to be 15 m2/g for pure TiO2 and 50 m2/g for the composite TiO2/SiO2 powder, while BJH plots were utilized to evaluate the distribution of the samples pore size. The inset figures in Figure 4 represent the BJH desorption cumulative pore size curve. The fact that the SSA of the composite TiO2/SiO2 is larger than that of pure TiO2 could be possibly attributed to the increased surface area of amorphous SiO2.The SSA’s enhancement of the composite powder would promote an increased photocatalytic efficiency towards degradation of RhB and phenol [41].
Table 7 presents data obtained from BET method regarding SSA, micropore surface area, average pore diameter, and cumulative volume.
3.1.5. Dynamic Light Scattering (DLS) Analysis
The DLS measurements were performed at pH values = 6.65 ± 0.01. The hydrodynamic radius distribution versus the scattering light intensity is presented in Figure S4 for reference TiO2 as well as the as-prepared composite powder sample. Based on the acquired results, the TiO2/SiO2 composite presented an optimal particle size distribution compared to pure TiO2, characterized by near monodispersity (PdI ≈ 0.1) (see Table 8). The size distribution of the composite powder was detected within the range of 10 and 100 nm with a maximum value ≈ 27 nm. Pure TiO2 is characterized also by a size distribution in the range of 10–100 nm, thus presenting a greater maximum value (≈36 nm) and a greater PdI value (PdI ≈ 0.26), almost reaching polydispersity (PdIs in the range 0.3 to 0.7). TiO2 is also characterized by a small fragment of few micro-sized (μm) particles, probably due to the presence of large agglomerates (see Figure S4b). The results of the DLS measurements are summarized in Table 8. Based on the obtained data, the addition of SiO2 to TiO2 resulted in particles’ size reduction and even distribution [22]. In general, the smallest particle size could potentially favor the redox rate’s enhancement for electrons and holes during the photocatalytic procedure as well as the recombination’s reduction of photogenerated electrons and holes, thus leading to a significantly improved photocatalytic efficiency of the studied composite powder [43].
3.1.6. Diffuse Reflectance UV–Vis Spectroscopy Analysis (DRS)
The determination of the energy band gap (Eg) is an important factor to be taken into account when conducting studies on photocatalysis. Figure 5a illustrates the diffuse reflectance spectra (DRS) of the TiO2/SiO2 composite powder as well as of pure TiO2.
To assess the reflectance of the composite powder, the Kubelka–Munk (K-M) method was employed, as shown in Figure 5a, using Equation (6) [43]:
where R is the reflectance.
As depicted in Figure 5a, it is evident that the absorption edges of TiO2 and TiO2/SiO2 are situated at 392 and 399 nm, respectively. Compared to pure TiO2, the composite powder exhibits a wider absorption range of visible light.
Figure 5b presents the direct Eg of the developed composite powder using the K-M model vs. energy by extrapolating the linear region of the spectra (F(R)hv)1/2 vs. hv. The energy band gap (Eg) was evaluated via Tauc’s equation (Equation (7)):
where Eg stands for the energy band gap, h corresponds to Planck’s constant, v is the frequency, α represents the absorption coefficient, and n = ½ [44].
The band gaps of pure TiO2 and TiO2/SiO2 were calculated equal to 3.24 eV and 3.18 eV, respectively. Based on the aforementioned observations, the composite TiO2/SiO2 powder demonstrated an extended range of light absorption combined with a significantly reduced band-gap energy. These features are considered advantageous for improving the overall efficiency of its photocatalytic properties [45].
3.1.7. FESEM Analysis
The morphology of the synthesized nanomatrials was observed by using FESEM. Figure 6 indicates that while TiO2 has a rugged morphology and many agglomerates (Figure 6a), SiO2 appears to have a smoother and flatter surface and a kind of prism-shape morphology (Figure 6b). The texture of the composite material (Figure 6c) seeems to have been refined compared to either TiO2 or SiO2 nanoparticles with smaller particles and aggregates. Babyszko et al. found results that are in accoradnce with our SEM analysis [46].
3.2. Photocatalytic Study of TiO2/SiO2 Composite Powder
3.2.1. Study of the Photocatalytic Efficiency of TiO2/SiO2 towards RhB Degradation
The photocatalytic efficiency of the composite TiO2/SiO2 powder sample was initially evaluated by measuring its ability to degrade RhB dye in an aqueous solution upon visible-light exposure. The photocatalytic tests were conducted at ambient temperature (25 °C) and pH value of 6.63 ± 0.01. In Figure 7, the photocatalytic performance of the tested composite powder is presented. To assess the enhancement of the composite’s photocatalytic efficiency under visible-light irradiation, pure TiO2 and SiO2 were included as references along with the composite sample. Control experiments were also performed, including photolysis (RhB photolysis) as well as adsorption–desorption equilibrium (RhB dark), without light irradiation but under constant stirring for the same duration as the photocatalytic process. The results indicated that less than 1% of RhB was degraded upon visible-light irradiation, showing that the degradation rate of RhB without the presence of the tested powders was extremely low. Additionally, consistent outcomes were obtained from the experiments conducted in the dark state, confirming the stability of the dye [16].
During the experiments, the TiO2/SiO2 composite powder demonstrated a high efficacy compared to pure TiO2 and SiO2 powders. It achieved complete degradation (100%) of RhB dye within 210 min upon visible-light exposure. The results obtained from Figure 7 indicate that the addition of SiO2 into TiO2 led to an enhanced photocatalytic degradation of RhB dye compared to pure TiO2 and SiO2 powders, which exhibited a degradation rate of 45.01 ± 1.17% and 43.49 ± 0.89%, respectively, within the same 210 min timeframe.
To validate the findings of the RhB degradation experiments, TOC analysis was performed to assess the degree of RhB’s mineralization throughout the photocatalytic trials. The mineralization percentage of RhB was determined using Equation (8):
The percentage of RhB mineralization was determined by calculating the ratio between the initial total organic carbon concentration (TOCinitial) in the medium before the photocatalytic study and the final total organic carbon concentration (TOCfinal) after conducting the photocatalytic treatment [47]. The corresponding data are illustrated in Figure S5. The TOC analysis results indicate that the composite TiO2/SiO2 powder exhibits an enhanced rate of RhB mineralization upon visible-light irradiation, thereby confirming the findings from the degradation study of RhB.
The superior photocatalytic performance of the composite powder compared to the reference powders can be attributed to several factors: (a) the composite powder exhibits a relatively smaller average crystallite size, as determined by XRD analysis; (b) it possesses a higher specific surface area, as evidenced by BET measurements; (c) it demonstrates a smaller hydrodynamic diameter (Dh), as indicated by DLS analysis; and (d) it showcases a reduced band-gap value (Eg), as observed during DRS analysis. It is well established that an increased SSA leads to enhanced light-harvesting capacity and faster interfacial charge-transfer rates. Moreover, the larger contact area between the catalyst and dye molecules promotes a maximum adsorbent effect. These characteristics facilitate the formation of numerous active sites for effective interactions between the composite TiO2/SiO2 powder and RhB molecules [10].
Kinetic Model Study
The results of the kinetic model investigations upon visible-light irradiation are depicted in Figure 8, showing the relationship between the variation of −ln(C/C0) towards time for the studied composite powder. The rate of photocatalytic RhB absorption on the surface of the powders is notably higher for the composite powder in relation to pure TiO2 and SiO2, as indicated by the pseudo-first-order kinetics (0.018 min−1), compared to the reference samples, which can be described by the following equation (Equation (9)) [6]:
where C0 and C comprise the initial and reaction-time RhB concentrations, respectively; k stands for the apparent rate constant of the photocatalytic oxidation; and t represents the irradiation time. The slope of the linear fitted plot refers to the apparent rate constants of the studied composite powder as well as reference powders (TiO2 and SiO2) (see Table 9).
More specifically, the apparent rate constant of the TiO2/SiO2 composite powder is as much as three times that of pure TiO2 and more than nine times that of SiO2 (Figure 8) under visible-light irradiation.
Additionally, the kinetics of photocatalytic trials could be described by the pseudo-second-order equation that is outlined below through Equation (10) [6]:
where qt and qe refer to the amount of the pollutant adsorbed at time t and equilibrium, respectively (mg/g), while k2 constitutes the rate constant (g/mg·min). As opposed to pseudo-first-order kinetics (Figure 8), the R2 values of the pseudo-second-order kinetic study (Figure 9) are lower (Table 9).
Hence, taking into account the R2 values of the kinetic model studies, the photocatalytic degradation of RhB under visible-light irradiation for the as-prepared composite as well as reference powders emulates pseudo-first-order reaction kinetics.
Study of the Photocatalytic Mechanism
The photocatalytic procedure involving RhB dye can be outlined through the following Equations (11)–(16) [48]:
In the process of photocatalytic oxidation, significant contributions are made by various key oxidative species, namely superoxide radicals (●O2−), electrons (e−), holes (h+), and hydroxyl radicals (●OH). To gain deeper insights into the fundamental photocatalytic mechanism, extensive investigations were performed to identify the active species involved. To accomplish this, a series of experiments were conducted to scavenge and capture the specific species. Specifically, p-benzonquinone (p-BQ) (C6H4(=O)2, ≥98%, Sigma-Aldrich, Darmstadt, Germany), silver nitrate (AgNO3, >99%, Sigma-Aldrich, Darmstadt, Germany), disodiumethylene diaminetetraacetate (EDTA-2Na, C10H14N2Na2O8●2H2O, ≥97%, Sigma-Aldrich, Darmstadt, Germany), and t-butanol (t-BuOH, (CH3)3COH, ≥99.5%, Sigma-Aldrich, Darmstadt, Germany) were introduced into the RhB dye solution. These substances were utilized to selectively trap and identify the superoxide radicals (●O2−), electrons (e−), holes (h+), and hydroxyl radicals (●OH), respectively [49].
According to the findings presented in Figure 10, the degradation efficiency of RhB on TiO2/SiO2 composite powder underwent a significant decrease to 21.31 ± 1.01%, 38.06 ± 1.13%, and 35.17 ± 0.98% respectively, upon the addition of p-BQ, AgNO3, or EDTA-2Na to the photocatalytic reaction solution. These data provided confirmation that the superoxide radicals (●O2−) and photogenerated electrons (e−) as well as holes (h+) indeed exerted a key influence in RhB’s photocatalytic degradation. Additionally, the inclusion of t-BuOH in the reaction solution resulted in a decrease in the degradation efficiency of RhB from 100% to 94.69 ± 1.03%, indicating that the hydroxyl radicals (●OH) were not the primary reactive species involved within the process.
Based on the analysis of the band-gap structure of free radicals as well as the experiments involving scavenging of electrons and holes, a plausible mechanism is proposed, as illustrated in Figure 11. When exposed to visible-light irradiation, TiO2 becomes excited, simultaneously generating electrons (e−) and holes (h+). The holes reside in the VB, while the electrons are located in the CB. The electrons in the CB readily engage in reactions with dissolved O2 in the water, leading to the formation of ●O2−, H2O2, or ●OH radicals. Meanwhile, the photogenerated holes in the VB can directly interact with OH− ions or H2O molecules bound to the surface, forming ●OH radicals. These highly reactive species, such as ●O2−, e−, and h+ radicals, relentlessly attack the RhB’s molecules until complete degradation is achieved, promoting efficient separation of electron–hole pairs and thereby augmenting the photocatalytic activity.
Reusability Study
As depicted in Figure S6, the reusability of the TiO2/SiO2 nanocomposite is demonstrated by subjecting it to visible-light irradiation over five consecutive photocatalytic cycles (catalyst loading = 5 mg, pH = 6.63 ± 0.01, C0(RhB) = 10 mg/L). Following degradation in each cycle, the composite photocatalyst was subjected to centrifugation and multiple washes with distilled water. Subsequently, it underwent drying in a vacuum oven at 70 °C for a duration of 24 h in preparation for the subsequent trial without any further treatment [50,51]. It is noteworthy that the as-mentioned photocatalyst exhibited commendable photostability under visible-light irradiation, with an approximate 7% (7.16 ± 0.83%) reduction in its photocatalytic efficiency observed after five repeated cycles. These findings serve as evidence of the TiO2/SiO2 photocatalyst’s robust stability throughout the process of cyclic photocatalysis.
3.2.2. Photocatalytic Efficiency towards Phenol Degradation
The effectiveness of the TiO2/SiO2 composite’s photocatalytic activity was also estimated towards degradation of phenol aqueous solution upon visible-light irradiation. In the case of phenol, the photocatalytic experiments were carried out at room temperature (25 °C) and pH = 7.32 ± 0.01. Figure 12 illustrates the photocatalytic performance of the as-synthesized composite powder. In order to evaluate the improvement of the photocatalytic performance of the composite powder upon visible-light irradiation, pure TiO2 and SiO2 were also included as references. Additionally, control experiments were conducted, including photolysis (phenol photolysis) and adsorption–desorption equilibrium (phenol dark), without light irradiation and under constant stirring for the same time period as the photocatalytic procedure. The obtained results indicated that <2% of phenol was degraded upon visible-light irradiation, thus confirming that the phenol’s degradation rate in the absence of the tested powders was negligible. Furthermore, consistent results were acquired from the trials conducted under dark conditions, verifying the stability of phenol [6].
During the photocatalytic experiments, the TiO2/SiO2 composite indicated an increased efficiency in comparison to pure TiO2 and SiO2 powders. More specifically, the composite powder achieved phenol degradation equal to 64.95 ± 1.94% during visible- light irradiation for 270 min. The observed results in Figure 12 demonstrate that the addition of SiO2 into TiO2 also led to an enhanced photocatalytic degradation of phenol compared to the pure TiO2 and SiO2 powders that presented degradation rates equal to 41.85 ± 1.29% and 40.38 ± 1.54%, respectively, within 270 min. According to the results received from the photocatalytic efficacy’s studies for both RhB and phenol, it can be observed that the photocatalytic effectiveness of the TiO2/SiO2 composite under visible-light irradiation reached 100% within 210 min in the case of RhB, while only 49.13 ± 0.79% of phenol was degraded within the same time period. Thus, it can be concluded that the composite photocatalyst presents selective activity towards the photocatalytic degradation of RhB (Figure 13).
TOC analysis was performed to estimate the degree of phenol’s mineralization during the photocatalytic procedure in order to ensure about the results of phenol degradation trials. The mineralization percentage of phenol was calculated using Equation (10). The data are depicted in Figure S7. Based on the results of TOC analysis, the composite TiO2/SiO2 powder exhibits a higher rate of phenol mineralization under visible-light irradiation compared to pure TiO2 and SiO2 reference powders, thus verifying the results of phenol photocatalytic degradation study.
Study of the Kinetic Model
The kinetic model studies upon visible-light irradiation revealed data that are depicted in Figure 14, showing the relationship between the variation of -ln(C/C0) towards time for the studied composite powder. Phenol photocatalytic rate absorption on the surface of the powders is increased in the case of the composite powder compared to pure TiO2 and SiO2, as indicated by the pseudo-first-order kinetics (0.003 min−1) that can be described through Equation (11) (see Table 10).
Kinetics were also studied according to the pseudo-second-order kinetic model (Equation (12)), and the results are presented in Figure 15.
Contrary to pseudo-first-order kinetics (Figure 14), the R2 values of the pseudo-second-order kinetic study (Figure 15) are lower (Table 10).
As a result, it can be assumed that a pseudo-first-order reaction kinetic model can describe the phenomenon of the photocatalytic degradation of phenol in the presence of the nanocomposite under visible-light irradiation.
Study of the Photocatalytic Mechanism
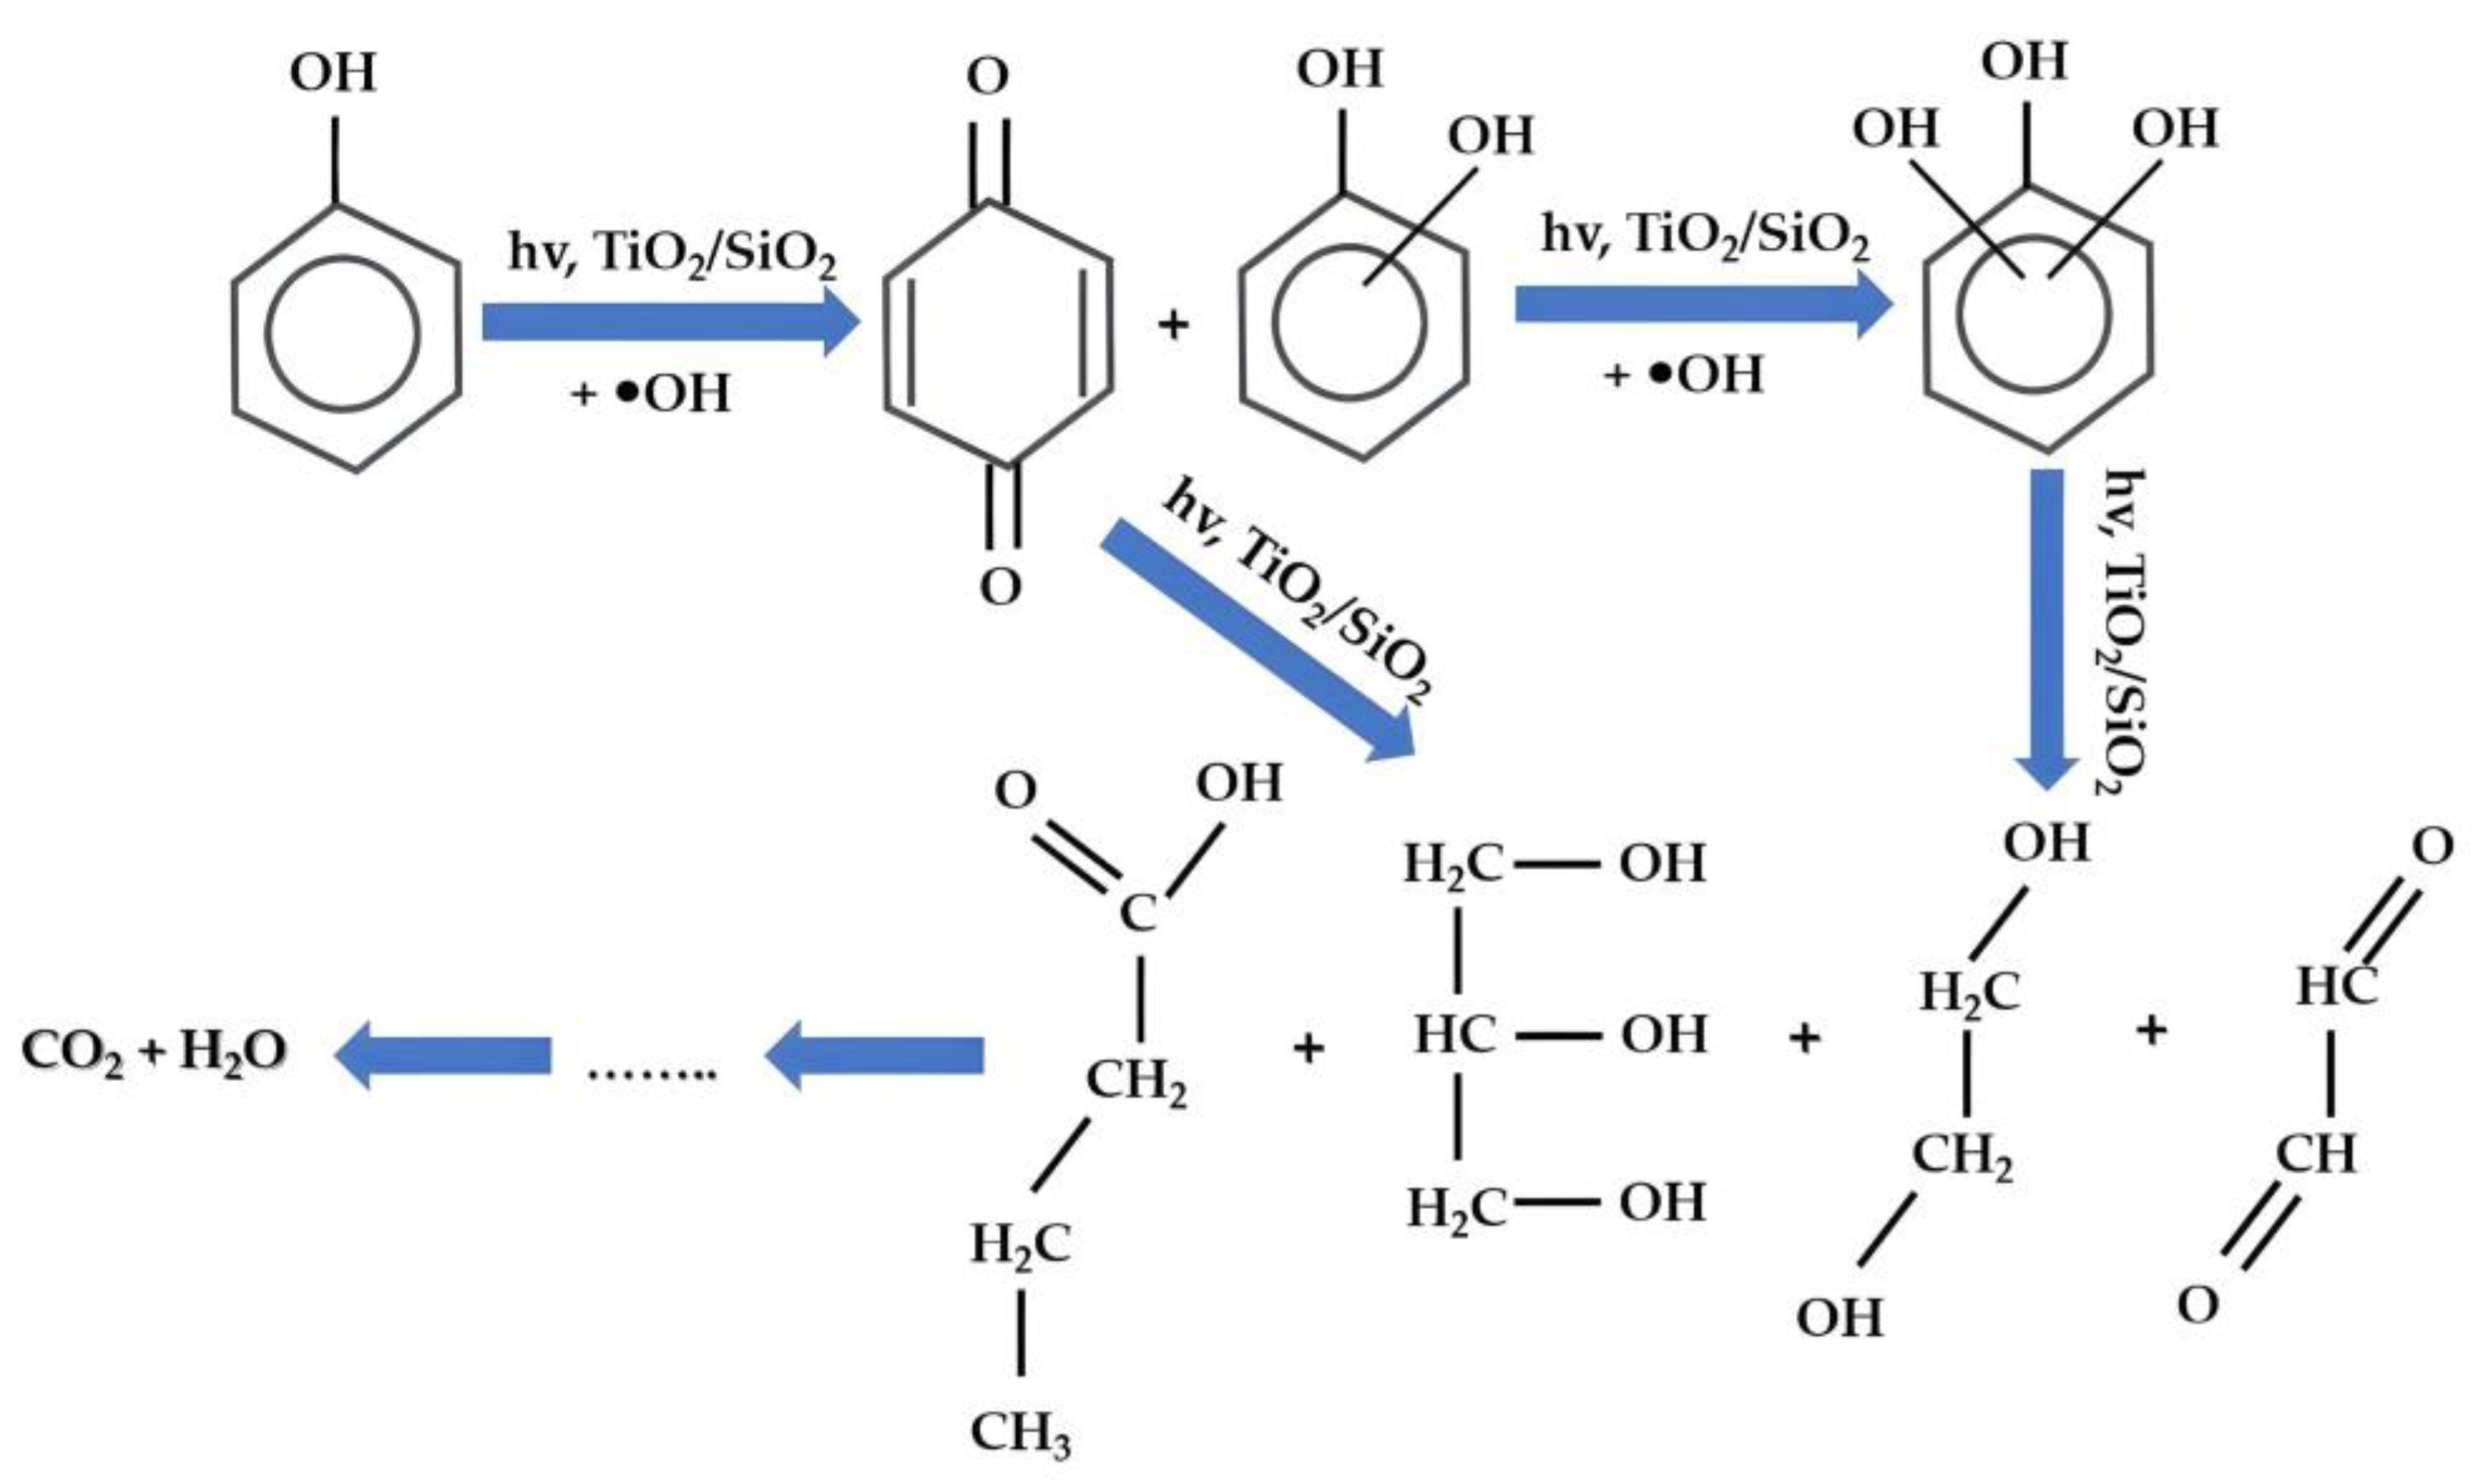
The results depicted in Figure 16 display the outcomes of HPLC and TOC measurements conducted on the reaction products of the visible-light-irradiated TiO2/SiO2 composite catalyst during phenol degradation. Several deductions can be made based on the findings shown in the figure. Following a 270 min irradiation period, slightly over 25% of the initial phenol underwent complete mineralization, as evidenced by the TOC curve indicating the conversion to CO2 and H2O. However, the disappearance of phenol itself occurred at a faster rate, with more than 65% of the substrate undergoing photocatalytic oxidation on the irradiated semiconductor. Notably, hydroquinone (HQ) and p-benzoquinone (p-BQ) were identified and quantitatively analyzed as the primary reaction intermediates. Since the photocatalytic oxidation of organic compounds on irradiated TiO2 samples involves •OH attacking the substrate, dihydroxybenzenes were identified as the primary products of this process. Within this study, the concentrations of 1,4-hydroxybenzene (hydroquinone) as well as p-benzoquinone were quantitatively monitored throughout the photocatalytic reaction. After a 270 min irradiation period, the hydroquinone concentration was 14.7%, while p-benzoquinone comprised 6.5% of the total. When combined, these two compounds constituted approximately 21% of the initial concentration of phenol. However, the disparity between the phenol and the TOC curve in Figure 16 indicates that ≈38% of the organic matter remained in the reaction solution after 270 min of irradiation with visible light, which was also ascertained through the TOC analysis (see Figure S7). Therefore, around 17% of the initial phenol transformed into other intermediates not mentioned earlier. According to the existing literature [52], the superoxide radicals (●O2−) and hydroxyl radicals (●OH) produced during the irradiation of TiO2 catalysts by visible light can promote the oxidization of phenol to HQ and p-BQ, leading eventually to its mineralization into H2O and CO2.
Thorough investigations were also realized to identify those active species actually involved by focusing on the verification of the proposed photocatalytic mechanism for phenol degradation. Similarly, to the case of RhB, a series of experiments took place for scavenging and capturing the specific species. However, given the fact that p-BQ constitutes an ●O2− radical scavenger, as mentioned above (see part 2 in Section 3.2.1), as well as an intermediate product of phenol degradation, ●O2− radical scavenging trials were excluded in order not to affect the HPLC measurements. As a result, AgNO3, EDTA-2Na, and t-BuOH were introduced into the phenol solution and utilized to selectively trap and identify electrons (e−), holes (h+), and hydroxyl radicals (●OH), respectively.
Based on the results illustrated in Figure 17, the degradation efficiency of phenol on TiO2/SiO2 composite powder presented a significant decrease to 15.23 ± 0.89% upon the addition of t-BuOH into the photocatalytic reaction solution. These data confirmed that the hydroxyl radicals (●OH) comprised a key parameter in phenol’s photocatalytic degradation. Additionally, the adding of AgNO3 and EDTA-2Na into the reaction solution resulted in a slight decrease in the phenol’s degradation efficacy from 64.95 ± 1.94% to 56.44 ± 1.23% and 58.07 ± 1.08%, respectively, indicating that the photo-generated electrons (e−) and holes (h+) were not the primary reactive species involved during the photocatalytic procedure.
Due to the obtained data, a potential mechanism for phenol oxidation in the presence of visible-light-irradiated TiO2/SiO2 composite catalyst is proposed and illustrated in Figure 18. However, it is important to note that the mechanism depicted in Figure 18 is incomplete due to the fact that the complete photocatalytic oxidation mechanism of phenol as well as its intermediates products has not been fully examined up to now [53]. According to an existing study [53], HQ and p-BQ exist in equilibrium in an aerated solution, even in the presence of irradiated TiO2. Consequently, p-BQ can be formed through three different routes: (1) through •OH attack on HQ molecules, (2) as a product of the reaction of HQ with photogenerated h+ in TiO2, and (3) via direct oxidation of HQ by dissolved O2 in H2O. Furthermore, HQ can undergo further hydration, and it remains uncertain whether the oxidative opening of an aromatic ring solely occurs through BQ oxidation. Hence, the further oxidation of p-BQ can directly result in oxygen-containing aliphatic compounds without additional hydroxylation of the compound, following the pathway depicted in Figure 18.
Reusability Study
In Figure S8, the reusability of the TiO2/SiO2 nanocomposite is demonstrated under visible-light irradiation over five consecutive photocatalytic cycles (catalyst loading = 5 mg, pH = 7.32 ± 0.01, C0(phenol) = 10 mg/L). The utilized procedure was the same as described in part 3 in Section 3.2.1. The composite photocatalyst presented remarkable visible-light photostability in the case of phenol, too, indexing ≈9% (7.16 ± 0.83%) reduction in its photocatalytic effectiveness after five repeated cycles. These observations certify the composite photocatalyst’s stability during the process of cyclic phenol photocatalysis.
4. Conclusions
Photocatalysis, using semiconductor materials like titanium dioxide (TiO2), constitutes a promising alternative effective method for the removal of organic pollutants such as dyes and phenols from water and wastewater treatment. It involves the activation of TiO2 by UV or visible light to generate ROS that can oxidize and ultimately degrade the organic contaminants.
Within the framework of the present study, silicon dioxide (SiO2) was utilized to modify TiO2, and both were initially synthesized via a facile sol–gel approach in a 7:1 molar ratio (TiO2:SiO2) through a wet impregnation method, expanding its photoactivation range in the visible-light region and developing visible-light-active TiO2/SiO2 nanocomposites.
The prosperous alteration of TiO2 using SiO2 was affirmed via FTIR analysis and the presence of Si–O–Si bonds in the composite powder. The TiO2/SiO2 composite exclusively consisted of the anatase crystal phase and enhanced crystallinity (85.22%) and also showed a lessened Eg value (3.18 eV) as opposed to the pure TiO2 catalyst. The average crystallite size of the as-developed composite catalyst was evaluated at 1.82 nm.
Initially, the developed TiO2/SiO2 composite catalyst was studied in respect to its photocatalytic effectiveness regarding the visible-light photodegradation of the RhB aqueous solution. The composite nanomaterials presented exceptional efficacy, leading to total (100%) RhB degradation within 210 min, while pure TiO2 and SiO2 achieved significantly lower degradation rates in the same duration (45.01 ± 1.17% and 43.49 ± 0.89%, respectively). These results were additionally supported by the data acquired through the TOC analysis. Kinetic study on the visible-light photodegradation of RhB fitted the first-order kinetic model, while the apparent rate constant (k1) of TiO2/SiO2 was as much as three times that of pure TiO2 and more than nine times that of SiO2. For asserting the durability of the prepared composite, five consecutive reusability tests were performed, proving the stability of the TiO2/SiO2 composite, as its photocatalytic efficacy’s loss was equal to 7.16 ± 0.83%.
Subsequently, the photocatalytic efficiency of the TiO2/SiO2 nanocomposites was tested with regards to phenol degradation, also utilizing visible-light irradiation. In that case, the TiO2/SiO2 catalyst accomplished 49.13 ± 0.79% phenol degradation within the 210 min time period, in which it reached complete degradation when RhB was the studied pollutants, thus proving that the composite catalyst exhibited selective photocatalytic activity based on the degradation of RhB. However, given the acquired results, the SiO2-modified TiO2 catalyst indicated enhanced phenol photodegradation (64.95 ± 1.94%) compared to pure TiO2 and SiO2, which reached degradation rates equal to ≈42% and ≈40% within 270 min, respectively. A first-order kinetic model also derived the optimum from the phenol photocatalysis kinetic study. Reusability trials verified the composite’s photo-durability (≈9% effectiveness loss) when using phenol as the pollutant.
According to photocatalysis mechanism study, ●O2−, h+, and e− were suggested to constitute the major ROS species responsible for RhB’s photodegradation under visible-light irradiation, potentially indicating a hole/electron pair recombination suppression mechanism. In the case of phenol, corresponding study and experimental data proved that ●OH radicals comprised the active species associated with its photocatalytic degradation.
Inferentially, the goal of the present study was to synthesize and thoroughly characterize a composite powder combining sol–gel (TiO2 and SiO2) and wet impregnation (TiO2/SiO2) methods, presenting ideal properties for enhanced photocatalytic performance towards photodegradation of organic compounds (rhodamine B and phenol) under visible-light irradiation. These compounds are commonly used in industrial applications and are reportedly labelled as harmful for both humans and the aquatic ecosystem. A comparison was also made to emphasize the composite’s potential selectivity in degrading a specific organic compound among the tested ones.
Furthermore, the present study aimed to shed light on the photocatalytic degradation mechanism of phenol under visible-light irradiation, particularly by quantitatively analyzing certain phenol intermediates (p-benzoquinone and hydroquinone) using the fabricated TiO2/SiO2 composite catalyst. It is noteworthy that, to the best of the authors’ knowledge, the complete understanding of the photodegradation mechanism of phenol and its derivatives under visible-light irradiation has not been established until now.
Taking into account all the aforementioned experimental results, the as-synthesized TiO2/SiO2 composite catalyst could be potentially utilized as an alternative, cost-effective, and environmentally friendly approach for water and wastewater treatment applications in various industries, including textile, pharmaceutical, papermaking, printing, cosmetics, and food processing industries, mainly towards the elimination of dyes (rhodamine B) as well as organic compounds (phenols).
Supplementary Materials
The following supporting information can be downloaded at: https://www.mdpi.com/article/10.3390/w15152773/s1, Figure S1: Williamsons-Hall plots of the as-studied TiO2/SiO2 powder; Figure S2: Magnification of Eg(1) Raman active mode of anatase TiO2 phase of the studied composite powder; Figure S3: Magnification of 350–700 cm−1 Raman spectra region of the studied composite powder; Figure S4: Size distribution of the aqueous dispersion solutions of: (a) TiO2/SiO2 and (b) pure TiO2 powders; Figure S5: Mineralization (%) of RhB for the as-synthesized composite powder, obtained through TOC analysis, after the implementation of the photocatalytic experimental study upon visible-light irradiation; Figure S6: Reusability efficiency of the TiO2/SiO2 composite powder after 5 experimental photocatalytic cycles; Figure S7: Mineralization (%) of phenol for the as-synthesized composite powder, obtained through TOC analysis, post photocatalytic experimental study upon visible-light irradiation; Figure S8: Reusability efficiency of the TiO2/SiO2 composite powder after 5 experimental photocatalytic cycles.
Author Contributions
Conceptualization, M.-A.G. and E.A.P.; methodology, E.F., M.-A.G. and N.L.; validation M.-A.G. and N.L.; formal analysis, M.-A.G. and N.L.; investigation, E.F., M.-A.G. and N.L.; resources, E.A.P.; writing—original draft preparation, E.F., M.-A.G. and N.L.; writing—review and editing, E.F., M.-A.G., N.L. and E.A.P.; visualization, E.F., M.-A.G. and N.L.; supervision, E.A.P.; project administration, E.A.P. All authors have read and agreed to the published version of the manuscript.
Funding
This research received no external funding.
Data Availability Statement
Not applicable.
Acknowledgments
The authors would also like to acknowledge Patrina Paraskevopoulou for her assistance with the BET measurements performed in the Department of Chemistry at the National and Kapodistrian University of Athens (NKUA) as well as Anastasia Detsi for her assistance with the HPLC measurements that took place in the Laboratory of Organic Chemistry in the School of Chemical Engineering at the National Technical University of Athens (NTUA). Also, the authors would like to thank Evdokia Galata for her assistance with the FESEM measurements conducted at the National Center for Scientific Research “Demokritos”.
Conflicts of Interest
The authors declare no conflict of interest.
References
- UNESCO. The United Nations World Water Development Report 2020 Water and Climate Change; UNESCO: Paris, France, 2020. [Google Scholar]
- Khan, S.; Malik, A. Toxicity evaluation of textile effluents and role of native soil bacterium in biodegradation of a textile dye. Environ. Sci. Pollut. Res. 2018, 25, 4446–4458. [Google Scholar] [CrossRef]
- Saeed, M.; Khan, I.; Adeel, M.; Akram, N.; Muneer, M. Synthesis of a CoO–ZnO photocatalyst for enhanced visible-light assisted photodegradation of methylene blue. New J. Chem. 2022, 46, 2224–2231. [Google Scholar] [CrossRef]
- Balcha, A.; Yadav, O.P.; Dey, T. Photocatalytic degradation of methylene blue dye by zinc oxide nanoparticles obtained from precipitation and sol-gel methods. Environ. Sci. Pollut. Res. 2016, 23, 25485–25493. [Google Scholar] [CrossRef] [PubMed]
- Panigrahy, N.; Priyadarshini, A.; Sahoo, M.M.; Verma, A.K.; Daverey, A.; Sahoo, N.K. A comprehensive review on eco-toxicity and biodegradation of phenolics: Recent progress and future outlook. Environ. Technol. Innov. 2022, 27, 102423. [Google Scholar] [CrossRef]
- Dodoo-Arhin, D.; Asiedu, T.; Agyei-Tuffour, B.; Nyankson, E.; Obada, D.; Mwabora, J.M. Photocatalytic degradation of rhodamine dyes using zinc oxide nanoparticles. Mater. Today Proc. 2021, 38, 809–815. [Google Scholar] [CrossRef]
- Sansenya, T.; Masri, N.; Chankhanittha, T.; Senasu, T.; Piriyanon, J.; Mukdasai, S.; Nanan, S. Hydrothermal synthesis of ZnO photocatalyst for detoxification of anionic azo dyes and antibiotic. J. Phys. Chem. Solids 2022, 160, 110353. [Google Scholar] [CrossRef]
- Vaez, Z.; Javanbakht, V. Synthesis, characterization and photocatalytic activity of ZSM-5/ZnO nanocomposite modified by Ag nanoparticles for methyl orange degradation. J. Photochem. Photobiol. A 2020, 388, 112064. [Google Scholar] [CrossRef]
- Khataee, A.R.; Pons, M.N.; Zahraa, O. Photocatalytic degradation of three azo dyes using immobilized TiO2 nanoparticles on glass plates activated by UV light irradiation: Influence of dye molecular structure. J. Hazard. Mater. 2009, 168, 451–457. [Google Scholar] [CrossRef]
- John Peter, I.; Praveen, E.; Vignesh, G.; Nithiananthi, P. ZnO nanostructures with different morphology for enhanced photocatalytic activity. Mater. Res. Express 2017, 4, 124003. [Google Scholar] [CrossRef]
- Zhang, D.E.; Ren, L.Z.; Hao, X.Y.; Pan, B.B.; Wang, M.Y.; Ma, J.J.; Li, F.; Li, S.A.; Tong, Z.W. Synthesis and photocatalytic property of multilayered Co3O4. Appl. Surf. Sci. 2015, 355, 547–552. [Google Scholar] [CrossRef]
- Ani, I.J.; Akpan, U.G.; Olutoye, M.A.; Hameed, B.H. Photocatalytic degradation of pollutants in petroleum refinery wastewater by TiO2- and ZnO-based photocatalysts: Recent development. J. Clean. Prod. 2018, 205, 930–954. [Google Scholar] [CrossRef]
- Sinar Mashuri, S.I.; Ibrahim, M.L.; Kasim, M.F.; Mastuli, M.S.; Rashid, U.; Abdullah, A.H.; Islam, A.; Asikin Mijan, N.; Tan, Y.H.; Mansir, N.; et al. Photocatalysis for organic wastewater treatment: From the basis to current challenges for society. Catalysts 2020, 10, 1260. [Google Scholar] [CrossRef]
- Tanji, K.; Navio, J.A.; Chaqroune, A.; Naja, J.; Puga, F.; Hidalgo, M.C.; Kherbeche, A. Fast photodegradation of rhodamine B and caffeine using ZnO-hydroxyapatite composites under UV-light illumination. Catal. Today 2022, 388–389, 176–186. [Google Scholar] [CrossRef]
- Lagopati, N.; Tsilibary, E.P.; Falaras, P.; Papazafiri, P.; Pavlatou, E.A.; Kotsopoulou, E.; Kitsiou, P. Effect of nanostructured TiO2 crystal phase on photoinduced apoptosis of breast cancer epithelial cells. Int. J. Nanomed. 2014, 9, 3219–3230. [Google Scholar] [CrossRef] [Green Version]
- Lagopati, N.; Kitsiou, P.; Kontos, A.; Venieratos, P.; Kotsopoulou, E.; Kontos, A.; Dionysiou, D.; Pispas, S.; Tsilibary, E.; Falaras, P. Photo-induced treatment of breast epithelial cancer cells using nanostructured titanium dioxide solution. J. Photochem. Photobiol. A Chem. 2010, 214, 215–223. [Google Scholar] [CrossRef]
- Anitha, B.; Khadar, M.A. Anatase-rutile phase transformation and photocatalysis in peroxide gel route prepared TiO2 nanocrystals: Role of defect states. Solid State Sci. 2020, 108, 106392. [Google Scholar] [CrossRef]
- Lagopati, N.; Kotsinas, A.; Veroutis, D.; Evangelou, K.; Papaspyropoulos, A.; Arfanis, M.; Falaras, P.; Kitsiou, P.V.; Pateras, I.; Bergonzini, A.; et al. Biological effect of silver-modified nanostructured titanium dioxide in cancer. Cancer Genom. Proteom. 2021, 18 (Suppl. S3), 425–439. [Google Scholar] [CrossRef]
- Nur, A.S.M.; Sultana, M.; Mondal, A.; Islam, S.; Robel, F.N.; Islam, A.; Sumi, M.S.A. A review on the development of elemental and codoped TiO2 photocatalysts for enhanced dye degradation under UV–vis irradiation. J. Water Process Eng. 2022, 47, 102728. [Google Scholar] [CrossRef]
- Xu, T.; Wang, P.; Wang, D.; Zhao, K.; Wei, M.; Liu, X.; Liu, H.; Cao, J.; Chen, Y.; Fan, H.; et al. Ultrasound-assisted synthesis of hyper-dispersed type-II tubular Fe3O4@SiO2@ZnO/ZnS core/shell heterostructure for improved visible-light photocatalysis. J. Alloys Compd. 2020, 838, 155689. [Google Scholar] [CrossRef]
- Dong, C.; Ji, J.; Yang, Z.; Xiao, Y.; Xing, M.; Zhang, J. Research progress of photocatalysis based on highly dispersed in mesoporous SiO2. Chin. Chem. Lett. 2019, 30, 853–862. [Google Scholar] [CrossRef]
- Eddy, D.R.; Ishmah, S.N.; Permana, M.D.; Firdaus, M.L.; Rahayu, I.; El-Badry, Y.A.; Hussein, E.E.; El-Bahy, Z.M. Photocatalytic phenol degradation by silica-modified titanium dioxide. Appl. Sci. 2021, 11, 9033. [Google Scholar] [CrossRef]
- Moji, R.G.; Kroon, R.E.; Motloung, S.V.; Motaung, T.E.; Koao, L.F. Morphology, structural and luminescent properties of sol-gel synthesized SiO2 powders co-doped with Sr2+ and Tb3+. Phys. B Condens. 2020, 580, 411817. [Google Scholar] [CrossRef]
- Tayade, R.J.; Surolia, P.K.; Kulkarni, R.G.; Jasra, R.V. Photocatalytic degradation of dyes and organic contaminants in water using nanocrystalline anatase and rutile TiO2. STAM 2007, 8, 455–462. [Google Scholar] [CrossRef] [Green Version]
- Phromma, S.; Wutikhun, T.; Kasamechonchung, P.; Eksangsri, T.; Sapcharoenkun, C. Effect of Calcination Temperature on Photocatalytic Activity of Synthesized TiO2 Nanoparticles via Wet Ball Milling Sol-Gel Method. Appl. Sci. 2020, 10, 993. [Google Scholar] [CrossRef] [Green Version]
- Zhang, H.; Banfield, J.F. Understanding Polymorphic Phase Transformation Behavior during Growth of Nanocrystalline Aggregates: Insights from TiO2. J. Phys. Chem. B 2000, 104, 3481–3487. [Google Scholar] [CrossRef]
- Limón-Rocha, I.; Guzmán-González, C.A.; Anaya-Esparza, L.M.; Romero-Toledo, R.; Rico, J.L.; González-Vargas, O.A.; Pérez-Larios, A. Effect of the Precursor on the Synthesis of ZnO and Its Photocatalytic Activity. Inorganics 2022, 10, 16. [Google Scholar] [CrossRef]
- Levin, A.A.; Narykova, M.V.; Lihachev, A.I.; Kardashev, B.K.; Kadomtsev, A.G.; Brunkov, P.N.; Panfilov, A.G.; Prasolov, N.D.; Sultanov, M.M.; Kuryanov, V.N.; et al. Modification of the Structural, Microstructural, and Elastoplastic Properties of Aluminum Wires after Operation. Metals 2021, 11, 1955. [Google Scholar] [CrossRef]
- Eddy, D.R.; Ishmah, S.N.; Permana, M.D.; Firdaus, M.L. Synthesis of Titanium Dioxide/Silicon Dioxide from Beach Sand as Photocatalyst for Cr and Pb Remediation. Catalysts 2020, 10, 1248. [Google Scholar] [CrossRef]
- Prabhu, R.R.; Abdul Khadar, M. Study of optical phonon modes of CdS nanoparticles using Raman spectroscopy. Bull. Mater. Sci. 2008, 31, 511–515. [Google Scholar] [CrossRef]
- Tripathi, A.K.; Singh, M.K.; Mathpal, M.C.; Mishra, S.K.; Agarwal, A. Study of structural transformation in TiO2 nanoparticles and its optical properties. J. Alloys Compd. 2013, 549, 114–120. [Google Scholar] [CrossRef]
- Reddy, A.J.; Kokila, M.K.; Nagabhushana, H.; Chakradhar, R.P.S.; Shivakumara, C.; Rao, J.L.; Nagabhushana, B.M. Structural, optical and EPR studies on ZnO: Cu nanopowders prepared via low temperature solution combustion synthesis. J. Alloys Compd. 2011, 509, 5349–5355. [Google Scholar] [CrossRef]
- Šćepanović, M.; Aškrabić, S.; Berec, V.; Golubović, A.; Dohčević-Mitrović, Z.; Kremenović, A.; Popović, Z.V. Characterization of La-Doped TiO2 Nanopowders by Raman Spectroscopy. Acta Phys. Pol. 2009, 115, 771–774. [Google Scholar] [CrossRef]
- Zanatta, A.R. A fast-reliable methodology to estimate the concentration of rutile or anatase phases of TiO2. AIP Adv. 2017, 7, 075201. [Google Scholar] [CrossRef] [Green Version]
- Jasinski, J.J.; Lubas, M.; Suchorab, K.; Gawęda, M.; Kurpaska, L.; Brykala, M.; Kosinska, A.; Sitarz, M.; Jagielski, J. Qualitative and semi-quantitative phase analysis of TiO2 thin layers by Raman imaging. J. Mol. Struct. 2022, 1260, 132803. [Google Scholar] [CrossRef]
- Lu, X.; Lv, X.; Sun, Z.; Zheng, Y. Nanocomposites of poly(l-lactide) and surface-grafted TiO2 nanoparticles: Synthesis and characterization. Eur. Polym. J. 2008, 44, 2476–2481. [Google Scholar] [CrossRef]
- Praveen, P.; Viruthagiri, G.; Mugundan, S.; Shanmugam, N. Structural, optical and morphological analyses of pristine titanium di-oxide nanoparticles—Synthesized via sol–gel route. Spectrochim Acta A Mol. Biomol. Spectrosc. 2014, 117, 622–629. [Google Scholar] [CrossRef] [PubMed]
- Olurode, K.; Neelgund, G.M.; Oki, A.; Luo, Z. A facile hydrothermal approach for construction of carbon coating on TiO2 nanoparticles. Spectrochim Acta A Mol. Biomol. Spectrosc. 2012, 89, 333–336. [Google Scholar] [CrossRef] [PubMed] [Green Version]
- Degen, T.; Sadki, M.; Bron, E.; König, U.; Nénert, G. The HighScore suite. Powder Diffr. 2014, 29, S13–S18. [Google Scholar] [CrossRef] [Green Version]
- Pudukudy, M.; Yaakob, Z.; Narayananc, B.; Gopalakrishnan, A.; Tasirin, S.M. Facile synthesis of bimodal mesoporous spinel Co3O4 nanomaterials and their structural properties. Superlattices Microstruct. 2013, 64, 15–26. [Google Scholar] [CrossRef]
- Danhier, F.; Lecouturier, N.; Vroman, B.; Jérôme, C.; Marchand-Brynaert, J.; Feron, O.; Préat, V. Paclitaxel-loaded PEGylated PLGA-based nanoparticles: In vitro and in vivo evaluation. J. Control. Release 2009, 133, 11–17. [Google Scholar] [CrossRef]
- Gatou, M.-A.; Lagopati, N.; Vagena, I.-A.; Gazouli, M.; Pavlatou, E.A. ZnO Nanoparticles from Different Precursors and Their Photocatalytic Potential for Biomedical Use. Nanomaterials 2023, 13, 122. [Google Scholar] [CrossRef] [PubMed]
- Cheng, Y.; Luo, F.; Jiang, Y.; Li, F.; Wei, C. The effect of calcination temperature on the structure and activity of TiO2/SiO2 composite catalysts derived from titanium sulfate and fly ash acid sludge. Colloids Surf. 2018, 554, 81–85. [Google Scholar] [CrossRef]
- Galata, E.; Georgakopoulou, E.A.; Kassalia, M.-E.; Papadopoulou-Fermeli, N.; Pavlatou, E.A. Development of Smart Composites Based on Doped-TiO2 Nanoparticles with Visible Light Anticancer Properties. Materials 2019, 12, 2589. [Google Scholar] [CrossRef] [PubMed] [Green Version]
- Sun, M.; Fang, Y.; Suna, S.; Wang, Y. Surface co-modification of TiO2 with N doping and Ag loading for enhanced visible-light photoactivity. RSC Adv. 2016, 6, 12272–12279. [Google Scholar] [CrossRef]
- Babyszko, A.; Wanag, A.; Sadłowski, M.; Kusiak-Nejman, E.; Morawski, A.W. Synthesis and Characterization of SiO2/TiO2 as Photocatalyst on Methylene Blue Degradation. Catalysts 2022, 12, 1372. [Google Scholar] [CrossRef]
- Uribe-López, M.C.; Hidalgo-López, M.C.; López-González, R.; Frías-Márquez, D.M.; Núñez-Nogueira, G.; Hernández-Castillo, D.; Alvarez-Lemus, M.A. Photocatalytic activity of ZnO nanoparticles and the role of the synthesis method on their physical and chemical properties. J. Photochem. Photobiol. A 2021, 404, 112866. [Google Scholar] [CrossRef]
- Rasalingam, S.; Wu, C.M.; Koodali, R.T. Modulation of pore sizes of titanium dioxide photocatalysts by a facile template free hydrothermal synthesis method: Implications for photocatalytic degradation of rhodamine B. ACS Appl. Mater. Interfaces 2015, 7, 4368–4380. [Google Scholar] [CrossRef]
- Trenczek-Zajac, A.; Synowiec, M.; Zakrzewska, K.; Zazakowny, K.; Kowalski, K.; Dziedzic, A.; Radecka, M. Scavenger-Supported Photocatalytic Evidence of an Extended Type I Electronic Structure of the TiO2@Fe2O3 Interface. ACS Appl. Mater. Interfaces 2022, 14, 38255–38269. [Google Scholar] [CrossRef]
- Farhadian, N.; Akbarzadeh, R.; Pirsaheb, M.; Jen, T.-C.; Fakhri, Y.; Asadi, A. Chitosan modified N, S-doped TiO2 and N, S-doped ZnO for visible light photocatalytic degradation of tetracycline. Int. J. Biol. Macromol. 2019, 132, 360–373. [Google Scholar] [CrossRef]
- Niu, P.; Wu, G.; Chen, P.; Zheng, H.; Cao, Q.; Jiang, H. Optimization of Boron Doped TiO2 as an Efficient Visible Light-Driven Photocatalyst for Organic Dye Degradation With High Reusability. Front. Chem. 2020, 8, 172. [Google Scholar] [CrossRef] [Green Version]
- Li, H.; Yao, Y.; Yang, X.; Zhou, X.; Lei, R.; He, S. Degradation of Phenol by Photocatalysis Using TiO2/Montmorillonite Composites Under UV Light. Res. Sq. 2021, 29, 68293–68305. [Google Scholar] [CrossRef] [PubMed]
- Sobczyński, A.; Duczmal, Ł.; Zmudziński, W. Phenol destruction by photocatalysis on TiO2: An attempt to solve the reaction mechanism. J. Mol. Catal. A Chem. 2004, 213, 225–230. [Google Scholar] [CrossRef]
Figure 1.
XRD pattern for the prepared TiO2/SiO2 (7:1) powder. The crystal planes presented in black correspond to the TiO2 anatase phase, while the crystal planes presented in red correspond to TiO2 rutile phase. The XRD pattern of pure TiO2 is presented as reference.
Figure 1.
XRD pattern for the prepared TiO2/SiO2 (7:1) powder. The crystal planes presented in black correspond to the TiO2 anatase phase, while the crystal planes presented in red correspond to TiO2 rutile phase. The XRD pattern of pure TiO2 is presented as reference.
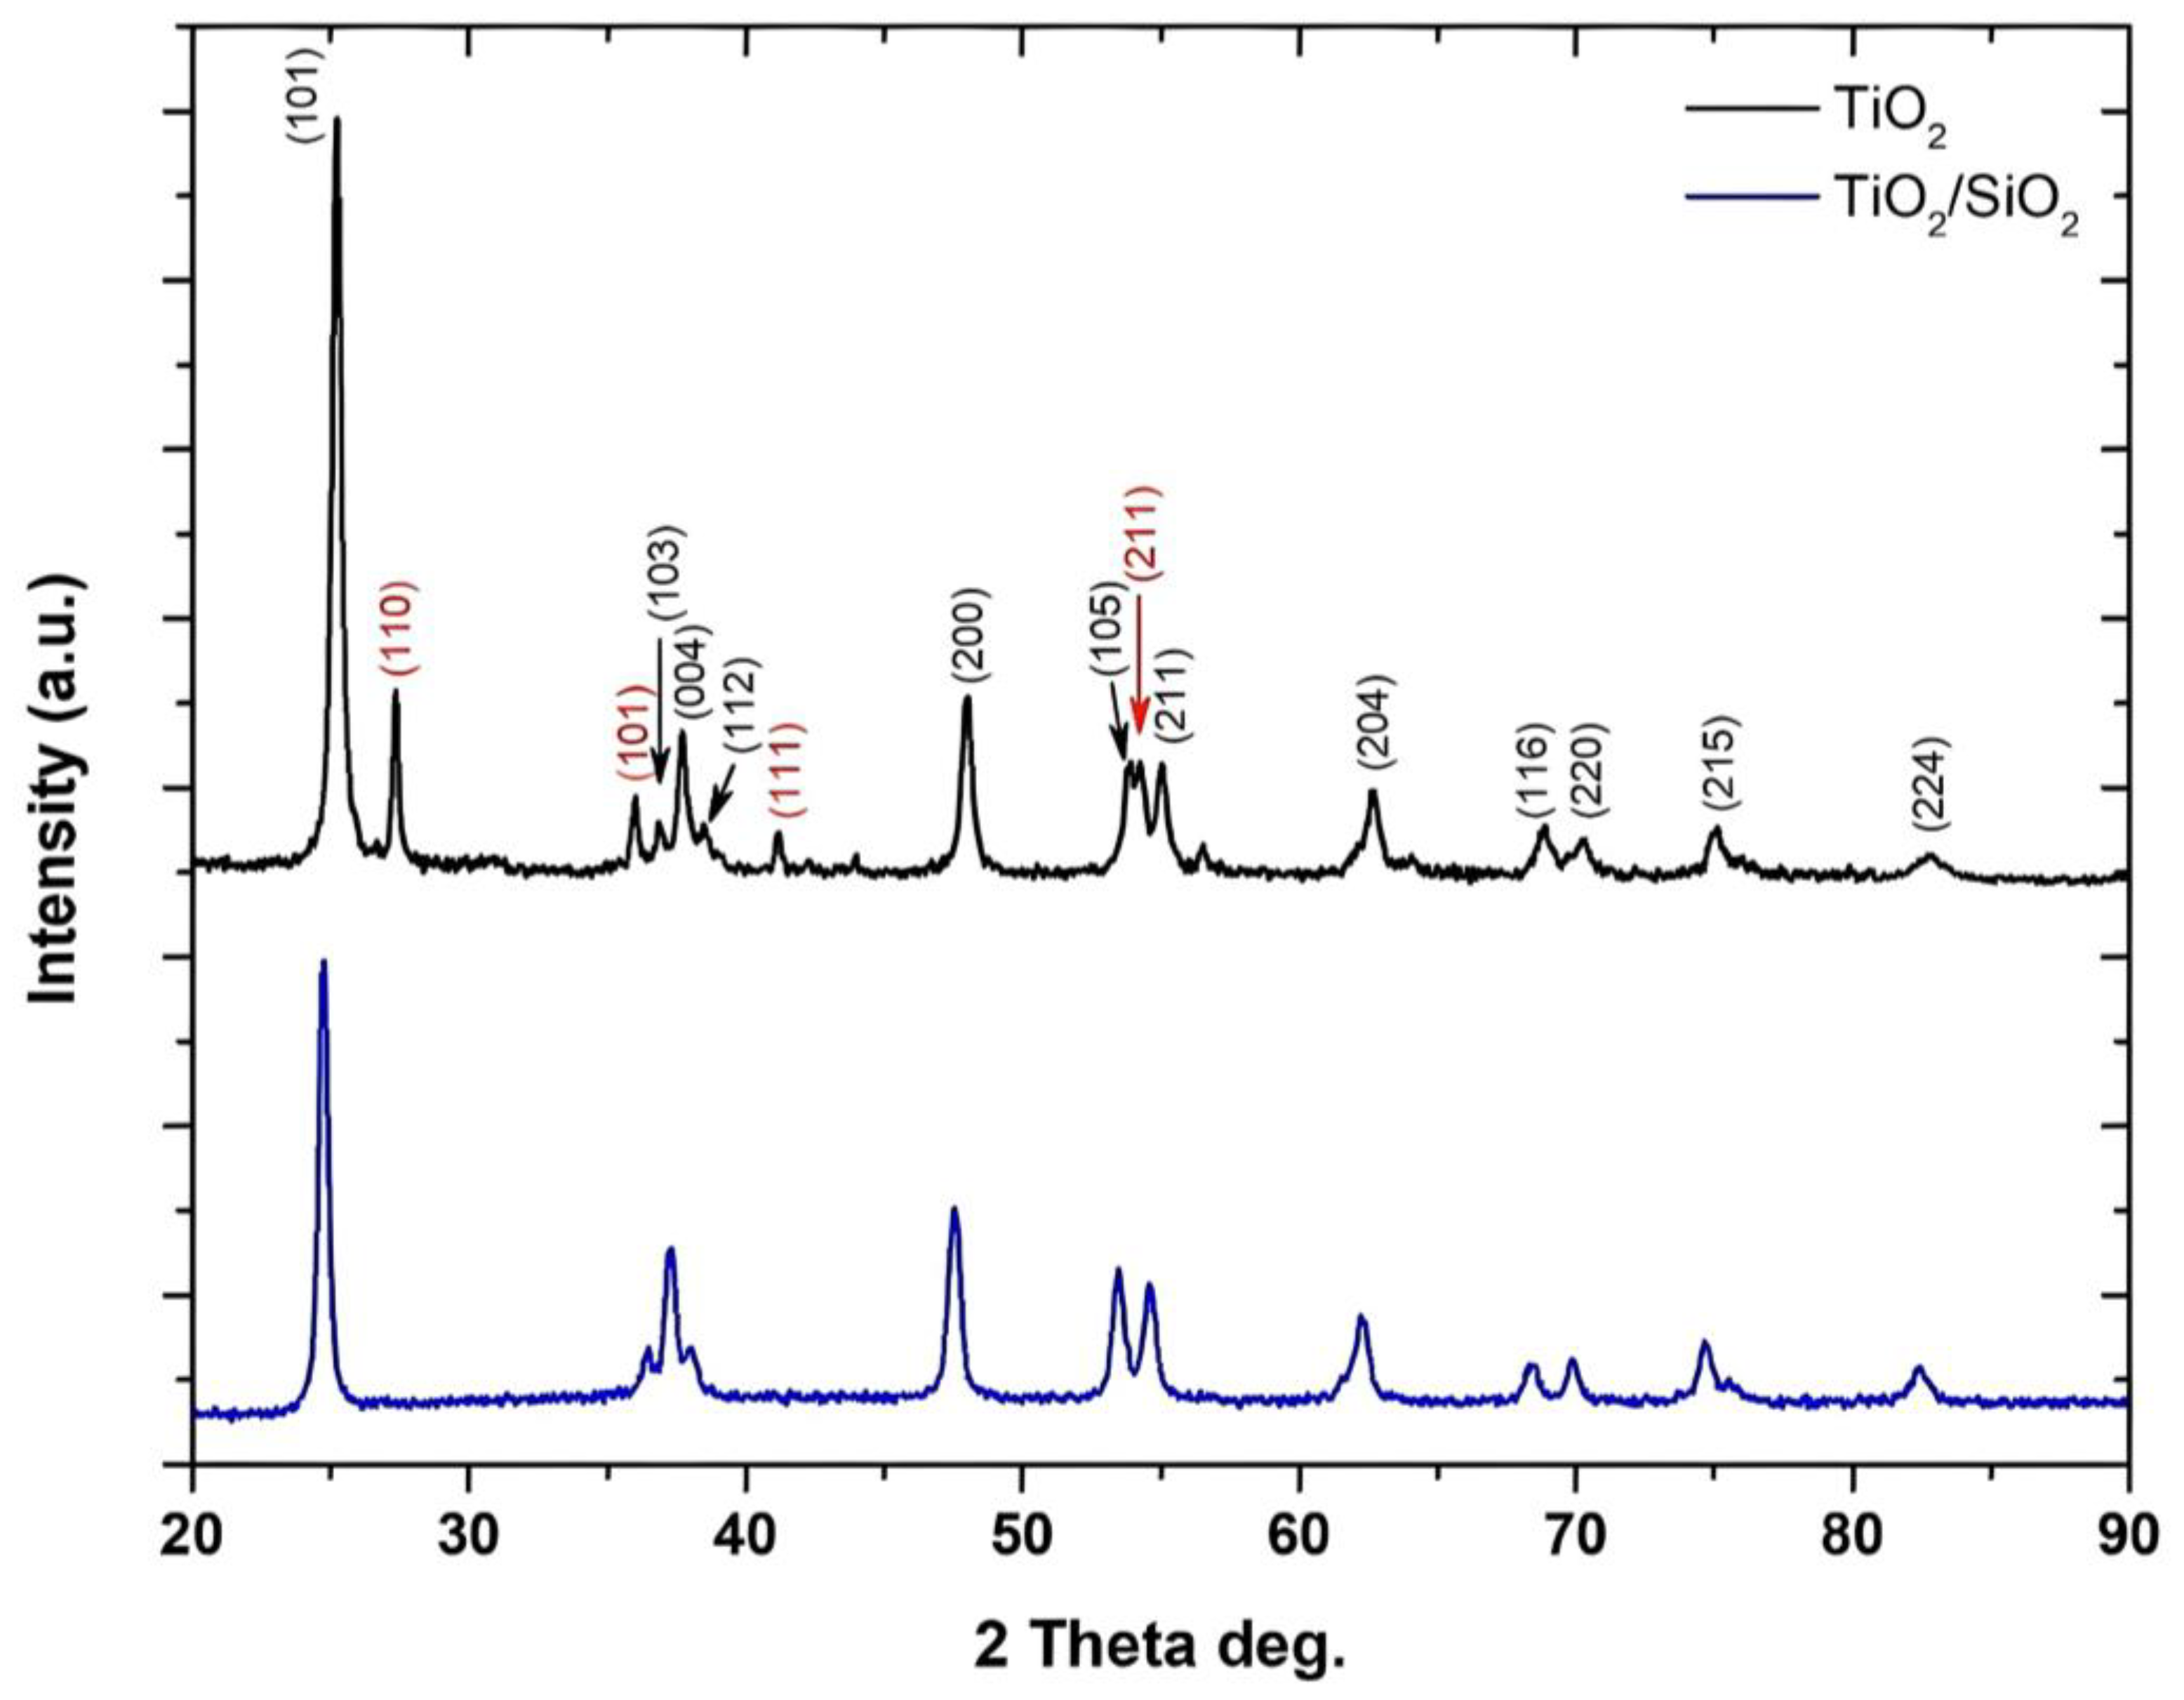
Figure 2.
Raman spectra of the studied TiO2/SiO2 powder. Also, the Raman spectrum of pure TiO2 is used as reference.
Figure 2.
Raman spectra of the studied TiO2/SiO2 powder. Also, the Raman spectrum of pure TiO2 is used as reference.

Figure 3.
FTIR spectra of the synthesized TiO2/SiO2 nanocomposite.
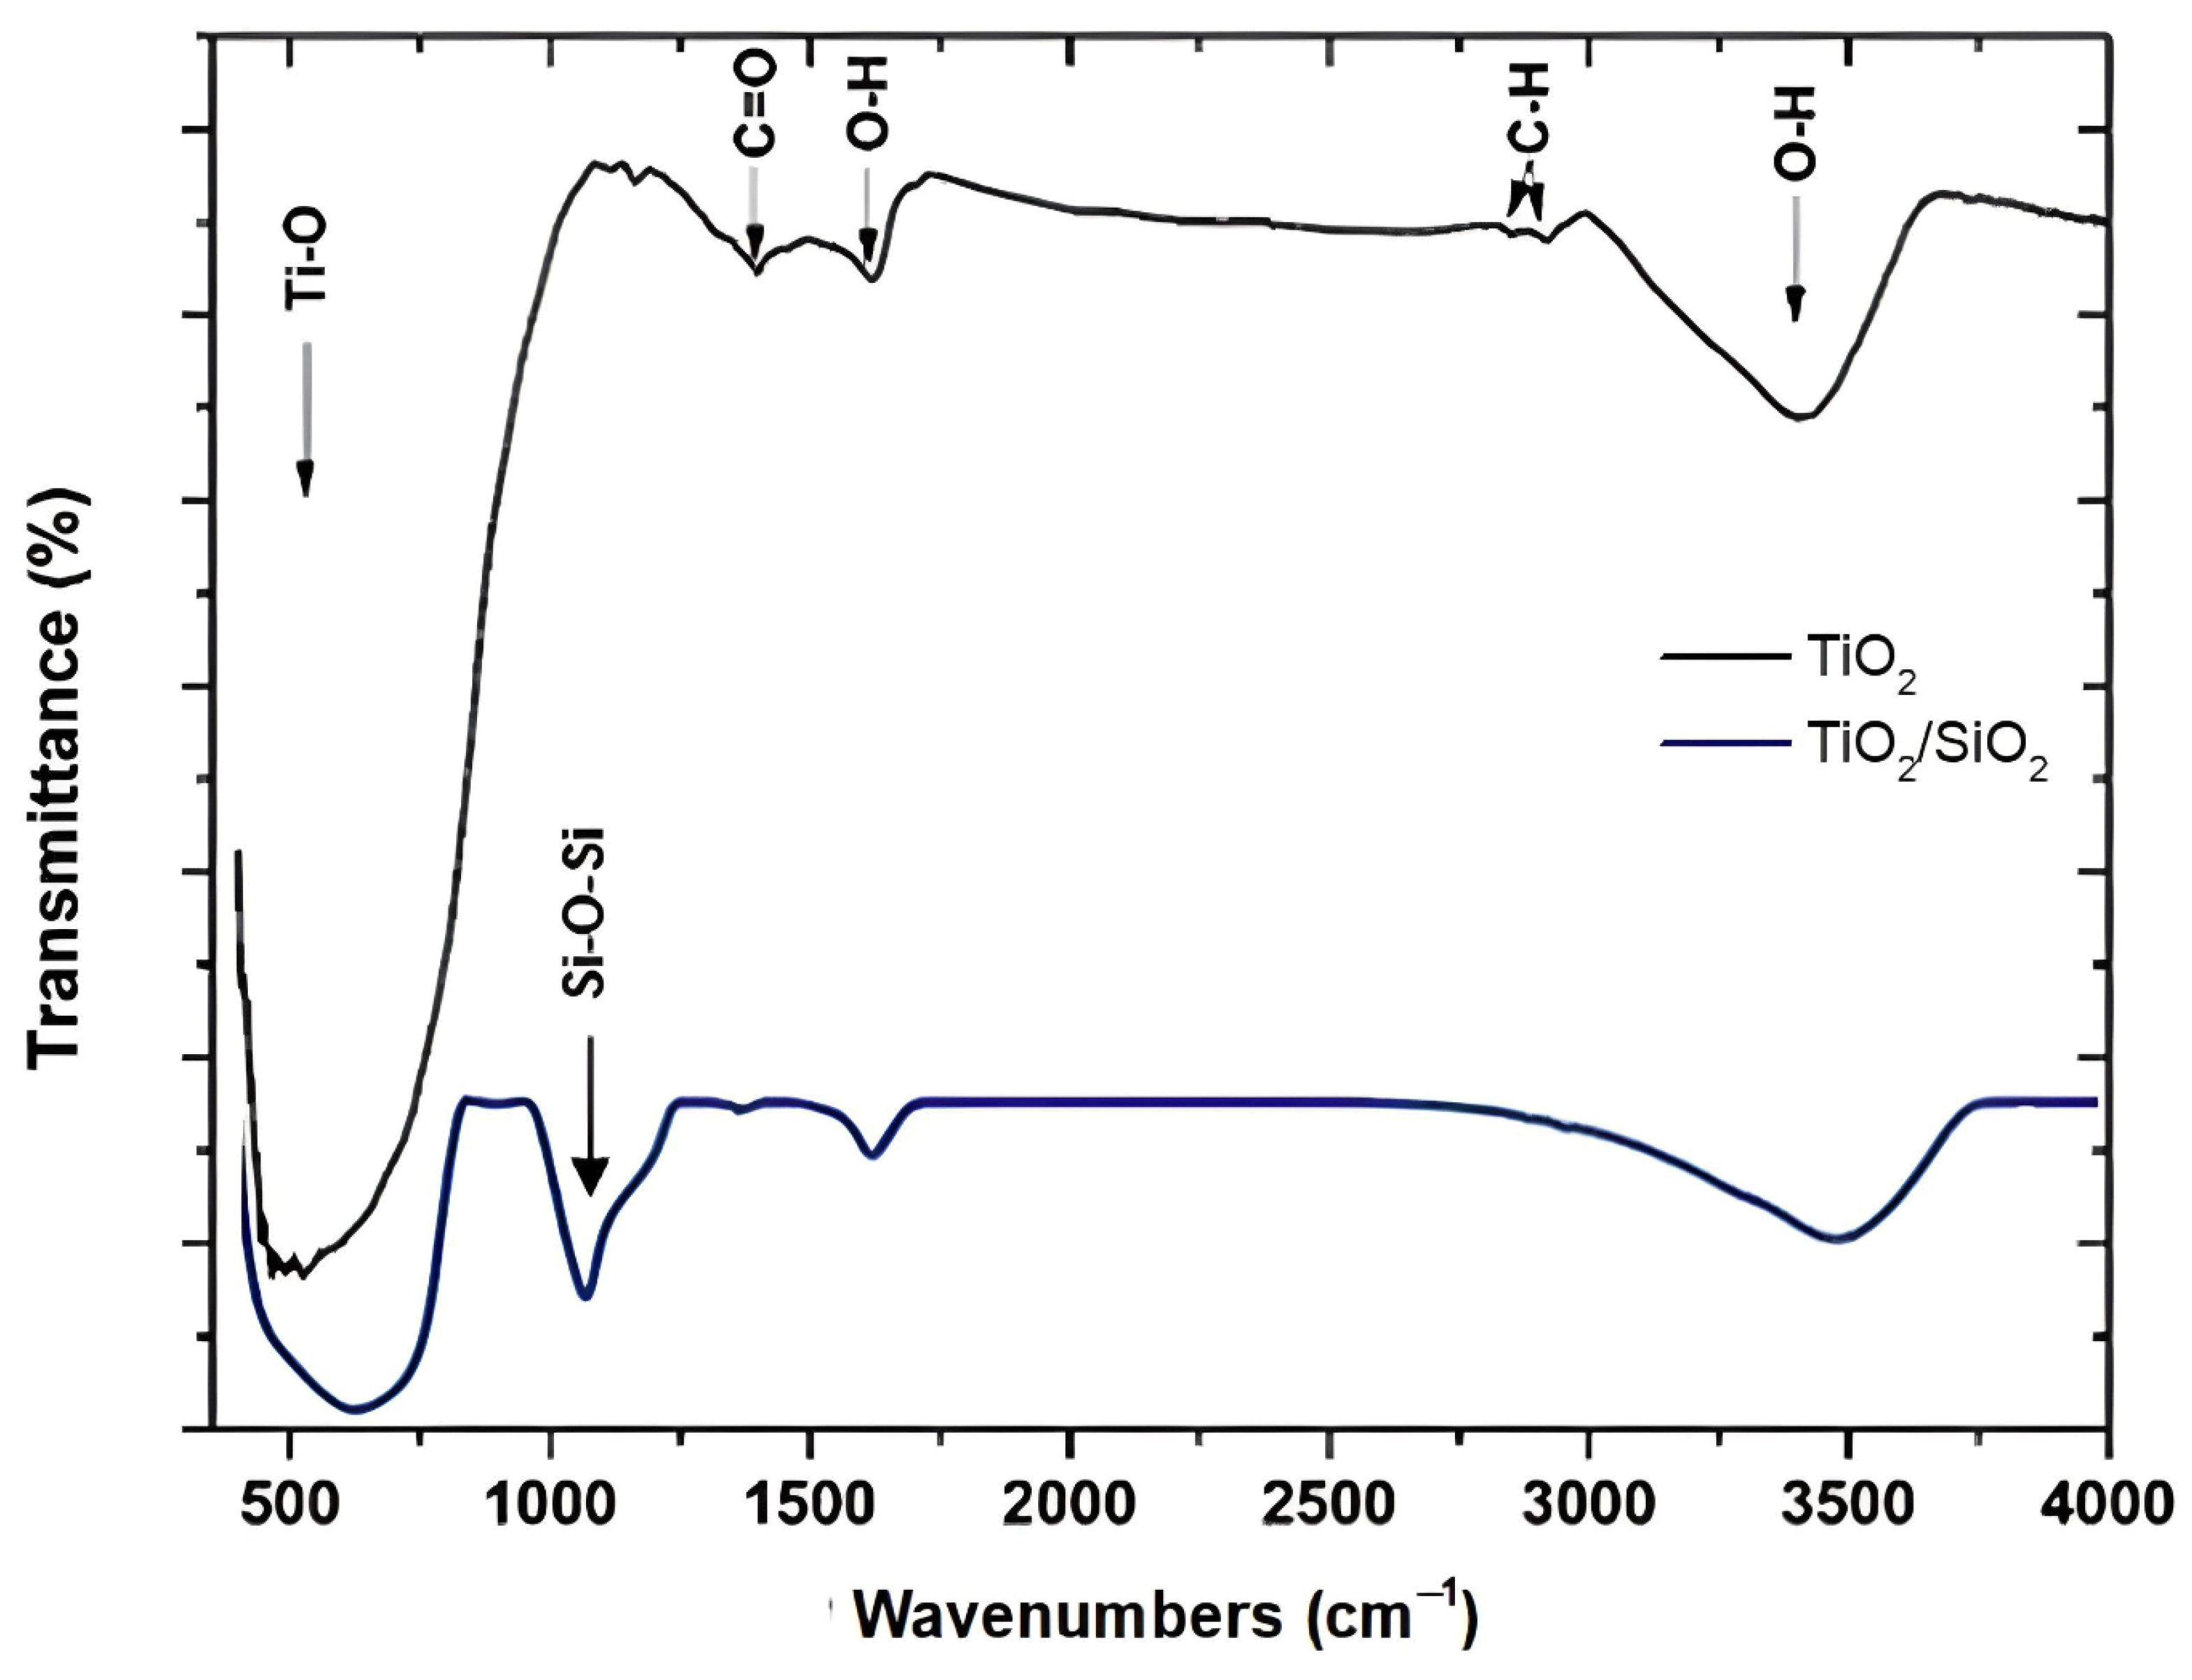
Figure 4.
N2-sorption diagrams of (a) pure TiO2 powder and (b) TiO2/SiO2 composite powder, as indicated (sorption: black line; desorption: red line). Insets show pore size distributions by the BJH method.
Figure 4.
N2-sorption diagrams of (a) pure TiO2 powder and (b) TiO2/SiO2 composite powder, as indicated (sorption: black line; desorption: red line). Insets show pore size distributions by the BJH method.
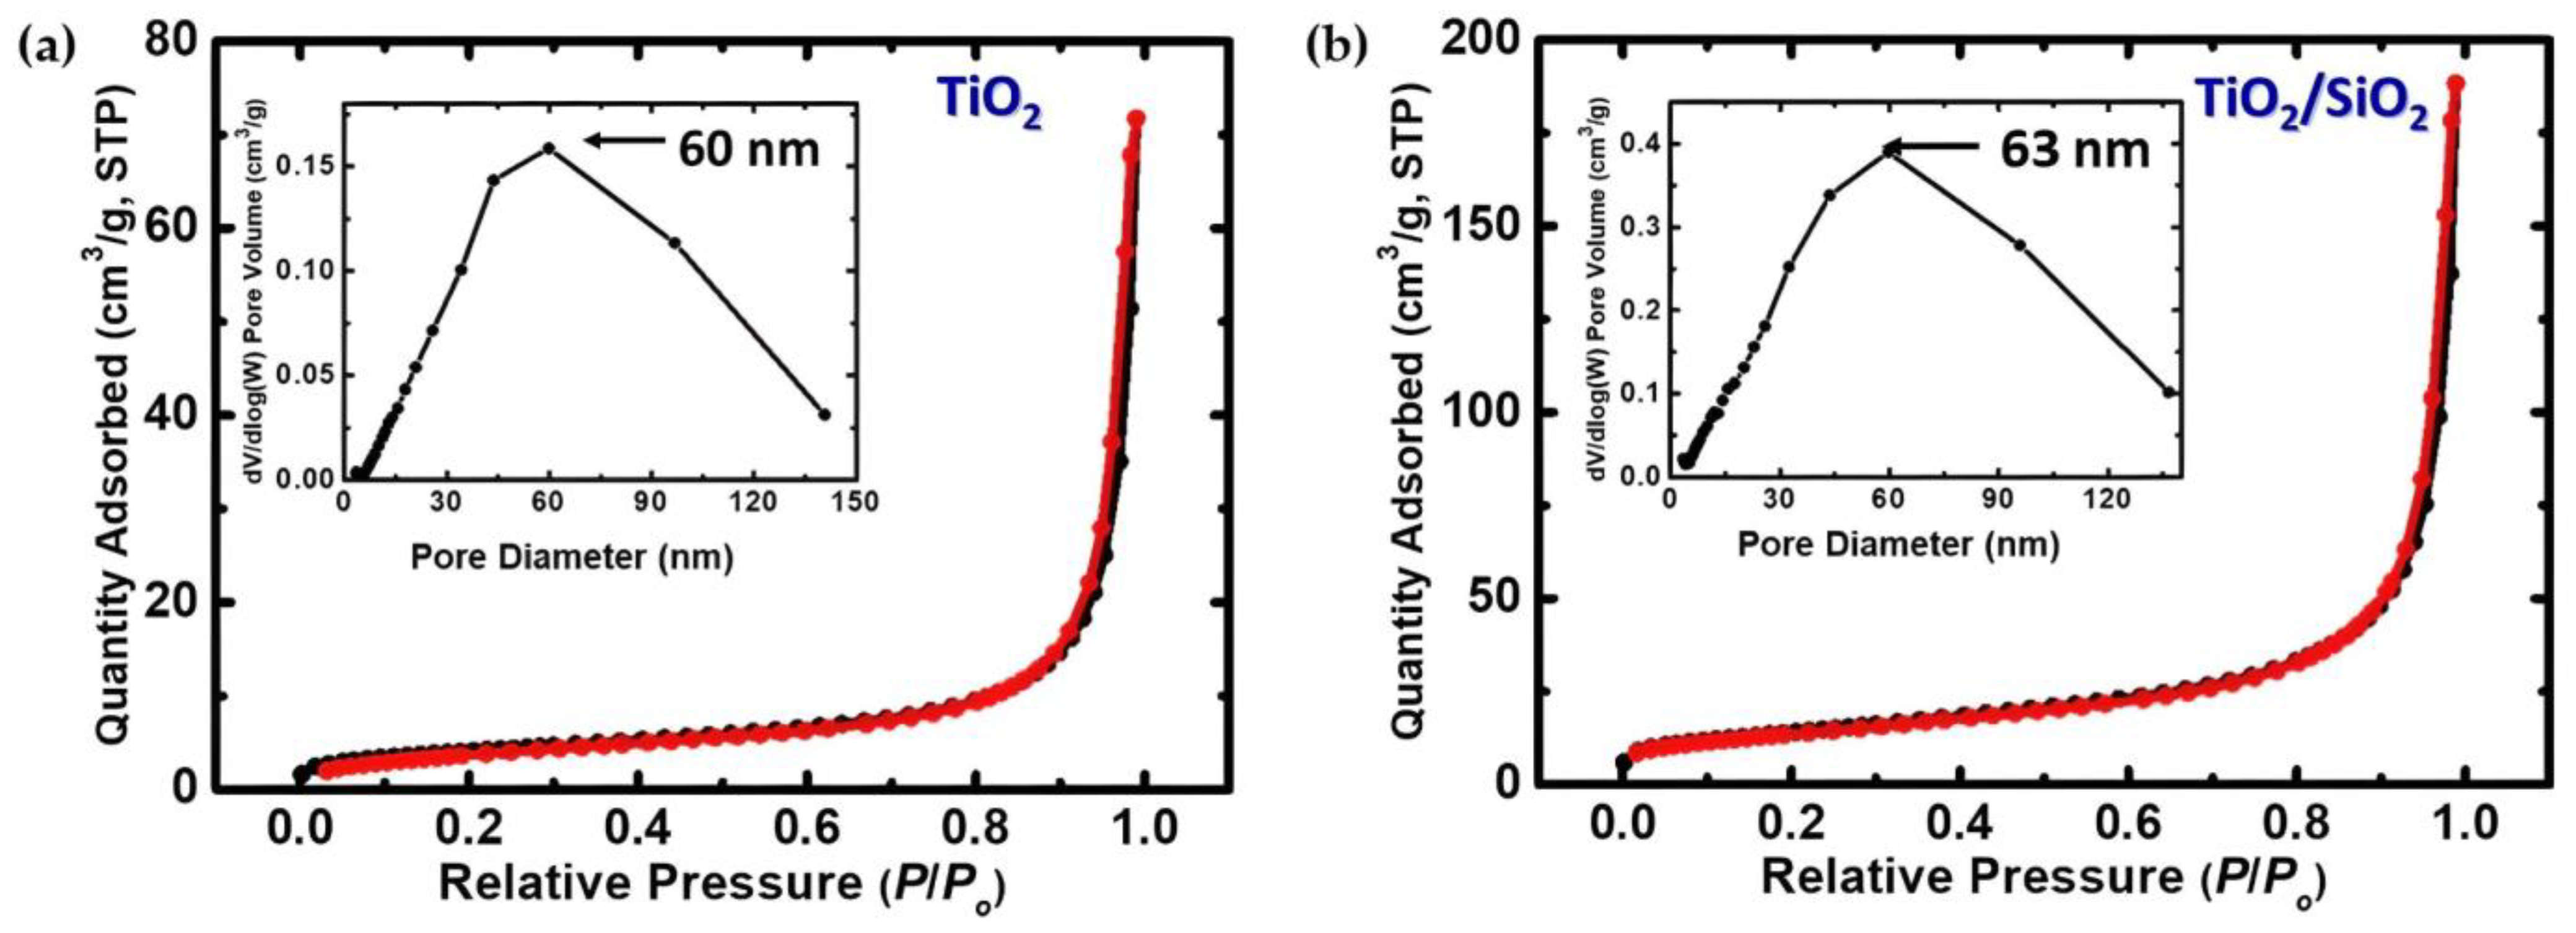
Figure 5.
(a) F(R) reflectance as a function of the wavelength for the studied composite powder and (b) energy band gap (Eg) of the same powder.
Figure 5.
(a) F(R) reflectance as a function of the wavelength for the studied composite powder and (b) energy band gap (Eg) of the same powder.
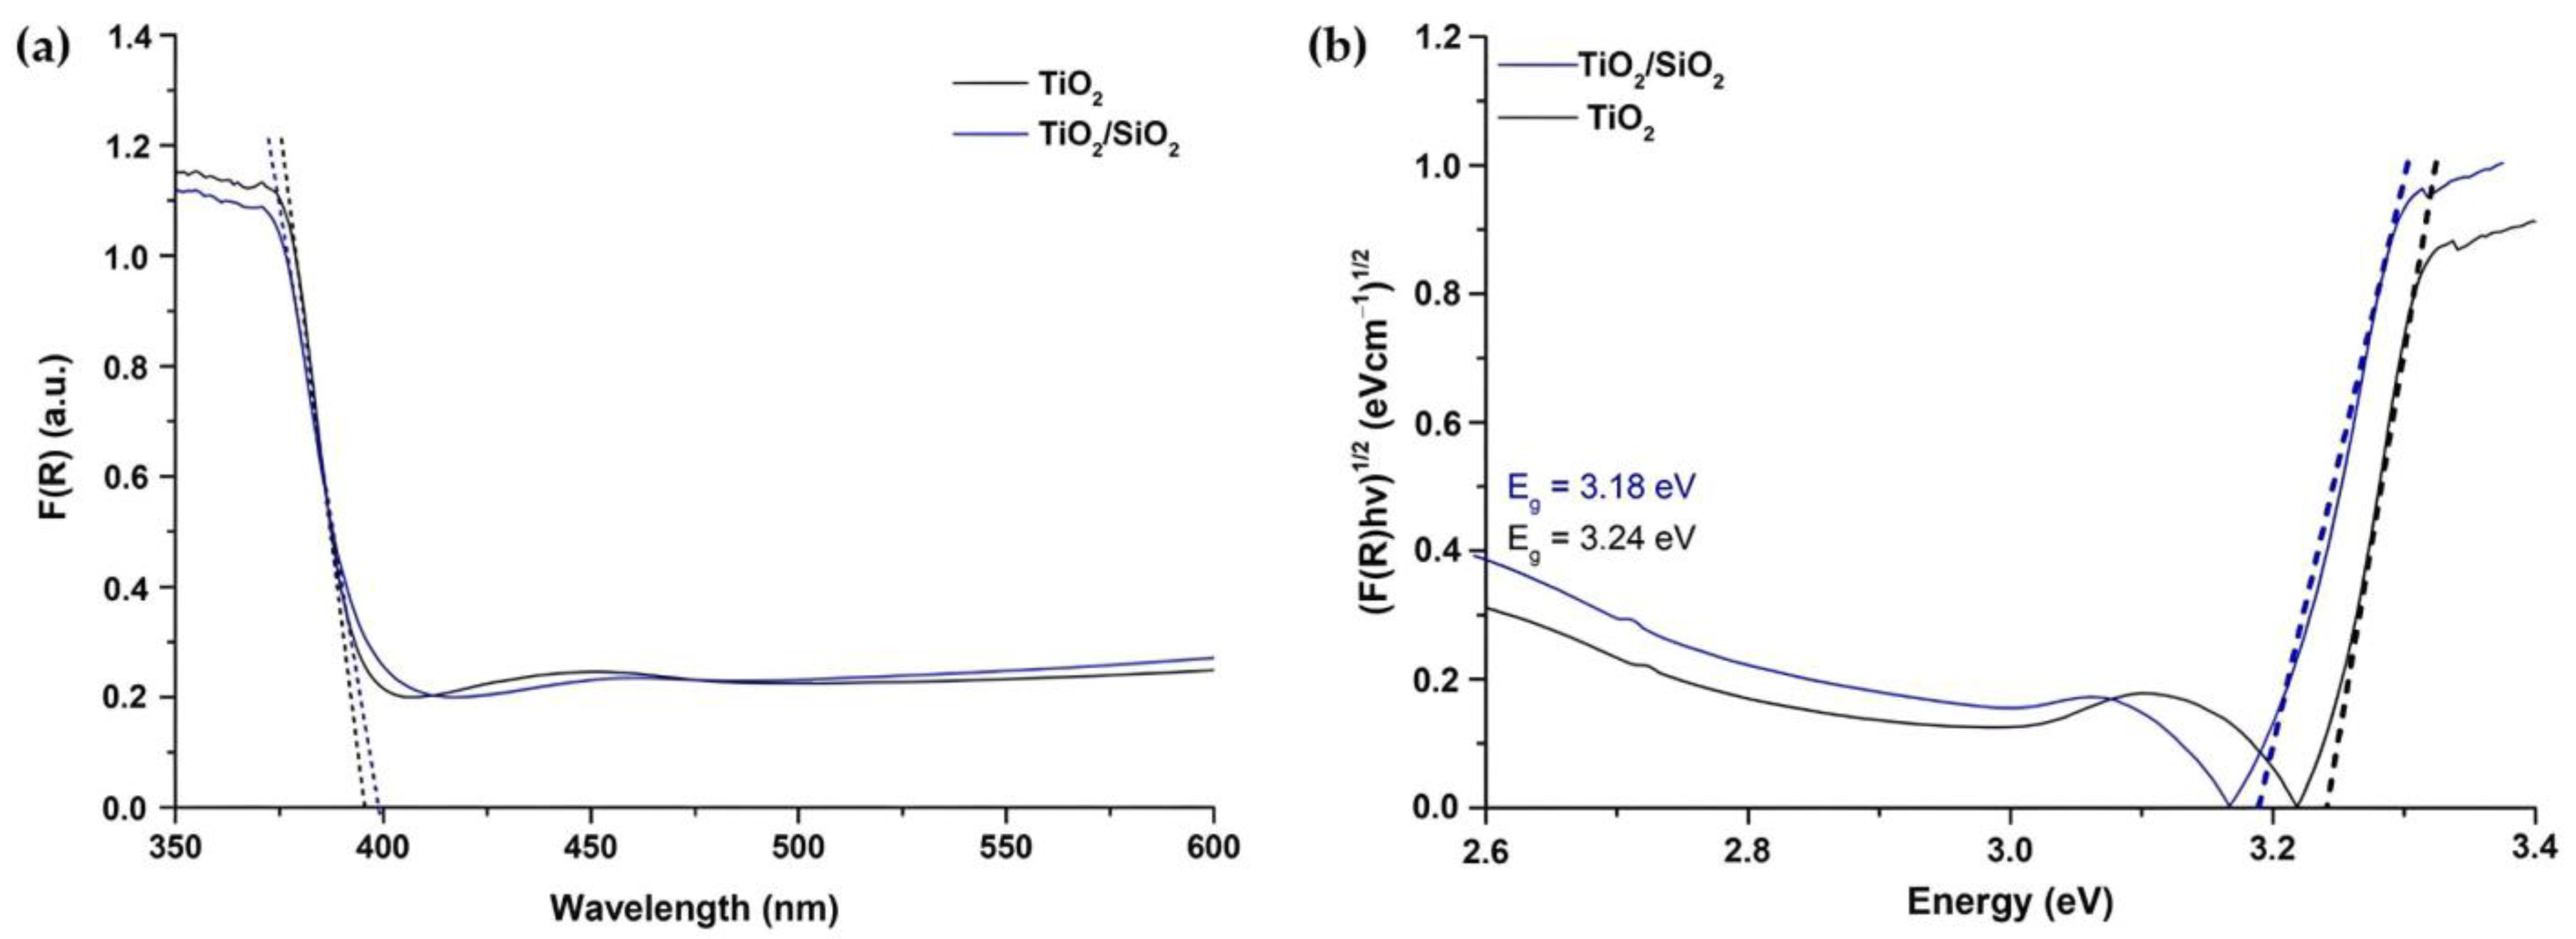
Figure 6.
FESEM images of TiO2 (a), SiO2 (b), and TiO2/SiO2 (c).
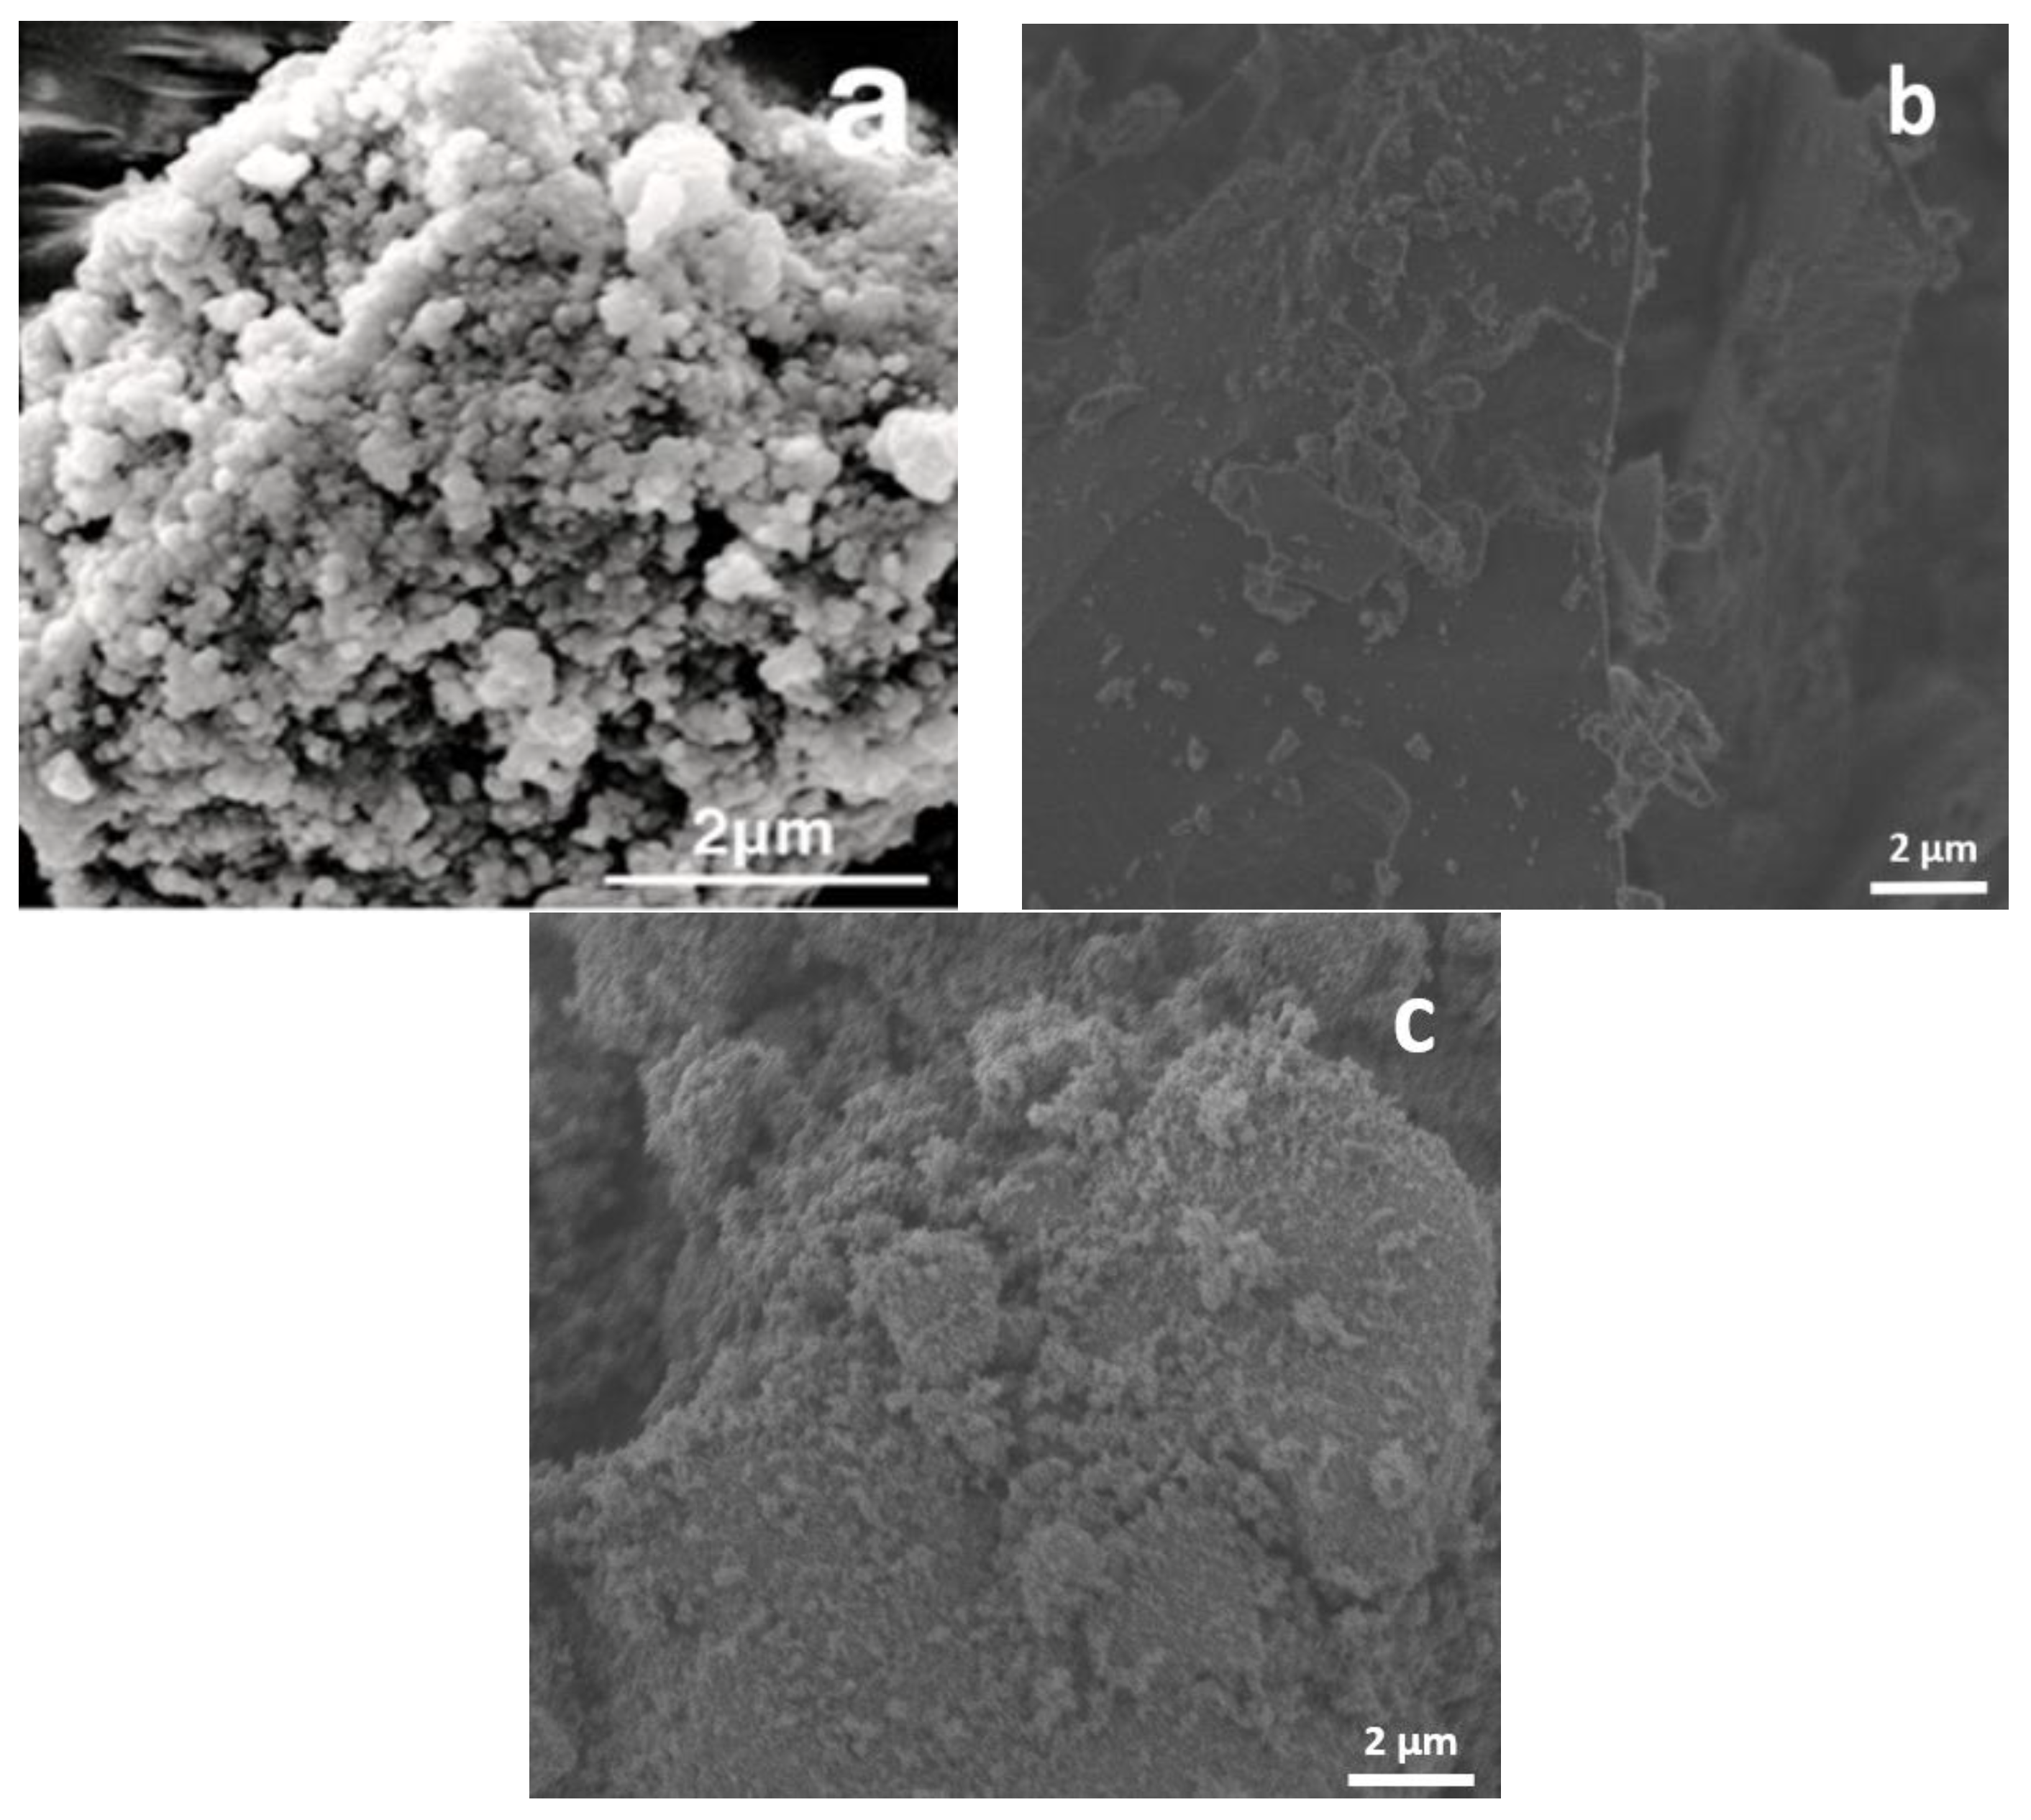
Figure 7.
Degradation curve of RhB for the composite TiO2/SiO2 powder vs. time upon visible-light irradiation. Degradation curves of pure TiO2 and SiO2 are included as reference. The RhB photolysis and its degradation in the dark are also included.
Figure 7.
Degradation curve of RhB for the composite TiO2/SiO2 powder vs. time upon visible-light irradiation. Degradation curves of pure TiO2 and SiO2 are included as reference. The RhB photolysis and its degradation in the dark are also included.
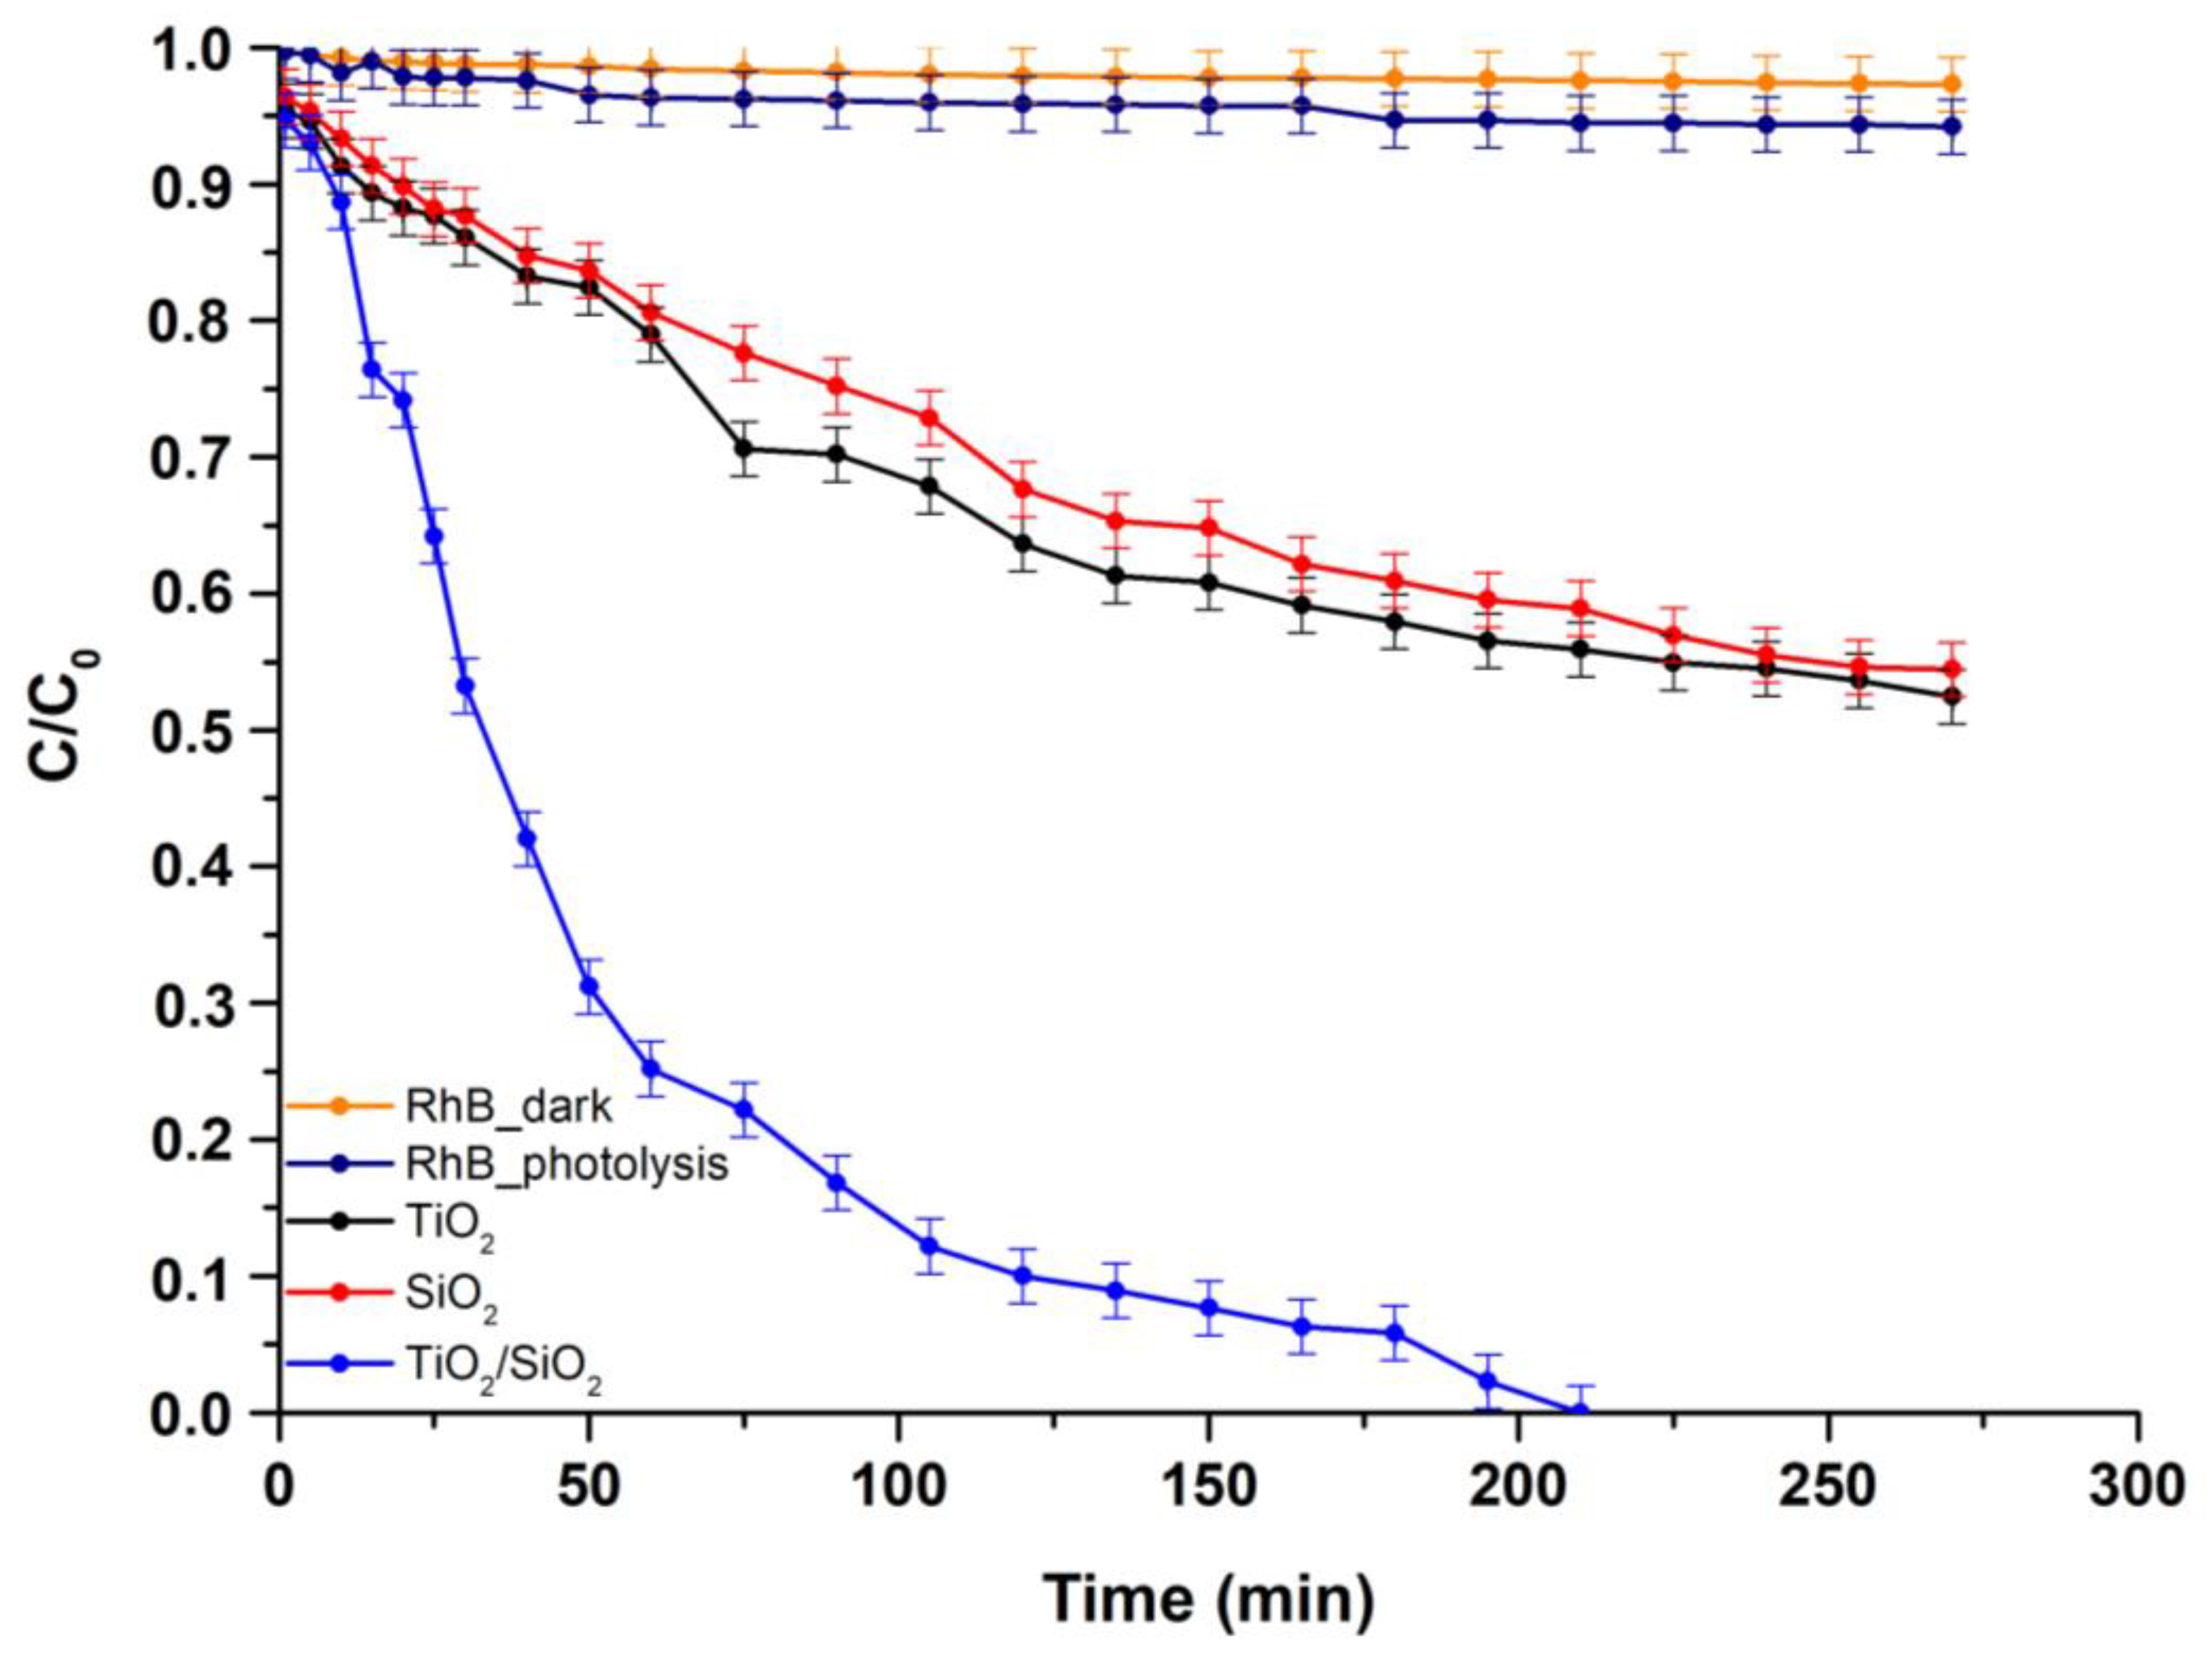
Figure 8.
Photocatalytic kinetic model studies for the tested nanocomposite as well as reference powders, following a pseudo-first-order model under visible-light irradiation photocatalytic experiments.
Figure 8.
Photocatalytic kinetic model studies for the tested nanocomposite as well as reference powders, following a pseudo-first-order model under visible-light irradiation photocatalytic experiments.
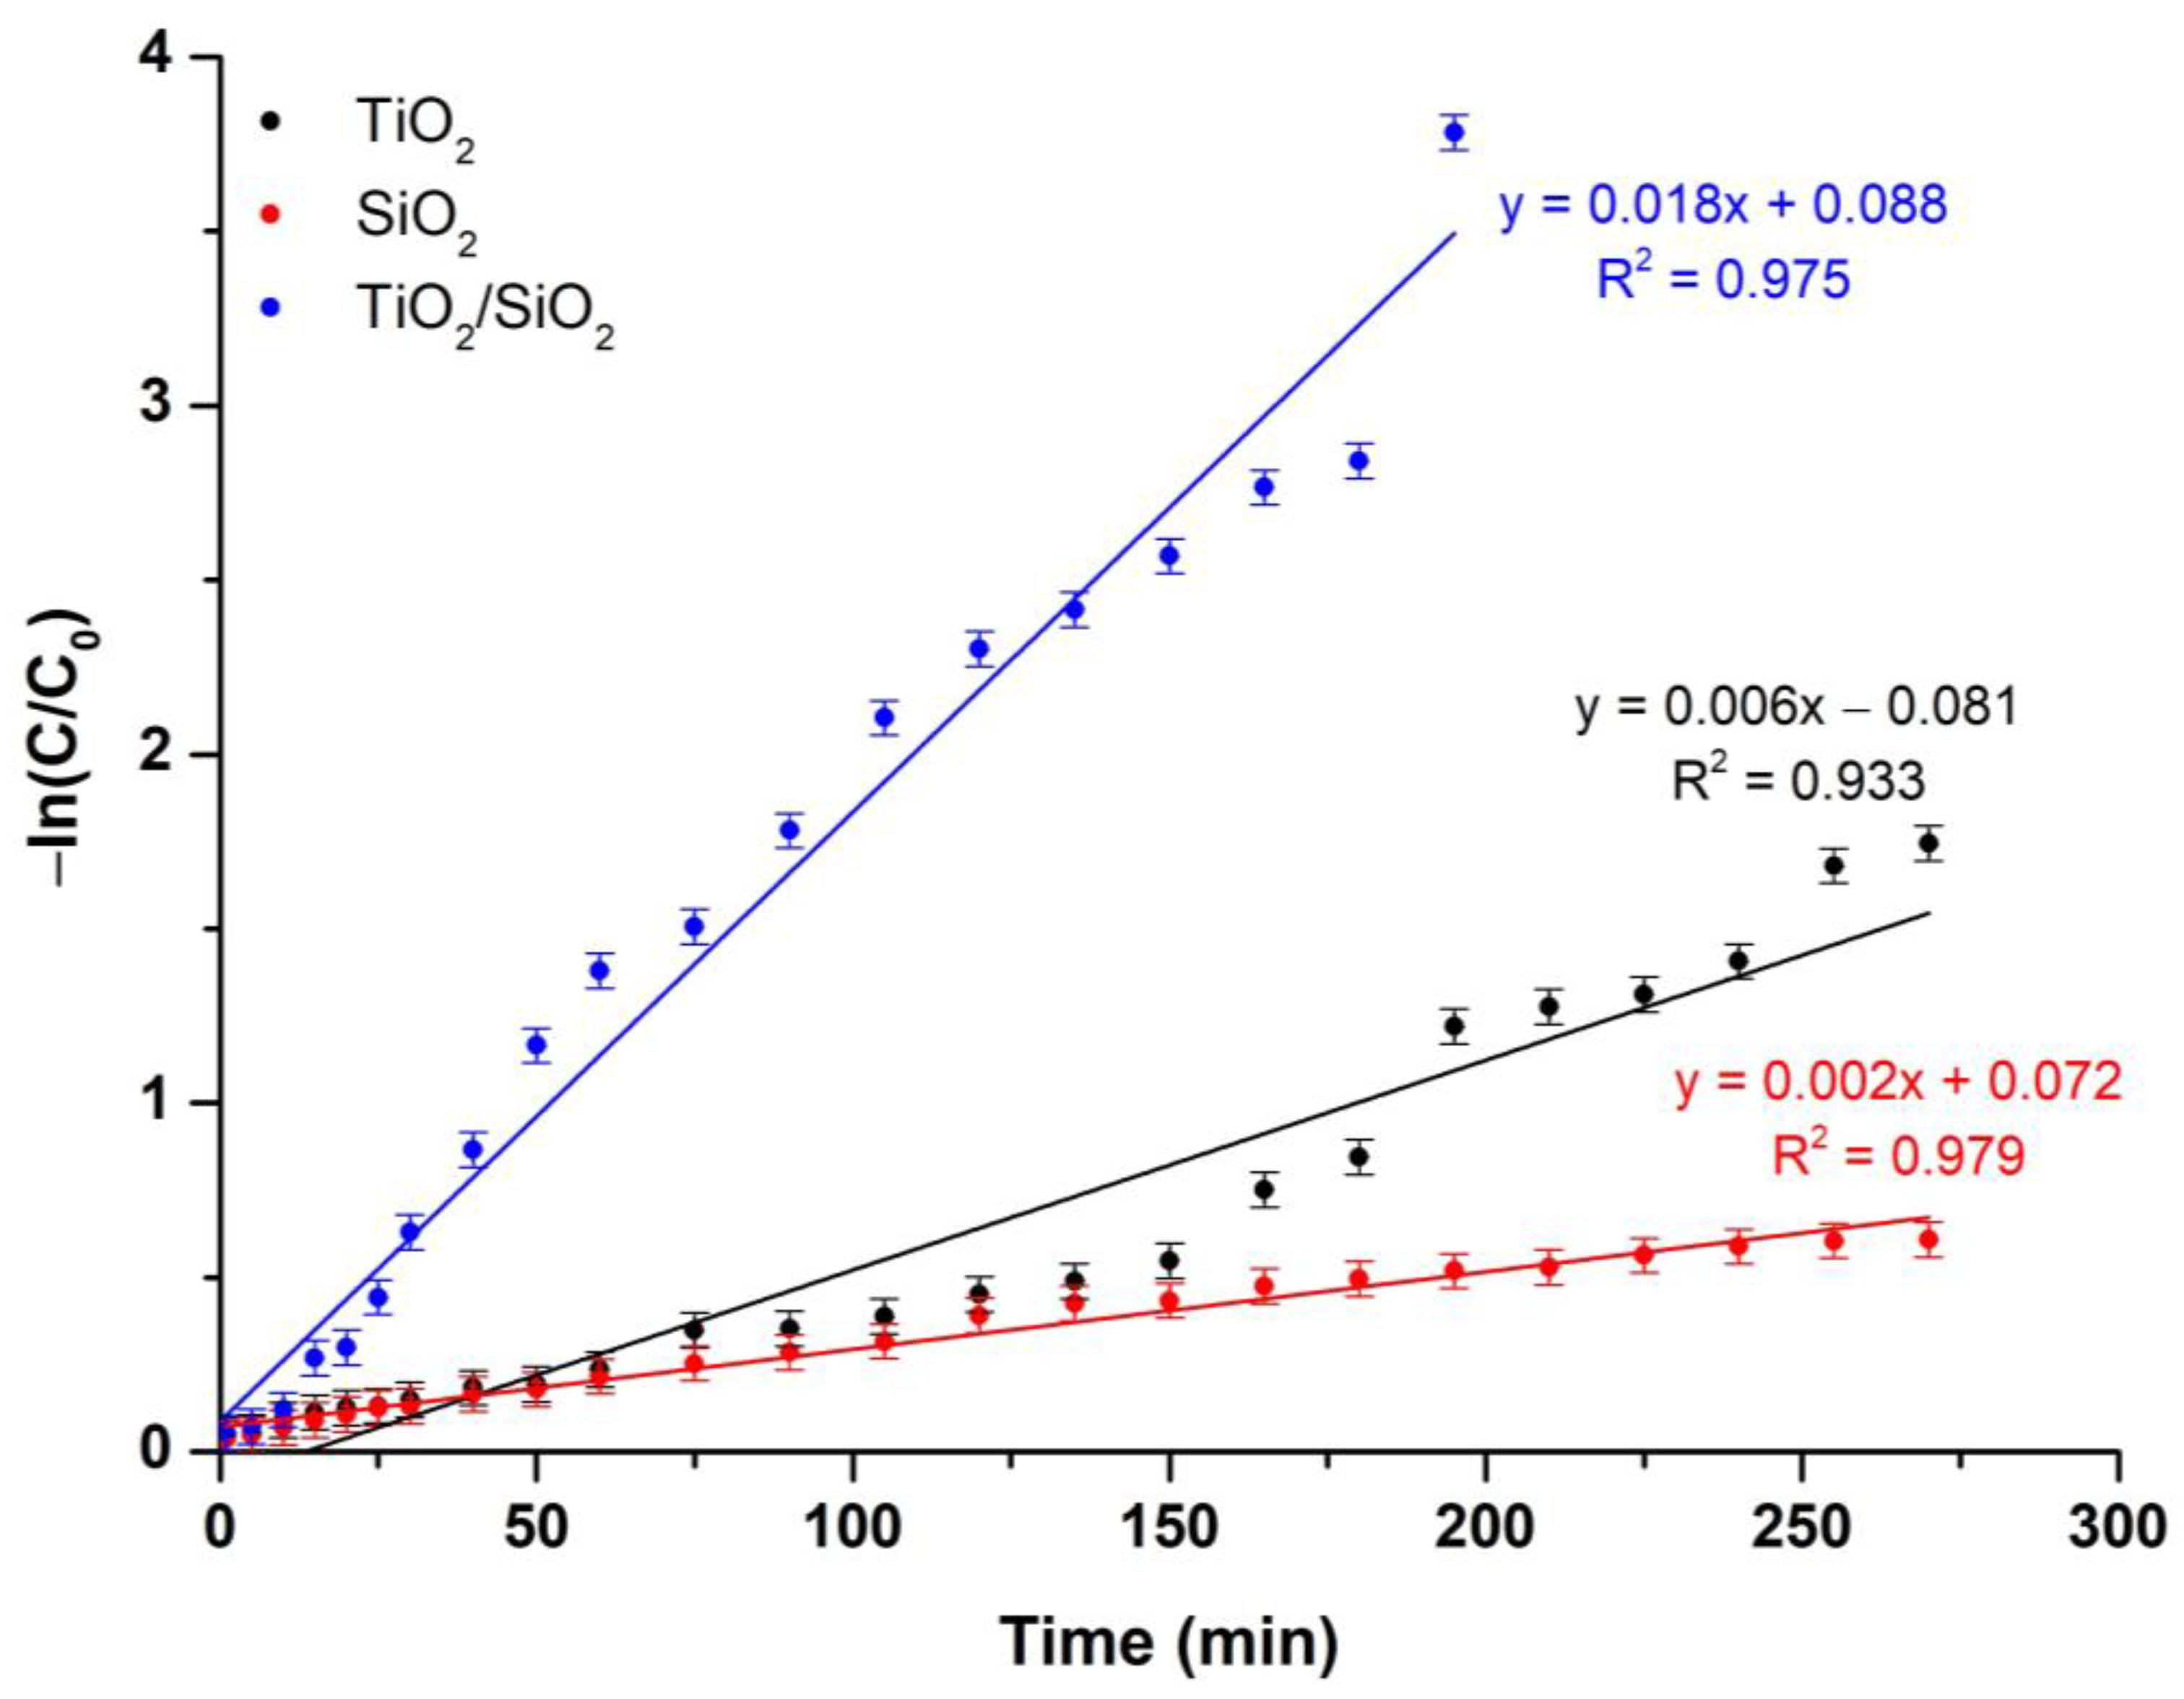
Figure 9.
Photocatalytic kinetic model studies for the examined composite as well as reference powders, following a pseudo-second-order model under visible-light irradiation photocatalytic experiments.
Figure 9.
Photocatalytic kinetic model studies for the examined composite as well as reference powders, following a pseudo-second-order model under visible-light irradiation photocatalytic experiments.
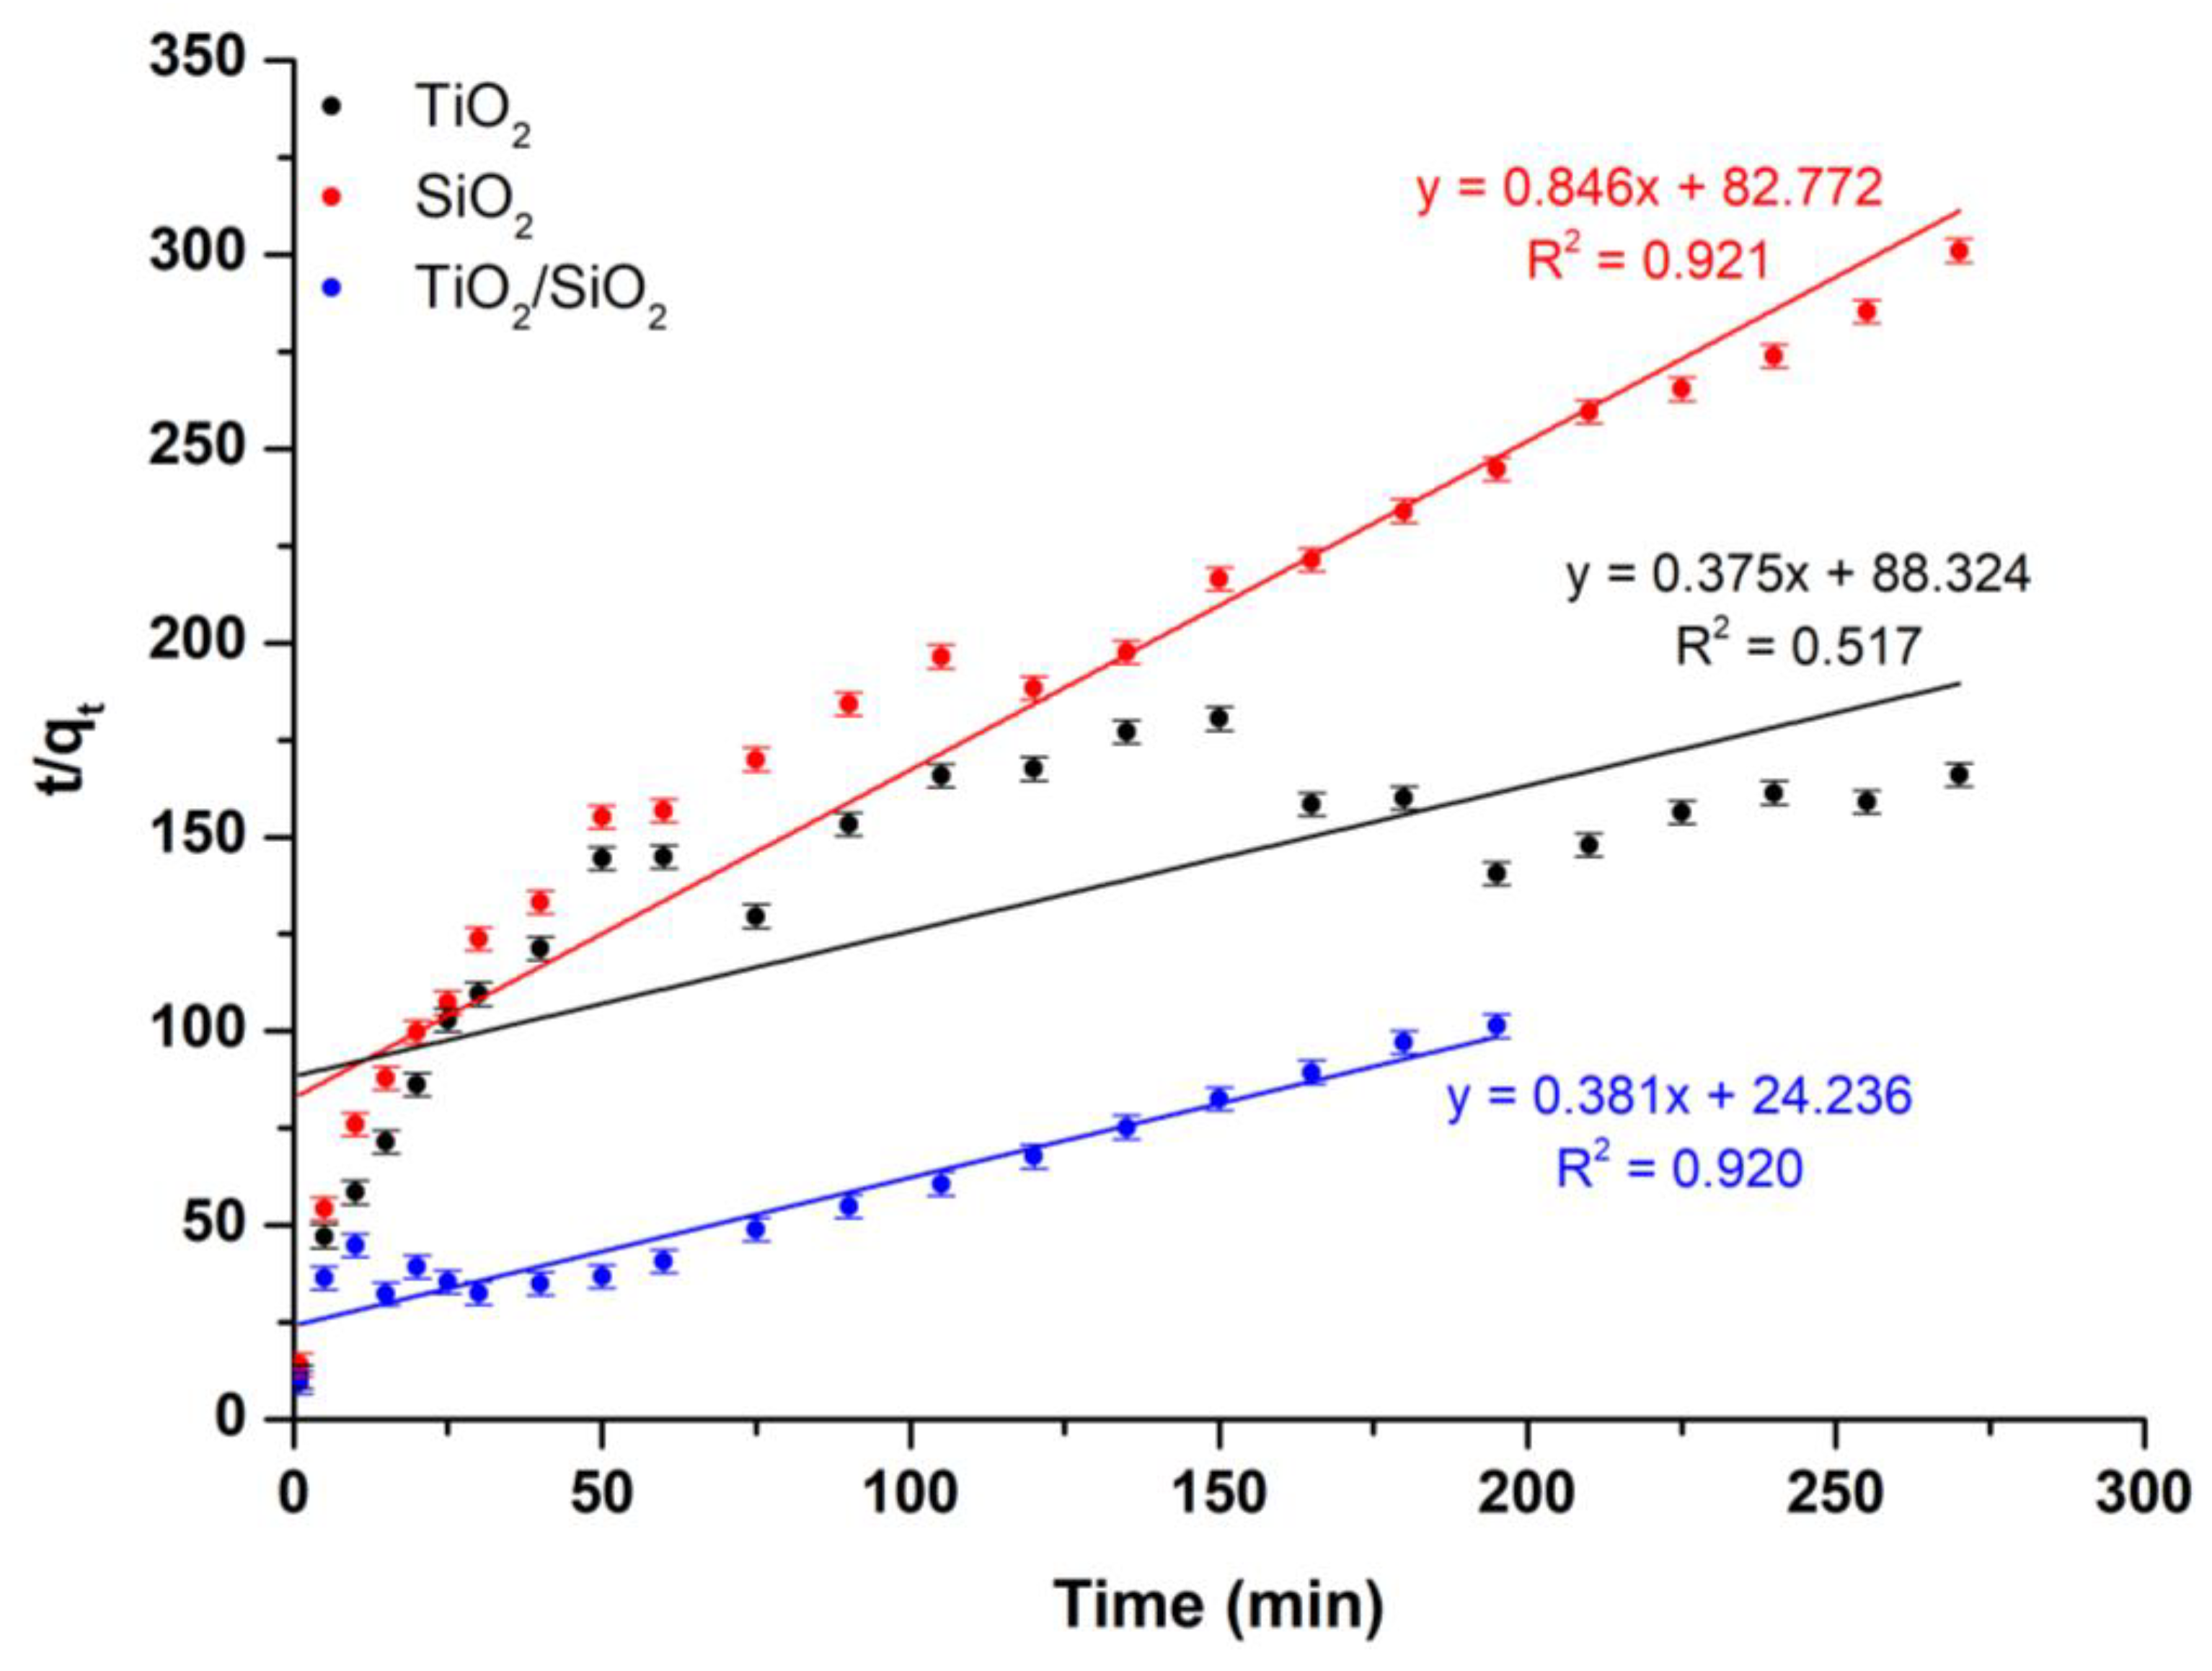
Figure 10.
Scavenging experiments for the RhB degradation over TiO2/SiO2 composite powder upon visible-light irradiation.
Figure 10.
Scavenging experiments for the RhB degradation over TiO2/SiO2 composite powder upon visible-light irradiation.
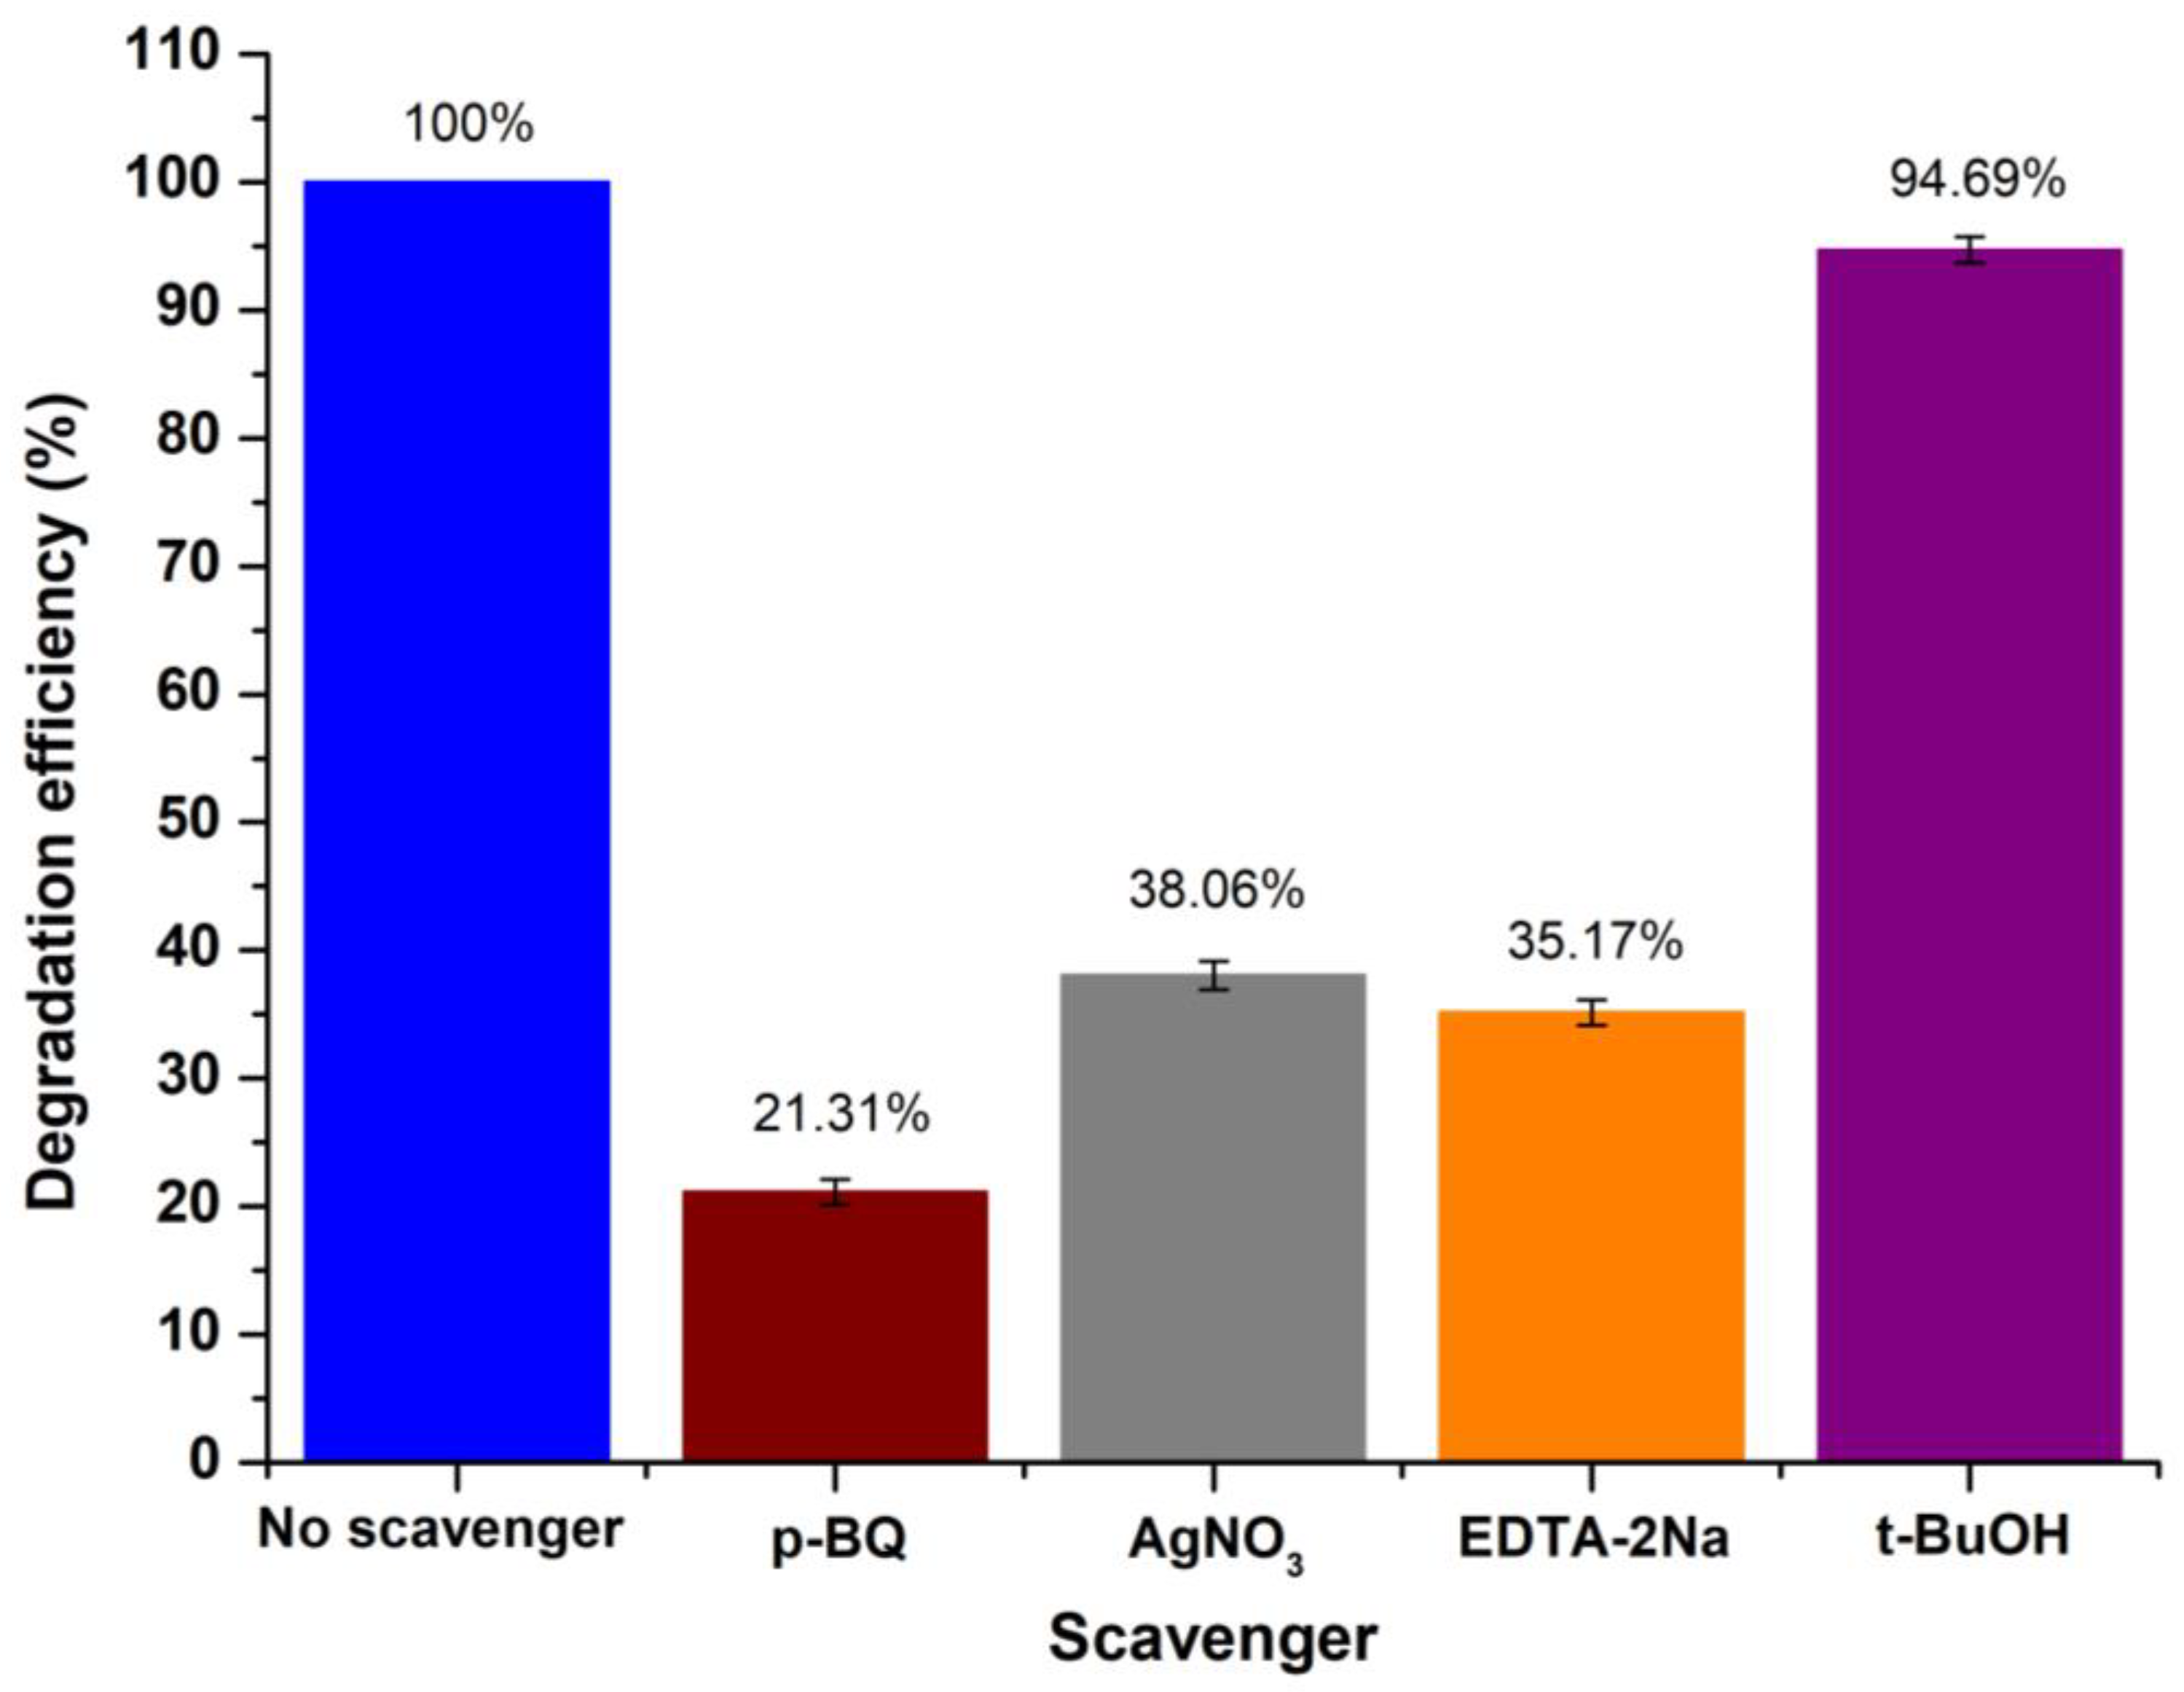
Figure 11.
The proposed photocatalytic mechanism of TiO2/SiO2 composite powder towards RhB degradation upon visible-light irradiation.
Figure 11.
The proposed photocatalytic mechanism of TiO2/SiO2 composite powder towards RhB degradation upon visible-light irradiation.
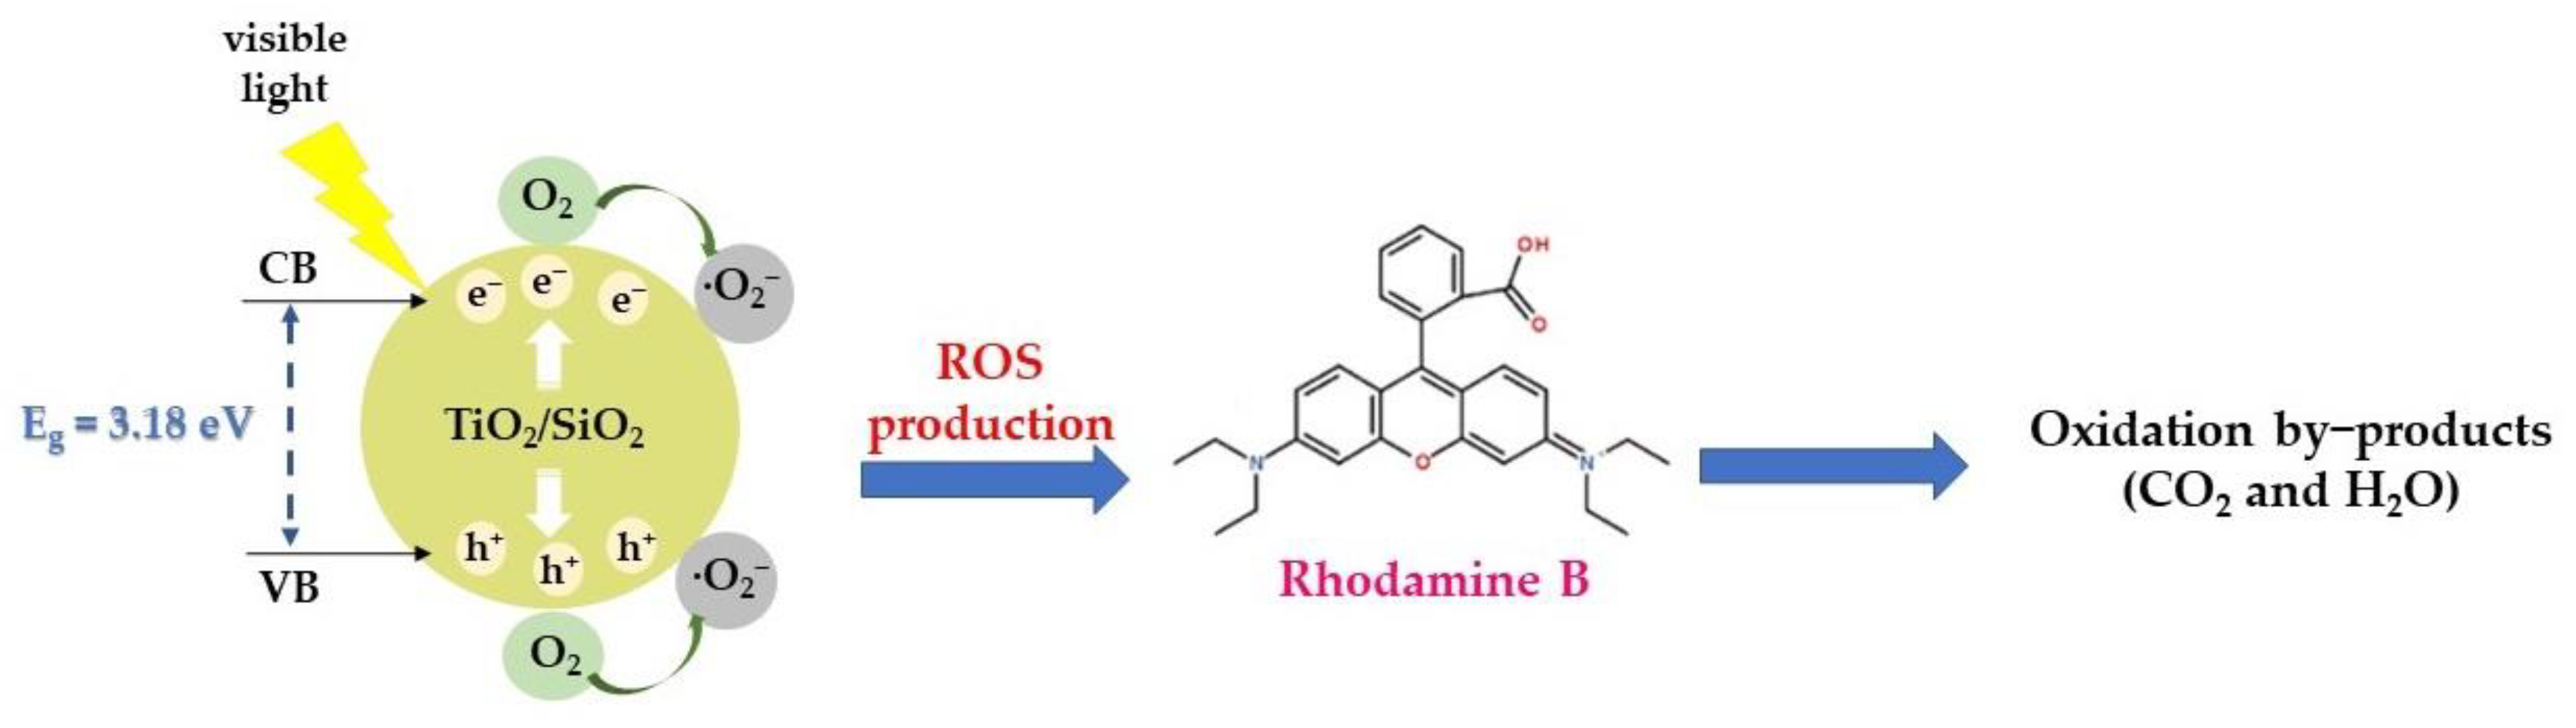
Figure 12.
Degradation curve of phenol for the composite TiO2/SiO2 powder vs. time under visible-light irradiation. Degradation curves of pure TiO2 and SiO2 are included as reference. The phenol photolysis and its degradation in the dark are also included.
Figure 12.
Degradation curve of phenol for the composite TiO2/SiO2 powder vs. time under visible-light irradiation. Degradation curves of pure TiO2 and SiO2 are included as reference. The phenol photolysis and its degradation in the dark are also included.

Figure 13.
Selectivity of the as-prepared composite photocatalyst.

Figure 14.
Photocatalytic kinetic model studies for the nanocomposite as well as reference powders, following a pseudo-first-order model under visible-light irradiation photocatalytic experiments.
Figure 14.
Photocatalytic kinetic model studies for the nanocomposite as well as reference powders, following a pseudo-first-order model under visible-light irradiation photocatalytic experiments.

Figure 15.
Photocatalytic kinetic model studies for the tested nanocomposite as well as reference powders, following a pseudo-second-order model under visible-light irradiation photocatalytic experiments.
Figure 15.
Photocatalytic kinetic model studies for the tested nanocomposite as well as reference powders, following a pseudo-second-order model under visible-light irradiation photocatalytic experiments.
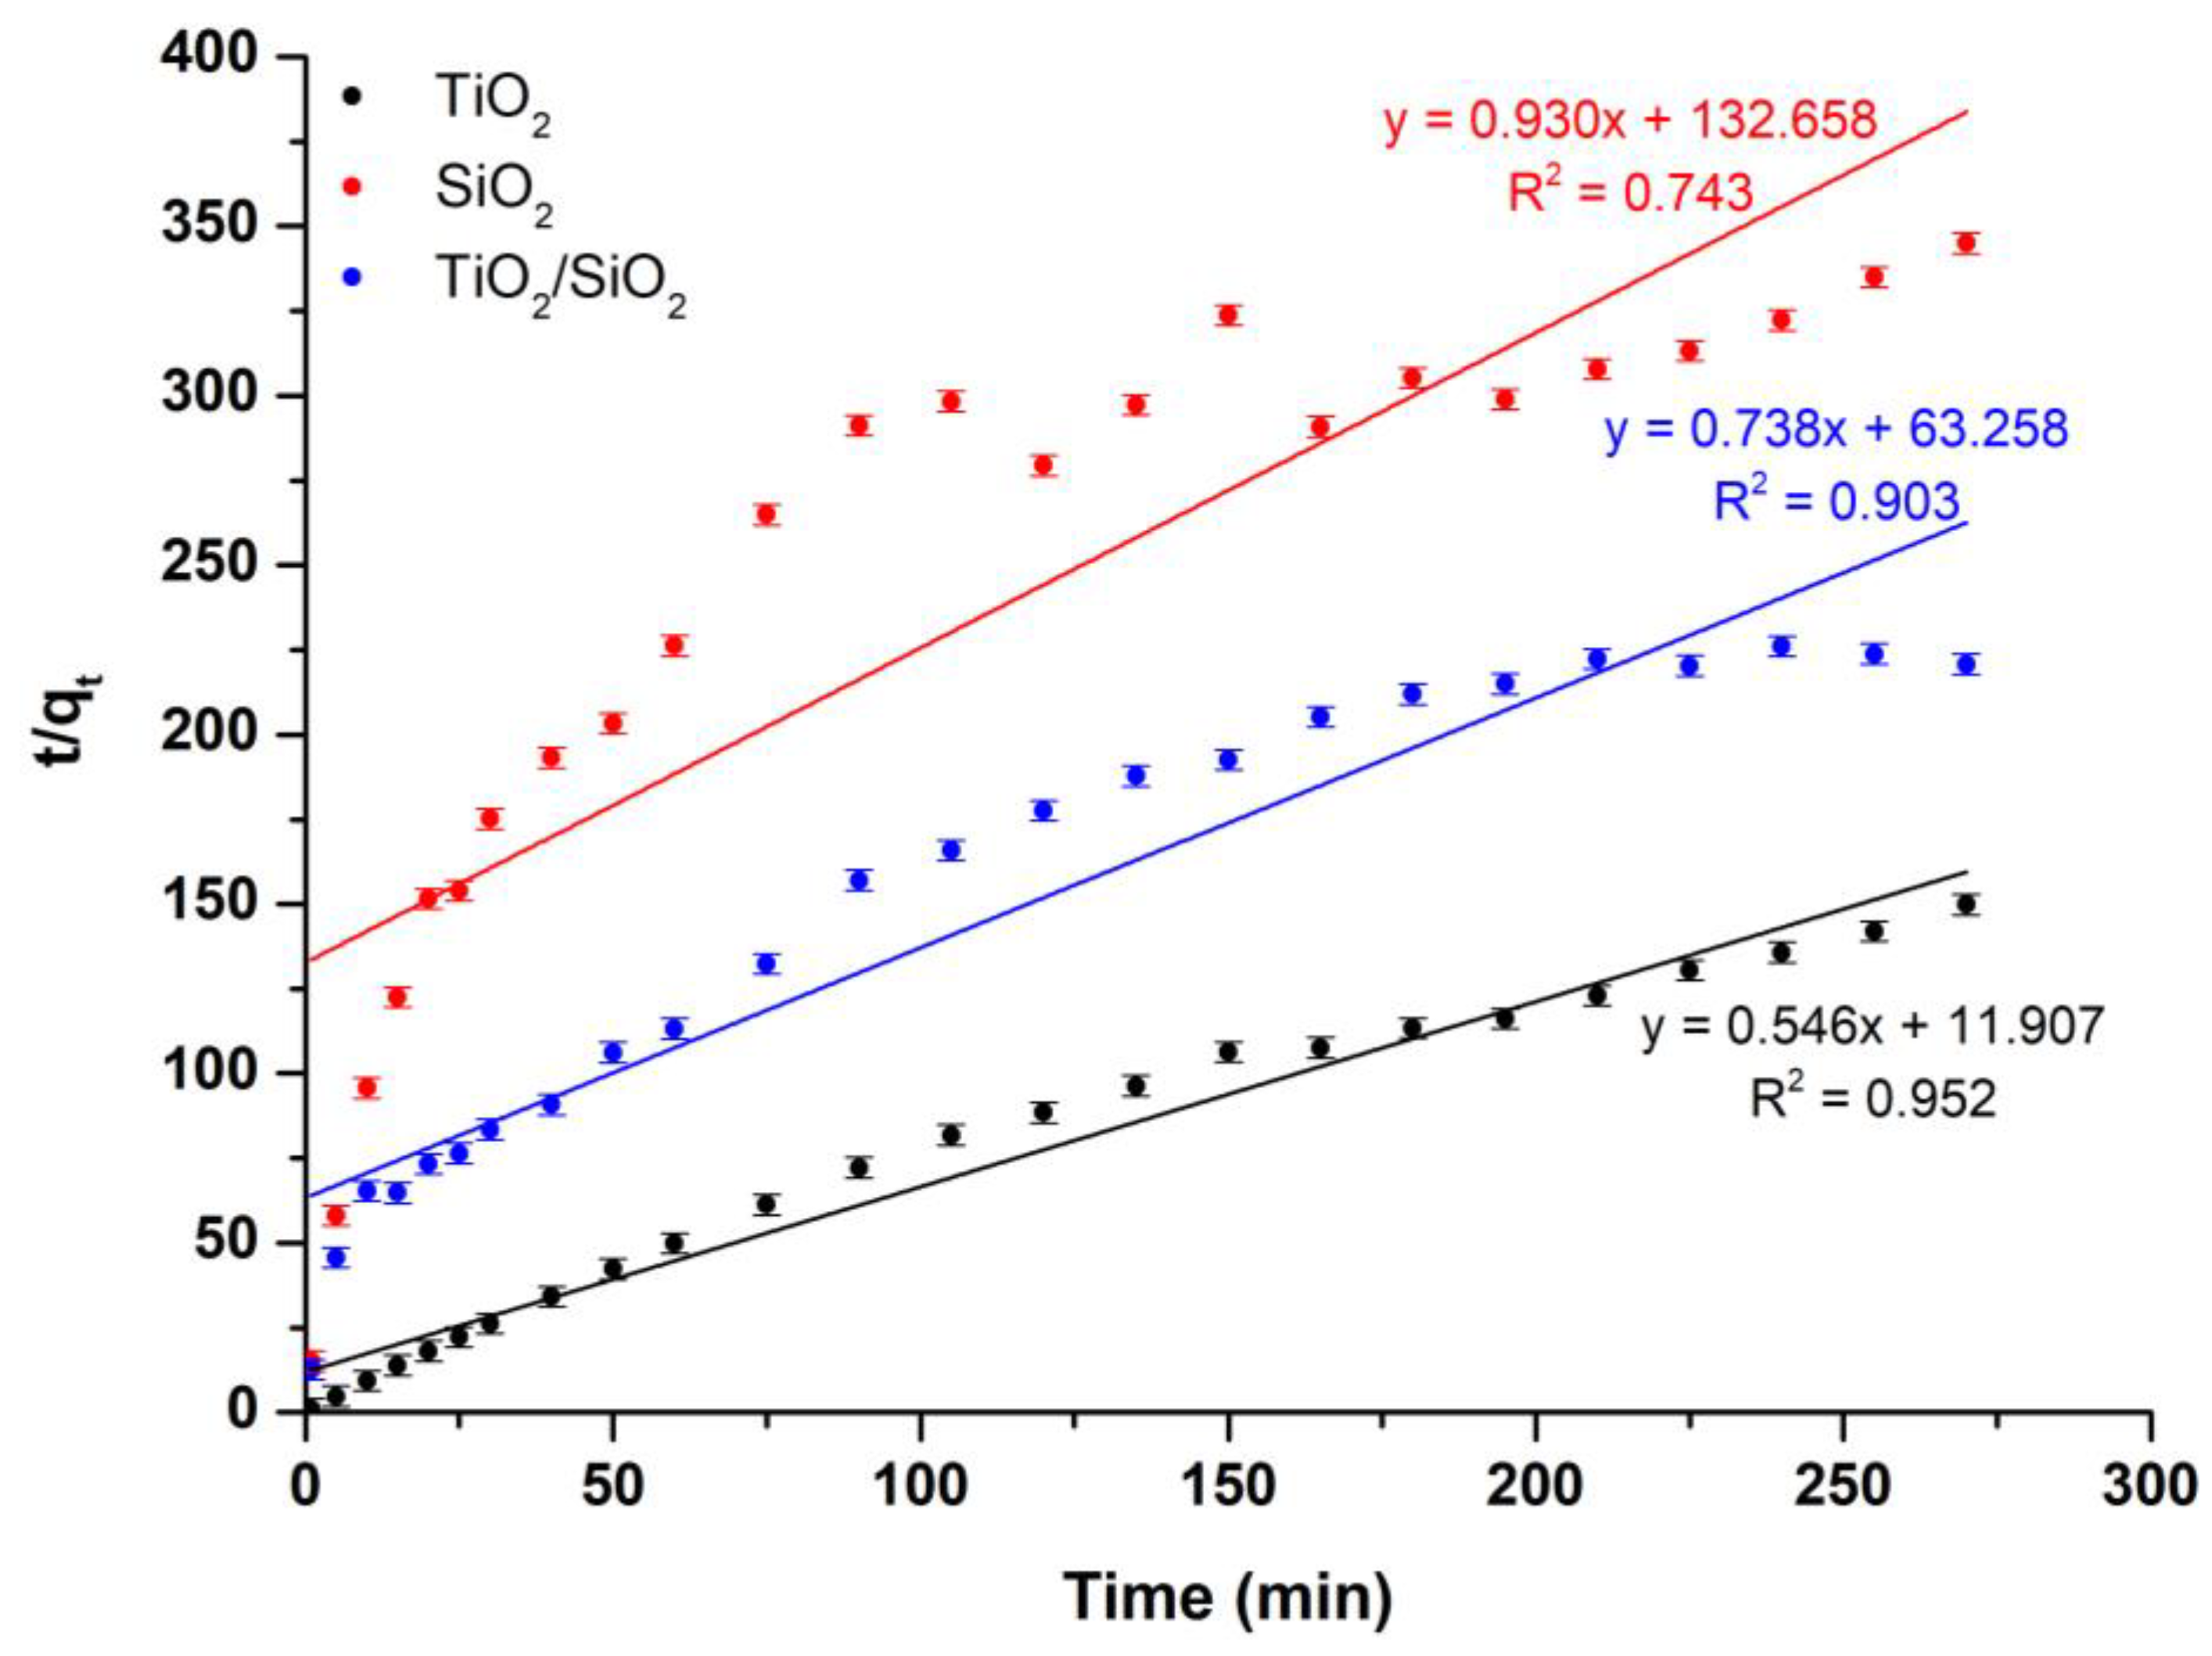
Figure 16.
HPLC and TOC analysis results regarding the decomposition of phenol products during the photoactivation of TiO2/SiO2 composite powder via visible-light irradiation.
Figure 16.
HPLC and TOC analysis results regarding the decomposition of phenol products during the photoactivation of TiO2/SiO2 composite powder via visible-light irradiation.
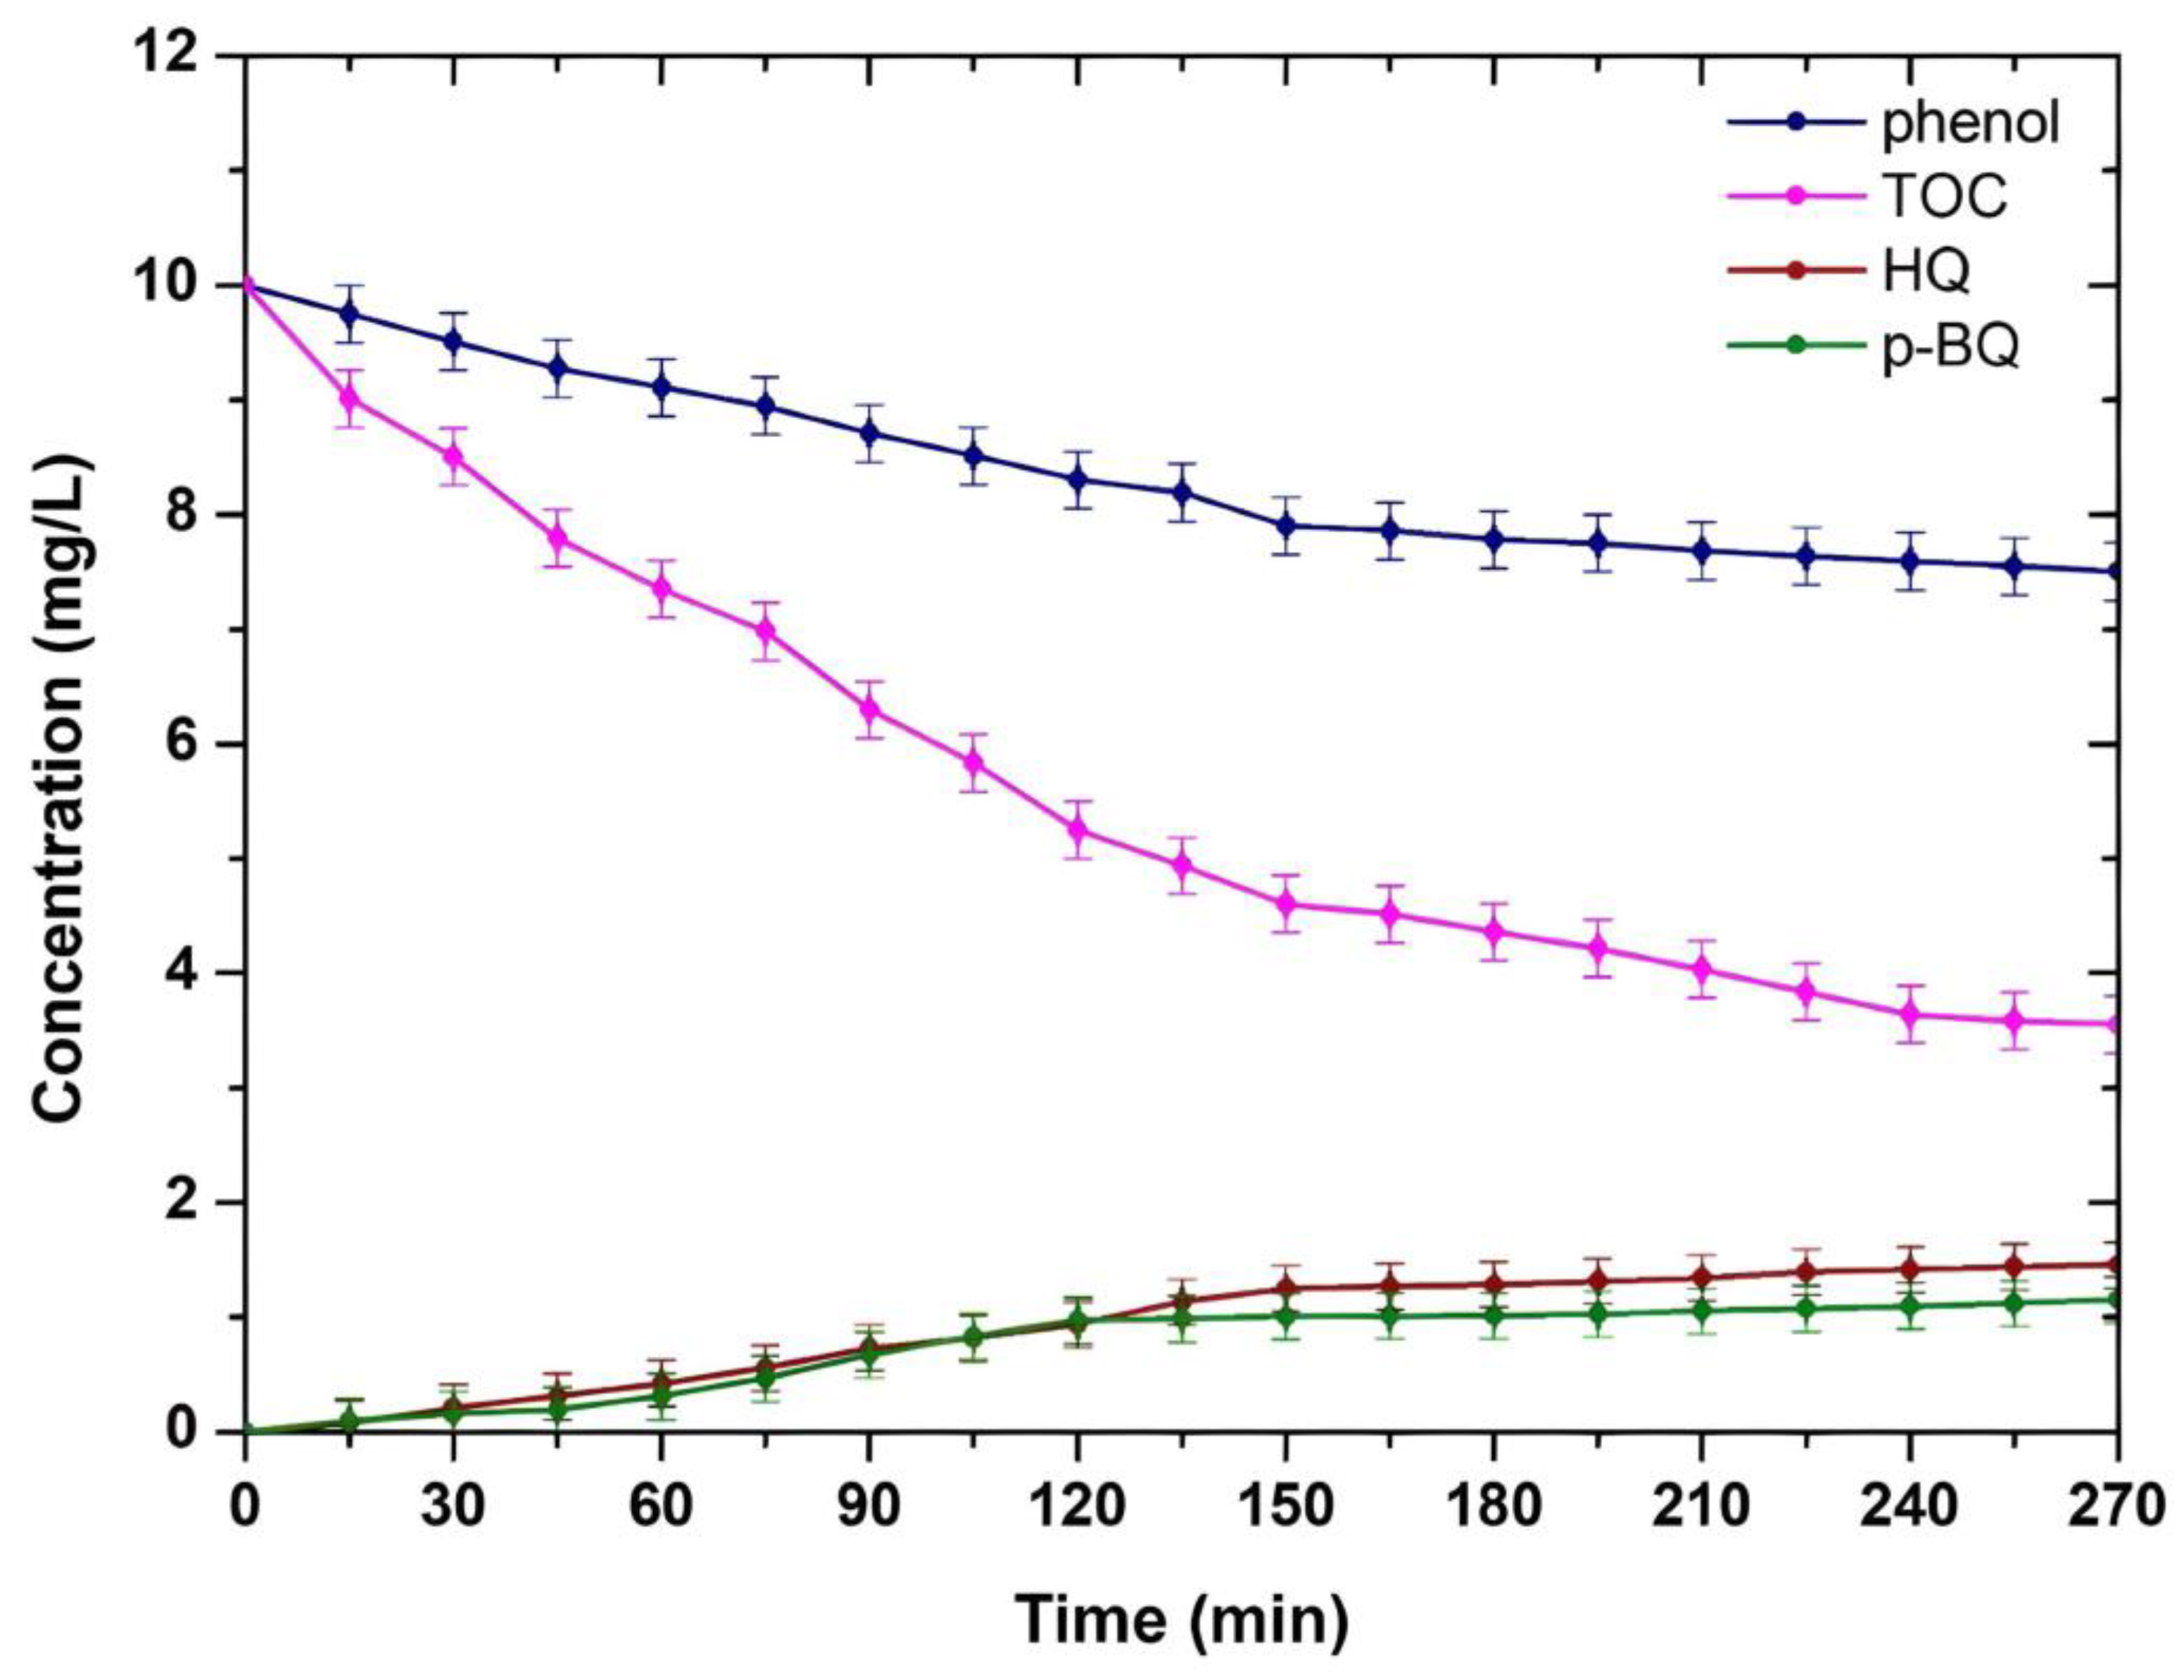
Figure 17.
Scavenging experiments for the degradation of phenol over TiO2/SiO2 composite powder under visible-light irradiation.
Figure 17.
Scavenging experiments for the degradation of phenol over TiO2/SiO2 composite powder under visible-light irradiation.

Figure 18.
The proposed photocatalytic mechanism of TiO2/SiO2 composite powder towards degradation of phenol under visible-light irradiation.
Figure 18.
The proposed photocatalytic mechanism of TiO2/SiO2 composite powder towards degradation of phenol under visible-light irradiation.

Table 1.
Crystallographic parameters of the as-synthesized TiO2/SiO2 powder.
| Sample | Crystalline Phase | Space Group | Phases Percentage |
|---|---|---|---|
| TiO2 | Tetragonal (anatase) Tetragonal (rutile) | I41/a m d P42/m n m | 73.22% 26.78% |
| TiO2/SiO2 | Tetragonal (anatase) | I41/a m d | 100% |
Table 2.
d-spacing calculations for TiO2 powder.
| Bragg’s Angle | dhkl (Å) | dhkl (nm) | hkl | |
|---|---|---|---|---|
| 2θ | θ | |||
| 25.26 | 12.63 | 3.5339 | 0.3534 | 101 (A) |
| 27.36 | 13.68 | 3.2571 | 0.3257 | 110 (R) |
| 36.02 | 18.01 | 2.4914 | 0.2491 | 101 (R) |
| 36.87 | 18.44 | 2.4359 | 0.2436 | 103 (A) |
| 37.72 | 18.86 | 2.3829 | 0.2383 | 004 (A) |
| 38.48 | 19.24 | 2.3376 | 0.2338 | 112 (A) |
| 41.16 | 20.58 | 2.1914 | 0.2191 | 111 (R) |
| 47.99 | 23.99 | 1.8942 | 0.1894 | 200 (A) |
| 53.85 | 26.93 | 1.7011 | 0.1701 | 105 (A) |
| 54.25 | 27.13 | 1.6895 | 0.1689 | 211 (R) |
| 54.97 | 27.49 | 1.6691 | 0.1669 | 211 (A) |
| 62.67 | 31.34 | 1.4812 | 0.1481 | 204 (A) |
| 68.84 | 34.42 | 1.3627 | 0.1363 | 116 (A) |
| 70.29 | 35.15 | 1.3381 | 0.1338 | 220 (A) |
| 74.99 | 37.49 | 1.2655 | 0.1266 | 215 (A) |
| 82.81 | 41.41 | 1.1647 | 0.1165 | 224 (A) |
Table 3.
d-spacing calculations for TiO2/SiO2 powder.
| Bragg’s Angle | dhkl (Å) | dhkl (nm) | hkl | |
|---|---|---|---|---|
| 2θ | θ | |||
| 25.26 | 12.63 | 3.5202 | 0.35202 | 101 (A) |
| 36.85 | 18.43 | 2.4894 | 0.24894 | 103 (A) |
| 37.80 | 18.90 | 2.3781 | 0.23781 | 004 (A) |
| 38.55 | 19.28 | 2.3335 | 0.23335 | 112 (A) |
| 48.05 | 24.03 | 1.8920 | 0.18920 | 200 (A) |
| 53.93 | 26.97 | 1.6988 | 0.16988 | 105 (A) |
| 55.07 | 27.54 | 1.6663 | 0.16663 | 211 (A) |
| 62.72 | 31.36 | 1.4802 | 0.14802 | 204 (A) |
| 68.94 | 34.47 | 1.3610 | 0.13610 | 116 (A) |
| 70.32 | 35.16 | 1.3376 | 0.13376 | 220 (A) |
| 75.09 | 37.55 | 1.2641 | 0.12641 | 215 (A) |
| 82.65 | 41.33 | 1.1665 | 0.11665 | 224 (A) |
Table 4.
Crystal lattice indices, average crystallite size, FWHM (full width at half maximum), and crystallinity of the produced TiO2/SiO2 powder.
Table 4.
Crystal lattice indices, average crystallite size, FWHM (full width at half maximum), and crystallinity of the produced TiO2/SiO2 powder.
| Sample | Crystal Lattice Index (a = b ≠ c) | Average Crystallite Size (nm) | FWHM | Crystallinity (%) | ||
|---|---|---|---|---|---|---|
| a | b | c | ||||
| TiO2 | 3.7833 | 3.7833 | 9.4929 | 3.17 | 0.3330 | 69.49 |
| TiO2/SiO2 | 3.7885 | 3.7885 | 9.5317 | 1.82 | 0.4878 | 85.22 |
Table 5.
The average crystal size (D), FWHM value, and average micro-strain (ε) of the studied TiO2/SiO2 powder.
Table 5.
The average crystal size (D), FWHM value, and average micro-strain (ε) of the studied TiO2/SiO2 powder.
| Sample | Average Crystallite Size (D, nm) | Full Width at Half Maximum (β, FWHM) | Average Micro-Strain (ε, ×103) |
|---|---|---|---|
| TiO2 | 3.17 | 0.3330 | 3.39 |
| TiO2/SiO2 | 1.82 | 0.4878 | 5.67 |
Table 6.
Phase composition calculations obtained through Raman analysis.
| Sample | Calculated Phase Composition (%) | |||
|---|---|---|---|---|
| According to Maximum Intensity | According to Band Integral Intensity | |||
| Anatase | Rutile | Anatase | Rutile | |
| TiO2 | 71.25 | 28.75 | 72.88 | 27.12 |
| TiO2/SiO2 | 100 | - | 100 | - |
Table 7.
Results of the BET method. (a) Micropore surface area via t-plot analysis, according to the Harkins and Jura model. (b) Cumulative volume of pores between 1.7 and 300 nm from N2-sorption data and the BJH desorption method. (c) Average pore diameter calculated by the 4 V/σ method; V was set equal to the maximum volume of N2 adsorbed along the isotherm as P/Po → 1.0 [42].
| Sample | BET Surface Area (m2/g) | Micropore Surface Area (m2/g) | Cumulative Volume (1.7–300 nm) (cm3/g) | Average Pore Diameter (nm) |
|---|---|---|---|---|
| TiO2 | 15 | 2 | 0.1 | 30 |
| TiO2/SiO2 | 50 | 2 | 0.3 | 23 |
| SiO2 | 185 [22] | - | - | - |
Table 8.
Size distribution data obtained from DLS measurements from dispersion aqueous solutions of the composite ΤiO2/SiO2 powder.
Table 8.
Size distribution data obtained from DLS measurements from dispersion aqueous solutions of the composite ΤiO2/SiO2 powder.
| Sample | Hydrodynamic Diameter (Dh) (nm) | PdI * |
|---|---|---|
| TiO2 | 35.94 ± 1.17 | 0.263 ± 0.011 |
| TiO2/SiO2 | 27.03 ± 1.02 | 0.114 ± 0.009 |
Note: * PdI, polydispersity index.
Table 9.
Kinetic parameters of the examined powders upon visible-light photocatalytic trials.
| Sample Name | Pseudo-First-Order Kinetic Model | Pseudo-Second-Order Kinetic Model | ||
|---|---|---|---|---|
| k1 (min−1) | R2 | k2 (g/mg·min) | R2 | |
| TiO2 | 0.006 | 0.933 | 0.375 | 0.517 |
| SiO2 | 0.002 | 0.979 | 0.846 | 0.921 |
| TiO2/SiO2 | 0.018 | 0.975 | 0.381 | 0.920 |
Table 10.
Kinetic parameters of the examined powders under visible-light photocatalytic trials.
| Sample Description | Pseudo-First-Order Kinetic Model | Pseudo-Second-Order Kinetic Model | ||
|---|---|---|---|---|
| k1 (min−1) | R2 | k2 (g/mg·min) | R2 | |
| TiO2 | 0.002 | 0.987 | 0.546 | 0.952 |
| SiO2 | 0.001 | 0.992 | 0.930 | 0.743 |
| TiO2/SiO2 | 0.003 | 0.975 | 0.738 | 0.903 |
Disclaimer/Publisher’s Note: The statements, opinions and data contained in all publications are solely those of the individual author(s) and contributor(s) and not of MDPI and/or the editor(s). MDPI and/or the editor(s) disclaim responsibility for any injury to people or property resulting from any ideas, methods, instructions or products referred to in the content. |
© 2023 by the authors. Licensee MDPI, Basel, Switzerland. This article is an open access article distributed under the terms and conditions of the Creative Commons Attribution (CC BY) license (https://creativecommons.org/licenses/by/4.0/).
Share and Cite
MDPI and ACS Style
Gatou, M.-A.; Fiorentis, E.; Lagopati, N.; Pavlatou, E.A. Photodegradation of Rhodamine B and Phenol Using TiO2/SiO2 Composite Nanoparticles: A Comparative Study. Water 2023, 15, 2773. https://doi.org/10.3390/w15152773
AMA Style
Gatou M-A, Fiorentis E, Lagopati N, Pavlatou EA. Photodegradation of Rhodamine B and Phenol Using TiO2/SiO2 Composite Nanoparticles: A Comparative Study. Water. 2023; 15(15):2773. https://doi.org/10.3390/w15152773
Chicago/Turabian StyleGatou, Maria-Anna, Evangelos Fiorentis, Nefeli Lagopati, and Evangelia A. Pavlatou. 2023. "Photodegradation of Rhodamine B and Phenol Using TiO2/SiO2 Composite Nanoparticles: A Comparative Study" Water 15, no. 15: 2773. https://doi.org/10.3390/w15152773
Note that from the first issue of 2016, this journal uses article numbers instead of page numbers. See further details here.