Article

Effect of Nitrogen Application and Microbial Fertilizer on Nitrogen Conversion Processes in Saline Farmland

1
Agricultural College, Inner Mongolia Agricultural University, Hohhot 010020, China
2
Inner Mongolia Academy of Agricultural & Animal Husbandry Sciences, Hohhot 010030, China
3
Modern Agricultural Development Center of Hangjinhou Banne, Bayannur 015400, China
4
Wuyuan County Agricultural & Animal Husbandry Technology Extension Center, Bayannur 015100, China
*
Authors to whom correspondence should be addressed.
Water 2023, 15(15), 2748; https://doi.org/10.3390/w15152748
Submission received: 20 June 2023 / Revised: 26 July 2023 / Accepted: 27 July 2023 / Published: 29 July 2023
(This article belongs to the Special Issue Monitoring, Reclamation and Management of Salt-Affected Lands)

Abstract

:
The nutrient utilization rate of salinized farmland soils is low, the nitrogen loss is high, and soil salinity inhibits the hydrolysis of urea and the release of nutrients. In this work, the effect of microbial fertilizer on the nitrogen transformation characteristics and nitrogen morphology of salinized soils was studied using indoor constant temperature incubation tests with different nitrogen application rates—without (A0) and with microbial fertilizer application (A1 (15 t/ha)) or nitrogen application (N) of 0 kg/ha (N0), 97.5 kg/ha (N1), or 195 kg/ha (N2). The results show the following: (i) When no microbial fertilizer was applied, an increased nitrogen application promoted nitrogen fertilizer’s ammonification and nitrification reactions. Furthermore, the maximum net nitrification rate with the high nitrogen fertilizer application decreased; the apparent ammonification rate and net ammonification rate A0N2 increased by 26.1% and 24.6%, respectively, compared with A0N1 on the first day of incubation; the maximum net nitrification rate of A0N1 was more than that of A0N2; and A0N1 > A0N2 on day 3, while A0N2 > A0N1 on days 3 to 15. At 3 d, the nitrogen conversion process of A0N1 was dominated by the nitrification reaction, while the ammonification reaction dominated in A0N2. (ii) Microbial fertilizers significantly increased the ammonification and nitrification rates under the low N fertilizer application. The intensity of ammonification and nitrification under the low N fertilizer application was greater than that under the high N fertilizer application. The apparent ammonification rate and net ammonification rate of A1N1 increased by 60.9% and 52.6% compared with A0N1 and 21.9% and 21.7% compared with A1N2 on the first day of incubation, and the peak net nitrification rates of A1N1 and A1N2 (28.19 mg/kg d and 11.02 mg/kg d, respectively) and net nitrification rates of A1N1 and A1N2 were 113.7% higher than those of A0N1. The net nitrification rates of A1N1 and A1N2 were 82.3% and 58.6% lower than the maximum net nitrification rates on the 15th day of incubation, respectively. (iii) In saline soils, low-nitrogen microbial fertilizers led to more ammonium nitrogen in the soil, and the high-nitrogen fertilizer application resulted in higher nitrate nitrogen in the soil, leading to nitrogen leaching. Therefore, when applying microbial fertilizer, choosing the most suitable period for reduced chasing is important for the efficient use of fertilizers, the alternative role of biofertilizers, and the study of environmental pollution.

1. Introduction

Nitrogen is one of the essential nutrients for plant growth and development. Nitrogen in soil is transformed into two forms, NH4+ and NO3, which are mainly absorbed by plants through mineralization, nitrification, and denitrification promoted by soil microorganisms. However, NO3 is the main cause of N leaching [1,2]. To reduce N leaching, it is imperative to regulate the process of N conversion. The amount of nitrogen applied is one of the main factors affecting the transformation of nitrogen by nitrogen fertilizers, which affects the rate and process of transformation in the soil. In general, adding exogenous nitrogen fertilizer can increase the soil urease and protease activities and promote mineralization to form ammonium nitrogen, thus increasing the net nitrogen mineralization [3]. Wang et al. [4] found that net soil ammonification was significantly higher in red loam soils under nitrogen application than in non-nitrogen treatments, and high nitrogen application inhibited soil nitrification. Tian et al. [5] showed that adding 250 mg/kg of exogenous N significantly increased the net N mineralization of purple tillage soils. Luo et al. [6] reported that low N treatment did not affect organic N mineralization in grassland soils, and high N treatment significantly promoted the net nitrification, ammonification, and mineralization rates. Nitrogen fertilizer increases the abundance and activity of soil ammonia-oxidizing archaea (AOA) and ammonia-oxidizing bacteria (AOB), resulting in a significant increase in the net nitrification rate with increasing nitrogen application; however, too much nitrogen fertilizer inhibits nitrification [7]. Zhu [8] analyzed the trend characteristics of N fertilizer on farmland in China, stating that ammonia volatilization losses accounted for 11% of applied N, nitrification–denitrification losses accounted for 34% of applied N, and runoff and leaching losses accounted for 7% of applied N. The losses were greater than crop uptake. It has also been reported that high N addition increases the risk of leaching losses of nitrate N and pollution of the environment [9]. Taken together, this suggests that the response of nitrogen transformation processes to N application may vary depending on soil type and N application level and that high N additions may not positively affect soil N supply capacity.
Soil salinity, an abiotic factor that affects crop yield, exerts a substantial influence on the efficiency of nitrogen utilization in crops through alterations in nitrogen transformations within saline soils. The process of salinization affects the cycling of nitrogen nutrients and the presence of inorganic nitrogen in the soil by modifying its physicochemical properties and microbial distribution [10]. Various scholars have investigated the impact of salinity on nitrogen transformations in soils, such as Wen [11], who analyzed the effects of salinity on soil mineralization and nitrification through soil incubation experiments, showing that a salinity at 2.9 g/kg significantly inhibited soil mineralization and nitrification processes, while a salinity below 1.9 g/kg did not significantly inhibit soil mineralization and nitrification processes. Reddy et al. [12] discovered that the mineralization of soil nitrogen was increasingly inhibited with rising salinity levels. Similarly, Li et al. [13] concluded that low salinity favors soil nitrogen transformations, whereas high salinity hampers it, with the inhibition becoming more pronounced as salinity increases. Previous studies demonstrate that salinization significantly affects soil nitrogen migration, transformation, and uptake, with the degree of inhibition being closely tied to soil salinity levels.
The beneficial microorganisms in microbial fertilizer promote mineral absorption through their own metabolism, enhance nitrogen fixation, improve the living environment of crops, and reduce their dependence on chemical fertilizers [14,15]. Regarding microbial fertilizers’ impact on salinity, they perform remarkably well in saline farmland by reducing water evaporation from the soil surface layer and inhibiting salt accumulation in the shallow soil layer affected by water flow. Consequently, this fosters a reduction in soil salinity [16]. The selected microbial fertilizer in this study possesses an organic matter content exceeding 60%, which enhances nutrient absorption and utilization by crops while improving soil structure [17]. Duan et al. found that the application of different microbial fertilizers could lower soil salinity and increase the nutrient content in the soil. The effect of microbial fertilizers on nitrogen conversion was studied; applying Bacillus subtilis biofertilizers reduced ammonia volatilization by 44% in alkaline soils, reduced the conversion of nitrogen fertilizers to ammonium nitrogen, and accelerated the nitrification process [18]. Using nitrogen-fixing cyanobacterial biofertilizers reduced ammonia volatilization in red soil rice fields, increased the total soil nitrogen content, and increased the residence time of nitrogen in the soil, thus increasing the efficiency of nitrogen fertilizer utilization [19]. The feasibility of replacing some nitrogen fertilizers with biofertilizers has been noted in existing studies [20,21,22]. Xuan et al. also confirmed this in a study on the effect of microbial fertilizers on the application of nitrogen fertilizer to sunflowers [15]. Previous studies have focused on the effects of biofertilizers on nitrogen fertilizer utilization and loss in non-saline soils and the effects of nitrogen application on nitrogen conversion in soils. This paper focuses on the effects of compound microbial fertilizers and different nitrogen application rates on soil nitrogen conversion processes in moderately saline soils to provide theoretical support for efficiently utilizing nutrients and reducing nitrogen loss in saline farmland soils.

2. Materials and Methods

2.1. Overview of the Area Where the Soil Samples Are Located

The test soil was taken from Sandaoqiao Town, Hangjinhou Banner, Bayannur City. The test area is located in the Loop Plain, a typical cold and arid area with an average annual precipitation of 135.9 mm, decreasing from southeast to northwest, with the most abundant precipitation in July and August. The local average annual temperature is 8.7 °C, evaporation is 1984.3 mm, the frost-free period is about 152 d, annual sunshine hours are over 3220 h, the cumulative temperature is over 3520 °C, and the sunshine rate is 73%. The saline soils contain mainly chloride and sulphate, the surface soil (0~20 cm) is sandy loam in texture, and the deep soil is mostly clay loam. The soil salinity ion composition is mainly Na+, Cl, and SO42−.

2.2. Test Materials

The test chemical nitrogen fertilizer was urea, with a N content of 46%. The test commercial compound microbial fertilizer was Eubacterium 1 (Paul Timken Biotechnology Ltd., Weifang, China); the main strains include mycorrhizal fungi 5%, nitrogen fixing bacteria 20%, Bacillus megaterium 10%, Bacillus subtilis 10%, Bacillus coli 15%, Bacillus licheniformis 5%, Streptomyces jingdaoensis 5%, beneficial live bacteria ≥ 5 × 10⁸ CFU/g (actual bacteria content 1 × 10⁹ CFU/g), and organic matter ≥ 60%. The physical and chemical indexes of the test soil are shown in Table 1.

2.3. Experiment Design

The experiment was conducted on moderately saline soils, using an indoor constant temperature culture. The experiment was set up with two factors: microbial fertilizer (without (A0), with (A1 (15 t/ha)) and nitrogen fertilizer (0 kg/ha (N0), 97.5 kg/ha (N1) (pure N), and 195 kg/ha (N2) (pure N)). The experiment was set up with six treatments, each replicated 18 times, for a total of 108 treatments.
The test was carried out in 250 mL plastic cups; 150 g of soil and microbial fertilizer were added to each cup, and the nitrogen fertilizer was added as an aqueous solution. The tops of the cups were sealed with cling film, and 20 small holes were evenly made in the cling film for ventilation, then the cups were placed in a constant temperature incubator at 25 °C. The soil was weighed and replenished daily to maintain the soil moisture content at 50–60% of the field water holding capacity. The soil’s physical and chemical indicators were sampled at 1, 3, 5, 15, 25, and 35 d. Three replicates of each treatment were randomly taken at each time, and samples were taken at the end of the experiment to determine soil nitrogen patterns.

2.4. Measurement Methods and Calculations

The soil EC and pH were determined by the potentiometric method. The soil ammonium nitrogen (NH4+-N) content was determined using a 2 mol/L KCl leaching-indophenol blue colorimetric method [23]; the soil nitrate nitrogen (NO3-N) content was determined using a dual wavelength UV spectrophotometer method; the soil total nitrogen content was determined using the semi-trace Kjeldahl method [24]; the soil organic matter was determined by the potassium dichromate volumetric external heating method [25]; and the available phosphorus in the soil was determined by the 0.5 mol/L NaHCO3 method [26].
The following equations were used to calculate each index [27,28]:
Inorganic   N   content ( mg / kg ) = N H 4 + - N t n + N O 3 - N t n Apparent   ammonification   rate mg / kg · d = b n   N H 4 + - N t n + 1 b n N H 4 + - N t n / t n + 1 t n Net   ammonification   rate ( m g / ( k g g d ) = b n N H 4 + N t n + 1 N H 4 + N t n C K N H 4 + N t n + 1 N H 4 + N t n / t n + 1 t n Apparent   nitrification   Rate mg / kg · d = bn N 0 3 N t n + 1 b n N O 3 N t n / t n + 1 t n Net   nitrification   rate m g / k g g d = b n N O 3 N t n + 1 N O 3 N t n C K N O 3 N t n + 1 N O 3 N t n / t n + 1 t n
Note: NH4+-N, soil ammonium nitrogen content; NO3-N, soil nitrate nitrogen content; bn, microbial fertilizer and nitrogen fertilizer dosage; CK, no fertilizer control; tn, previous sample; tn+1, latter sample.

2.5. Data Analysis Method

Microsoft Excel 2016 was used for data calculation; Origin 2022 software was used for plotting; SPSS 19.0 was used for statistical analysis; and Duncan’s method was used for multiple comparisons.

3. Results

3.1. Effect of Microbial Fertilizer and Different Nitrogen Applications on the Ammonification Process of Nitrogen Fertilizer

As seen from Table 2, the ammonification rates of both the microbial fertilizer and the different nitrogen application treatments peaked on the first day of incubation and then declined rapidly after reaching the peak, with the most apparent decrease in the net ammonification rate from 1 to 3 d. Under the condition of no microbial fertilizer, the apparent and net ammonification rates of A0N2 were more than those of A0N1 on the first day of incubation; A0N2 increased by 26.1% and 24.6%, respectively, compared with A0N1. On the third day of incubation, the nitrogen conversion process of A0N1 was dominated by nitrification, while A0N2 was dominated by ammonification. Under the conditions of microbial fertilizer application, A1N1 had the maximum apparent ammonification rate and net ammonification rate, which were 21.9% and 21.7% higher than A1N2, respectively. The nitrification reaction in A1N1 was dominant on the third day of incubation, while the ammonification reaction in A1N2 remained dominant on the seventh day. The apparent ammonification and net ammonification rates of the fertilization treatments at d 1 were A1N1 > A1N2 > A0N2 > A0N1. The apparent ammonification rate and net ammonification rate of A1N1 increased by 60.9% and 52.6% compared to A0N1, and A1N2 increased by 4.6% and 0.6% compared to A0N2.

3.2. Effect of Microbial Fertilizers and Different Nitrogen Applications on the Nitrification Rate of Nitrogen Fertilizers

As seen from Table 3, the apparent nitrification rates for the microbial fertilizer and different nitrogen application treatments peaked at d 1 and then declined rapidly, while the net nitrification rates were very low or even negative, indicating that denitrification was predominant at this time. In the absence of microbial fertilizer, the net nitrification rates of A0N1 and A0N2 peaked at 10.85 mg/kg d and 8.96 mg/kg d at d 7 and 2.14 mg/kg d and 2.76 mg/kg d at d 15, a decrease of 80.3% and 69.2%, respectively, compared to d 7. Under the conditions of microbial fertilizer application, the net nitrification rate of A1N1 and A1N2 peaked at 28.19 mg/kg d and 11.02 mg/kg d on the third and seventh day of incubation, respectively. The net nitrification rates of A1N1 and A1N2 peaked at 23.19 mg/kg d and 11.02 mg/kg d at d3 and d7, respectively, and were 4.11 mg/kg d and 4.56 mg/kg d at d15 of incubation. A1N1 and A1N2 decreased by 82.3% and 58.6%, respectively, compared to the maximum net nitrification rates, and the nitrification reaction process of A1N1 was nearly complete. When comparing the soil net nitrification rates, the peak of A1 treatment was higher than that of A0 treatment, and the peak size of the net nitrification rate was A1N1 > A1N2 > A0N1 > A0N2. A1N1 increased by 113.7% and A1N2 increased by 23.0% compared with A0N1.

3.3. Changes in Nitrogen Content of Salinized Farmland Soils as a Result of Microbial Fertilizers and Different Nitrogen Applications

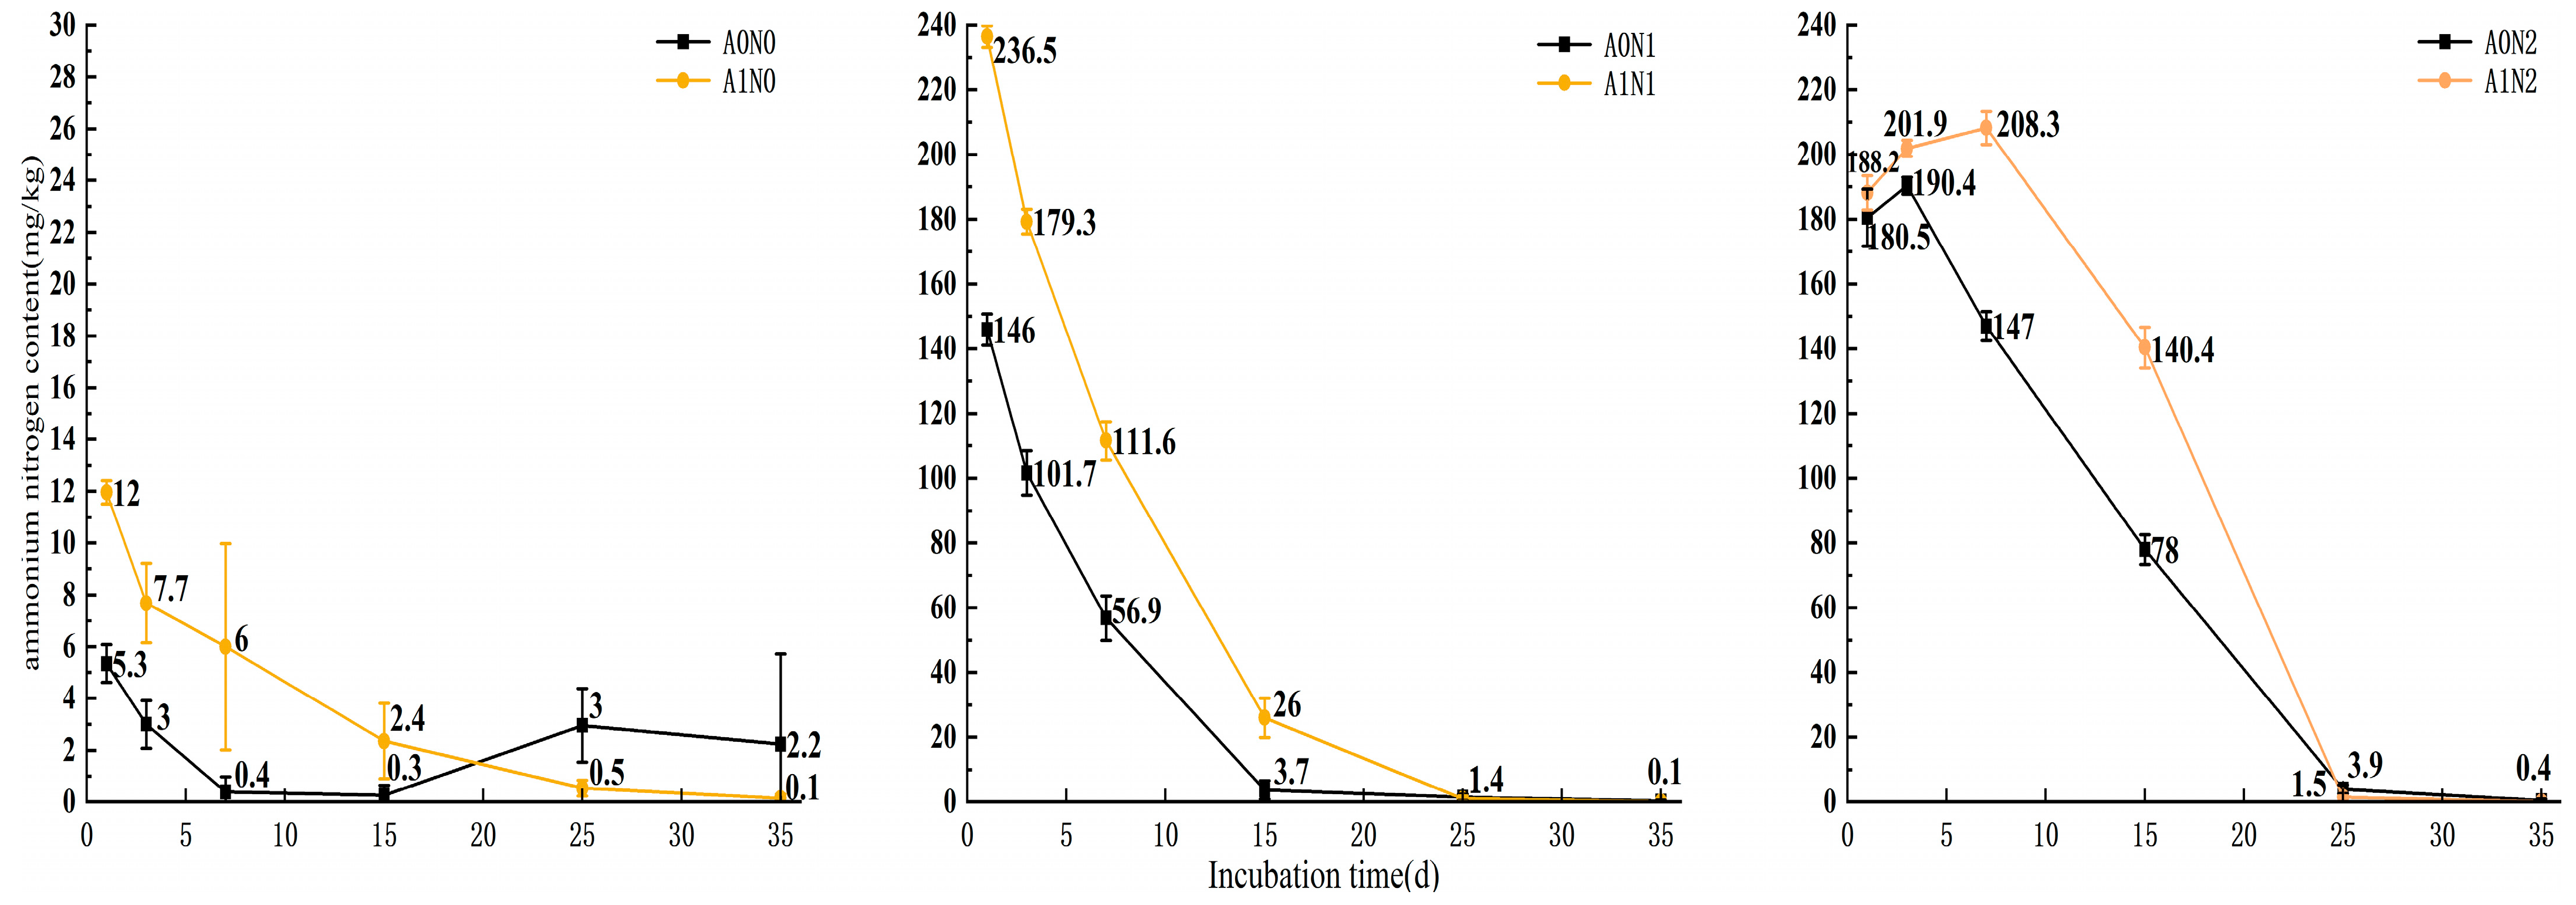
3.3.1. Effect of Microbial Fertilizer and Different Application Rates of Nitrogen on the Change in Ammonium Nitrogen Content in Salinized Farmland Soils

As seen in Figure 1, the ammonium nitrogen content of the N1 application peaked on the first day of incubation and then decreased rapidly. At the same time, the ammonium nitrogen content of the N2 application showed a trend of increasing and then decreasing. The soil ammonium nitrogen content of all the nitrogen fertilizer treatments decreased to the lowest from 25 to 35 d with no difference from the control treatment. Under the condition of no microbial fertilizer application, the ammonium nitrogen content of A0N1 treatment peaked on the first day of incubation, and A0N2 peaked on the third day of incubation. The ammonium nitrogen content of all nitrogen treatments in saline soil was significantly higher than the A0N0 treatment. Under the conditions of microbial fertilizer application, the ammonium nitrogen content of A1N1 reached its peak on the first day of incubation, A1N2 reached its peak on the seventh day of incubation, and the ammonium nitrogen content of all the nitrogen fertilizer treatments was significantly higher than that of A1N0. On d 1, the trend in soil ammonium nitrogen content was A1N1 > A1N2 > A1N0, and on d 3–15, the trend in soil ammonium nitrogen content was A1N2 > A1N1 > A1N0. On balance, the A1 treatment had a higher ammonium nitrogen content than the A0 treatment from d 1–25 with the same amount of nitrogen fertilizer. By d 15 of incubation, the nitrogen contents of A0N1 and A1N1 were 97.5% and 89.0% lower than their respective maximum ammonium nitrogen content, and the nitrogen contents of A0N2 and A1N2 were 62.4% and 32.6% lower than their respective maximum ammonium nitrogen content, with the N1 treatment dropping to the lowest ammonium nitrogen content and the N2 treatment maintaining a higher content. Comparing the maximum ammonium nitrogen content of the applied nitrogen treatments, A1N1 had the maximum ammonium nitrogen content of 236.50 mg/kg, which was 62.0%, 14.0%, and 13.6% higher than A0N1, A0N2, and A1N2, respectively, and A1N2 increased by 9.4% compared to A0N2.
The results of an ANOVA between microbial fertilizer and nitrogen application on the soil ammonium nitrogen content are shown in Table 4. The interaction between microbial fertilizer and N application significantly affected the soil ammonium N content from 1 to 15 d of incubation.

3.3.2. Effect of Microbial Fertilizers and Different N Application Rates on Changes in Nitrate N Content of Saline Farmland Soils

As shown in Figure 2, the nitrate–nitrogen content of the nitrogen fertilizer treatments showed a higher level with treatment A1 than A0 during the 35 days of incubation. When no microbial fertilizer was applied, the nitrate–nitrogen content of the soil in each nitrogen application treatment increased with increasing incubation time, reaching peaks of 144.24 (A0N1) and 180.21 (A0N2) on the 15th day of incubation, respectively, while the nitrate–nitrogen content of salinized soil in the A0N0, A0N1, and A0N2 treatments was 134.10 mg/kg, 158.50 mg/kg, and 159.08 mg/kg on the 35th day of incubation, respectively. Under the conditions of microbial fertilizer application, the nitrate–nitrogen content of the soil in each nitrogen application treatment increased with increasing incubation time, reaching peaks of 173.33 (A1N1) and 185.00 (A1N2) on the 15th day of incubation, and the trends in nitrate–nitrogen content of the saline soil on the first day of incubation was A1N0 > A1N2 > A1N1, on the third day of incubation it was A1N0 > A1N1 > A1N2, and in the remainder of the incubation time it was A1N0 > A1N2. A1N1 > A1N2. The rest of the time, the trend in soil nitrate nitrogen content was A1N2 > A1N1 > A1N0.
Table 5 shows the significance of microbial fertilizer and nitrogen application on the soil nitrate–nitrogen content. The results show that nitrogen application had a significant effect on the soil nitrate–nitrogen content at 35 d of incubation (p < 0.05), and the addition of microbial fertilizer had no significant effect on the soil nitrate–nitrogen content at 1 d and 15 d of incubation (p > 0.05), and a significant effect at 3–7 d and 25–35 d (p < 0.05). The interaction between microbial fertilizer and nitrogen application significantly affected the soil nitrate–nitrogen content on 3 d and between 25 and 35 d.

3.3.3. Effect of Microbial Fertilizers and Different N Applications on Changes in the Inorganic N Content of Saline Farmland Soils

From Figure 3, the inorganic N content of the soil under the N1 fertilizer dosage first declined and then remained nearly unchanged, while the inorganic N content of the soil under the N2 fertilizer dosage first increased, then decreased, and then remained nearly unchanged. The trend in inorganic nitrogen content was A1N1 > A0N1, A1N2 > A0N2, A0N2 > A0N1 from 1 to 15 d of incubation, and the difference in inorganic nitrogen content was smaller between the nitrogen fertilization treatments from 25 to 35 d of incubation.
Table 6 shows the significance analysis of the effect of microbial fertilizer and nitrogen application on the inorganic nitrogen content of the soil. The results show that there is a significant difference (p < 0.05) between nitrogen application and microbial fertilizer on the inorganic nitrogen content of the soil in the 35 d of incubation, and the interaction between microbial fertilizer and nitrogen application has a significant effect on the inorganic nitrogen content of the soil from 1 to 35 d.

4. Discussion

4.1. Effect of Microbial Fertilizers and Different Nitrogen Applications on the Rate of Ammonification of Nitrogen Fertilizers

As nitrogen fertilizer was added as an aqueous solution in this experiment, there was no need for soil wetting to dissolve the nitrogen fertilizer’s active ingredients before entering the soil. Hence, each treatment’s ammonification rate and net ammonification rate were high and peaked on day 1 of incubation, after which the ammonification rate of each treatment decreased rapidly. Fertilizer application significantly enhances the total soil nitrogen content, organic carbon content, and microbial mass carbon, thereby influencing the intensity and timing of nitrogen transformation processes within the soil [29]. Introduction of exogenous inorganic nitrogen promotes the accumulation of soil ammonium nitrogen, primarily through a reduction in nitrification [30]. The microbial fertilizer utilized in this study exhibits an organic matter content exceeding 60%. Consequently, its application leads to an increase in soil organic matter content and exerts a regulatory effect on soil carbon and nitrogen. Organic materials increase the growth rate of soil microorganisms, contributing to an increase in total microbial biomass and, consequently, an increase in the accumulation of microbial residues. In this study, without microbial fertilizer, the ammonification rate was accelerated by increasing nitrogen application, and the high nitrogen application rate prolonged the nitrogen conversion process, with ammonification as the main effect. The application of microbial fertilizer significantly increased the ammonification rate in N1 application and prolonged the nitrogen conversion process, with the ammonification reaction as the primary role in N2 application. In a comprehensive comparison, the A1N1 treatment had the maximum ammonification rate, and there was no significant difference between A1N2 and A0N2. The ammonification rate of salinized soil with microbial fertilizer was greater than without under the same amount of nitrogen application. The results of Chen et al. [31] and Wang [29] showed that organic fertilizers had a significant slow-release effect on soil nitrogen, and the addition of organic fertilizers significantly enhanced the intensity of soil ammonification, which was similar to the results of this experiment. The study of Wen et al. [32] found that the nitrogen application treatment showed a promoting effect on the soil ammonification rate, and the soil ammonification increased by increasing the amount of nitrogen application, which was consistent with the results of this experiment. We also found that the promoting effect of microbial fertilizer on nitrogen ammonification was related to the amount of nitrogen applied. The promoting effect decreased with increased nitrogen application, which might be because adding microbial fertilizer increased the type and number of microorganisms driving nitrogen transformations and the organic matter content in the soil. However, chemical fertilizer also had an inhibitory effect on microorganisms. Some studies showed [33] that soil salinity and application of nitrogen fertilizer in moderately salinized soil inhibited the reduced promotion effect of microbial fertilizers.

4.2. Effect of Microbial Fertilizers and Different Nitrogen Applications on Nitrification Rates of Nitrogen Fertilizers

Nitrification is an essential part of the nitrogen cycle and is closely related to the ratio of soil ammonium nitrogen to nitrate nitrogen, divided into the ammonia oxidation process—in which ammonium nitrogen is converted to nitrite nitrogen—and the nitrite oxidation process in which nitrite nitrogen is converted to nitrate nitrogen [34]. The net nitrification rates were all negative on the first day of incubation when the soil was probably dominated by denitrification, and the negative values were larger in the treatment with the addition of microbial fertilizer, probably because the microbial fertilizer contained a large amount of organic matter, which temporarily inhibited autotrophic nitrification. The intensity of the reaction increased so that nitrification rates showed a significant decrease and then an increase [35]. This study showed that under the condition of no microbial fertilizer application, N2 application promoted the nitrification reaction process of nitrogen fertilizer compared with N1 application, but the maximum nitrification reaction intensity decreased, and N2 application prolonged the nitrogen conversion process mainly by nitrification reactions. The application of microbial fertilizer increased the nitrification rate of nitrogen fertilizer, and the nitrification effect of N1 application was stronger than N2 application, which prolonged nitrogen conversion dominated by the nitrification reaction in N2 application. Jia et al. [36] showed that high nitrogen application promoted soil nitrification more significantly, which is consistent with this paper. Yin et al. [37] showed that the nitrification and mineralization of soil nitrogen were significantly enhanced from days 3 to 35 of the culture period. It was found that treatments with microbial fertilizers prolonged the nitrification reaction time and had a greater nitrification reaction intensity, which may be due to the addition of microbial fertilizers, increasing the number of subnitrifying and nitrifying bacteria in the soil and promoting the conversion of ammonium to nitrate nitrogen in the soil.

4.3. Effect of Microbial Fertilizers and Different N Application Rates on Soil N Content

In this experiment, the ammonium nitrogen content of the soil peaked and then decreased rapidly with increasing incubation time, while the nitrate nitrogen then increased rapidly. The ammonium nitrogen in the soil was converted to nitrate nitrogen by the nitrification reaction process because the rapid increase in ammonium nitrogen as a substrate for the nitrification reaction promotes the nitrification reaction and the associated bacterial community. It has been shown that the amount of nitrogen fertilizer determines the amount of mineral nitrogen in the soil [34,38,39]. The high N fertilizer application rate in this study resulted in ammonium N retention in the soil, which was longer with the addition of microbial fertilizer, consistent with the change in ammonification rate above. The reason for the retention may be because high levels of ammonium N in the soil inhibit microbial uptake and utilization of other N sources, which in turn inhibits the conversion of ammonium N to nitrate N, keeping the ammonium N in the soil at a high level [40]. The increase in ammonium N content in soil is the leading cause of ammonia volatilization [18], so high N addition and application with microbial fertilizer may increase the loss of N fertilizer through ammonia volatilization; the effect of N application on the soil nitrate N content was greater for high N fertilizer application treatment than low N fertilizer application treatment, which is consistent with the results of Qin et al. [7]. The nitrate–nitrogen content of low nitrogen application with microbial fertilizer was higher than high nitrogen application with microbial fertilizer and treatments without microbial fertilizer in the early stage of culture, and there was no significant difference in the nitrate–nitrogen content of all nitrogen application treatments in the late stage of culture. In general, the low N fertilizer with microbial fertilizer promoted the conversion of N into more inorganic N for plant uptake and use in the early stage of culture; the content decreased in the middle of the culture but remained high, mainly in the form of nitrate N. The high N fertilizer with microbial fertilizer maintained a high content of inorganic N in the early and middle stages of culture, mainly in the form of ammonium N and nitrate N. All treatments had a higher content of inorganic N in the late stage of culture. The inorganic nitrogen content of all treatments did differ significantly at the later stage of cultivation and was dominated by nitrate nitrogen. In the river loop irrigation area, nitrate–nitrogen is easily soluble in water, so high nitrogen fertilizer addition maintains high nitrate–nitrogen and ammonium–nitrogen contents in the soil for a long time, which will not only easily cause groundwater pollution by leaching but also great fertilizer loss. Meanwhile, the ammonium–nitrogen content in the soil is the highest with a low nitrogen fertilizer dosage, but it is present for a shorter period. Therefore, this study concluded that it is feasible to replace part of the nitrogen fertilizer with microbial fertilizer. The basis of its replacement is to choose a suitable application period and carry out a reasonable reduction in fertilizer chasing during the crop nitrogen demand period, which can provide sufficient nutrients for the crop, improve fertilizer utilization efficiency, and reduce nitrogen loss.

5. Conclusions

Both microbial fertilizer and nitrogen application in moderately saline soils have a significant effect on nitrogen conversion:
(i)
When no microbial fertilizer was applied, an increased nitrogen fertilizer application promoted the ammonification and nitrification of nitrogen fertilizer and reduced the maximum nitrification rate under high nitrogen fertilizer application. A high nitrogen fertilizer application prolonged the process of nitrogen transformation, with ammonification and nitrification reactions as the main effects. From the perspective of fertilizer utilization and the ecological environment, reducing nitrogen application can suppress the intensity and duration of soil nitrification reactions, thereby decreasing the content of nitrate nitrogen in the soil and reducing nitrate leaching losses.
(ii)
The application of microbial fertilizer significantly increased the rate of ammonification and nitrification for the low N fertilizer dosage, the intensity of ammonification and nitrification for the low N fertilizer dosage was greater than the high N fertilizer dosage, and the application of microbial fertilizer prolonged the nitrogen transformation with ammonification and nitrification reactions as the main effects under the high N fertilizer dosage. When microbial bacterial fertilizers are applied together with low-nitrogen fertilizers, there is a higher presence of ammonium nitrogen in the soil. Conversely, when high-nitrogen fertilizers are applied, the soil maintains a consistently high level of nitrate nitrogen, significantly increasing the risk of nitrogen leaching.
(iii)
In terms of nitrogen conversion, the use of microbial fertilizers as a substitute for a portion of nitrogen fertilizers in salinized farmland effectively increases the nitrogen nutrient content required by crops. To capitalize on this benefit, appropriate timing of subsequent fertilization is crucial, allowing the substantial amount of ammonium nitrogen produced by microbial fertilizers to be efficiently utilized. By doing so, the risk of fertilizer loss and environmental pollution can be minimized.

Author Contributions

Conceptualization, H.Z.; data curation, H.Z.; formal analysis, H.Z.; funding acquisition, C.Y. and J.Z.; investigation, X.N., J.P., Q.C., L.W. and E.L.; methodology, L.L.; project administration, L.L. and J.Z.; resources, J.Z. and C.Y.; software, H.Z.; supervision, L.L.; validation, C.Y.; visualization, H.Z.; writing—original draft, H.Z. and L.L.; writing—review and editing, H.Z. and C.Y. All authors have read and agreed to the published version of the manuscript.

Funding

This study research was supported by the Science and Technology Plan Program of Inner Mongolia Autonomous Region (Grant No. 2020GG0181, 2021GG0060), Major scientific and technological projects in Ordos (Grant No. 2022EEDSKJZDZX011), and the Projects for the Central Government to Guide Local Scientific and Technological Development (Grant No. 2021ZY0031), Projects of Inner Mongolia Autonomous Region Agricultural and Animal Husbandry Science and Technology Innovation Fund (Grant No. 2023CXJJN14), and the Natural Science Foundation of Inner Mongolia Autonomous Region (Grant No. 2023ZD28).

Data Availability Statement

Not applicable.

Acknowledgments

We would like to give our heartfelt thanks to Chen Qiang of the Modern Agri-cultural Development Center of Hangjinhou Banner for the help in selection of study areas.

Conflicts of Interest

The authors declare no conflict of interest.

References

  1. He, J.; Zhang, L. Key processes and microbial mechanisms of soil nitrogen transformation. Microbiol. China 2013, 40, 98–108. [Google Scholar] [CrossRef]
  2. Li, H.; Yao, R.; Yang, J.; Wang, X.; Zheng, F.; Chen, Q.; Xie, W.; Zhang, X. Influencing mechanism of soil salinization on nitrogen transformation processes and efficiency improving methods for high efficient utilization of nitrogen in salinized farmland. Chin. J. Appl. Ecol. 2020, 31, 3915–3924. [Google Scholar] [CrossRef]
  3. Jiao, Y.; Qi, P.; Wang, X.; Wu, J.; Yao, Y.; Cai, L.; Zhang, R. Effects of Different Nitrogen Application Rates on Soil Organic Nitrogen Components and Enzyme Activities in Farmland. Sci. Agric. Sin. 2020, 53, 2423–2434. [Google Scholar]
  4. Wang, X.; Xu, J.; Long, C.; Zhu, S.; Lu, M.; Yang, W. Effect of nitrogen rates and soil water contents on soil nitrogen mineralization under ryegrass returning into red soil. J. Plant Nutr. Fertil. 2018, 24, 365–374. [Google Scholar]
  5. Tian, D.; Gao, M.; Xu, C. Effects of Soil Moisture and Nitrogen Addition on Nitrogen Mineralization and Soil pH in Purple Soil of Three Different Textures. J. Soil Water Conserv. 2016, 30, 255–261. [Google Scholar] [CrossRef]
  6. Luo, Q.; Gong, J.; Xu, S.; Baoyin, T.; Wang, Y.; Di, Z.; Pan, Y.; Liu, M.; Yang, L. Effects of N and P additions on net nitrogen mineralization in temperate typical grasslands in Nei Mongol, China. Chin. J. Plant Ecol. 2016, 40, 480–492. [Google Scholar]
  7. Lu, Y.; Zhou, L.; Long, G.; Tang, L. Effect of Different Nitrogen Rates on the Nitrification Potential and Abundance of Ammonia-oxidizer in Intercropping Maize Soils. Environ. Sci. 2016, 37, 3229–3236. [Google Scholar] [CrossRef]
  8. Zhu, Z. Research on soil nitrogen in china. Acta Pedol. Sin. 2008, 45, 778–783. [Google Scholar]
  9. Qin, Y.; He, F.; Tong, Z.; Xie, K.; Wang, D.; Gammal, Q.; Song, Q.; Wang, H.; Zhang, W.; Li, X. Influence of fertilizer use on nitrogen transformation in soils of the Leymus chinensis steppe. Acta Prataculturae Sin. 2016, 25, 48–55. [Google Scholar]
  10. Zeng, K.; Liu, L.; Cai, Y.; Chen, Y.; Chen, D.; Sun, F.; Pei, S.; Zhou, C.; Shen, X. The nitrogen cycle and factors affecting it in the belowground ecosystem. Pratacultural Sci. 2017, 34, 502–514. [Google Scholar]
  11. Wen, P. Study on Nitrogen Transformation and Effects of Nitrogen onWinter Wheat Seedlings Growth in Saline Soil in Yellow River Delta. Bachelor’s Thesis, University of Chinese Academy of Sciences, Beijing, China, 2018. [Google Scholar]
  12. Reddy, N.; Crohn, D.M. Effects of soil salinity and carbon availability from organic amendments on nitrous oxide emissions. Geoderma 2014, 235–236, 363–371. [Google Scholar] [CrossRef]
  13. Li, J.; Huang, G. Pilot Study of Salinity(NaCI)Affecting Nitrogen Transformation in Silt Loam Soil. Res. Environ. Sci. 2008, 21, 98–103. [Google Scholar] [CrossRef]
  14. Liu, C.; Zhou, L.; Chen, D.; Chen, Y. Effects of bacterial manure on soil fertility and above-ground parts of Prunus persica (L.). J. Henan Agric. Univ. 2020, 54, 597–603. [Google Scholar] [CrossRef]
  15. Xuan, X.; Zhao, W.; Li, S.; Bao, S.; Pei, X. Study on the effect of microbial fertilizer on the reduction of nitrogen fertilization in saline sunflower. J. Shanxi Agric. Univ. 2023, 43, 102–111. [Google Scholar] [CrossRef]
  16. Zhang, L. Effects of Soil Conditioner on Physical and Chemical Properties of Saline-alkali Soil and Bacterial Community Structure. Bachelor’s Thesis, Inner Mongolia Agricultural University, Hohhot, China, 2020. [Google Scholar]
  17. Meng, Q.; Yang, X.; Yao, L.; Zhang, M.; Qiu, L.; Wang, Z.; Ding, U.; Zhu, B. Effects of Combined Application of Straw and Microbial Fertilizer on SoilAggregates and Fungal Community Diversity of Rice Field Saline Alkali Soil. Heilongjiang Agric. Sci. 2022, 45, 25–30. [Google Scholar]
  18. Sun, B.; Bai, Z.; Bao, L.; Xue, L.; Zhang, S.; Wei, Y.; Zhang, Z.; Zhuang, G.; Zhuang, X. Bacillus subtilis biofertilizer mitigating agricultural ammonia emission and shifting soil nitrogen cycling microbiomes. Environ. Int. 2020, 144, 105989. [Google Scholar] [CrossRef]
  19. Song, X.; Zhang, J.; Li, D.; Peng, C. Nitrogen-fixing cyanobacteria have the potential to improve nitrogen use efficiency through the reduction of ammonia volatilization in red soil paddy fields. Soil Tillage Res. 2022, 217, 105274. [Google Scholar] [CrossRef]
  20. Cao, X. A preliminary study on the effect of biofertilizer application in maize fields. Farmers Consult. 2019, 37, 38. [Google Scholar]
  21. Fan, B. Advances in biofertilizer research and development in China. J. Plant Nutr. Fertil. 2017, 23, 1602–1613. [Google Scholar]
  22. LV, N.; Zhuang, H.; Cheng, W. Feasibility study on reduction of agricultural chemical fertilizer and substitution of bio-fertilizer: An empirical study of cotton survey data in Xinjiang. Geogr. Res. 2022, 41, 1459–1480. [Google Scholar]
  23. Li, J.; Chen, X. Study on determination method of soil ammonium nitrogen. World Nonferrous Met. 2017, 32, 211–212. [Google Scholar]
  24. Zhou, Y. Studies on automatic nitrogen determinators for the determination of total nitrogen in soils. Agric. Henan 2014, 25, 16–17. [Google Scholar]
  25. Qian, S.; Wu, W. Discussion of methods for the determination of soil organic matter. Xinjiang Agric. Sci. Technol. 1997, 19, 19–20. [Google Scholar]
  26. You, Z. Comparative study of methods for the determination of quick-acting potassium in soils. Soil Fertil. Sci. China 1992, 29, 45–48. [Google Scholar]
  27. Shi, B.; Lai, X.; Li, J.; Tian, X.; Zhang, G. Effect of Interaction Between Manure and Urea on Transformation of Nitrogen in Brown Red Soil. J. Nucl. Agric. Sci. 2017, 31, 938–945. [Google Scholar]
  28. Tao, J.; Yang, J.; Yao, R.; Wang, X.; Liu, G.; Chen, Q. Effects of Soil Salinity on Nitrogen Transformation in Hetao Irrigation District of Inner Mongolia, China. Soils 2020, 52, 802–810. [Google Scholar] [CrossRef]
  29. Wang, J. The Effect of Manure and Chemical Fertilizingon Nitrogen Transformation and Functional Bacteria Diversity in Soil. Bachelor’s Thesis, Northeast Agricultural University, Haerbin, China, 2012. [Google Scholar]
  30. Gan, J.; Meng, Y.; Zheng, Z.; Sha, L.; Feng, Z. Effects of Fertilization on Mineralization and Nitrification of Nitrogen in Soil Grown Amomum UnderTropical Rainforest. J. Agro-Environ. Sci. 2003, 22, 174–177. [Google Scholar]
  31. Chen, Z.; Huang, Y. Effects Organic Manures with Different C-N ratio on Nitrogen in Tobacco-growing Yellow Soil. Guizhou Agric. Sci. 2016, 44, 75–78. [Google Scholar]
  32. Wen, J.; Yan, W.; Liu, Y.; Liang, X.; Gao, C. Effect of nitrogen application on soil nitrogen mineralization of Cinnamomum camphora plantation in subtropical area. J. Cent. South Univ. For. Technol. 2015, 35, 103–108. [Google Scholar] [CrossRef]
  33. Fu, X.; Yang, S.; Liu, D.; Liu, M.; Han, T. Responses of soil microbes to N fertilizers in two saline soils. J. Plant Nutr. Fertil. 2018, 24, 661–667. [Google Scholar]
  34. Pan, F.; Zhang, W.; Sun, Z.; Tang, J.; Chen, B.; Li, X. Effects of Exogenous Nitrogen Addition on Soil Mineral Nitrogen Content in Protected Vegetable Fields of Different Years. North. Hortic. 2022, 46, 79–86. [Google Scholar]
  35. Liu, Y.; Zhu, J.; Wu, Y.; Shu, L. Effects of biochar application on the abundance and structure of ammonia-oxidizer communities in coal-mining area. Chin. J. Appl. Ecol. 2017, 28, 3417–3423. [Google Scholar] [CrossRef]
  36. Jia, J.; Li, Z.; Liu, M.; Che, Y. Nitrification in Red Paddy Soils Different in Soil Fertility Under N Fertilization. J. Ecol. Rural. Environ. 2010, 26, 329–333. [Google Scholar]
  37. Yin, C.; Li, L.; Zhao, J.; Yang, J.; Zhao, H. Impacts of Returning Straw and Nitrogen Application on the Nitrification and Mineralization of Nitrogen in Saline Soil. Water 2023, 15, 564. [Google Scholar] [CrossRef]
  38. Gao, Y.; Cheng, W.; Zhang, W.; Li, Y.; Shen, B.; Wang, D.; Qiu, H. Effect of organic fertilizer partially replace chemical fertilizer on yield, Nmin’s level in soil and N fertilizer efficiency of potato in the Yellow River irrigation area of the central in Gansu. J. Gansu Agric. Univ. 2016, 51, 54–60+68. [Google Scholar] [CrossRef]
  39. Hu, M.; Tian, C.; Wang, L. Effects of nitrogen rate, applying time on cotton growth and soil mineral nitrogen content. J. Northwest A F Univ. 2011, 39, 103–109. [Google Scholar] [CrossRef]
  40. You, L.; Li, D.; Wu, Z.; Cui, L.; Yan, Z.; Zhang, J.; Cui, Y.; Liu, Y. Nitrogen transformation of stable ammonium fertilizer in black soil and cinnamon soil. Chin. J. Appl. Ecol. 2019, 30, 1079–1087. [Google Scholar] [CrossRef]
Figure 1. Changes in ammonium nitrogen content in saline soil during cultivation.
Water 15 02748 g001
Figure 2. Dynamic changes in nitrate–nitrogen content in saline soil during cultivation.
Water 15 02748 g002
Figure 3. Dynamic changes in inorganic nitrogen content in saline soil during cultivation.
Water 15 02748 g003
Table 1. Soil physical and chemical indicators.
Bulk Density/
kg/cm3
pHConductivity/
dS/m
Organic Matter g/kgTotal N
g/kg
Available Phosphorus
mg/kg
Nitrate Nitrogen/
mg/kg
Ammonium Nitrogen/
mg/kg
Inorganic Nitrogen/
mg/kg
1.458.02.4017.20.7821.3518.8813.7932.67
Table 2. Rates of soil ammonification by microbial fertilizers and different nitrogen application treatments (mg/(kg·d)).
IndicatorIncubation Time (d)A0N1A0N2A1N1A1N2
Apparent ammonification rate1132.18166.74212.71174.44
3−22.164.93−23.596.85
7−11.20−10.85−16.921.58
15−6.64−8.63−10.70−8.48
25−0.23−7.41−2.51−13.89
35−0.12−0.35−0.09−0.15
Net ammonification rate1140.62175.18214.54176.27
3−20.996.10−21.468.99
7−10.54−10.19−16.502.01
15−6.63−8.61−10.24−8.03
25−0.50−7.68−2.32−13.71
35−0.05−0.28−0.05−0.11
Table 3. Microbial fertilizers and nitrification rates in soils treated with different nitrogen application rates (mg/(kg·d)).
IndicatorIncubation Time (d)A0N1A0N2A1N1A1N2
Apparent nitrification rate181.8179.0783.4497.32
33.9710.3218.743.37
78.917.012.748.99
153.574.192.823.26
25−0.62−0.92−0.46−1.44
35−0.82−1.19−1.03−0.48
Net nitrification rate1−19.55−22.28−52.03−38.15
31.678.0223.197.82
710.858.964.7711.02
152.142.764.114.56
25−1.94−2.25−0.051.03
35−0.05−0.420.160.71
Table 4. Variance analysis of the effect of microbial fertilizer and N application on soil ammonium N content.
Treatment1 d3 d7 d15 d25 d35 d
FpFpFpFpFpFp
A191.001<0.001 *338.419<0.001 *306.779<0.001 *209.350<0.001 *15.4210.002 *1.6110.228
N2650.629<0.001 *4438.005<0.001 *1886.159<0.001 *1154.125<0.001 *3.9230.049 *0.9810.403
A × N114.332<0.001 *187.127<0.001 *57.575<0.001 *78.798<0.001 *2.1130.1640.8150.466
Note(s): * indicates a significant linear correlation in soil nitrogen content at the p < 0.05 level.
Table 5. Variance analysis of the effect of microbial fertilizer and nitrogen application on soil nitrate nitrogen content.
Treatment1 d3 d7 d15 d25 d35 d
FpFpFpFpFpFp
A0.2890.60056.671<0.001 *22.332<0.001 *0.2890.6007.3920.019 *10.2450.008 *
N208.775<0.001 *12.5250.001 *32.013<0.001 *208.775<0.001 *137.461<0.001 *219.571<0.001 *
A × N0.6310.54910.2480.003 *2.0910.1660.6310.5499.8860.003 *27.776<0.001 *
Note(s): * indicates a significant linear correlation in soil nitrogen content at the p < 0.05 level.
Table 6. Variance analysis of the effect of microbial fertilizer and N application on soil inorganic state N content.
Treatment1 d3 d7 d15 d25 d35 d
FpFpFpFpFpFp
A101.409<0.001 *207.978<0.001 *206.777<0.001 *101.409<0.001 *13.0060.004 *8.4200.013 *
N1009.699<0.001 *913.651<0.001 *957.147<0.001 *1009.699<0.001 *143.508<0.001 *127.711<0.001 *
A × N42.794<0.001 *73.259<0.001 *14.696<0.001 *42.794<0.001 *11.4210.002 *19.337<0.001 *
Note(s): * indicates a significant linear correlation in soil nitrogen content at the p < 0.05 level.
Disclaimer/Publisher’s Note: The statements, opinions and data contained in all publications are solely those of the individual author(s) and contributor(s) and not of MDPI and/or the editor(s). MDPI and/or the editor(s) disclaim responsibility for any injury to people or property resulting from any ideas, methods, instructions or products referred to in the content.

