Article

A Bilevel Optimal Water Allocation Model Considering Water Users’ Satisfaction Degree and Water Rights Transaction: A Case Study in Qingzhang River Basin, China

1
Research Center for Eco-Environment of South-to-North Water Transfer Project, the Yellow River Basin, Henan University of Engineering, Zhengzhou 451191, China
2
College of Management and Economics, Tianjin University, Tianjin 300072, China
3
Nanyang Institute of Technology, Nanyang 473004, China
*
Author to whom correspondence should be addressed.
Water 2023, 15(14), 2650; https://doi.org/10.3390/w15142650
Submission received: 18 May 2023 / Revised: 12 July 2023 / Accepted: 19 July 2023 / Published: 21 July 2023
(This article belongs to the Section Water Use and Scarcity)

Abstract

:
The contradiction between water supply and demand in China is becoming increasingly prominent. A water allocation scheme that satisfies various water users can effectively solve it. In this paper, considering both individual rationality and collective rationality, a bilevel optimal allocation model for river basin water resources is established. Firstly, water users’ satisfaction degree was defined, to characterize their satisfaction with the water resource allocation scheme, and principles of water users’ satisfaction degree were mathematically expressed, to represent water users’ negotiation activities in the initial water rights allocation. Then, based on the initial allocation results, water users’ water intake quantity, water-saving amount, and water-trade amount were optimized by water rights trading. Finally, an algorithm based on the response surface was put forward for solving the proposed bilevel optimal allocation model. The validity and feasibility of the model and algorithm were verified by a case study in the Qingzhang River Basin in China.

1. Introduction

Water resources play an important role in socio-economic development [1]. With population growth, climate change, and rapid social and economic development, the contradiction between water supply and demand is becoming increasingly prominent [2], such as water conflicts in the Zhanghe river basin in China [3,4]. More than 30 intense water conflicts in the basin, including bombing of water conservancy facilities, have occurred since the 1950s, causing huge economic losses and negative social implications [3]. To resolve the conflicts in the basin, the water allocation scheme of the Zhanghe river was formed and the Zhanghe River Upstream Management Bureau (ZRUMB) was established to implement the scheme. However, due to the decreasing runoff and excess water demand [5], the scheme was not well carried out by water users and conflicts among them occurred from time to time [6]. To enhance the enforceability of the scheme and alleviate the water conflicts [7], it is necessary to study how to make the water allocation scheme of the Zhanghe river satisfactory for water users [8].
The scarcity of water resources and the nature of public water products determine the importance of efficiency, fairness, and sustainability in water resource allocation [9,10]. In order to achieve effective, fair, and sustainable water resource allocation, scholars have conducted much research on initial water rights allocation [11,12], water rights trading [13,14], and a combination of the two [15]. Scholars have also used interval parameter programming, fuzzy programming, stochastic programming, etc., to study water resource allocation under uncertain conditions [16,17,18]. This research is widely applicable to water allocation in China. However, such studies are mainly carried out by the water administrative authorities as representatives of water resource owners [19,20], always aiming to maximize the overall allocation benefit of the basin [21,22,23,24,25,26]. These methods are mostly based on the assumption of collective rationality and do not consider water users’ negotiation will, assuming that water users will accept and execute water resource allocation schemes [27]. In the case of sufficient water resources, the schemes may be accepted and implemented by water users. Otherwise, according to the logic of collective action [28], water users, based on individual rationality, will not accept the schemes [15] and will always judge whether they are satisfied according to two aspects [8]: whether their water volume allocation is enough, and whether their volume allocation is fair compared with that of other water users [8]. If they are not satisfied, water users may take actions to obtain more water resources. When the initial water rights allocation scheme is executed, water rights trading is an effective action [29,30]. Regarding water rights trading, researchers have studied water rights trading mechanisms [31], the third-party effect of water rights trading [22], games [18] and bargaining [32] among water users, and water trading models [33]. The prerequisite for the smooth implementation of water rights trading is that water users are satisfied with and execute the initial water rights allocation schemes made by water administrative authorities [15,34]. When water users are not satisfied with the scheme and, thus, cannot willingly participate in the water allocation, they may not execute it [35], and conflicts may occur among water users [6], even without water rights trading. As such, it is necessary to provide water users with a participation channel in river basin water allocation decision-making and enhance their satisfaction degree with the scheme [8]. Generally speaking, based on individual rationality, the higher the water users’ satisfaction degree with the initial water rights allocation scheme, the better their implementation of the scheme [18].
Therefore, making use of collective rationality in existing research and introducing individual rationality, this paper proposes the concept of water users’ satisfaction degree, constructs the principles of water users’ satisfaction degree through which water users can participate in the water allocation and express their own interests, and builds an initial water rights allocation sub-model based on satisfaction degree negotiation. Then, including the initial water rights allocation sub-model with water rights trading, a bilevel optimal model for river basin water resources allocation is established. Thirdly, a two-layer solution algorithm based on response surface is proposed. Finally, the effectiveness of the bilevel optimal allocation model and algorithm is verified through a case study of the Qingzhang River Basin in China.

2. Materials and Methods

2.1. The Definition and Principles of Water Users’ Satisfaction Degree

2.1.1. Definition of Water Users’ Satisfaction Degree

At present, water basin resource allocation in China is mainly planned by river basin management institutions first, and then carried out by water users in the basin. The term “water users” in this paper mainly refers to those agents representing different administrative regions in the basin. A drawback of this mechanism is that the scheme’s implementation is not fully taken in consideration, which may result in conflicts among water users. In this paper, the scheme’s implementation is explained as the willingness of users who carry out the scheme, which can be reflected by water users’ satisfaction degree with the scheme. Water users’ satisfaction degree refers to their subjective evaluation of the water allocation scheme from the perspective of their own interests. When water users’ satisfaction degree with the scheme is high, this means that the implementation of the scheme is high, and vice versa. According to the function of satisfaction in mathematics [17], water users’ satisfaction degree is defined as follows:
S k = 0 , R k < D min k R k D min k D max k D min k , D min k < R k < D max k 1 , R k D max k
In Formula (1), Sk is water users’ satisfaction degree in administrative region Ak in the basin, Rk is the water amount allocated to administrative region Ak, and Dmink and Dmaxk are the minimum and maximum amount of water demand in administrative region Ak, respectively.

2.1.2. Principles of Water Users’ Satisfaction Degree

The implementation of water allocation scheme is influenced by two aspects. From water users’ own perspective, they consider whether their own water demand is satisfied. When comparing with other users, they care whether or not their satisfaction degrees are relatively equal and fair. From this, two principles are formed: ① a minimum satisfaction degree; ② the difference in satisfaction degree. These two principles are abstractly quantified into two functions: minimum satisfaction degree function and differential satisfaction degree function.
Minimum satisfaction degree function: The satisfaction degree of each user in the basin should be greater than a minimum satisfaction degree set by the watershed management agency. Its mathematical expression is
S k S 0
In Formula (2), S0 is the minimum satisfaction degree that must be met by each user within the basin, as specified by the watershed management agency.
For the difference satisfaction function, the coordination deviation of each water user’s satisfaction degree should be limited within a small range. When considering equality and difference among water users and the efficiency of water resource allocation, the mathematical expression is as follows:
S k S 0 w k S j S 0 w j δ
In Formula (3), Sj is the satisfaction degree in administrative region Aj (jk) and δ is an error coefficient, which is a minimum positive number close to 0. ‘SkS0′ and ‘SjS0′, respectively, represent the difference between the satisfaction degree in regions Ak and Aj and the minimum satisfaction degree set by the watershed management agency. Wk and wj are the decision weights of Ak and Aj, respectively, in water resource allocation negotiations. S k S 0 w k and S j S 0 w j denote the satisfaction coefficients of water users Ak and Aj respectively, indicating how well the satisfaction degree matches the decision weight.
wk and wj are highly affected by the adopted principle of water resource allocation. The principle of respecting the historical and current situations places greater emphasis on objective facts and is more suitable to serve as the basis for negotiation among water users. Hence, the decision weights of administrative regions are set mainly according to this principle, including the principles of water source priority, occupation priority, and population priority. The specific methods for applying these principles are as follows.
The principle of water source priority implies allocation is made according to the water yield of each area: the higher the water yield, the higher the decision weight. The corresponding decision weight can be expressed as follows:
γ c k = C k k = 1 K C k
In Formula (4), rck is the decision weight of administrative region Ak on the priority of water sources, Ck represents the water yield in administrative region Ak, and K is the number of administrative regions in the basin.
The principle of occupation priority indicates that allocation is determined by the current water consumption in each district: the higher the current water consumption, the higher the decision weight. The corresponding decision weight can be expressed as follows:
γ o k = O k k = 1 K O k
In Formula (5), rok is the decision weight of administrative region Ak on occupation priority and Ok is the current water consumption in administrative region Ak.
The principle of population priority means water is distributed according to the proportion of regional population: the greater the regional population, the higher the decision-making weight. The corresponding decision weight can be expressed as follows:
γ p k = P k k = 1 K P k
In Formula (6), γpk is the decision weight of administrative region Ak based on population priority and Pk is the total population in administrative region Ak.
Therefore, the decision weight wk of region Ak can be expressed as the weighted average of the above three types of decision weights, and its mathematical form is
w k = θ C γ c k + θ O γ o k + θ P γ p k
In Formula (7), θ c , θ o , and θ p are the importance coefficients assigned to water source, occupation, and population principles in the allocation of water resources, in which θ C + θ O + θ P = 1 .

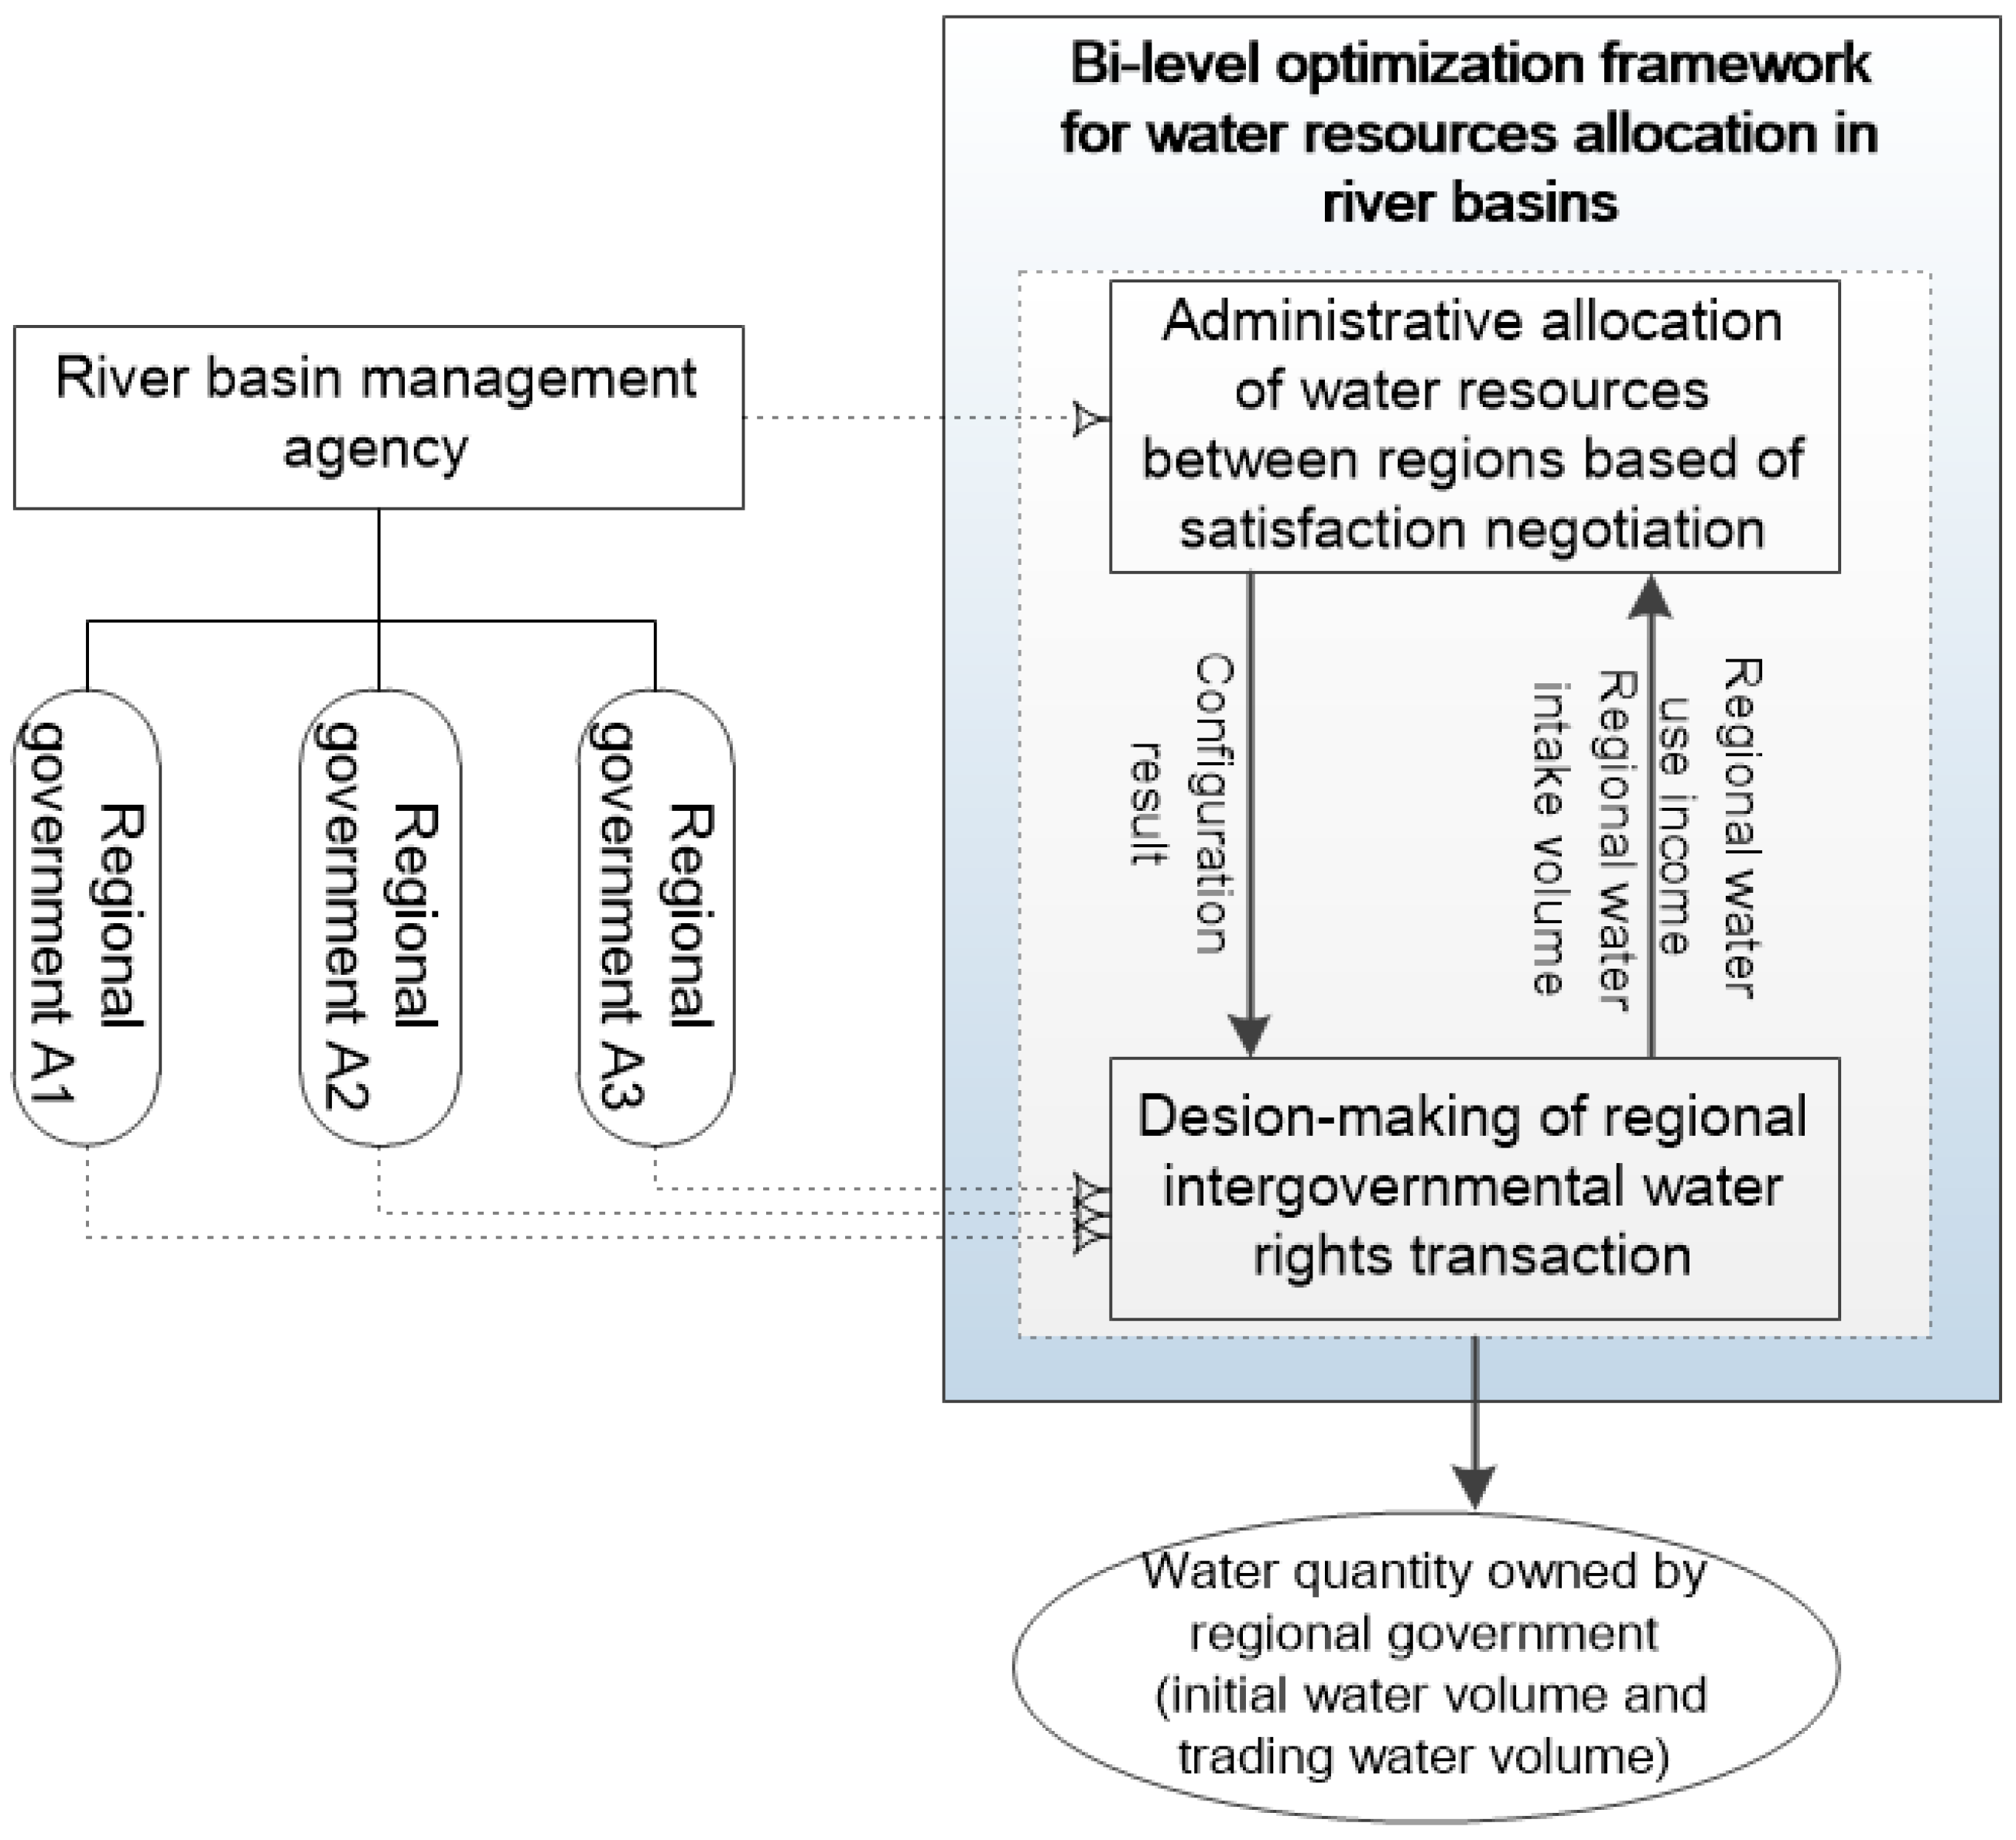
2.2. A Bilevel Optimization Model for Basin Water Resources Allocation

2.2.1. Model Framework

Water resource allocation is carried out by basin management agencies in two steps, shown in Figure 1. Firstly, initial water allocation is implemented only considering water users’ satisfaction degree, aiming for a maximum benefit of the river basin. Secondly, water trading is conducted to further optimize water allocation among water users and maximize their own benefits constrained by initial water allocation. These two steps loop until maximization of benefit of the river basin is obtained.

2.2.2. Model Assumptions

① The principles of water resource allocation in a basin include basic water security, historical and present water use status, water users’ satisfaction, and fairness and efficiency principles. Specifically, basic water security and water users’ satisfaction principles form the constraint conditions of the model. The principle of respecting historical and present situations is reflected when calculating the decision-making weight of water users. The principle of efficiency is embodied through water rights trading and objective function;
② According to basic water security principles, basic water needs such as water for life should be fully satisfied in priority. Hence, while carrying out allocation, the amount of basic water needs is subtracted first. The rest of the water is allocated among water users;
③ According to the principle of fairness and efficiency, a higher level of fairness and benefit of water resource allocation in the basin is better. Therefore, the model takes fairness and efficiency as an objective function;
④ To simplify the model, it is supposed that water trading only takes place among water users within the same basin and cannot occur among water users in different basins.
When establishing the model, it is assumed that, when the water demand Dk of administrative region Ak is greater than its actual water intake, that is, Dk > Qk, it is possible to resolve the difference DkQk in water demand for area Ak by saving water and improving water efficiency. When the actual water intake Qk of area Ak is greater than its initial water allocation, that is, Qk > Rk, area Ak can obtain surplus water quantity QkRk from other regions by water rights trading on the market. In contrast, when the actual water intake Qk of area Ak is less than the initial water allocation Rk, that is, Qk < Rk, area Ak can transfer the surplus water RkQk through a water market to obtain income.
China’s water rights trading market adopts a “quasi-market” mode. Although it is not a completely competitive market, the price of water rights transaction is affected by the relationship between supply and demand in the water market, that is, water rights transaction price is related to water rights trading volume. However, to avoid “negative externalities” from water rights trading and promote trading activity, it is necessary for the government to regulate water rights transaction price. Therefore, according to the oligopoly competition model, the expression for water rights transaction price is assumed to be Vd = Vgbx(Vg > 0, b > 0), where Vd is the price of water rights transactions, x is the total amount of water rights trading among regions, b is the influence coefficient of water rights supply and demand on water rights transaction price, and Vg is the benchmark price for water rights transactions, which reflects the guiding price for a water rights transaction defined by the government.

2.2.3. Model Construction

In the bilevel optimization model of water resource allocation in a river basin, upper-level optimization is mainly used to determine the initial water amount of each administrative region, and lower-level optimization is mainly used to determine their actual water withdrawal (or transaction water volume). The former aims to maximize the water use efficiency of entire river basin from the river basin management institutions’ perspective, which represents overall benefit. The latter aims to maximize the water use efficiency of a region from the perspective of local government, which represents local benefit. The watershed management organization and local government have a “master–slave” relationship, and the optimization variables of watershed management agencies are prioritized over those of local governments.
(1) Optimization sub-model of water rights trading among water users:
The decision maker for the lower-level optimization model is regional local government, and its main goal is to optimize the actual water intake Qk given the maximum net income of the region, under the condition that initial water allocation is known.
When water-saving measures are adopted, the water use benefit function of area Ak (represented by GDP output value) can be expressed as follows:
B k = b k a Q k = 1 + b ' b k 0 Q k
In Formula (8), bka and bk0 are the output value of GDP per cubic meter of water when water-saving measures are taken and not taken in area Ak, respectively, and b’ represents the growth rate of GDP per cubic meter of water after water-saving measures are taken, which can be expressed with the percentage of the economic benefit increment per cubic meter before and after water saving.
After water saving and water rights trading, the net income function bkp of area Ak can be expressed as follows:
B k p = B k Q k V r φ k D k Q k + R k Q k V d
In Formula (9), Vr is the price of water resources (which is an optimization variable to be solved), Qk · Vr is the cost of water resources in area Ak, φ k D k Q k is the water-saving cost function of area Ak, and R k Q k V d is the water rights trading income of region Ak.
As a rational individual, area Ak chooses a strategy (here, it refers to the determination of water intake) that maximizes its net income. Based on this, the optimization model of water rights transactions among water users can be established as follows:
m a x Q k B k Q k V r φ k D k Q k + R k Q k V d s . t . k = 1 K Q k R T R L R E R C k = 1 K R k R T R L R E R C Q k , R k > 0
In Formula (10), RT is the total water resources of the whole basin, RL is the basic domestic water consumption of the whole basin, RE is the basic ecological water consumption and basic grain water consumption, and RC is the basic water use, which is not involved in initial water rights allocation and water rights trading;
(2) Optimization sub-model of initial water rights allocation:
The decision maker for the higher-level optimization model is the basin management organization, whose main task is to optimize the initial allocation scheme of water resources and the regulation scheme of water rights trading, with the goal of maximizing its overall benefit of the basin on the premise of ensuring basic water use in the basin;
① Optimization objective:
The optimization objective Bw includes an initial water resource allocation sub-objective Bw1 and water rights trading regulation sub-objective Bw2. Bw1 can be expressed as the weighted sum of water shortage rate and economic benefits after initial distribution, and its mathematical expression is
B w 1 = η · max D k R k D k + 1 η · k = 1 K b k 0 · R k max ( b k 0 ) · k = 1 K R k
In Formula (11), max D k R k D k is the water shortage rate in a basin, which reflects the fairness of allocation, k = 1 K b k 0 · R k is the economic benefit of initial allocation, which becomes k = 1 K b k 0 · R k max ( b k 0 ) · k = 1 K R k after standardization, and η is the weight of water shortage rate in the whole target area.
Bw2 can be expressed as the sum of water users’ economic benefits in a basin after water rights trading. Considering the unity of the target order of magnitude, it is standardized as follows:
B w 2 = k = 1 K B k p max ( b k 0 ) · k = 1 K R k
Based on the above analysis, Bw can be expressed mathematically as
B w = ρ · B w 1 + 1 ρ · B w 2
In Formula (13), ρ is a weight factor. When the value of ρ is large, river basin management institutions focus on administrative allocation; when the value of ρ is small, river basin management institutions focus on market allocation;
② Constraints:
Constraints include initial water rights allocation constraints and water rights transaction constraints. According to Formulas (1)–(4), initial water rights allocation constraints can be expressed as
k = 1 K R k R T R L R E R C S k S 0 S k S 0 ω k S j S 0 ω j δ
In Formula (14), Sk and Sj can be determined from initial water distribution and water demand according to the formula for water users’ satisfaction.
When trading water rights, the trading price of water rights should be higher than the cost of water resources. Therefore, the regulation and control constraints of water rights trading are mainly about the cost and the price of water, which can be expressed as
l b V r u b V r V d V d m a x
In Formula (15), lb and ub represent the lower bound and upper bound of water resource prices, respectively, which are determined by river basin management agencies; accordingly, Vdmax indicates the maximum value of water rights transaction price, which is also determined by river basin management agencies with the aim of preventing “negative externalities” in water rights transactions and ensuring fairness;
③ Optimization sub-model:
Based on the above objective and constraint functions, the optimization model of initial water resource allocation can be established as follows:
max R k , V r , V g B w = ρ · B w 1 + 1 ρ · B w 2   s . t . k = 1 K R k R T R L R E R C S k S 0 S k S 0 ω k S j S 0 ω j δ l b V r u b V r V d V d m a x 0   ρ 1
In Formula (16), Rk is initial allocation, Vr is water resource price, and Vg is the water rights trading benchmark price. Vr and Vg are used to guide the water intake behavior and regulate water rights trading;
(3) Bilevel optimization model for basin water resources allocation
In summary, Formulas (10) and (16) can be combined to form the bilevel optimal water resources allocation model. In the model, watershed management agencies guide local governments through their own decision-making results (initial water allocation, water resource price, and benchmark price of water rights trading) but do not directly interfere with the decision-making of water intake in each region. On the premise of complying with the decisions of watershed management institutions, local governments can freely make decisions on water intake amount, water saving amount, and water rights trading to maximize their own interests, and their decision results are fed back to watershed management agencies.

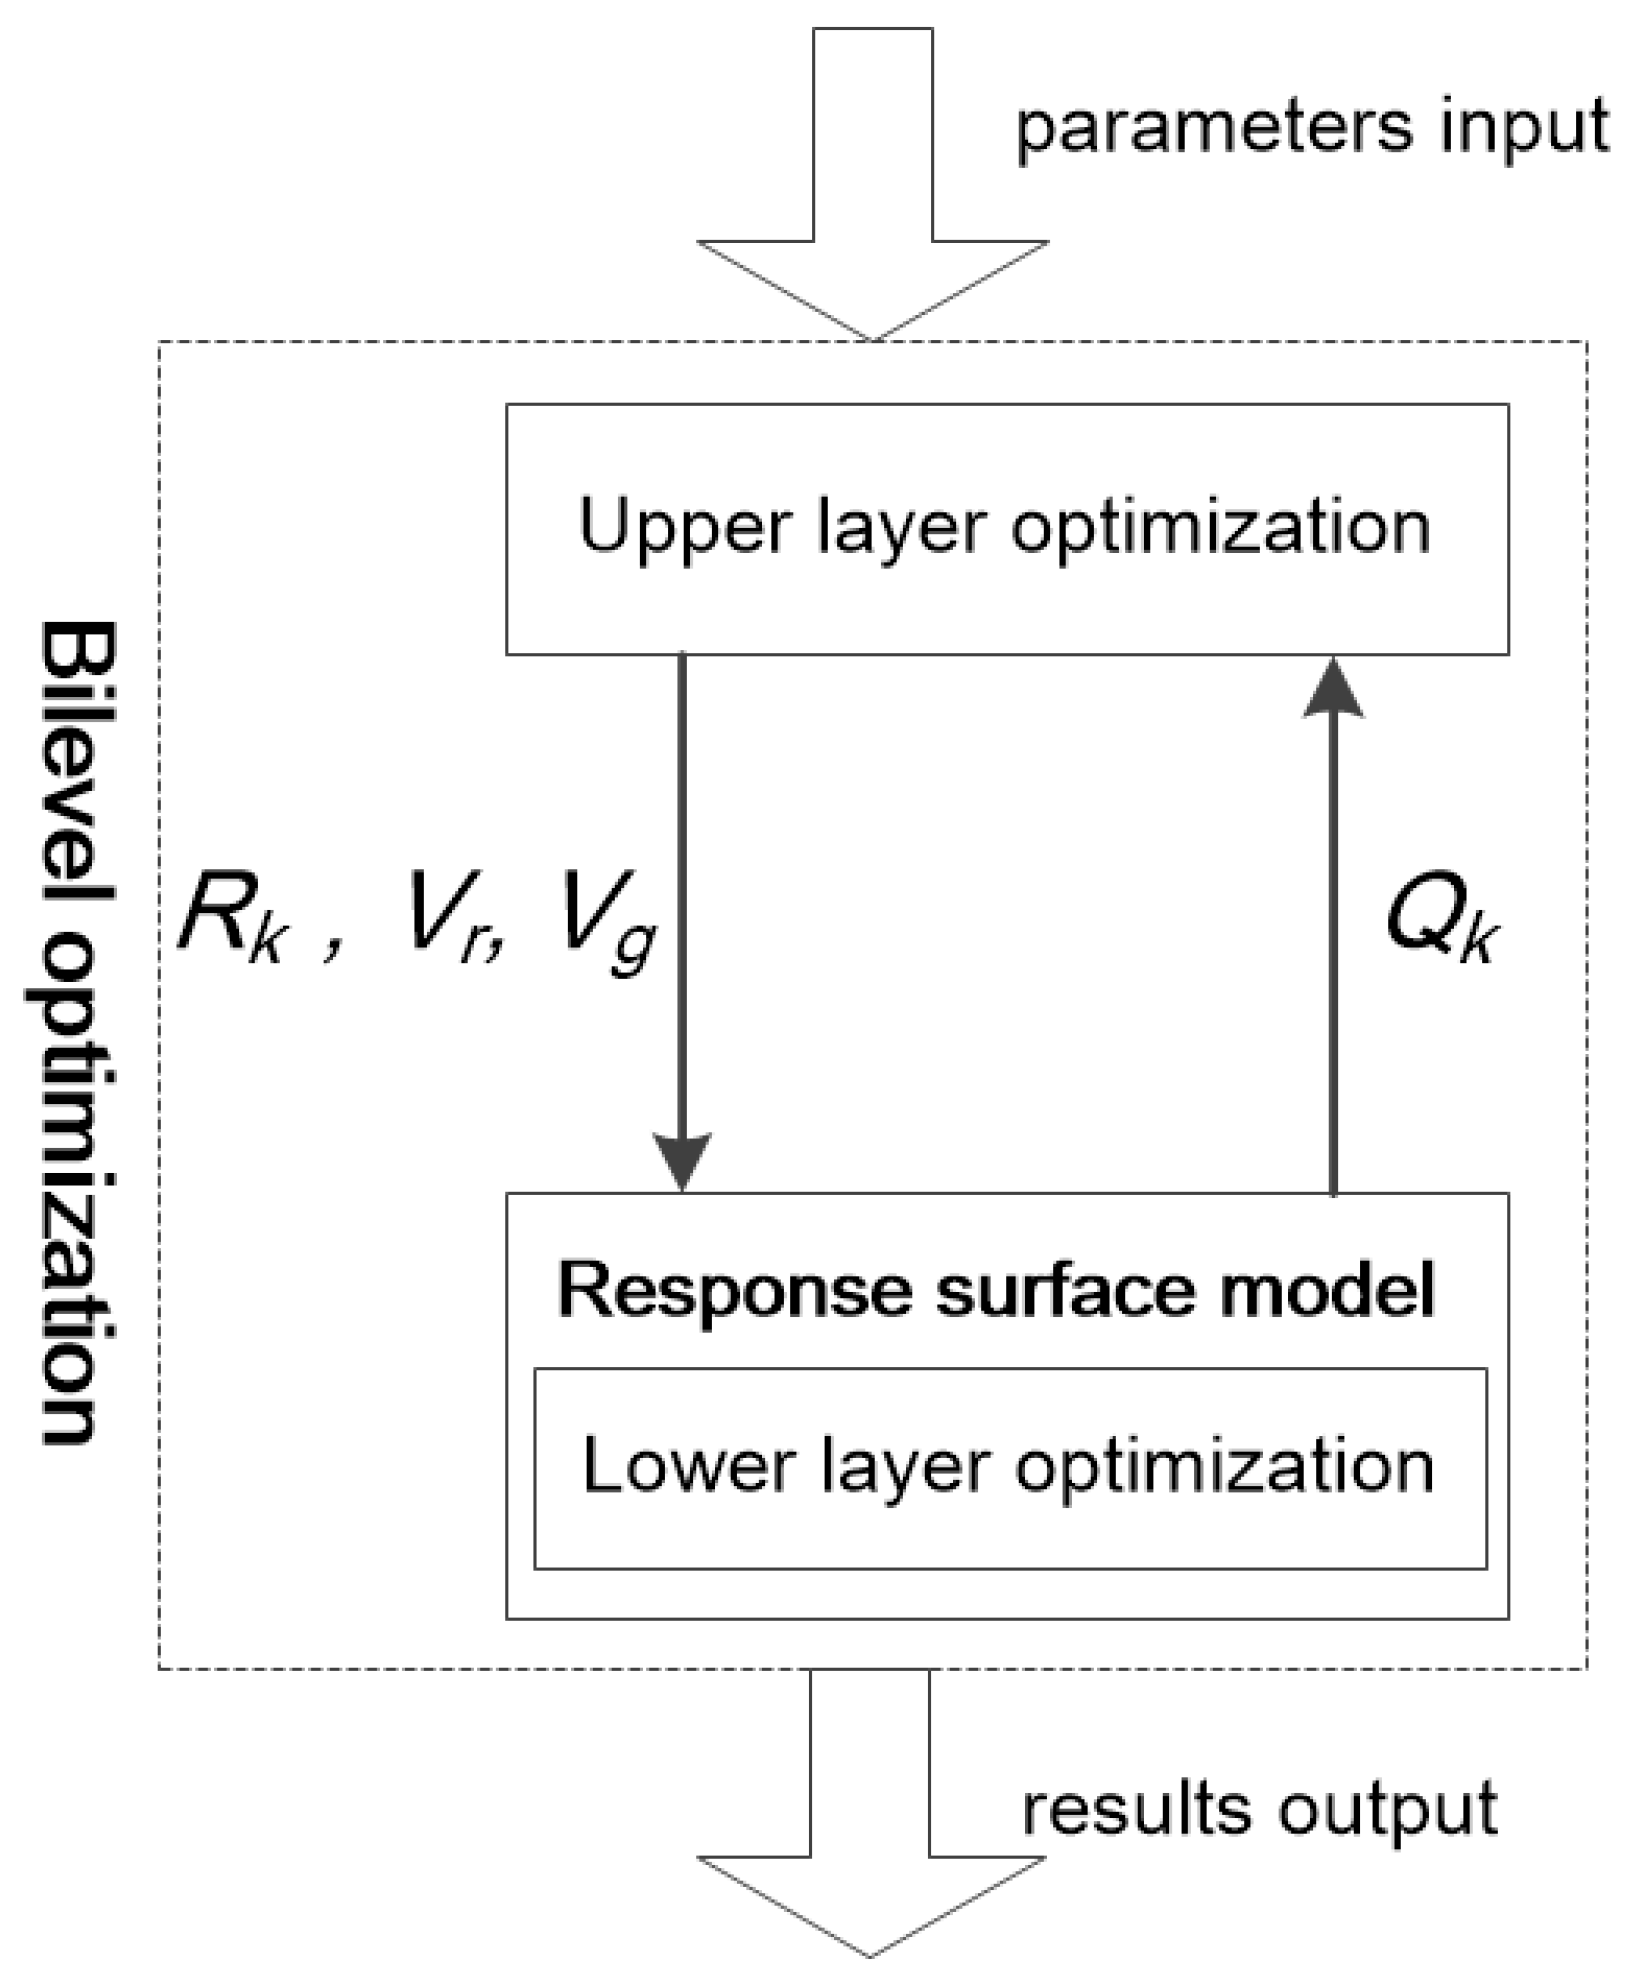
2.3. Solution to the Bilevel Optimization Model for Water Basin Resource Allocation

2.3.1. Solution Ideas

① The lower-level decision maker pursues a maximization of its own benefits after water rights trading, that is, the lower-level decision maker hopes to improve its benefits through water rights trading and prefers a high growth rate of benefits, starting from the establishment of water rights trading. Therefore, the objective function of the lower optimization model can be transformed into the economic benefit growth rate before and after water rights transactions;
② China’s water rights trading has the characteristics of a “quasi-market”. The government hopes that the economic growth rate of both parties before and after water rights trading can be as balanced as possible. A minimum economic benefit growth rate among lower-level stakeholders can be taken as the lower-level optimization goal; thus, the multilevel optimization problem can be transformed into a single optimization problem and optimization conflict can be effectively avoided among the lower-level subjects.
Based on the above two points, the objective function of the lower-level interregional water rights trading optimization model can be modified as follows:
m a x m i n ( B k p B k b B k b )
In Formula (17), B k b = b k 0 R k V r R k is the net income before water rights transactions in area A k

2.3.2. Algorithm Design Based on Response Surface Methodology
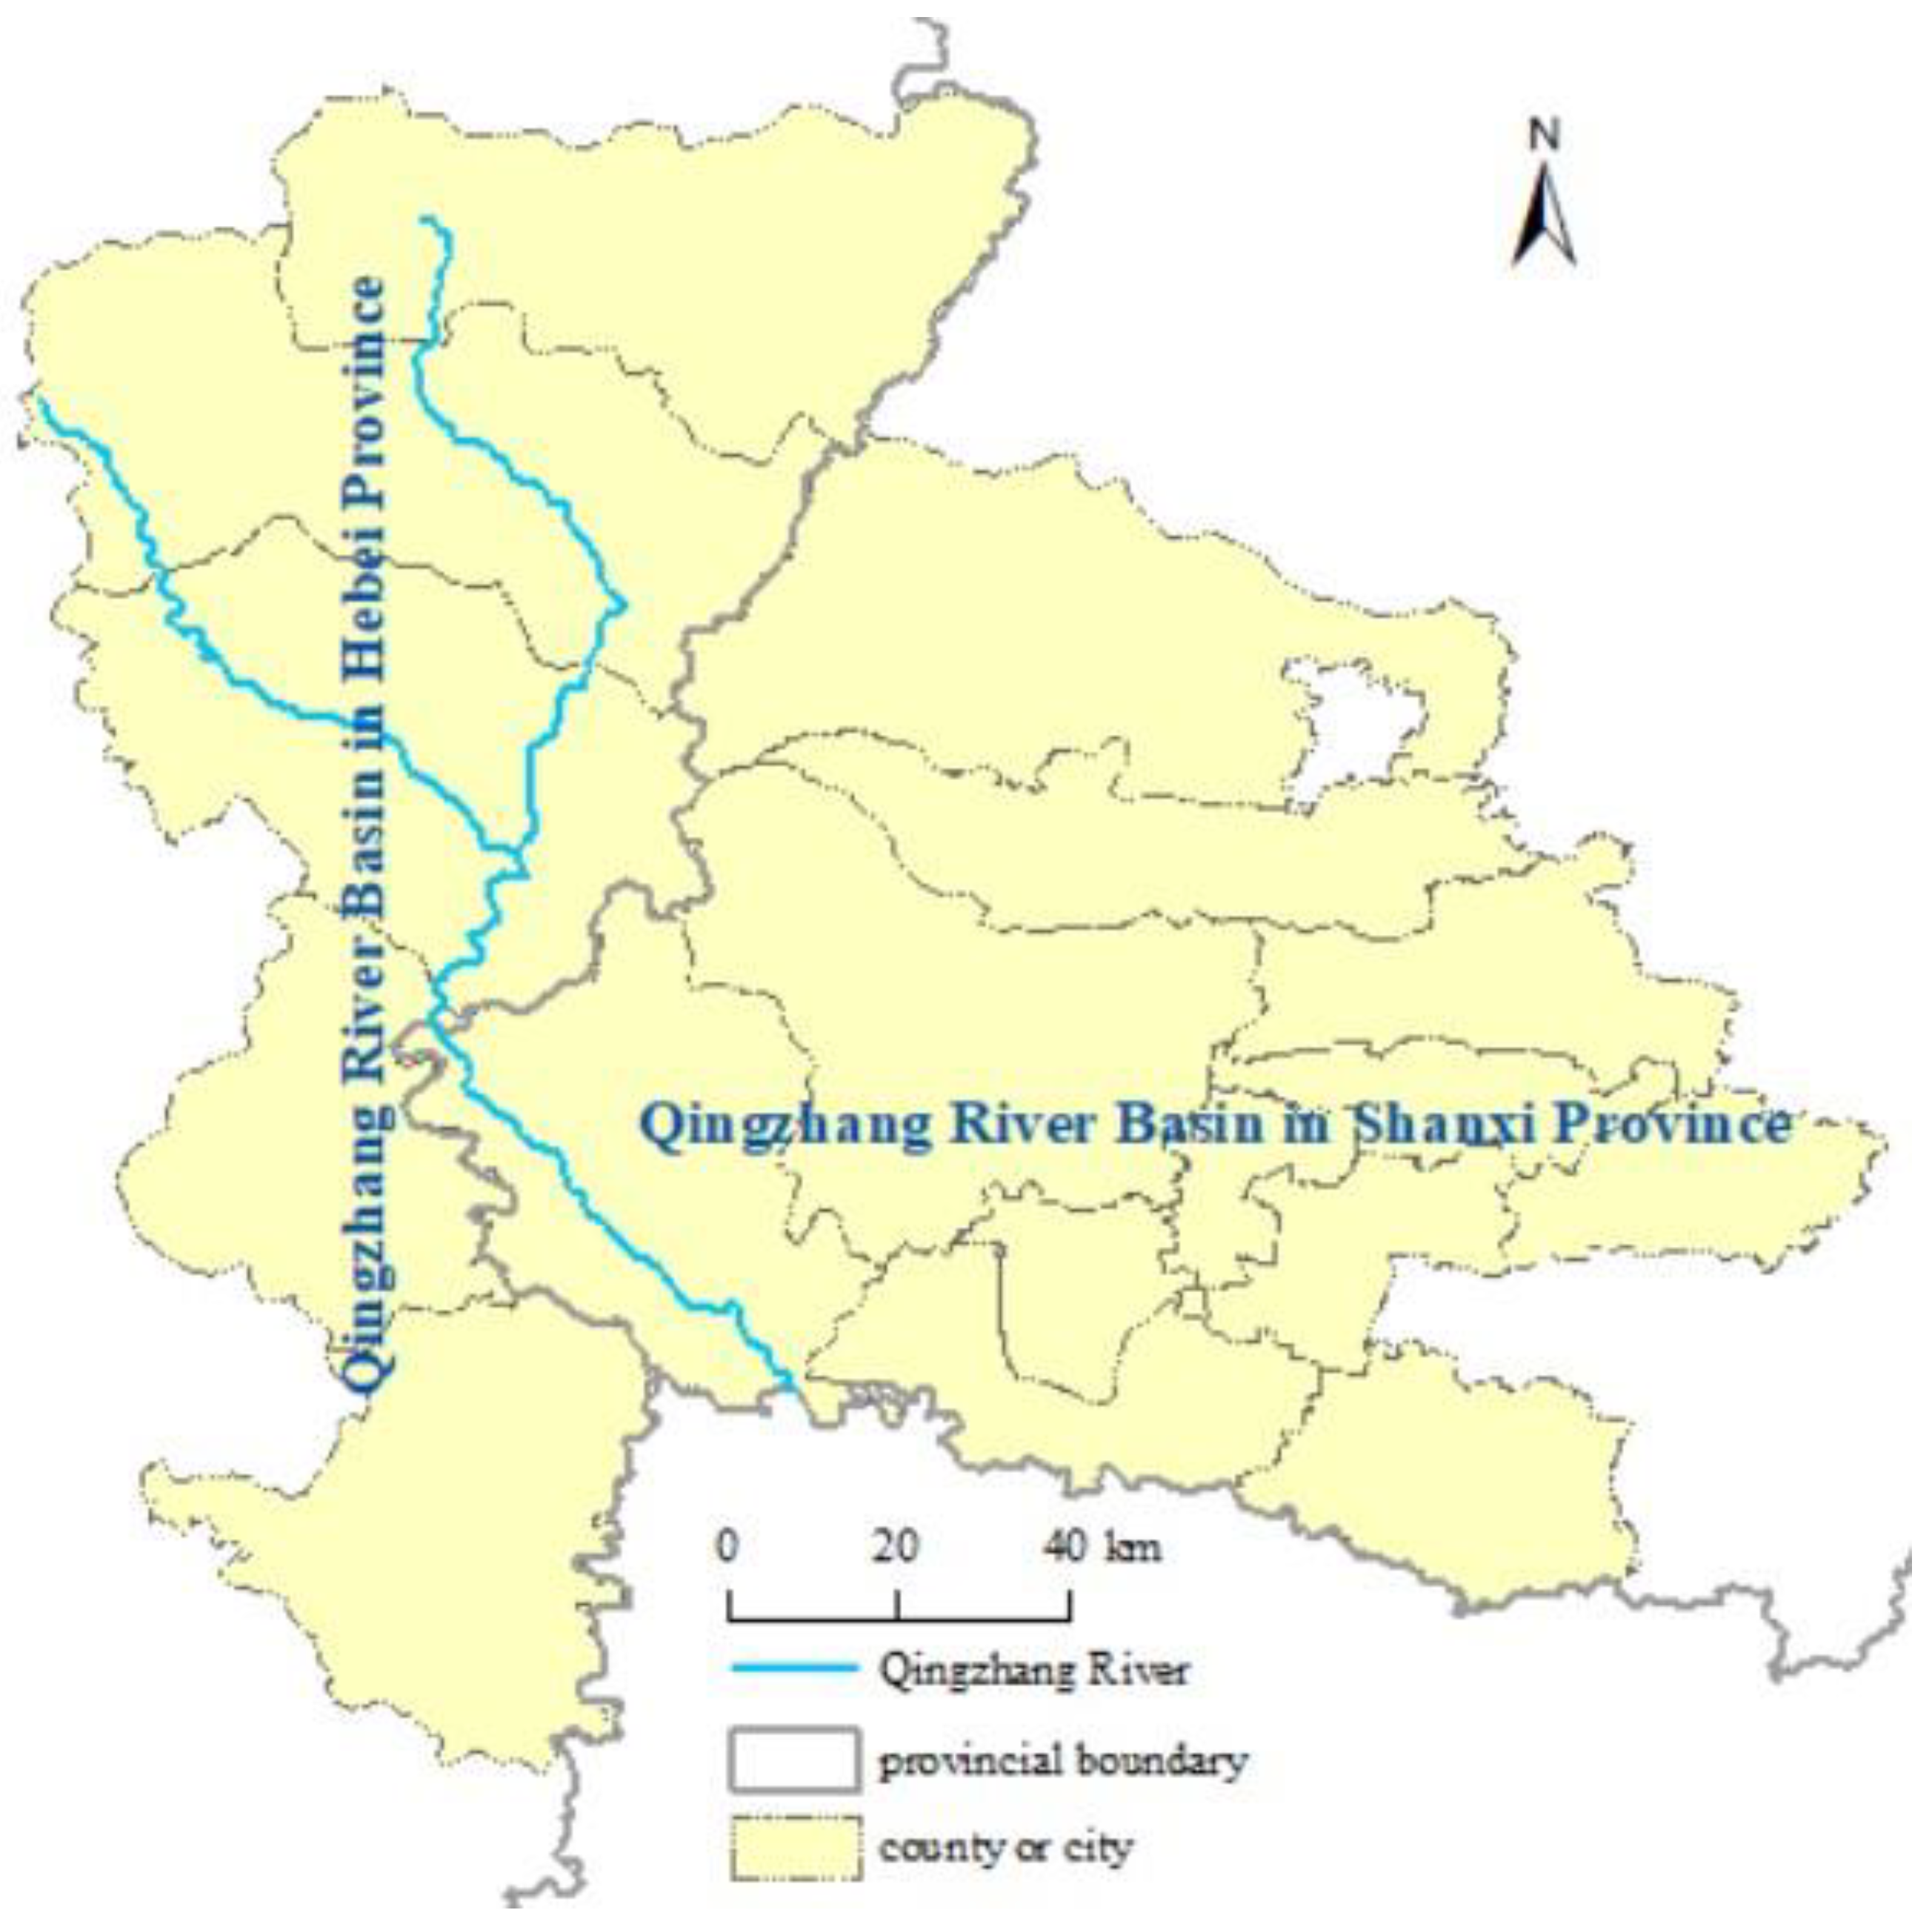
The proposed bilevel optimization problem is a kind of mathematical model with a hierarchical relationship between master and slave, and the lower optimization problem is nested in the solution process of the upper optimization model. The objective function and constraints of the upper optimization problem are not only related to their own optimization variables, but also depend on the optimal solution of the lower optimization problem; furthermore, the optimal solution of the lower optimization problem is influenced by the optimization variables of the upper optimization problem. The key to solving the bilevel optimization problem is to determine how the lower optimization variables contained in the upper model be calculated, and the most direct method is to solve the lower optimization model. In this kind of processing method, first, its calculation process is complex and calculation cost is high. Second, it may cause discontinuity in the objective and constraint functions of the upper model, which will make it difficult to solve the model. To improve this situation, the response surface method is introduced to solve the lower optimization variables, and a bilevel optimization model algorithm based on the response surface is proposed.
① The basic idea of the algorithm:
The response surface methodology (RSM) is a multivariable modeling method combining approximate model technology and experimental design methods. It can approximate a complex “black box” problem by fitting a clearly expressed function or model based on a series of test samples. For the bilevel optimization model for basin water resource allocation, the lower optimization model can be regarded as a “black box”. The inputs of this black box are optimization variables Rk, Vr, and Vg of the upper model, and its output is the optimization variable Qk of the lower model. The task of the RSM is to fit a clearly expressed mathematical model Qk = f(Rk, Vr, Vg) instead of the lower optimization model shown in Formula (10).
Based on the RSM, the lower optimization variables Qk included in the upper model can be calculated directly through the lower response surface model Qk = f(Rk, Vr, Vg), which simplifies the process of solving the whole bilevel optimization problem and is more conducive to obtaining the global optimal solution. The solution process is shown in Figure 2.
② Calculation steps of the algorithm
Step 1. Rk, Vr, and Vg are the independent variables of the response surface model, and Qk is a dependent variable. In the feasible region of independent variables, a certain number of independent variable sample points (Rk, Vr, Vg) are selected by an experimental design method. Formula (10) is solved by the optimization algorithm with sample points as basic parameters, and the corresponding dependent variable sample points (Qk)are obtained;
Step 2. Select an appropriate approximate model technology and take the test sample (Rk, Vr, Vg, Qk) as data to generate a response surface model Qk = f(Rk, Vr, Vg);
Step 3. Replace the lower optimization model with the RSM Qk = f(Rk, Vr, Vg) to calculate Qk, then use the optimization algorithm to solve the upper optimization model to obtain an upper optimal solution (Rk, Vr, Vg) and its corresponding lower optimal solution Qk.
It can be seen from the above steps that there are two key technologies involved in the construction of a response surface model: one is experimental design method, and the other one is the approximate model technology. Commonly used experimental design methods include full factorial design, partial factorial design, central combination design, orthogonal design, uniform design, and so on. Approximate model techniques include polynomial functions, Kriging models, radial basis function models, neural networks, and support vector machines. Considering the calculation cost and accuracy, uniform design was chosen as the experimental design method, and quadratic polynomial function or Kriging model was selected as the approximate model in this paper.

3. Case Analysis

The Qingzhang River flows through Jinzhong city and Changzhi city in Shanxi Province and Handan city in Hebei Province (shown in Figure 3). The information on water supply, water demand, and agricultural and industrial water consumption in the basin are shown in Table 1, and basic domestic water consumption is shown in Table 2. In this section, the bilevel optimization model is applied to optimize the allocation of water resources in the Qingzhang River Basin in Shanxi and Hebei provinces.
According to Table 1 and Table 2, the basic domestic water demand of Shanxi Province and Hebei Province can be calculated as 0.15 and 0.14 billion cubic meters, respectively. After prioritizing basic domestic water, the total amount of water resources available for distribution in the basin is 137.79 million m3. The water demand of Shanxi Province and Hebei Province are 36.60 and 106.33 million m3, respectively. In the case study, they are regarded as the maximum amounts of Shanxi’s and Hebei’s water demands, and half of the two values are assumed as their respective minimum amounts of water demands. Based on field investigation, the output values of GDP per cubic meter of water of Shanxi and Hebei are CNY 114 and CNY 233, respectively, and the priorities of water source, occupation, and population are assumed as 0.3, 0.4, and 0.3, respectively. According to Formula (7), the decision weights of Shanxi and Hebei are 0.35 and 0.65, respectively.
The paper confirms the validity of the proposed model in two steps. Firstly, to validate the reasonability of the satisfaction degree concept, initial water allocation of the Qingzhang River Basin was conducted, only considering water users’ satisfaction degree. Secondly, considering both initial water allocation and water rights transaction, the proposed bilevel optimal allocation of Qingzhang river was carried out.
(1) Initial water rights allocation of Qingzhang River Basin only considering water users’ satisfaction degree:
According to the information of the Qingzhang River Basin above, the initial water allocation model of the basin is as follows:
min [ η · max ( 0.3660 R ^ 1 0.3660 , 1.0633 R ^ 2 1.0633 ) 1 η · 114 · R ^ 1 + 233 · R ^ 2 233 × 1.3779 ]
s . t . R ^ 1 + R ^ 2 1.3779 S 1 S 0 S 2 S 0 S 1 S 0 0.347 S 2 S 0 0.653 δ
In Formula (18), R ^ 1 and R ^ 2 represent the amount of allocated water of Shanxi and Hebei provinces, respectively, and are the optimization variables of the model. S 1 and S 2 represent the satisfaction degree of Shanxi and Hebei provinces, respectively.
We set η = 0.6 , S 0 = 0.8, and δ = 0.1 . The optimization results were R ^ 1 = 0.34 hundred million m3, R ^ 2 = 1.03 hundred million m3; the maximum of water shortage rate of the whole basin was 0.06, and the economic benefit was CNY 280.16 hundred million. The other results of Shanxi and Hebei provinces are shown in Table 3.
Through an analysis of the calculation results in Table 3, the following findings can be obtained:
① For the initial water rights allocation scheme, Shanxi’s water satisfaction was 0.889, and Hebei’s water satisfaction was 0.941, both of which were greater than the minimum satisfaction of 0.8, reflecting the equity of the water allocation of the basin;
② There are differences in water supply and demand, population, etc. between Shanxi and Hebei provinces, and these were reflected by these two provinces’ decision weights. Shanxi’s decision weight (0.35) was lower than that of Hebei (0.65). However, their satisfaction degrees were both greater than the minimum satisfaction degree of the basin ( S 0 = 0.8). This is because the construction of difference satisfaction function (Formula (8)), which reflects the differences between administrative regions, can improve their satisfaction degrees effectively. Thus, this approach achieves a fair configuration, meets the constraint of differences of satisfaction, and ensures a high efficiency of configuration;
③ The solution process of the initial water allocation is iterative, whose iterative criterion is whether Shanxi and Hebei’s satisfaction degrees follow the principles of water users’ satisfaction degree (Formulas (2) and (3)) or not. Thus, this process reflects the negotiations between Shanxi and Hebei provinces by which they can take part in the water allocation and express their own benefit. In this case, the allocation results are better carried out;
④ The management agency can regulate the equity and efficiency of water allocation effectively by setting different minimum satisfaction degree of the basin ( S 0 ). In practice, if the agency pays more attention to the equity of allocation, S 0 can be set high. If more attention is paid to the efficiency of allocation, S 0 can be set low;
(2) Bilevel optimal water allocation of Qingzhang river basin:
In order to maximize the water use efficiency, bilevel optimal water allocation of Qingzhang River Basin was carried out, including both initial water rights and water rights trading.
The optimization variables and parameters of the model were set as follows: initial water distribution in Shanxi was R1, water intake was Q1, and water-saving cost function was 24(D1Q1)2; Hebei’s initial water allocation was R2, water intake was Q2, and water-saving cost function was 26(D2Q2)2. Before and after water saving, the growth rate of water use efficiency in Shanxi was 0.3 and that in Hebei was 0.2. The water resource price was Vr where 0.4 V r 2.0 , the benchmark price of water rights transactions was Vg and the price function of water rights transactions was V g 0.13 R 1 + R 2 Q 1 Q 2 , in which V r V g 4.0 . The minimum satisfaction of Shanxi and Hebei provinces was S0 = 0.8, and the balance error coefficient was δ = 0.1.
Through optimization calculations, the optimal solution of this problem was obtained as follows: R1 = 34.58 million m3, R2 = 103.21 million m3, Q1 = 34.03 million m3, Q2 = Q1 = 103.76 million m3, water resource price Vr = CNY 0.54, and water rights transaction benchmark price Vg = CNY 0.75, as shown in Table 4.
Through an analysis of the calculation results in Table 4, the following findings can be obtained:
① For the initial water rights allocation scheme, Shanxi’s water satisfaction was 0.89, and Hebei’s water satisfaction was 0.94, both of which are greater than the minimum satisfaction of 0.8. Hebei’s water satisfaction was slightly higher than Shanxi’s, which is consistent with the fact that Hebei’s decision-making weight was slightly higher than Shanxi’s. This result shows that there is a positive correlation between regional satisfaction and decision weight, and the water allocation scheme achieves satisfaction above the minimum constraint of water users. Thus, this approach achieves a fair configuration, meets the constraint of difference of satisfaction, and ensures a high efficiency of configuration;
② Shanxi’s water intake was 0.55 million m3 less than its initial distribution, while Hebei’s water intake was 0.55 million m3 more than its initial distribution. This shows that Shanxi saved 0.55 million m3 in water resources, and the saved water was sold to Hebei Province. Hebei Province alleviated its own water shortage problem by purchasing 0.55 million m3 of water from Shanxi. This demonstrates that water rights trading encourages water rights holders to save water and obtain economic benefits by selling water, which promotes water transfer from areas with low efficiency to areas with high efficiency and further realizes an efficient allocation of water resources;
③ Before water rights trading, the economic benefits of Shanxi and Hebei were CNY 39.23 hundred million and CNY 239. 92 hundred million, respectively. After water rights trading, the economic benefits of Shanxi and Hebei increased to CNY 50.24 hundred million and CNY 289.53 hundred million, respectively. It can be seen that Shanxi Province obtained more economic benefits through water conservation and water rights trading. Although Hebei Province bought water from Shanxi Province at a certain cost, its ultimate economic benefits were improved, which shows that water rights trading can effectively solve water shortage problems and improve the utilization efficiency of water resources.

4. Conclusions

In this paper, administrative allocation mode and market allocation mode are integrated with the consideration of water users’ satisfaction degree and water rights transaction negotiations. A bilevel optimal water allocation model for river basin water resources is constructed, and a solving algorithm based on the response surface is proposed.
(1) The model integrates both collective and individual rationalities of water users, simulates water users’ negotiation behavior with the principles of water users’ satisfaction, and enhances the enforceability of the water resource allocation scheme;
(2) Satisfaction degree is a useful way for water users to participate in water allocation. The management agency of the basin can regulate the equity and efficiency of water allocation by setting the minimum satisfaction degree of the basin ( S 0 ). The higher the value of ( S 0 ), the more attention is paid to the equity of water allocation;
(3) Compared to only considering satisfaction degree in the initial allocation, bilevel optimal water allocation improves the overall efficiency of water resource allocation effectively. In the initial allocation, only considering satisfaction degree, Shanxi’s and Hebei’s economic benefits a\were CNY 39.17 hundred million and CNY 240.99 hundred million, respectively. In the bilevel optimal water allocation, taking into account the mutual influence of satisfaction degree and water rights transactions, Shanxi’s and Hebei’s economic benefits were obviously improved to CNY 50.24 hundred million and 289.53 hundred million, respectively. Meanwhile, Shanxi’s and Hebei’s satisfaction degrees only fluctuated a little;
(4) In the model, the basin management organization is not only a distributor of water resources, but also a regulator of the water rights trading market. In addition to participating in initial negotiations over water rights allocation, local governments can also make decisions on water rights trading volume and water intake independently to maximize their own interests.
However, this paper did not consider the variability in water resources demand and supply over years, which will influence the water allocation results. The results calculated in this paper can only be used for water allocation in a given year. Water allocation of the Zhanghe River Basin should be allocated dynamically [36], i.e., should be conducted on the basis of the predicted water supply and demand data according to seasonal variation, social development, and so on. It is necessary to predict these data first, and then use the established model in this paper to carry out the allocation. Integrating complex water demand and supply prediction problems into the model built in this paper will be a potential focus of future research.

Author Contributions

Y.C.: methodology, software, validation, formal analysis, investigation, resources, data curation, writing—original draft preparation, visualization, project administration, funding acquisition; Y.X.: writing—review and editing; J.Z.: supervision. All authors have read and agreed to the published version of the manuscript.

Funding

This research was funded by the National Natural Science Foundation of China (Grant No. 71804042), the Young Teacher Foundation of Education Department of Henan Province (Grant No. 2021GGJS160), and the Program of Philosophy and Social Science of Office of Philosophy and Social Sciences Planning of Henan Province (No. 2022BJJ036).

Data Availability Statement

The data presented in this study are available on request from the corresponding author.

Conflicts of Interest

The authors declare no conflict of interest.

References

  1. Yan, Q.; Zhang, Y.; Wang, Q. Analysis of Demand and Structural Changes in China’s Water Resources over the Next 30 Years. Water 2023, 15, 745. [Google Scholar] [CrossRef]
  2. Roson, R.; Damania, R. The macroeconomic impact of future water scarcity: An assessment of alternative scenarios. J. Policy Model. 2017, 39, 1141–1162. [Google Scholar] [CrossRef]
  3. Wu, N.; Xu, Y.; Kilgour, D.M. Water allocation analysis of the Zhanghe River basin using the Graph Model for Conflict Resolution with incomplete fuzzy preferences. Sustainability 2019, 11, 1099. [Google Scholar] [CrossRef] [Green Version]
  4. Yuan, L.; He, W.; Degefu, D.M.; Wan, Z.; Ramsey, T.S.; Wu, X. A system dynamics simulation model for water conflicts in the Zhanghe River Basin, China. Int. J. Water Resour. Dev. 2021, 6, 1–17. [Google Scholar] [CrossRef]
  5. Wang, J.; Wu, T.; Li, Q.; Wang, S. Quantifying the effect of environmental drivers on water conservation variation in the eastern Loess Plateau, China. Ecol. Indic. 2021, 125, 107493. [Google Scholar] [CrossRef]
  6. Chu, Y.; Hipel, K.W.; Fang, L.; Wang, H. Systems methodology for resolving water conflicts: The Zhanghe River water allocation dispute in China. Int. J. Water Resour. Dev. 2015, 31, 106–119. [Google Scholar] [CrossRef]
  7. Luo, Y.; Sha, J.; Liu, B.; Zhang, Y.; Yang, J. Optimal Allocation of Water Resources Based on GWAS Model in Handan, China. Water 2023, 15, 1090. [Google Scholar] [CrossRef]
  8. Chu, Y. Optimal Water Resource Allocation of the River Basin Considering the Water Body Satisfaction Degree. Resour. Sci. 2018, 40, 8. [Google Scholar] [CrossRef] [Green Version]
  9. Ma, J.; Liu, H.; Wu, W.; Zhang, Y.; Dong, S. Research on Optimal Allocation of Water Resources in Handan City Based on the Refined Water Resource Allocation Model. Water 2023, 15, 154. [Google Scholar] [CrossRef]
  10. Tian, J.; Guo, S.; Liu, D.; Pan, Z.; Hong, X. A Fair Approach for Multi-Objective Water Resources Allocation. Water Resour. Manag. 2019, 33, 3633–3653. [Google Scholar] [CrossRef]
  11. Wang, Z.; Zhang, L.; Cheng, L.; Liu, K.; Wei, Y.M. Basin-Wide Initial Water Rights Allocation Model Considering Both the Quantity and Quality of Water. Environ. Model. Assess. 2020, 25, 581–589. [Google Scholar] [CrossRef]
  12. Ge, M.; Wu, F.P.; You, M. Initial Provincial Water Rights Dynamic Projection Pursuit Allocation Based on the Most Stringent Water Resources Management: A Case Study of Taihu Basin, China. Water 2017, 9, 35. [Google Scholar] [CrossRef] [Green Version]
  13. Delorit, J.D.; Block, P.J. Promoting Competitive Water Resource Use Efficiency at the Water-Market Scale: An Intercooperative Demand Equilibrium-Based Approach to Water Trading. Water Resour. Res. 2018, 54, 5394–5421. [Google Scholar] [CrossRef]
  14. He, Y.; Yang, J.; Chen, X. Allocating river water in a cooperative way: A case study of the Dongjiang River Basin, South China. Stoch. Environ. Res. Risk Assess. 2018, 32, 3083–3097. [Google Scholar] [CrossRef]
  15. Wang, L.; Fang, L.; Hipel, K.W. Basin-wide cooperative water resources allocation. Eur. J. Oper. Res. 2008, 190, 798–817. [Google Scholar] [CrossRef]
  16. Zeng, X.T.; Li, Y.P.; Huang, G.H.; Liu, J. Modeling of Water Resources Allocation and Water Quality Management for Supporting Regional Sustainability under Uncertainty in an Arid Region. Water Resour. Manag. 2017, 31, 3699–3721. [Google Scholar] [CrossRef]
  17. Pienaar, G.W.; Hughes, D.A. Linking Hydrological Uncertainty with Equitable Allocation for Water Resources Decision-Making. Water Resour. Manag. 2017, 31, 269–282. [Google Scholar] [CrossRef]
  18. Zheng, H.; Wang, Z.; Hu, S.; Wei, Y. A Comparative Study of the Performance of Public Water Rights Allocation in China. Water Resour. Manag. 2012, 26, 1107–1123. [Google Scholar] [CrossRef]
  19. Yao, L.; Xu, Z.; Chen, X. Sustainable water allocation strategies under various climate scenarios: A case study in China. J. Hydrol. 2019, 574, 529–543. [Google Scholar] [CrossRef]
  20. Zheng, H.; Liu, Y.; Zhao, J. Understanding water rights and water trading systems in China: A systematic framework. Water Secur. 2021, 13, 100094. [Google Scholar] [CrossRef]
  21. Zhou, Y.; Guo, S.; Xu, C.Y.; Liu, D.; Chen, L.; Wang, D. Integrated optimal allocation model for complex adaptive system of water resources management (II): Case study. J. Hydrol. 2015, 531, 977–991. [Google Scholar] [CrossRef]
  22. Hung, M.F.; Shaw, D.; Chie, B.T. Water Trading: Locational Water Rights, Economic Efficiency, and Third-Party Effect. Water 2014, 6, 723–744. [Google Scholar] [CrossRef] [Green Version]
  23. Yan, S.; Wang, L.; Li, T. An Agricultural Interval Two-Stage Fuzzy Differential Water Price Model (ITS-DWPM) for Initial Water Rights Allocation in Hulin, China. Water 2020, 12, 221. [Google Scholar] [CrossRef] [Green Version]
  24. He, Y.; Chen, X.; Sheng, Z.; Lin, K.; Gui, F. Water allocation under the constraint of total water-use quota: A case from Dongjiang River Basin, South China. Hydrol. Sci. J. 2018, 63, 154–167. [Google Scholar] [CrossRef]
  25. Zhang, J.; Meng, C.; Hu, S.; Li, W. Optimal allocation model for water resources coupled with ecological value factors—A case study of Dalian, China. Water 2022, 14, 266. [Google Scholar] [CrossRef]
  26. Wu, D.; Wu, F. The coupling allocation of initial two-dimensional water rights in basin based on the bi-hierarchy optimal model. China Popul. Resour. Environ. 2012, 22, 26–34. (In Chinese) [Google Scholar] [CrossRef]
  27. Lizhong, W.; Liping, F. WHK Mathematical Programming Approaches for Modeling Water Rights Allocation. J. Water Resour. Plan. Manag. 2007, 133, 50–59. [Google Scholar] [CrossRef]
  28. Congleton, R.D. The Logic of Collective Action and beyond. Public. Choice 2015, 164, 217–234. [Google Scholar] [CrossRef] [Green Version]
  29. Tian, G.L.; Liu, J.N.; Li, X.Y.; Li, Y.Q.; Yin, H. Water rights trading: A new approach to dealing with trans-boundary water conflicts in river basins. Water Policy 2020, 22, 133–152. [Google Scholar] [CrossRef] [Green Version]
  30. Zhang, W.; Mao, H.; Yin, H.; Guo, X. A pricing model for water rights trading between agricultural and industrial water users in China. J. Water Supply Res. Technol. 2018, 67, 347–356. [Google Scholar] [CrossRef]
  31. Zhang, G.Z.; Liu, H.; Jia, D.W. River Basin Management Based on the Mechanisms of Water Rights Trading. Procedia Environ. Sci. 2010, 2, 665–673. [Google Scholar] [CrossRef] [Green Version]
  32. Degefu, D.M.; He, W.; Yuan, L. Monotonic Bargaining Solution for Allocating Critically Scarce Transboundary Water. Water Resour. Manag. 2017, 31, 2627–2644. [Google Scholar] [CrossRef]
  33. Huangg; Loucks, P. An Inexact Two-Stage Stochastic Programming Model for Water Resources Management Under Uncertainty. Civ. Eng. Environ. Syst. 2000, 17, 95–118. [Google Scholar] [CrossRef]
  34. Li, T.; Zeng, X.; Chen, C.; Kong, X.; Zhang, J.; Zhu, Y.; Zhang, F.; Dong, H. Scenario Analysis of Initial Water-Rights Allocation to Improve Regional Water Productivities. Water 2019, 11, 1312. [Google Scholar] [CrossRef] [Green Version]
  35. Wu, X.; He, W.; Yuan, L.; Kong, Y.; Li, R.; Qi, Y.; Yang, D.; Degefu, D.M.; Ramsey, T.S. Two-stage water resources allocation negotiation model for transboundary rivers under scarcity. Front. Environ. Sci. 2022, 10, 900854. [Google Scholar] [CrossRef]
  36. Yuan, L.; He, W.; Liao, Z.; Degefu, D.; An, M.; Zhaofang, Z. Simulating Water Resource Disputes of Transboundary River: A Case Study of the Zhanghe River Basin, China. In IOP Conference Series: Earth and Environmental Science, Proceedings of the 2017 International Conference on Advanced Environmental Engineering (ICAEE2017), Shenzen, China, 15–17 December 2017; IOP Publishing Ltd.: Bristol, UK, 2018; Volume 111, p. 12001. [Google Scholar] [CrossRef] [Green Version]
Figure 1. Optimization framework of bilevel water resource allocation of river basins.
Water 15 02650 g001
Figure 2. The algorithm of the bilevel optimization model based on the response surface method.
Water 15 02650 g002
Figure 3. The Qingzhang River Basin in China.
Water 15 02650 g003
Table 1. Water supply and agricultural and industrial water consumption in the Qingzhang River Basin in a given year.
SubregionTotal Water Supply (108 m3)Current Water Consumption
(108 m3)
Irrigated Area
(104 mu)
Agricultural Water Quota
(m3/mu)
Industrial Water Quota
(m3/104 CNY)
Total Water Demand
(108 m3)
Qingzhang in Shanxi0.500.5014.6930073.80.52
Qingzhang in Hebei1.181.1718.5548431.20
Table 2. Domestic water consumption in the Qingzhang River Basin in a given year.
SubregionUrban Population (Hundred Million)Urban Water
Use Quota
(L/Person-Day)
Rural Population (Hundred Million)Rural Water
Use Quota
(L/Person-Day)
Large Livestock (Hundred Million)Small livestock (Hundred Million)Water for
Large Livestock (L/Person-Day)
Water for
Small Livestock
(L/Person-Day)
Qingzhang in Shanxi9.12121.2729.7856.588.4171.993515
Qingzhang in Hebei10.1214235.46455.2641.233515
Table 3. The results for initial water rights allocation, only considering satisfaction degree in the Qingzhang River Basin, in a given year.
ProvincesWater Demand
(Million m3)
Initial
Water Distribution
(Million m3)
Water Shortage RateSatisfaction Degrees of Water UsersDecision WeightEconomic Benefit
(Hundred Million CNY)
Shanxi36.6034.360.060.880.3539.17
Hebei106.33103.430.020.950.65240.99
Table 4. The results for the bilevel optimal water allocation of the Qingzhang River Basin in a given year.
ProvincesWater Demand
(Million m3)
Initial Water Distribution
(Million m3)
Water Intake
(Million m3)
Water Resource Fee
(CNY)
Trading Benchmark Price(CNY)Satisfaction of Water UsersDecision WeightPre-transaction Benefit
(Hundred Million CNY)
Post-transaction Benefit
(Hundred Million CNY)
Shanxi36.6034.5834.030.540.750.890.3539.2350.24
Hebei106.33103.21103.760.540.750.940.65239.92289.53
Disclaimer/Publisher’s Note: The statements, opinions and data contained in all publications are solely those of the individual author(s) and contributor(s) and not of MDPI and/or the editor(s). MDPI and/or the editor(s) disclaim responsibility for any injury to people or property resulting from any ideas, methods, instructions or products referred to in the content.

