
Exceeding Turbidity versus Karst Spring Discharge during Single Rainfall Events: The Case of the Jadro Spring

Faculty of Civil Engineering, Architecture and Geodesy, University of Split, 21000 Split, Croatia
*
Author to whom correspondence should be addressed.
Water 2023, 15(14), 2589; https://doi.org/10.3390/w15142589
Submission received: 5 June 2023
/
Revised: 7 July 2023
/
Accepted: 14 July 2023
/
Published: 16 July 2023
(This article belongs to the Section Hydrology)
Abstract
:The relationship between karst spring discharge and turbidity during periods where the turbidity exceeds the permitted value of 4 NTU is analyzed by means of classical hydrological methods including hysteresis loops. The Williams method (1989) is adjusted by replacing river discharge with karst spring discharge, and sediment concentration with exceeding turbidity. The study’s first part focuses on the general hydrological characteristics of cumulative rainfall, turbidity, and discharge during each period. In the second part, four major types of hysteresis loops are identified, classified, and hydrologically explained. The study area is the karst catchment of the Jadro Spring in Croatia. The obtained results show that hysteresis loops can be very useful in analyses of water turbidity from karst springs. A relationship between the type of loop, intensity of discharge, and size of the secondary peak in turbidity is identified. The major types of hysteresis loops were clockwise, counterclockwise, figure-eight and complex loops, and their main characteristics were summarized. The results gave a new insight into the behavior of the turbidity of the Jadro Spring.
1. Introduction
Karst aquifers are valuable drinking water resources that fully or partially supply as much as 25% of the world’s population [1]. Karst areas are predominant in the mountainous and Adriatic area on the territory of the Republic of Croatia and mainly belong to the geological structure of the Dinarides [2,3]. More than half of the territory of the Republic of Croatia belongs to the Dinarides [3]. It is an area rich in precipitation and underground aquifers from which drinking water is supplied to numerous cities. Hydrogeological and hydrological characteristics of karst aquifers are significantly different from characteristics of other hydrogeological environments such as fractured and granular aquifers [4,5,6,7]. Underground structures of pores, fissures, fractures, and conduits of various sizes cause a high degree of heterogeneity, anisotropy, complex hydraulic conditions, and temporal variability of the hydraulic parameters [8,9]. Due to their specific hydrogeological properties, karst aquifers are sometimes difficult to exploit and they are always susceptible to pollution. Karst aquifers show a rapid response to hydrological phenomena such as rain and snowmelt, so the water level in karst aquifers can sometimes vary more than 100 m in just a few hours [6]. The consequences of such behavior are rapid variations in discharge and drinking water quality at karst springs.
Changes in drinking water quality at karst springs often become evident soon after a rainfall event [10]. For a better understanding of these changes, it is crucial to understand and interpret the catchment transport pathways activated during rainfall events. Conclusions about transport processes in aquifers can be obtained by knowing the type of relationship between discharge and water quality indicators [11,12]. The relationships between discharge and water quality indicators often exhibit a looping trajectory known as a hysteresis loop [11,13]. Williams [13] established the five most common classes of hysteresis loops with appropriate explanations. They are single-valued, clockwise, counterclockwise, single-valued line plus loop, and figure-eight loop. They are obtained by analyzing relations between sediment concentration (Cw) and discharge (Qw) during single flood events in rivers, where the temporal graphs Qw − t and Cw − t are compared with the hysteresis loops Cw − Qw. The single-valued line (Class I) is described as the simplest relation, where a functional relationship between Cw and Qw exists (for each Qw there is a unique value of Cw). The clockwise loop (Class II) is the most common type of hysteresis loop. There are two most probable causes of a clockwise loop. The first is a rapid depletion of available sediment before the maximum water discharge is reached. The second is that an armored layer formation occurred before the maximum water discharge is reached. The most common, clockwise loop is formed when sediment concentration peaks before water discharge. However, clockwise loops can occur also when sediment concentration and discharge peak simultaneously. Counterclockwise loops (Class III) are formed mainly from three possible causes. The first possible cause is the difference between the transit times of water and suspended sediment. Flood wave velocity is somewhat faster than the velocity that carries the suspended sediment. The second possible cause is high soil erodibility combined with prolonged erosion during the flood event. The third possible cause of counterclockwise loops is the seasonal variability of rainfall and sediment concentration. The consequence of these possible causes is that the sediment concentration lags water discharge. Also, as clockwise loops, counterclockwise loops can occur even when sediment concentration and discharge peak simultaneously. The single-valued line plus loop (Class IV) is defined as a combination of Class I, and Class II or Class III because of changes in relations during a flood event due to available sediment, sediment transport, and storage. The figure-eight loop (Class V) is a combination of Class II and III with a clockwise loop at high flows and a counterclockwise loop at low flows. It is not always possible to easily define the class of a hysteresis loop [11,14], and hysteresis loops of the same class can sometimes appear for several reasons [11]. The first three classes are most common regardless of whether the analyzed resource is a karst spring or a river [11,14,15,16,17,18,19,20,21,22,23,24,25,26]. Class V has a rare occurrence [12,16,27,28,29]. A combination of classes or complex hysteresis loops occurs mostly during extended periods of high rainfall [16,17,18,28,29,30]. Williams’ method [13] served as a basis for the following research on hysteresis between discharge and suspended sediment or dissolved solids.
Turbidity (Tk), as an important and easy-to-measure indicator of water quality in karst springs [31], usually has been analyzed parallel with rainfall and karst spring discharge [32,33,34,35,36,37,38]. However, only a few studies have adopted the method of Williams [13]. These studies extended the application of this method by replacing Cw with Tk, as well as by using other water-quality parameters. For example, hysteresis loops between turbidity and electrical conductivity (EC − Tk) have been used for distinguishing transport processes in a karst network [20,21]. Normalized EC − Tk relations have been used for identifying transport modalities in karst aquifers by comparing univariate clustering results [22]. Normalized EC − Tk − Qw graphs have been used for comparing the relations between EC, Tk, and Qw and to highlight the particles’ transport in the karst network [23]. Relations between EC and Tk have also been investigated to obtain information about hydro-sedimentary processes and contamination sources in a karst spring [10].
The subject of interest of this study is the turbidity of water from the Jadro Spring, located near the city of Split in the Republic of Croatia. The main objective was an extension of the existing knowledge about the turbidity mechanism in karst by using hysteresis loops. The study deals with the events during which turbidity exceeded the permitted standard of drinking water of 4 NTU. The first part of the study is focused on the general description of these events, such as general characteristics of cumulative rainfall, turbidity, and discharge. In the second part, using a similarity between the turbidity mechanism in rivers and the turbidity mechanism in karst aquifers, the method of Williams [13] is adjusted by replacing river discharge with karst spring discharge and sediment concentration with exceeding turbidity. The adjusted method is applied to the time series observed during the events. Major types of hysteresis loops between exceeding turbidity and karst spring discharge are identified, classified, and hydrologically explained.
2. Materials and Methods
Since Roman times, the Jadro Spring has been used for the water supply of surrounding settlements (Figure 1). Information about water supply projects from ancient times to the present day can be found in [39]. However, continuous hourly measurements of turbidity were only established in 2017. The lack of data on water turbidity has resulted in an insufficient number of publications on this subject. The existing studies that dealt with this topic analyzed the relationship between turbidity, rainfall, and discharge, and they show that turbidity depends on discharge, and it often exceeds the permitted standard of drinking water [39,40,41,42]. The existing hypothesis is that the origin of turbidity is predominantly the remobilized autochthonous sediment from aquifer, with a possible limited contribution of allochthonous sediment from the part of the catchment located in the vicinity of the spring [43]. A proposal for a technical solution to this problem can be found in [10]. Detailed hydrogeological and hydrological information about the Jadro Spring has been published in several publications, e.g., [44,45,46,47]. Below is a summary of previously published information relevant to this study.
The Jadro Spring is a karst spring with rapid and large flow oscillations. The study covers the analysis period from 2017 to 2020. For the analyzed period the minimum discharge values do not go below 3.45 m3/s during summer, and the maximum discharge of 61.23 m3/s was observed in the winter of 2020. Due to the underground and still insufficiently known connections, the Jadro Spring catchment is often considered together with the catchment of the Žrnovnica Spring, including the area connected to the Cetina River basin [42]. The catchment is situated in the Dinaric karst at altitudes between 261 and 1339 m a.s.l. The Jadro Spring emerges at the elevation of 35 m a.s.l. The catchment of the Jadro and Žrnovnica springs is a typical catchment with karst morphological characteristics, and complex hydrogeological and hydrological runoff conditions, where the hydrological delineation of the catchment is not reliably defined and described [48,49,50]. According to previous research [51], the catchment area is estimated to be between 250 and 500 km2. The northern boundary represents a hydrogeological barrier located north of Mućko polje. Tracing in the Jablan ponor obtained that the apparent groundwater flow velocity between the Jablan ponor and the Jadro Spring was 10.6 cm/s. The western boundary represents only a hypothetical boundary because its determination is based on less important hydrogeological indicators. Tracing the Postinje ponor showed that the western part of Mućko polje is shared with the catchment of the Mandrača and Ribnik springs. The apparent groundwater flow velocity between the Postinje ponor and the Jadro Spring was 0.55 cm/s. The southern boundary is a coastal barrier created by the contact between the hinterland’s permeable rocks and the coastal region’s impermeable rocks. The Jadro and Žrnovnica springs are in the lowest part of this contact area. The eastern boundary of the catchment is located near the Cetina River, which flows through the carbonate formation at altitudes above 300 m a.s.l. Tracing the Grabov Mlin ponor confirmed a direct underground connection between the riverbed of the Cetina River and the Jadro Spring. About 95.8% of the injected tracer appeared at the spring, where the apparent groundwater flow velocity was estimated to be 0.8 cm/s. The tracer test of the Bazin ponor, situated in the Bisko Polje, obtained that the water from this area is also mostly drained by the Jadro Spring. About 76.3% of the injected tracer was recovered at the Jadro Spring, with an apparent groundwater flow velocity of 6.7 cm/s. The Adriatic type of Mediterranean climate with mild, rainy winters, and dry summers prevails within the catchment [52].
Available data for this study were hourly time series of discharge and turbidity from the Jadro Spring, and daily rainfall observed at the meteorological station, Dugopolje. They cover the period from 2017 to 2020. For the analyzed period, the mean discharge from the Jadro Spring was 9.03 m3/s. Minimum values did not go below 3.45 m3/s during summer. The maximum discharge of 61.23 m3/s was observed on 4 December 2020. Annual rainfall at the Dugopolje station ranges between 1109 and 1494 mm. The average is about 1312 mm. Graphical presentations of the analyzed time series are in Figure 2, and the general statistical characteristics are presented in Table 1. The discharge and rainfall data were provided by the Croatian Meteorological and Hydrological Service (Zagreb, Croatia), and the turbidity data were provided by Water supply and sanitation d.o.o. Split (Split, Croatia). The analyzed periods refer to rainfall events during which turbidity exceeded the permitted standard for drinking water of 4 NTU. Cumulative rainfall, turbidity, and discharge are monitored from the beginning of rainfall events to the moment when turbidity returns below 4 NTU. A total of 20 rainfall events with exceeding turbidity were registered during the study period, so 20 corresponding subseries of cumulative rainfall (Pc), spring discharge (Q), and exceeding turbidity (Te) were formed. Each subseries is considered as a single event which is analyzed separately. A general description of these subseries is represented by three groups of hydrological variables, which are summarized in Table 2. These variables describe the hydrological conditions preceding turbidity exceedance, and the event of turbidity exceedance. For each subseries, classical hydrological analyses were performed including analysis of hydrograph, graph of turbidity, and Te − Q hysteresis loops. To focus the analysis on the most relevant segments, the hysteresis loops are monitored only for the values of turbidity that exceeded the permitted standard of drinking water.
3. Results
General characteristics of analyzed events are presented in Table 3 (year 2017), Table 4 (year 2018), Table 5 (year 2019), and Table 6 (year 2020). Eight rainfall events produced exceeding turbidity in winter (January to March), eleven in fall (October to December), and only one in spring (April). Concerning variables that describe the hydrological conditions before turbidity exceedance, it can be noted that the duration of rainfall events before turbidity exceedance, tbTe, varied between 19 and 526 h. Event 5 was the event with the shortest value, and event 16 was with the longest. It should be noted that event 16 consists of three sub-events. Consequently, both values, tbTe of 526 h, as well as the value of cumulative rainfall before turbidity exceedance, PcTe of 356.20 mm, were the highest values during the entire analyzed period. Minimum cumulative rainfall that produced turbidity exceedance, PcTe of 33.38 mm, appeared during event 6. Both the minimum and maximum values of rainfall intensity before turbidity exceedance, ibTe, appeared in 2017. The minimum of 0.38 mm/h appeared during event 2, and the maximum of 3.16 mm/h appeared during event 5. The minimum value of peak discharge that produced turbidity exceedance, Qemax of 16.70 m3/s, appeared during event 4.
Concerning variables that describe the event of turbidity exceedance, it can be noted that the duration of turbidity exceedance, te, varied between 4 and 205 h. The event with the longest duration, te of 205 h, started on 3 December 2020 (event 20). During this event, the maximum in turbidity Temax of 62.45 NTU and the maximum in discharge Qemax of 61.23 m3/s appeared, which are the highest values for the entire analyzed period. The time from the start of the rainfall event to the maximum turbidity, tbTemax, is generally very similar to the time from the start of the rainfall event to the maximum discharge, tbQemax. In most events, the time difference between tbTemax and tbQemax is from 0 to 10 h. The rainfall event with the longest time difference of 71 h is event 15 (tbTemax of 30 h, tbQemax of 101 h). This event is the only one that occurred during spring. The second is event 11 with a time difference of 31 h (tbTemax of 81 h, tbQemax of 50 h).
Graphical presentations of time series of turbidity, discharge, and cumulative rainfall for each event are presented in Figure 3a–e (events 1–5), Figure 4a–h (events 6–13), Figure 5a–e (events 14–20), and Figure 6a–b (events 19–20). The obtained Te − Q hysteresis loops are presented in Figure 3a1–e1 (events 1–5), Figure 4a1–h1 (events 6–13), Figure 5a1–e1 (events 14–20), and Figure 6a1–b1 (events 19–20). It is noticeable that most events are characterized by the occurrence of two or more peaks in turbidity. Generally, increases and decreases in turbidity including primary peaks mainly follow increases and decreases in discharge, but there are also secondary peaks in turbidity that are not supported by peaks in discharge (events 2, 3, 5, 10, 11, 12, 14, 15, 16, 17, 19, and 20). Increases in cumulative rainfall are not always followed by increases in discharge. There are episodes of rainfall at the beginning of rainfall events that are accumulated in soil and epikarst zone, or spent on evapotranspiration, so they do not affect significantly discharge and turbidity. Whence the water capacity of soil and epikarst zone is fulfilled, discharge and turbidity follow cumulative rainfall and they rise continuously to maximum values. The exceptions are events 11 and 15. In event 11, although the cumulative rainfall was constant after the first turbidity peak, turbidity reached its maximum in the second peak after 33 h. Event 15 is characterized by the appearance of two significant turbidity peaks but, unlike in other events, both peaks appear much before the peak in discharge.
An overview of all hysteresis loop types obtained for the analyzed events is presented in Table 7, where ΔTemax,Qemax represents the time difference between tbTemax and tbQemax so it has a sign depending on whether Qemax is reached first or not. Seven events had a clockwise hysteresis loop: 1, 4, 7, the first sub-event of event 13, 15, and the third sub-event of event 16. In event 15, exceeding turbidity Te peaks evidently before discharge Q (the time difference between their peaks ΔTemax,Qemax is −71 h). Event 15 also has a high value of maximum turbidity Temax of about 37 NTU, and a long duration of turbidity exceedance te of 147 h. In the remaining six events, Te and Q have rather simultaneous peaks (ΔTemax,Qemax is between −4 and 5 h). The clockwise loops of these six events are characterized by a low value of Temax (about 5 NTU), a short duration of te (from 4 to maximum 16 h), and the value of maximum in discharge Qemax below 31 m3/s.
Four events had a counterclockwise hysteresis loop: 3, 6, 9, and the second sub-event of event 13. The duration of te varies from 8 to 113 h. The value of Temax is below 9 NTU in all events except event 3, where Temax is about 29 NTU. The value of Qemax ranges between 25 and 40 m3/s. The time difference between peaks ΔTemax,Qemax is very small, 1 or 2 h.
Figure-eight hysteresis loops appeared in seven events: 5, 11, 12, 14, the second sub-event of event 16, 17, and 19. All events had a large secondary peak. Also, in all events, the clockwise loop showed up first at high discharge values, and then the counterclockwise loop was formed at a lower discharge. The duration of te varies between 55 and 126 h. The value of Temax is between 9 and 33 NTU. The time difference between peaks ΔTemax,Qemax is between −4 and 4 h., except in event 11 where Te peaks 31 h before Q because the second peak is primary. The value of Qemax ranges between 25 and 47 m3/s.
Complex hysteresis loops showed up in six events: 2, 8, 10, the first sub-event of 16, 18, and 20. They all have several peaks in Te and Q, where the time difference between peaks ΔTemax,Qemax has a larger range of values than other loops, between −10 and 8 h. The duration of te is long, from 90 to 205 h. The value of Temax is high, between 13 and 61 NTU. The value of Qemax is also high, including all values above 47 m3/s.
4. Discussion
Jadro is a karst spring with rapid flow oscillations and belongs to the group of karst-fissure waters that are susceptible to turbidity [39,41]. This study shows that the water turbidity of the Jadro Spring is seasonal and that the highest values are most often observed in the period from September to March, which is in accordance with previous studies [40,42] using daily turbidity, precipitation, and discharge data.
Generally, the temporal variations in turbidity are mainly related to temporal variations in discharge. Turbidity has two peaks. The first peak, usually the primary peak, is simultaneous with the peak in discharge. This behavior can be explained by the entrainment of autochthonous sediment from the aquifer [36,53]. The second peak is usually smaller, and it arrives during the period of recession in discharge, which shows that a significant quantity of sediment comes to the spring later, with a time delay.
However, there are exceptions—events 11 and 15. In event 15, the primary and secondary peak appeared before the peak in discharge. The near-constant discharge well under 10 m3/s during turbidity exceedance shows that turbidity and discharge are not related, which means that the turbidity generated during this event is a direct consequence of rainfall. Higher values of turbidity in event 15 can be explained by a ˝washing effect˝, which is a typical behavior of turbidity generated by allochthonous sediment. The appearance of a ˝washing effect˝ generated by allochthonous sediment can be explained by particles originating from the land surface [31], and a possibility that these particles got into the karst subsoil from a part of the catchment located close to the spring because it is registered shortly after the beginning of the rainfall. In event 11, the second peak was higher than the first peak. During this event, the increase in turbidity followed the increase in discharge and cumulative rainfall until the appearance of the first peak, and after 33 h without any rainfall, the second peak in turbidity appeared during the recession in discharge. These results indicate that the turbidity of water from the Jadro Spring is generated by the sediment from several relatively separate conduit systems which transport water from different parts of the catchment, so the second peak in turbidity represents distant parts of the catchment from where sediment comes to the spring with a time delay.
Hysteresis loops generally enable insight into the development of one physical variable about another [13,54]. They are often used to describe the relations between sediment concentration and discharge during single flood events for rivers, and to provide possible explanations for their occurrence [13]. In this study, the method has been slightly adjusted by replacing Cw − Qw with Te − Q hysteresis loops. Four major types of Te − Q hysteresis loops were identified and explained. A single-valued line was not present.
Clockwise hysteresis loops are the most common hysteresis loops reported in previous studies, and they indicate a rapid connection between the stream and a source [13,25,28,29,55,56]. In this study, they are associated with lower values of turbidity and discharge, as well as shorter duration of turbidity exceedance. Six of seven clockwise loops were observed during fall and winter. For all six loops, turbidity and discharge were peaking almost simultaneously. The only event observed during spring is event 15 where turbidity peaks almost 3 days before discharge. Event 15, generated in spring, produced a higher value of Temax and a longer te duration than clockwise loops generated in fall/winter, which can be explained as the result of an accumulation of deposited sediment between two rainfall events [30].
Counterclockwise hysteresis loops have been generally related to sediment sources located distantly from the measurement location [55,56,57]. In this study, none of the four counterclockwise loops show a typical form since turbidity and discharge reach their peaks almost simultaneously. Counterclockwise loops are associated with values of turbidity slightly higher than clockwise loops, and variable duration of turbidity exceedance.
Figure-eight hysteresis loops were rarely reported [13,17,27,28,29,30,58], especially in karst [55,56,57]. The phenomenon of figure-eight hysteresis loops can be caused by mechanisms that initiate clockwise or counterclockwise hysteresis loops [59]. In this study, figure-eight hysteresis loops appeared seven times, and they consisted of clockwise and counterclockwise loops. The clockwise loops showed up at higher discharge values, and then the counterclockwise loops at lower values, exactly as described in [13]. It was also pointed out in previous studies that events with figure-eight loops have longer duration [17,29,59], and that figure-eight loops can be explained as complex responses related to multiple peaks during rainfall events [58]. In this study, all events with a figure-eight loop have a large secondary peak in turbidity. Primary peaks in turbidity are synchronized with peaks in discharge almost completely in all events, except in event 11 where the second peak is primary. The obtained figure-eight loops generally had a longer duration of turbidity exceedance than counterclockwise loops, and higher turbidity, but differences were not large.
Complex hysteresis loops comprised two or more types of loops, i.e., different hysteresis loops coexisted in the same rainfall event, so they are very difficult to summarize because of their complexity [29,55]. However, it was noted that they are related to high values of discharge, high values of turbidity, and long duration of turbidity exceedance. Because of spatial and temporal variability of groundwater levels during these rainfall events, which additionally complicates the dynamic of sediment transport, peaks in turbidity are less synchronized with peaks in discharge.
Generally, the results of analyses of hysteresis loops between exceeding turbidity and discharge show that a clear relationship between the type of loop, the intensity of discharge, and the size of the secondary peak in turbidity exists. Clockwise loops are observed during the events with discharge below 32 m3/s. The form of these loops exhibits a typical behavior of autochthonous sediment in karst spring water: (1) Intensive entrainment of sediment occurs during the rise in discharge, so turbidity increases rapidly, (2) Turbidity and discharge reach their peaks simultaneously, (3) Turbidity decreases faster than discharge after the peak due to recession in discharge and process of sedimentation. If they exist, the secondary peaks are small or below 4 NTU, so they do not affect the form of clockwise loops. Counterclockwise and figure-eight hysteresis loops are observed during the events with discharge ranging from 25 to 47 m3/s. At these discharges, a secondary peak is evident in all events. However, the figure-eight loop is obtained for rainfall events with the size of the secondary peak in turbidity like the primary peak. It is evident that with discharge increasing, the clockwise form of the loop is turned to counterclockwise, and the rise in the secondary peak in turbidity deforms the loop completely to the figure-eight form. The secondary peak is generated by the sediment from distant parts of the catchment that comes to the spring with a time delay; therefore, a figure-eight loop indicates a domination of that sediment in spring water, whereas a counterclockwise loop indicates a domination of the sediment from the vicinity of spring. The spatial distribution of rainfall has an important role in the generation of turbidity. Local storm events in the vicinity of spring may produce a quick turbidity response during low discharges (event 15). On the other hand, a more intensive rainfall in a distant part of the catchment may produce a situation where the second peak is higher (event 11). Complex hysteresis loops are observed during all rainfall events with discharge above 47 m3/s. These events include the longest periods with several peaks in discharge and turbidity, where each peak demonstrates different behavior, so a combination of several types of loops may be present. During these events, the two highest discharges were observed, which produced the two highest turbidities.
5. Conclusions
The relationship between karst spring discharge and turbidity during rainfall events where the turbidity exceeded the permitted standard of drinking water, was analyzed by means of classical hydrological methods including analyses of hydrographs, graphs of turbidity, and hysteresis loops. The method introduced by Williams [13] is adjusted by replacing the river discharge with the karst spring discharge and the sediment concentration with the exceeding turbidity. The form of loops is analyzed only for the values of turbidity that exceeded the permitted standard of drinking water, i.e., only segments of loops above 4 NTU are the subject of interest. Four major types of hysteresis loops are identified and explained: clockwise, counterclockwise, figure-eight, and complex loops. The presented results show that a relationship between the type of loop, the intensity of discharge, and the size of the secondary peak in turbidity exists. Clockwise loops are observed during events with lower discharge. Counterclockwise and figure-eight loops are observed during events with a middle-range discharge, whereas complex loops are observed during events with higher discharge. A clockwise or counterclockwise loop indicates that turbidity is predominantly generated by the sediment from the vicinity of the spring. Figure-eight loops generally had a longer duration of turbidity exceedance and higher turbidity values. Complex loops were related to high values of discharge (>47 m3/s), high values of turbidity, and long duration of turbidity exceedance.
The obtained results show that the hysteresis loop between exceeding turbidity and discharge can be very useful in analyses of water turbidity from karst springs. They confirmed the existing hypothesis about the turbidity mechanism of the Jadro Spring [43]. Turbidity is generated by sediment from several relatively separate conduit systems that transport water to the spring with different time delays. The origin of turbidity is dominantly the remobilized autochthonous sediment from the aquifer, and a limited quantity of allochthonous sediment from the land surface [31], with a possibility that this sediment got into the karst subsoil from a part of the catchment located close to the spring. It means that turbidity may demonstrate complex and unexpected behavior during local storm events.
Author Contributions
Conceptualization, A.K.; methodology, A.K.; software, A.K.; validation, D.J. and V.D.-J.; formal analysis, A.K. and D.J.; investigation, A.K. and D.J.; resources, A.K, D.J. and V.D.-J.; data curation, A.K. and V.D.-J.; writing—original draft preparation, A.K.; writing—review and editing, D.J.; visualization, A.K.; supervision, D.J. and V.D.-J. All authors have read and agreed to the published version of the manuscript.
Funding
This research is partially supported through project KK.01.1.1.02.0027, a project co-financed by the Croatian Government and the European Union through the European Regional Development Fund—the Competitiveness and Cohesion Operational Program.
Data Availability Statement
3rd Party Data.
Conflicts of Interest
The authors declare no conflict of interest.
References
- Iacurto, S.; Grelle, G.; De Filippi, F.M.; Sappa, G. Karst recharge areas identified by combined application of isotopes and hydrogeological budget. Water 2021, 13, 1965. [Google Scholar] [CrossRef]
- Biondić, B.; Biondić, R.; Dukarić, F. Protection of karst aquifers in the Dinarides in Croatia. Environ. Geol. 1998, 34, 309–319. [Google Scholar] [CrossRef]
- Terzić, J.; Stroj, A.; Frangen, T. Hydrogeological investigation of karst system properties by common use of diverse methods: A case study of Lička Jesenica springs in Dinaric karst of Croatia. Hydrol. Process. 2012, 26, 3302–3311. [Google Scholar] [CrossRef]
- Bonacci, O. Karst Hydrology: With Special Reference to the Dinaric Karst; Springer: Berlin/Heidelberg, Germany, 1987. [Google Scholar]
- Bakalowicz, M. Karst groundwater: A challenge for new resources. Hydrogeol. J. 2005, 13, 148–160. [Google Scholar] [CrossRef]
- Goldscheider, N.; Drew, D. Methods in Karst Hydrogeology, 1st ed.; Taylor & Francis Group: Leiden, The Netherlands, 2007. [Google Scholar] [CrossRef]
- Labat, D.; Argouze, R.; Mazzilli, N.; Ollivier, C.; Sivelle, V. Impact of Withdrawals on Karst Watershed Water Supply. Water 2022, 14, 1339. [Google Scholar] [CrossRef]
- Labat, D.; Ababou, R.; Mangin, A. Introduction of wavelet analyses to rainfall/runoffs relationship for a karstic basin: The case of Licq-Atherey karstic system (France). Groundwater 2001, 39, 605–615. [Google Scholar] [CrossRef]
- Labat, D.; Sivakumar, B.; Mangin, A. Evidence for deterministic chaos in long-term high-resolution karstic streamflow time series. Stoch. Environ. Res. Risk Assess. 2016, 30, 2189–2196. [Google Scholar] [CrossRef]
- Schiperski, F.; Zirlewagen, J.; Hillebrand, O.; Nödler, K.; Licha, T.; Scheytt, T. Relationship between organic micropollutants and hydro-sedimentary processes at a karst spring in south-west Germany. Sci. Total Environ. 2015, 532, 360–367. [Google Scholar] [CrossRef] [PubMed]
- Lloyd, C.E.M.; Freer, J.E.; Johnes, P.J.; Collins, A.L. Using hysteresis analysis of high-resolution water quality monitoring data, including uncertainty, to infer controls on nutrient and sediment transfer in catchments. Sci. Total Environ. 2016, 543, 388–404. [Google Scholar] [CrossRef] [Green Version]
- Qin, C.; Li, S.-L.; Waldron, S.; Yue, F.-J.; Wang, Z.-J.; Zhong, J.; Ding, H.; Liu, C.-Q. High-frequency monitoring reveals how hydrochemistry and dissolved carbon respond to rainstorms at a karstic critical zone, Southwestern China. Sci. Total Environ. 2020, 714, 136833. [Google Scholar] [CrossRef]
- Williams, G.P. Sediment concentration versus water discharge during single hydrologic events in river. J. Hydrol. 1989, 111, 89–106. [Google Scholar] [CrossRef]
- Orwin, J.F.; Smart, C.C. The evidence for paraglacial sedimentation and its temporal scale in the deglacierizing basin of Small River Glacier, Canada. Geomorphology 2004, 58, 175–202. [Google Scholar] [CrossRef]
- Hudson, P.F. Event sequence and sediment exhaustion in the lower Panuco Basin, Mexico. CATENA 2003, 52, 57–76. [Google Scholar] [CrossRef]
- Fang, N.F.; Shi, Z.H.; Chen, F.X.; Zhang, H.Y.; Wang, Y.X. Discharge and suspended sediment patterns in a small mountainous watershed with widely distributed rock fragments. J. Hydrol. 2015, 528, 238–248. [Google Scholar] [CrossRef]
- Hu, J.; Gao, P.; Mu, X.; Zhao, G.; Sun, W.; Li, P.; Zhang, L. Runoff-sediment dynamics under different flood patterns in a Loess Plateau catchment, China. CATENA 2019, 173, 234–245. [Google Scholar] [CrossRef]
- Fortesa, J.; Latron, J.; García-Comendador, J.; Company, J.; Estrany, J. Runoff and soil moisture as driving factors in suspended sediment transport of a small mid-mountain Mediterranean catchment. Geomorphology 2020, 368, 107349. [Google Scholar] [CrossRef]
- Fortesa, J.; Ricci, G.F.; García-Comendador, J.; Gentile, F.; Estrany, J.; Sauquet, E.; Datry, T.; De Girolamo, A.M. Analysing hydrological and sediment transport regime in two Mediterranean intermittent rivers. CATENA 2021, 196, 104865. [Google Scholar] [CrossRef]
- Valdes, D.; Dupont, J.-P.; Massei, N.; Laignel, B.; Rodet, J. Analysis of karst hydrodynamics through comparison of dissolved and suspended solids’ transport. Comptes Rendus Geosci. 2005, 337, 1365–1374. [Google Scholar] [CrossRef]
- Valdes, D.; Dupont, J.-P.; Massei, N.; Laignel, B.; Rodet, J. Investigation of karst hydrodynamics and organization using autocorrelations and T–ΔC curves. J. Hydrol. 2006, 329, 432–443. [Google Scholar] [CrossRef]
- Fournier, M.; Massei, N.; Bakalowicz, M.; Dupont, J.-P. Use of univariate clustering to identify transport modalities in karst aquifers. Comptes Rendus Geosci. 2007, 339, 622–631. [Google Scholar] [CrossRef]
- Fournier, M.; Massei, N.; Bakalowicz, M.; Dussart-Baptista, L.; Rodet, J.; Dupont, J.P. Using turbidity dynamics and geochemical variability as a tool for understanding the behavior and vulnerability of a karst aquifer. Hydrogeol. J. 2007, 15, 689–704. [Google Scholar] [CrossRef]
- Aubert, A.H.; Gascuel-Odoux, C.; Merot, P. Annual hysteresis of water quality: A method to analyse the effect of intra- and inter-annual climatic conditions. J. Hydrol. 2013, 478, 29–39. [Google Scholar] [CrossRef]
- Dupas, R.; Gascuel-Odoux, C.; Gilliet, N.; Grimaldi, C.; Gruau, G. Distinct export dynamics for dissolved and particulate phosphorus reveal independent transport mechanisms in an arable headwater catchment. Hydrol. Process. 2015, 29, 3162–3178. [Google Scholar] [CrossRef]
- Serra, T.; Soler, M.; Barcelona, A.; Colomer, J. Suspended sediment transport and deposition in sediment-replenished artificial floods in Mediterranean rivers. J. Hydrol. 2022, 609, 127756. [Google Scholar] [CrossRef]
- Seeger, M.; Errea, M.-P.; Beguería, S.; Arnáez, J.; Martí, C.; García-Ruiz, J.M. Catchment soil moisture and rainfall characteristics as determinant factors for discharge/suspended sediment hysteretic loops in a small headwater catchment in the Spanish Pyrenees. J. Hydrol. 2004, 288, 299–311. [Google Scholar] [CrossRef] [Green Version]
- Oeurng, C.; Sauvage, S.; Sánchez-Pérez, J.-M. Dynamics of suspended sediment transport and yield in a large agricultural catchment, southwest France. Earth Surf. Process. Landf. 2010, 35, 1289–1301. [Google Scholar] [CrossRef] [Green Version]
- Fang, N.F.; Shi, Z.H.; Li, L.; Jiang, C. Rainfall, runoff, and suspended sediment delivery relationships in a small agricultural watershed of the Three Gorges area, China. Geomorphology 2011, 135, 158–166. [Google Scholar] [CrossRef]
- Dominic, J.A.; Aris, A.Z.; Sulaiman, W.N.A. Factors Controlling the Suspended Sediment Yield During Rainfall Events of Dry and Wet Weather Conditions in A Tropical Urban Catchment. Water Resour. Manag. 2015, 29, 4519–4538. [Google Scholar] [CrossRef]
- Schiperski, F. Turbidity as an indicator of contamination in karst springs: A short review. In Karst Groundwater Contamination and Public Health; White, W., Herman, J., Herman, E., Rutigliano, M., Eds.; Advances in Karst Science; Springer: Cham, Switzerland, 2018. [Google Scholar] [CrossRef]
- Mahler, B.J.; Lynch, F.L. Muddy waters: Temporal variation in sediment discharging from a karst spring. J. Hydrol. 1999, 214, 165–178. [Google Scholar] [CrossRef] [Green Version]
- Bouchaou, L.; Mangin, A.; Chauve, P. Turbidity mechanism of water from a karstic spring: Example of the Ain Asserdoune spring (Beni Mellal Atlas, Morocco). J. Hydrol. 2002, 265, 34–42. [Google Scholar] [CrossRef]
- Amraoui, F.; Razack, M.; Bouchaou, L. Turbidity dynamics in karstic systems. Example of Ribaa and Bittit springs in the Middle Atlas (Morocco). Hydrol. Sci. J. 2003, 48, 971–984. [Google Scholar] [CrossRef]
- Massei, N.; Wang, H.Q.; Dupont, J.P.; Rodet, J.; Laignel, B. Assessment of direct transfer and resuspension of particles during turbid floods at a karstic spring. J. Hydrol. 2003, 275, 109–121. [Google Scholar] [CrossRef]
- Pronk, M.; Goldscheider, N.; Zopfi, J. Dynamics and interaction of organic carbon, turbidity and bacteria in a karst aquifer system. Hydrogeol. J. 2006, 14, 473–484. [Google Scholar] [CrossRef] [Green Version]
- Pronk, M.; Goldscheider, N.; Zopfi, J. Particle-Size Distribution as Indicator for Fecal Bacteria Contamination of Drinking Water from Karst Springs. Environ. Sci. Technol. 2007, 41, 8400–8405. [Google Scholar] [CrossRef] [PubMed] [Green Version]
- Pronk, M.; Goldscheider, N.; Zopfi, J.; Zwahlen, F. Percolation and particle transport in the unsaturated zone of a karst aquifer. Groundwater 2009, 47, 361–369. [Google Scholar] [CrossRef] [Green Version]
- Margeta, J.; Marasović, K. Vodoopskrbni zahvati na izvoru rijeke Jadro od antike do danas. Građevinar 2018, 70, 985–996. [Google Scholar]
- Margeta, J.; Fistanic, I. Water quality modelling of Jadro spring. Water Sci. Technol. 2004, 50, 59–66. [Google Scholar] [CrossRef]
- Marasović, K.; Margeta, J. A study of Roman water intake structures at the Jadro River’s spring. Vjesnik za Arheologiju i Historiju Dalmatinsku 2017, 110, 509–532. [Google Scholar]
- Ignjatić Zokić, T.; Miletić, B.; Cvetnić, M.; Markić, M.; Kučić Grgić, D.; Prevarić, V. Pilot istraživanje višeslojnom filtracijom vode izvorišta Jadro. Hrvat. Vode 2020, 28, 197–204. [Google Scholar]
- Jukić, D.; Denić-Jukić, V.; Kadić, A. Temporal and spatial characterization of sediment transport through a karst aquifer by means of time series analysis. J. Hydrol. 2022, 609, 127753. [Google Scholar] [CrossRef]
- Fritz, F. Hidrogeologija zaleđa Splita. Krš Jugosl. 1981, 10, 97–118. [Google Scholar]
- Kapelj, S.; Kapelj, J.; Švonja, M. Hidrogeološka obilježja sliva Jadra i Žrnovnice. Tusculum 2012, 5, 205–216. [Google Scholar]
- Bonacci, O.; Andrić, I. Karst spring catchment: An example from Dinaric karst. Environ. Earth Sci. 2015, 74, 6211–6223. [Google Scholar] [CrossRef]
- Loborec, J.; Đurin, B. Primjena višekriterijske analize u svrhu odabira optimalne metode procjene prirodne ranjivosti krških vodonosnika. Hrvat. Vode 2016, 24, 193–202. [Google Scholar]
- Kadić, A.; Jukić, D.; Denić-Jukić, V. Study of hydrological relations between two adjacent karst springs by means of time series analysis. In Aqua 2015: Back to the Future! Proceedings of the 42nd International Congress of International Association of Hydrogeologists Roma, Italy, 13–18 September 2015; Roma Società Geologica Italiana 2016: Rome, Italy, 2015; p. 67. [Google Scholar]
- Jukić, D.; Denić-Jukić, V. Estimating parameters of groundwater recharge model in frequency domain: Karst springs Jadro and Žrnovnica. Hydrol. Process. 2008, 22, 4532–4542. [Google Scholar] [CrossRef]
- Jukić, D.; Denić-Jukić, V. Investigating relationships between rainfall and karst-spring discharge by higher-order partial correlation functions. J. Hydrol. 2015, 530, 24–36. [Google Scholar] [CrossRef]
- Denić-Jukić, V.; Jukić, D. Kompozitne kernel funkcije i njihova primjena na izvor Jadra. Hrvat. Vode 2002, 39, 107–126. [Google Scholar]
- Denić-Jukić, V. Hydrological Aspects of the Discharge from Karst. Ph.D. Thesis, University of Split, Split, Croatia, 2002. [Google Scholar]
- Vuilleumier, C.; Jeannin, P.-Y.; Hessenauer, M.; Perrochet, P. Hydraulics and turbidity generation in the Milandre Cave (Switzerland). Water Resour. Res. 2021, 57, e2020WR029550. [Google Scholar] [CrossRef]
- De Bastos, F.; Reichert, J.M.; Minella, J.P.G.; Rodrigues, M.F. Strategies for identifying pollution sources in a headwater catchment based on multi-scale water quality monitoring. Environ. Monit. Assess. 2021, 193, 169. [Google Scholar] [CrossRef]
- Bettel, L.; Fox, J.; Husic, A.; Zhu, J.; Al Aamery, N.; Mahoney, T.; Gold-McCoy, A. Sediment transport investigation in a karst aquifer hypothesizes controls on internal versus external sediment origin and saturation impact on hysteresis. J. Hydrol. 2022, 613, 128391. [Google Scholar] [CrossRef]
- Zhu, M.; Yu, X.; Li, Z.; Xu, X.; Ye, Z. Quantifying and interpreting the hysteresis patterns of monthly sediment concentration and water discharge in karst watersheds. J. Hydrol. 2023, 618, 129179. [Google Scholar] [CrossRef]
- Husic, A.; Fox, J.F.; Clare, E.; Mahoney, T.; Zarnaghsh, A. Nitrate Hysteresis as a Tool for Revealing Storm-Event Dynamics and Improving Water Quality Model Performance. Water Resour. Res. 2023, 59, e2022WR033180. [Google Scholar] [CrossRef]
- Nadal-Romero, E.; Regüés, D.; Latron, J. Relationships among rainfall, runoff, and suspended sediment in a small catchment with badlands. CATENA 2008, 74, 127–136. [Google Scholar] [CrossRef]
- Buendia, C.; Vericat, D.; Batalla, R.J.; Gibbins, C.N. Temporal dynamics of sediment transport and transient in-channel storage in a highly erodible catchment. Land Degrad. Dev. 2016, 27, 1045–1063. [Google Scholar] [CrossRef]
Figure 1.
Hydrogeological map of the Jadro and Žrnovnica Springs catchment with monitoring network [45,48].

Figure 2.
Time series of hourly discharge (Q) and turbidity (T) of the Jadro Spring, and daily rainfall at the meteorological station, Dugopolje (P) for the years: (a) 2017, (b) 2018, (c) 2019, (d) 2020. The red line represents the permitted turbidity (T) value of 4 NTU.
Figure 2.
Time series of hourly discharge (Q) and turbidity (T) of the Jadro Spring, and daily rainfall at the meteorological station, Dugopolje (P) for the years: (a) 2017, (b) 2018, (c) 2019, (d) 2020. The red line represents the permitted turbidity (T) value of 4 NTU.
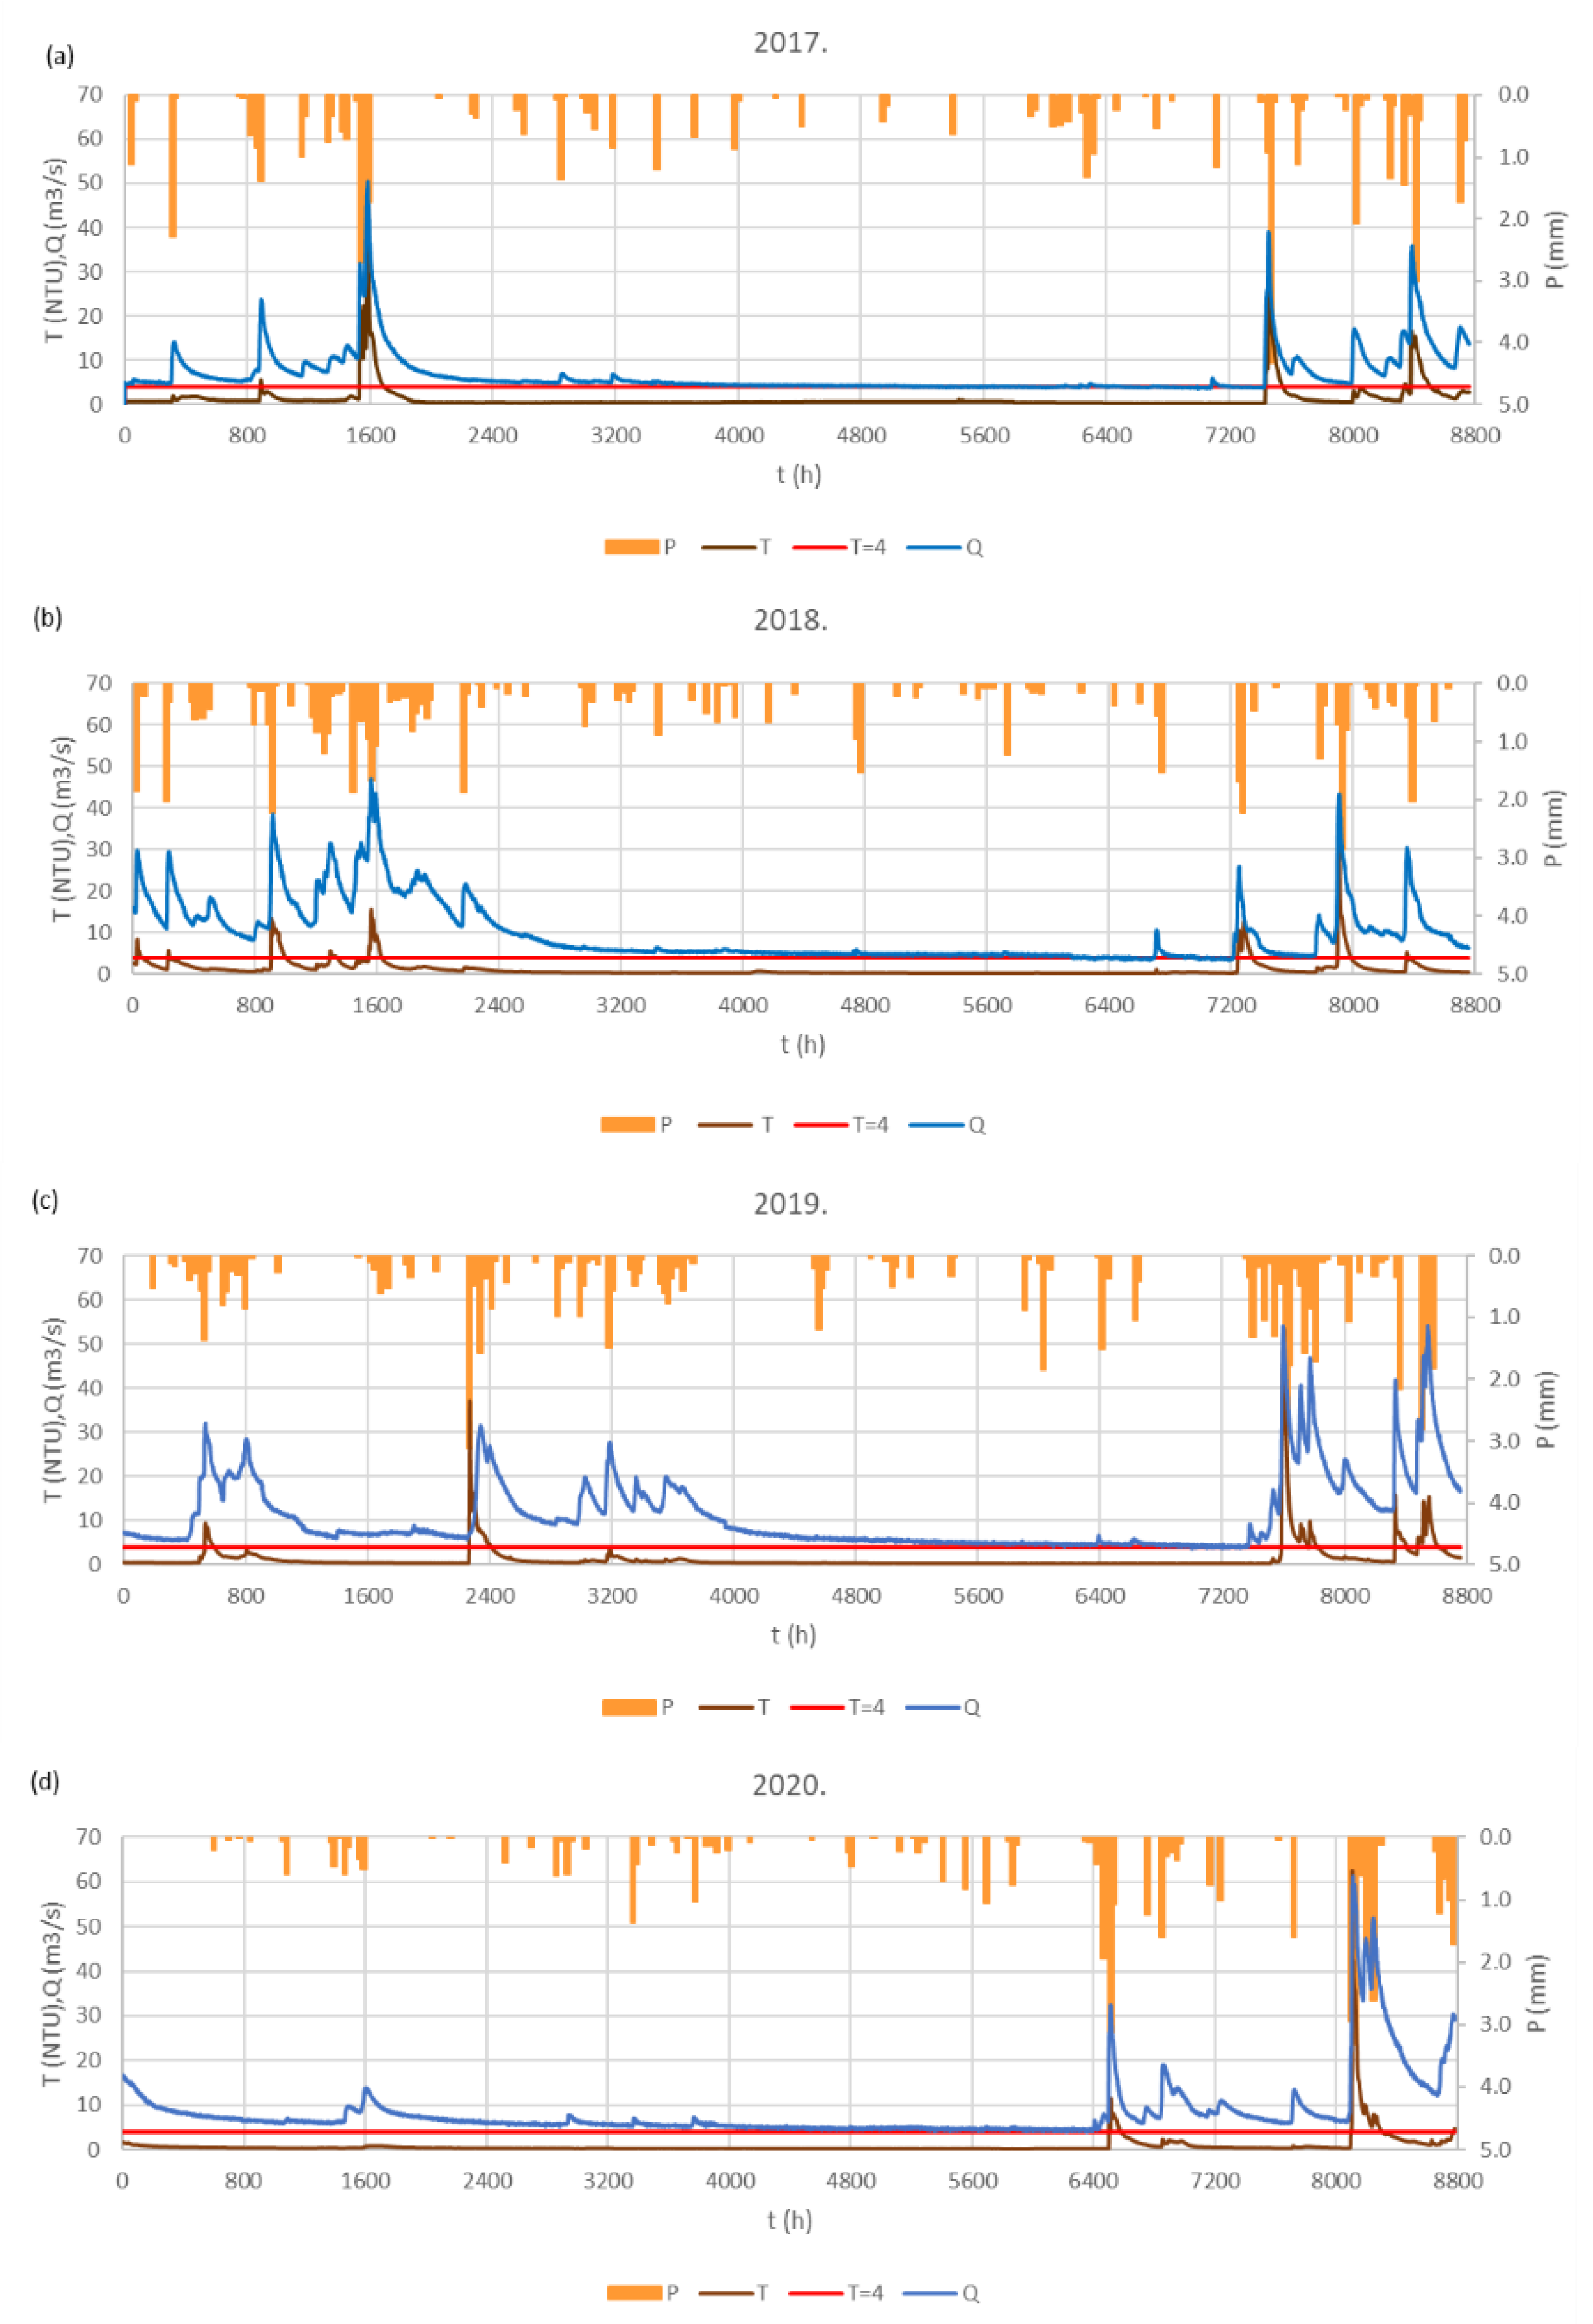
Figure 3.
The left column (a–e) shows the time series of hourly turbidity (T), discharge (Q), and cumulative rainfall (Pc) for rainfall events with exceeding turbidity in 2017, with the start and end date of each event. The right column (a1–e1) shows exceeding turbidity (Te) versus discharge (Q) hysteresis plots (Te − Q) with the start and end date of exceeding turbidity. Dominant hysteresis directions are marked by arrows.
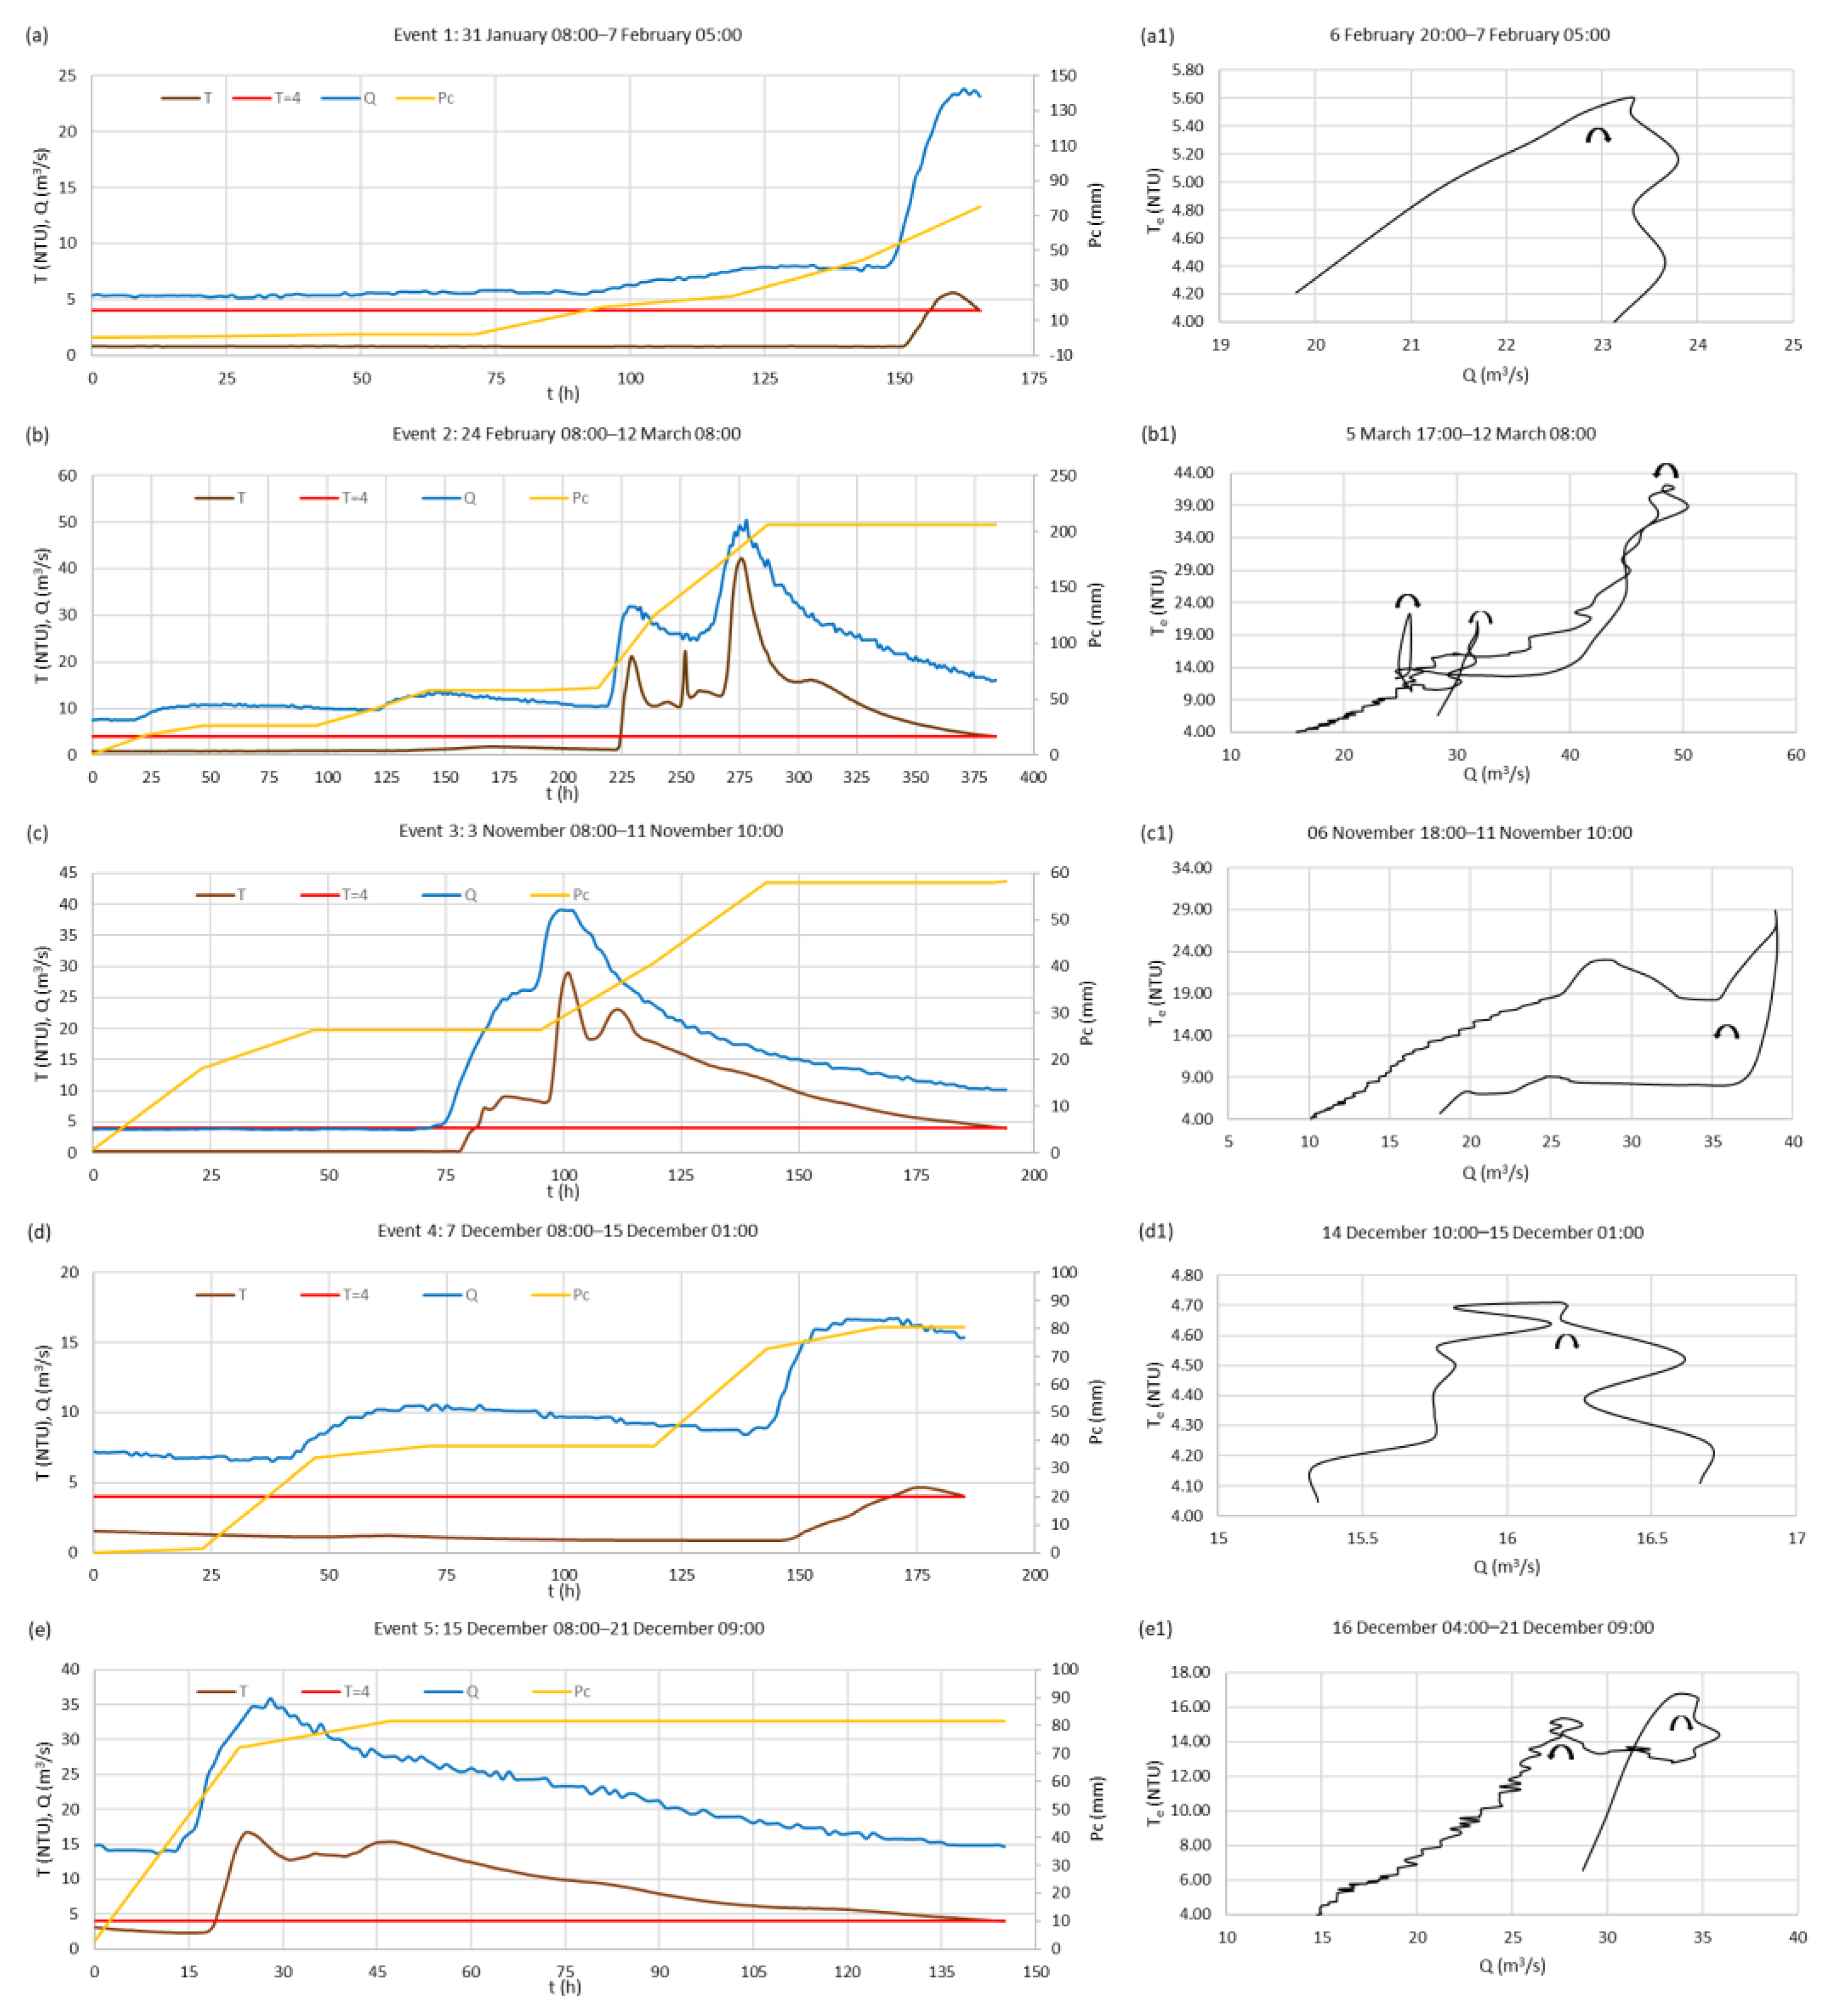
Figure 4.
The left column (a–h) shows the time series of hourly turbidity (T), discharge (Q), and cumulative rainfall (Pc) for rainfall events with exceeding turbidity in 2018, with the start and end date of each event. The right column (a1–h1) shows exceeding turbidity (Te) versus discharge (Q) hysteresis plots (Te − Q), with the start and end date of exceeding turbidity. Dominant hysteresis directions are marked by arrows.
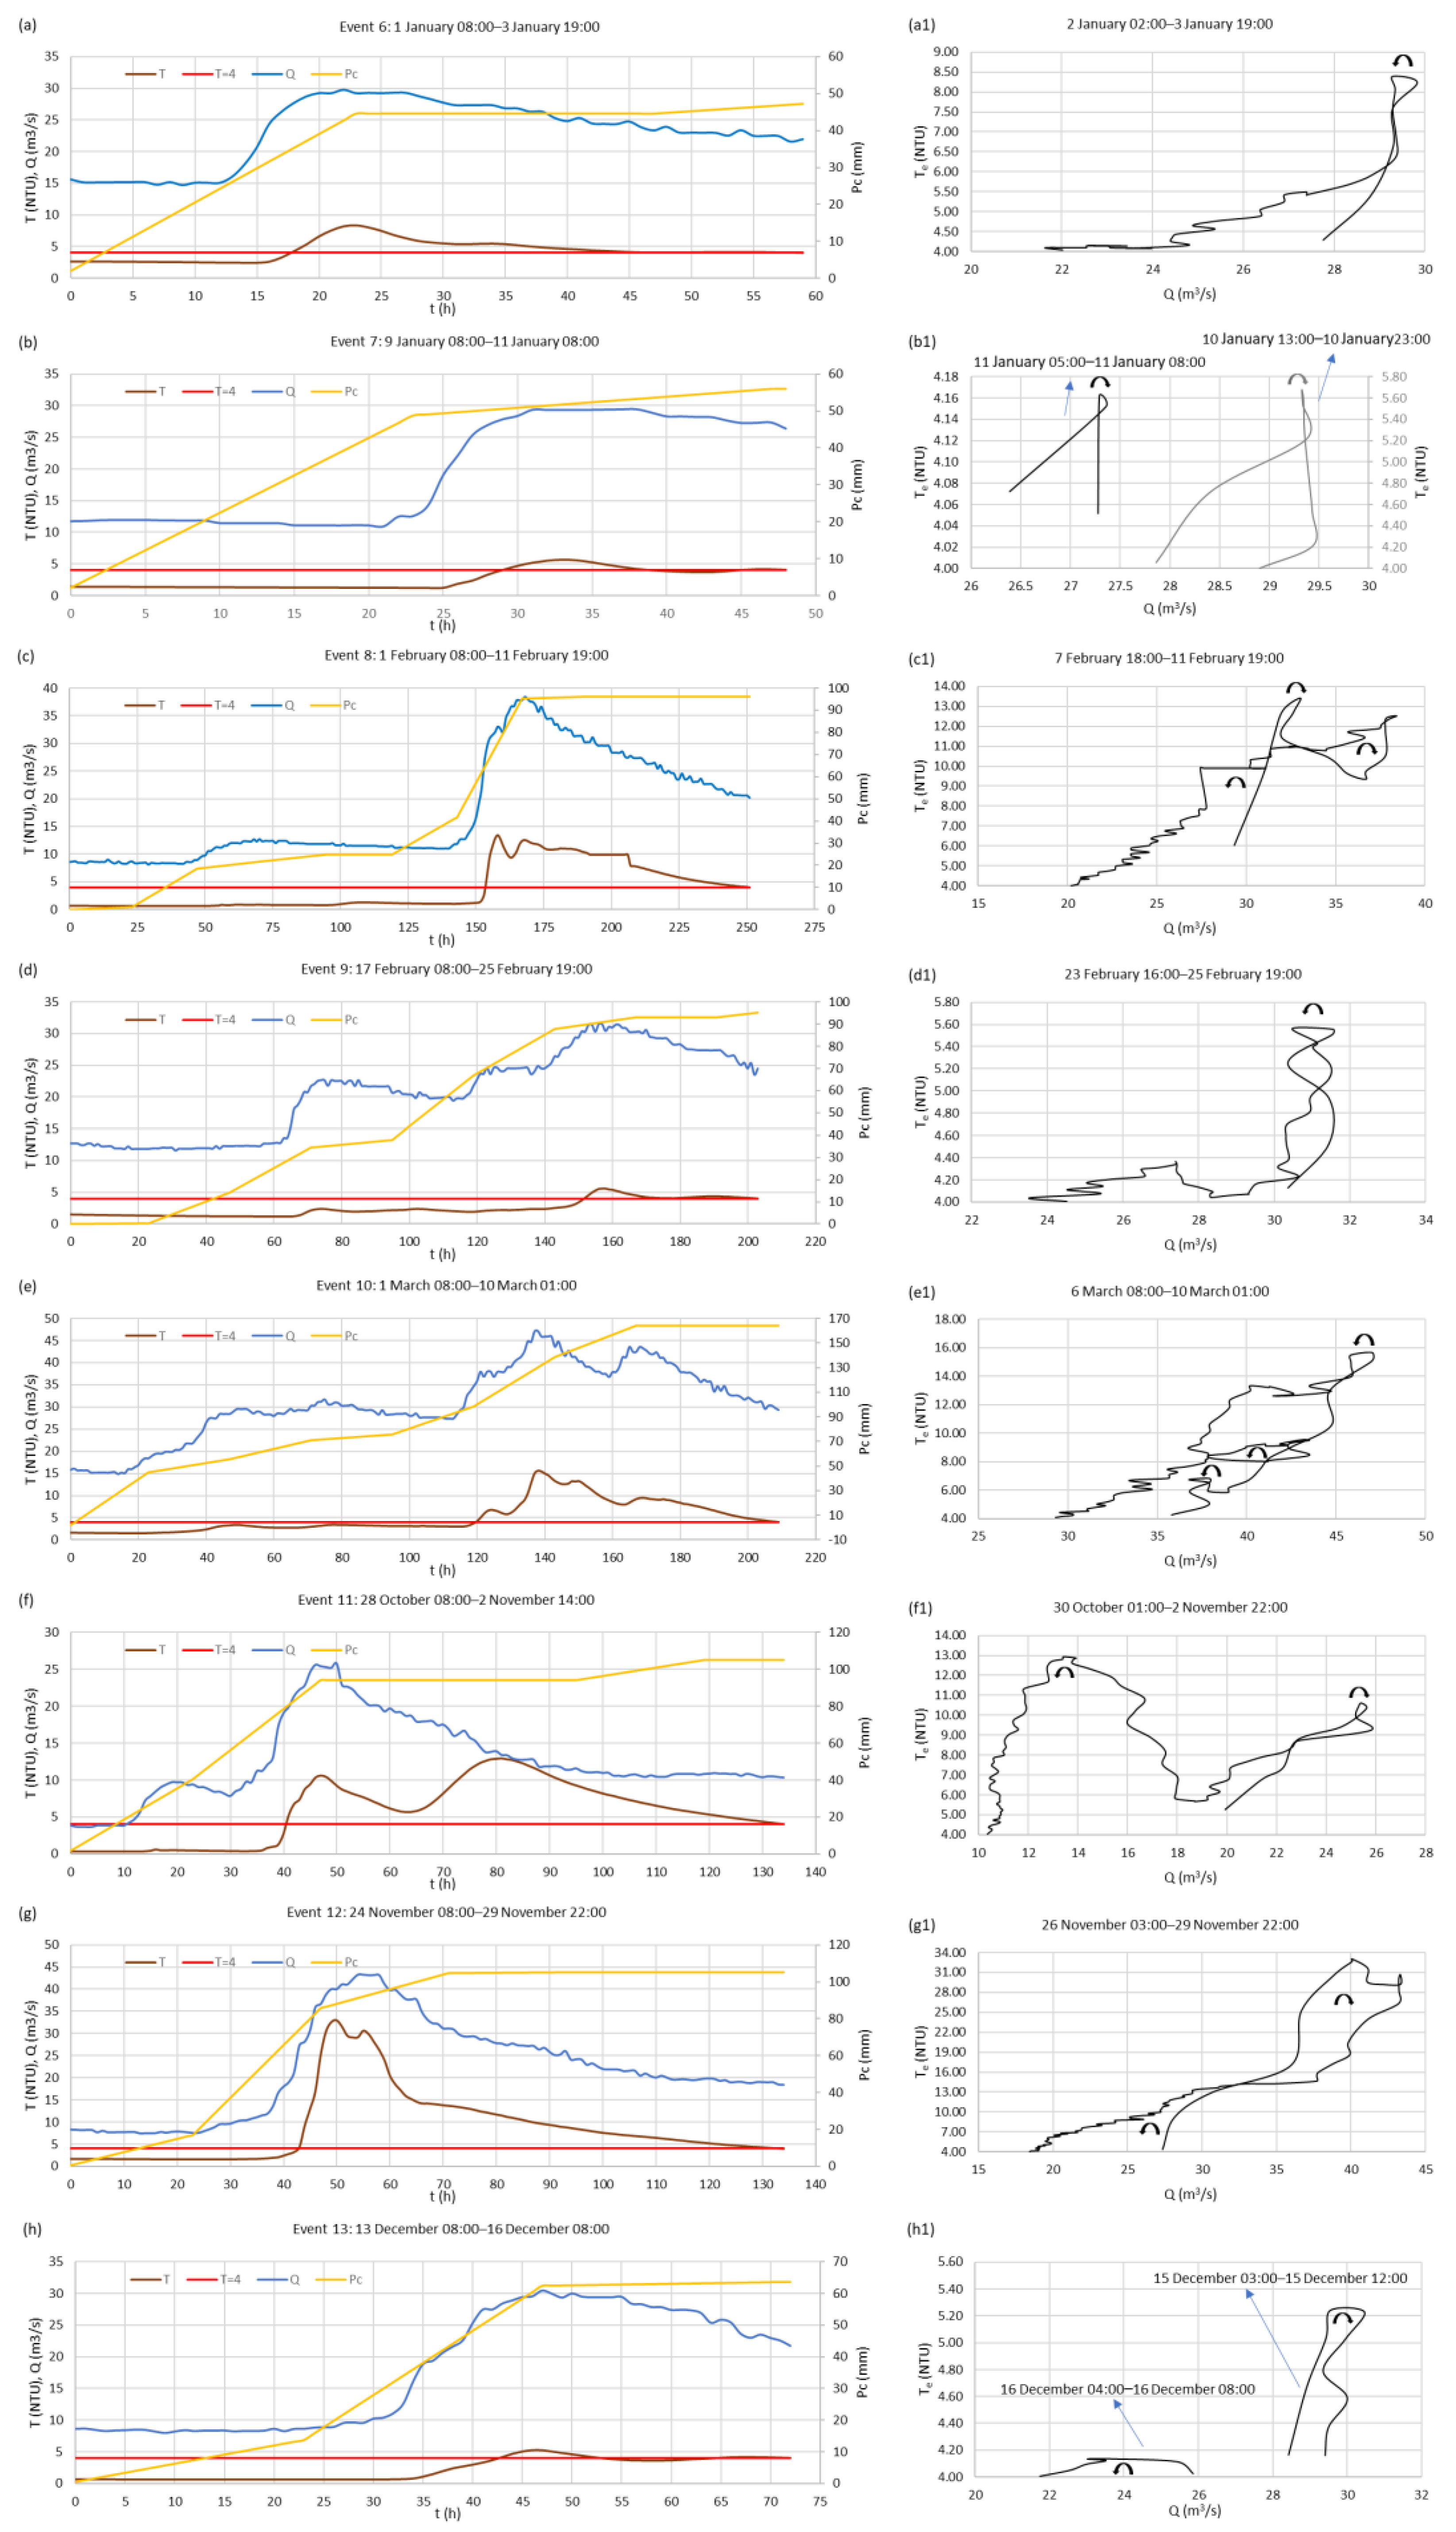
Figure 5.
The left column (a–e) shows the time series of hourly turbidity (T), discharge (Q), and cumulative rainfall (Pc) for rainfall events with exceeding turbidity in 2019, with the start and end date of each event. The right column (a1–e1) shows exceeding turbidity (Te) versus discharge (Q) hysteresis plots (Te − Q), with the start and end date of exceeding turbidity. Dominant hysteresis directions are marked by arrows.
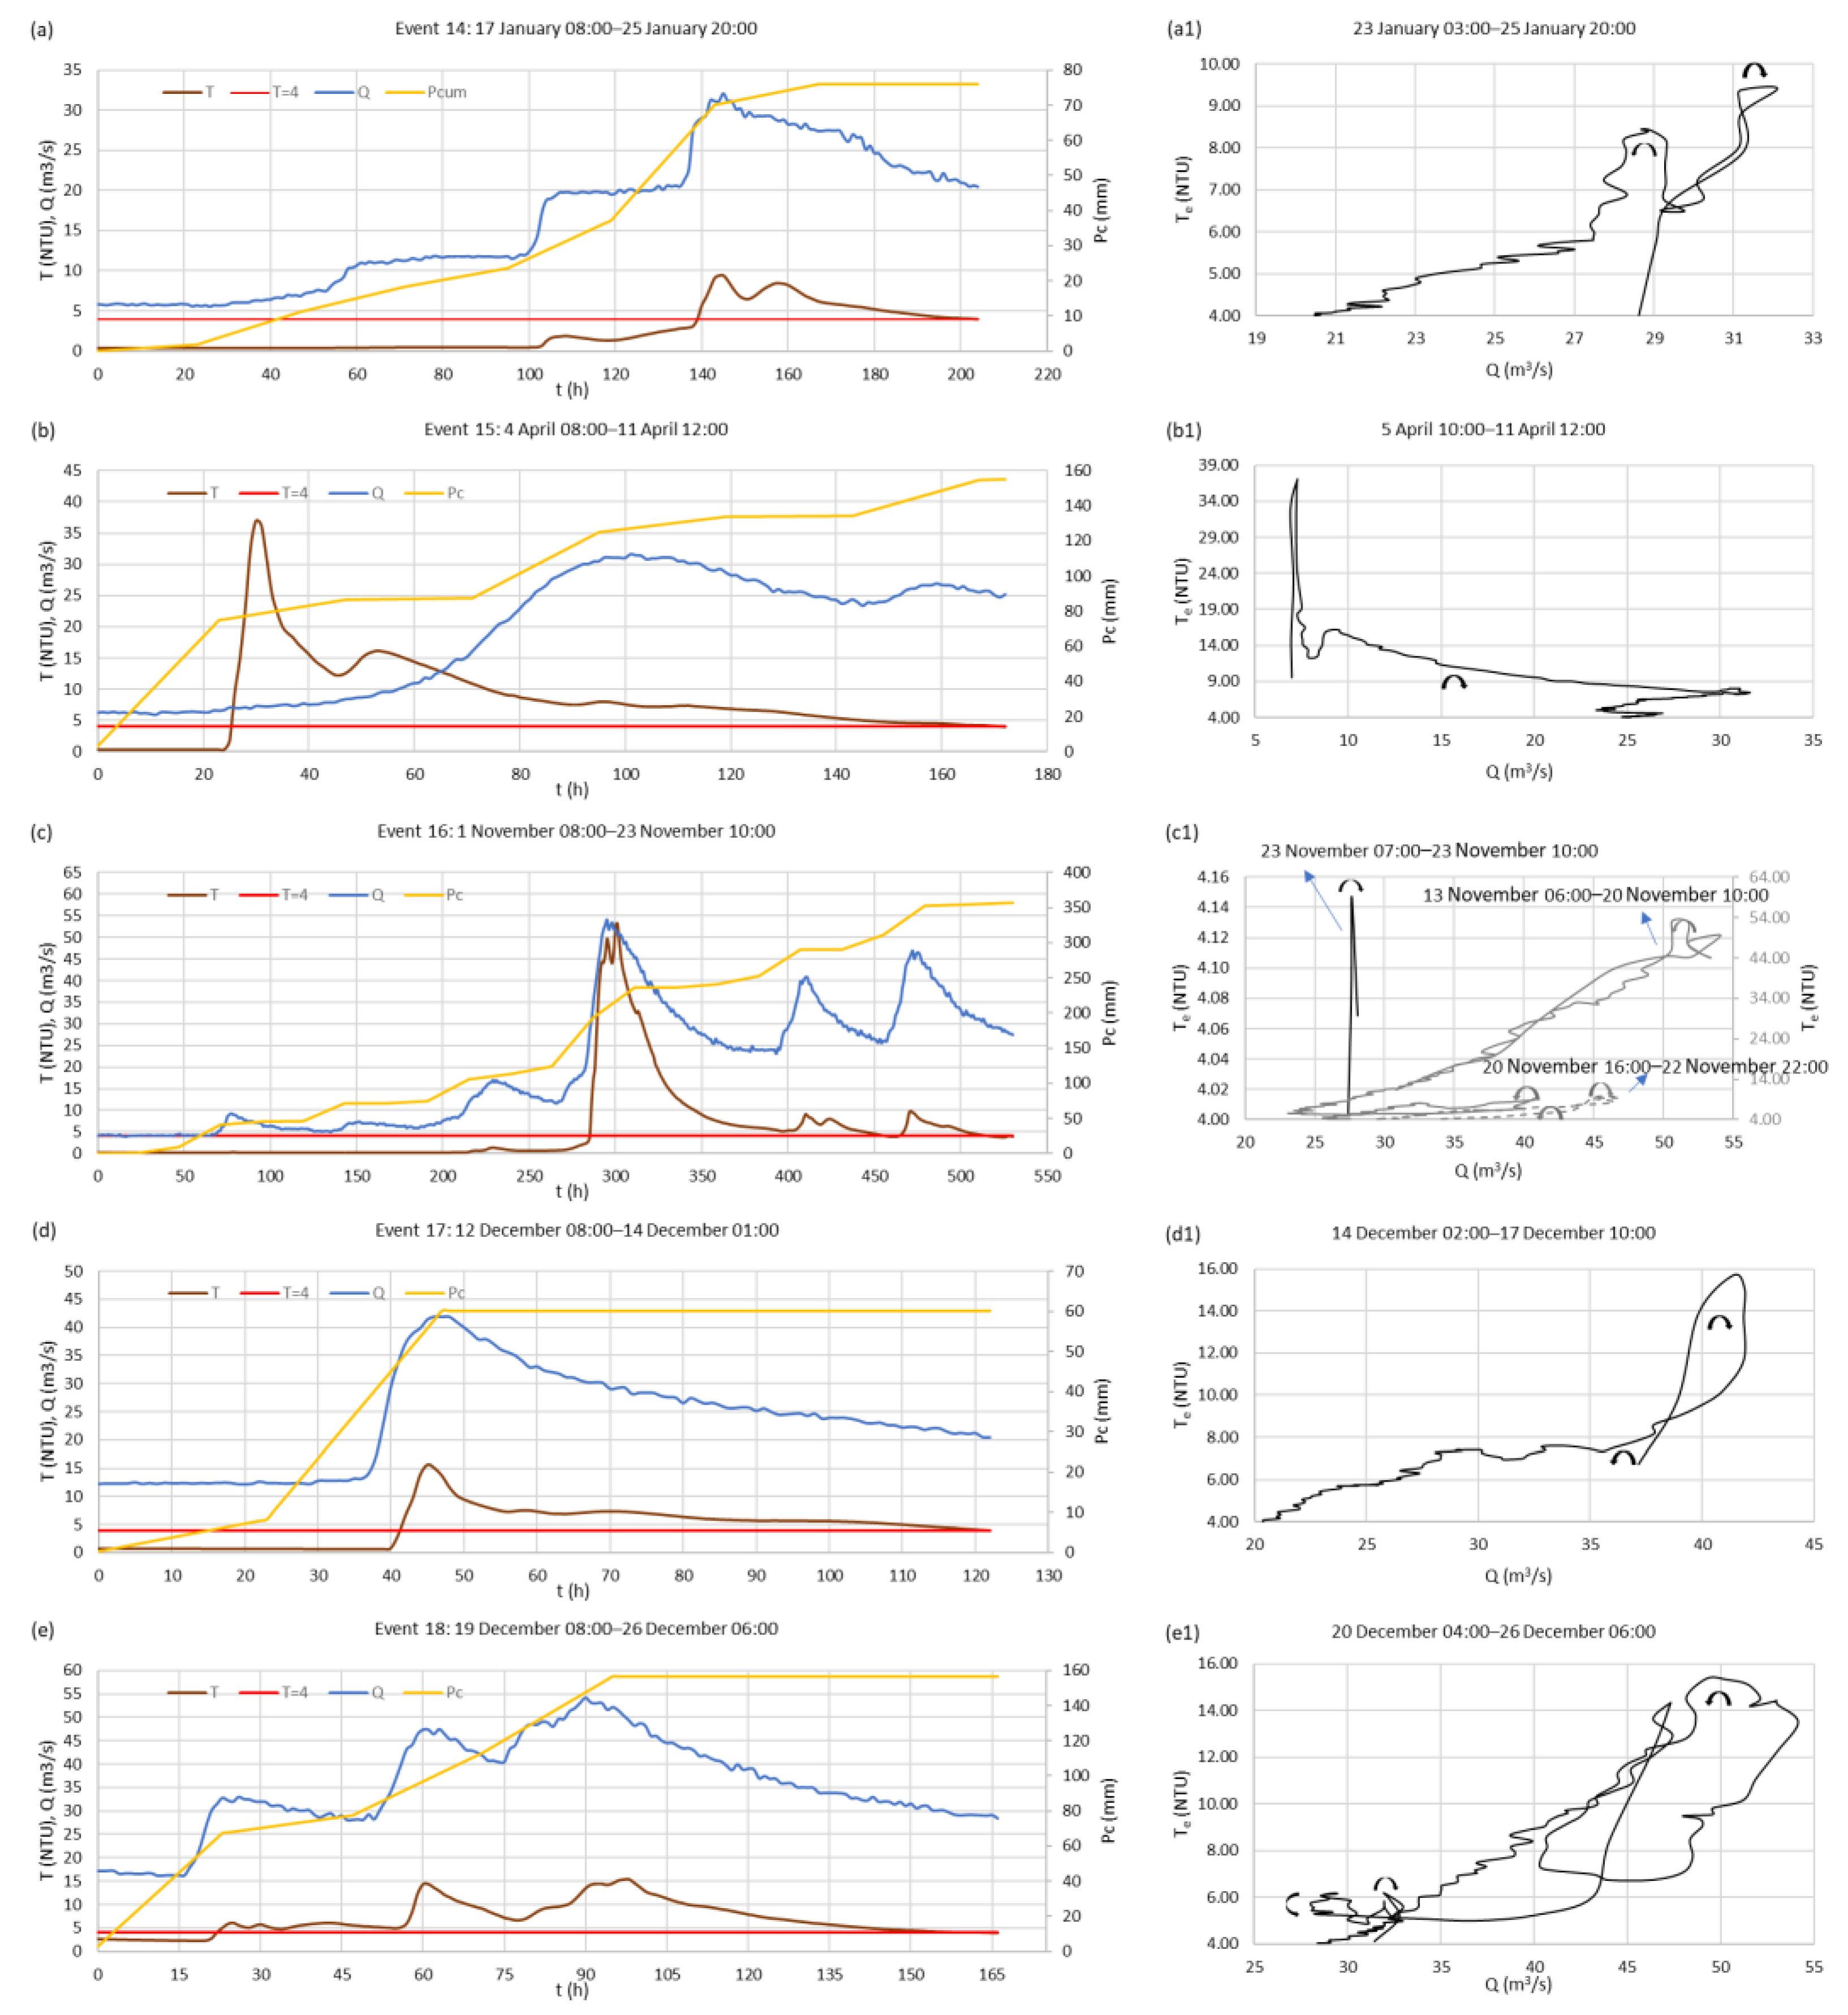
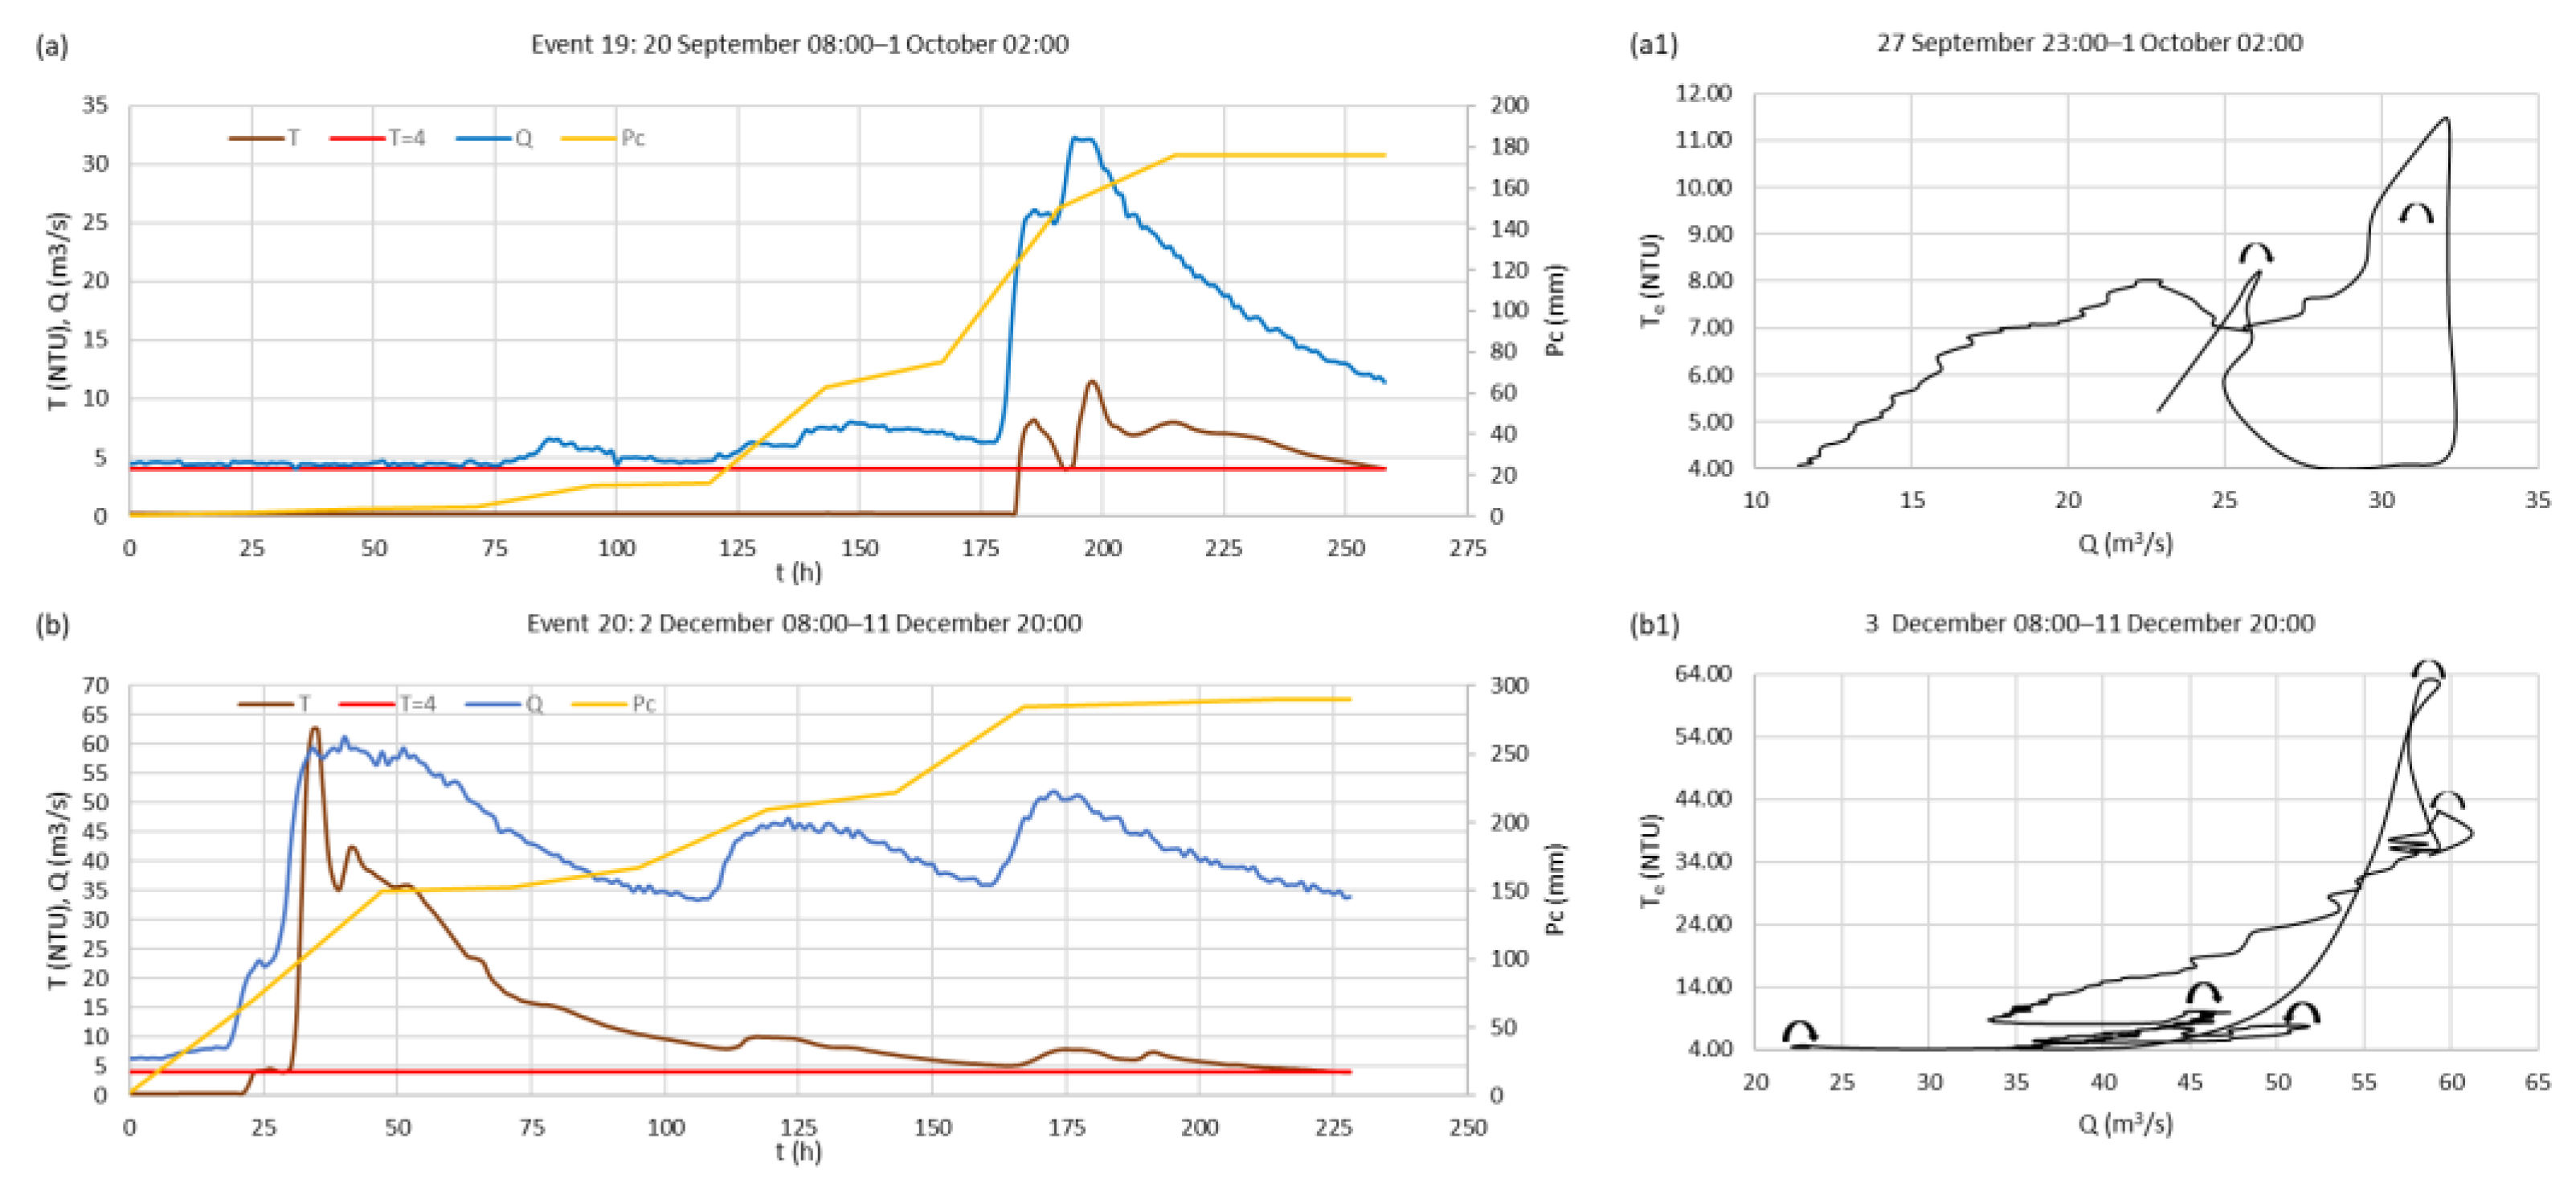
Figure 6.
The left column (a,b) shows the time series of hourly turbidity (T), discharge (Q), and cumulative rainfall (Pc) for rainfall events with exceeding turbidity in 2020, with the start and end date of each event. The right column (a1,b1) shows exceeding turbidity (Te) versus discharge (Q) hysteresis plots (Te − Q), with the start and end date of exceeding turbidity. Dominant hysteresis directions are marked by arrows.

Table 1.
General statistical characteristics of the time series (minimum, maximum, sum, mean, and standard deviation) for the period 2017–2020.
Table 1.
General statistical characteristics of the time series (minimum, maximum, sum, mean, and standard deviation) for the period 2017–2020.
| 2017–2020 | |||||
|---|---|---|---|---|---|
| Min. | Max. | Mean | St. Dev. | ||
| Rainfall (mm) | Dugopolje | - | 103.9 | 3.6 | 10.2 |
| Turbidity (NTU) | Jadro | 0.22 | 62.45 | 1.2 | 2.74 |
| Discharge (m3/s) | 3.45 | 61.23 | 9.03 | 7.21 | |
Table 2.
Rainfall events variables and associated abbreviations.
| Turbidity Variables | Discharge Variables | Rainfall Variables |
|---|---|---|
| Maximum turbidity during the period where Tk > 4 NTU − Temax (NTU) | Maximum discharge during the period where Tk > 4 NTU − Qemax (m3/s) | Duration of the rainfall event which preceded Te − tbTe (h) |
| Duration of the period where Tk > 4NTU − te (h) | The time from the start of the rainfall event to the occurrence of Qemax − tbQemax (h) | Cumulative rainfall before the start of Te − PcTe (mm) |
| The time from the start of the rainfall event to the occurrence of Temax − tbTemax (h) | Cumulative rainfall before the appearance of Qemax − PcQemax (mm) | |
| Rainfall intensity before the start of Te − ibTe (mm/h) | ||
| Rainfall intensity before the appearance of Qemax − ibQemax (mm/h) |
Table 3.
General characteristics of single rainfall events in the year 2017.
| Rainfall Event | Start of the Rainfall Event | tbTe (h) | Start of Te | te (h) | Temax (NTU) | Qemax (m3/s) | PcTe (mm) | PcQemax (mm) | ibTe (mm/h) | ibQemax (mm/h) | tbTemax (h) | tbQemax (h) |
|---|---|---|---|---|---|---|---|---|---|---|---|---|
| 1 | 31 January | 155 | 6 February 20:00 | 10 | 5.61 | 23.80 | 60.85 | 69.23 | 0.39 | 0.43 | 160 | 162 |
| 2 | 24 February | 224 | 5 March 17:00 | 160 | 42.14 | 50.39 | 84.71 | 189.09 | 0.38 | 0.68 | 276 | 278 |
| 3 | 3 November | 81 | 6 November 18:00 | 113 | 28.93 | 39.02 | 64.48 | 129.53 | 0.80 | 1.31 | 101 | 100 |
| 4 | 7 December | 169 | 14 December 10:00 | 16 | 4.71 | 16.70 | 80.50 | 80.50 | 0.48 | 0.47 | 176 | 171 |
| 5 | 15 December | 19 | 16 December 04:00 | 126 | 16.73 | 35.91 | 60.08 | 73.68 | 3.16 | 2.73 | 25 | 28 |
Table 4.
General characteristics of single rainfall events in the year 2018.
| Rainfall Event | Start of the Rainfall Event | tbTe (h) | Start of Te | te (h) | Temax (NTU) | Qemax (m3/s) | PcTe (mm) | PcQemax (mm) | ibTe (mm/h) | ibQemax (mm/h) | tbTemax (h) | tbQemax (h) |
|---|---|---|---|---|---|---|---|---|---|---|---|---|
| 6 | 1 January | 17 | 2 January 02:00 | 42 | 8.38 | 29.83 | 33.38 | 40.79 | 1.96 | 1.94 | 24 | 22 |
| 7 | 9 January | 28 | 10 January 13:00 | 11 | 5.67 | 29.44 | 50.30 | 53.00 | 1.80 | 1.43 | 34 | 38 |
| 44 | 11 January 05:00 | 4 | 4.16 | 27.36 | 55.10 | 55.70 | 1.25 | 1.21 | 46 | 47 | ||
| 8 | 1 February | 153 | 7 February 18:00 | 98 | 13.41 | 38.43 | 64.09 | 95.30 | 0.42 | 0.57 | 158 | 168 |
| 9 | 17 February | 151 | 23 February 16:00 | 52 | 5.57 | 31.55 | 89.56 | 90.67 | 0.59 | 0.58 | 158 | 157 |
| 10 | 1 March | 119 | 6 March 08:00 | 90 | 15.66 | 47.04 | 98.30 | 128.45 | 0.83 | 0.94 | 138 | 138 |
| 11 | 28 October | 41 | 30 October 01:00 | 94 | 12.94 | 25.80 | 78.40 | 94.00 | 1.91 | 1.84 | 81 | 50 |
| 12 | 24 November | 42 | 26 November 03:00 | 92 | 33.03 | 43.31 | 71.43 | 90.45 | 1.70 | 1.71 | 50 | 54 |
| 13 | 13 December | 42 | 15 December 03:00 | 10 | 5.24 | 30.46 | 52.36 | 60.48 | 1.25 | 6.00 | 46 | 47 |
| 64 | 16 December 04:00 | 8 | 4.13 | 25.86 | 63.36 | 63.36 | 0.99 | 0.99 | 67 | 65 |
Table 5.
General characteristics of single rainfall events in the year 2019.
| Rainfall Event | Start of the Rainfall Event | tbTe (h) | Start of Te | te (h) | Temax (NTU) | Qemax (m3/s) | PcTe (mm) | PcQemax (mm) | ibTe (mm/h) | ibQemax (mm/h) | tbTemax (h) | tbQemax (h) |
|---|---|---|---|---|---|---|---|---|---|---|---|---|
| 14 | 17 January | 138 | 23 January 03:00 | 66 | 9.41 | 32.10 | 63.17 | 70.25 | 0.46 | 0.49 | 145 | 145 |
| 15 | 4 April | 25 | 5 April 10:00 | 147 | 37.01 | 31.61 | 75.78 | 126.74 | 3.03 | 1.27 | 30 | 101 |
| 16 | 1 November | 285 | 13 November 06:00 | 173 | 53.31 | 54.05 | 187.52 | 205.78 | 0.66 | 0.70 | 301 | 295 |
| 463 | 20 November 16:00 | 55 | 9.90 | 46.87 | 324.60 | 338.40 | 0.70 | 0.72 | 471 | 472 | ||
| 526 | 23 November 07:00 | 4 | 4.15 | 28.09 | 356.20 | 356.20 | 0.68 | 0.68 | 528 | 527 | ||
| 17 | 12 December | 41 | 14 December 02:00 | 81 | 15.73 | 41.90 | 47.23 | 55.88 | 1.15 | 1.24 | 45 | 46 |
| 18 | 19 December | 20 | 20 December 06:00 | 145 | 15.38 | 54.14 | 61.78 | 145.93 | 3.09 | 1.64 | 98 | 90 |
Table 6.
General characteristics of single rainfall events in the year 2020.
| Rainfall Event | Start of the Rainfall Event | tbTe (h) | Start of Te | te (h) | Temax (NTU) | Qemax (m3/s) | PcTe (mm) | PcQemax (mm) | ibTe (mm/h) | ibQemax (mm/h) | tbTemax (h) | tbQemax (h) |
|---|---|---|---|---|---|---|---|---|---|---|---|---|
| 19 | 20 September | 182 | 27 September 23:00 | 76 | 11.49 | 32.29 | 121.88 | 152.15 | 0.67 | 0.79 | 198 | 194 |
| 20 | 2 December | 23 | 3 December 08:00 | 205 | 62.45 | 61.23 | 70.50 | 123.43 | 3.07 | 3.17 | 34 | 40 |
Table 7.
Overview of all hysteresis loop types with their general characteristics for each rainfall event with exceeding turbidity during the study period 2017–2020. The hysteresis loop types (HT) are described as: clockwise (C), counterclockwise (CC), figure-eight (F8), and complex (CX). The time difference between Temax and Qemax is marked with ΔTemax,Qemax.
| Year | Rainfall Event | Start and End of Te | te (h) | Temax (NTU) | Qemax (m3/s) | ΔTemax,Qemax (h) | HT |
|---|---|---|---|---|---|---|---|
| 2017 | 1 | 6 February 20:00–7 February 05:00 | 10 | 5.61 | 23.80 | −2 | C |
| 2 | 5 March 17:00–12 March 08:00 | 160 | 42.14 | 50.39 | −2 | CX | |
| 3 | 6 November 18:00–11 November 10:00 | 113 | 28.93 | 39.02 | 1 | CC | |
| 4 | 14 December 10:00–15 December 01:00 | 16 | 4.71 | 16.70 | 5 | C | |
| 5 | 16 December 04:00–21 December 09:00 | 126 | 16.73 | 35.91 | −3 | F8 | |
| 2018 | 6 | 2 January 02:00–03 January 19:00 | 42 | 8.38 | 29.83 | 2 | CC |
| 7 | 10 January 13:00–10 January 23:00 | 11 | 5.67 | 29.44 | −4 | C | |
| 11 January 05:00–11 January 08:00 | 4 | 4.16 | 27.36 | −1 | C | ||
| 8 | 7 February 18:00–11 February 19:00 | 98 | 13.41 | 38.43 | −10 | CX | |
| 9 | 23 February 16:00–25 February 19:00 | 52 | 5.57 | 31.55 | 1 | CC | |
| 10 | 6 March 08:00–10 March 01:00 | 90 | 15.66 | 47.04 | 0 | CX | |
| 11 | 30 October 01:00–02 November 22:00 | 94 | 12.94 | 25.80 | 31 | F8 | |
| 12 | 26 November 03:00–29 November 22:00 | 92 | 33.03 | 43.31 | −4 | F8 | |
| 13 | 15 December 03:00–15 December 12:00 | 10 | 5.24 | 30.46 | −1 | C | |
| 16 December 04:00–16 December 08:00 | 8 | 4.13 | 25.86 | 2 | CC | ||
| 2019 | 14 | 23 January 03:00–25 January 20:00 | 66 | 9.41 | 32.10 | 0 | F8 |
| 15 | 5 April 10:00–11 April 12:00 | 147 | 37.01 | 31.61 | −71 | C | |
| 16 | 13 November 06:00–20 November 10:00 | 173 | 53.31 | 54.05 | 6 | CX | |
| 20 November 16:00–22 November 22:00 | 55 | 9.90 | 46.87 | −1 | F8 | ||
| 23 November 07:00–23 November 10:00 | 4 | 4.15 | 28.09 | 1 | C | ||
| 17 | 14 December 02:00–17 December 10:00 | 81 | 15.73 | 41.90 | −1 | F8 | |
| 18 | 20 December 06:00–26 December 06:00 | 145 | 15.38 | 54.14 | 8 | CX | |
| 2020 | 19 | 27 September 23:00–1 October 02:00 | 76 | 11.49 | 32.29 | 4 | F8 |
| 20 | 3 December 08:00–11 December 20:00 | 205 | 62.45 | 61.23 | 4 | CX |
Disclaimer/Publisher’s Note: The statements, opinions and data contained in all publications are solely those of the individual author(s) and contributor(s) and not of MDPI and/or the editor(s). MDPI and/or the editor(s) disclaim responsibility for any injury to people or property resulting from any ideas, methods, instructions or products referred to in the content. |
© 2023 by the authors. Licensee MDPI, Basel, Switzerland. This article is an open access article distributed under the terms and conditions of the Creative Commons Attribution (CC BY) license (https://creativecommons.org/licenses/by/4.0/).
Share and Cite
MDPI and ACS Style
Kadić, A.; Denić-Jukić, V.; Jukić, D. Exceeding Turbidity versus Karst Spring Discharge during Single Rainfall Events: The Case of the Jadro Spring. Water 2023, 15, 2589. https://doi.org/10.3390/w15142589
AMA Style
Kadić A, Denić-Jukić V, Jukić D. Exceeding Turbidity versus Karst Spring Discharge during Single Rainfall Events: The Case of the Jadro Spring. Water. 2023; 15(14):2589. https://doi.org/10.3390/w15142589
Chicago/Turabian StyleKadić, Ana, Vesna Denić-Jukić, and Damir Jukić. 2023. "Exceeding Turbidity versus Karst Spring Discharge during Single Rainfall Events: The Case of the Jadro Spring" Water 15, no. 14: 2589. https://doi.org/10.3390/w15142589
Note that from the first issue of 2016, this journal uses article numbers instead of page numbers. See further details here.