Article

Tris(2-benzimidazolyl)amine (NTB)-Modified Metal-Organic Framework: Preparation, Characterization, and Mercury Ion Removal Studies

1
Department of Integrated Environmental Systems, Pyeongtaek University, Pyeongtaek 17869, Republic of Korea
2
Department of Biological and Environmental Engineering, Semyung University, Jecheon 27236, Republic of Korea
3
Department of Environmental Engineering, Kwangwoon University, Seoul 01897, Republic of Korea
4
ENVIONEER Co., Ltd., Jecheon 27116, Republic of Korea
*
Authors to whom correspondence should be addressed.
Water 2023, 15(14), 2559; https://doi.org/10.3390/w15142559
Submission received: 5 June 2023 / Revised: 7 July 2023 / Accepted: 10 July 2023 / Published: 12 July 2023
(This article belongs to the Special Issue Advanced Technologies in Water Treatment)

Abstract

:
Heavy metal ions (HMIs) are exceedingly hazardous to both humans and the environment, and the necessity to eliminate them from aqueous systems prompted the development of novel materials. In this study, tris(2-benzimidazolylmethyl)amine (NTB) was impregnated into MIL-101-(Cr) metal-organic framework using an incipient wetness impregnation approach, and the ability of the composite material to adsorb Hg2+ ions from the water was examined. The synthesized materials were analyzed with several physico-chemical techniques such as powder X-ray diffraction, elemental analysis, scanning electron microscopy, thermogravimetric analysis, nitrogen sorption isotherms at 77 K, and X-ray photoelectron spectrometry. MIL-101-NTB quickly adsorbs 93.9% of Hg2+ ions within 10 min from a 10.0 ppm single ion solution. A better fit of the kinetic data to a pseudo-second-order model validated the chemisorption of Hg2+ ions on MIL-101-NTB. The experimental data fitted well with the Langmuir isotherm model, and the maximum adsorption capacity obtained at 125 ppm initial concentration was 111.03 mg/g. Despite the presence of other competing ions (Cu2+, Pb2+, and Cd2+), high Hg2+ ions removal efficiency (99.6%, 1.0 ppm initial concentration) was maintained in the diverse ion batch adsorption studies. A 0.2 M EDTA solution could desorb the Hg2+ ions, and cyclic Hg2+ ions sorption studies indicated that MIL-101-NTB might have a high Hg2+ ions removal efficiency for at least five consecutive cycles. Based on the FTIR and XPS analyses, Hg2+ ions chelation by NTB molecules and electrostatic interactions between Hg2+ ions and carboxylate groups in MIL-101-NTB are plausible mechanisms for Hg2+ ions adsorption.

Graphical Abstract

1. Introduction

Heavy metal ions (HMIs) are produced owing to rapid industrial and agricultural development. Consequently, excessive levels of heavy metals (HMs) in industrial wastewater are increasingly common [1]. Many heavy metal complexes can be found in water because of their great solubility; they quickly enter organisms and food chains and accumulate in our surroundings [2]. These HMIs are derived from natural (volcanic eruptions, weathering, and attrition waste) and anthropogenic (artificial) sources (industrial effluents, fertilizers, and sewage) [3].
The slow accumulation of HMIs poses a considerable risk to human health, exacerbated by their non-biodegradability. Mercury is toxic to the immune system, central nervous system, kidneys, and liver. Possible side effects include hearing loss, paralysis, insomnia, and anxiety [4]. Therefore, industrial effluent streams must be decontaminated before discharge into a river or pond to avoid adverse health and environmental effects from direct or indirect metal consumption [5].
The need to remove HMIs from aqueous systems has stimulated research into developing new materials. Therefore, several methods have been developed to eradicate HMIs from domestic or industrial wastewater, including precipitation, flocculation, membrane separation, electrochemistry, and ion exchange [6,7]. Additionally, adsorption technology provides the benefits of low budget, ease of use, and high efficacy for removing pollutants from wastewater [8]. Numerous adsorbents have been studied for HMI removal, including activated carbon, metal-organic frameworks (MOFs), zeolites, and clay [9,10,11,12].
MOFs are porous crystalline inorganic–organic solids that can be created by combining different metal ions with organic ligands. The main difference between MOFs and other porous inorganic materials (such as zeolites) is that MOFs comprise highly adjustable organic and inorganic components. Modifying the metal ion and organic ligand makes it feasible to tailor the framework’s topology and chemical functionality [13]. Furthermore, MOFs’ organic and inorganic components enable post-synthetic modification with functional groups via covalent and coordinate covalent bonding, respectively. Consequently, MOFs have been explored for numerous applications, including gas storage, gas separation, energy storage and conversion, catalysis, drug delivery, and sensor applications [14,15,16,17,18,19]. Additionally, several benchmark MOFs, such as Cu-BTC, MOF-5, and MOF-177, are unstable in water [20,21,22]. Notably, zirconium-based MOFs of the UiO series are renowned for their chemical stability [23,24,25].
In addition to the UiO series of MOFs, MIL-101(Cr), which belongs to the MIL series of MOFs first described by Ferey et al., in 2005 [26], possesses excellent water/chemical stability [27]. Moreover, it has many unsaturated coordinated centers, which aid in the post-synthesis modification of MIL-101(Cr) with electron-rich molecules, such as ethylenediamine. Furthermore, it has a high gas-absorption capacity and catalytic potential [26,27]. Nevertheless, very few studies are available on HMI removal using MIL-101(Cr). Luo et al. reported the selective removal of lead ions using ethylenediamine-functionalized MIL-101(Cr) [28]. Furthermore, Rastkari et al. reported that the adsorption capacity of tetraethylenepentamine (TEPA)-grafted MIL-101(Cr) for Pb2+, Cu2+, Cd2+, and Co2+ ions in an aqueous solution was eight times that of a pristine MOF [29].
Thompson et al. reported the synthesis of a water-insoluble, polydentate trisbenzimidazole derivative known as tris(2-benzimidazolylmethyl) amine, abbreviated as NTB, in 1977 [30]. NTB is a tripod organic linker prepared by the direct condensation of o-phenylenediamine with nitrilotriacetic acid. Owing to the similarity of NTB-Zn (II) complexes with carbonic anhydrase (CA), previously, NTB was used in preparing biomimicking agents for CA for CO2 hydration (CO2 to HCO3 ion conversion) [31] and also studied as a corrosion inhibitor [32]. To date, there have been no reported studies on the adsorptive removal of Hg2+ ions from aqueous solutions using NTB-modified MOFs. This study aimed to assess the efficacy of NTB-modified MIL-101(Cr) in eliminating Hg2+ ions from aqueous solutions. Moreover, we investigated the parameters influencing Hg2+ ions removal efficiencies, such as the effects of initial concentration, contact time, and adsorbent dosage. Additionally, the desorption of Hg2+ ions with ethylenediaminetetraacetic acid (EDTA) solution was studied, and its cyclic sorption ability was investigated.

2. Materials and Methods

2.1. Materials

Cr(NO3)3·9H2O (Extra pure, 98.0%), terephthalic acid (H2BDC) (Guaranteed reagent, 99.0%), dimethylformamide (DMF) (Special grade, 99.5%), CuCl2 (Extra pure, 99.0%), PbCl2 (Extra pure, 98.0%), HgCl2 (Special grade, 99.5%), NaOH (Extra pure, 98.0%), EDTA (Extra pure, 99.0%), and methanol (Extra pure, 99.5%) were purchased from Samchun Chemicals Ltd., South Korea. CdCl2 (For analysis, 99%) was purchased from Acros Organics. Nitriloacetic acid (NTA) (ACS reagent, 99.0%) and o-phenylenediamine (99.5%) were purchased from Sigma Aldrich.

2.2. Methods

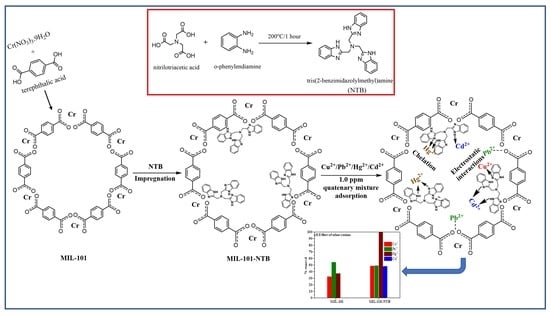
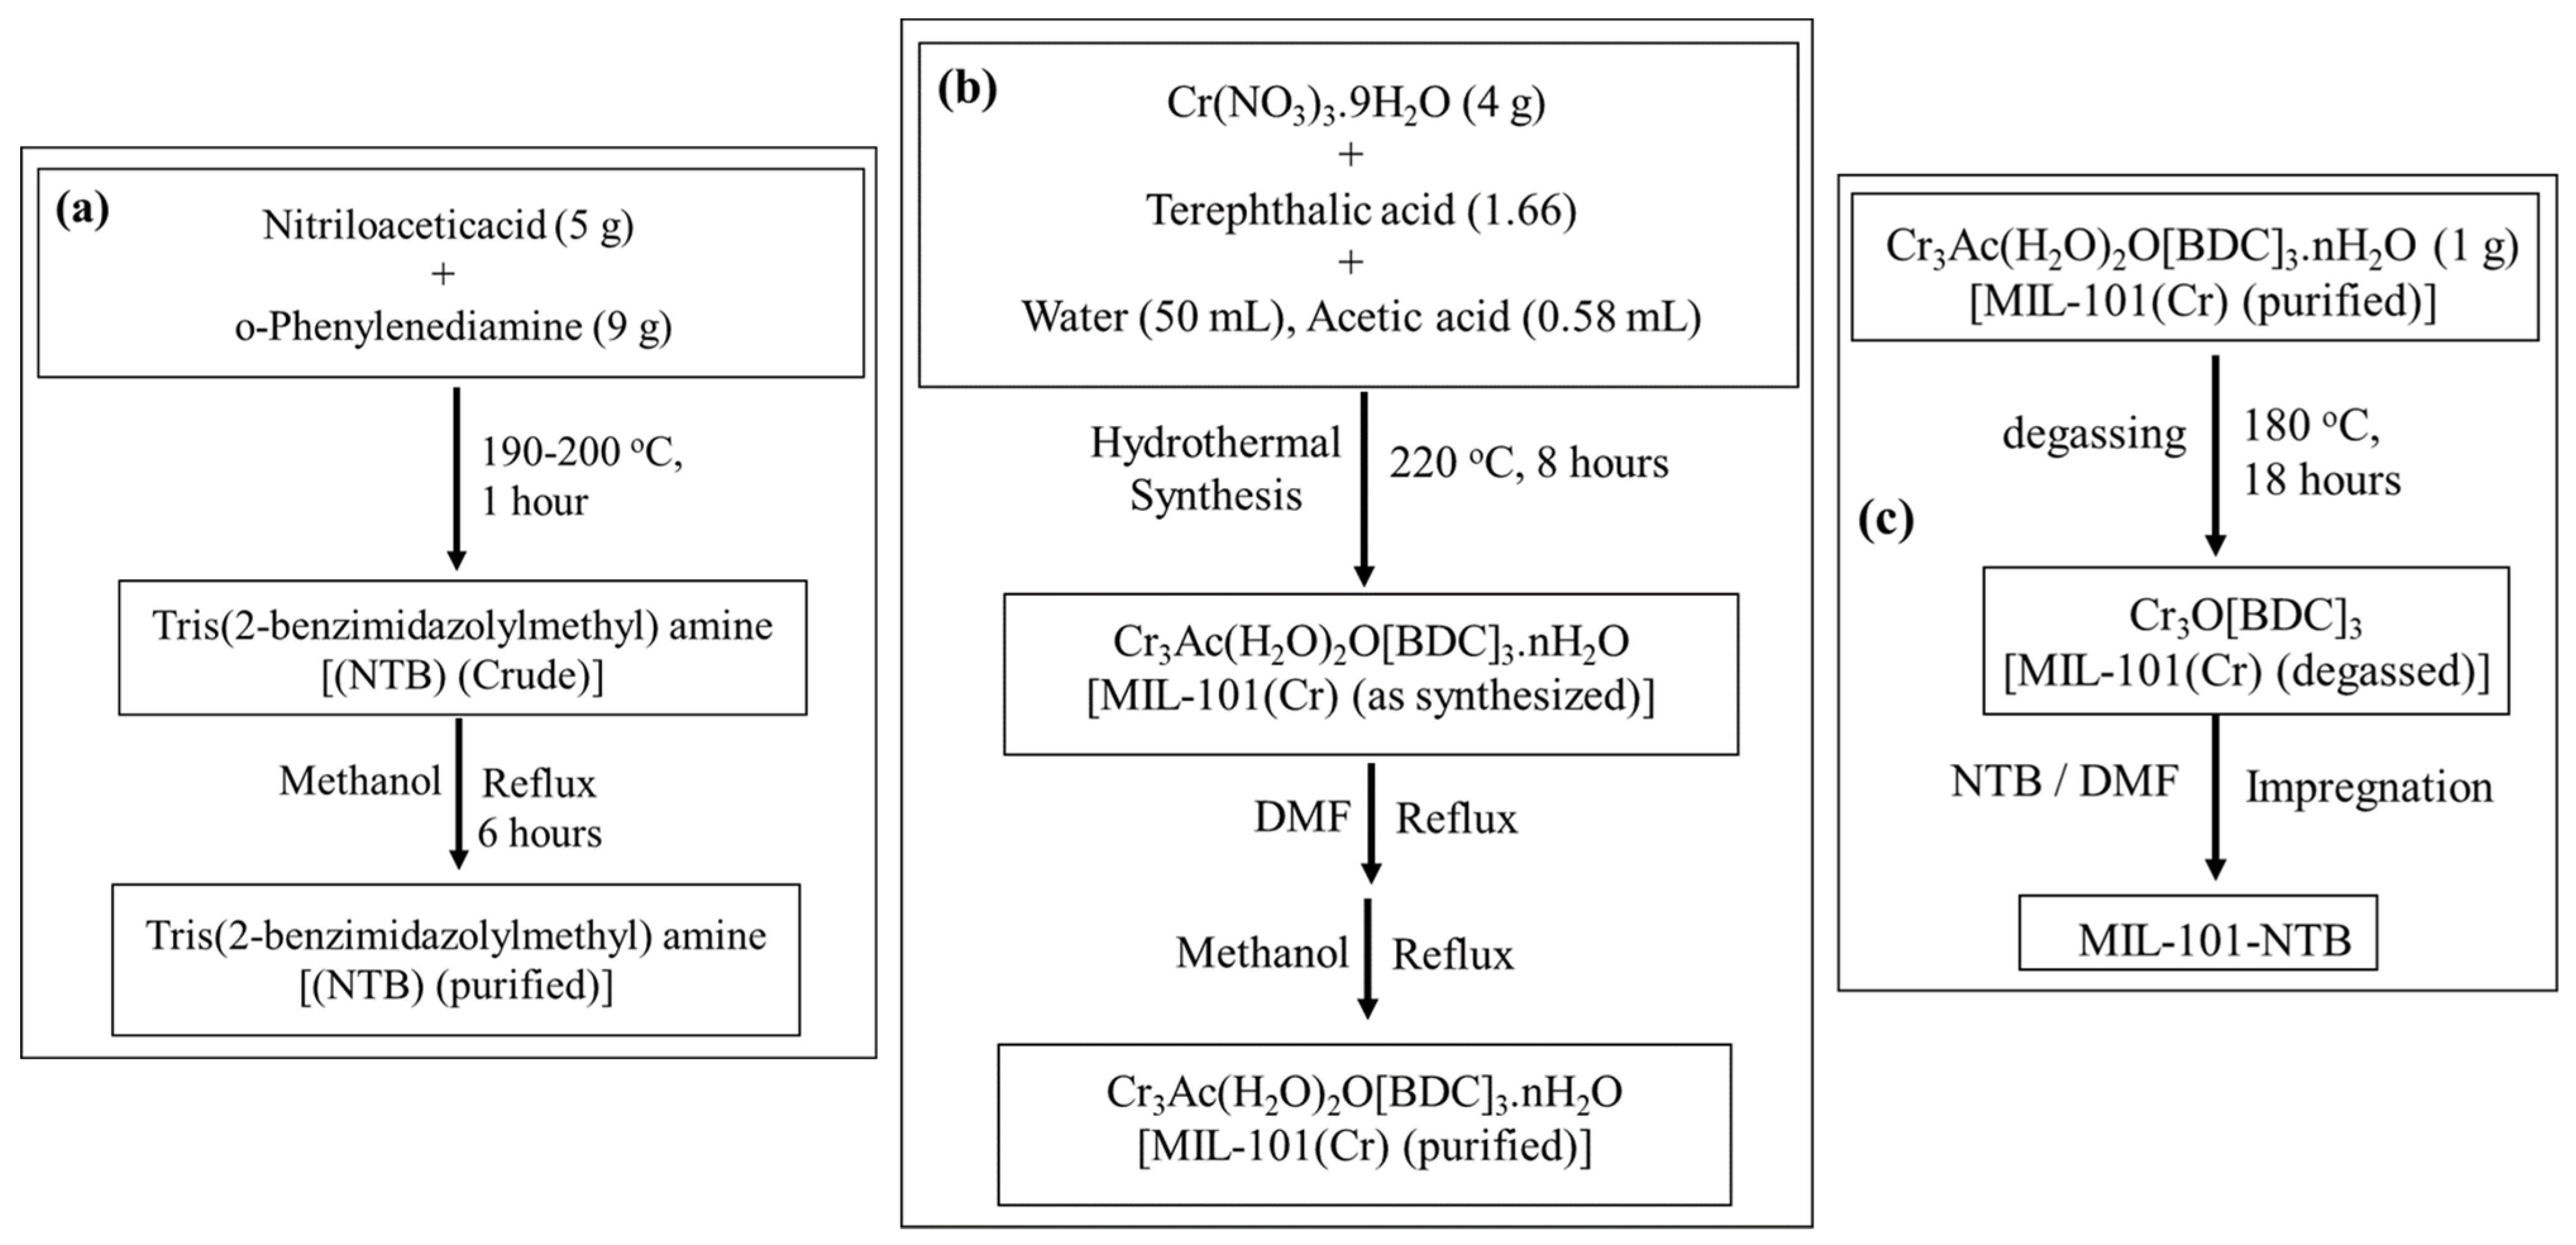
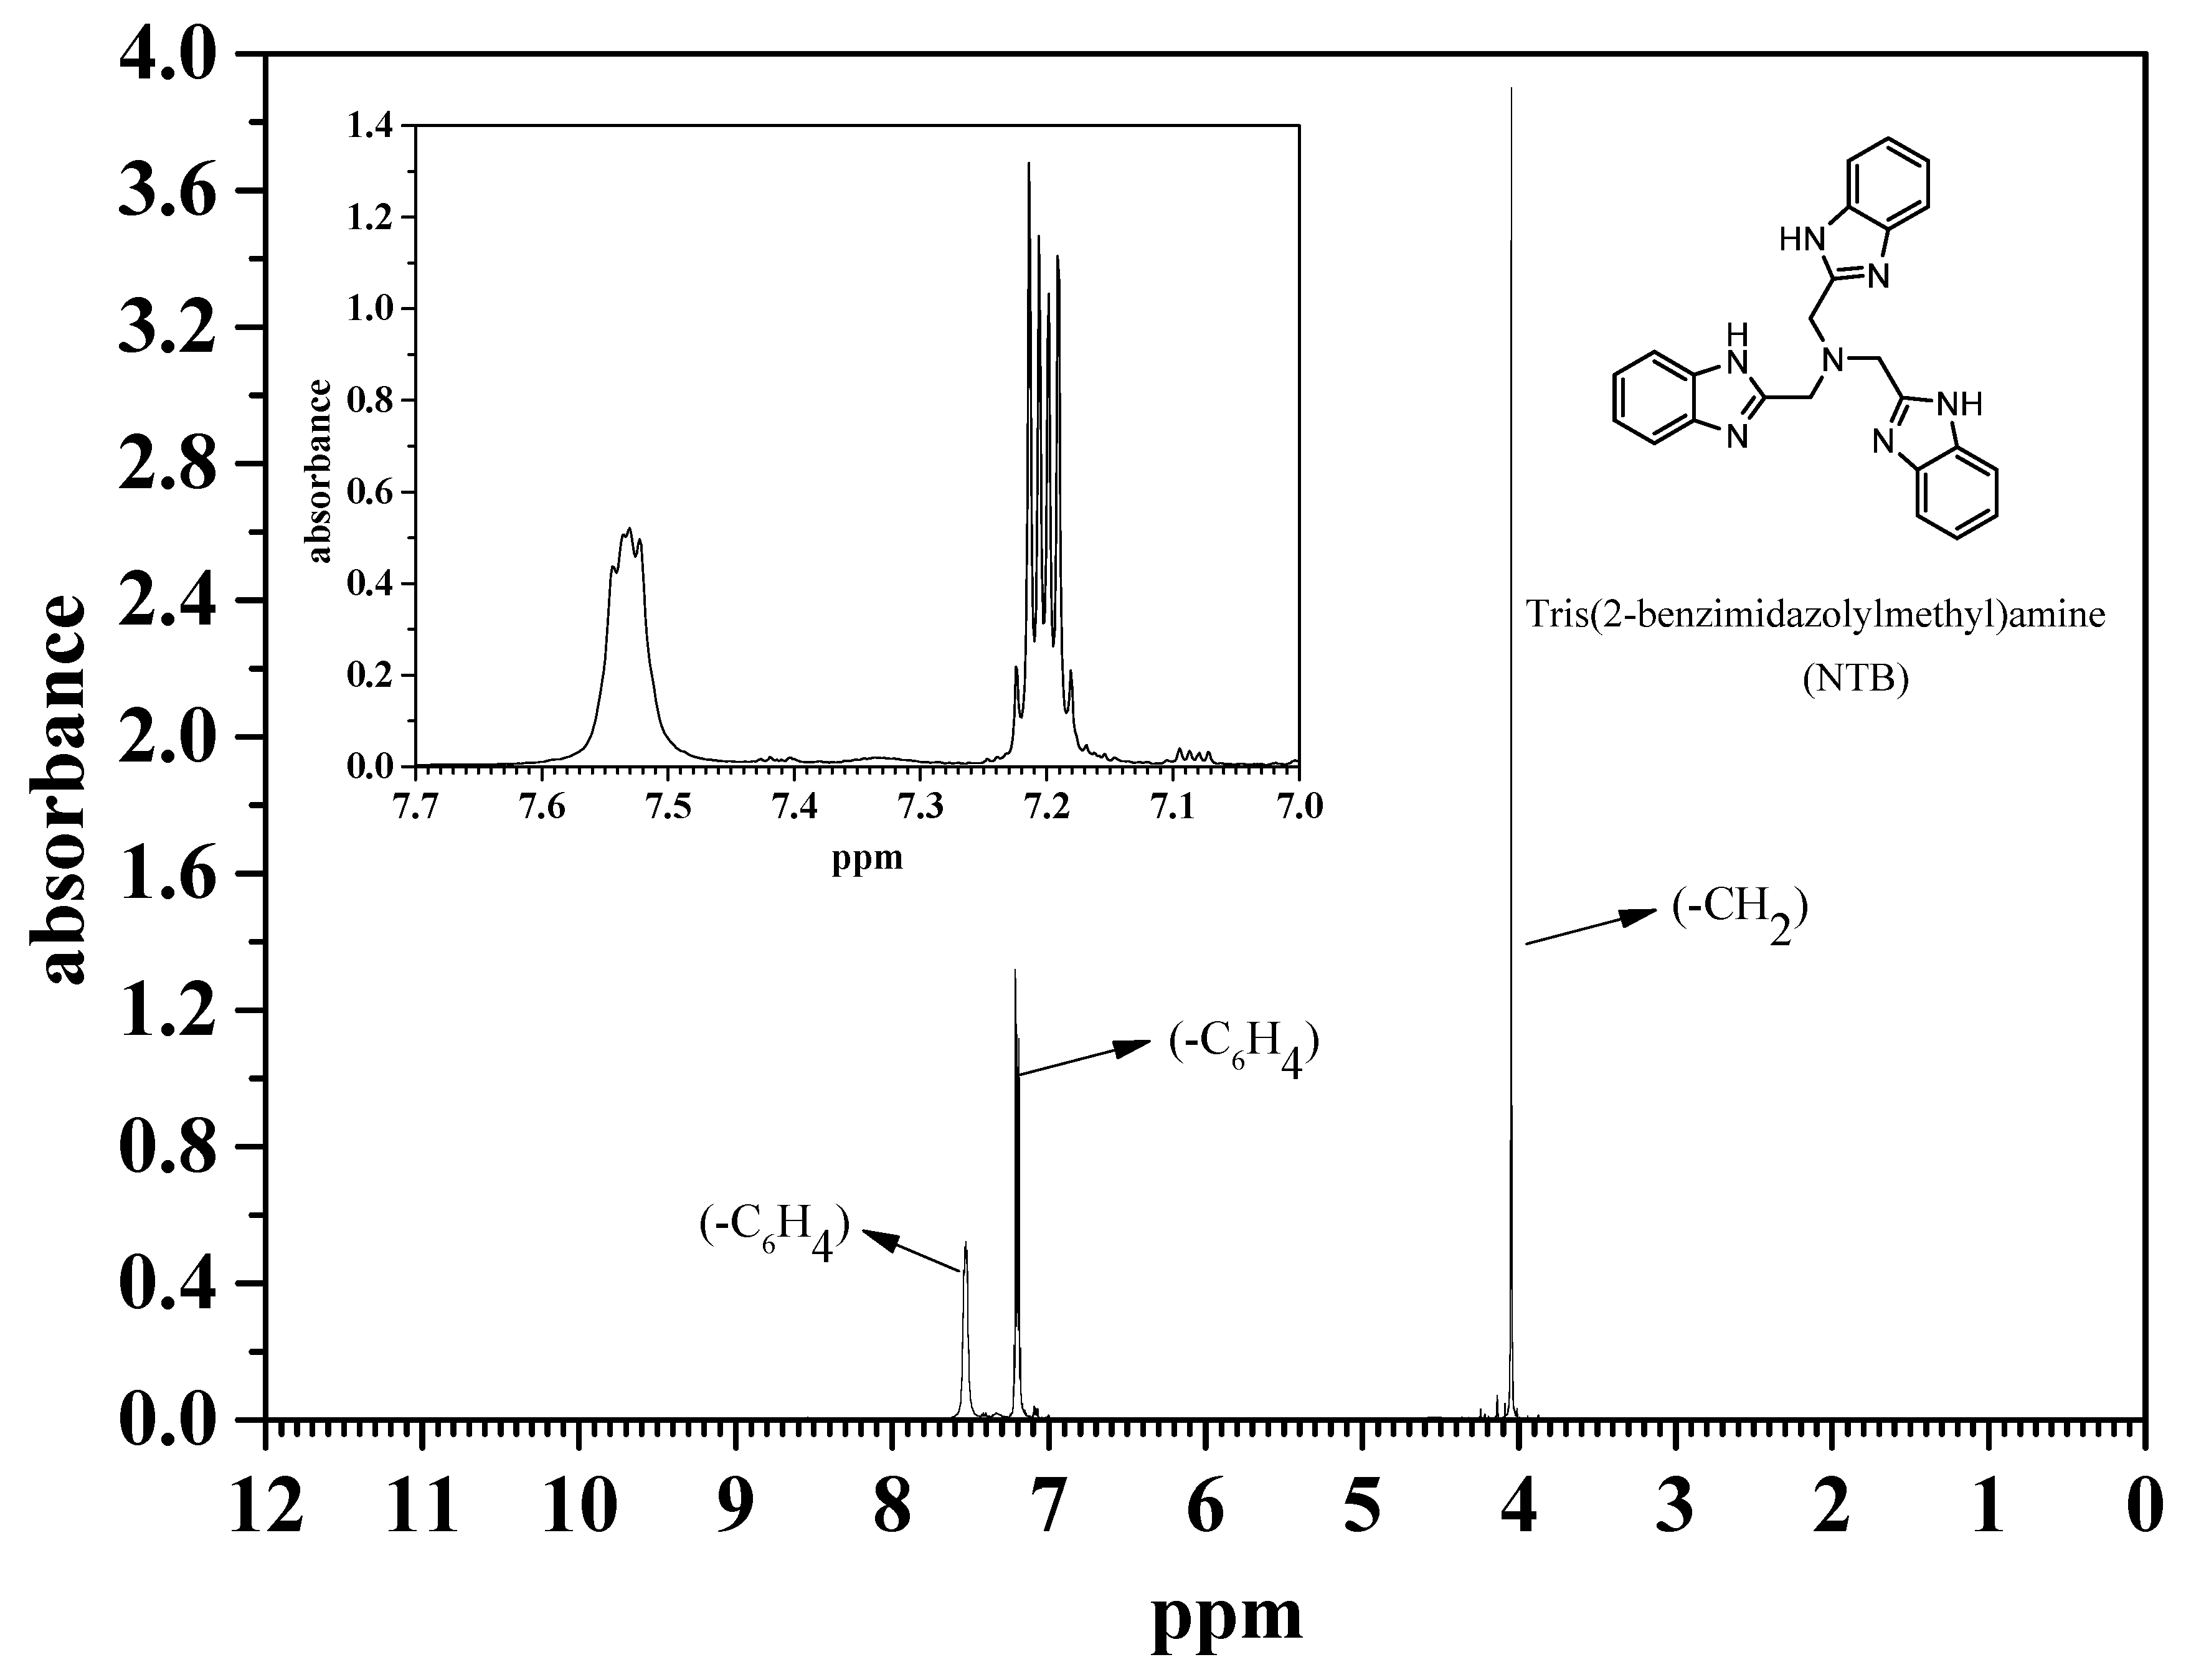
2.2.1. Preparation of Tris(2-benzimidazolylmethyl)amine (NTB)

First, 5 g NTA and 9 g o-phenylenediamine were mixed in a mortar to create a homogenous solid mixture. Next, the mixture was transferred into a 250 mL single-neck round-bottom flask and heated in an oil bath at 190–200 °C for 1 h. Afterward, the reaction mixture was cooled, crushed, and refluxed for 6 h in methanol which extracted NTB, and the unreacted NTA was left as a solid. After filtration and evaporation of methanol, a white-pink powder was obtained, which was washed with hot water four times to eliminate unreacted diamine. Lastly, the pinkish-white powder was dried overnight at 80 °C in an air oven and kept in glass vials for further analysis and reaction. A flowchart for the preparation of NTB is shown in Figure 1a.

2.2.2. Preparation of MIL-101(Cr)

The preparation and purification methods utilized in this study were adapted from a previous report [33], with minor adjustments made. In the initial step, a mixture containing 4 g of Cr(NO3)3·9H2O, 1.66 g of terephthalic acid, 50 mL of deionized water, and 0.58 mL of glacial acetic acid was thoroughly combined. This mixture was then placed in a 100 mL autoclave made of Teflon-lined stainless steel. Subsequently, the autoclave was subjected to an oven-drying process at a temperature of 220 °C for a duration of 8 h. Once the autoclave contents had reached the ambient temperature, they underwent a filtration process, followed by rinsing with distilled water. Subsequently, the filtered contents were subjected to overnight oven-drying at a temperature of 80 °C. Subsequently, a two-step solvent treatment was implemented to remove any remaining unreacted terephthalic acid present within the MIL-101 pores. The crude product was refluxed overnight in DMF, filtered while hot, and washed with DMF. The product was subjected to oven-drying at a temperature of 80 °C. Following this, the product was further refluxed for a duration of 8 h in methanol. The resulting mixture was then filtered while hot and subsequently washed with hot methanol and dried at 80 °C. Figure 1b depicts a flowchart illustrating the process of preparing MIL-101.

2.2.3. Preparation of MIL-101-NTB

First, 1 g MIL-101 was degassed at 180 °C for 18 h in an oven. After that, it was cooled to 80 °C and tightly packed. Next, 0.75 g of NTB was dissolved in 1.5 mL DMF, and the solution was impregnated into MIL-101. Lastly, the product was oven-dried at 85 °C for 2 h and vacuum-dried overnight at 150 °C. The color of the final product was changed from light green to light gray. This material was designated as MIL-101-NTB and a flowchart for the preparation of MIL-101-NTB is shown in Figure 1c.

2.3. Batch Adsorption Experiments and Adsorbent Regeneration

To prepare 1000 parts per million (ppm) stock solutions, CuCl2, HgCl2, PbCl2, and CdCl2 were dissolved in distilled water within a 1 L volumetric flask. The resulting solution was then diluted with deionized water until the desired volume was achieved. Subsequently, a series of 1 L solutions containing metal ions with varying initial concentrations ranging from 1 to 125 ppm were prepared through successive dilutions of the original stock solutions. Adsorption tests were conducted using 50 mL conical flasks that were fitted with a rubber septum. The experiment involved adding adsorbent to a 10 mL metal ion solution. The conical flask was then sealed with a rubber septum and placed on an open-air shaker (OS-4000, Jeio Tech, Republic of Korea) where it was shaken continuously at 150 rpm. This was performed to ensure adequate adsorption at an ambient temperature of 25 ± 2 °C. The suspension obtained was subjected to filtration using a disposable 0.45 µm syringe filter. The filtrate was then analyzed to determine the concentration of residual metal ions. Following the Hg2+ single-ion adsorption experiment, MIL-101-NTB underwent a 30-min treatment with a 5 mL/0.2 M EDTA solution to evaluate the desorption of Hg2+ ions and the regeneration of MIL-101-NTB. Five consecutive cycles of cyclic sorption experiments were performed.
The heavy metal ion (%) removal was calculated by the following equation:
%   R e m o v a l = ( C o C e ) C o × 100
The heavy metal ion removal capacity at equilibrium was calculated by the following equation:
R e m o v a l   C a p a c i t y   m g g = C o C e × V m      
where Co and Ce are the initial and equilibrium concentrations in mg/L of heavy metal ions, V is the volume of solution in liters, and m is the mass of adsorbent in grams.

2.4. Instrumentation

The PHILIPS X’pert MPD diffractometer was utilized to collect powder X-ray diffraction (PXRD) patterns at room temperature. The diffraction was performed using Cu Kα1 radiation with a wavelength of 1.54056 Å. The angle range for data collection was set from 2θ = 5° to 20°, and the scan speed was set at 0.1 °/s. The thermal stability of the samples was assessed using a thermogravimetric analyzer (TGA, NETZSCH STA 449 F5 Jupitor). The measurements were conducted under an argon atmosphere, with a temperature range of 30−600 °C and a heating rate of 5 °C/min. The Fourier transform infrared (FTIR) spectra were recorded using a Shimadzu IRSpirit spectrometer with a resolution of 1.0 cm−1. The spectra were obtained in the wavelength range of 400–4000 cm−1 at ambient temperature.
The surface morphology of the samples was analyzed using a field emission scanning electron microscope (FE-SEM) model JSM-7100F, Jeol. Simultaneously, elemental mapping images were obtained by coupling energy dispersive X-ray spectroscopy (EDS) with the FE-SEM instrument. The elemental (CHN) analysis was conducted using a Thermo Scientific FLASH 2000 instrument. The N2 sorption isotherms were determined by conducting measurements at −196.15 °C and pressures up to 1 bar. These measurements were carried out using a static volumetric gas adsorption system (BELSORP-max, MicrotracBEL Corp., Japan). The BET equation, Barrett–Joyner–Halenda (BJH) desorption, and single-point adsorption methods were employed to determine the BET surface area, pore volume, and pore diameter, respectively. In addition, the pore size distribution (PSD) curve was calculated using the non-local density functional theory (NLDFT) model. This calculation was performed using the BElSimTM software integrated within the BELSORP-max system.
The surface elemental composition was analyzed using a K-Alpha X-ray photoelectron spectrometer (Thermo Fisher Scientific, UK). Wide Survey (full range) and high-resolution spectra were acquired before and after heavy metal adsorption. The experimental data of the high-resolution C1s and N1s spectra were deconvoluted into separate peaks using Origin Pro 9.0 software. Before SEM-EDS and X-ray photoelectron spectroscopy (XPS) analyses, the heavy metal-adsorbed samples were oven-dried at 80 °C overnight. Inductively coupled plasma atomic emission spectrometry (ICP-AES, Agilent 7800 Quadrupole) was used to quantify the concentration of residual HMIs in the aqueous solution.

3. Results and Discussion

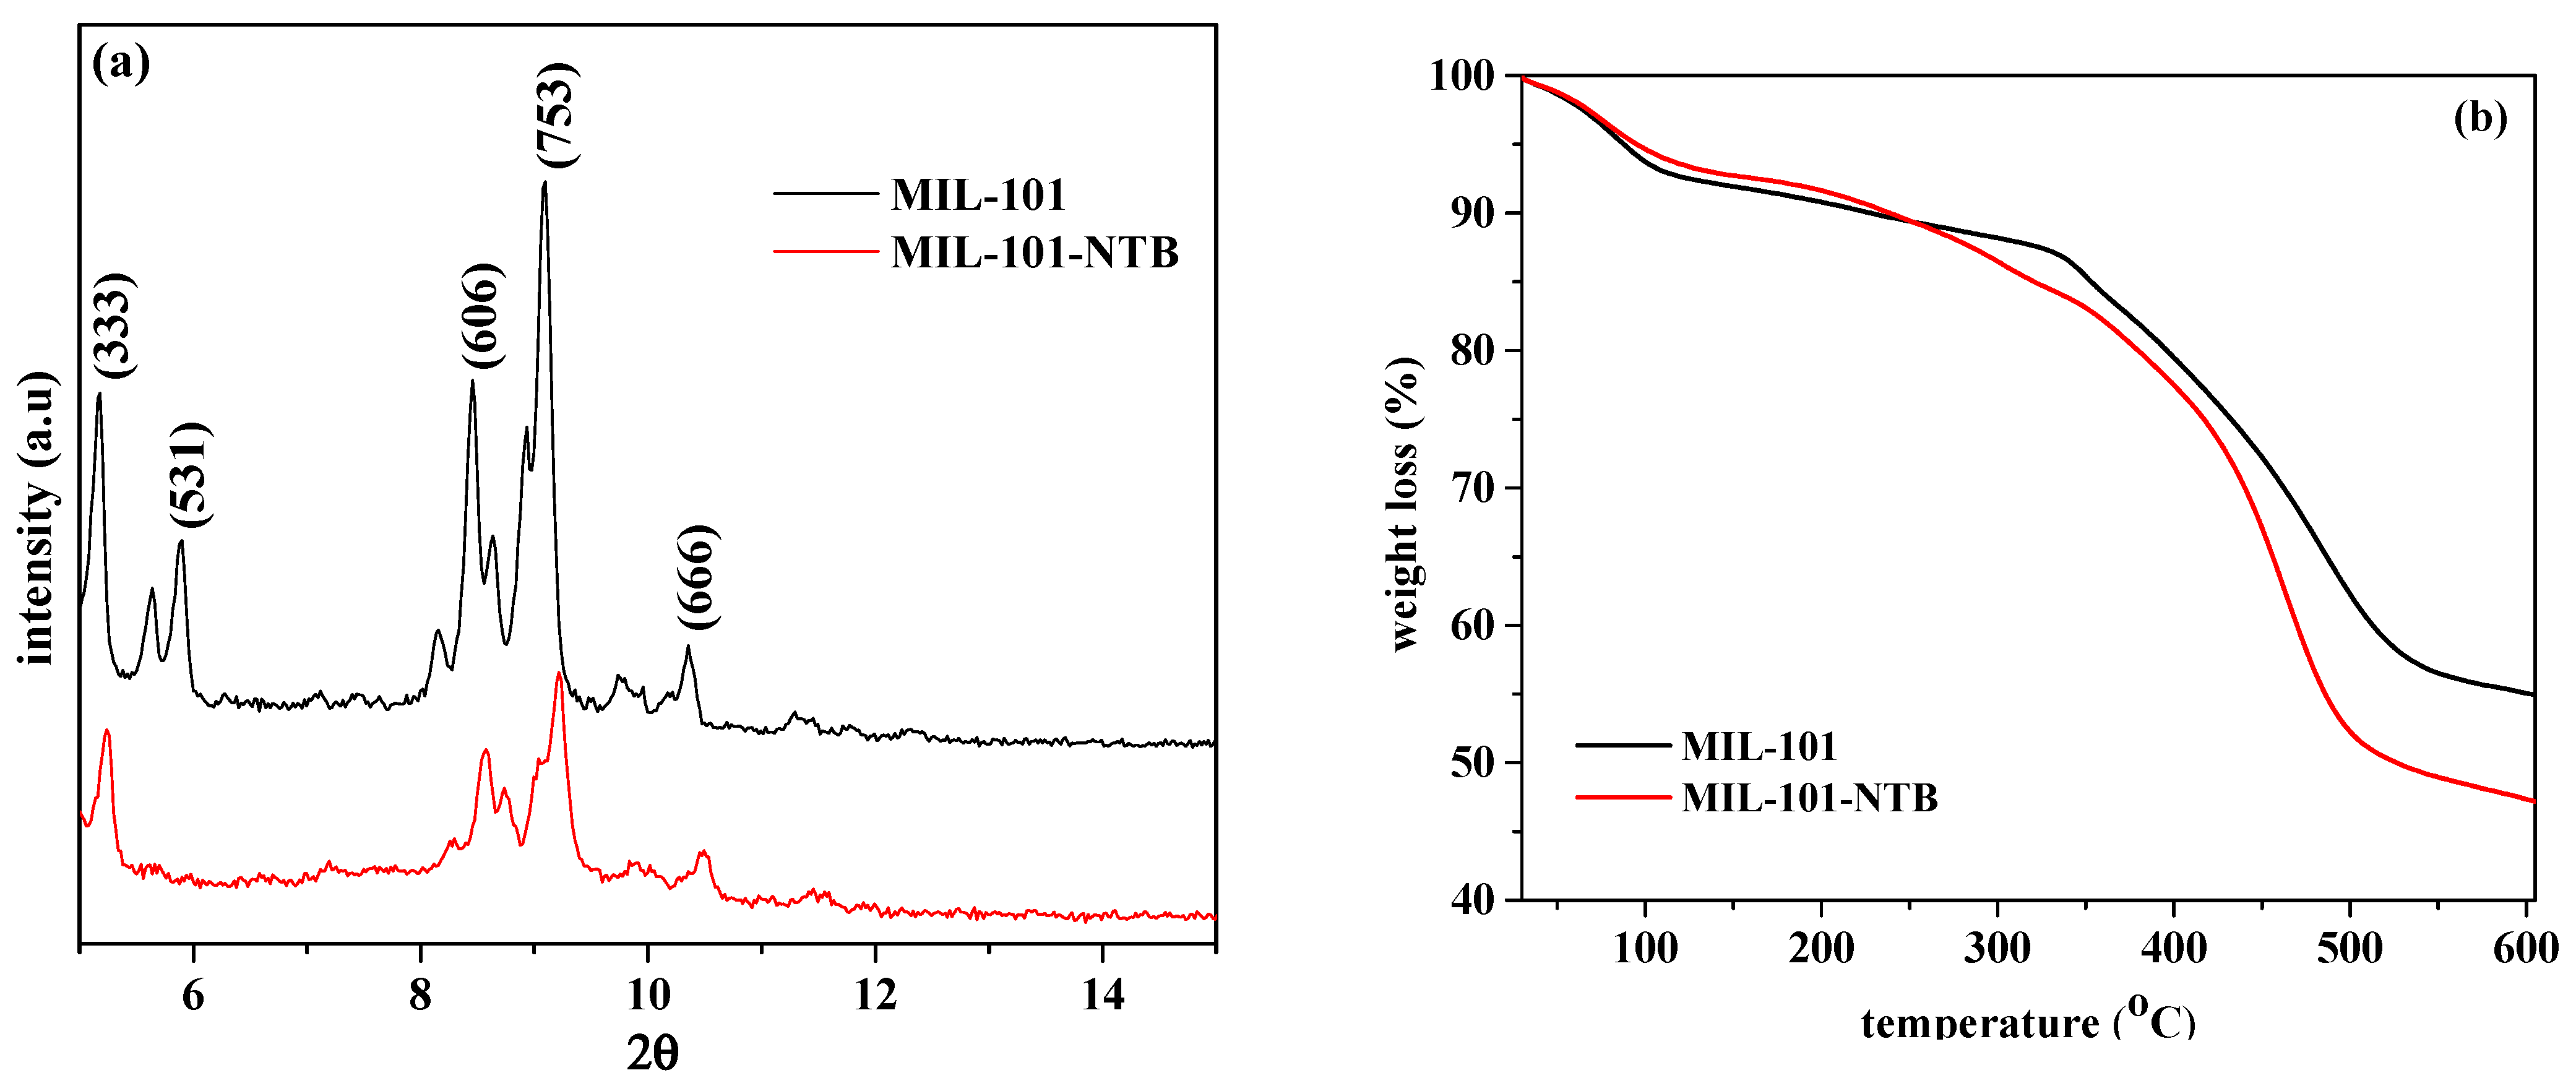
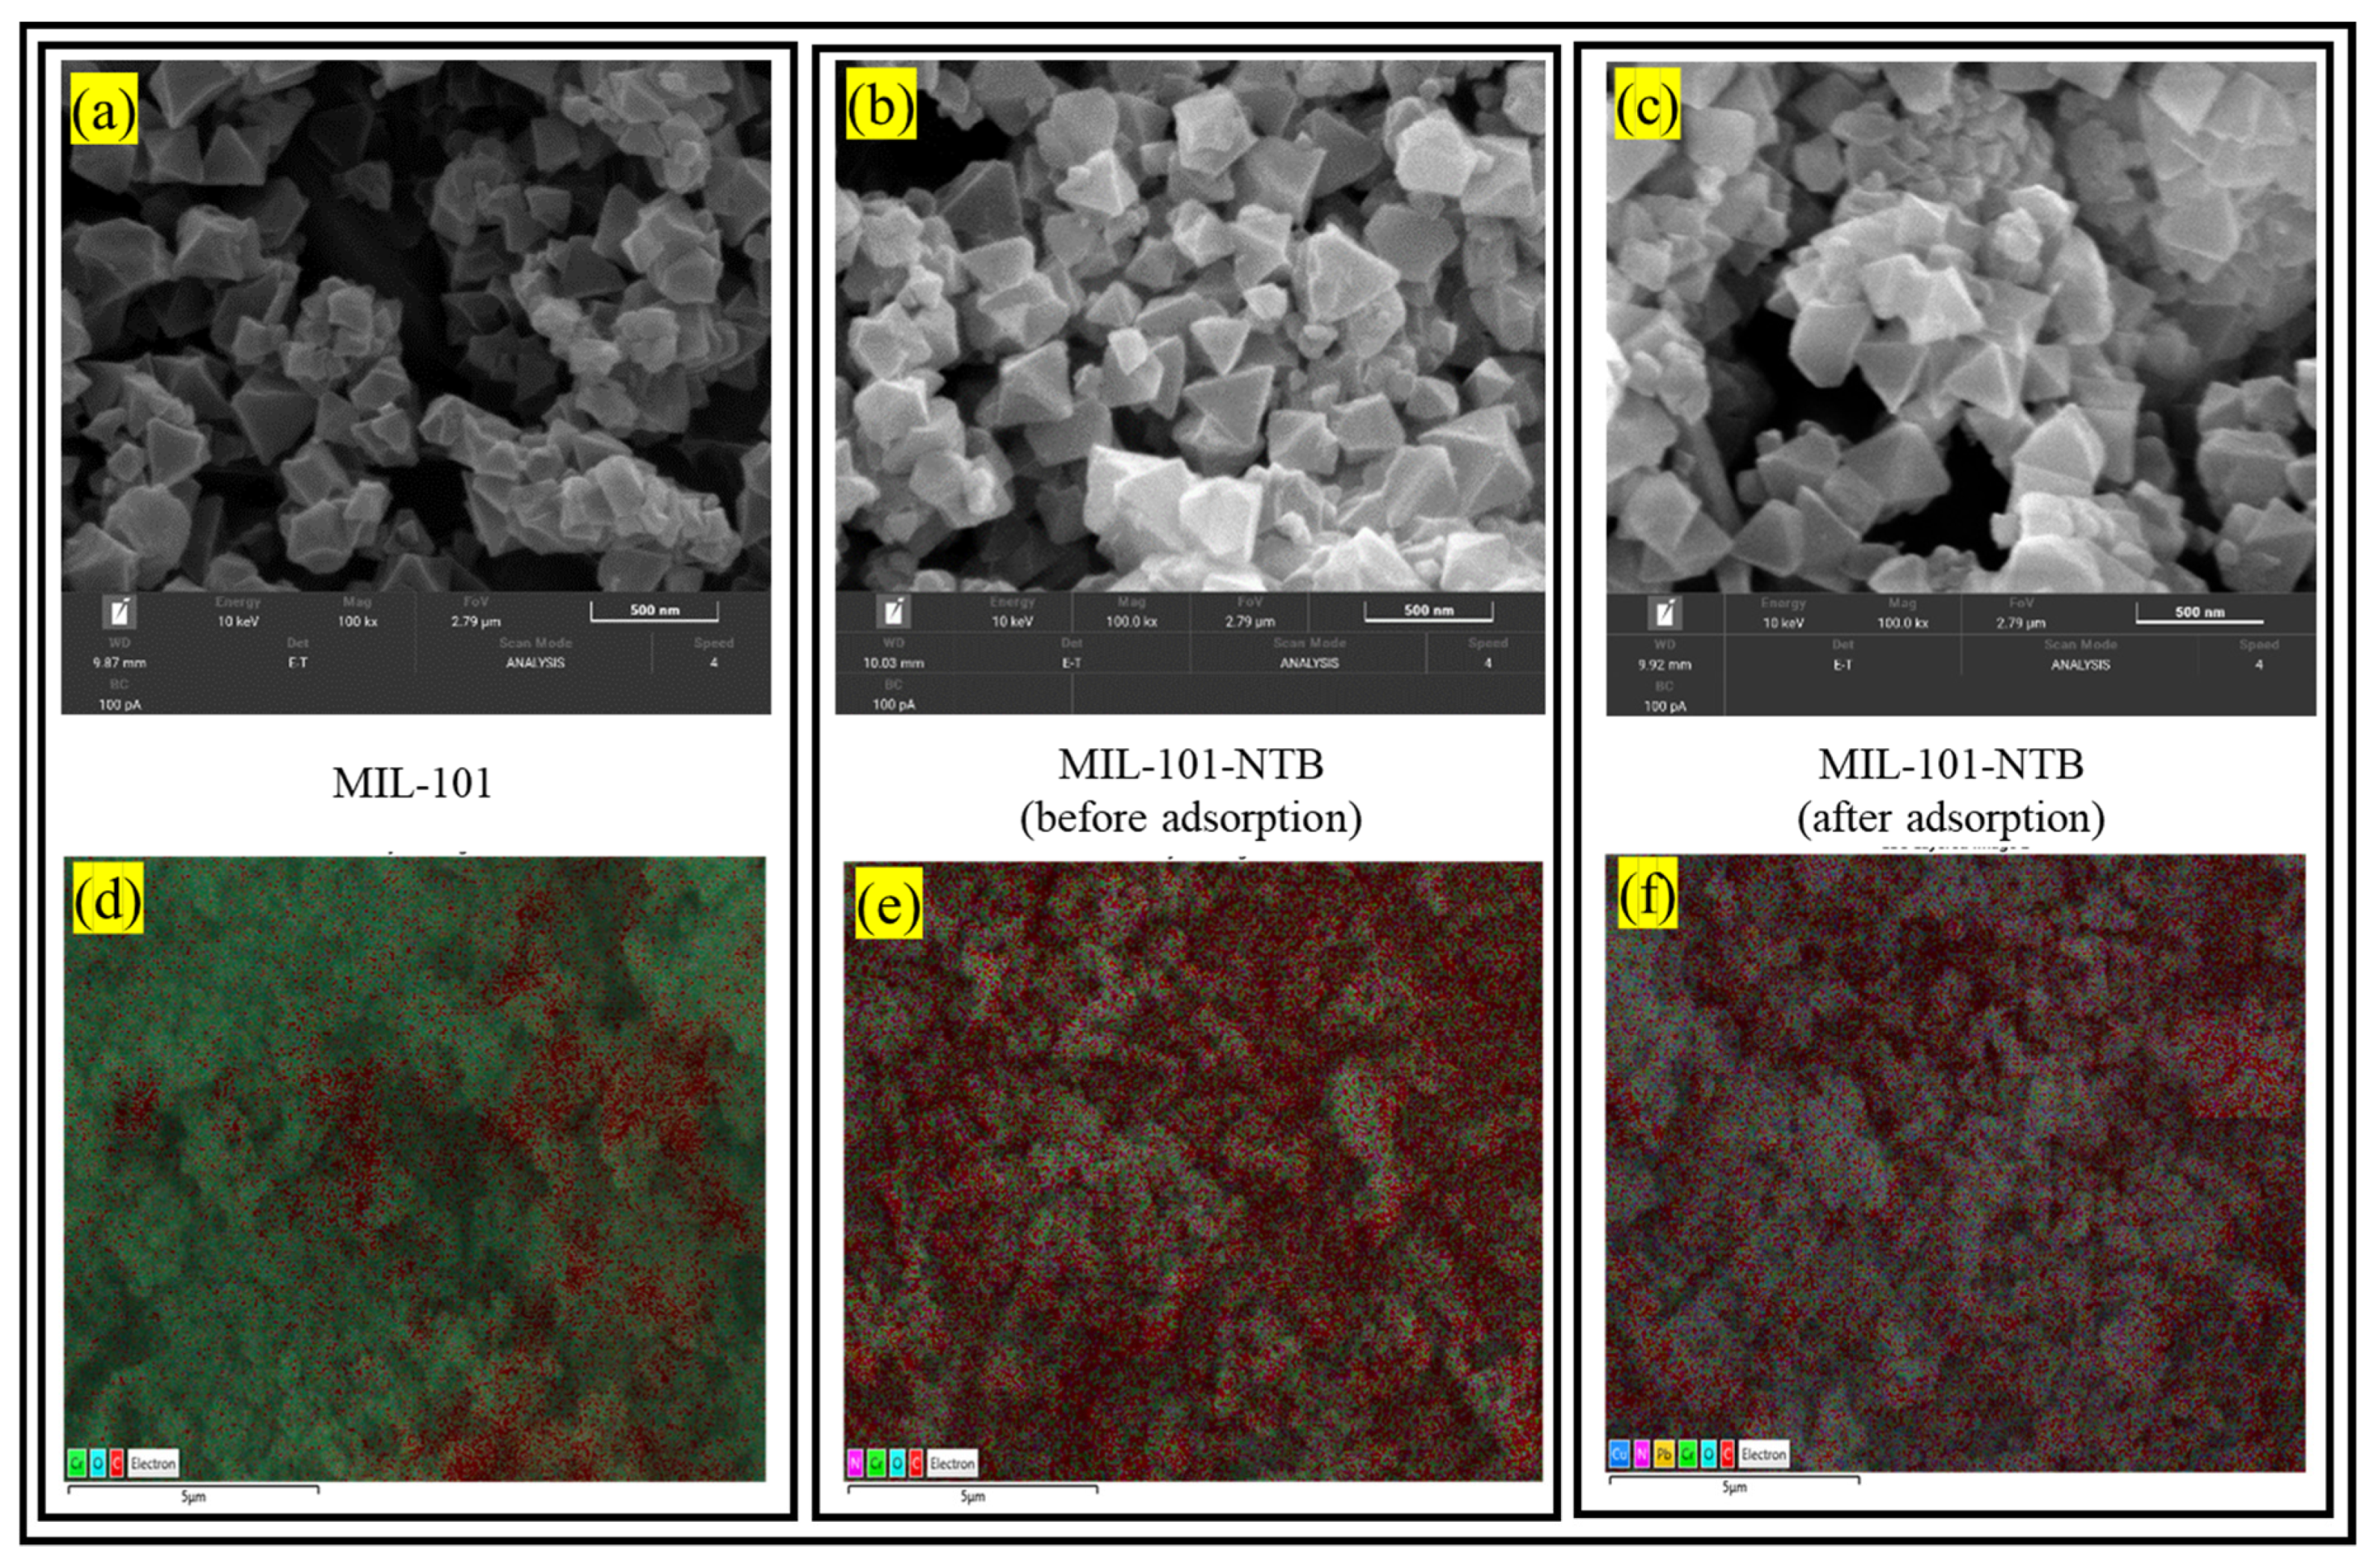
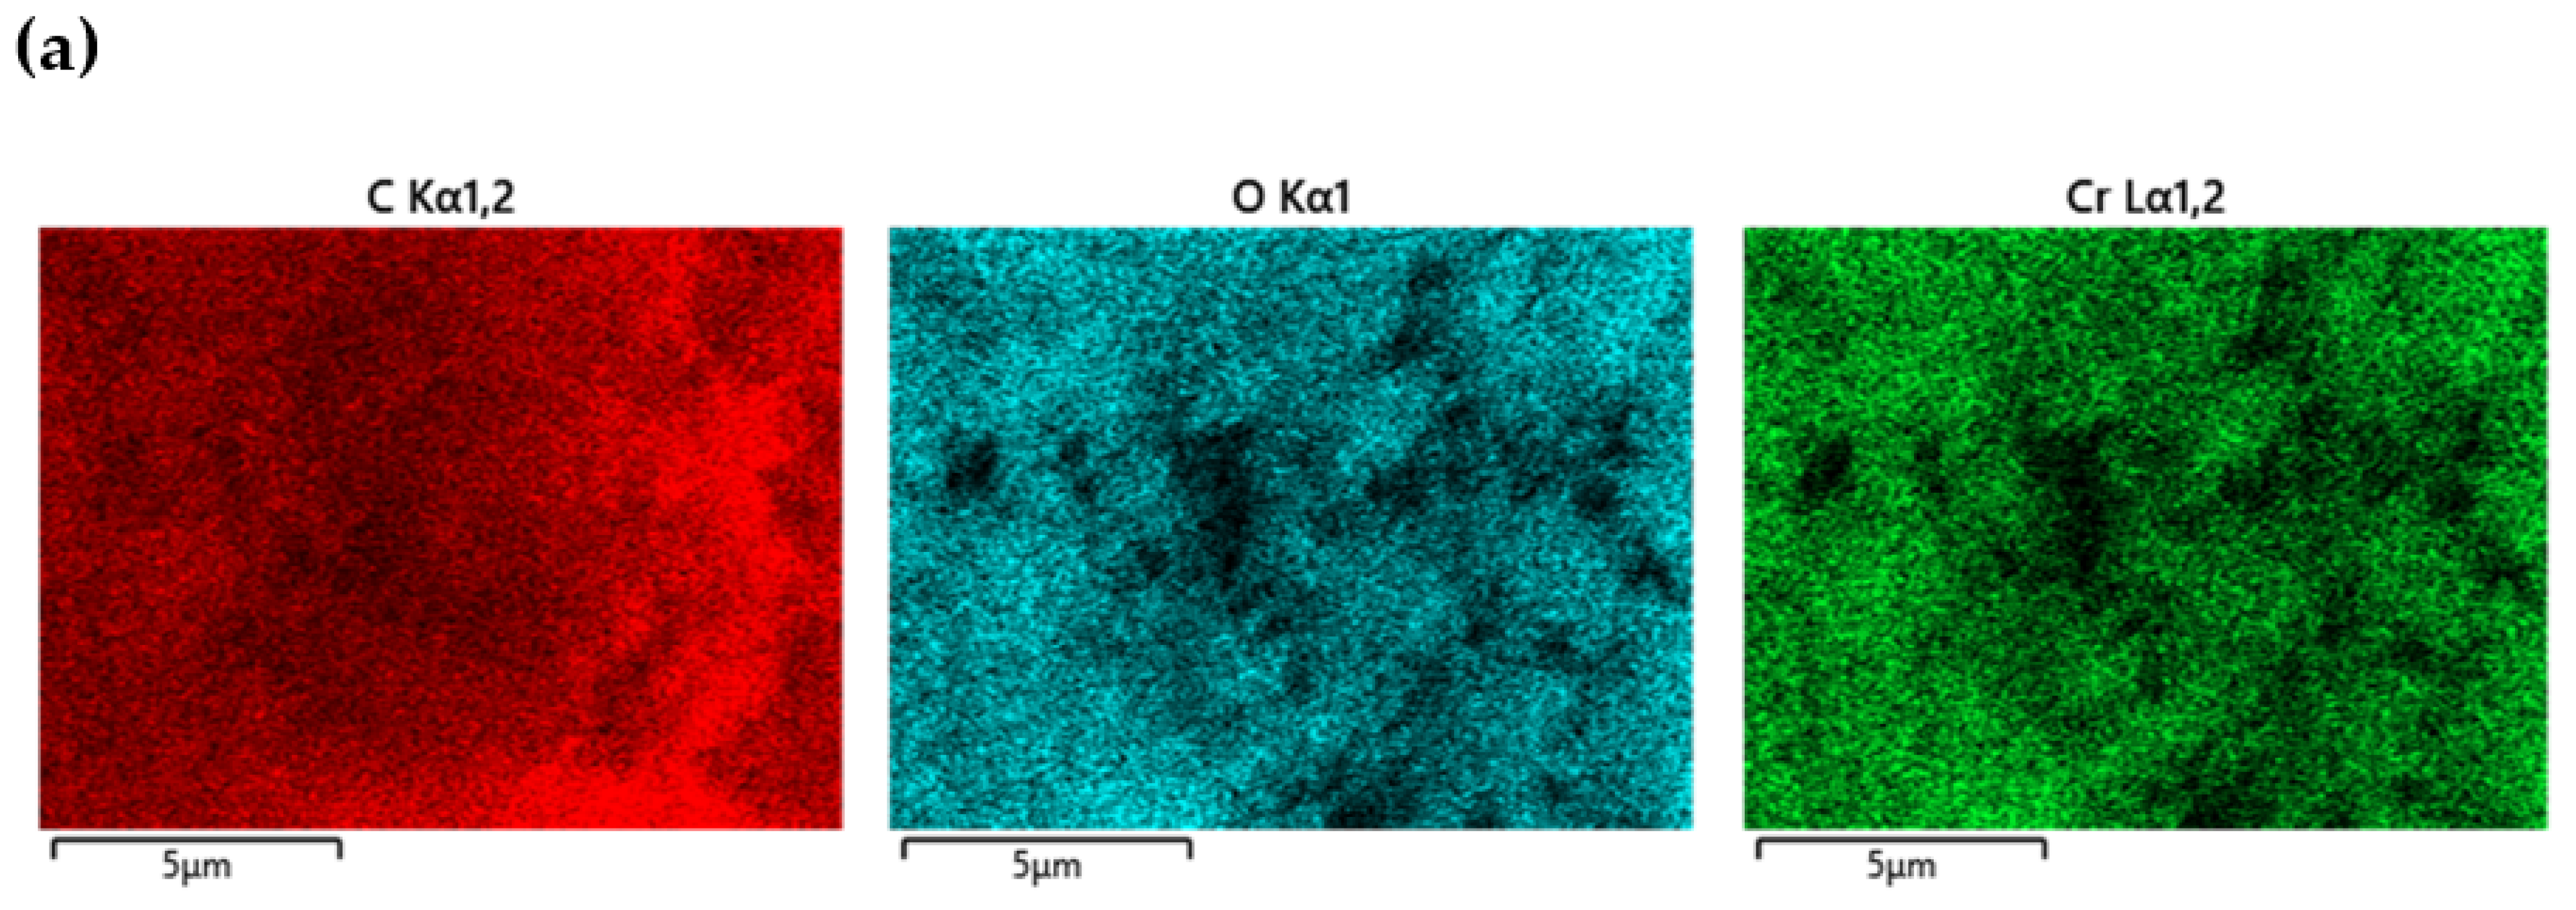
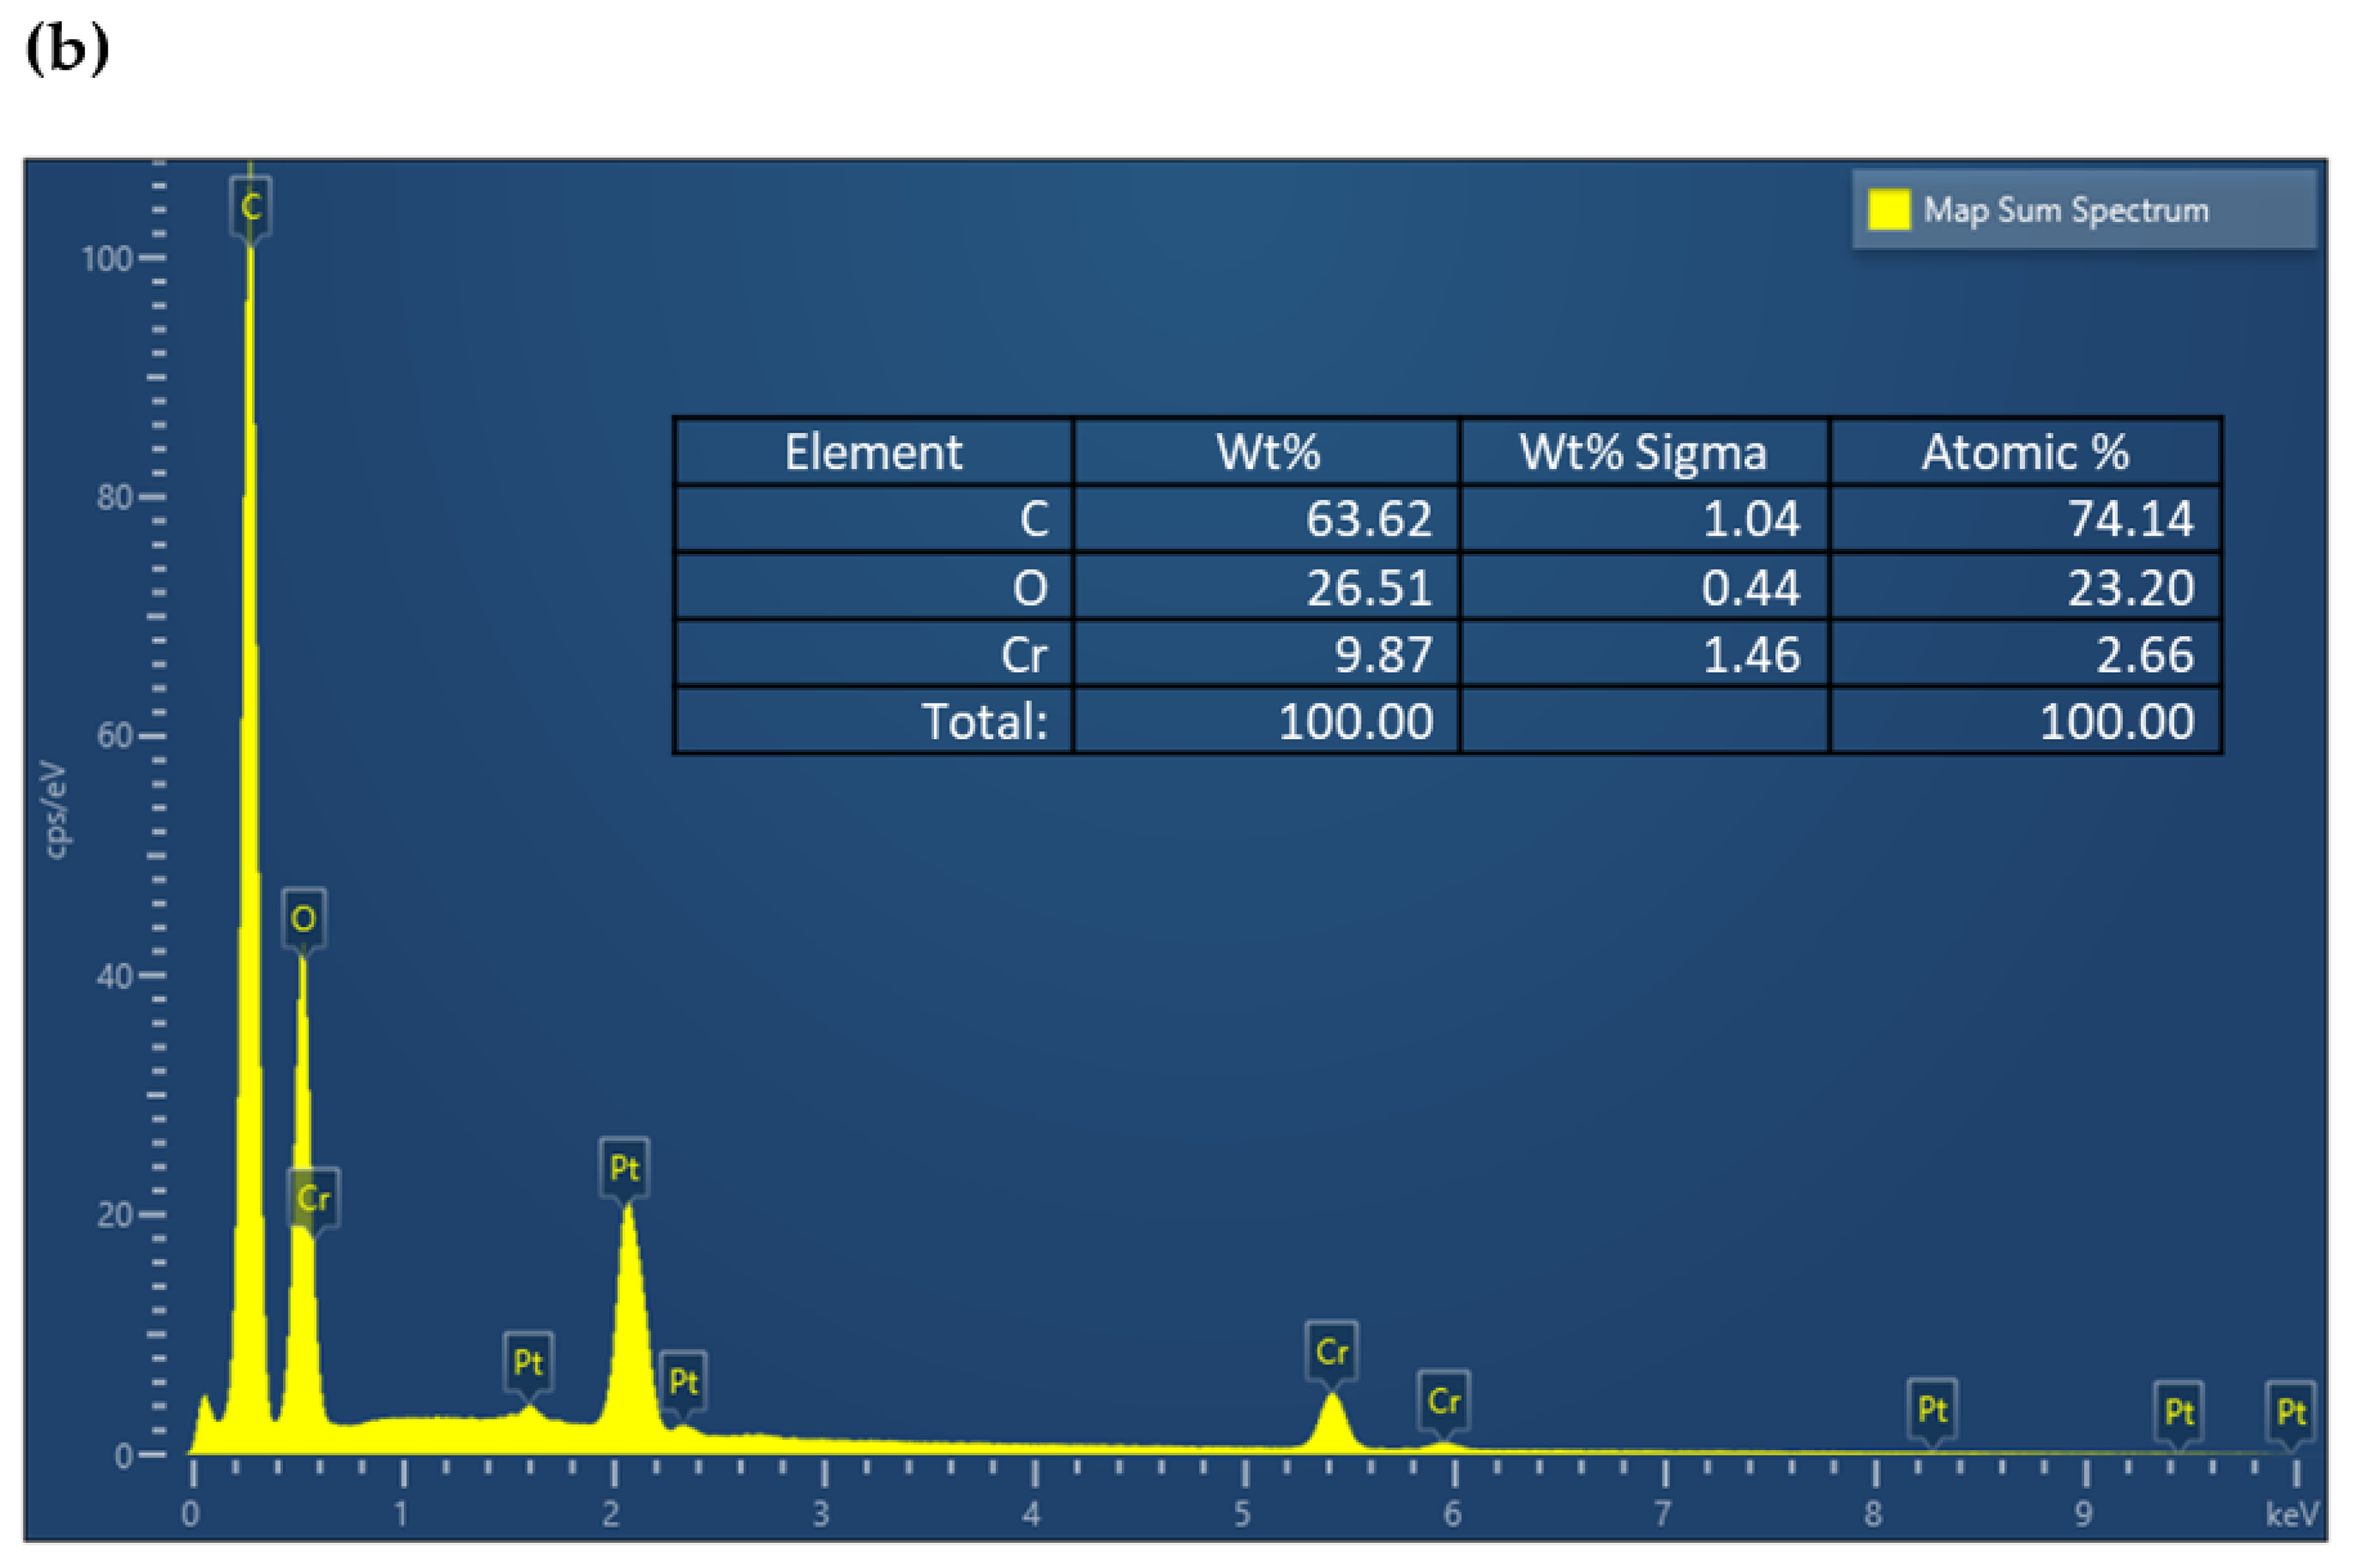
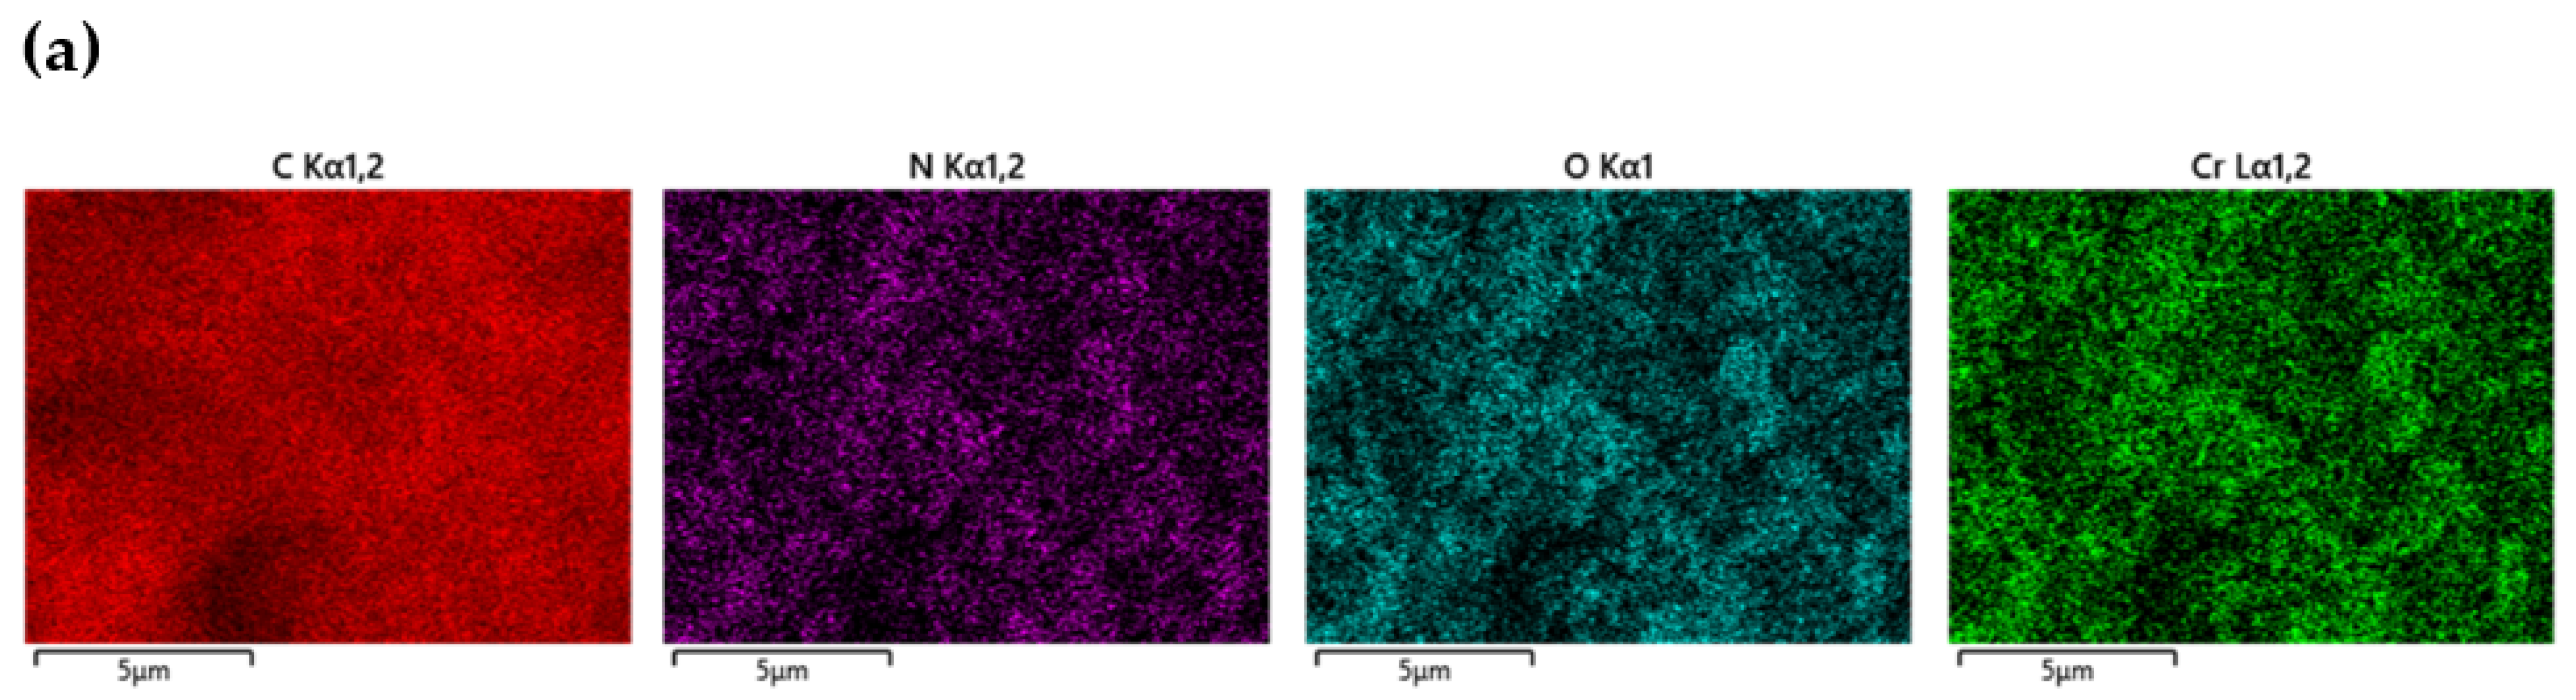
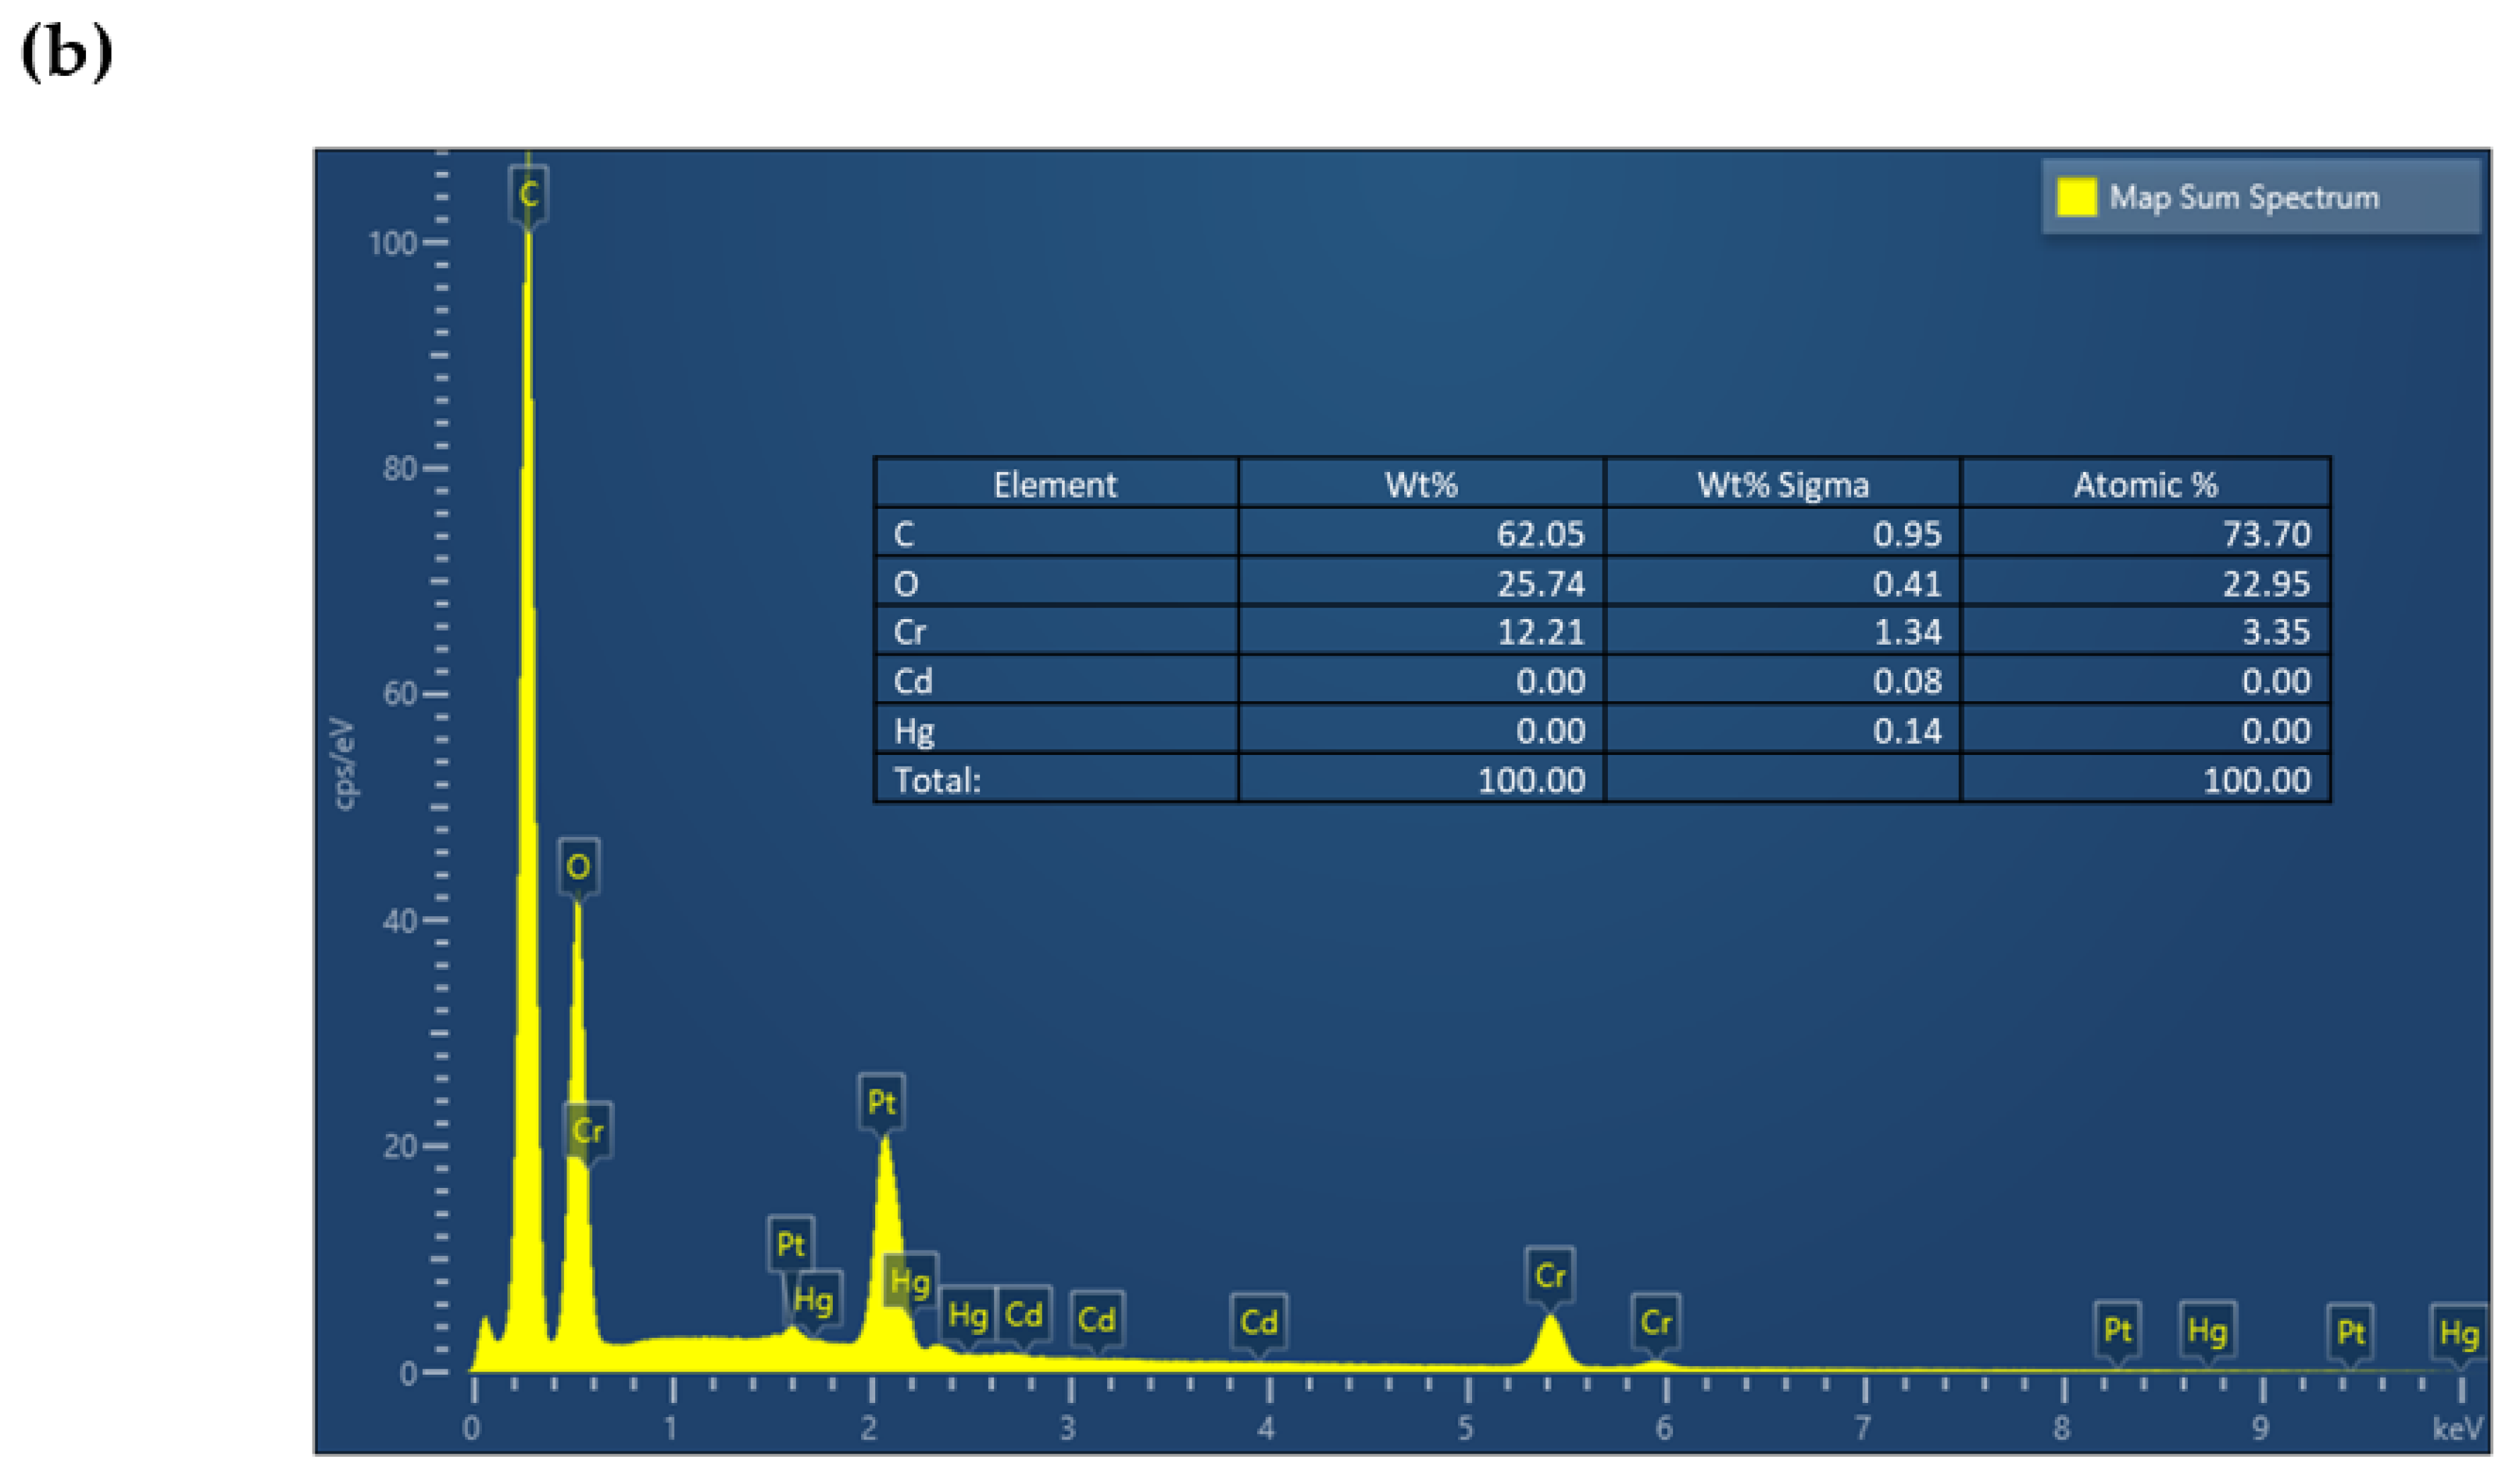
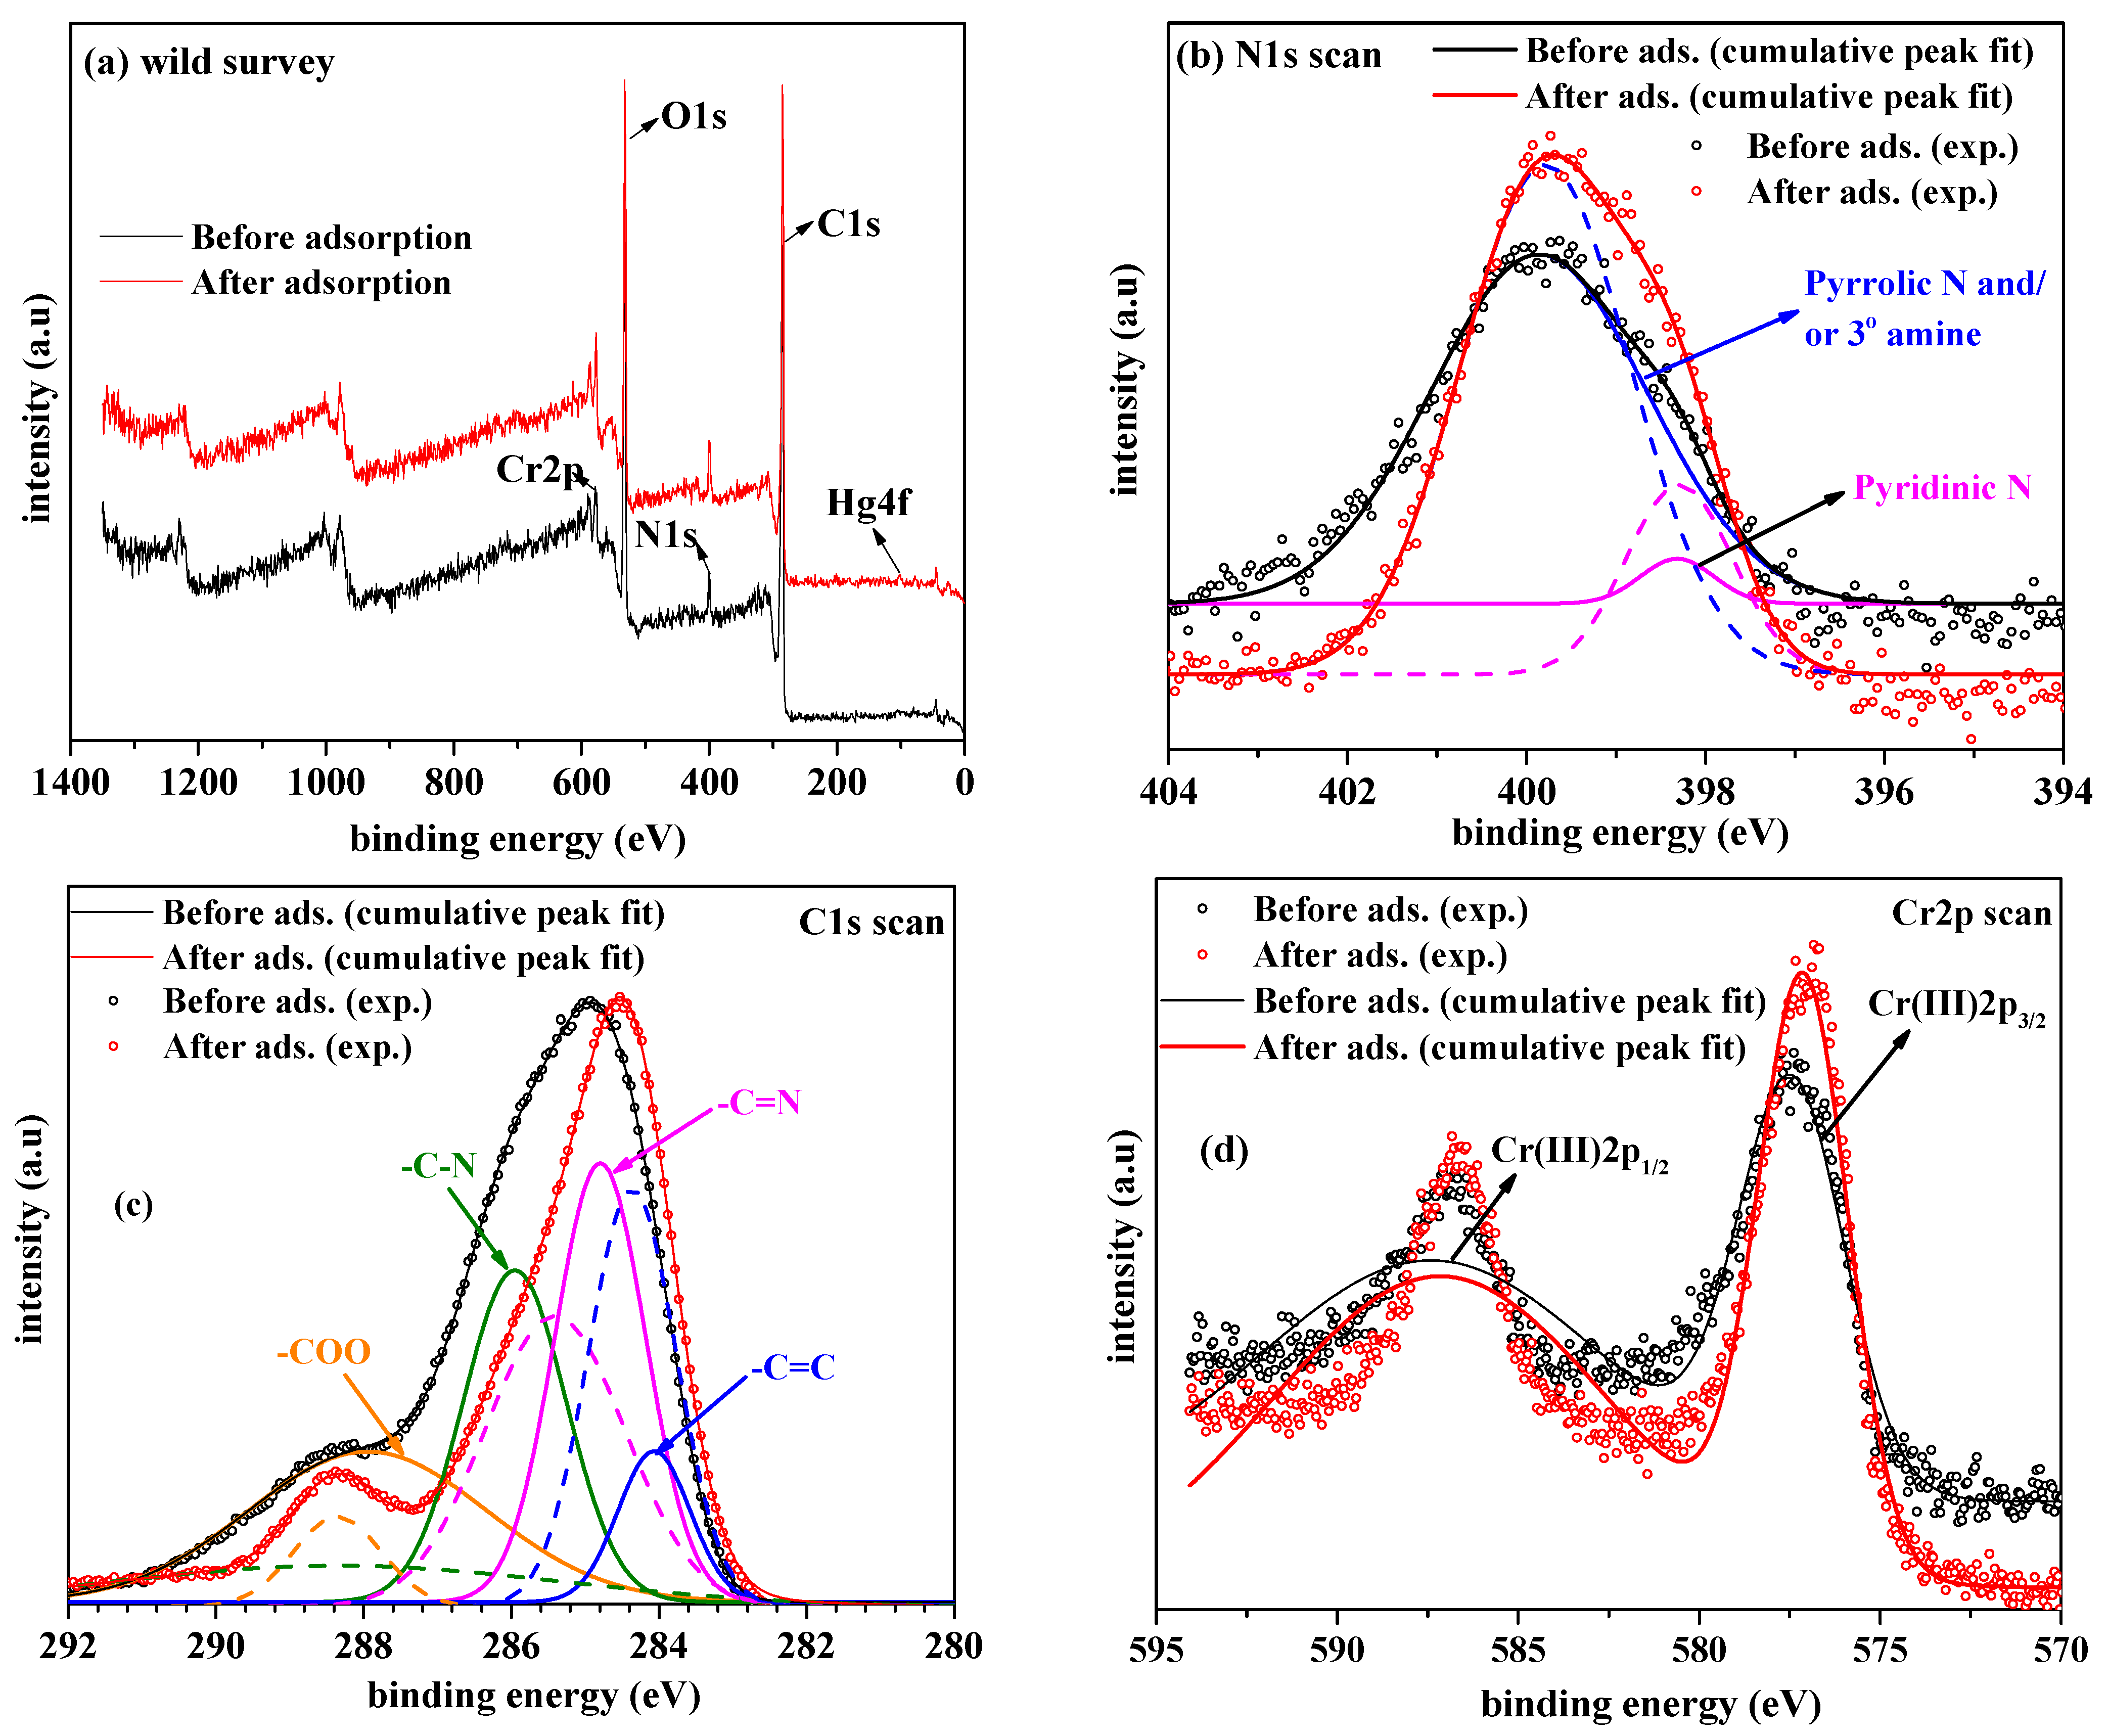
3.1. Characterization

1H NMR spectroscopy, FT-IR spectroscopy, PXRD analysis, CHN analysis, porosity measurements, FE-SEM, SEM-EDS analysis, and TGA analysis were used to characterize the synthesized materials. The formation of the NTB linker was confirmed using 1H NMR analysis, and the resulting spectrum is shown in Figure 2. Chemical shifts were observed at 4.07 (s 6H CH2), 7.21 (m 6H C6H4), and 7.53 ppm (m 6H C6H4). The analysis was performed in CD3OD solvent, and the NMR results were consistent with a previous study [31]. Notably, NTB was sparingly soluble in CD3OD. Consequently, no peaks were observed in the recorded 1H NMR spectra even though chemical shifts owing to hydrogen atoms in the imidazole moiety should occur at 12.1 (-NH) and 8.5 ppm (-CH) in the spectrum.
Figure 3a shows the PXRD spectra of MIL-101 and MIL-101-NTB. The MIL-101 diffraction peaks corresponding to reflection planes are indexed, and the peak positions are consistent with previous findings [34]. MIL-101-NTB exhibited PXRD diffraction patterns identical to those of MIL-101, indicating that NTB impregnation did not affect the structure of MIL-101. After impregnation, the PXRD peak intensities decreased owing to scattering from the NTB. Furthermore, the compression of the MIL-101 lattice following the grafting of amine molecules caused the rightward shift and broadening of the peaks. A similar peak shift was observed in the previous reports [35].
Figure 3b shows the TGA results for MIL-101 and MIL-101-NTB. Notably, 4.04 and 4.06 mg of MIL-101 and MIL-101-NTB samples were analyzed, respectively. The TGA result for MIL-101 was consistent with previous reports [34,36] and revealed considerable weight loss across three temperature ranges. Initially, a weight loss of 8.57% was noted between 30–100 °C, associated with the evaporation of moisture and other atmospheric gases on the adsorbent’s surface. In the second step, 3.82% weight loss was observed between 100–320 °C due to the loss of coordinated water molecules/OH groups bound to the MIL-101 framework. In the third step, 32.86% weight loss was observed between 320–550 °C, ascribed to the disintegration of the MOF framework. Moreover, the MIL-101-NTB TGA plot showed three significant weight losses in three temperature regions: initially, a 7.11% weight loss was observed between 30–100 °C, which was related to the loss of atmospheric gases. In the second step, 8.83% weight loss was observed between 150–338 °C due to the loss of trace DMF (boiling point: 146 °C) and NTB molecules (melting point: 271 °C). In the third step, 37.09% weight loss was observed between 338–550 °C, ascribed to the decomposition of the MOF framework. The TGA plot of MIL-NTB (Figure 3b) reveals that it was stable up to 150 °C.
Figure 3c depicts the FTIR spectra of MIL-101, NTB, and MIL-101-NTB (before and after Hg2+ ions adsorption). To obtain clear data, adsorption was conducted using a solution containing 50 ppm Hg2+ ions to obtain MIL-101-NTB (after adsorption). The FTIR spectra of the pristine MOF contains a band at 1625 cm−1 corresponding to bending vibrations due to the adsorbed water on the surface of MIL-101 [37]. The band at 1392 cm−1 is attributed to symmetric (O-C-O) dicarboxylate vibrations, confirming the presence of a BDC linker inside the MIL-101 framework structure [38]. The bands at 1508 cm−1 and 750 and 1020 cm−1 are caused by the stretching (C=C) and deformation (C-H) vibrations of the benzene ring [39]. The FTIR pattern was consistent with previous findings [34]. Additionally, it shows that the spectra of MIL-101-NTB (before adsorption) exhibit an extra broad peak at 2713–3100 cm−1 because of N-H stretching vibrations of the benzimidazole rings that are missing in pristine MIL-101 [40]. Furthermore, Figure 3c reveals the absence of these peaks (peaks at 2902 and 2989 cm−1) in MIL-101-NTB (after adsorption), suggesting the participation of both nitrogen atoms of the imidazole ring in chelation with Hg2+ ion. The missing peaks in the 2713–3100 cm−1 region were recovered after regeneration. Similar findings were observed in a previous report on copper (II) complexes with benzimidazole [41].
Figure 3d illustrates the N2 sorption isotherms, and the inset depicts the PSD calculated by NLDFT using the N2 adsorption data at −196.15 °C for pristine and NTB-modified MOFs. The surface area and pore volume values of pristine MOF were 2426.7 m2/g and 1.64 cm3/g, respectively, consistent with a previous study in which acetic acid was used as a mineralizer [42]. However, after NTB modification, drastic reductions in the surface area (837.9 m2/g) and pore volume (0.49 cm3/g) of the composite MOF were noted. Notably, NLDFT determines the pore size distribution of porous materials better than other conventional approaches, such as the BJH (mesopore distribution) and Horvath and Kawazoe methods (micropore distribution) [43]. The inset shows the NLDFT-calculated PSD curves for MIL-101 and MIL-NTB. Moreover, the PSD curve of MIL-101 demonstrates a broad curve between 0.49–3.81 nm with a maximum of 2.07 nm, and the PSD curve of MIL-101-NTB was detected between 0.62–2.87 nm with a maximum of 1.75 nm. Additionally, the PSD curve of MIL-101-NTB shows a significant reduction in peak intensity. The decrease in peak intensity and shift in peak maxima from 2.07 to 1.75 indicate that NTB molecules are present within the MIL-101 pore walls. A similar reduction in pore size has been reported for TEPA-grafted MIL-101 [44].
Figure 4 shows the SEM and the EDS elemental mapping images of pristine and NTB-modified MIL-101 (before and after diverse ion adsorption). Notably, 50 ppm Cu2+/Pb2+/Hg2+/Cd2+ quaternary mixture was used during adsorption to obtain the MIL-101-NTB sample (after adsorption). The octahedral cubic structure of pristine MOF was consistent with previous studies [33]. As shown in both NTB-modified MOF samples (before and after adsorption), the octahedral cubic structure remained unchanged following modification with NTB. The EDS elemental mapping image indicated the absence of nitrogen in MIL-101; however, nitrogen was present in MIL-101-NTB, confirming the presence of NTB on its surface. The inhomogeneous distribution of the NTB was obtained from the EDS images of MIL-101-NTB (before adsorption) and MIL-101-NTB (after adsorption). In these images, the density of carbon (red color) in the before-adsorption sample is high whereas the density of carbon in the after-adsorption sample is less, which indicates the inhomogeneous distribution of NTB molecules on the surface of MIL-101-NTB (after adsorption). Agglomeration of NTB was observed on the MIL-101 surface after adsorption. Diephuis et al. reported similar agglomeration profiles of iron oxide on the sand [45]. Individual elemental mapping images, map sum spectra, and weight percent values can be found in Figure 5, Figure 6, Figure 7 and Figure 8. The weight percentages of carbon found in pristine and NTB-modified MIL-101 samples (before and after diverse ion adsorption) were 63.62, 65.02, and 67.59%, respectively. The nitrogen weight percentages in pristine MOF and NTB-modified MOF samples (before and after adsorption) were 0.0, 3.89, and 10.87%, respectively. The presence of nitrogen and the increase in carbon weight percentages in MIL-101-NTB (before adsorption) compared with MIL-101 demonstrate the surface presence of NTB. Conversely, an increase in these values for MIL-101-NTB (after adsorption) suggests that the free NTB molecules which are not grafted to the unsaturated chromium metal centers exited the pores and agglomerated on the surface.
In Figure 8b, EDS mapping shows the content of Cd and Hg on MIL-101-NTB surface is 0 after adsorption of Cd2+ and Hg2+ ions. The disadvantage of EDS analysis is that it generates data from only the upper few microns of the investigated material, and it is a relatively insensitive method with detection limits in the percentage range that are lower. EDS can detect major and minor elements with concentrations greater than 10 wt% (major concentrations) and concentrations between 1 and 10 wt% (minor concentrations). EDS cannot detect trace elements (concentrations below 0.01 wt%) because the detection limit for bulk materials is 0.1% [46]. For diverse ions adsorption, the initial concentration of the solution was taken as 50 ppm (0.005 wt%); consequently, the EDS analysis generates elemental information qualitatively, but it is extremely difficult to obtain accurate quantitative data.
The CHN analysis shows the increase in the percentages of carbon and nitrogen in the NTB-modified MOF (before adsorption) compared with the pristine MOF (Table 1), indicating the presence of NTB in the framework. MIL-101 contained 0.95% of nitrogen due to the presence of DMF molecules used for its purification. The weight loss at 150 °C in the TGA plot and the presence of nitrogen in the CHN analysis confirms that the methanol treatment did not completely remove the DMF molecules from the MIL-101 framework. Notably, 1.77 mg of MIL-101-NTB (before adsorption) was used for CHN analysis, and it contained 8.95% of nitrogen, equivalent to 0.37 g/1 g of MIL-101. However, this value was less than that of the amount used for impregnation (0.75 g/1 g MIL-101). Technically, there should be no loss in NTB quantity because no washing was performed after impregnation. However, the decrease in NTB content in the MIL-101-NTB samples suggests that the NTB molecules were not uniformly distributed across the MOF surface. Furthermore, the nitrogen content was measured after three consecutive adsorption cycles; MIL-101-NTB (after adsorption) contained 8.18% nitrogen, 0.77% less than the before-adsorption sample. This loss could be attributed to the removal of DMF from the pores during adsorption. The recovery of missing peaks in the FTIR analysis of MIL-101-NTB (after regeneration) sample and small loss in the nitrogen content in the CHN analysis of MIL-101-NTB (after adsorption) sample further suggests that the NTB molecules did not fall off during the adsorption process.
Surface-sensitive XPS provides the chemical state information of the elements in the sample. It involves striking the sample with low-energy X-rays (below 6 keV) and measuring the kinetic energy of the emitted electrons [47]. The surface functionalities of NTB-modified MOF samples (before and after Hg2+ ions adsorption) were assessed using XPS analysis, and the results are shown in Figure 9 and Table 2, which comprises a low-resolution wild survey and high-resolution N1s, C1s, and Cr2p spectra. Figure 9a shows the survey spectra of MIL-101-NTB (before adsorption) and MIL-101-NTB (after adsorption). MIL-101-NTB (before adsorption) peaked at 284.60, 400.16, 532.0, and 576.21 eV, corresponding to C1s, N1s, O1s, and Cr2p, respectively. However, in addition to these peaks, the after-adsorption sample showed a peak at 100 eV corresponding to Hg4f. These values are consistent with previous reports [48,49]. The presence of nitrogen in the NTB-modified MOF validates the existence of NTB on the surface of the pristine MOF. Figure 9b shows the high-resolution N1s spectra of both samples. Notably, one NTB molecule has three benzimidazole rings, and each ring contains two types of nitrogen atoms, pyridinic and pyrrolic; as pyridinic nitrogen atoms are more basic than pyrrolic, pyridinic nitrogen atoms will bind to the coordinatively unsaturated Cr3+ center of the MIL-101. The surface functionalization of coordinatively unsaturated Cr3+ centers of the MIL-101 with multifunctional chelating groups such as ethylenediamine (ED), diethylenetriamine (DETA) was previously reported [50]. Consequently, a single NTB molecule includes three pyridinic nitrogen atoms, and theoretically, if one atom is grafted to an unsaturated chromium center, the other two nitrogen atoms are free. Nitriloacetic acid contributes an additional form of a tertiary nitrogen atom to the NTB molecule. The N1S peak was deconvoluted into two peaks. The peaks at 398.30 eV and 399.88 eV represent pyridinic and pyrrolic nitrogen, respectively [51]. As mentioned earlier, the NTB molecule contains one tertiary amine group from NTA, and according to previous reports, the peak corresponding to tertiary amine will appear at 399.88 eV [52]. The intensity of the peaks increased after adsorption, and the peak corresponding to pyrrolic and/or tertiary amine was slightly shifted from 399.88 to 399.76, indicating these groups’ participation in the chelation of Hg2+ ions. Furthermore, the elemental analysis showed that nitrogen level increased from 4.04 to 6.29% in the after-adsorption sample, indicating that more NTB is present on the surface, which further supports the agglomeration of NTB observed in SEM analysis.
Figure 9c depicts the high-resolution C1s spectra of the NTB-modified MOF samples (before and after Hg2+ ions adsorption). The C1s peak of MIL-101-NTB (before adsorption) was deconvoluted into four peaks at 284.06, 284.77, 285.95, and 288.02 eV corresponding to the C=C, -C=N, -C-N, and -COO groups, respectively. The peak obtained at 285.95 eV possibly belongs to pyrrolic nitrogen from benzimidazole rings and/or nitrogen from the tertiary amine in the NTA molecule. Moreover, the C1S peak of MIL-101-NTB (after adsorption) was divided into four sub-peaks at 284.34, 285.34, 286.29–291.02, and 288.36 eV corresponding to -C=C, -C=N, -C-N, and -COO groups, respectively [53]. Major peak position and intensity changes were observed for the C=N, -C-N, and -COO groups. The intensity of the -C=N peak corresponding to pyridinic nitrogen reduced and shifted towards higher binding energy by 0.67 eV, and the intensity of the -C-N peak corresponding to either pyrrolic and/or NTA nitrogen was significantly reduced. Furthermore, a broad peak was observed between 286.29–291.02 eV, indicating this group’s participation in Hg2+ ion binding. Additionally, the stretching vibrations of -N-H bonds from pyrrolic nitrogen were completely absent in the FTIR spectra of MIL-101-NTB (after adsorption), suggesting the participation of pyrrolic nitrogen in the binding of Hg2+ ions. Therefore, all three forms of nitrogen atoms could bind Hg2+ ions. Moreover, the -COO group intensity of MIL-101-NTB (after adsorption) was significantly reduced, and its peak was shifted to a higher binding energy by 0.34 eV, suggesting that bidentate carboxylic acid groups connected to the chromium trimers might participate in the binding of Hg2+ ions.
Figure 9d shows the high-resolution spectra of Cr2p. MIL-101-NTB showed two peaks at 577.26 and 586.70 eV, corresponding to Cr2p3/2 and Cr2p1/2, respectively, confirming the presence of Cr(III). A similar peak profile was observed in MIL-101-NTB (after adsorption) at 576.76 and 586.70 eV. These values are consistent with previous reports [54,55,56,57].
The EDS and XPS show the nitrogen content of MIL-101-NTB increase after adsorption, and CHN analysis shows the nitrogen content decrease after adsorption which might be due to the following reasons. EDS and XPS are surface sensitive, i.e., they measure the elemental composition up to sub-micron level only. SEM images suggest that agglomeration of NTB molecules was taking place after adsorption. Due to agglomeration, the after-adsorption sample is not uniform and spot analysis by EDS or coverage of a small area by XPS analysis shows high content of nitrogen in both EDS and XPS analysis results. The CHN analysis is bulk analysis and the difference in nitrogen content before and after adsorption was 0.77%. This loss could be attributed to the removal of trace DMF molecules from the pores of pristine MIL-101 during adsorption.

3.2. Adsorption Experiments

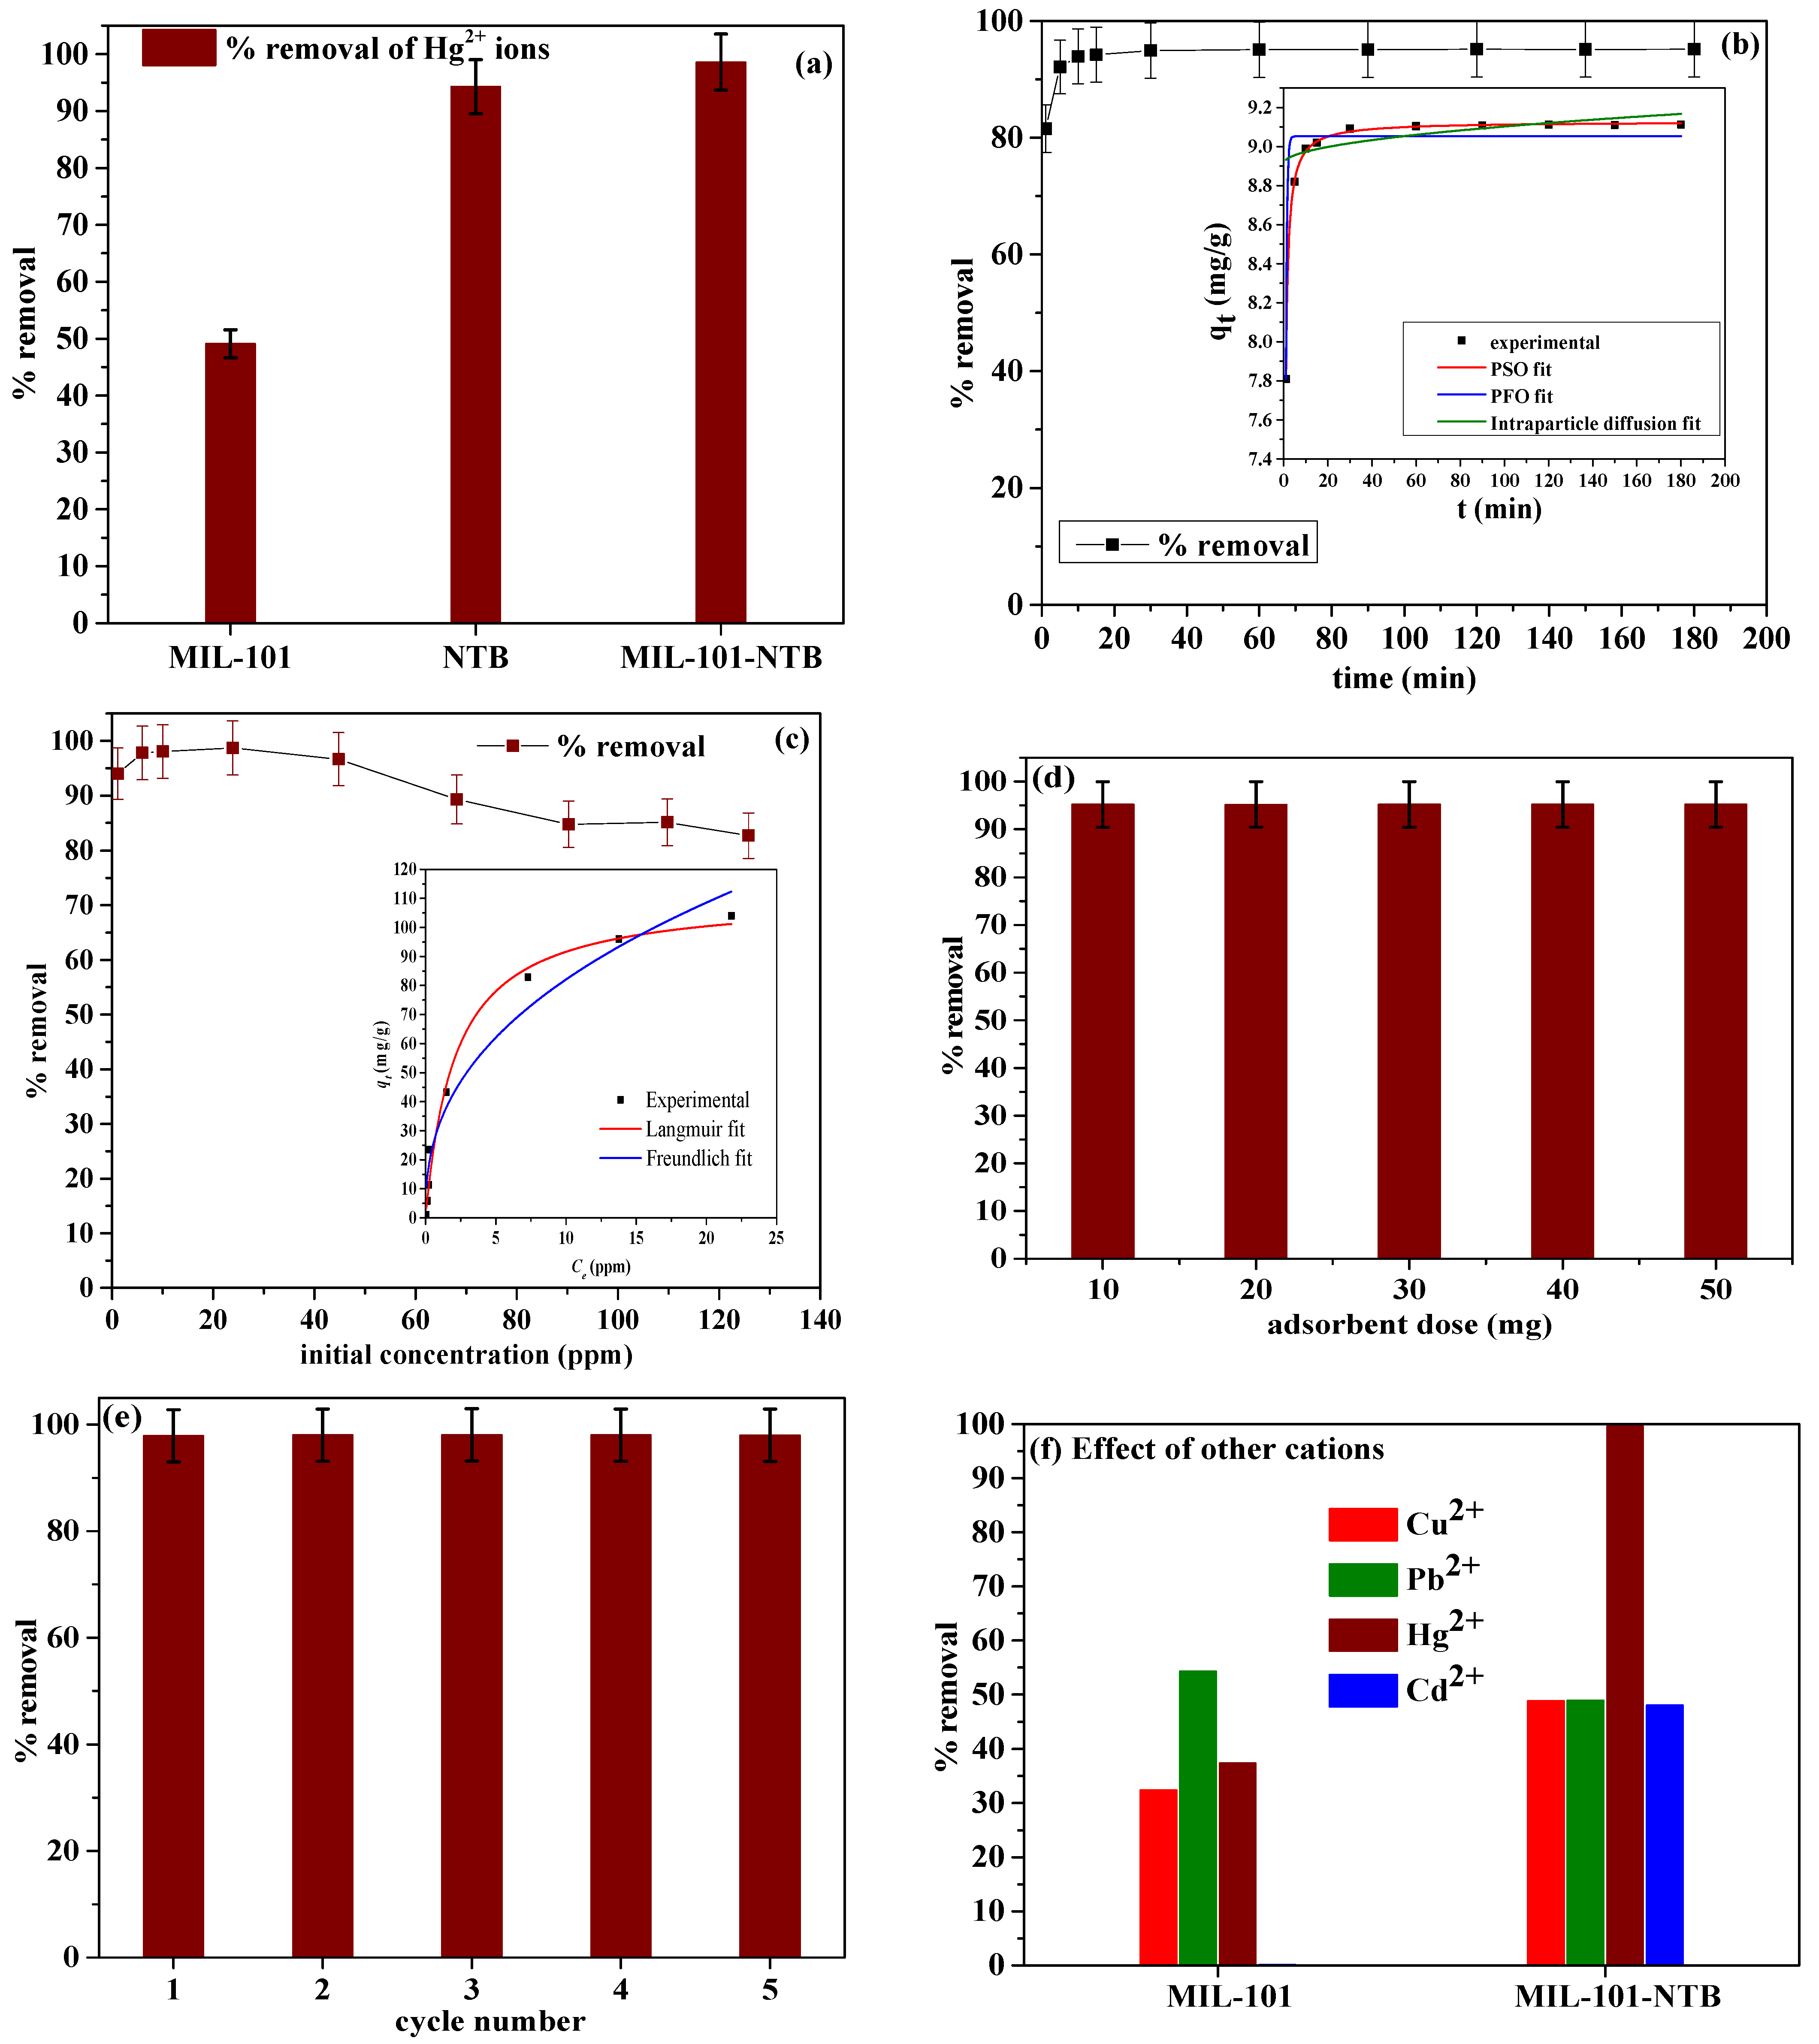
3.2.1. Preliminary Screening

Our research area is to upgrade natural water (common surface-water) to drinking water. Typically, the concentration of heavy metal ions (HMIs) in common surface-water is found to be at low levels. Therefore, preliminary single ion adsorption tests were conducted using MIL-101, NTB, and MIL-101-NTB with a 1 ppm initial concentration of Hg2+ ions solution; the results are depicted in Figure 10a. The pH of the solution is vital in determining the speciation of HMIs in the solution and their adsorption. At low pH values (<2), metal ion removal efficiency is reduced due to an increase in H+ ion concentration, and protonation of imidazole groups occurs, resulting in electrostatic repulsion between the adsorbent surface and HMIs. The metal ion removal efficiency was reduced at higher pH values (>8) owing to the formation of metal hydroxides [58]. The optimal pH reported in the literature for the adsorption of Hg2+ ions on MOF-based composite materials is 5–7 [59]. The pH of the as-prepared Hg2+ single ion solution (with 1.0 ppm initial concentration) was 5.47. The pH of the solution was unchanged during the experiments. The percentage removal of Hg2+ ions by MIL-101, NTB, and MIL-101-NTB was 49.1%, 94.3%, and 98.6%, respectively; therefore, MIL-101 had a lower removal efficiency (%) than NTB and MIL-101-NTB.
Further adsorption experiments were performed for Hg2+ ions removal using MIL-101-NTB, and adsorption parameters, such as the effect of contact time, initial concentration, adsorbent dosage, desorption of Hg2+ ions, and cyclic adsorption tests, were investigated.

3.2.2. Effect of Contact Time

The adsorption experiments were conducted between 1–180 min with a 10.0 ppm initial concentration of Hg2+ ions using MIL-101-NTB, and the results are shown in Figure 10b. The removal efficiency of MIL-101-NTB at 1, 5, and 10 min was 81.5, 92.1, and 93.9%, respectively, whereas the removal capacity at 1, 5, and 10 min was calculated as 7.81, 8.82, and 8.99 mg/g, respectively. A 94.19% removal efficiency was accomplished within 15 min, and 95.06 and 95.15% removal efficiencies were detected at 60 min and 180 min, respectively. These results indicate that MIL-101-NTB can quickly adsorb Hg2+ ions from the solution. Adsorption kinetics provides information on the mechanism and rate of the adsorption process. Nonlinear pseudo-first-order (PFO) (3), pseudo-second-order (PSO) (4), and intraparticle diffusion kinetic models (5) were used to fit the experimental adsorption kinetics data [60]. The kinetic model fittings are shown in the inset of Figure 10b.
q t = q e ( 1 e k 1 t )
q t = q e 2     k 2   t   q e   k 2   t + 1
  q t = k i t 1 / 2 + C
where qe (mg/g) and qt (mg/g) represent the amount of Hg2+ ions adsorbed per gram of adsorbent at equilibrium and any time (min), respectively. k1 (1/min) and k2 (g/mg min) are the rate constants of the pseudo-first-order pseudo-second-order kinetic models, respectively. ki (mg/g min1/2) expresses the rate constant of the intraparticle diffusion kinetic model. Table 3 comprises the parameters corresponding to the three kinetic models described above. The experimental data fitted well in the pseudo-second-order model (R2 = 0.9995) compared with the pseudo-first-order model (R2 = 0.9411). The calculated removal capacity at 180 min was 9.12 mg/g, which was quite close to the experimental removal capacity (9.1 mg/g). Notably, surface adsorption, comprising the chemisorption process, is the rate-limiting factor in this model [61]. Additionally, the chemisorption of Hg2+ ions on the surface of MIL-101-NTB occurs via the chelation of nitrogen groups in the NTB molecule.

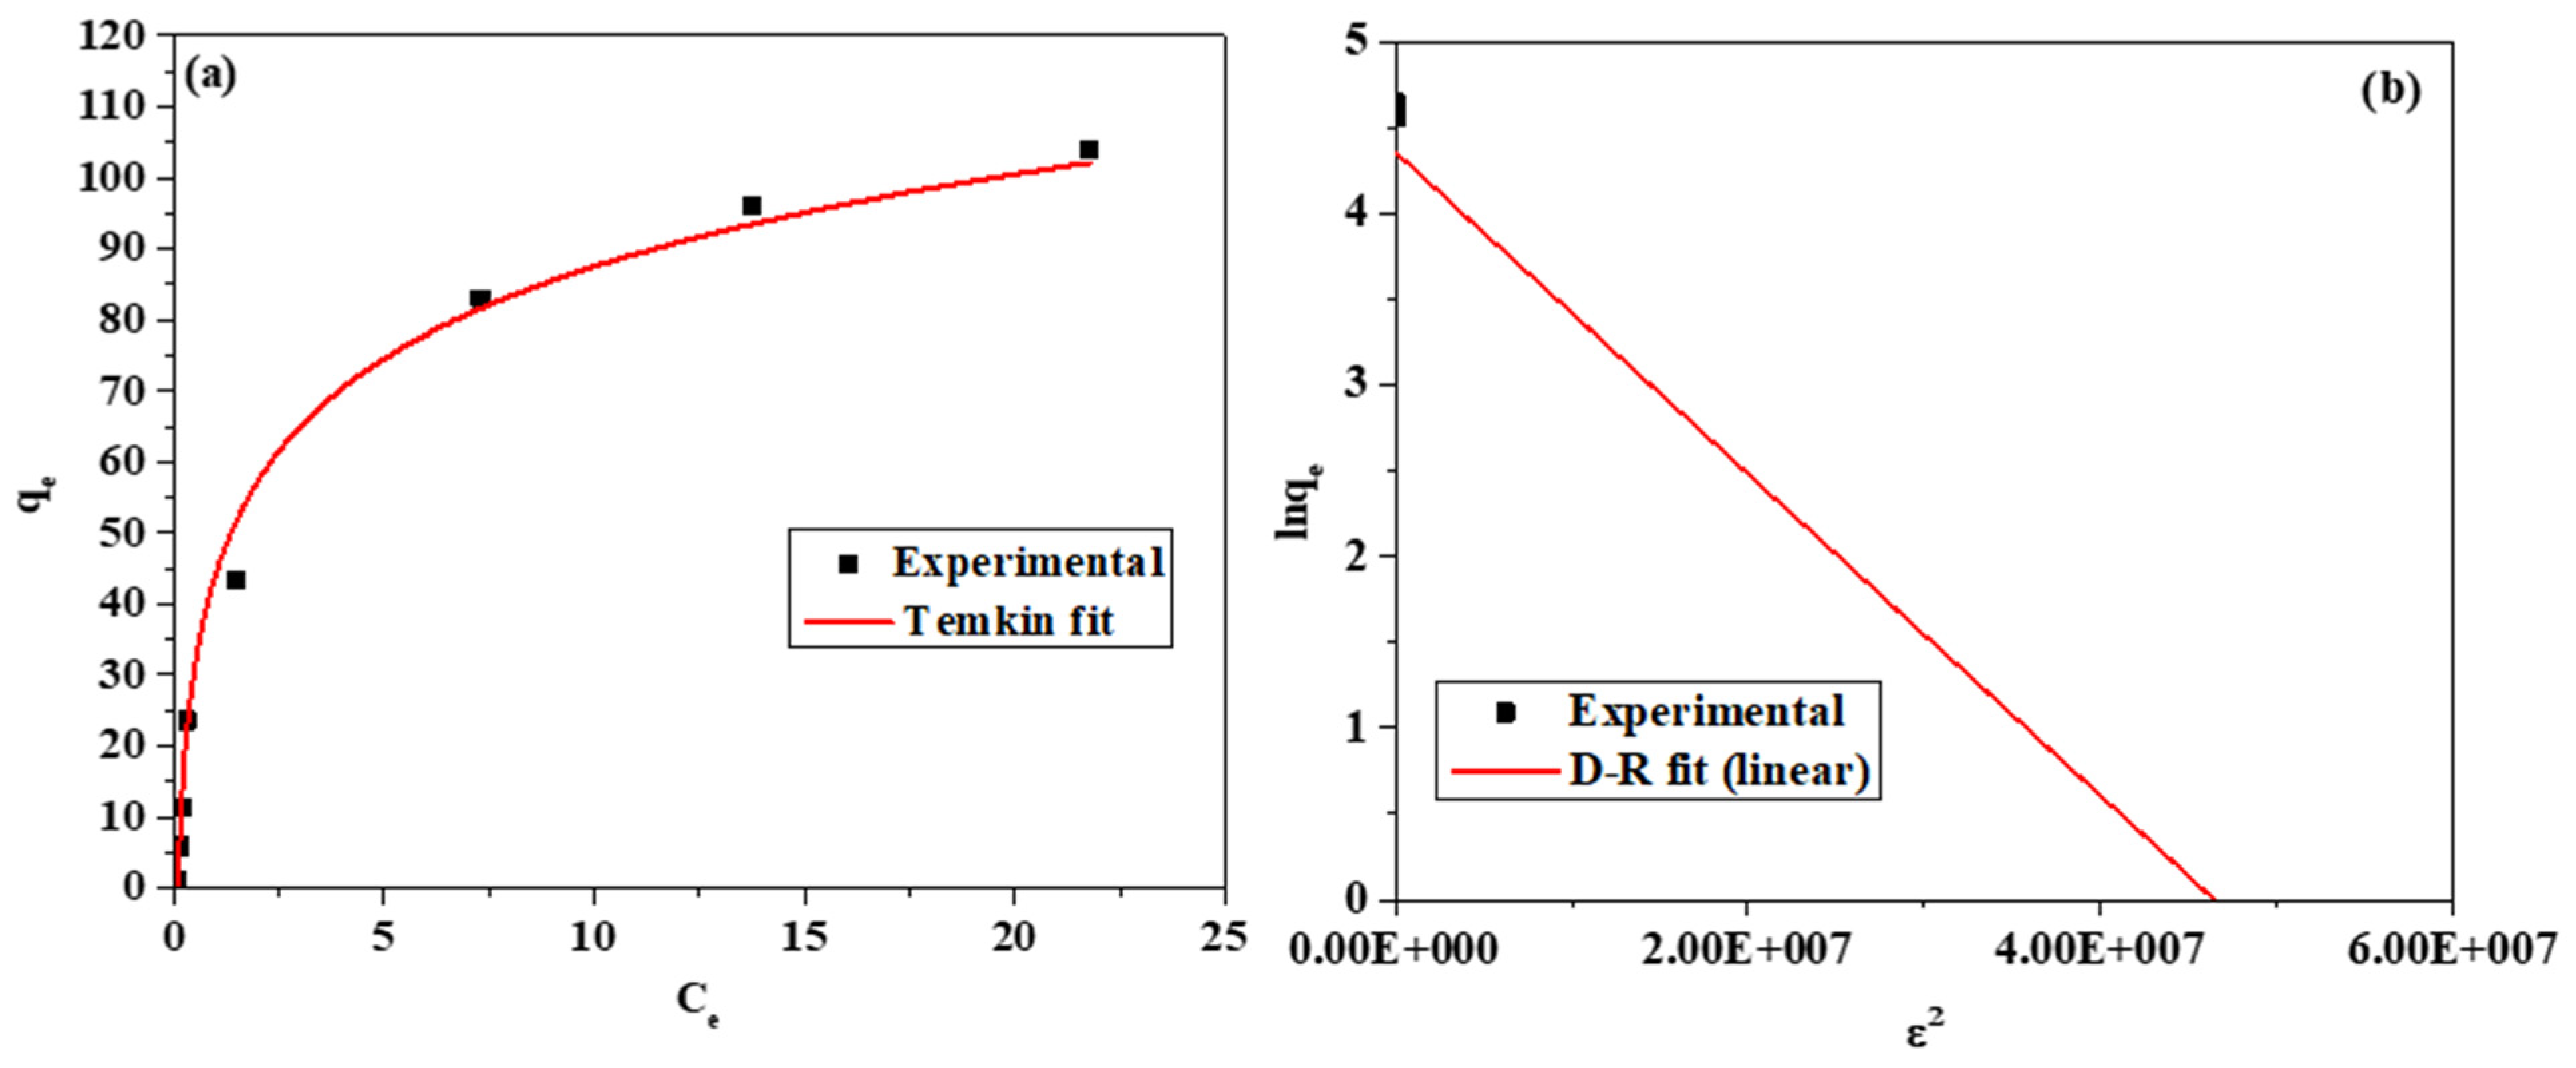
3.2.3. Effect of Initial Concentration

It is necessary to construct an adsorption isotherm of the adsorbate ions over a range of initial concentrations to determine the nature of the interaction between the adsorbate molecules and adsorbent and calculate the maximum adsorption capacity. The adsorption experiments were conducted with 1–125 ppm of initial concentrations of Hg2+ ions using MIL-101-NTB, and the results are shown in Figure 10c. The removal efficiency (%) of Hg2+ ions increased from 93.99 to 98.71% between 1–23.85 ppm and decreased gradually to 82.69%. The initial concentration acts as a driving force to move the adsorbent ions from the bulk to the active adsorption sites of the adsorbent [62]. The removal percentage was lower because there was a lower concentration gradient near the adsorbent interface, and Hg2+ ions could not diffuse well at low initial concentrations. Similar results have been reported previously [63]. The further decrease in the percentage removal of Hg2+ ions with increasing initial concentration is because, at a constant adsorbent dosage, the total number of available adsorption sites in the adsorbent are fixed and adsorb nearly the same amount of adsorbate ions, resulting in a decrease in the percentage removal of mercury ions corresponding to an increase in the initial concentration. The experimental data were fitted into the nonlinear Langmuir, Freundlich, and Temkin isotherm models given by Equations (6)–(8), respectively. The linear form of the Dubinin–Radushkevich (D-R) isotherm model was given by Equation (9) [60]. The Langmuir and Freundlich fits are shown in the inset of Figure 10c. The Temkin and D–R fits are shown in Figure 11.
q e = b q m a x C e 1 + b C e
q e = k C e 1 / n
q e = R T B   l n k t C e
l n q e = l n q m a x β ε 2
ε = R T l n ( 1 + 1 C e )
E = 1 2 β
where Ce (mg/L) represents the equilibrium concentration of Hg2+ ions; qe (mg/g) represents the amount of Hg2+ ions adsorbed per unit mass of adsorbent at equilibrium; qmax (mg/g) is the Langmuir constant that represents maximum adsorption capacity assuming a monolayer coverage of adsorbate over a homogenous adsorbent surface; b (L/mg) is a kinetic parameter representing the adsorption energy of the adsorbent for the adsorbate; k (mg/g) is the Freundlich constant related to adsorption capacity; and 1/n is an empirical parameter related to adsorption intensity or surface heterogeneity. B represents the Temkin isotherm constant (J/mol). The adsorption process is endothermic when B is negative and exothermic when it is positive. kt represents the maximum bond energy (L/mg). R and T are gas constant (8.314 J/K mol) and temperature (K), respectively. In the Dubinin–Radushkevich isotherm, qmax represents monolayer adsorption capacity (mg/g). β represents the adsorption energy constant. ε is the Polanyi potential calculated by Equation (10). In the Dubinin–Radushkevich isotherm, the most probable free adsorption energy (E, J/mol) is calculated by Equation (11). E < 8 kJ/mol indicates the physisorption process whereas 8 < E < 16 kJ/mol indicates the chemisorption process.
Table 4 comprises the parameters corresponding to the four isotherm models described above. Based on R2 values, it seems the Langmuir model (R2 = 0.9888) displayed a considerably better fit than the others. The Langmuir model can be ascribed to the monolayer coverage of Hg2+ ions on the MIL-101-NTB surface. Once the monolayer formation was completed, a plateau was observed in the Langmuir fit, indicating the saturation of all the active sites [64]. Since the B value of the Temkin fit (132.2 J/mol) is positive, the adsorption of Hg2+ ions on MIL-101-NTB is exothermic in nature. The E value (2.24) obtained from the D-R fit is less than 8, suggesting that the adsorption process is supposed to be physisorption. The maximum adsorption capacity (qmax) obtained from the Langmuir isotherm model was 111.03 mg/g. Table 5 compares the Hg2+ ions maximum adsorption capacity for various MOFs reported in the literature. Based on this data, MIL-101-NTB has a moderate Hg2+ ions removal capacity compared with the other MOFs. MIL-101-NTB is a more advantageous MOF for Hg2+ ions removal compared to other MOFs due to the cost-effective, simple preparation, and water-insoluble nature of NTB.

3.2.4. Effect of Adsorbent Dosage

The adsorption dosage affects the removal efficiency; it increases the ratio of adsorbate ions in open, active sites, thereby increasing the removal efficiency. However, adsorbent particle aggregation reduces open sites; therefore, higher adsorbent dosages may reduce the removal efficiency [65]. Therefore, the adsorbent dosage is critical for achieving maximum removal performance. The adsorption experiments were conducted with 10–50 mg of MIL-101-NTB with a 10.0 ppm initial concentration of Hg2+ ions, and the results are shown in Figure 10d. The removal efficiency and capacity for the 10 mg adsorbent dose were 95.2% and 9.1 mg/g, respectively, and similar values were obtained in the remaining experiments. These values suggest that less amount of MIL-101-NTB (10.0 mg) can adsorb 95.2% Hg2+ ions from the 10.0 ppm solution, and increasing the adsorbent dose does not affect the removal efficiency.

3.2.5. Adsorbent Regeneration

Adsorbents for the economical and efficient removal of HMIs were chosen based on their stability and regenerative capacity. Desorption experiments were conducted with a 5 mL/0.2M EDTA solution as the regeneration agent to assess the desorption of Hg2+ ions and regeneration of MIL-101-NTB; the results are depicted in Figure 10e. Five adsorption cycles were measured, and the removal efficiencies for the first, second, third, fourth, and fifth cycles were 97.8, 98.0, 98.1, 98.0, and 98.0%, respectively. The Hg2+ ions removal efficiency was unchanged in the fourth and fifth cycles, and 0.2 M EDTA solution could successfully desorb all Hg2+ ions from MIL-101-NTB. These cyclic Hg2+ ions sorption studies suggest that MIL-101-NTB is stable and might have a high Hg2+ ions removal efficiency for at least five consecutive cycles.

3.2.6. Effect of Other Cations

We conducted a diverse ion batch adsorption experiment with a quaternary mixture of Cu2+, Pb2+, Hg2+,, and Cd2+ ions (1.0 ppm initial concentration) to evaluate the effect of other ions on the Hg2+ ions removal efficiency of MIL-101 and MIL-101-NTB; the results are shown in Figure 10f. The removal efficiencies of MIL-101 for Cu2+, Pb2+, Hg2+,, and Cd2+ were 32.4, 54.3, 37.4, and 0.1%, respectively, and that of MIL-101-NTB for Cu2+, Pb2+, Hg2+,, and Cd2+ were 48.9, 49.0, 99.6, and 48.1%, respectively. Compared with the single ion adsorption experiments, the Hg2+ ions removal efficiency was unaltered, indicating that the presence of other ions did not affect the Hg2+ ions removal efficiency of MIL-101-NTB.

3.2.7. Mechanism behind Adsorption of HMIs Using MIL-101-NTB

Hg2+ and Cd2+ ions: The hard and soft acids and bases (HSAB) theory proposed by Pearson in 1963 asserts that Hg2+ and Cd2+ ions are soft acids [66]. In MIL-101-NTB, the benzimidazole nitrogen is a soft base, and soft acid HMIs, such as Hg2+ and Cd2+ ions, were bound to the benzimidazole groups via chelation. Based on the XPS study, it was determined that carboxylate groups participate in Hg2+ ion binding via electrostatic interactions. Hence, electrostatic interactions and chelation are key mechanisms in the adsorption of these ions.
Pb2+ and Cu2+ ions: Based on the HSAB theory, Cu2+ and Pb2+ ions are borderline acids. However, the percentage removal of Cu2+ ions increased, and that of Pb2+ ions decreased in MIL-101-NTB compared with MIL-101. A recent molecular modeling report on the adsorption of Pb2+, Cu2+, and Cd2+ ions by MIL-101(Cr) stated that a higher amount of Pb2+ ion adsorption than other HMIs was observed near the benzoate fragment owing to electrostatic interactions [67]. Based on this report, the carboxylate groups in the MIL-101 framework may be responsible for the high adsorption of Pb2+ ions in pristine MIL-101; however, following modification with NTB, some of these active sites were hindered by the NTB molecules, decreasing Pb2+ ion adsorption in MIL-101-NTB. Previous reports suggest that Cu2+ ions can form complexes with benzimidazole molecules [41], and this tendency improves the Cu2+ ion removal efficiency (%) in MIL-101-NTB compared with pristine MIL-101.
Table 5. A comparison of the maximum adsorption capacities of various MOFs for Hg2+ ions.
Serial NumberMOFMaximum Adsorption Capacity (mg/g)References
1Zr-MSA-MA714.8[68]
2UIO-66-DMTD670.5[69]
3LMOF-263380[70]
4DUT-67-SH372[71]
5FJI-H12440[72]
6MIL-101-NTB111.07This work
7AMOF-178[73]
8MOF-74-Zn63[74]
9MIL-101-Thymine52[75]

4. Conclusions

MIL-101 was modified with NTB via incipient wetness impregnation. MIL-101-NTB exhibited a greater tendency for Hg2+ ions adsorption than MIL-101 in single and diverse batch adsorption studies.
The experimental data of the kinetic and isotherm studies fitted well with the pseudo-second-order kinetic equation and the Langmuir isotherm model. The maximum adsorption capacity calculated from the Langmuir fit at 125 ppm was 111.03 mg/g. Moreover, the excellent fit of the kinetic data to a pseudo-second-order model verified the chemisorption of Hg2+ ions on MIL-101-NTB. Due to the chelation of Hg2+ ions with NTB molecules, MIL-101-NTB rapidly adsorbed 93.9% of Hg2+ ions within 10 min from a 10.0 ppm single ion solution.
An amount of 0.2 M EDTA solution could desorb the Hg2+ ions, and cyclic Hg2+ ions sorption experiments indicated that MIL-101-NTB might have a high Hg2+ ions removal efficiency for at least five consecutive cycles.
Furthermore, the Hg2+ ions removal efficiency remained unchanged in the presence of other HMIs, including Cu2+, Pb2+, and Cd2+ ions. High Hg2+ ions removal efficiency was maintained in both single and diverse ion batch adsorption studies.
Based on the FTIR and XPS analyses, Hg2+ ions chelation by NTB molecules and electrostatic interactions between Hg2+ ions and carboxylate groups in MIL-101-NTB are plausible mechanisms for Hg2+ ions adsorption by MIL-101-NTB.
Finally, SEM analysis detected the agglomeration of NTB molecules on the MIL-101 surface; therefore, attempts are now being undertaken to address this problem by grating NTB on MIL-101 rather than impregnation.

Author Contributions

P.B.S.R.: Conceptualization, methodology, writing—original draft, review, and editing; S.S.C.: project administration, review, and editing; H.M.: methodology, review, and editing; J.-K.Y.: supervision, review, and editing. J.-H.L.: project administration, funding acquisition, review, and editing; J.H.H.: project administration, conceptualization, supervision, methodology, review, and editing. All authors have read and agreed to the published version of the manuscript.

Funding

This work was supported by Industrial Strategic Technology Development Program (20012763, development of petroleum residue-based porous adsorbent for industrial wastewater) funded by the Ministry of Trade, Industry, and Energy (MOTIE, Korea) and the Korea Environment Industry and Technology Institute through the Prospective Green Technology Innovation Project, funded by the Korea Ministry of Environment (2021003160013).

Data Availability Statement

The authors confirm that the data supporting the findings of this study are available within the article.

Conflicts of Interest

The authors declare that they have no known competing financial interests or personal relationships that could have appeared to influence the work reported in this paper.

References

  1. Demey, H.; Vincent, T.; Guibal, E. A novel algal-based sorbent for heavy metal removal. Chem. Eng. J. 2018, 332, 582–595. [Google Scholar] [CrossRef]
  2. Kumar, V.; Parihar, R.D.; Sharma, A.; Bakshi, P.; Sidhu, G.P.S.; Bali, A.S.; Karaouzas, I.; Bhardwaj, R.; Thukral, A.K.; Gyasi-Agyei, Y.; et al. Global evaluation of heavy metal content in surface water bodies: A meta-analysis using heavy metal pollution indices and multivariate statistical analyses. Chemosphere 2019, 236, 124364. [Google Scholar] [CrossRef] [PubMed]
  3. Morais, S.; Costa, F.G.; Pereira, M.D.L. Heavy metals and human health. In Environmental Health–Emerging Issues and Practice; Oosthuizen, J., Ed.; IntechOpen: Rijeka, Croatia, 2012; pp. 227–245. [Google Scholar]
  4. Bernhoft, R.A. Mercury toxicity and treatment: A review of the literature. J. Environ. Public Health 2012, 2012, 460508. [Google Scholar] [CrossRef] [PubMed]
  5. Fu, F.; Wang, Q. Removal of heavy metal ions from wastewaters: A review. J. Environ. Manag. 2011, 92, 407–418. [Google Scholar] [CrossRef]
  6. Zamora-Ledezma, C.; Negrete-Bolagay, D.; Figueroa, F.; Zamora-Ledezma, E.; Ni, M.; Alexis, F.; Guerrero, V.H. Heavy metal water pollution: A fresh look about hazards, novel and conventional remediation methods. Environ. Technol. Innov. 2021, 22, 101504. [Google Scholar] [CrossRef]
  7. Norton-Brandão, D.; Scherrenberg, S.M.; Lier, J.B.V. Reclamation of used urban waters for irrigation purposes-a review of treatment technologies. J. Environ. Manag. 2013, 122, 85–98. [Google Scholar] [CrossRef]
  8. Huang, Y.; Zeng, X.; Guo, L.; Lan, J.; Zhang, L.; Cao, D. Heavy metal ion removal of wastewater by zeolite-imidazolate frameworks. Sep. Purif. Technol. 2018, 194, 462–469. [Google Scholar] [CrossRef]
  9. Jha, M.K.; Joshi, S.; Sharma, R.K.; Kim, A.A.; Pant, B.; Park, M.; Pant, H.R. Surface modified activated carbons: Sustainable bio-based materials for environmental remediation. Nanomaterials 2021, 11, 3140. [Google Scholar] [CrossRef]
  10. Chen, Y.; Bai, X.; Ye, Z. Recent progress in heavy metal ion decontamination based on metal-organic frameworks. Nanomaterials 2020, 11, 1481. [Google Scholar] [CrossRef]
  11. Yuna, Z. Review of the natural, modified, and synthetic zeolites for heavy metals removal from wastewater. Environ. Eng. Sci. 2016, 33, 443–454. [Google Scholar] [CrossRef]
  12. Mao, S.; Gao, M. Functional organoclays for removal of heavy metal ions from water: A review. J. Mol. Liq. 2021, 334, 116143. [Google Scholar] [CrossRef]
  13. Xu, G.-R.; An, Z.-H.; Xu, K.; Liu, Q.; Das, R.; Zhao, H.-L. Metal organic framework (MOF)-based micro/nanoscaled materials for heavy metal ions removal: The cutting-edge study on designs, synthesis, and applications. Coord. Chem. Rev. 2021, 427, 213554. [Google Scholar] [CrossRef]
  14. Yang, X.; Xu, Q. Bimetallic metal-organic frameworks for gas storage and separation. Cryst. Growth Des. 2017, 17, 1450–1455. [Google Scholar] [CrossRef]
  15. Li, X.R.; Yang, X.C.; Xue, H.G.; Pang, H.; Xu, Q. Metal-organic frameworks as a platform for clean energy applications. EnergyChem 2020, 2, 100027. [Google Scholar] [CrossRef]
  16. Li, H.; Li, L.B.; Lin, R.B.; Zhou, W.; Zhang, Z.J.; Xiang, S.C.; Chen, B.L. Porous metal-organic frameworks for gas storage and separation: Status and challenges. EnergyChem 2019, 1, 100006. [Google Scholar] [CrossRef]
  17. Samanta, P.; Desai, A.V.; Sharma, S.; Chandra, P.; Ghosh, S.K. Selective recognition of Hg2+ ion in water by a functionalized metal–organic framework (MOF) based chemodosimeter. Inorg. Chem. 2018, 57, 2360–2364. [Google Scholar] [CrossRef] [PubMed]
  18. Wu, M.X.; Yang, Y.W. Metal-organic framework (MOF)-based drug/cargo delivery and cancer therapy. Adv. Mater. 2017, 29, 1606134. [Google Scholar] [CrossRef]
  19. Yi, F.Y.; Chen, D.; Wu, M.K.; Han, L.; Jiang, H.L. Chemical sensors based on metal-organic frameworks. ChemPlusChem 2016, 81, 675–690. [Google Scholar] [CrossRef]
  20. Castillo, J.; Thijs, V.; Sofia, C. Understanding water adsorption in Cu-BTC metal-organic frameworks. J. Phys. Chem. C 2008, 112, 15934–15939. [Google Scholar] [CrossRef]
  21. Saha, D.; Bao, Z.; Jia, F.; Deng, S. Adsorption of CO2, CH4, N2O, and N2 on MOF-5, MOF-177, and zeolite 5A. Environ. Sci. Technol. 2010, 44, 1820–1826. [Google Scholar] [CrossRef]
  22. Tan, K.; Nijem, N.; Canepa, P.; Gong, Q.; Li, J.; Thonhauser, T.; Chabal, Y.J. Stability and hydrolyzation of metal organic frameworks with paddle-wheel SBUs upon hydration. Chem. Mater. 2012, 24, 3153–3167. [Google Scholar] [CrossRef] [Green Version]
  23. Qiu, J.H.; Feng, Y.; Zhang, X.F.; Jia, M.M.; Yao, J.F. Acid-promoted synthesis of UiO-66 for highly selective adsorption of anionic dyes: Adsorption performance and mechanisms. J. Colloid Interface Sci. 2017, 499, 151–158. [Google Scholar] [CrossRef] [PubMed]
  24. Pei, L.; Zhao, X.; Liu, B.; Li, Z.; Wei, Y. Rationally Tailoring Pore and Surface Properties of Metal–Organic Frameworks for Boosting Adsorption of Dy3+. ACS Appl. Mater. Interfaces 2021, 13, 46763–46771. [Google Scholar] [CrossRef] [PubMed]
  25. Ru, J.; Wang, X.; Wang, F.; Cui, X.; Du, X.; Lu, X. UiO series of metal-organic frameworks composites as advanced sorbents for the removal of heavy metal ions: Synthesis, applications and adsorption mechanism. Ecotoxicol. Environ. Saf. 2021, 208, 111577. [Google Scholar] [CrossRef] [PubMed]
  26. Ferey, G.; Draznieks, C.M.; Serre, C.; Millange, F.; Dutour, J.; Surble, S.; Margiolaki, I. A chromium terephthalate based solid with unusually large pore volumes and surface area. Science 2005, 309, 2040–2042. [Google Scholar] [CrossRef] [PubMed]
  27. Zou, M.; Dong, M.; Zhao, T. Advances in metal-organic frameworks MIL-101(Cr). Int. J. Mol. Sci. 2022, 23, 9396. [Google Scholar] [CrossRef]
  28. Luo, X.; Ding, L.; Luo, J. Adsorptive removal of Pb(II) ions from aqueous samples with amino-functionalization of metal-organic frameworks MIL-101(Cr). J. Chem. Eng. Data 2015, 60, 1732–1743. [Google Scholar] [CrossRef]
  29. Rastkari, N.; Akbari, S.; Brahmand, M.B.; Takhvar, A.; Ahmadkhaniha, R. Synthesis and characterization of tetraethylenepentamine functionalized MIL-101(Cr) for removal of metals from water. J. Environ. Health Sci. Eng. 2021, 19, 1735–1742. [Google Scholar] [CrossRef]
  30. Thompson, L.K.; Ramaswamy, B.S.; Seymour, E.A. Cobalt (II) and zinc(II) complexes of the tripod’ ligand tris(2-benzimidazylmethy1)amine. Some five-coordinate derivatives and some with mixed stereochemistries. Can. J. Chem. 1977, 55, 878. [Google Scholar] [CrossRef] [Green Version]
  31. Nakata, K.; Shimomura, N.; Shiina, N.; Izumi, M.; Ichikawa, K.; Shiro, M. Kinetic study of catalytic CO2 hydration by water-soluble model compound of carbonic anhydrase and anion inhibition effect on CO2 hydration. J. Inorg. Biochem. 2002, 89, 255–266. [Google Scholar] [CrossRef]
  32. Tang, Y.; Zhang, F.; Hu, S.; Cao, Z.; Wu, Z.; Jing, W. Novel benzimidazole derivatives as corrosion inhibitors of mild steel in the acidic media. Part I: Gravimetric, electrochemical, SEM and XPS studies. Corros. Sci. 2013, 74, 271–282. [Google Scholar] [CrossRef]
  33. Phani, B.S.R.; Raj, M.C.; Senthilkumar, S.; Somani, R.S.; Bajaj, H.C. HF-free synthesis of MIL-101(Cr) and its hydrogen adsorption studies. Environ. Prog. Sustain. 2016, 32, 461–468. [Google Scholar]
  34. Kayal, S.; Sun, B.; Chakraborty, A. Study of metal-organic framework MIL-101(Cr) for natural gas (methane) storage and compare with other MOFs (metal-organic frameworks). Energy 2015, 91, 772–781. [Google Scholar] [CrossRef]
  35. Rana, A.K.; Bankar, P.; Kumar, Y.; More, M.A.; Late, D.J.; Shirage, P.M. Synthesis of Ni-doped ZnO nanostructures by low-temperature wet chemical method and their enhanced field emission properties. RSC Adv. 2016, 6, 104318–104324. [Google Scholar] [CrossRef] [Green Version]
  36. Prasanth, K.P.; Rallapalli, P.; Raj, M.C.; Bajaj, H.C.; Jasra, R.V. Enhanced hydrogen sorption in single walled carbon nanotube incorporated MIL-101 composite metal–organic framework. Int. J. Hydrogen Energy 2011, 36, 7594–7601. [Google Scholar] [CrossRef]
  37. Khodkar, A.; Khezri, S.M.; Pendashteh, A.; Khoramnejadian, S.; Mamani, L. Preparation and application of α-Fe2O3@MIL-101(Cr)@TiO2 based on metal–organic framework for photocatalytic degradation of paraquat. Toxicol. Ind. Health 2018, 34, 842–859. [Google Scholar] [CrossRef]
  38. Jhung, S.H.; Lee, J.H.; Yoon, J.W.; Serre, C.; Ferey, G.; Chang, J.S. Microwave synthesis of chromium terephthalate MIL-101 and its benzene sorption ability. Adv. Mater. 2007, 19, 121–124. [Google Scholar] [CrossRef]
  39. Jafar, S.; Sedigheh, Z.; Maryam, T. Synthesis of a chromium terephthalate metal organic framework and use as nanoporous adsorbent for removal of diazinon organophosphorus insecticide from aqueous media. J. Dispers. Sci. Technol. 2019, 40, 1423–1440. [Google Scholar]
  40. Yurdakul, S.; Yilmaz, C. Vibrational spectroscopic investigations of M(benzimidazole)2Ni(CN)4 and Cd(benzimidazole)Cl2 complexes. Vib. Spectrosc. 1999, 21, 127–132. [Google Scholar] [CrossRef]
  41. Pashchevskaya, N.V.; Nazarenko, M.A.; Bolotin, S.N.; Oflidi, A.I.; Panyushkin, V.T. Effect of the condition of synthesis on the composition and structure of copper(II) complexes with benzimidazole. Russ. J. Inorg. Chem. 2010, 55, 1425–1432. [Google Scholar] [CrossRef]
  42. Ren, J.; Musyoka, N.M.; Langmi, H.W.; Segakweng, T.; North, B.C.; Mathe, M.; Kang, X. Modulated synthesis of chromium-based metal-organic framework (MIL-101) with enhanced hydrogen uptake. Int. J. Hydrogen Energy 2014, 39, 12018–12023. [Google Scholar] [CrossRef]
  43. Quantachrome Instruments. Pore Size Analysis by Gas Adsorption and the Density Functional Theory. 2010, pp. 1–13. Available online: https://www.azom.com/article.aspx?ArticleID=5189 (accessed on 15 January 2020).
  44. Yoon, H.C.; Rallapalli, P.B.S.; Beum, H.T.; Han, S.S.; Kim, J.N. Hybrid postsynthetic functionalization of tetraethylenepentamine onto MIL-101(Cr) for separation of CO2 from CH4. Energy Fuels 2018, 32, 1365–1373. [Google Scholar] [CrossRef]
  45. Diephuis, W.R.; Molloy, A.L.; Boltz, L.L.; Porter, T.B.; Aragon Orozco, A.; Duron, R.; Crespo, D.; George, L.J.; Reiffer, A.D.; Escalera, G. The effect of agglomeration on arsenic adsorption using iron oxide nanoparticles. Nanomaterials 2022, 12, 1598. [Google Scholar] [CrossRef] [PubMed]
  46. Goldstein, J.; Newbury, D.; Joy, D.; Lyman, C.; Echlin, P.; Lifshin, E. Scanning Electron Microscopy and X-ray Microanalysis, 3rd ed.; Springer: New York, NY, USA, 2003. [Google Scholar]
  47. Stevie, F.A.; Donley, C.L. Introduction to X-ray photoelectron spectroscopy. J. Vac. Sci. Technol. A 2020, 38, 063204. [Google Scholar] [CrossRef]
  48. Quan, X.; Sun, Z.; Meng, H.; Han, Y.; Wu, J.; Xu, J.; Xu, Y.; Zhang, X. Surface functionalization of MIL-101(Cr) by aminated mesoporous silica and improved adsorption selectivity toward special metal ions. Dalton Trans. 2019, 48, 5384–5396. [Google Scholar] [CrossRef]
  49. Zhang, L.; Wang, J.; Du, T.; Zhang, W.; Zhu, W.; Yang, C.; Yue, T.; Sun, J.; Li, T.; Wang, J. NH2-MIL-53(Al) metal-organic framework as the smart platform for simultaneous high-performance detection and removal of Hg2+. Inorg. Chem. 2019, 58, 12573–12581. [Google Scholar] [CrossRef]
  50. Hwang, Y.K.; Hong, D.Y.; Chang, J.-S.; Jhung, S.H.; Seo, Y.K.; Kim, J.H.; Vimont, A.; Daturi, M.; Serre, C.; Ferey, G. Amine grafting on coordinatively unsaturated metal centers of MOFs: Consequences for catalysis and metal encapsulation. Agnew. Chem. Int. Ed. 2008, 47, 4144–4148. [Google Scholar] [CrossRef]
  51. Bui, N.T.; Kang, H.; Teat, S.J. A nature-inspired hydrogen-bonded supramolecular complex for selective copper ion removal from water. Nat. Commun. 2020, 11, 3947. [Google Scholar] [CrossRef]
  52. Li, Y.; He, J.; Zhang, K.; Liu, T.; Hu, Y.; Chen, X.; Wang, C.; Huang, X.; Kong, L.; Liua, J. Super rapid removal of copper, cadmium and lead ions from water by NTA-silica gel. RSC Adv. 2019, 9, 397–407. [Google Scholar] [CrossRef]
  53. Ai, W.; Zhou, W.; Du, Z.; Du, Y.; Zhang, H.; Jia, X.; Xie, L.; Yi, M.; Yu, T.; Huang, W. Benzoxazole and benzimidazole heterocycle-grafted graphene for high-performance supercapacitor electrodes. J. Mater. Chem. 2012, 22, 23439–23446. [Google Scholar] [CrossRef]
  54. Chen, Y.; An, D.; Sun, S.; Gao, J.; Qian, L. Reduction and removal of chromium VI in water by powdered activated carbon. Materials 2018, 11, 269. [Google Scholar] [CrossRef] [PubMed] [Green Version]
  55. Vo, T.K.; Kim, J.-H.; Kwon, H.T.; Kim, J. Cost-effective and eco-friendly synthesis of MIL-101(Cr) from waste hexavalent chromium and its application for carbon monoxide separation. Ind. Eng. Chem. Res. 2019, 80, 345–351. [Google Scholar] [CrossRef]
  56. Huang, X.; Hu, Q.; Gao, L.; Hao, Q.; Wang, P.; Qin, D. Adsorption characteristics of metal–organic framework MIL-101(Cr) towards sulfamethoxazole and its persulfate oxidation regeneration. RSC Adv. 2018, 8, 27623–27630. [Google Scholar] [CrossRef] [PubMed]
  57. Zhang, F.; Jin, Y.; Fu, Y.; Zhong, Y.; Zhu, W.; Ibrahim, A.A.; El-Shall, M.S. Palladium Nanoparticles Incorporated within Sulfonic Acid-Functionalized MIL–101(Cr) for Efficient Catalytic Conversion of Vanillin. J. Mater. Chem. A 2015, 3, 17008–17015. [Google Scholar] [CrossRef]
  58. Zhang, Y.; Xie, Z.; Wang, Z.; Feng, X.; Wang, Y.; Wu, A. Unveiling the adsorption mechanism of zeolitic imidazolate framework-8 with high removal efficiency on copper ions from aqueous solutions. Dalton Trans. 2016, 45, 12653–12660. [Google Scholar] [CrossRef] [PubMed]
  59. Kobielska, P.A.; Howarth, A.J.; Farha, O.K.; Nayak, S. Metal-organic frameworks for heavy metal removal from water. Coord. Chem. Rev. 2018, 358, 92–107. [Google Scholar] [CrossRef]
  60. Rahmani, A.; Shabanloo, A.; Zabihollahi, S.; Mehdi, S.; Mostafa, L.; Mohammad, K.; Saber, A.; Davood, N. Facile fabrication of amino-functionalized MIL-68(Al) metal–organic framework for effective adsorption of arsenate (As(V)). Sci. Rep. 2022, 12, 11865. [Google Scholar] [CrossRef]
  61. Dariush, R. Pseudo-second-order kinetic equations for modeling adsorption systems for removal of lead ions using multi-walled carbon nanotube. J. Nanostruct. Chem. 2013, 3, 55–60. [Google Scholar]
  62. Ragheb, S.M. Phosphate removal from aqueous solution using slag and fly ash. Hbrc J. 2013, 9, 270–275. [Google Scholar] [CrossRef] [Green Version]
  63. Salman, N.; Vijay, B.; Jiri, M.; Jakub, W.; Promoda, B.; Azeem, A. Sorption properties of iron impregnated activated carbon web for removal of methylene blue from aqueous media. Fibers Polym. 2016, 17, 1245–1255. [Google Scholar]
  64. Aboutorabi, L.; Morsali, A.; Tahmasebi, E.; Buyukgungor, O. Metal-organic framework based on isonicotinate N-oxide for fast and highly efficient aqueous phase Cr (VI) adsorption. Inorg. Chem. 2016, 55, 5507–5513. [Google Scholar] [CrossRef] [PubMed]
  65. Deng, Y.Y.; Xiao, X.F.; Wang, D.; Han, B.; Gao, Y.; Xue, J.L. Adsorption of Cr(VI) from aqueous solution by ethylenediaminetetraacetic acid-chitosan modified metal-organic framework. J. Nanosci. Nanotechnol. 2020, 20, 1660–1669. [Google Scholar] [CrossRef] [PubMed]
  66. Pearson, R.G. Hard and Soft Acids and Bases. J. Am. Chem. Soc. 1963, 85, 3533–3539. [Google Scholar] [CrossRef]
  67. Joseph, L.; Saha, M.; Kim, S.; Jun, B.-M.; Heo, J.; Park, C.M.; Jang, M.; Flora, J.R.V.; Yoon, Y. Removal of Cu2+, Cd2+, and Pb2+ from aqueous solution by fabricated MIL-100(Fe) and MIL-101(Cr): Experimental and molecular modeling study. J. Environ. Chem. Eng. 2021, 9, 106663. [Google Scholar] [CrossRef]
  68. Gao, X.; Liu, B.; Zhao, X. Thiol-decorated defective metal-organic framework for effective removal of mercury(II) ion. Chemosphere 2023, 317, 137891. [Google Scholar] [CrossRef]
  69. Fu, L.; Wang, S.; Lin, G.; Zhang, L.; Liu, Q.; Fang, J.; Wei, C.; Liu, G. Post-functionalization of UiO-66-NH2 by 2,5-dimercapto-1,3,4-thiadiazole for the high efficient removal of Hg(II) in water. J. Hazard. Mater. 2019, 368, 42–51. [Google Scholar] [CrossRef]
  70. Rudd, N.D.; Wang, H.; Fuentes-Fernandez, E.M.A.; Teat, S.J.; Chen, F.; Hall, G.; Chabal, Y.J.; Li, J. Highly efficient luminescent metal-organic framework for the simultaneous detection and removal of heavy metals from water. ACS Appl. Mater. Interfaces 2016, 8, 30294–30303. [Google Scholar] [CrossRef] [Green Version]
  71. Zhao, X.; Gao, X.; Zhang, Y.-N.; Wang, M.; Gao, X.; Liu, B. Construction of dual sulfur sites in metal–organic framework for enhanced mercury(II) removal. J. Colloid Interface Sci. 2023, 631, 191–201. [Google Scholar] [CrossRef]
  72. Liang, L.F.; Chen, Q.; Jiang, F.; Yuan, D.; Qian, J.; Lv, G.; Xue, H.; Liu, L.; Jiang, H.L.; Hong, M. In situ large-scale construction of sulfur-functionalized metal-organic framework and its efficient removal of Hg(II) from water. J. Mater. Chem. A 2016, 4, 15370–15374. [Google Scholar] [CrossRef] [Green Version]
  73. Fang, Q.R.; Yuan, D.Q.; Sculley, J.; Li, J.R.; Han, Z.B.; Zhou, H.C. Functional mesoporous metal-organic frameworks for the capture of heavy metal ions and size-selective catalysis. Inorg. Chem. 2010, 49, 11637–11642. [Google Scholar] [CrossRef]
  74. Xiong, Y.Y.; Li, J.Q.; Gong, L.L.; Feng, X.F.; Meng, L.N.; Zhang, L.; Meng, P.P.; Luo, M.B.; Luo, F. Using MOF-74 for Hg2+ removal from ultra-low concentration aqueous solution. J. Solid State Chem. 2017, 246, 16–22. [Google Scholar] [CrossRef]
  75. Luo, X.B.; Shen, T.T.; Ding, L.; Zhong, W.P.; Luo, J.F.; Luo, S.L. Novel thymine-functionalized MIL-101 prepared by post-synthesis and enhanced removal of Hg2+ from water. J. Hazard. Mater. 2016, 306, 313–322. [Google Scholar] [CrossRef] [PubMed]
Figure 1. Flow charts for the preparation of (a) NTB, (b) MIL-101, and (c) MIL-101-NTB.
Water 15 02559 g001
Figure 2. 1H NMR spectrum of NTB.
Water 15 02559 g002
Figure 3. (a) PXRD patterns of MIL-101 and MIL-101-NTB (before adsorption); (b) TGA analysis of MIL-101 and MIL-101-NTB (before adsorption); (c) FTIR spectra of MIL-101, NTB, MIL-101-NTB (before adsorption) and MIL-101-NTB (after adsorption); (d) N2 sorption isotherms of MIL-101 and MIL-101-NTB measured at −196.15 °C.
Water 15 02559 g003aWater 15 02559 g003b
Figure 4. SEM images (a) MIL-101; (b) MIL-101-NTB (before adsorption); and (c) MIL-101-NTB (after adsorption). EDS elemental mapping images (d) MIL-101; (e) MIL-101-NTB (before adsorption); and (f) MIL-101-NTB (after adsorption).
Water 15 02559 g004
Figure 5. (a) EDS elemental mapping images of MIL-101; (b) EDS map sum spectrum of MIL-101.
Water 15 02559 g005aWater 15 02559 g005b
Figure 6. (a) EDS elemental mapping images of MIL-101-NTB (before adsorption); (b) EDS map sum spectrum of MIL-101-NTB (before adsorption).
Water 15 02559 g006aWater 15 02559 g006b
Figure 7. (a) EDS elemental mapping images of MIL-101-NTB (after Cu2+ and Pb2+ ions adsorption); (b) EDS map sum spectrum of MIL-101-NTB (after Cu2+ and Pb2+ ions adsorption).
Water 15 02559 g007aWater 15 02559 g007b
Figure 8. (a) EDS elemental mapping images of MIL-101-NTB (after Cd2+ and Hg2+ ions adsorption); (b) EDS map sum spectrum of MIL-101-NTB (after Cd2+ and Hg2+ ions adsorption).
Water 15 02559 g008aWater 15 02559 g008b
Figure 9. XPS analysis of MIL-101-NTB (before adsorption) and MIL-101-NTB (after adsorption). (a) wild survey spectra; (b) high-resolution N1s spectra; (c) high-resolution C1s spectra; and (d) high-resolution Cr2p spectra (the solid lines of the deconvoluted peaks indicate before adsorption whereas the dashed lines represent after adsorption).
Water 15 02559 g009
Figure 10. Adsorption experiments: (a) single ion batch adsorption experiments [initial concentration: 1.0 ppm; volume: 10 mL; amount of adsorbent: 10 mg; contact time: 120 min]; (b) the effect of contact time on Hg2+ ion removal efficiency [initial concentration: 10.0 ppm; volume: 10 mL; amount of adsorbent: 10 mg]; (c) the effect of Hg2+ ion initial concentration on Hg2+ ion removal efficiency [volume: 10 mL; amount of adsorbent: 10 mg; contact time: 120 min]; (d) the effect of adsorbent dose on Hg2+ ion removal efficiency [initial concentration: 10.0 ppm; volume: 10 mL; contact time: 120 min]; (e) cyclic sorption experiments [initial concentration: 10.0 ppm; volume: 30 mL; amount of adsorbent: 30 mg; contact time: 30 min; desorption agent: 5 mL of 0.2 M EDTA solution; desorption time: 30 min]; and (f) diverse ion batch adsorption experiments [quaternary mixture initial concentration: 1.0 ppm; volume: 10 mL; amount of adsorbent: 10 mg; contact time: 120 min].
Water 15 02559 g010
Figure 11. (a) Temkin plot; (b) D–R plot (linear form) of Hg2+ ions adsorption on MIL-101-NTB.
Water 15 02559 g011
Table 1. CHN analysis of MIL-101 and MIL-101-NTB (before and after adsorption).
Serial NumberSample%C%H%N
1MIL-10134.956.690.95
2MIL-101-NTB
(Before adsorption)
48.474.998.95
3MIL-101-NTB
(After adsorption)
48.225.778.18
Table 2. Surface elemental analysis in percent, obtained from XPS analysis.
Serial NumberSampleC1sCr2pN1sO1sHg4f
1MIL-101-NTB
(Before adsorption)
48.471.574.0423.55---
2MIL-101-NTB
(After adsorption)
48.222.416.2923.810.06
Table 3. Kinetic parameters of Hg2+ ions adsorption on MIL-101-NTB.
Serial NumberKinetic ModelKinetics ParametersParameter ValuesStandard Error
1Pseudo-first-order modelqe (mg/g)9.05250.0327
K1 (min−1)1.98560.08202
R20.9411---
2Pseudo-second-order modelqe (mg/g)9.12760.00324
K2
(g mg−1 min−1)
0.64910.0057
R20.9995---
3Intraparticle diffusion modelC8.91340.00795
Ki (mg/g min0.5)0.01898.3534 × 10−4
R20.3393---
Table 4. Isotherm parameters of Hg2+ ions adsorption on MIL-101-NTB.
Serial NumberAdsorption IsothermsIsotherm ParametersParameter ValuesStandard Error
1Langmuirqmax (mg/g)111.034.5919
b (L/mg)0.47250.0829
R20.9888---
2Freundlichk (mg/g)32.434.2249
n2.47910.3049
R20.9594---
3TemkinKt (mg/g)10.671.6221
b (Jol/mol)132.200.8786
R20.9848---
4D–RIntercept4.35930.1206
qmax (mg/g)78.20---
β (mol2/kJ2)
(slope)
−9.385 × 10−85.80712 × 10−9
E2.24---
R20.9738---
Disclaimer/Publisher’s Note: The statements, opinions and data contained in all publications are solely those of the individual author(s) and contributor(s) and not of MDPI and/or the editor(s). MDPI and/or the editor(s) disclaim responsibility for any injury to people or property resulting from any ideas, methods, instructions or products referred to in the content.

