Article

Luminescence Toxicological Analysis of Water Supply Systems in Dispersed Rural Areas: A Case Study in Boyacá, Colombia

by
Yadi Johaira Ramos-Parra
1,2,*,
Jaime Díaz-Gómez
1,
Mónica Viviana Mesa-Torres
1,
Sergio David Torres-Piraquive
1,
Nohora Yaneth Zipa-Casas
3,
Sandra Suescún-Carrero
3 and
Mabel Medina-Alfonso
3
1
Research Group of Water Resources Management, Department of Sanitary Engineering, Universidad de Boyacá, Tunja 150001, Colombia
2
Grupo de Investigación en Energía, Ambiente y Desarrollo (EADE), Universidad Jorge Tadeo Lozano, Bogotá 110311, Colombia
3
Secretaría de Salud de Boyacá, Grupo de Investigación del Laboratorio Departamental de Salud Pública, Tunja 150001, Colombia
*
Author to whom correspondence should be addressed.
Water 2023, 15(13), 2474; https://doi.org/10.3390/w15132474
Submission received: 25 May 2023 / Revised: 22 June 2023 / Accepted: 30 June 2023 / Published: 5 July 2023
(This article belongs to the Special Issue Drinking Water Quality and Health Risk Assessment)

Abstract

:
The quality of water supply systems is still a major problem in developing countries, especially in rural areas. The acute bioluminescence V. fischeri inhibition assay is widely recognized as a toxicological method that can be used to detect the acute effects of different contaminants. In this study, the physicochemical characteristics and toxicology of 72 water samples collected in 18 rural aqueducts located in Boyacá (Colombia) were evaluated. The primary economic activities identified as potential influencers of water quality in the water supply basins were agriculture (n = 3), livestock (n = 2), and domestic sewage discharge (n = 1). The average luminescence inhibition rate was 66%, with a minimum of 29%, and a maximum of 97%. A total of 85% of the tested samples (n = 61) had “moderate acute hazard”, while 15% (n = 15) had “acute hazard”. A total of 95% of the aqueducts distributed water with high risk. There was a weak positive correlation between the apparent color and the V. fischeri inhibition rate (p < 0.05). The water treatments, including disinfection, and the economic activities had no correlation with the inhibition rate of luminescent bacteria. The results of this investigation can be used by sanitary authorities to incorporate future toxicological monitoring of chemical contaminants, such as humic substances and metals, into water-quality monitoring in rural areas.

1. Introduction

Water chemical contamination is a threat to human health and aquatic ecosystems [1]. It is widely recognized that, worldwide, there is a significant decline in the availability of freshwater in terms of quality and quantity. This is a problem that requires attention from different stakeholders [2]. It is expected that by 2050 more than 2500 people will be consuming contaminated water with chemical substances of ecotoxicological interest [3]. The presence of these constituents in the environment has a natural and anthropogenic origin, mainly caused by runoff from agricultural activities, and domestic and industrial discharges [4]. These substances include pharmaceuticals and personal care products (PPCPs), nanomaterials, fire retardants, pesticides [5], plasticizers, surfactants, and disinfection by-products [6,7]. Considering the impact of these contaminants on aquatic life and human health, a toxicological evaluation of these substances in the water supply networks is required [8,9].
There are two ways to address this issue. Firstly, a detailed description of the water supply network is required. Secondly, it is also necessary to measure the concentrations of the microbiological and physicochemical parameters [10,11]. Recognizing the potential impact of chemical substances on human health, recent research has highlighted the importance of toxicological surveillance on water supply systems, including these constituents [12].
The toxicological evaluation of water resources is recognized as an important tool to estimate the potential risk that chemical substances pose to the environment and living organisms [13,14]. Traditional analytical systems, such as high-performance liquid chromatography and gas chromatography/mass spectrometry, which are commonly used for monitoring environmental pollution, have limitations in terms of their high operational cost, prolonged analysis time, and experienced personnel [15,16]. In recent years, toxicity testing using different techniques has made significant advances and is now recognized as an effective tool for environmental risk assessments [17].
In this regard, rapid bioassays were introduced to overcome the limitations associated with traditional analytical techniques and are used to determine the potential toxicity of a constituent in vivo [18]. Bioassays can identify the behavioral or physiological changes manifested by living organisms attributable to metabolic disruptions induced by toxic constituents [19]. The test organisms traditionally used in bioassays can be microorganisms, such as Vibrio fischeri and pseudomonas, alongside plants and algae, or invertebrates, such as Daphnia Magna, and also fish [20].
A bacterial bioluminescence-based assay was described in its current form in 1969 and later modified into an enzymatic bioluminescent technique [21]. Bioluminescence occurs from in situ enzyme-catalyzed chemical transformations [22]. Luminous bacteria are ubiquitous and primarily inhabit the marine ecosystem as free-living or parasitic organisms [23]. The assay is based on the correlation of the changes in the kinetic characteristics of the chemiluminescence reaction with the toxicity of the tested constituent. Typically, the luminescence test uses luminescent bacteria or isolated organisms, such as V. fischeri, V. Harvey, Pseudomonas fluorescens, and Pseudomonas leiognathi. The V. fischeri test is recognized for its simplicity, low cost, and high sensitivity, and it is especially suitable as a biological detector because the luminescence metabolism of the bacteria is directly related to energy metabolism [24].
The bioluminescence assay using V. fischeri was initially commercialized as a Microtox® test (Modern Water, Canada). Currently, the assay is used to assess the toxicity of different substances, such as organic and inorganic compounds, wastewaters, surface waters, sludge, leachate, pesticides, and treated wastewater [25]. At present, the bioassay is widely recognized and accepted as a toxicity test and has been normalized by the ISO 11,348 norm. V. fischeri is a non-pathogenic biosafety level (BSL-1) organism that is related to pathogenic Vibrio species, such as Vibrio cholera. In a recent study, [26] assessed the toxicity of Luoma Lake’s water quality by conducting acute toxicity tests on V. fischeri. They compared the luminescence test results with variations in pH, hardness, turbidity, and dissolved oxygen.
As a result, the correlation analysis revealed that only dissolved oxygen exhibited a weak but statistically significant positive correlation, with a Pearson correlation coefficient of 0.455 (p < 0.05). Furthermore, [27] demonstrated the potential of the V. fischeri luminescence test to evaluate the acute toxicity of various drugs found in wastewater, including antibiotics, antihistamines, antifungals, steroidal, and non-steroidal anti-inflammatories. Recently, [28] demonstrated that the luminescence of V. fischeri and the respiration activity of activated sludge bacteria can be utilized to establish a reliable test system for measuring bacterial toxicity. More recently, [29] conducted a study to analyze the effectiveness of biotoxicological assays in testing effluent waters from the Adriatic Sea along the Italian coast, for both surface waters and marine sediments. They concluded that the V. fischeri toxicity luminescence test was a useful tool for detecting the presence of pollutants and can be employed in environmental safety and protection assessments.
In Colombia, evaluations of water supply quality and toxicity have been conducted in both urban [30] and rural areas [31]. To ensure the quality of drinking water, maximum acceptable levels were established for physical, chemical, and bacteriological characteristics. Decree 1575 in 2007 created the drinking water control and protection system (SPCCA) and quality control instruments, such as the drinking water quality risk index (IRCA). The IRCA is an index that assesses the quality of drinking water considering Colombian legislation. It measures the risk of becoming ill as a result of the consumption of supplied water with certain physicochemical and bacteriological characteristics.
It is acknowledged that in rural areas the water quality supply can be influenced by anthropogenic activities, such as agriculture and livestock. Taking this into consideration, the aim of this study was to evaluate the water toxicity in dispersed rural water supply systems of Boyacá (Colombia) using luminescence bioassays and identify its relationship with water quality measurements. Additionally, the IRCA index and the presence of economic activities upstream of the water catchment area were considered. To our knowledge, this study is the first evaluation of rural water supply systems in Colombia aiming to evaluate physicochemical water supply characteristics with acute toxicity.

2. Materials and Methods

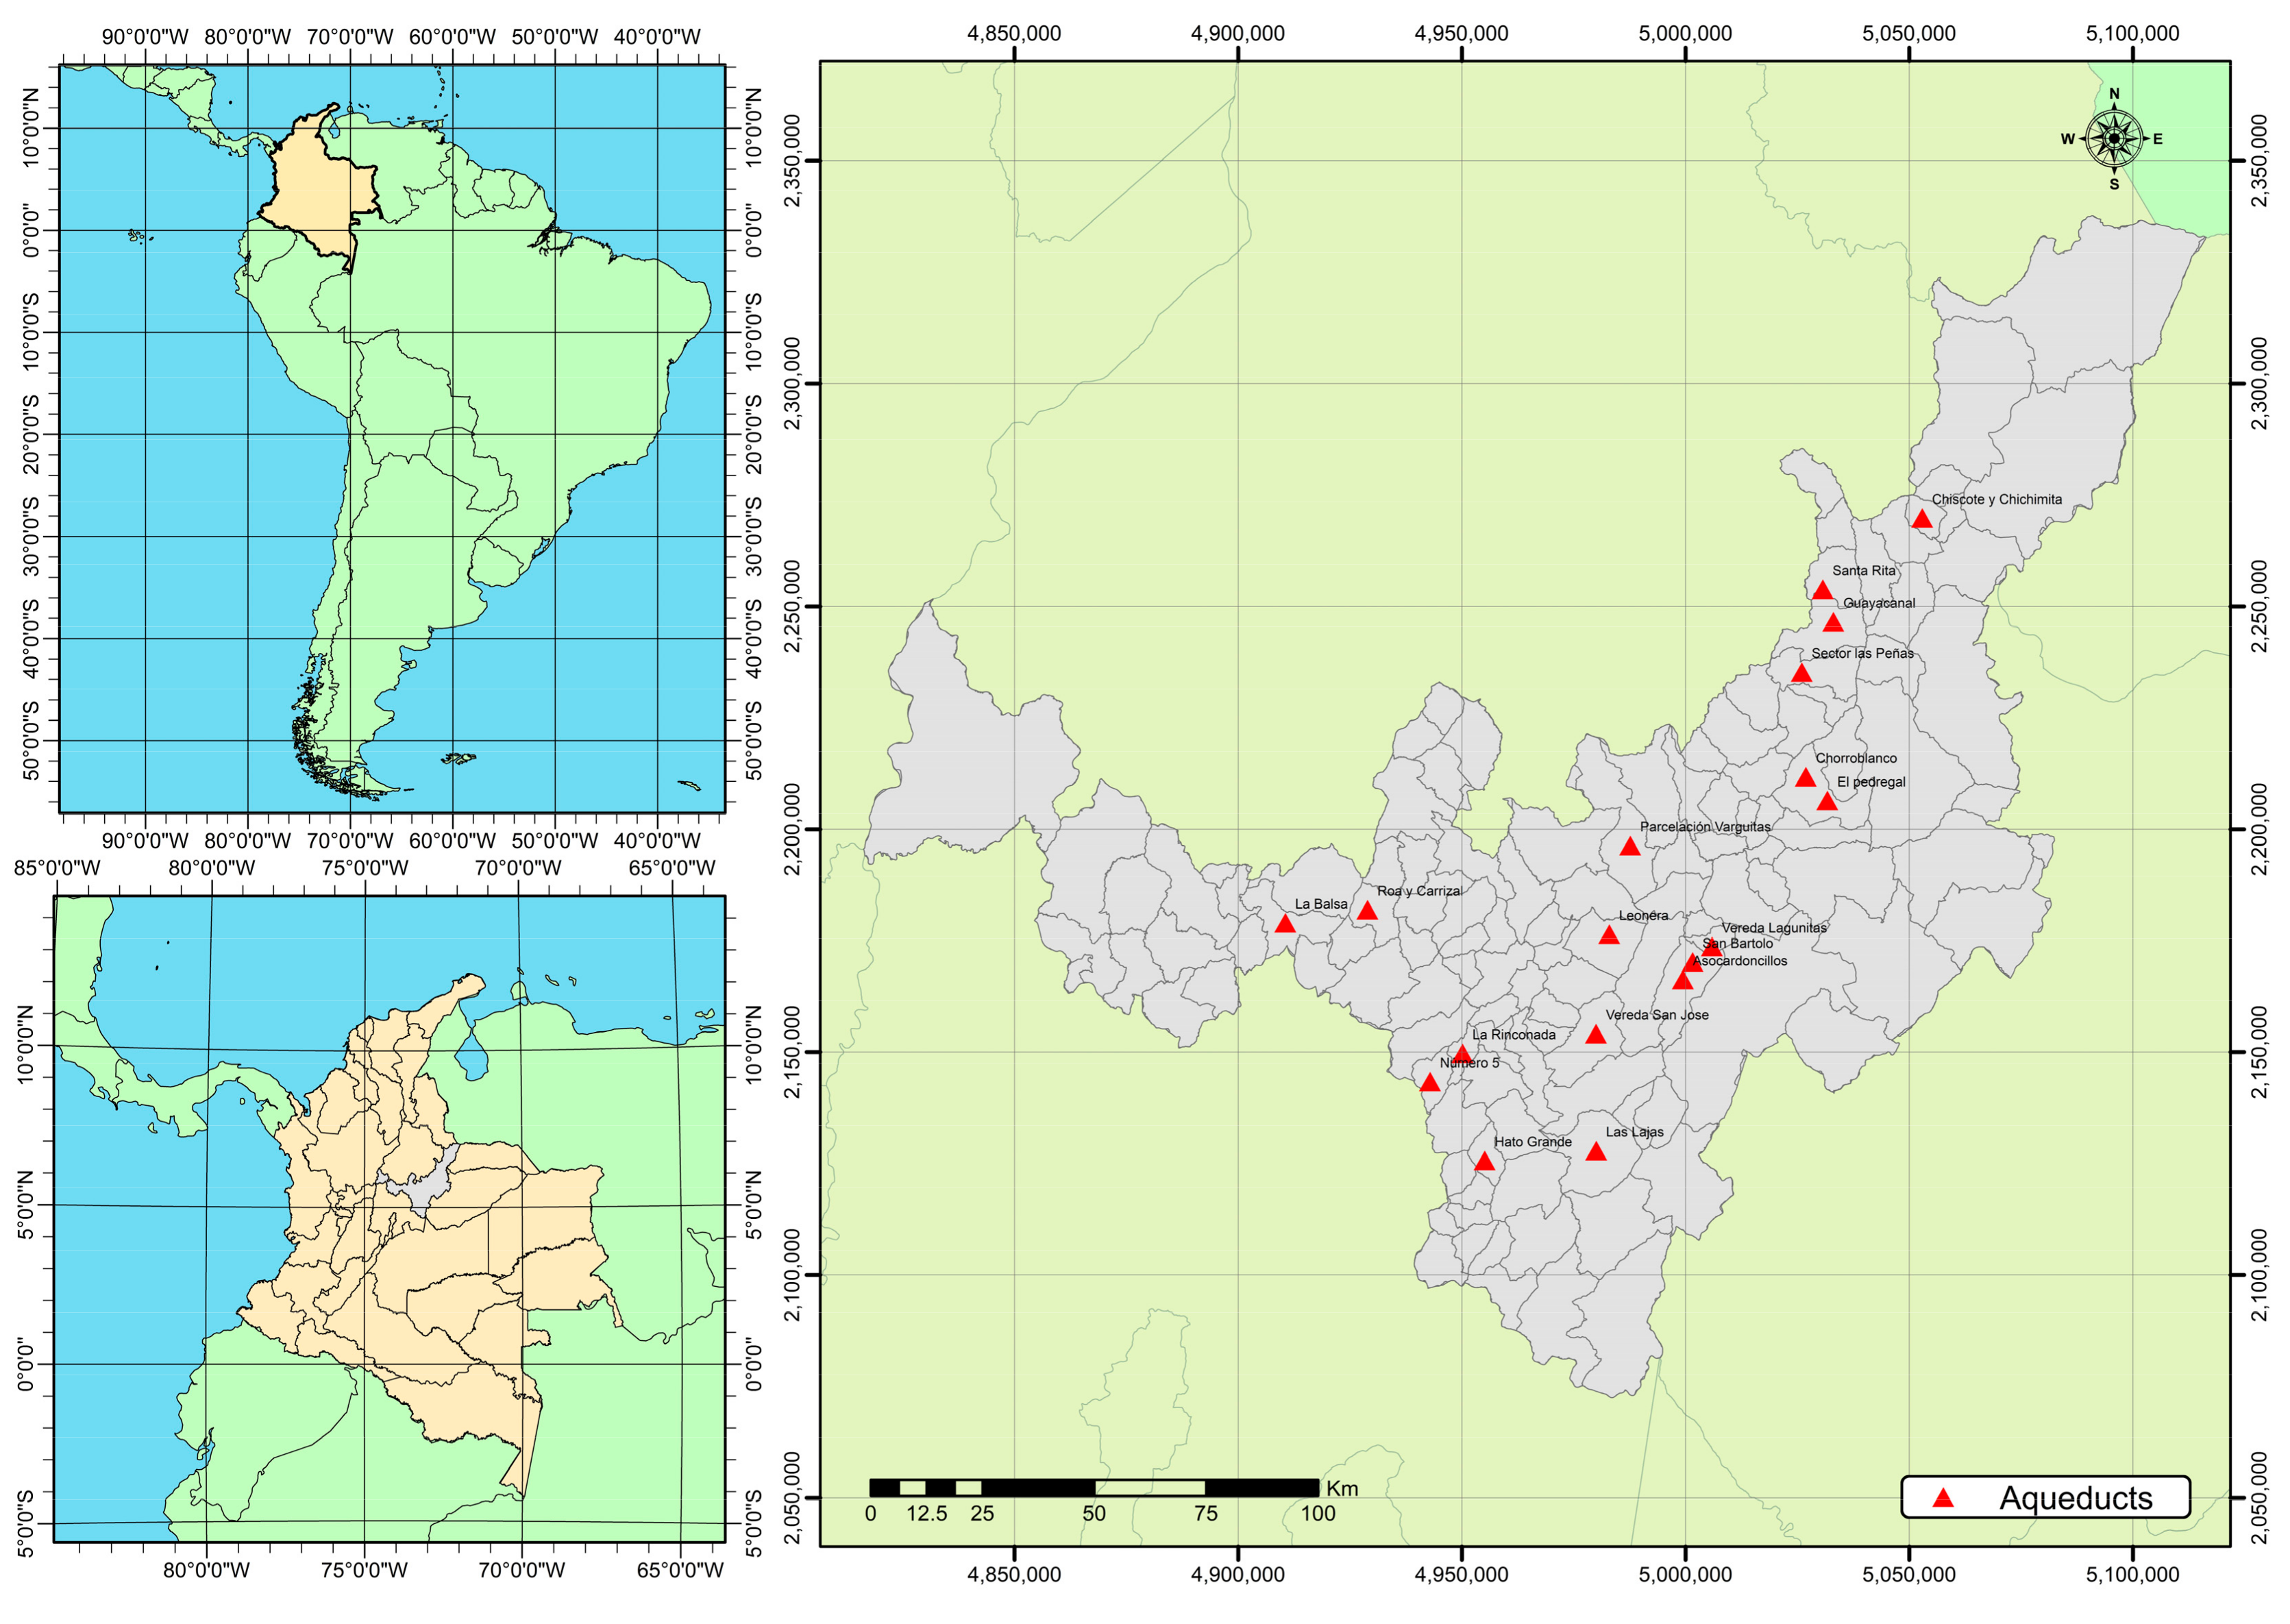
2.1. Description of the Study Area

Boyacá is located in the Colombian Andean Region at an average altitude of 2440 m above sea level. Due to its altitude and geographical location, the average environmental temperature is 14 °C. There are two seasons, a wet season from April to May and October to November, and a dry season from December to January and July to August. The average precipitation is 590 mm/year and varies monthly from 10 mm to 85 mm. Boyacá is recognized for its diverse economic activities, such as agriculture, livestock, mining, and tourism, which are mainly concentrated in rural areas. The rural area is characterized by small-scale agriculture on plots of about 1–3 ha [32].
The water samples (n = 72) were collected from 18 rural water supply networks, as shown in Figure 1. The selection of these aqueducts was made considering the population being served, reported cases of diarrhea, and potential impacts on the water supply quality, water intake, and the water supply distribution network caused by economic and productive activities [33].

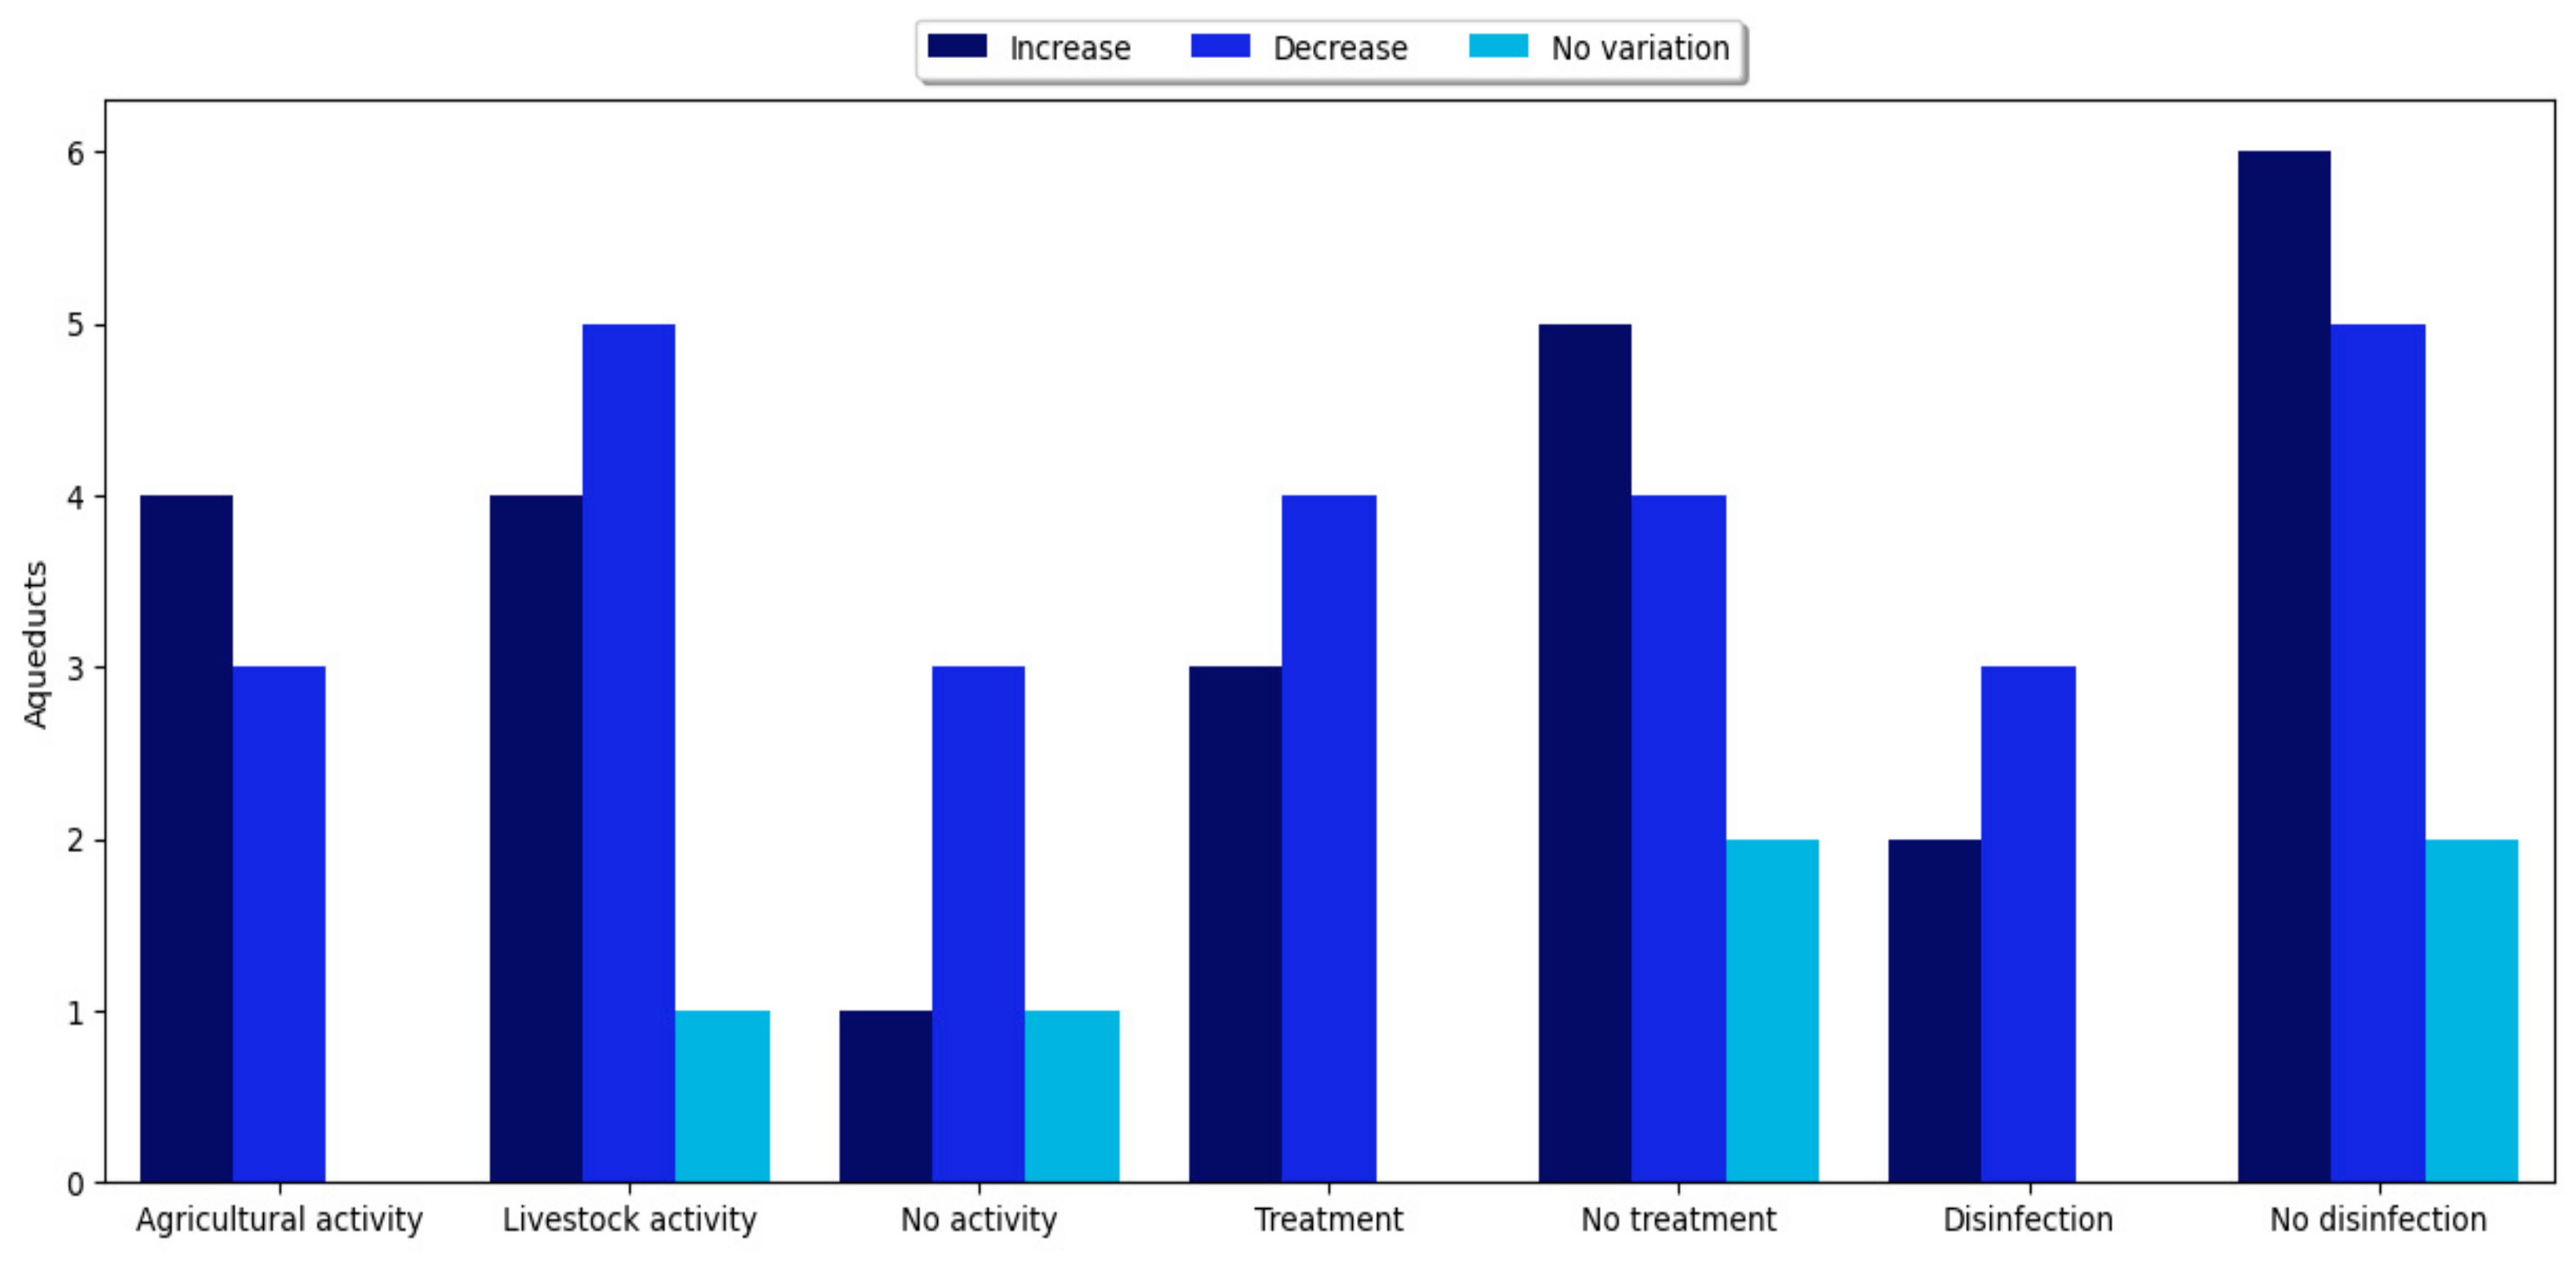
2.2. Economic Activities Identification

A field visit was conducted to assess the water intake systems and examine the area located 2 km upstream to identify any anthropogenic activities that may impact water quality. These activities include direct domestic discharges, runoff from agricultural or livestock areas, and mining operations. Additionally, an evaluation of the existing water supply infrastructure was performed, which included the characteristics of the water treatment system, while the use of chemicals for coagulation and disinfection was also examined.

2.3. Water Quality Evaluation

The water samples were collected from the water source, the water treatment plant effluent, and the water distribution networks between July 2022 and February 2023. Each sampling point was geographically located using a geographic positioning system (GPS, Garming Montana 750i). The samples were preserved and analyzed at the Laboratory of Environmental Studies at the University of Boyacá (Tunja, Colombia). The Residual Chlorine (HACH Kit reference 10223, Loveland, CO, USA) and pH were quantified in situ using a HACH multiparameter (HQ40D). Turbidity was measured using a portable meter (HACH, 2100Q) and the apparent color was determined using a spectrophotometer HACH (DR 2800). Conductivity was quantified using a Metrohm® (Herisau, Switzerland) meter (712 Model), fluoride was measured using a HACH meter (HQ 40D) with a selective electrode (HACH, ISEF121), and total organic carbon was determined through digestion in a digestion reactor (HACH DR200) and subsequent spectrophotometric analysis (HACH, DR2800).
The E. coli and total coliforms were quantified using the membrane filter technique (MF), using the defined substrate method (DSM) with Colisure (IDDEX Kit, Westbrook, ME, USA) for samples without turbidity, and with Colilert (IDDEX) for samples with turbidity. Nitrate, nitrite, and sulfate were measured in a HACH spectrophotometer (DR5000). The analytical techniques followed the procedures recommended by APHA [34].
To ensure the quality of drinking water, Colombia established maximum acceptable levels for physical, chemical, and bacteriological characteristics. Decree 1575 of 2007 established the drinking water control and protection system (SPCCA) with quality control instruments, such as the drinking water quality risk index (IRCA).
IRCA was calculated using Equation (1) [35] and considered 15 physicochemical and microbiological parameters, each with assigned scores; see Table 1.
R i s k   s c o r e s   f o r   n o n c o m p l i a n t   p a r a m e t e r s R i s k   s c o r e s   o f   m e a s u r e d   p a r a m e t e r s = I R C A

2.4. Bioluminescence Test

The sample toxicological evaluation was performed using the V. fischeri luminescence bioassay following the methodology of ISO 11348-3 [36]. The V. fischeri (NRRL B-11177) bacteria were activated by adding an aspersion of 1 mL of reconstitution solution 3 times and letting it rest for 15 min. A stock solution was prepared by diluting 1 mL of the activated bacteria in 50 mL of a NaCl 2% p/v solution, with the temperature varying from 5 °C to 15 °C in a thermoblock (EchoTherm Digital, Model IC22, Torrey Pines Scientific, Carlsbad, CA, USA).
A preliminary toxicological evaluation was conducted on undiluted samples by following the procedure recommended by the Mexican Norm NMX-AA-112-SCFI-2017. This procedure is recommended as an initial assessment to differentiate between toxic and non-toxic samples. Toxic samples were classified as those with a luminescence inhibition of 10% compared to the control.
The inhibition effect of the samples and dilutions was compared with a non-toxic control (NaCl, 2% solution), measuring the luminescence at 0 and 30 min using a Macherey Nagel BioFix Lumi-10 Luminometer. Toxicity tests were carried out at room temperature (19 ± 1 °C).
The inhibition effect after 30 min was calculated using Equation (2) [36]:
I c t I T t I c t × 100 % = % H t ,
where
  • Ht: inhibitory effect of a sample after 30 min (%).
  • Ict: the corrected value of I 0 for the samples after the addition of the sample.
  • ITt: luminescence intensity of the sample after a contact time of 30 min, measured in relative light units (RLU).
The risk classification was determined based on the luminescence inhibition effect and the toxicity grade, following the recommendation of [37], as shown in Table 2.

2.5. Data Analysis

The water-quality parameters measured at different sampling sites were evaluated using central tendency statistics. Their correlation with the inhibition effect was determined using the Spearman coefficient [38]. A p < 0.05 was considered statistically significant. A graphic description of the methodology is presented in Figure 2.

3. Results

3.1. Description of the Rural Water Supply Systems

In this study, a total of 72 samples taken from water supply systems were analyzed. The field investigation revealed that 60% of the studied aqueducts provided were from an untreated water supply, while 40% received water treatment in compact units that consisted of coagulation–flocculation (n = 1), sedimentation (n = 5), filtration (n = 5), and disinfection (n = 5). On average, 50 users received a water supply that originated from surface lotic systems (n = 16) and lentic systems (n = 2), see Table 3.
The main anthropogenic activities identified in the study area included agriculture (n = 7), livestock (n = 10), sewage discharges (n = 2), mining (n = 1), and unidentified sources (n = 5). The water supply systems lacked skilled operators and regular monitoring programs for both raw and treated water qualities [38].

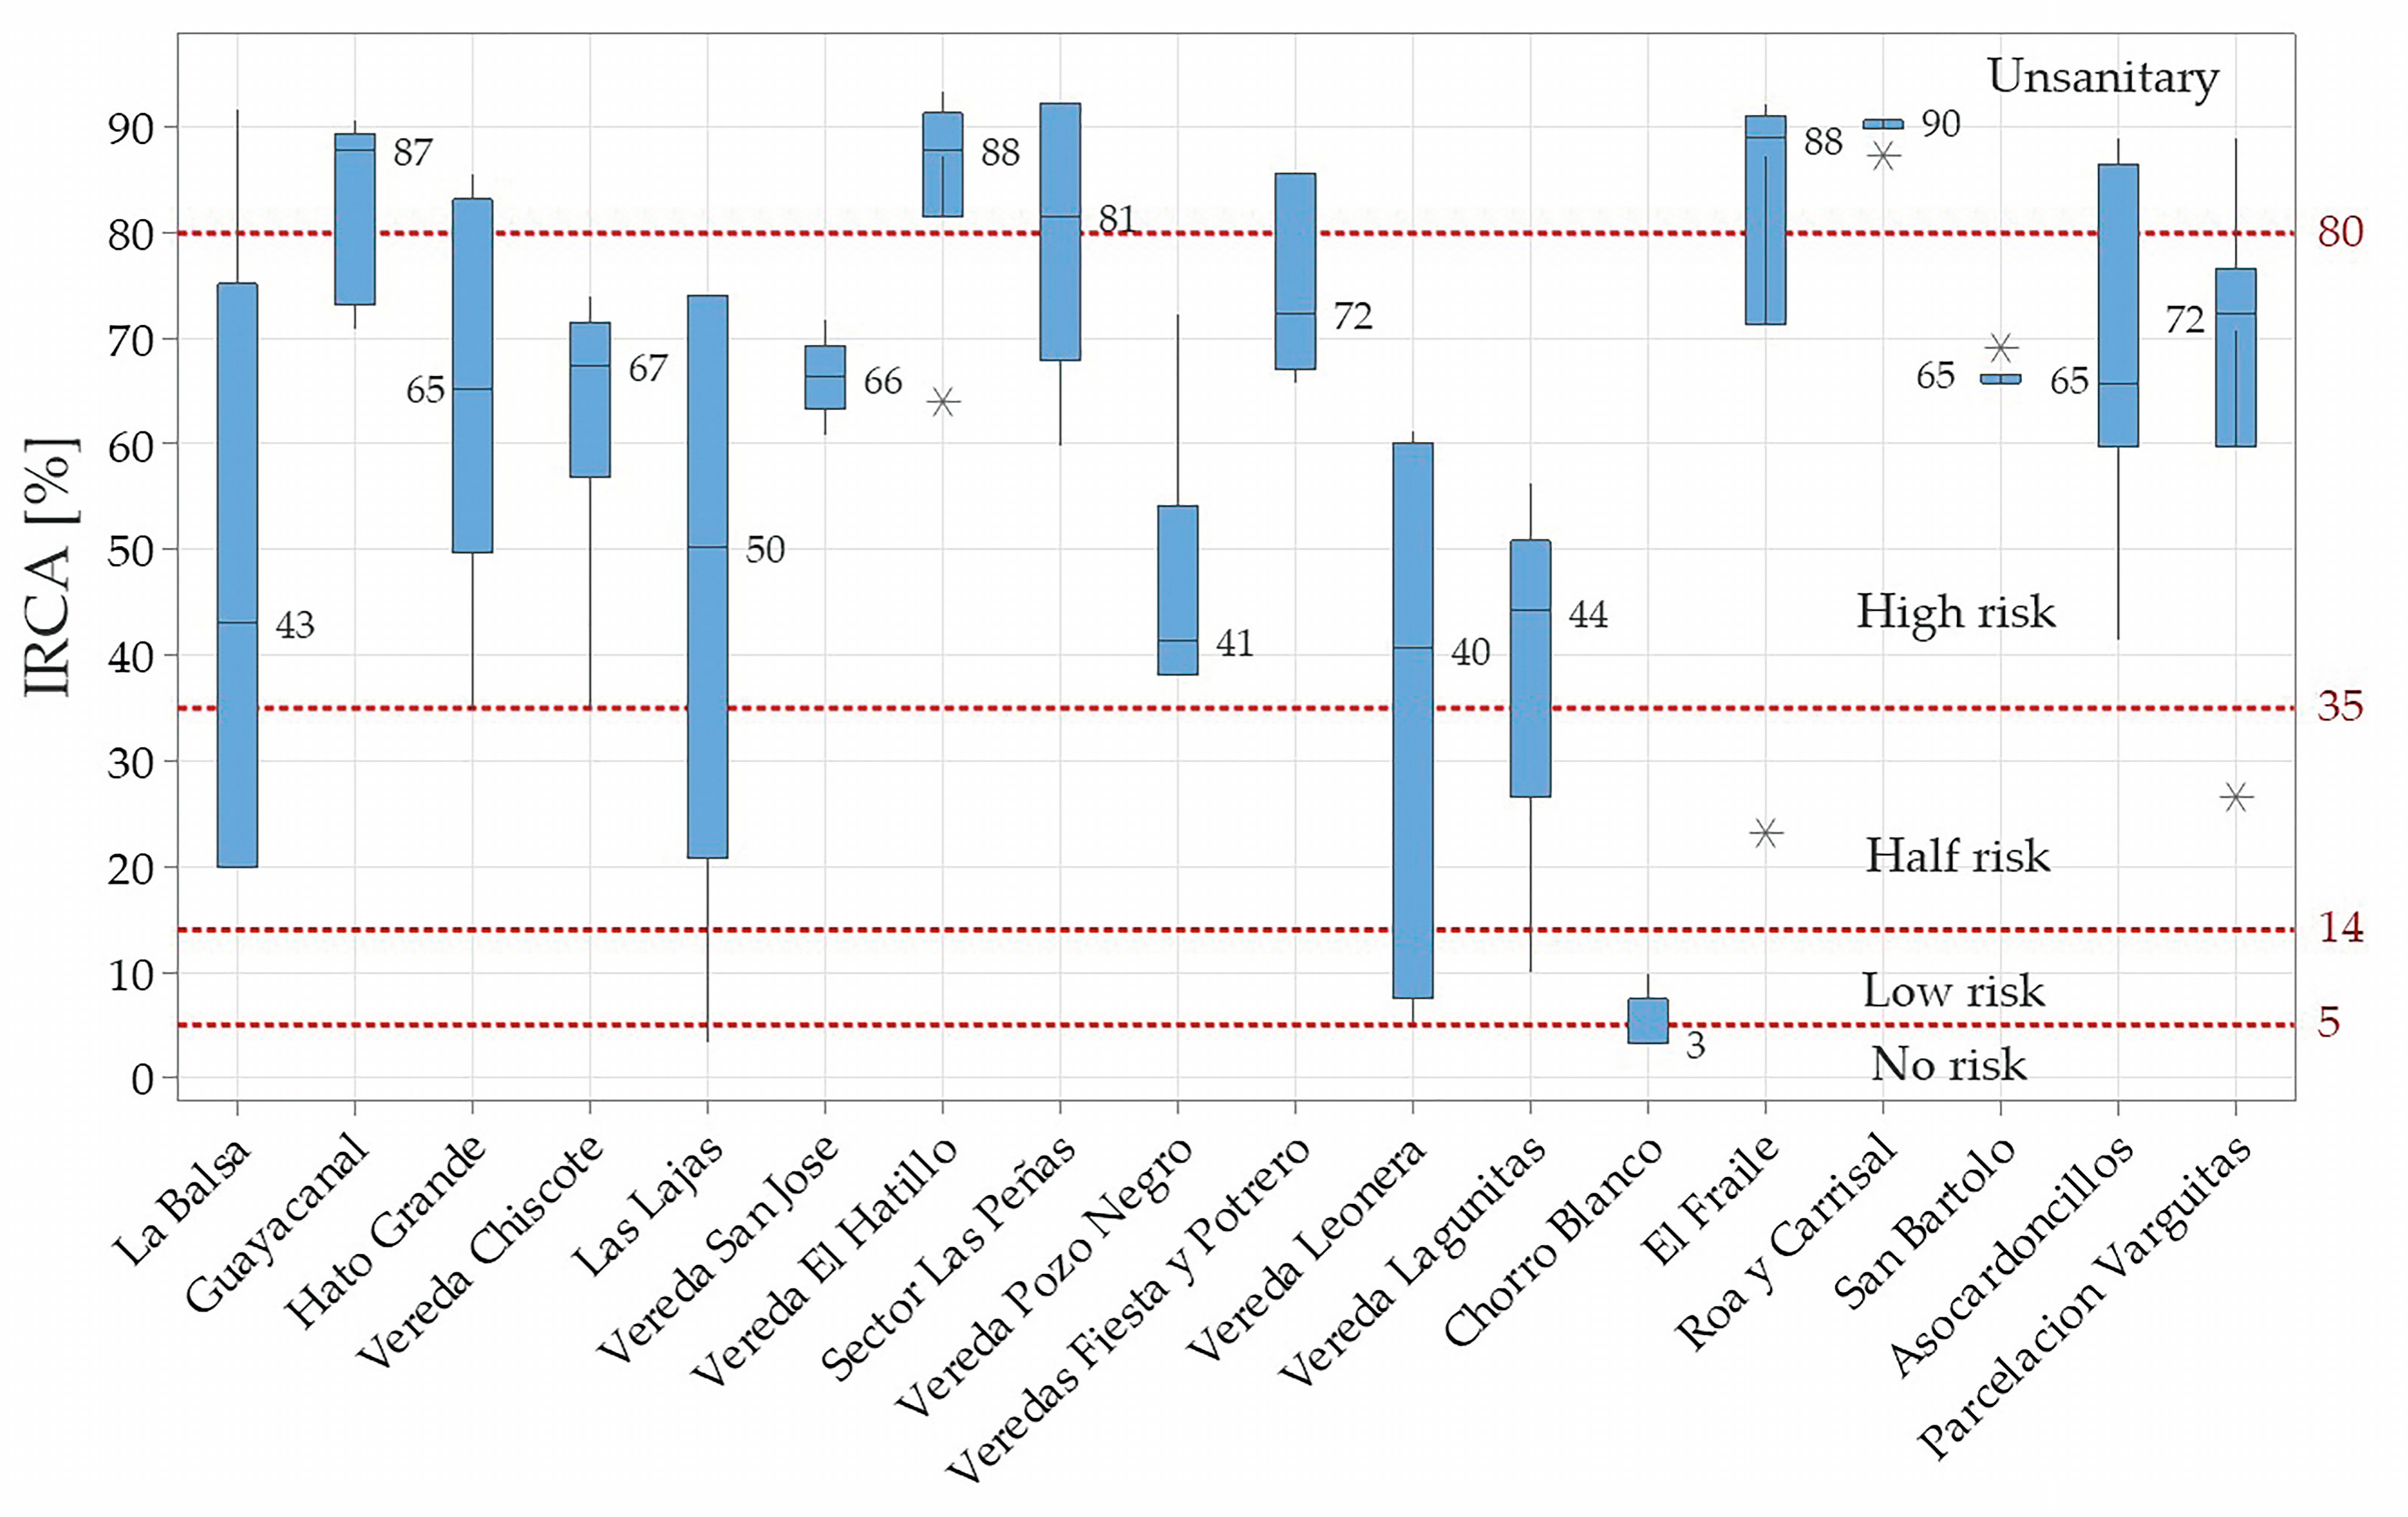
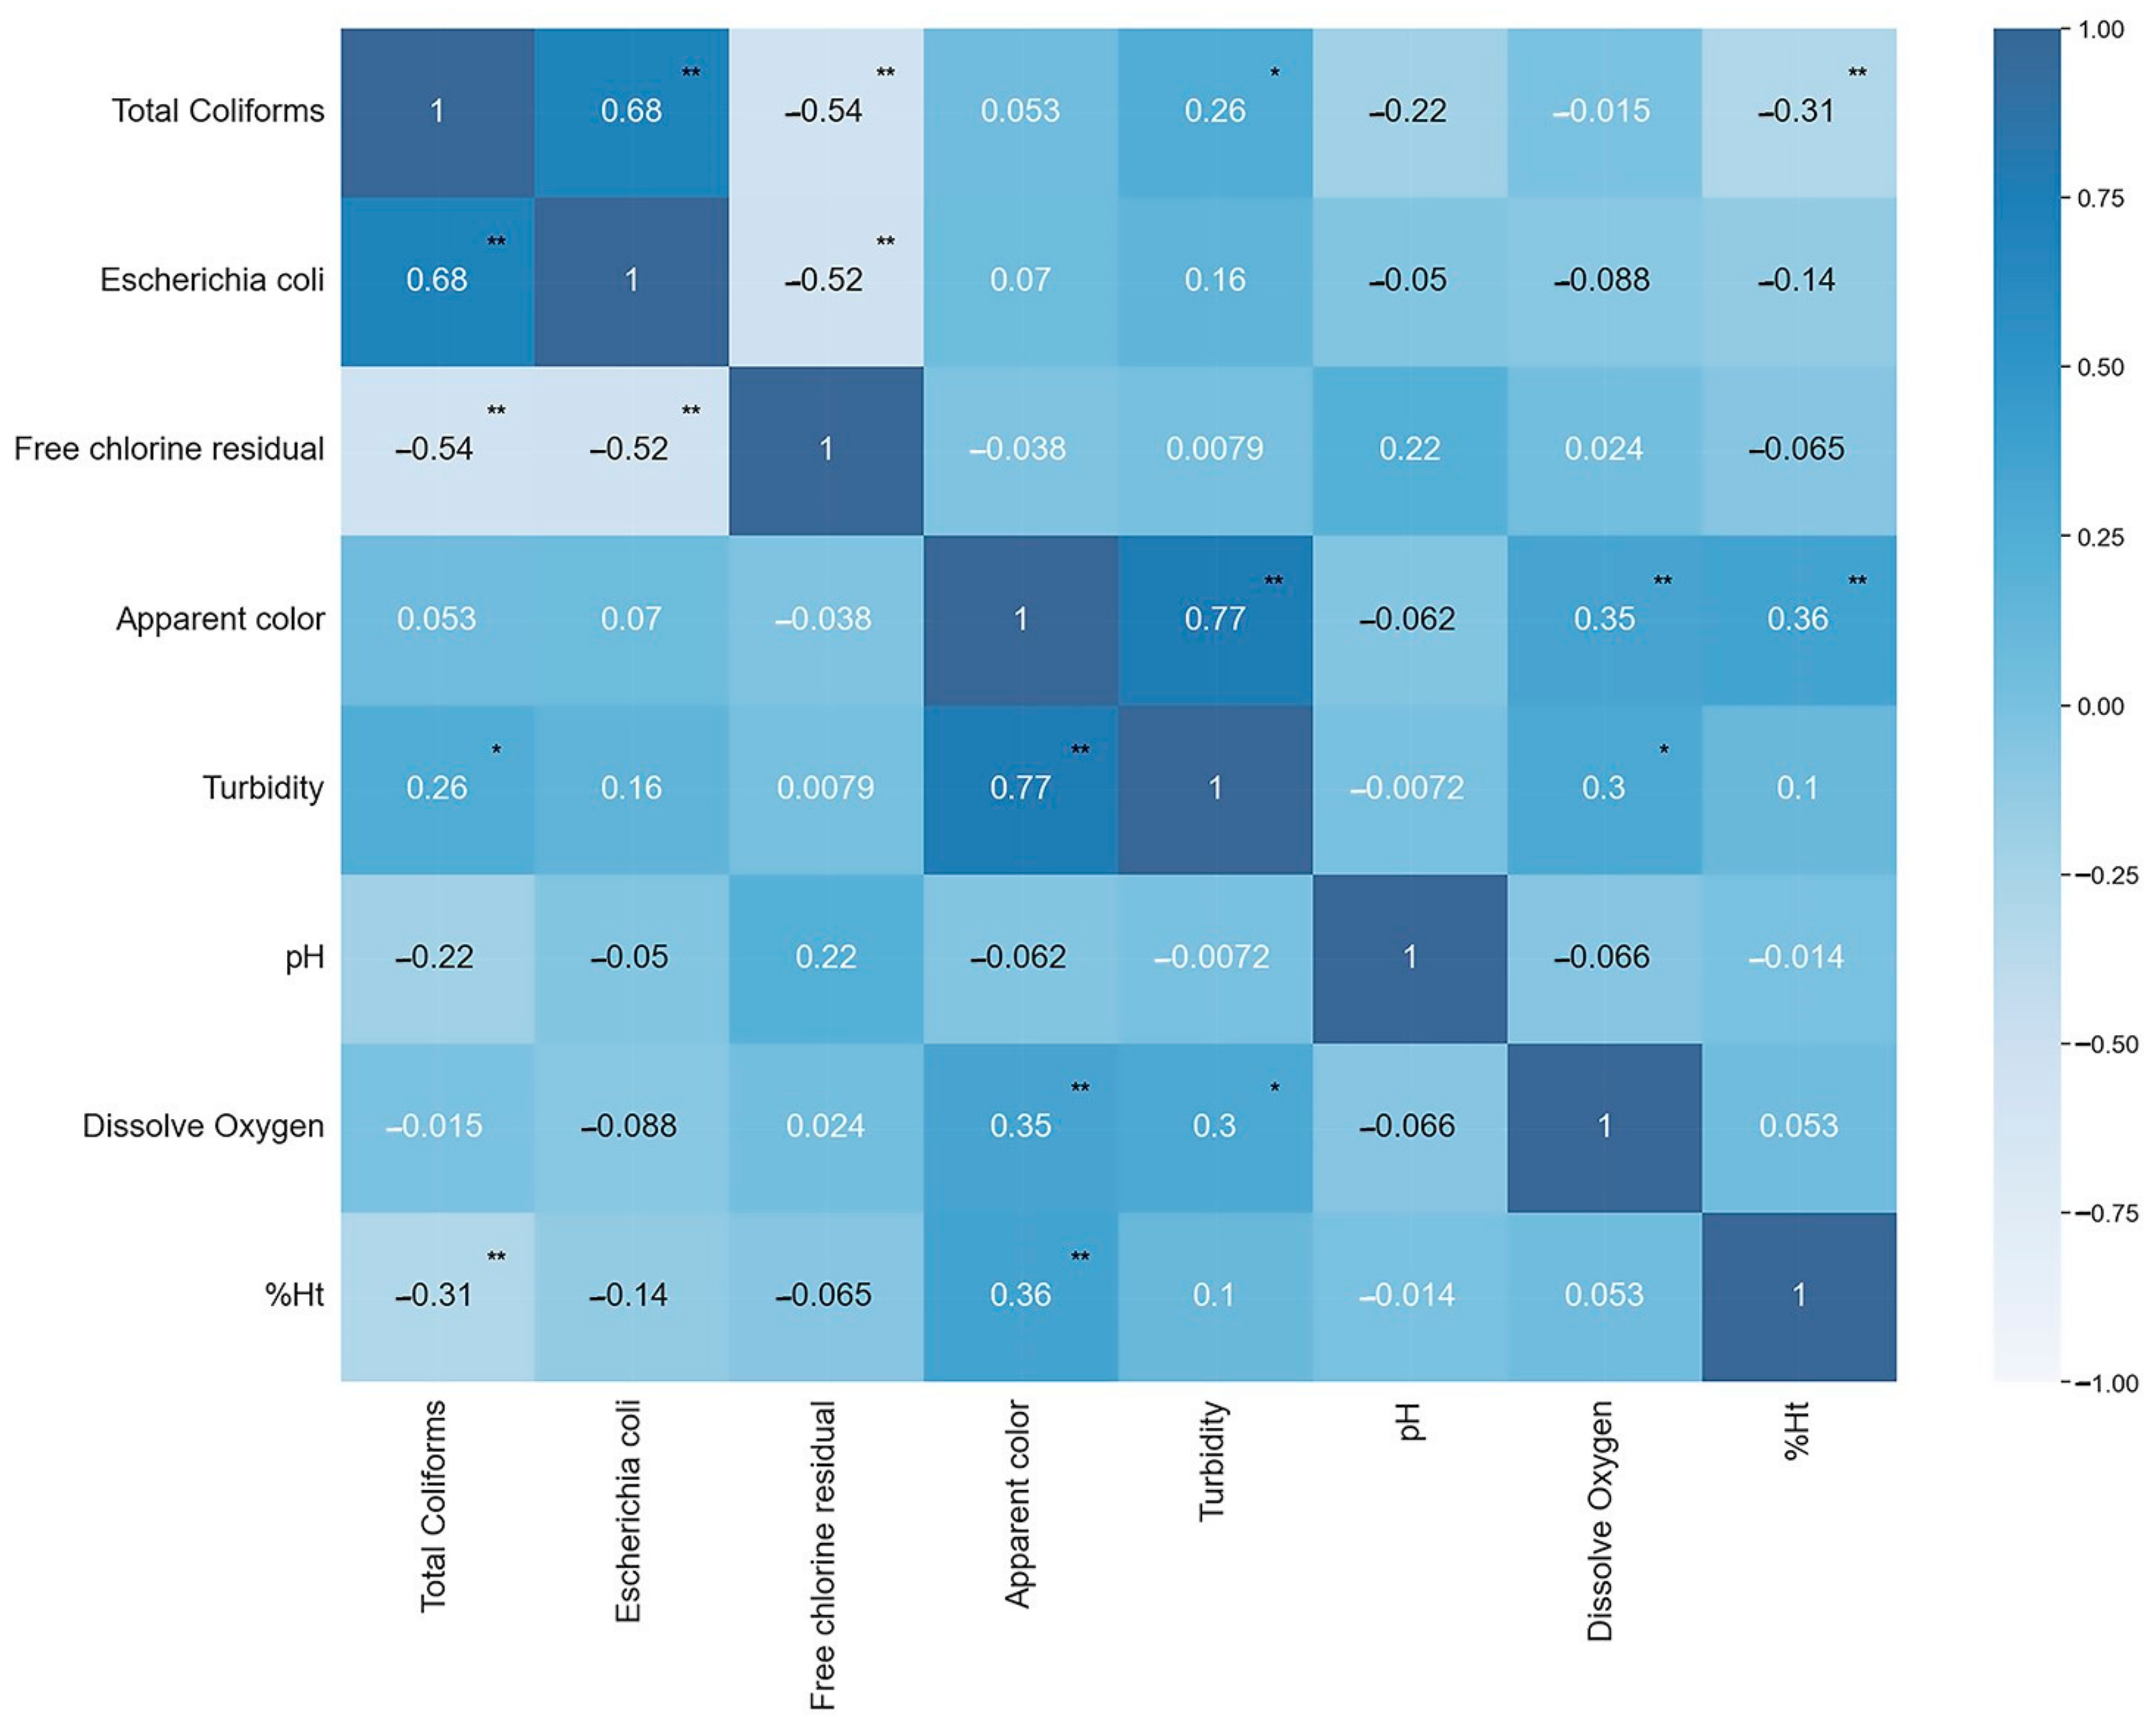
3.2. Characterization of Drinking Water Quality

Taking into account the Colombian legislation for water supply quality, the critical parameters that contribute to increasing the risk of poor water supply consumption include total Coliforms, E. coli, and the absence of free residual chlorine. Among the evaluated systems, five were found to be disinfected with chloride but only one provided a water supply with a microorganism concentration below that required by Colombian regulations. The average chloride concentration was 0.8 mg/L (sd = 0.34).
This study revealed that 95% of the evaluated water supply systems reported the presence of total coliforms (m = 980.19 NMP/100 mL, sd = 945.12) and E. Coli (m = 40.37 NMP/100 mL, sd = 128.39) in both the water catchment and household water. The average apparent color value was 28 Pt–Co units (sd = 39), a value that was higher than the Colombian legislation limit. The average turbidity was 3 NTU (sd = 5.4), the average dissolved oxygen concentration was 5.5 mg/L (sd = 1.37), and the average pH was 6.7 (sd = 0.91).
Table 4 shows the average values of the physicochemical and microbiological parameters, measured at different sampling points within the water distribution systems. The Kruskal–Wallis nonparametric test conducted at a 5% significance level indicated no significant difference in the evaluated parameters from the different perspectives of the water supply system. This lack of statistical significance is associated with the absence of treatment, and the presence of economic activities in areas near the water catchment.
Table 5 presents a statistical analysis of the IRCA values of the aqueducts. The Shapiro–Wilk test was conducted to assess the normal distribution of the IRCA values for the aqueducts La Balsa, Guayacanal, Hato Grande, Huerta Vieja, Las Lajas, San Jose, Puerto Romero, Sector Las Peñas, Fiesta y Potrero, Leonera, Lagunitas, Chorro Blanco, Roa y Carrisal, San Bartolo, and Asocardoncillos, which did not reject the null hypothesis, whereby the information follows a normal distribution (p > 0.05). However, for the aqueducts Vereda Chiscote, Vereda El Hatillo, Vereda Pozo Negro, El Fraile, and Parcelacion Lagunitas, the null hypothesis of normal probability distribution was rejected (p > 0.05).
Table 5 shows that the water quality of the Chorro Blanco aqueduct complied with the Colombian regulation (Resolution 2115 of 2007) throughout the evaluation period, showing low data dispersion.
Figure 3 shows a box plot with the IRCA values of the evaluated aqueducts. It includes the scale and classification considered by Colombian legislation and the median IRCA values. The majority of the evaluated aqueducts have an IRCA value that corresponds to high risk (35.1–80) and non-viable sanitary values (80.1–100). The most dispersed datasets correspond to La Balsa, Las Lajas, and Vereda Leonera.

3.3. Bioluminescence Test Results

The average luminescence inhibition rate across all water samples was 66% (sd = 14.7), with a minimum of 29%, and a maximum of 97%. Table 6 shows the luminescence inhibition rate at the different points of each water system. In four systems, the inhibition rate increased by more than 10% from the water catchment to the water distribution network. This observation aligns with water systems exhibiting high concentrations of total coliforms (n = 2, > 2419 CFU/100 mL). The primary economic activities identified as potential influencers of water quality in the water supply basins were agriculture (n = 3), livestock (n = 2), and domestic sewage discharge (n = 1).
Figure 4 shows that, in this study, the variation in the V. fischeri inhibition rate in the water catchment or the water distribution network was not related to the presence of economic activities or specific water treatment.
The evaluation of toxicity levels using the classification proposed by [32] revealed that the water supply in the studied rural aqueducts exhibited a moderate acute hazard with an average %Ht of 43 (media = 43; sd = 13.28); see Figure 5. In this study, 85% of the tested samples (n = 61) had “moderate acute hazard”, and 15% (n = 15) “acute hazard”. Among the 7 aqueducts that reported acute hazard, the samples were collected from the water catchment (n = 4), treatment effluent (n = 2), and water supply distribution network (n = 5). Additionally, the samples with the highest concentrations of apparent color (minimum: 3 PCU; maximum: 42 PCU) exhibited an acute hazard.
There were no significant statistical differences in terms of %Ht toxicity levels among the aqueducts when considering the economic activities that were conducted near the water catchment and the presence or absence of a treatment system. However, it was observed that, in the Las Lajas and Fraile aqueducts, the %Ht value increased by more than 10% after the disinfection process.
The relationship between the physicochemical parameters (turbidity, apparent color, pH, and dissolved oxygen) and microbiological parameters (total coliforms and E. coli), as well as the bioluminescence inhibition percentage, were evaluated using the Spearman’s correlation, as shown in Figure 6.
It can be observed that there was no significant statistical correlation between the physicochemical parameters (turbidity, pH, and dissolved oxygen) and E. coli for the V. fischeri inhibition rate. However, a weak negative correlation between the total coliforms and the V. fischeri inhibition rate (p < 0.05) was observed. Additionally, there was a weak positive correlation between the apparent color and the inhibition rate (p < 0.05), indicating that higher values of apparent color increase the V. fischeri inhibition rate.

4. Discussion

The water catchments of the studied aqueducts are located in rural areas with soils rich in organic matter, which could contribute to the V. fischeri inhibition rate. It is known that the apparent color is associated with the presence of humic substances, with origins in the degradation of soil organic matter [39,40]. A previous study [41] demonstrated that high concentrations of humic substances can increase water toxicity. According to [42], the inhibition rate of V. fischeri changed weakly with high concentrations of humic substances. This was related to the use of carbon as a metabolic source of energy. Additionally, as was demonstrated by [10], the potential toxicity caused by unknown chemical substances produced by domestic and livestock activities requires a complementary analysis to identify its potential effect on the luminescence inhibition rate.
Furthermore, other investigations have identified a positive correlation between high apparent color in water sources and the presence of metals [43]. These investigations link economic activities, such as agriculture and livestock, near water catchments to high concentrations of heavy metals, such as cadmium, lead, copper, and zinc. The presence of these metals poses a toxicological risk to both humans and ecosystems [44,45]. Therefore, an evaluation of the use of these metals in aqueducts that reported acute toxicity levels is recommended [46]. The effects of humic substances on the toxicity of copper, zinc, and lead and their binary mixtures were investigated using V. fischeri as a test organism, as well as functions of time and concentrations [47]. The toxicities of copper and lead were generally comparable, while the toxicity of zinc was lower than that of the other two metals. The toxicity of copper decreased with the addition of humic acids, while the toxicity of zinc remained almost constant. On the other hand, the toxicity of lead increased. The conclusion is that the environmental potential risk posed by a chemical must be evaluated by taking into account other constituents that may interact with the specific constituent.
The results of this investigation contrast with those reported by [48], who concluded that the V. fischeri luminescence inhibition rate has a negative correlation with the apparent color and a positive correlation with the total coliform concentration. However, when discussing their results, they mention that the negative correlation of color and the inhibitory effect is incorrect since samples with suspended or dissolved substances can absorb some of the light produced by V. fischeri, thereby making them appear more toxic.
Regarding the positive correlation between V. fischeri and the total coliforms, the same authors suggested that it may be attributed to a response resulting from competition for available oxygen, which can influence the bioluminescence produced by the bacteria, as it is linked to its respiratory metabolism. This is different from what is reported in this study because the water samples did not exhibit a similar pattern in relation to high inhibition rates and the presence of total coliforms.

5. Conclusions

Toxicity evaluation is a valuable method used in environmental pollution monitoring programs to assess the safety of water supply systems. In this research, a toxicity evaluation using luminescence bacteria was employed as a fast and cost-effective technique to assess the risk of 18 aqueducts located in dispersed rural areas of Boyacá (Colombia). Of the 18 rural aqueducts that were studied, only 40% treated the water prior to distribution. The main economic activity carried out in the catchment source is keeping livestock (n = 10). The parameters that contribute the most to the risk associated with the consumption of unsafe water are total coliforms and E. coli. The average luminescence inhibition rate across all water samples was 66%, with a minimum of 29%, and a maximum of 97%. The classification of the toxicity exhibited a moderate acute hazard with an average %Ht of 43.
Comparing the behavior of the inhibitory effect in the samples according to the collection point, it was observed that it remained in the system; that is, the treatment or distribution does not lead to an alteration in the reduction in bioluminescence in V. fischeri.
For the 7 aqueducts that reported an acute hazard, the samples were collected from the water catchment (n = 4), treatment effluent (n = 2), and water supply distribution network (n = 5). Additionally, the samples with the highest concentrations of apparent color (minimum: 3 PCU; maximum: 42 PCU) exhibited an acute hazard. The inhibition rate increased by more than 10% from the water intake to the water distribution network in the aqueducts that added chlorine as a disinfectant. This aspect requires additional analysis of the incidence of chlorine in the luminescence of V. fischeri. The results showed that 85% of the rural water supply systems exhibited a moderate acute hazard and 15% exhibited a moderately acute hazard. This finding is consistent with the calculation of the drinking water quality risk index (IRCA), which indicated that 95% of the aqueducts were classified as having a high acute risk hazard or being unsanitary.
A weak positive correlation (p < 0.05) was observed between the apparent color and the V. fischeri inhibition rate. This could be attributed to the presence of high humic substances or a metal concentration that can enhance the bacterial inhibition rate. A weak negative correlation (p < 0.05) was found between the total coliforms and the V. fischeri inhibition rate. The water treatments, including disinfection, and the economic activities near the aqueducts showed no correlation with the inhibition rate of the luminescent bacteria. The classification of toxicity used in this article is a useful tool for facilitating the understanding of the results and their adaptation to rural contexts or small communities. Further investigations are recommended to identify the specific constituents that can affect the inhibition rate of luminescent bacteria. These findings can be utilized by the sanitary authorities to include these contaminants in water-quality evaluation programs in rural areas.

Author Contributions

Y.J.R.-P.: conceptualization, validation, investigation, resources, writing—original draft, writing—review and editing, project administration; J.D.-G.: conceptualization, methodology, validation, investigation, resources, writing—original draft, writing—review and editing, visualization, project administration; S.D.T.-P.: writing—review and editing, data acquisition; M.V.M.-T.: writing—review and editing, supervision, data acquisition; S.S.-C.: investigation, writing—review and editing; N.Y.Z.-C.: investigation, writing—review and editing; M.M.-A.: investigation, writing—review and editing. All authors have read and agreed to the published version of the manuscript.

Funding

This study was funded by the Ministry of Science, Technology, and Innovation—Minciencias (Colombia-grant No. 844-2019).

Institutional Review Board Statement

Not applicable.

Data Availability Statement

Data sharing is not applicable. No new data were created or analyzed in this study. Data sharing is not applicable to this article.

Acknowledgments

We thank Victoria Eugenia Muñoz for the valuable comments on the manuscript and the Water Supply Quality Group of Secretaria de Salud de Boyaca for its support with the water sampling and the identification of economic activities in the project area.

Conflicts of Interest

The author declares no conflict of interest.

References

  1. WHO. Guidelines for Drinking-Water Quality Addendum; WHO: Geneva, Switzerland, 2017; Volume 109. [Google Scholar]
  2. Morrison, K. Stakeholder Involvement in Water Management: Necessity or Luxury? Water Sci. Technol. 2003, 47, 43–51. [Google Scholar] [CrossRef] [PubMed]
  3. Wen, Y.; Schoups, G.; Van De Giesen, N. Organic Pollution of Rivers: Combined Threats of Urbanization, Livestock Farming and Global Climate Change. Sci. Rep. 2017, 7, 43289. [Google Scholar] [CrossRef] [PubMed] [Green Version]
  4. Dingemans, M.M.L.; Baken, K.A.; van der Oost, R.; Schriks, M.; van Wezel, A.P. Risk-Based Approach in the Revised European Union Drinking Water Legislation: Opportunities for Bioanalytical Tools. Integr. Environ. Assess. Manag. 2019, 15, 126–134. [Google Scholar] [CrossRef]
  5. Van De Merwe, J.P.; Neale, P.A.; Melvin, S.D.; Leusch, F.D.L. In Vitro Bioassays Reveal That Additives Are Signi Fi Cant Contributors to the Toxicity of Commercial Household Pesticides. Aquat. Toxicol. 2018, 199, 263–268. [Google Scholar] [CrossRef] [PubMed] [Green Version]
  6. Yang, Y.; Ok, Y.S.; Kim, K.H.; Kwon, E.E.; Tsang, Y.F. Occurrences and Removal of Pharmaceuticals and Personal Care Products (PPCPs) in Drinking Water and Water/Sewage Treatment Plants: A Review. Sci. Total Environ. 2017, 596–597, 303–320. [Google Scholar] [CrossRef]
  7. Du, Y.; Lv, X.T.; Wu, Q.Y.; Zhang, D.Y.; Zhou, Y.T.; Peng, L.; Hu, H.Y. Formation and Control of Disinfection Byproducts and Toxicity during Reclaimed Water Chlorination: A Review. J. Environ. Sci. 2017, 58, 51–63. [Google Scholar] [CrossRef]
  8. Neale, P.A.; Escher, B.I. In Vitro Bioassays to Assess Drinking Water Quality. Curr. Opin. Environ. Sci. Health 2019, 7, 1–7. [Google Scholar] [CrossRef]
  9. Brunner, A.M.; Dingemans, M.M.L.; Baken, K.A.; van Wezel, A.P. Prioritizing Anthropogenic Chemicals in Drinking Water and Sources through Combined Use of Mass Spectrometry and ToxCast Toxicity Data. J. Hazard. Mater. 2019, 364, 332–338. [Google Scholar] [CrossRef]
  10. Xu, J.; Wei, D.; Wang, F.; Bai, C.; Du, Y. Bioassay: A Useful Tool for Evaluating Reclaimed Water Safety. J. Environ. Sci. 2019, 88, 165–176. [Google Scholar] [CrossRef]
  11. Pedrazzani, R.; Bertanza, G.; Brnardić, I.; Cetecioglu, Z.; Dries, J.; Dvarionienė, J.; García-Fernández, A.J.; Langenhoff, A.; Libralato, G.; Lofrano, G.; et al. Opinion Paper about Organic Trace Pollutants in Wastewater: Toxicity Assessment in a European Perspective. Sci. Total Environ. 2019, 651, 3202–3221. [Google Scholar] [CrossRef]
  12. Diaz-Sosa, V.R.; Tapia-Salazar, M.; Wanner, J.; Cardenas-Chavez, D.L. Monitoring and Ecotoxicity Assessment of Emerging Contaminants in Wastewater Discharge in the City of Prague (Czech Republic). Water 2020, 12, 1079. [Google Scholar] [CrossRef] [Green Version]
  13. De Castro-Català, N.; Kuzmanovic, M.; Roig, N.; Sierra, J.; Ginebreda, A.; Barceló, D.; Pérez, S.; Petrovic, M.; Picó, Y.; Schuhmacher, M.; et al. Ecotoxicity of Sediments in Rivers: Invertebrate Community, Toxicity Bioassays and the Toxic Unit Approach as Complementary Assessment Tools. Sci. Total Environ. 2016, 540, 297–306. [Google Scholar] [CrossRef] [Green Version]
  14. Schreiber, B.; Fischer, J.; Schiwy, S.; Hollert, H.; Schulz, R. Towards More Ecological Relevance in Sediment Toxicity Testing with Fish: Evaluation of Multiple Bioassays with Embryos of the Benthic Weatherfish (Misgurnus fossilis). Sci. Total Environ. 2018, 619–620, 391–400. [Google Scholar] [CrossRef]
  15. Gomes, O., Jr.; Borges Neto, W.; Machado, A.E.H.; Daniel, D.; Trovó, A.G. Optimization of Fipronil Degradation by Heterogeneous Photocatalysis: Identification of Transformation Products and Toxicity Assessment. Water Res. 2017, 110, 133–140. [Google Scholar] [CrossRef]
  16. Kołtowski, M.; Charmas, B.; Skubiszewska-Zięba, J.; Oleszczuk, P. Effect of Biochar Activation by Different Methods on Toxicity of Soil Contaminated by Industrial Activity. Ecotoxicol. Environ. Saf. 2017, 136, 119–125. [Google Scholar] [CrossRef]
  17. Abbas, M.; Adil, M.; Ehtisham-ul-Haque, S.; Munir, B.; Yameen, M.; Ghaffar, A.; Shar, G.A.; Asif Tahir, M.; Iqbal, M. Vibrio Fischeri Bioluminescence Inhibition Assay for Ecotoxicity Assessment: A Review. Sci. Total Environ. 2018, 626, 1295–1309. [Google Scholar] [CrossRef]
  18. Barceló, D.; Žonja, B.; Ginebreda, A. Toxicity Tests in Wastewater and Drinking Water Treatment Processes: A Complementary Assessment Tool to Be on Your Radar. J. Environ. Chem. Eng. 2020, 8, 104262. [Google Scholar] [CrossRef]
  19. Yu, D.; Wang, Q.; Fang, Y.; Kang, Z.; Liu, L.; He, J.; Han, X.; Yu, H.; Dong, S. Study on Simplified Strategies for Procedure of Rapid Detection of Water Toxicity. Talanta 2021, 235, 122787. [Google Scholar] [CrossRef]
  20. Mendonça, E.; Picado, A.; Paixão, S.M.; Silva, L.; Cunha, M.A.; Leitão, S.; Moura, I.; Cortez, C.; Brito, F. Ecotoxicity Tests in the Environmental Analysis of Wastewater Treatment Plants: Case Study in Portugal. J. Hazard. Mater. 2009, 163, 665–670. [Google Scholar] [CrossRef]
  21. Kudryasheva, N.S. Bioluminescence and Exogenous Compounds: Physico-Chemical Basis for Bioluminescent Assay. J. Photochem. Photobiol. B Biol. 2006, 83, 77–86. [Google Scholar] [CrossRef]
  22. Tzani, M.A.; Gioftsidou, D.K.; Kallitsakis, M.G.; Pliatsios, N.V.; Kalogiouri, N.P.; Angaridis, P.A.; Lykakis, I.N.; Terzidis, M.A. Direct and Indirect Chemiluminescence: Reactions, Mechanisms and Challenges. Molecules 2021, 26, 29. [Google Scholar] [CrossRef] [PubMed]
  23. Kaeding, A.J.; Ast, J.C.; Pearce, M.M.; Urbanczyk, H.; Kimura, S.; Endo, H.; Nakamura, M.; Dunlap, P.V. Phylogenetic Diversity and Cosymbiosis in the Bioluminescent Symbioses of “Photobacterium Mandapamensis”. Appl. Environ. Microbiol. 2007, 73, 3173–3182. [Google Scholar] [CrossRef] [PubMed] [Green Version]
  24. Schulz, W.; Seitz, W.; Weiss, S.C.; Weber, W.H.; Böhm, M.; Flottmann, D. Use of Vibrio Fischeri for Screening for Bioactivity in Water Analysis. J. Planar Chromatogr. Mod. TLC 2008, 21, 427–430. [Google Scholar] [CrossRef]
  25. Westlund, P.; Nasuhoglu, D.; Isazadeh, S.; Yargeau, V. Investigation of Acute and Chronic Toxicity Trends of Pesticides Using High-Throughput Bioluminescence Assay Based on the Test Organism Vibrio Fischeri. Arch. Environ. Contam. Toxicol. 2018, 74, 557–567. [Google Scholar] [CrossRef] [PubMed]
  26. Christensen, D.G.; Visick, K.L. Vibrio Fischeri: Laboratory Cultivation, Storage, and Common Phenotypic Assays. Curr. Protoc. Microbiol. 2020, 57, e103. [Google Scholar] [CrossRef]
  27. Yi, X.; Gao, Z.; Liu, L.; Zhu, Q.; Hu, G.; Zhou, X. Acute Toxicity Assessment of Drinking Water Source with Luminescent Bacteria: Impact of Environmental Conditions and a Case Study in Luoma Lake, East China. Front. Environ. Sci. Eng. 2020, 14, 109. [Google Scholar] [CrossRef]
  28. Strotmann, U.; Flores, D.P.; Konrad, O.; Gendig, C. Bacterial Toxicity Testing: Modification and Evaluation of the Luminescent Bacteria Test and the Respiration Inhibition Test. Processes 2020, 8, 1349. [Google Scholar] [CrossRef]
  29. Grande, R.; Di Pietro, S.; Di Campli, E.; Di Bartolomeo, S.; Filareto, B.; Cellini, L. Bio-Toxicological Assays to Test Water and Sediment Quality. J. Environ. Sci. Health Part A 2007, 42, 33–38. [Google Scholar] [CrossRef]
  30. Villanueva, C.M.; Evlampidou, I.; Ibrahim, F.; Donat-Vargas, C.; Valentin, A.; Tugulea, A.M.; Echigo, S.; Jovanovic, D.; Lebedev, A.T.; Lemus-Pérez, M.; et al. Global Assessment of Chemical Quality of Drinking Water: The Case of Trihalomethanes. Water Res. 2023, 230, 119568. [Google Scholar] [CrossRef]
  31. Galezzo, M.A.; Rodríguez Susa, M. The Challenges of Monitoring and Controlling Drinking-Water Quality in Dispersed Rural Areas: A Case Study Based on Two Settlements in the Colombian Caribbean. Environ. Monit. Assess. 2021, 193, 1–13. [Google Scholar] [CrossRef]
  32. Binder, C.; Schertenleib, R.; Diaz, J.; Bader, H.-P.; Baccini, P. Regional Water Balance as a Tool for Water Management in Developing Countries. Int. J. Water Resour. Dev. 1997, 13, 5–20. [Google Scholar] [CrossRef]
  33. Pérez-Vidal, A.; Escobar-Rivera, J.C.; Torres-Lozada, P. Development and Implementation of a Water-Safety Plan for Drinking-Water Supply System of Cali, Colombia. Int. J. Hyg. Environ. Health 2020, 224, 113422. [Google Scholar] [CrossRef]
  34. APHA. Standard Methods for the Examination of Water and Wastewater Standard Methods for the Examination of Water and Wastewater; American Public Health Association: Washington, DC, USA, 2009. [Google Scholar]
  35. Ministerio de la Protección Social; Ministerio de Ambiente Vivienda y Desarrollo Territorial. M. Resolución 2115 de 2007, Bogotá, Colombia. Available online: https://minvivienda.gov.co/sites/default/files/normativa/2115%20-%202007.pdf (accessed on 24 May 2023).
  36. ISO. Water Quality—Determination of the Inhibitory Effect of Water Samples on the Light Emission of Vibrio Fischeri (Luminescent Bacteria Test); International Organization for Standarization: London, UK, 2008. [Google Scholar]
  37. Persoone, G.; Marsalek, B.; Blinova, I.; Törökne, A.; Zarina, D.; Manusadzianas, L.; Nalecz-Jawecki, G.; Tofan, L.; Stepanova, N.; Tothova, L.; et al. A Practical and User-Friendly Toxicity Classification System with Microbiotests for Natural Waters and Wastewaters. Environ. Toxicol. 2003, 18, 395–402. [Google Scholar] [CrossRef]
  38. Naghettini, M. Fundamentals of Statistical Hydrology; Springer International Publishing: Cham, Switzerland, 2016. [Google Scholar] [CrossRef]
  39. Ramos-Parra, Y.J.; Pinilla-Roncancio, M.V. Calidad de Agua de Consumo Humano En Sistemas de Abastecimiento Rurales En Boyacá, Colombia. Un Análisis Water Quality for Human Consumption in Rural Supply Systems in Boyacá, Colombia. An Infrastructural Analysis. Rev. EIA 2020, 17, 219–233. [Google Scholar]
  40. Esimbekova, E.N.; Kondik, A.M.; Kratasyuk, V.A. Bioluminescent Enzymatic Rapid Assay of Water Integral Toxicity. Environ. Monit. Assess. 2013, 185, 5909–5916. [Google Scholar] [CrossRef]
  41. Martínez, M.; Osorio, A. Validation of a Method for Real Color Analysis in Water. Fac. De Cienc. 2018, 7, 143–155. [Google Scholar]
  42. Tarasova, A.S.; Stom, D.I.; Kudryasheva, N.S. Antioxidant Activity of Humic Substances via Bioluminescent Monitoring in Vitro. Environ. Monit. Assess. 2015, 187, 89. [Google Scholar] [CrossRef]
  43. Alengebawy, A.; Abdelkhalek, S.T.; Qureshi, S.R.; Wang, M.Q. Heavy Metals and Pesticides Toxicity in Agricultural Soil and Plants: Ecological Risks and Human Health Implications. Toxics 2021, 9, 42. [Google Scholar] [CrossRef]
  44. Cukurluoglu, S.; Muezzinoglu, A. Assessment of Toxicity in Waters Due to Heavy Metals Derived from Atmospheric Deposition Using Vibrio Fischeri. J. Environ. Sci. Health—Part A 2013, 48, 57–66. [Google Scholar] [CrossRef]
  45. Reza, R.; Singh, G. Heavy Metal Contamination and Its Indexing Approach for River Water. Int. J. Environ. Sci. Technol. 2010, 7, 785–792. [Google Scholar] [CrossRef] [Green Version]
  46. Taufique Arefin, M.; Mokhlesur Rahman, M.; Wahid-U-Zzaman, M.; Kim, J.E. Appraisal of Heavy Metal Status in Water for Irrigation Usage of the Bangshi River, Bangladesh. Appl. Biol. Chem. 2016, 59, 729–737. [Google Scholar] [CrossRef]
  47. Tsiridis, V.; Petala, M.; Samaras, P.; Hadjispyrou, S.; Sakellaropoulos, G.; Kungolos, A. Interactive Toxic Effects of Heavy Metals and Humic Acids on Vibrio Fischeri. Ecotoxicol. Environ. Saf. 2006, 63, 158–167. [Google Scholar] [CrossRef] [PubMed]
  48. Gomes, A.I.; Pires, J.C.M.; Figueiredo, S.A.; Boaventura, R.A.R. Multiple Linear and Principal Component Regressions for Modelling Ecotoxicity Bioassay Response. Environ. Technol. 2014, 35, 945–955. [Google Scholar] [CrossRef]
Figure 1. Location of rural aqueducts in municipalities of Boyacá.
Water 15 02474 g001
Figure 2. Description of the methodology of this study.
Water 15 02474 g002
Figure 3. IRCA values of the evaluated aqueducts. *: outliers.
Water 15 02474 g003
Figure 4. Variation in the inhibition rate in relation to economic activities and water treatment.
Water 15 02474 g004
Figure 5. Toxicity level classifications of the rural aqueducts in different system points.
Water 15 02474 g005
Figure 6. Spearman’s coefficient correlation between water quality parameters and V. fischeri. inhibition rate (statistical significance ** p < 0.01 y * p < 0.05).
Water 15 02474 g006
Table 1. Water-quality parameters and risk scores were used to calculate the IRCA.
ParameterRisk Score
Apparent Color6
Turbidity15
pH1.5
Free residual chlorine15
Total alkalinity1
Calcium1
Manganese1
Hardness1
Sulfates1
Chlorides1
Nitrates1
Nitrites3
Fluorides1
TOC3
Total Coliforms15
Escherichia Coli25
Sum of scores92
Note: Source: Adapted from Resolución 2115–2007.
Table 2. Water supply toxicity classification.
%HtClassLevel Risk
≤20%Class INo acute hazard
20 ≤ Ht ≤ 50%Class IIModerate acute hazard
50 ≤ Ht ≤ 100%Class IIIAcute hazard
Ht 100% in at least one testClass IVHigh acute hazard
Ht 100% in all testsClass VVery high acute hazard
Note: Source: Adapted from [37].
Table 3. Identification of water treatment sources and economic activities.
AqueductWater SourceWater TreatmentDisinfectionEconomic Activity
La BalsaSpringNoNoAgriculture
Vereda LagunitasLakeYesYesLivestockAgriculture
Roa y CarrisalCreekNoNoNo reported
Hato GrandeSpringYesYesLivestock
Veredas Fiesta y PotrerosSpringNoNoNo reported
Las LajasSpringYesYesLivestock
Vereda San JoseSpringNoNoLivestock
Vereda LeoneraLakeYesYesLivestockAgriculture
Parcelacion VarguitasCreekYesNoLivestock
GuayacanalCreekNoNoNo reported
Vereda ChiscoteCreekYesNoNo reported
Vereda el HatilloCreekNoNoLivestockAgriculture
Sector las PeñasSpringNoNoNo reported
El FraileCreekYesYesLivestockMining
Chorro BlancoCreekNoNoLivestockAgriculture
Vereda Pozo NegroCreekNoNoLivestock
AsocardoncillosSpringNoNoAgricultureDomestic
BartoloSpringNoNoAgricultureDomestic
Table 4. Average of the physicochemical and microbiological parameters measured at different points of the water supply systems.
ParameterSourceTreatmentDistribution Network
Mean (sd)
Total coliforms
NMP/100 mL
1163 (1053.39)827 (1020.99)1103 (847.14)
Escherichia coli
NMP/100 mL
66 (178.97)22 (159.90)52 (68.58)
Free residual chlorine
mg/LCl2
0 (0.369)0.14 (0.368)0.18 (0.32)
Apparent color
UPC
29 (28.20)26 (41.57)32 (43.57)
Turbidity
NTU
2.86 (3.84)3.27 (3.48)2.57 (6.79)
pH6.46 (0.95)6.95 (1.10)6.75 (0.77)
Dissolved oxygen
mg/L
6.41 (1.48)6.74 (1.23)6.69 (1.41)
Table 5. Statistics on the IRCA values of the evaluated aqueducts.
AqueductIRCA (%)
Average
Standard Deviation* CI (95%)MinimumMaximum
La Balsa47.828.318–7819.891.7
Guayacanal838.674–927091
Hato Grande652044–853485
Chiscote631448–781961
Las Lajas463014–78374
San Jose66362–706071
El Hatillo851074–966493
Sector Las Peñas791365–935992
Pozo Negro461332–603872
Fiesta y Potrero74865–846585
Leonera352410–62561
Lagunitas391624–54956
Chorro Blanco4.92.72–839
El Fraile782750–1072392
Roa y Carrisal901.388–918790
San Bartolo661.364–776599
Asocardoncillos681751–874188
Parcelacion Varguitas672145–892588
Note: * CI: confidence interval; n = 6.
Table 6. Observed luminescence inhibition rate (%) in water samples.
Aqueduct%Ht
Water SourceTreatment SystemDistribution Network
La Balsa647478
Vereda Lagunitas414149
Roa y Carrisal726965
Hato Grande644568
Veredas Fiesta y Potreros516651
Las Lajas807979
Vereda San Jose646474
Vereda Leonera876870
Parcelación Varguitas386554
Guayacanal975355
Vereda Chiscote965746
Vereda el Hatillo847983
Sector las Peñas797581
el Fraile847259
Chorro Blanco807157
Vereda Pozo Negro818181
Asocardoncillos527761
San Bartolo526154
Disclaimer/Publisher’s Note: The statements, opinions and data contained in all publications are solely those of the individual author(s) and contributor(s) and not of MDPI and/or the editor(s). MDPI and/or the editor(s) disclaim responsibility for any injury to people or property resulting from any ideas, methods, instructions or products referred to in the content.

