Article

Study on the Acoustic Emission Characteristics and Failure Precursors of Water-Rich Frozen Sandstone under Different Lateral Unloading Rates

1
School of Architecture and Civil Engineering, Xi’an University of Science and Technology, Xi’an 710054, China
2
School of Geology and Environment, Xi’an University of Science and Technology, Xi’an 710054, China
3
Geological Research Institute for Coal Green Mining, Xi’an University of Science and Technology, Xi’an 710054, China
*
Author to whom correspondence should be addressed.
Water 2023, 15(12), 2297; https://doi.org/10.3390/w15122297
Submission received: 24 April 2023 / Revised: 31 May 2023 / Accepted: 9 June 2023 / Published: 20 June 2023
(This article belongs to the Topic Advances in Well and Borehole Hydraulics and Hydrogeology)

Abstract

:
The artificial freezing method is used to cross the water-rich soft rock strata in order to exploit deep coal resources. At present, studies that consider both freezing effect and unloading rate are insufficient. To study the influences of the excavation rate using the artificial freezing method on the unloading deformation and failure of the water-rich surrounding rock, we carry out mechanical and synchronous acoustic emission (AE) tests on frozen (−10 °C) sandstone samples under different lateral unloading rates. Combined with the AE signals, the stress, strain and failure process are analysed to determine the mechanical behaviours of frozen rock samples under different lateral unloading rates. The damage difference between normal temperature rock and frozen rock during lateral unloading is studied. According to acoustic emission signals, the damage relationships among acoustic emission amplitude, energy, cumulative acoustic emission energy (CAEE), stress and strain were compared and analyzed. In this paper, acoustic emission 3D positioning system is used to monitor the fracture propagation trajectory in the process of unloading confining pressure of frozen sandstone. The results show that the peak stress of frozen sandstone during lateral unloading is about 2.5 times of that at 20 °C. More than 2 AE amplitudes per second are regarded as the precursor of failure (FP), and point FP is taken as the first level warning. The CAEE of rock samples at 20 °C and frozen rock samples shows the same change law over time, increasing slowly before the FP point and exponentially after the FP point. Peak stress increases and axial strain decreases with the increase of unloading rate of frozen rock sample. The CAEE at point FP and the peak acoustic emission energy (AEE) and the CAEE at the time of failure increase when the unloading rate of frozen rock sample increases. Principal component analysis method was used to extract key characteristic energy to obtain a clearer AEE concentration area, which was defined as second-level early warning. The research results can provide guidance for freezing shaft construction to reduce the occurrence of disasters.

1. Introduction

Shallow coal resources are unable to meet the national development needs with the increase of resources demand. The mechanical properties of the water-rich strata above deep coal resources are poor [1]. To mine deep coal resources, the artificial freezing method is often used to cross water-rich and weak rock formations [2,3]. Furthermore, the artificial freezing method can prevent water infiltration and increase the strength of the surrounding rock [4,5]. Consequently, studying the mechanical properties of frozen rock is crucial to the excavation and construction of frozen shafts.
When artificial freezing method is adopted, the stress change caused by freezing well excavation can be regarded as the process that the axial stress remains unchanged and the horizontal stress decreases gradually. Studies have shown that with the decrease of freezing temperature, the unfrozen water content of rock decreases [6], and the compressive strength and tensile strength and the resistance to deformation increase [7,8]. The main factors affecting the strength of frozen rock are the ice crystal strength, particle strength, friction between blocks, and occlusal strength [9]. But the failure mechanism of lateral unloading and triaxial compression is different. Constant axial pressure and continuous unloading of confining pressure will lead to strain softening and serious lateral deformation [10]. The peak strain of lateral unloading is higher than that of triaxial compression under the same confining pressure [11]. Lateral unloading damage of rock is more serious than triaxial compression [12]. With the increase of axial stress and unloading rate, rock burst risk becomes more serious [13,14]. However, previous studies have only considered freezing action or lateral unloading, not a coupling effect between them.
In addition, the researchers used acoustic emission equipment to study the evolution of damage inside the rock [15,16,17,18]. The results show that the location of microcracks formed by force on granite and mudstone is consistent with acoustic emission location [19]. Kim et al. [20] proposed a new method for assessing rock damage based on AEE. Li [21] used AE technology to study the damage process of granite and coal. Both the plastic strain and the AE signal of coals can reflect the damage law [22,23]. Moreover, the number of sandstone AE events is related to the total damage volume, and the AE amplitude is related to the load [24,25]. Under the action of both temperature and confining pressure, the AE signal of rock salt has a corresponding relationship with its compressive deformation [26]. Thus, the acoustic emission parameters of rock can serve as a precursor to failure during the loading process. AE equipment was applied to study rocks under normal temperatures, and its effectiveness was proved. Understanding of the rock fracture process at room temperature and the development of mature monitoring techniques provide a basis for revealing the damage and fracture characteristics of frozen rocks under lateral unloading.
However, the research on damage and fracture of frozen rock under lateral unloading is still in the exploratory stage, and some basic questions are still unclear. For example, the question of whether temperature, as one of the main factors determining the mechanical properties of rocks, changes the fracture behaviors of rocks and whether lateral unloading rate affects the failure process of frozen rock needs to be investigated. If the answer is affirmative, the underlying mechanisms should be explored. In this paper, a low-temperature and high-pressure rock triaxial test system is used to conduct mechanical and synchronous acoustic emission tests on water-rich frozen sandstone at different lateral unloading rates. The effects of temperature and unloading rate on the fracture process of rock samples were analyzed by correlating acoustic emission signals, stress, strain and failure process, and a two-stage warning was established. In the discussion section, the influence mechanism of freezing on fracture mechanical behavior of water-rich sandstone under lateral unloading is explained. This approach can play a guiding role in excavation through water-rich rock formations by the artificial freezing method.

2. Test Content

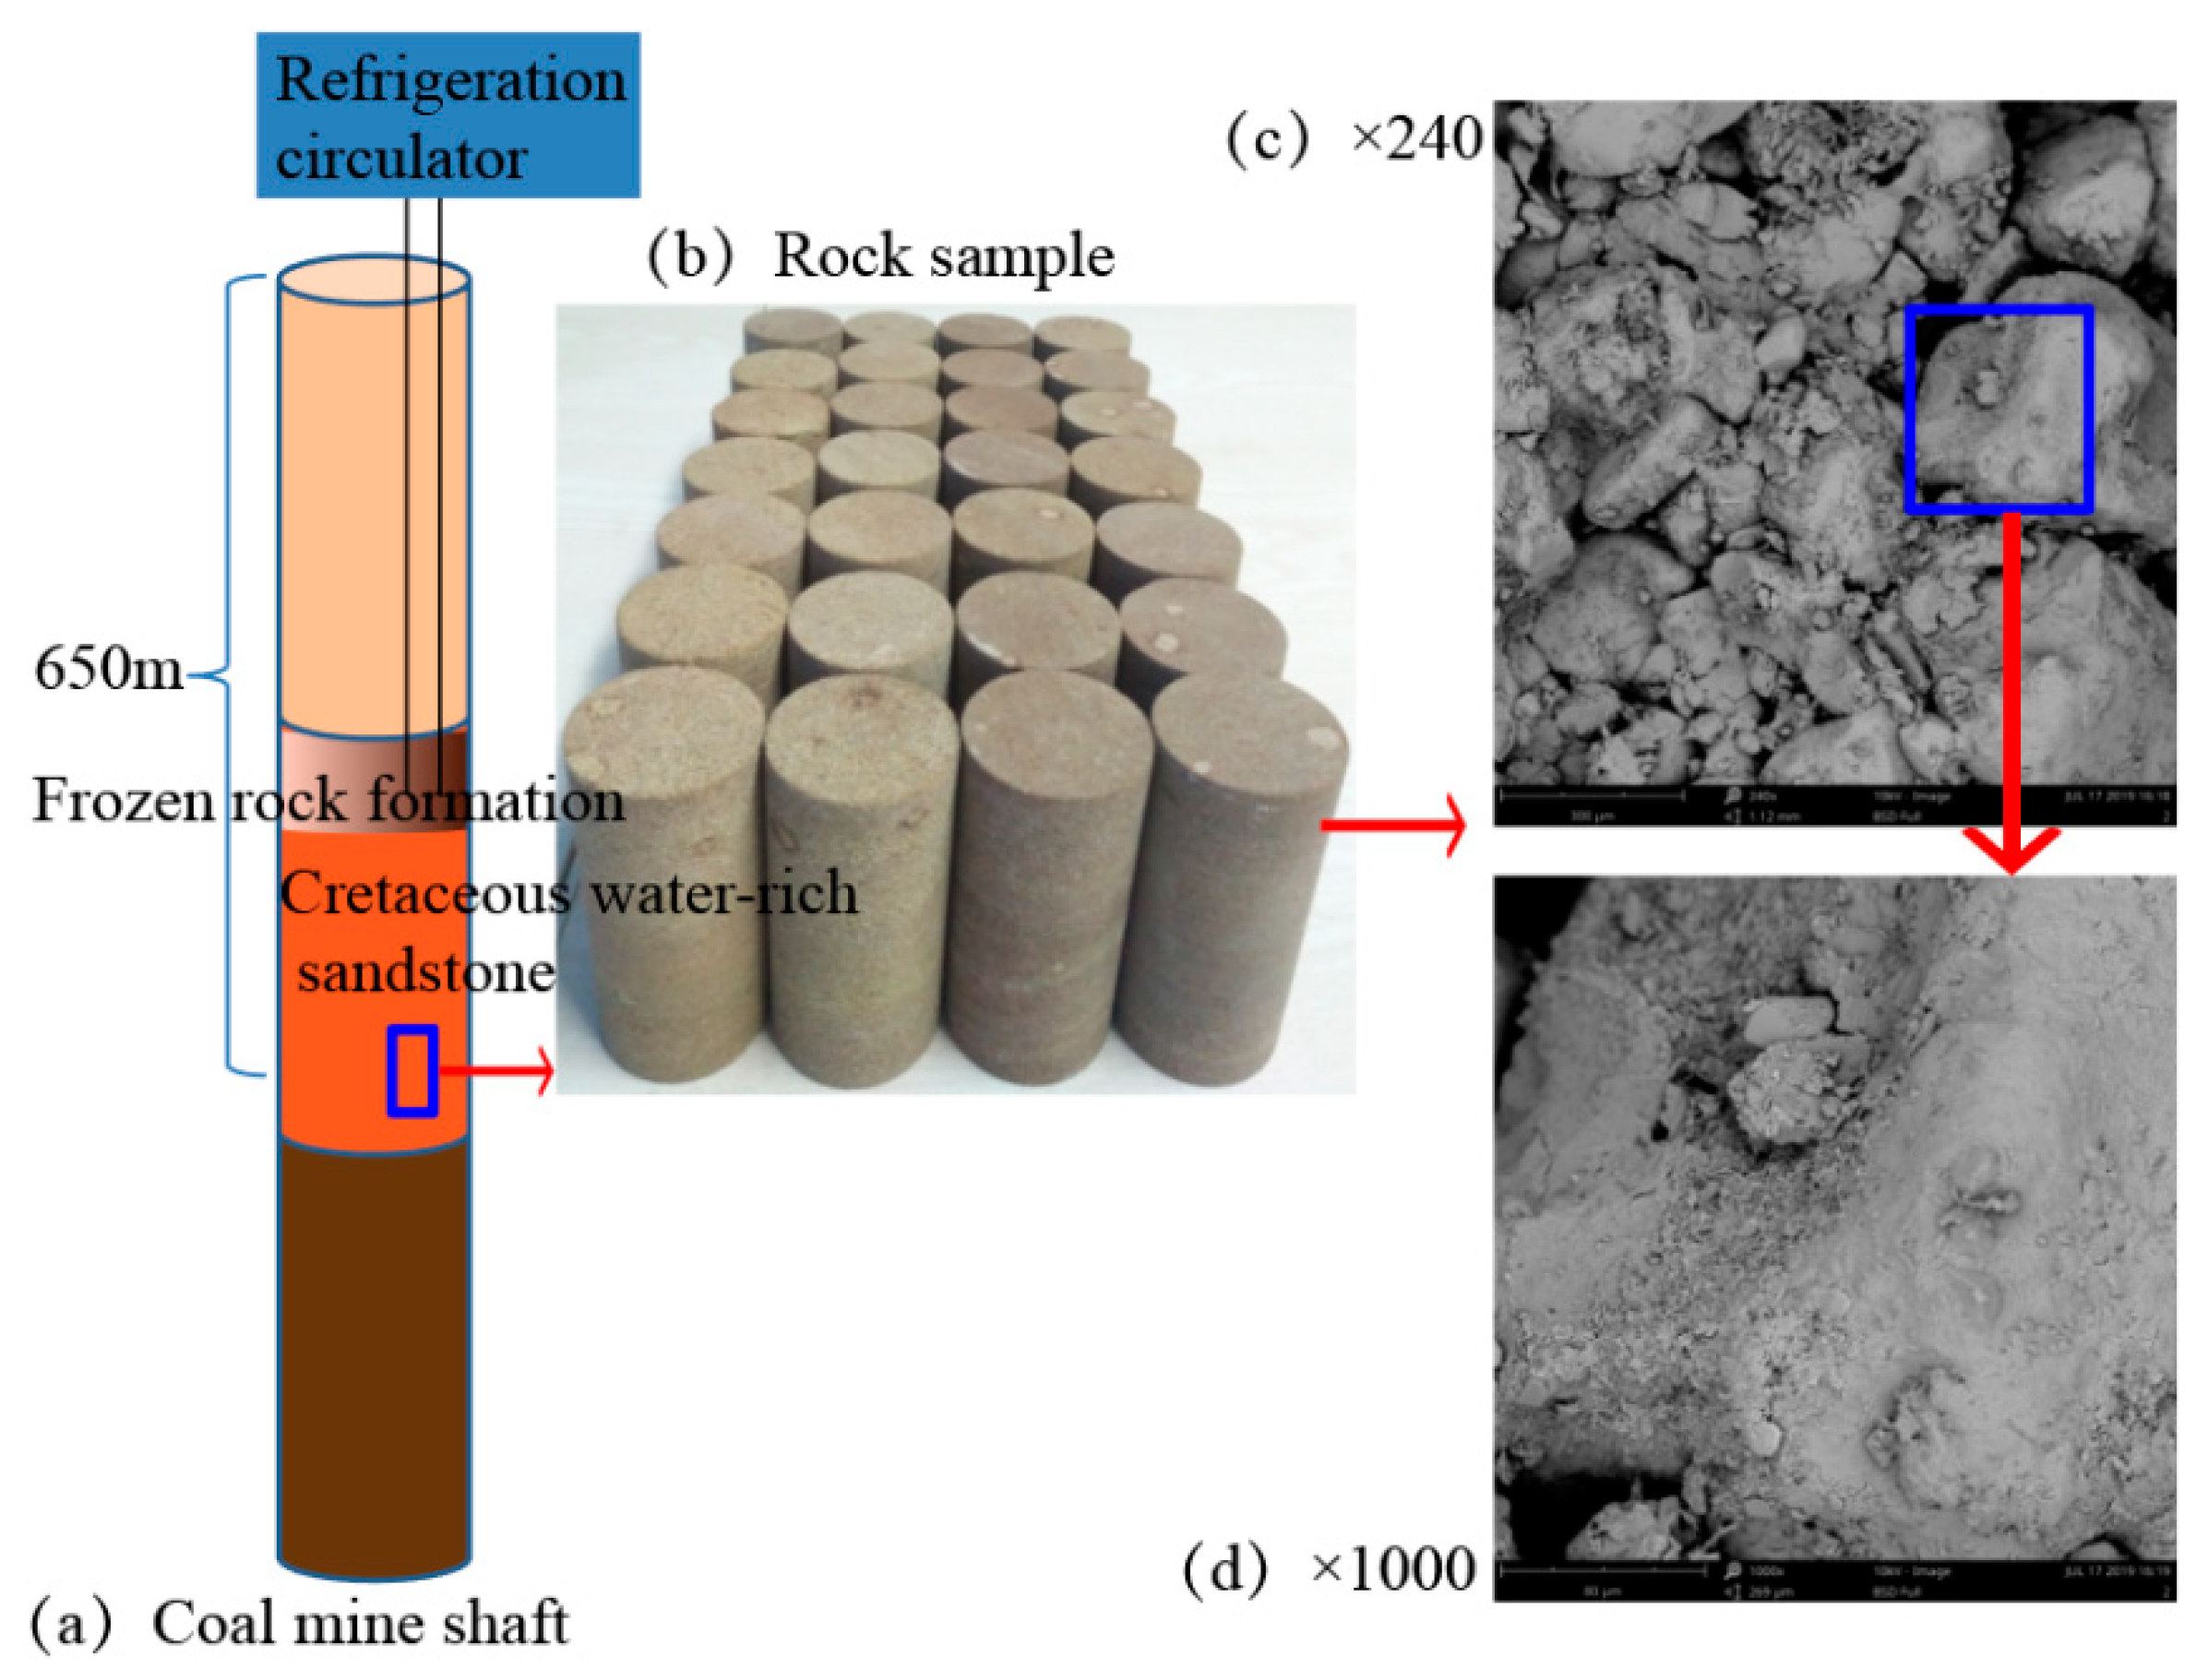
2.1. Sample Preparation

Cretaceous medium-grained red sandstone is taken from coal mines in Shaanxi Province (Figure 1). Cores are drilled along the vertical (normal to the bedding direction) and processed into standard rock samples ( φ = 50 mm, H = 100 mm). They were all taken from the same sandstone. As can be seen from the enlarged images in (Figure 1c,d), the sandstone is cemented by particles of different sizes, with irregular particle shapes and many uneven pores. There are clay minerals on the surface of some pores and particles, which have a certain cohesive force. The average physical parameters of the sandstone are shown in Table 1.

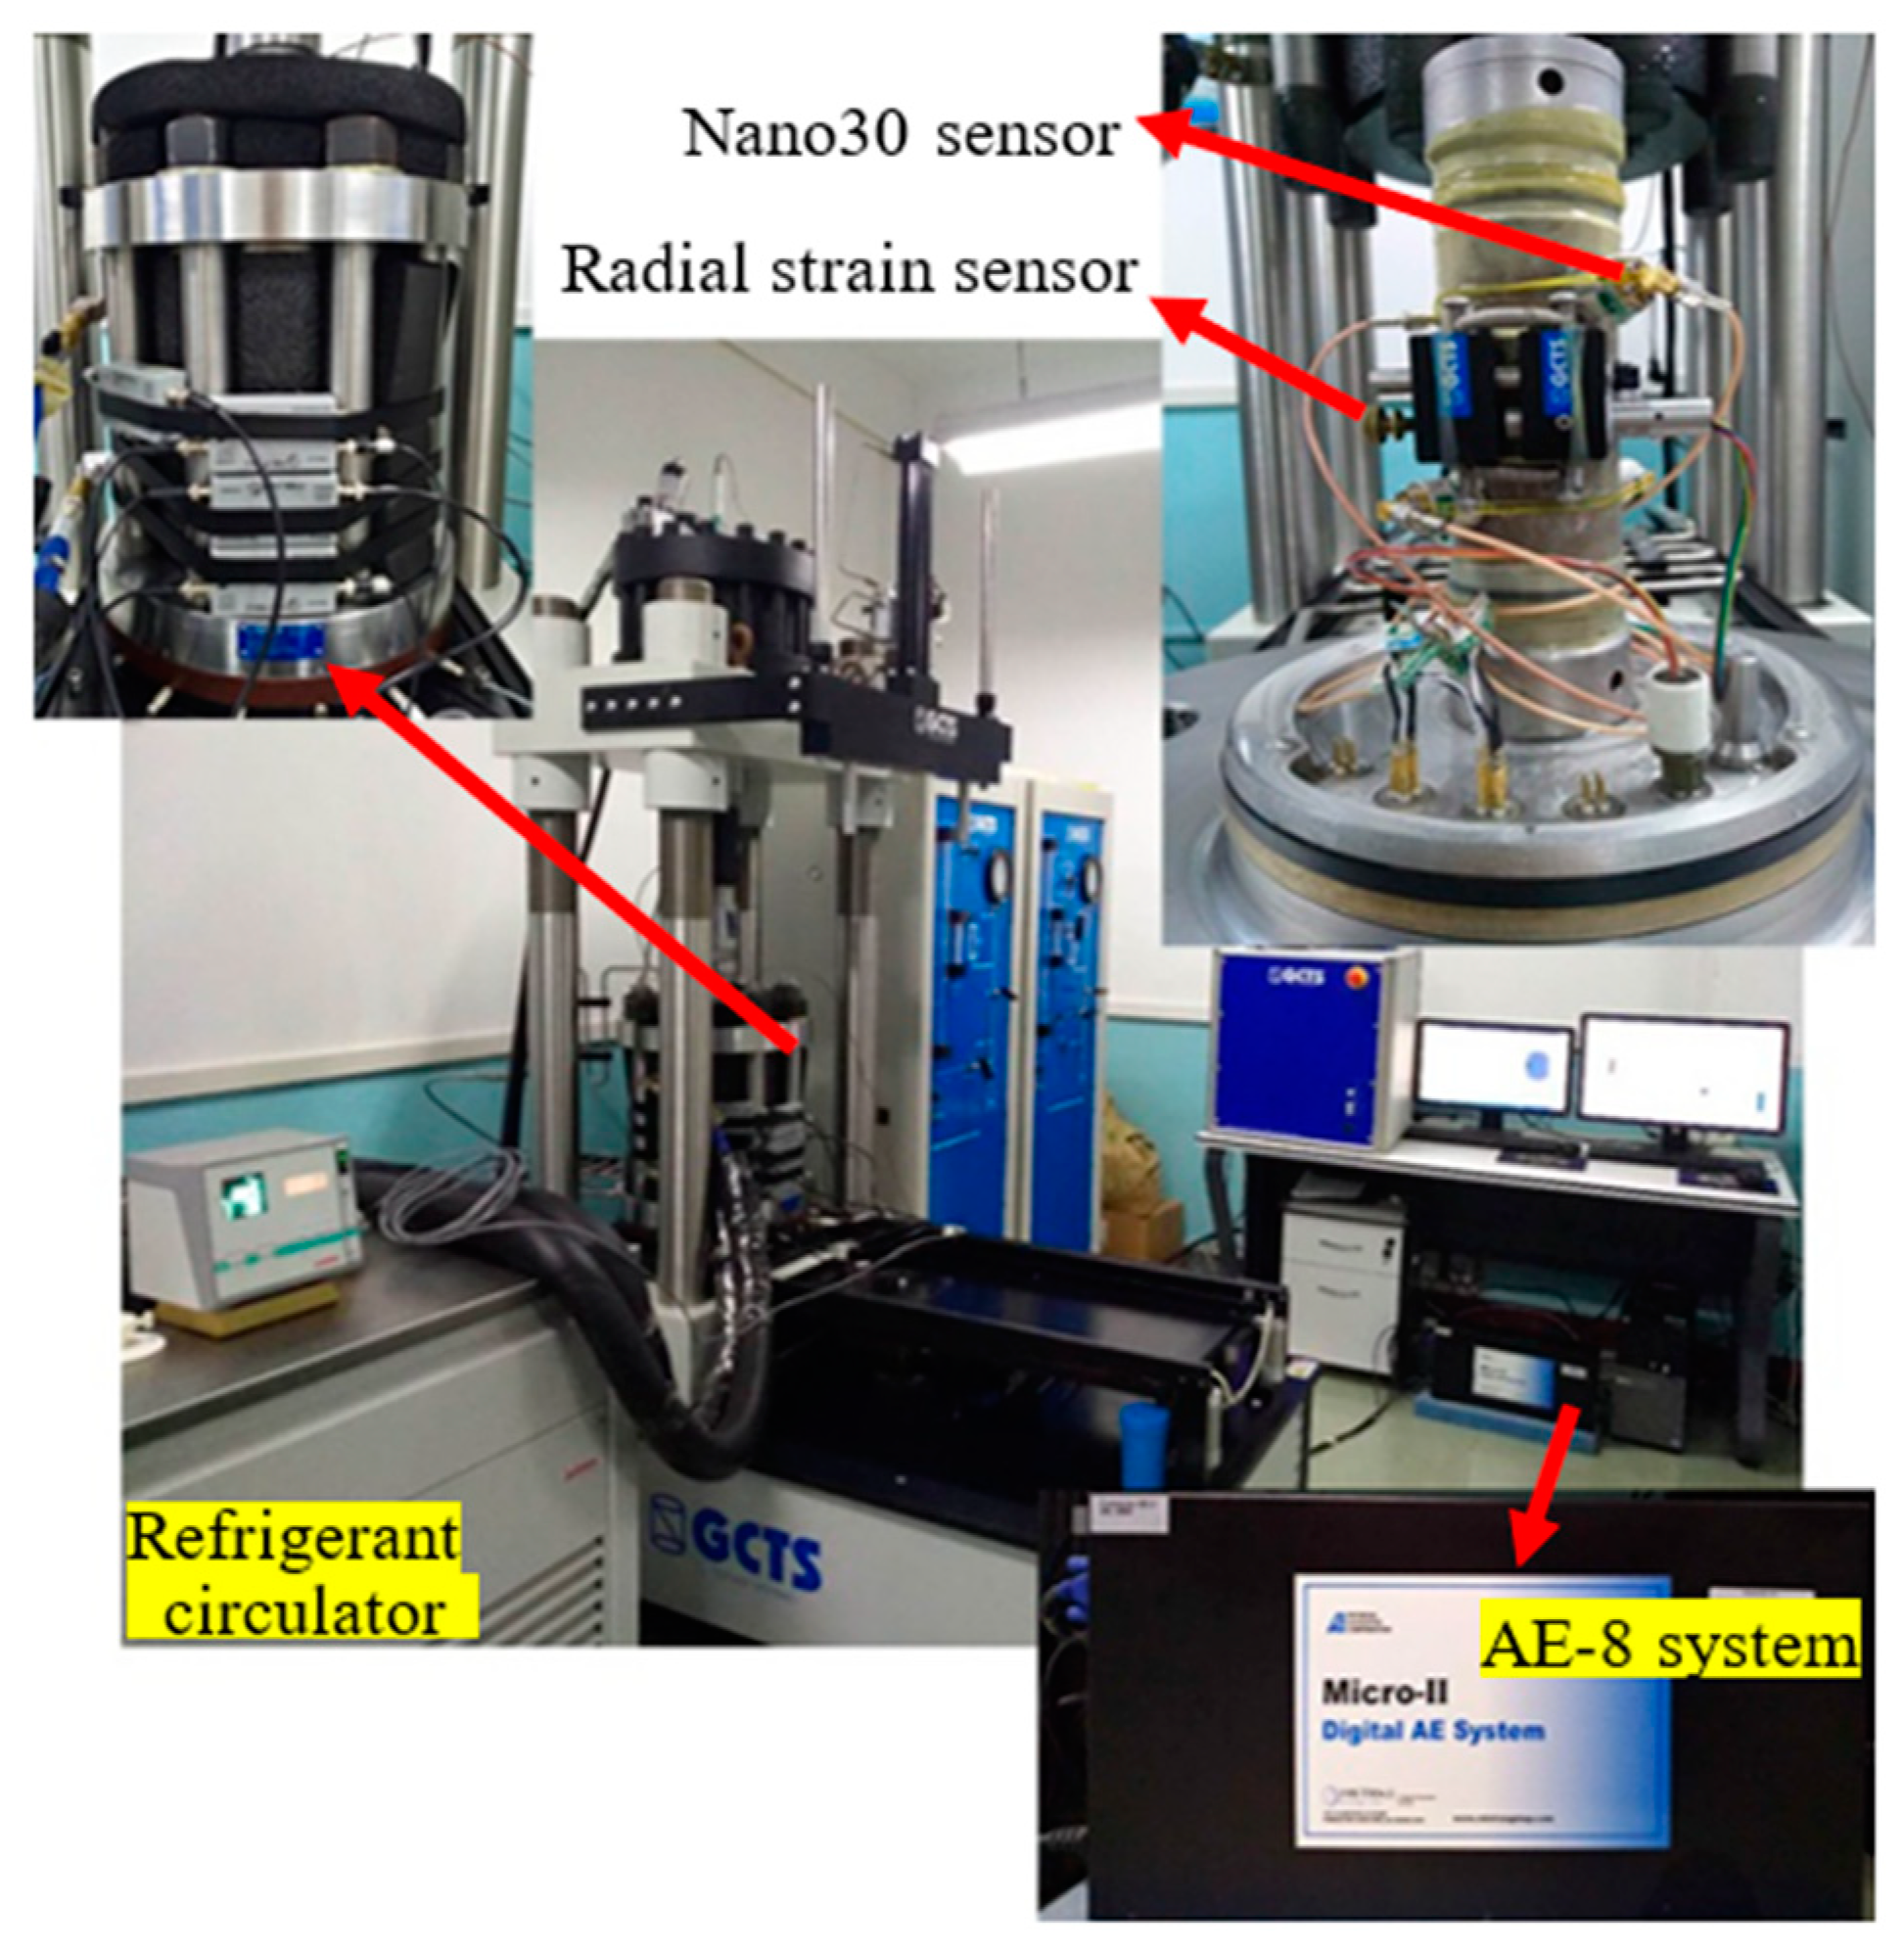
2.2. Experimental Design
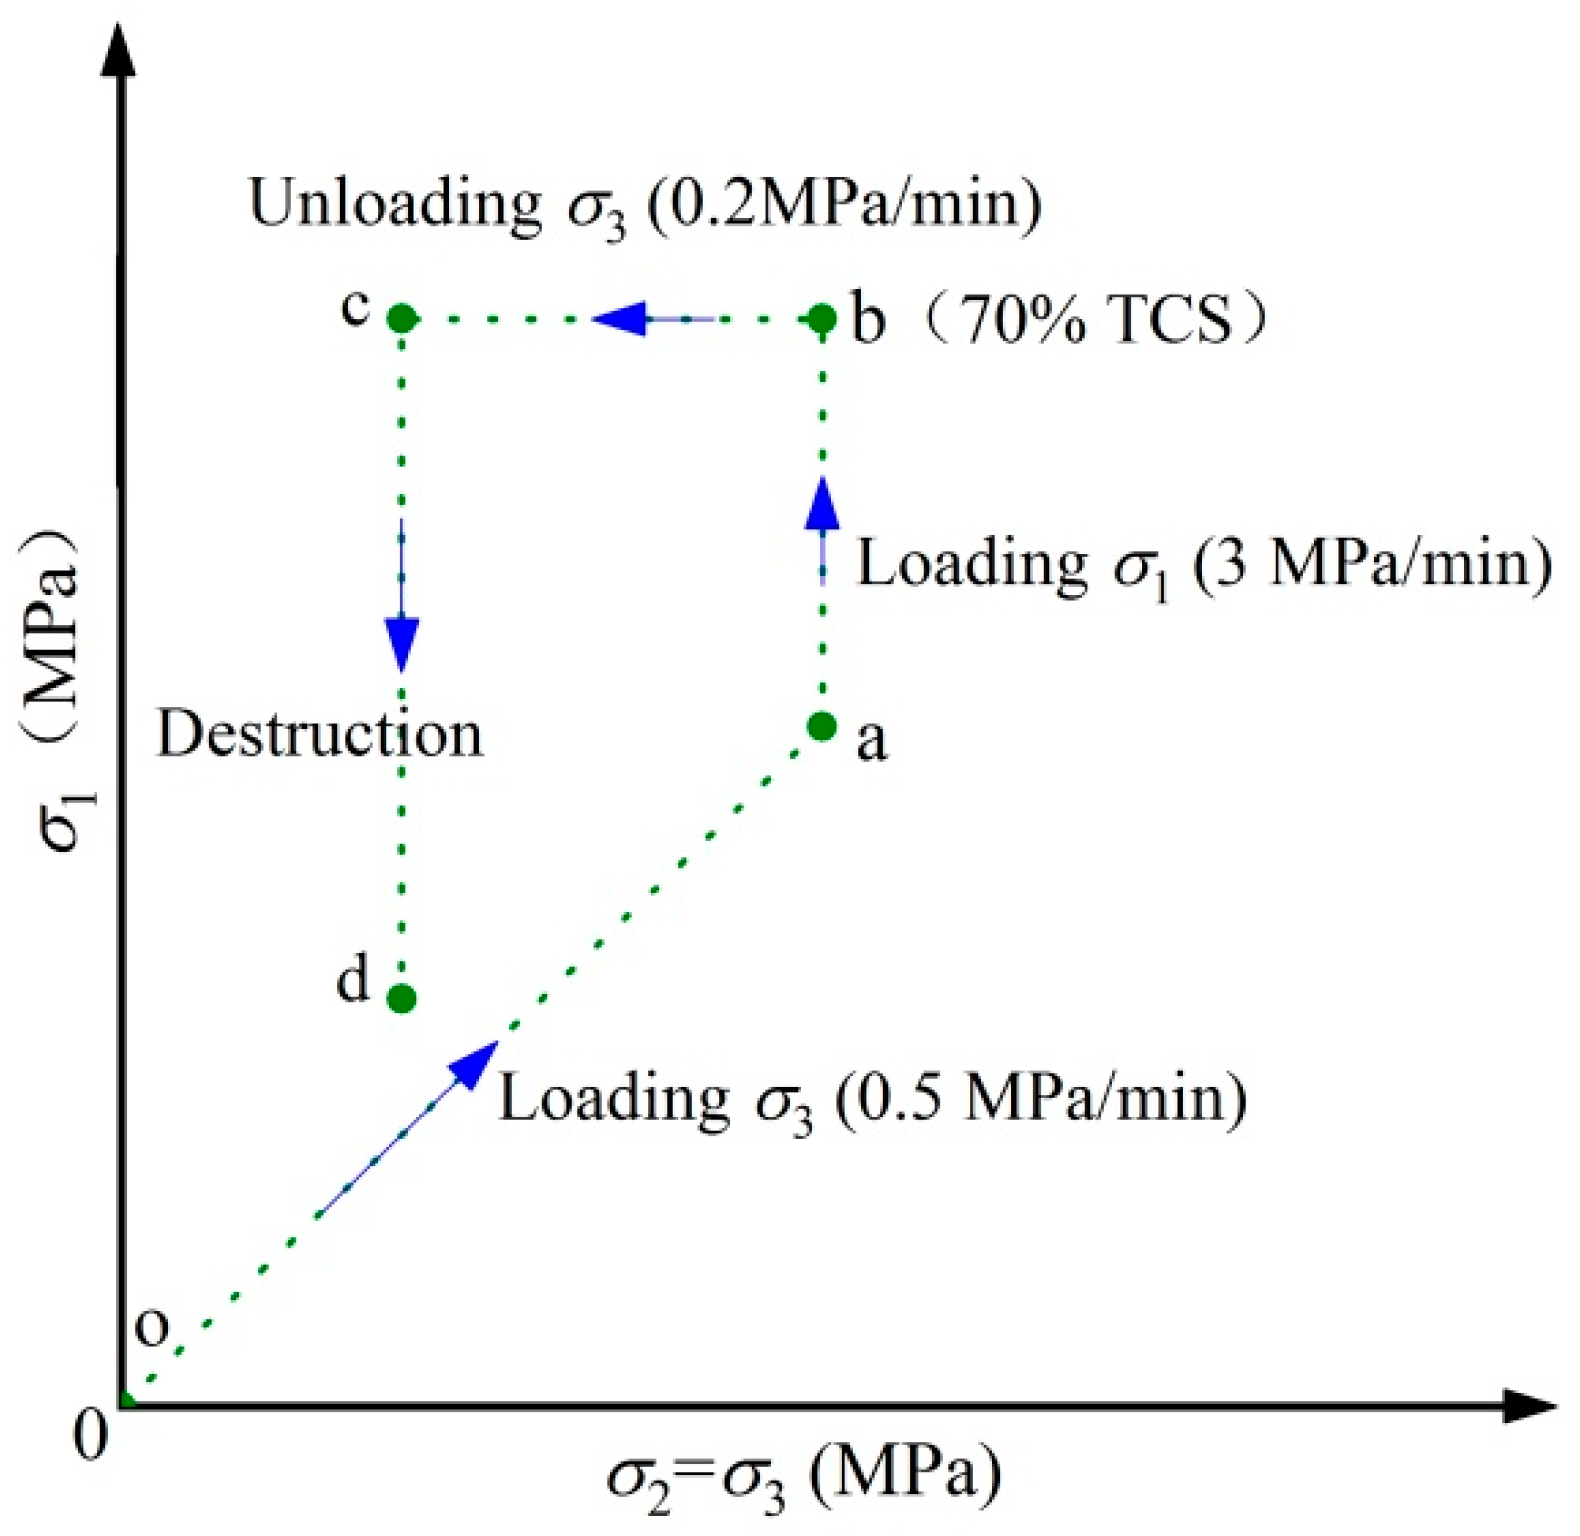
An electrohydraulic servo-controlled low-temperature and high-pressure rock triaxial test system produced by GCTS is used for the test; photos of the system are shown in Figure 2. An AE−8 acoustic emission system produced by the American Physical Acoustics Company and composed of sensors, pregain amplifiers, and signal acquisition and control systems is also used.
The water-rich rock formations were cooled by refrigeration circulators to form a freezing circle before excavation (Figure 1a).During the formation of the frozen wall at the study site, the temperature in the temperature measuring hole decreased over time and finally stabilized at −9.45~−11.03°C. We cooled the triaxial pressure chamber through a refrigeration circulator, and the rock samples in the triaxial pressure chamber were frozen (Figure 2). We set rock samples at room temperature (20 °C) as standard. The freezing temperature was set to −10 °C for comparison with the room temperature (20 °C). The freezing depth of coal mine shafts in China can exceed 1 km, and the freezing depth is going to continue to increase in the future. When sandstone freezes, the conversion of pore liquid water within the rock into ice causes volumetric expansion and an increase in horizontal stress. Thus, the test confining pressure is set at 20 MPa. The initial axial pressure of a frozen sandstone lateral unloading test (LUT) is based on 70% of the triaxial compressive strength (a stress level corresponding to volumetric strain rotation). The axial loading rate of triaxial compression test is 0.06mm/min. We prepared a total of 28 rock samples. To ensure the repeatability of the test results, 3 samples are tested under each condition. The test plan for the lateral unloading of the frozen sandstone is visualized in Table 2.

2.3. Test Scheme

(1) Set the acoustic emission parameters: The sensor threshold and pregain amplifier are set at 40 dB. The time difference positioning method is used to locate each AE signal source. Four acoustic emission sensors (numbered 1, 2, 3, and 4) are employed, and the distance unit is set to millimetres. After selecting a cylindrical structure type, the centre of the bottom surface of the sample is taken as the origin of the coordinate axis; then, the horizontal right direction is taken as the positive X axis, the horizontal forward direction is the positive Z axis, and the vertical upward direction is the positive Y axis. According to the sample size and sensor installation position, the coordinates of the four sensors are listed in Table 3.
(2) Rock sample preparation: First, the installation positions of the 4 acoustic emission sensors are marked on the sides of the saturated rock sample. Then, petroleum jelly is spread evenly across the surface of the rock sample, a rubber mould is fixed onto the base, and the acoustic emission sensors are fixed. A radial deformation sensor is installed at 1/2H of the rock sample, and the axial deformation is measured by the displacement of the seat actuator. After sealing the pressure chamber, insulation cotton is wrapped around the setup to fix the preamplifier.
(3) Cooling: The temperature of the rock sample is reduced from room temperature to −10 °C at a cooling rate of 10 °C/h and kept at a constant temperature for 10 h.
(4) The lateral unloading test adopts the stress control method to simulate the excavation of the freezing wall; the corresponding stress path is shown in Figure 3. The rock sample is kept at a constant temperature throughout this process.
(5) The stress, strain and AE signal parameters of the whole process are recorded for the frozen sandstone lateral unloading test.

3. Test Results and Analysis

3.1. Effect of Temperature on the AE Characteristics of Sandstone under Lateral Unloading

When a rock sample deforms under stress, internal cracks may develop and produce transient elastic waves, that is, acoustic emission signals. Acoustic emission amplitude represents the intensity of the wave source. The AEE represents the energy released by the crack propagating inside the rock per unit of time: the greater the AEE is, the more serious the internal damage of the rock. Thus, the AEE released by rock fractures can reveal the essential characteristics of rock failure. The results of the 3 samples are similar under the same conditions, so only one sample is selected for the following analysis. There are few AE signals during the initial axial pressure and initial confining pressure loading stage, during which the rock sample experiences mainly compaction. Because the purpose of this stage is to simulate the in situ stress, we mainly study the mechanical behaviour of the rock sample during the confining pressure unloading stage. Taking the time corresponding to the unloading confining pressure of the rock sample at 20 °C and −10 °C as the starting point of the horizontal axis, the curves of the AE amplitude, deviatoric stress and axial strain over time are plotted in Figure 4. We then plot the curves of the AEE and CAEE over time (see Figure 5).
Figure 4 shows that the deviatoric stress linearly increases at a rate of 0.2 MPa/min until the rock sample is broken. Before point FP, the AE amplitude points appear sporadically. With an increase in the unloading time, the number of AE amplitude points gradually increases, as does the AE amplitude. As the temperature decreases, the number of AE amplitude points drops. More than 2 AE amplitude points appear every second after the FP point, forming a triangle dense area. FP is defined as the failure precursor point. This feature can be interpreted as a precursor signalling the lateral unloading failure of the frozen sandstone. With an increase in the unloading time, the AE amplitude gradually rises, and as the temperature decreases, the AE amplitude tends to decrease. Point FP in Figure 4 is the demarcation point for the rock samples at 20 °C and −10 °C. Before point FP, with an increase in the unloading time, the axial strain increases approximately linearly. After point FP, with an increase in the unloading time, the axial strain increases exponentially.
Figure 5 shows that the CAEE of the rock samples at 20 °C and −10 °C show the same trends over time. Before point FP, most of the AEE of the rock samples at 20 °C and −10 °C are less than 10 V2·μs and 30 V2·μs, respectively. Individually, higher AEE correspond to higher AE amplitudes, and the CAEE increases slowly with time. After point FP, with an increase in the unloading time, the CAEE increases exponentially. Before the 20 °C and −10 °C rock samples are destroyed, the AEE cluster areas are less than 40 V2·μs and 100 V2·μs, respectively, and the occurrence of these cluster areas can be regarded as a precursor signalling the lateral unloading instability of frozen sandstone.
The curves of the changes in the parameters of the rock samples 5 s before and after the moment of lateral unloading failure are plotted in Figure 6. The lateral unloading peak stress of the frozen sandstone is approximately 2.5 times that of the 20 °C sandstone. Before the failure of the 20 °C and −10 °C rock samples, the axial strain is 0.41% and 0.97%, respectively, and the corresponding CAEE is 4234 V2·μs and 14,086 V2·μs. When the 20 °C rock sample is broken, the deviatoric stress gradually decreases, and the axial strain increases 10-fold. When the 20 °C rock sample is broken, a quiet sound is emitted, the rock sample is severely fragmented, and the brittleness of the sample is relatively weak. An energy cluster appears that lasts for 4 s before and after the peak energy, so the CAEE increases significantly. At the moment when the −10°C rock sample fails, the deviatoric stress drops, and the axial strain increases about 2~3 times. A large energy cluster is noted before and after the peak energy, but the duration of this cluster is less than 1 s. Furthermore, the CAEE after the destruction of the 20 °C sandstone is greater than that after the destruction of the frozen sandstone.

3.2. Influence of the Unloading Rate on the AE Characteristics of Frozen Sandstone

The curves of the AE amplitude, deviatoric stress and axial strain over time for the frozen rock samples under different lateral unloading rates are shown in Figure 4b and Figure 7. Under an initial confining pressure of 20 MPa, the frozen rock samples are unloaded at rates of 0.04 MPa/min, 0.2 MPa/min and 4 MPa/min, and the deviatoric stress increases linearly at the same rate until the rock sample is broken. Taking point FP as the demarcation point, before point FP, the axial strain increases linearly with time, and the AE amplitude points appear sporadically. When the confining pressure is unloaded at rates of 0.04 MPa/min, 0.2 MPa/min and 4 MPa/min, the AE amplitudes of the frozen rock samples reach 40~50 dB, 40~55 dB and 40~65 dB, respectively. As the unloading rate of the frozen rock samples increases, the number of AE amplitude points increases. After point FP, with an increase in the unloading time, the axial strain increases exponentially. AE amplitude points appear at a high occurrence rate (more than two AE amplitude points per second on average), and the AE amplitude gradually increases. Taking the moment near point FP as the starting point, the AE amplitude points form an area of dense datapoints in the shape of a right triangle. Under different lateral unloading rates, the appearance of this triangular area of AE amplitude datapoints can be interpreted as a precursor signalling the failure of the frozen rock samples with point FP as the starting point. In summary, as the unloading rate of a frozen rock sample increases, the number of AE amplitude points increases during the unloading deformation process, and the AE amplitude increases.
The curves of the AEE and CAEE over time corresponding to the frozen rock samples under different lateral unloading rates are shown in Figure 5b and Figure 8. Before point FP, the AEE of the frozen rock samples is released intermittently, with the energies generally being less than 20 V2·μs. As the lateral unloading rate of frozen rock increases, the AE amplitude and the AEE increase. After point FP, the AEE of the frozen rock samples become clustered before the occurrence of unloading failure. As the lateral unloading rate of a frozen rock sample increases, the energy values in the AEE cluster area rise, the cluster area becomes more obvious, and the time to reach point FP is shortened. Under different lateral unloading rates, the CAEE of the frozen rock samples exhibit the same variation trend over time, with a gradual increase before point FP and an exponential increase after point FP.
Under different lateral unloading rates, the curves of the changes in the parameters of the frozen rock samples 5 s before and after the moment of failure are plotted in Figure 6b and Figure 9. The characteristic values of the frozen sandstone under different lateral unloading rates are shown in Table 4. The confining pressure of the frozen rock samples is unloaded at rates of 0.04 MPa/min, 0.2 MPa/min and 4 MPa/min; the corresponding axial strains before the failure of the rock sample are 1.40%, 0.97% and 0.76%, respectively, and the corresponding cumulative energies are 15,154 V2·μs, 14,086 V2·μs and 75,079 V2·μs. The deviatoric stress drops at the moment when the frozen rock sample fails, the axial strain increases approximately 3- to 4-fold, the AEE peaks, and the AEE before and after the peak is high. As the lateral unloading rate of a rock sample increases, the deviatoric stress at point FP increases, the axial strain decreases, and the CAEE increases. As the lateral unloading rate of a rock sample increases, the peak AEE increases during failure, and the CAEE increases significantly. For frozen rock samples at unloading rates of 0.04 MPa/min and 0.2 MPa/min, the deviatoric stress at point FP is slightly lower than the peak stress. For the frozen rock samples at an unloading rate of 4 MPa/min, the deviatoric stress at point FP is 7 MPa less than the peak stress. For the frozen rock samples at an unloading rate of 4 MPa/min, at point FP, the axial strain is approximately 2/3 of the axial strain of the samples unloaded at rates of 0.04 MPa/min and 0.2 MPa/min.

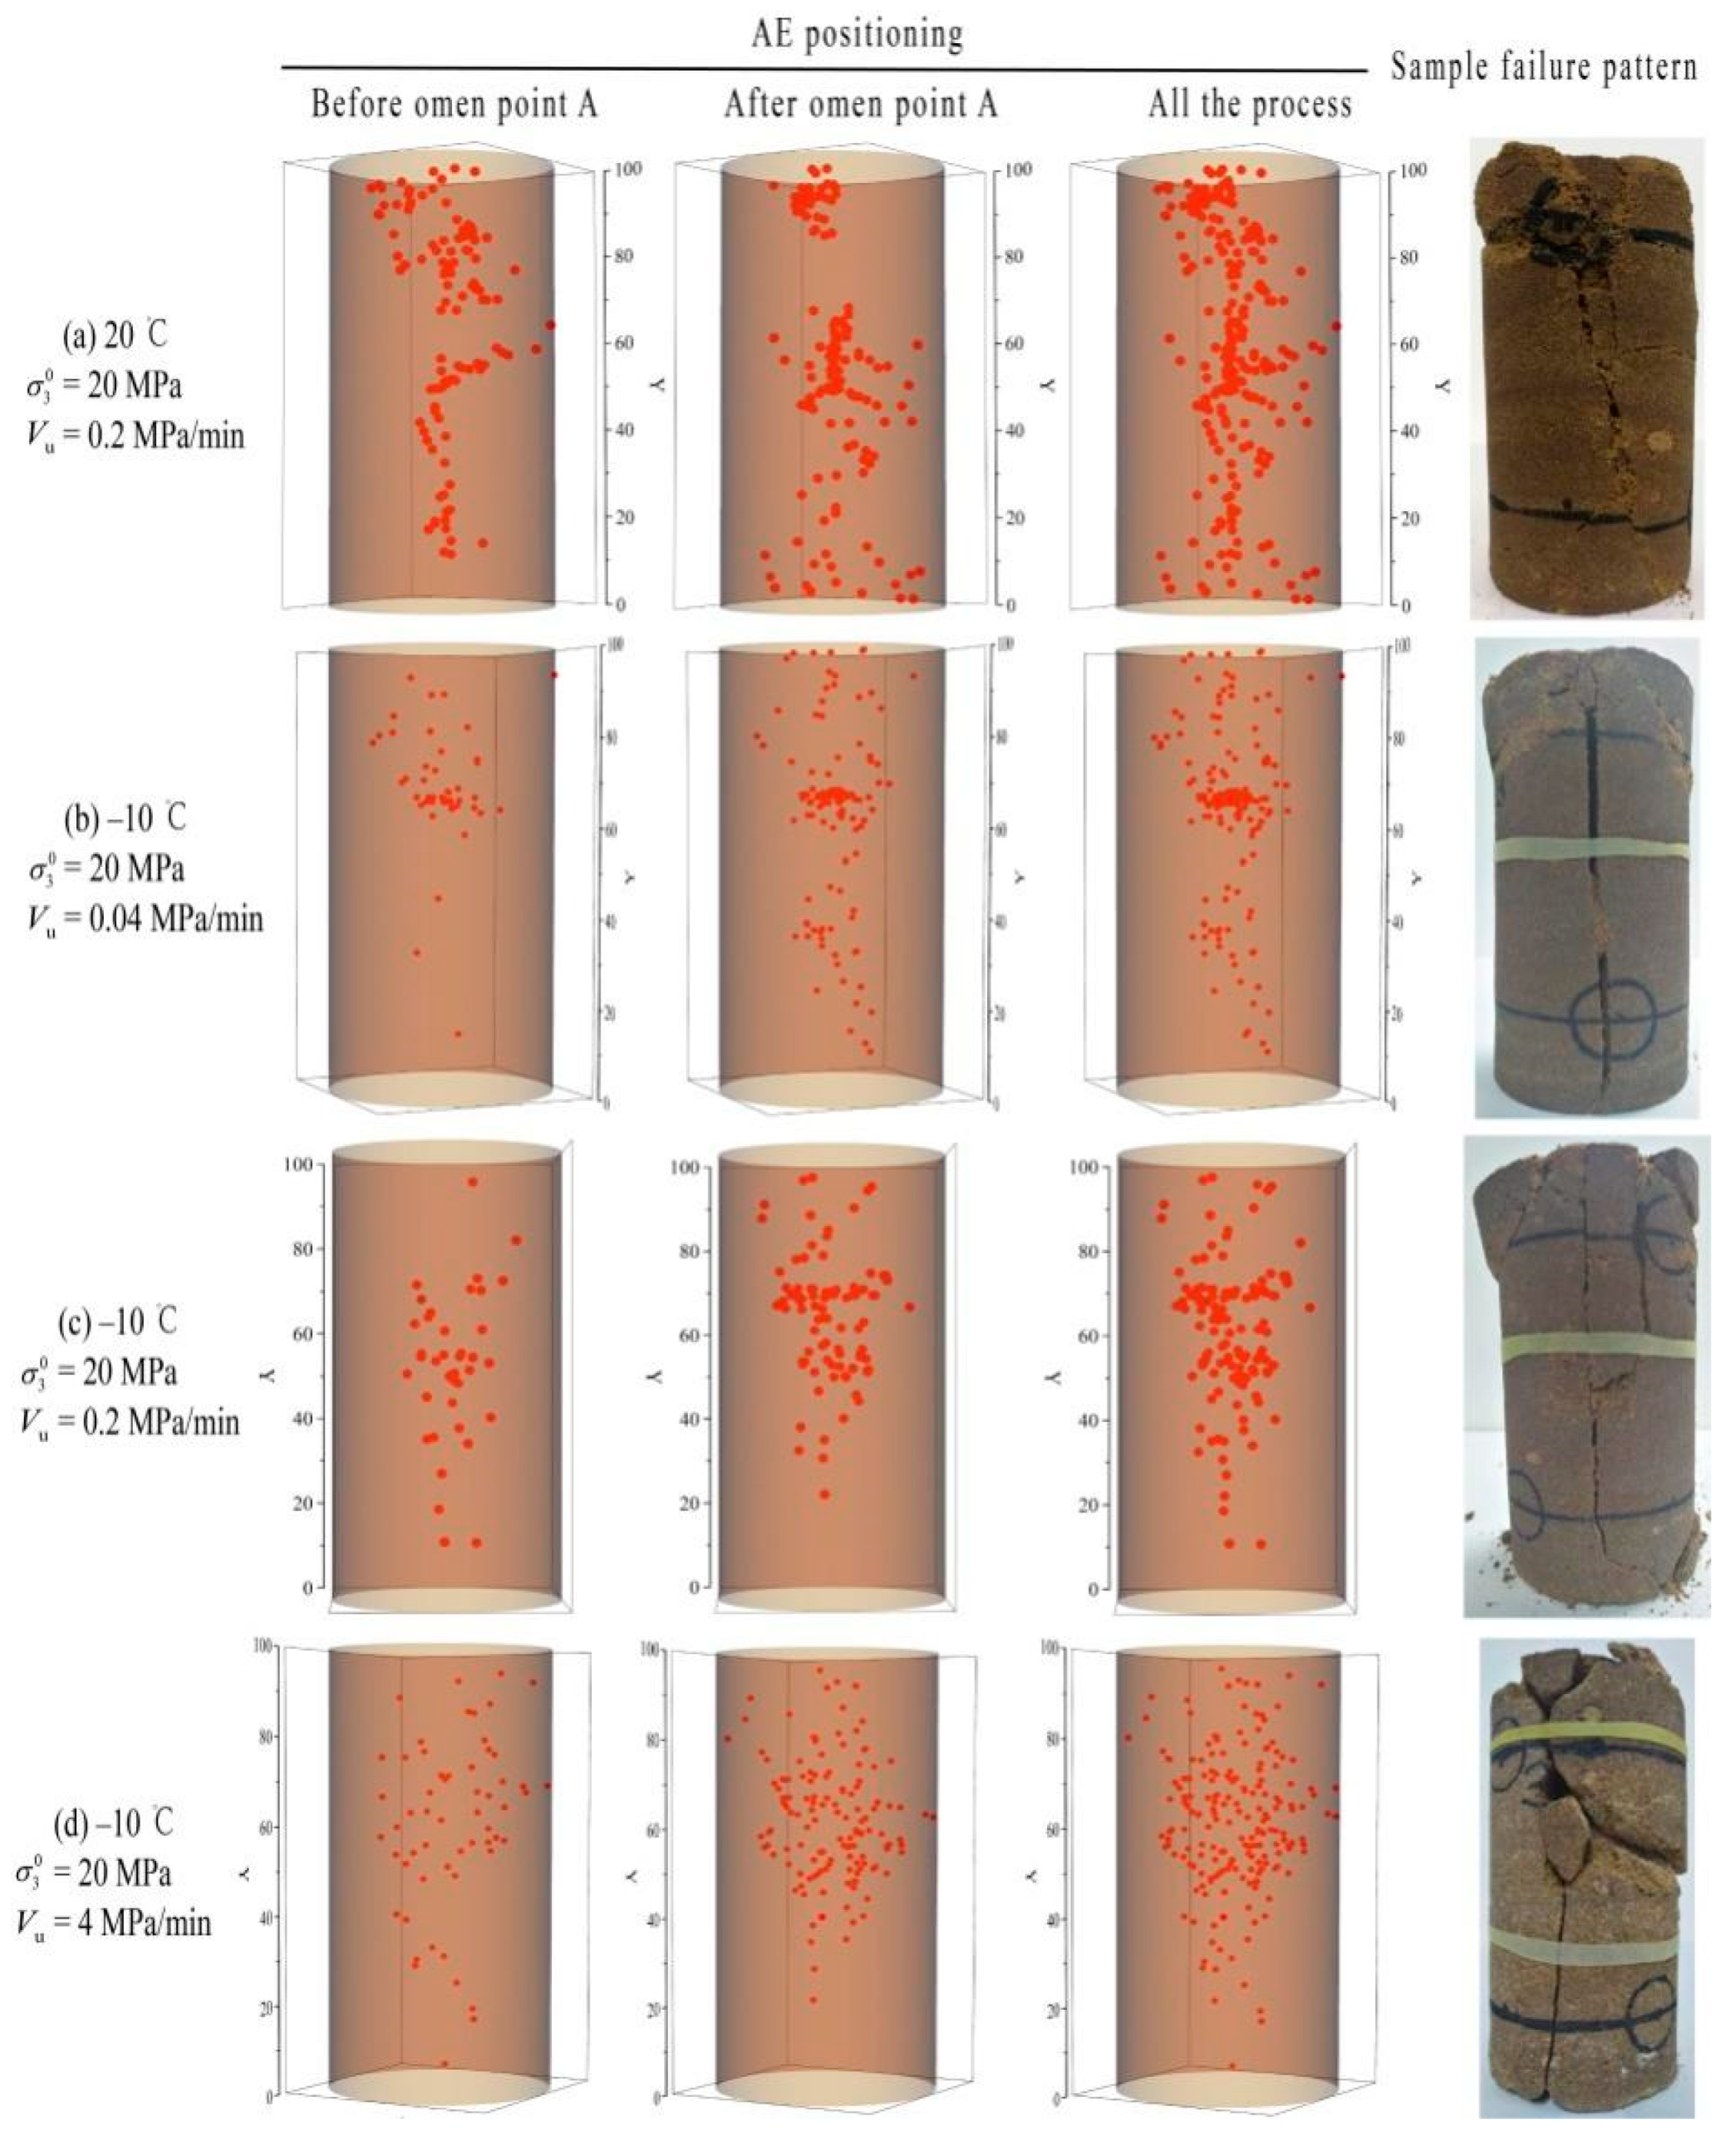
3.3. Comparative Analysis among the AE Event Locations and Failure Modes of Frozen Sandstone under Different Lateral Unloading Rates

The AE event locations in the frozen sandstone samples are compared with the failure modes under different lateral unloading rates in Figure 10. The AE event locations are divided into three areas for analysis: before point FP, after point FP, and the whole process. The number of AE events in a frozen rock sample before point FP is 1/5~1/3 of the number of AE events during the whole fracturing process. The AE event locations before point FP indicate the initial positions of microcracks, and these microcracks propagate and penetrate the sample after starting point FP. The lateral unloading failures of the frozen rock samples are mainly attributable to tensile cracks. Although tension cracks appear before macroscopic failure affects the propagation of the AE signal and weakens the AE signals during macroscopic failure, the AE event locations before the rock sample macroscopically fails can indicate the locations of propagating cracks. The AE event locations before point FP and after point FP are denser in the central area of the upper part of the rock sample. The locations of the AE events in the frozen sandstone during the lateral unloading process are consistent with the failure mode. Under different lateral unloading rates, the failure modes of the frozen rock samples diverge.
  • At an unloading rate of 0.2 MPa/min in the 20°C rock sample, a splitting crack forms in the axial direction but is slightly inclined, showing a certain degree of shear friction with a wide crack band and loose fragmentation.
  • At unloading rates of 0.04 MPa/min and 0.2 MPa/min, the frozen rock sample is split vertically by an axial crack, and the section is clean with clearly defined fracture edges.
  • At an unloading rate of 4 MPa/min, the frozen rock sample is vertically split by a main crack in the axial direction, and the right rock fragment is divided into two pieces from the middle by a transverse crack.
The principles governing these observations are as follows:
  • As the confining pressure on frozen sandstone is unloaded, the deviator stress increases, the rock sample expands and deforms radially, and tensile stress appears in the centre of the rock sample, resulting in tensile cracks. After starting A, these tensile cracks extend and penetrate in the axial direction, forming a macroscopic splitting crack.
  • As the axial stress is applied to a frozen rock sample by the upper indenter, the splitting cracks mostly start from the middle and upper parts of the rock sample, and the fragmentation at the upper end is more obvious.
  • The frozen rock sample undergoes lateral swelling under a high unloading rate, and the surface expansion deformation is greater than the central expansion deformation in the short term. The inconsistency between the expansion and deformation of the surface and the centre part produces circumferential tensile cracks and crosscutting cracks.
The solid particles and ice crystals in frozen sandstone are tightly bonded, which is beneficial to the propagation and reception of acoustic emission signals before the crack penetrates; in addition, the AE events location are more accurate. Acoustic emission three-dimensional positioning can reveal the evolution of the lateral unloading cracks and damage areas within frozen sandstone in real time. In the excavation process with the artificial freezing method, according to the AE events location before point FP, the approximate locations of the cracks in the frozen surrounding rock are determined, and the support is strengthened, which can reduce the occurrence of disasters and economic losses.

4. Picking the Acoustic Emission Key Energy

4.1. Picking Method

During the process of lateral unloading deformation and the failure of frozen sandstone, a large amount of low-acoustic-emission-energy signals is not conducive to the analysis of failure precursors, so the key energy in the process of rock failure needs to be identified. The key energy should be able to represent the key fracture event during the lateral unloading deformation and failure of frozen sandstone and correspond to the key mechanical characteristics. The set of this energy is represented by S F .
According to the principal component analysis method, E = e 1 e 2 e 3 e n 1 e n T is the AEE vector, F = f 1 f 2 f 3 f n 1 f n T is the AE frequency vector, and α i is the energy contribution rate corresponding to different energy values:
α i = e i k = 1 n e k f k ( i = 1 , 2 , 3 , , n )
Priority is given to the AEE, which has a greater energy contribution rate during the deformation and failure of the rock. The different energy values are arranged in descending order according to the energy contribution rate, and then the CAEE contribution rate is calculated according to the energy and frequency ( β i ).
β i = k = 1 i e k f k k = 1 n e k f k ( i = 1 , 2 , 3 , , n )
In statistics, a certain phenomenon can be accepted when the statistical probability exceeds 85%. Since the AEE generated by rock fractures vary under different conditions, the average AEE (85~95%) is used as the preliminary picking threshold ( Q ) [27].
The final picking threshold is represented by Q s , and the calculation formula is
Q = i = 1 n e i / n : e i E , 0.85 β i 0.95
Q s = E max R 2 + Q
where Emax is the peak AEE and R is the proportion of the amount of energy greater than the initial picking threshold.
The key AEE set after picking is expressed as
S F = S i E ( i ) Q s , i = 1 , 2 , n

4.2. Picking Results

According to the above key AEE picking method, the picking threshold for the lateral unloading AEE of frozen sandstone is calculated (see Table 5). We pick the key AEE of frozen sandstone under different lateral unloading rates and eliminate the weak (low-energy) signals generated by microcrack propagation and internal friction. The retained high-energy key signals account for fewer than 3% of the original signals, eliminating the interference due to a large number of weak signals. Thus, the efficiency of data processing is improved, and the AEE cluster area is clearer.

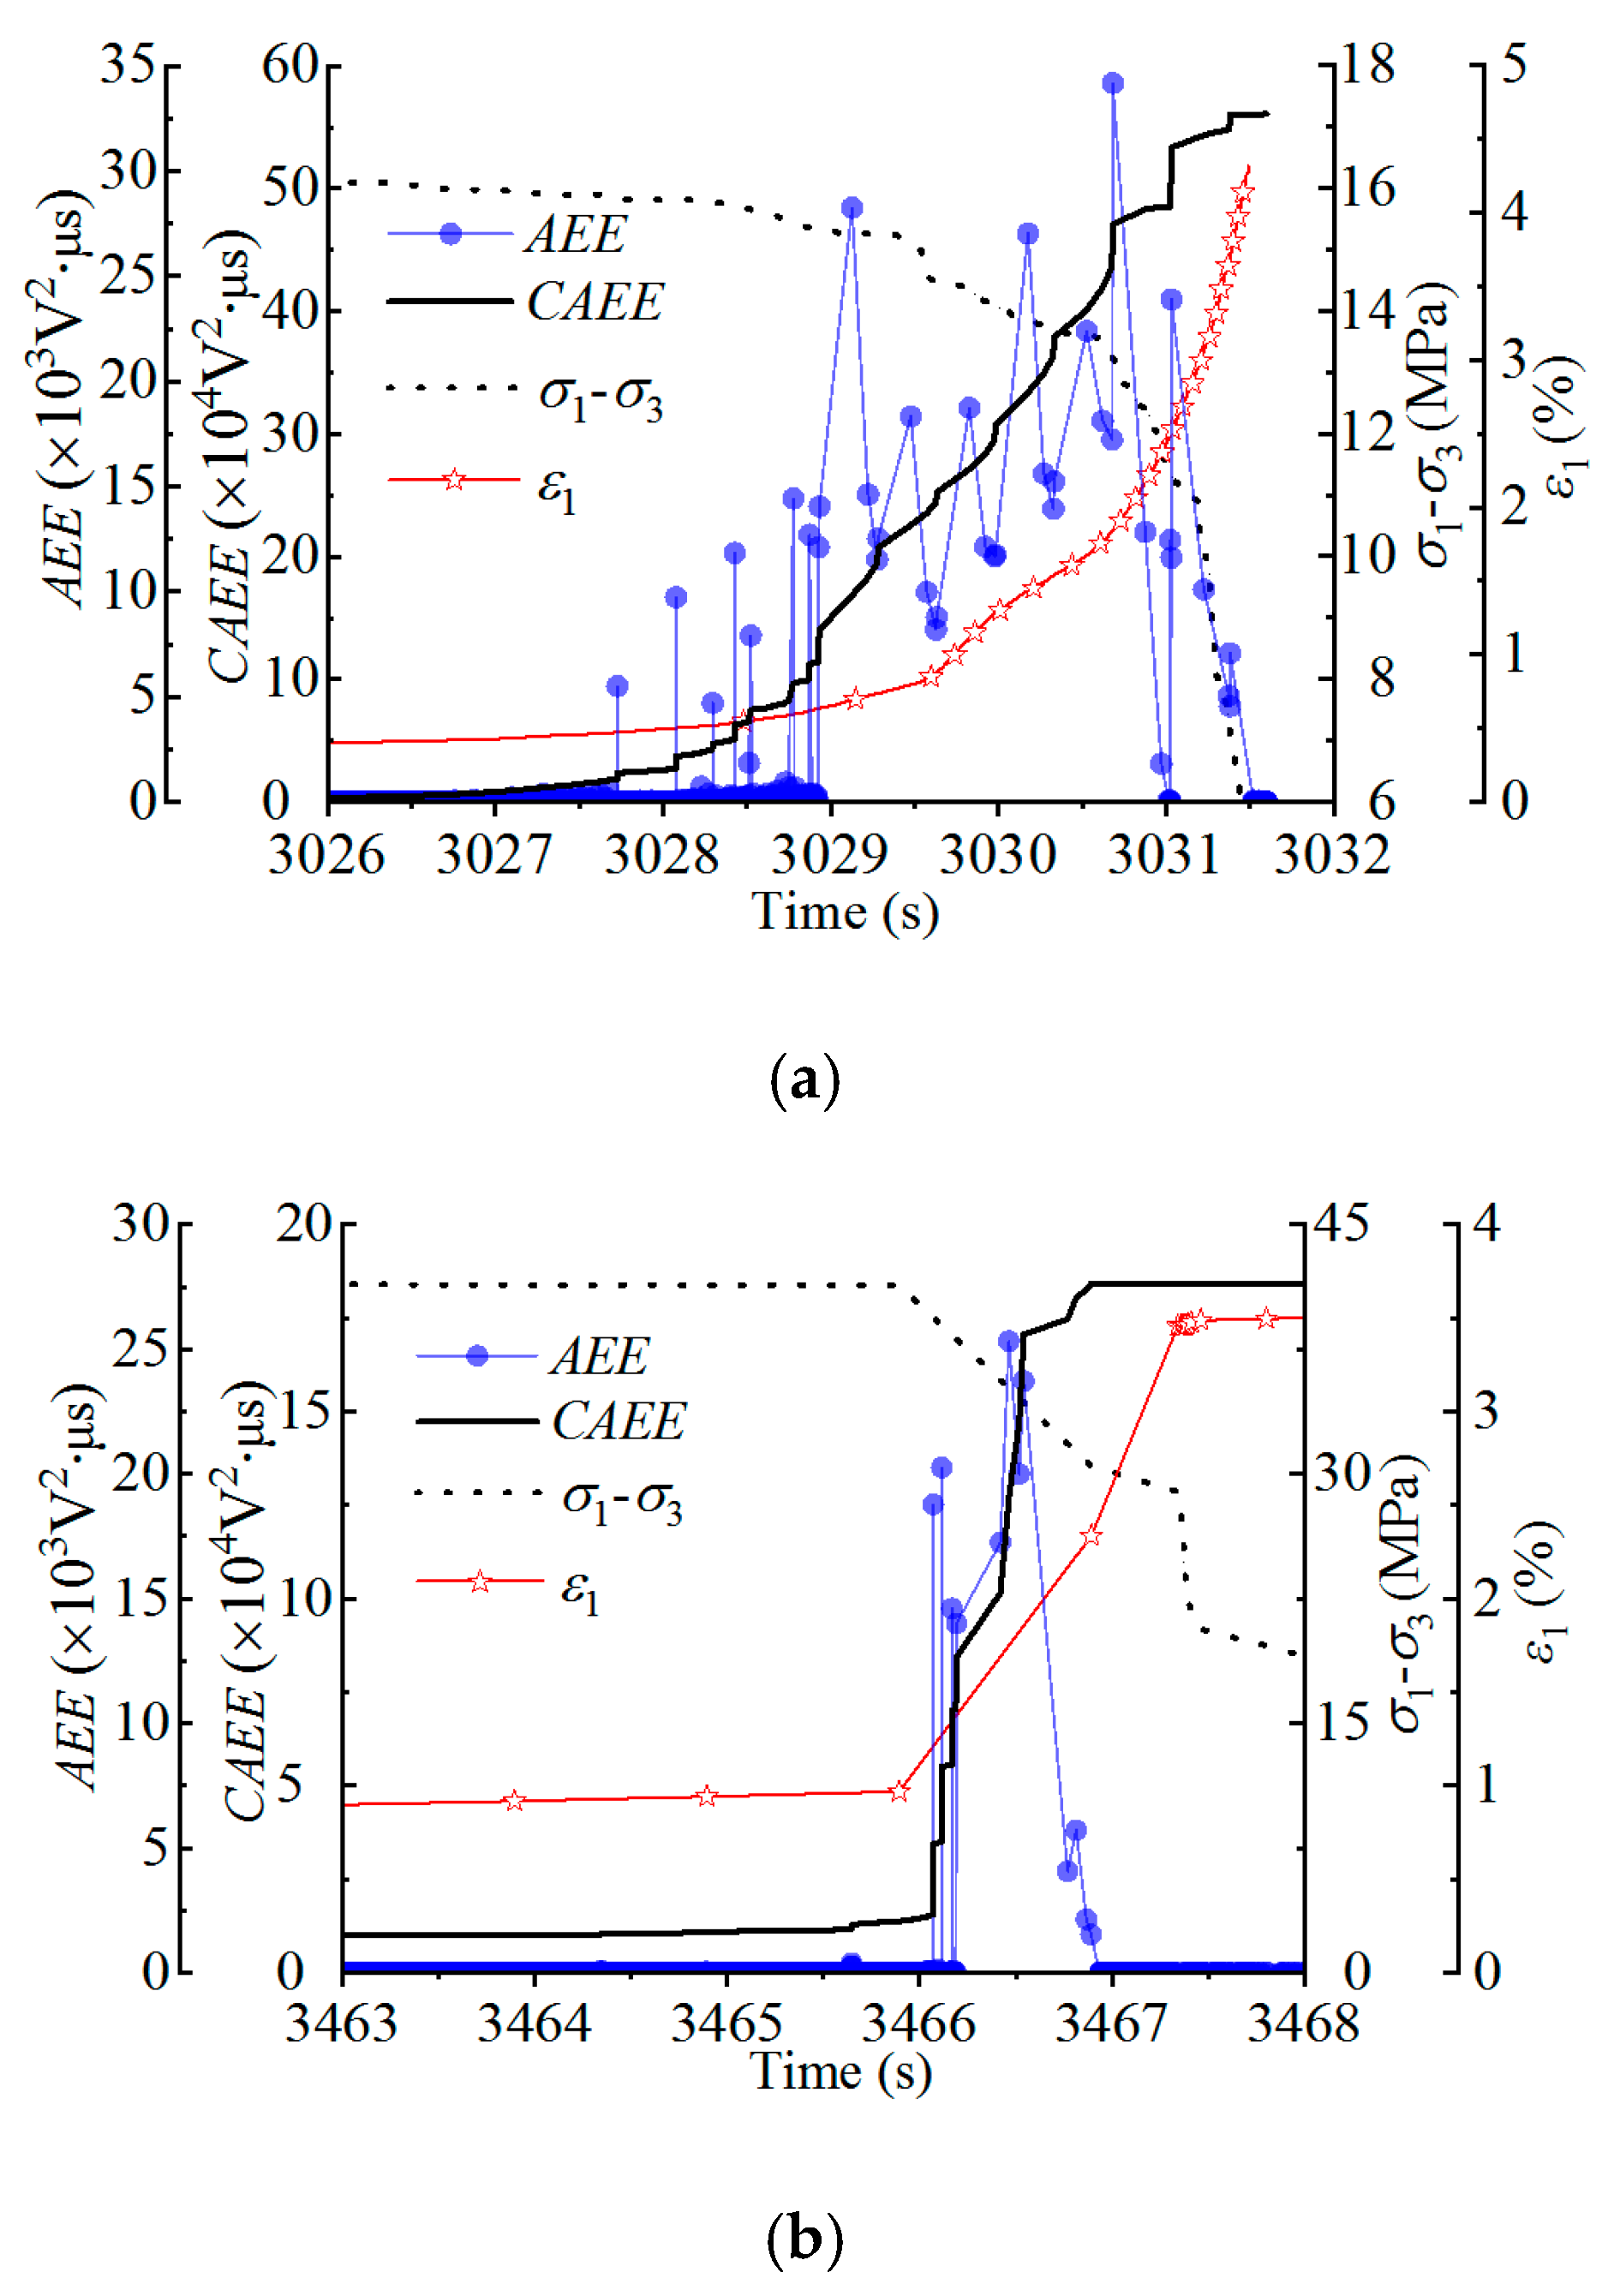
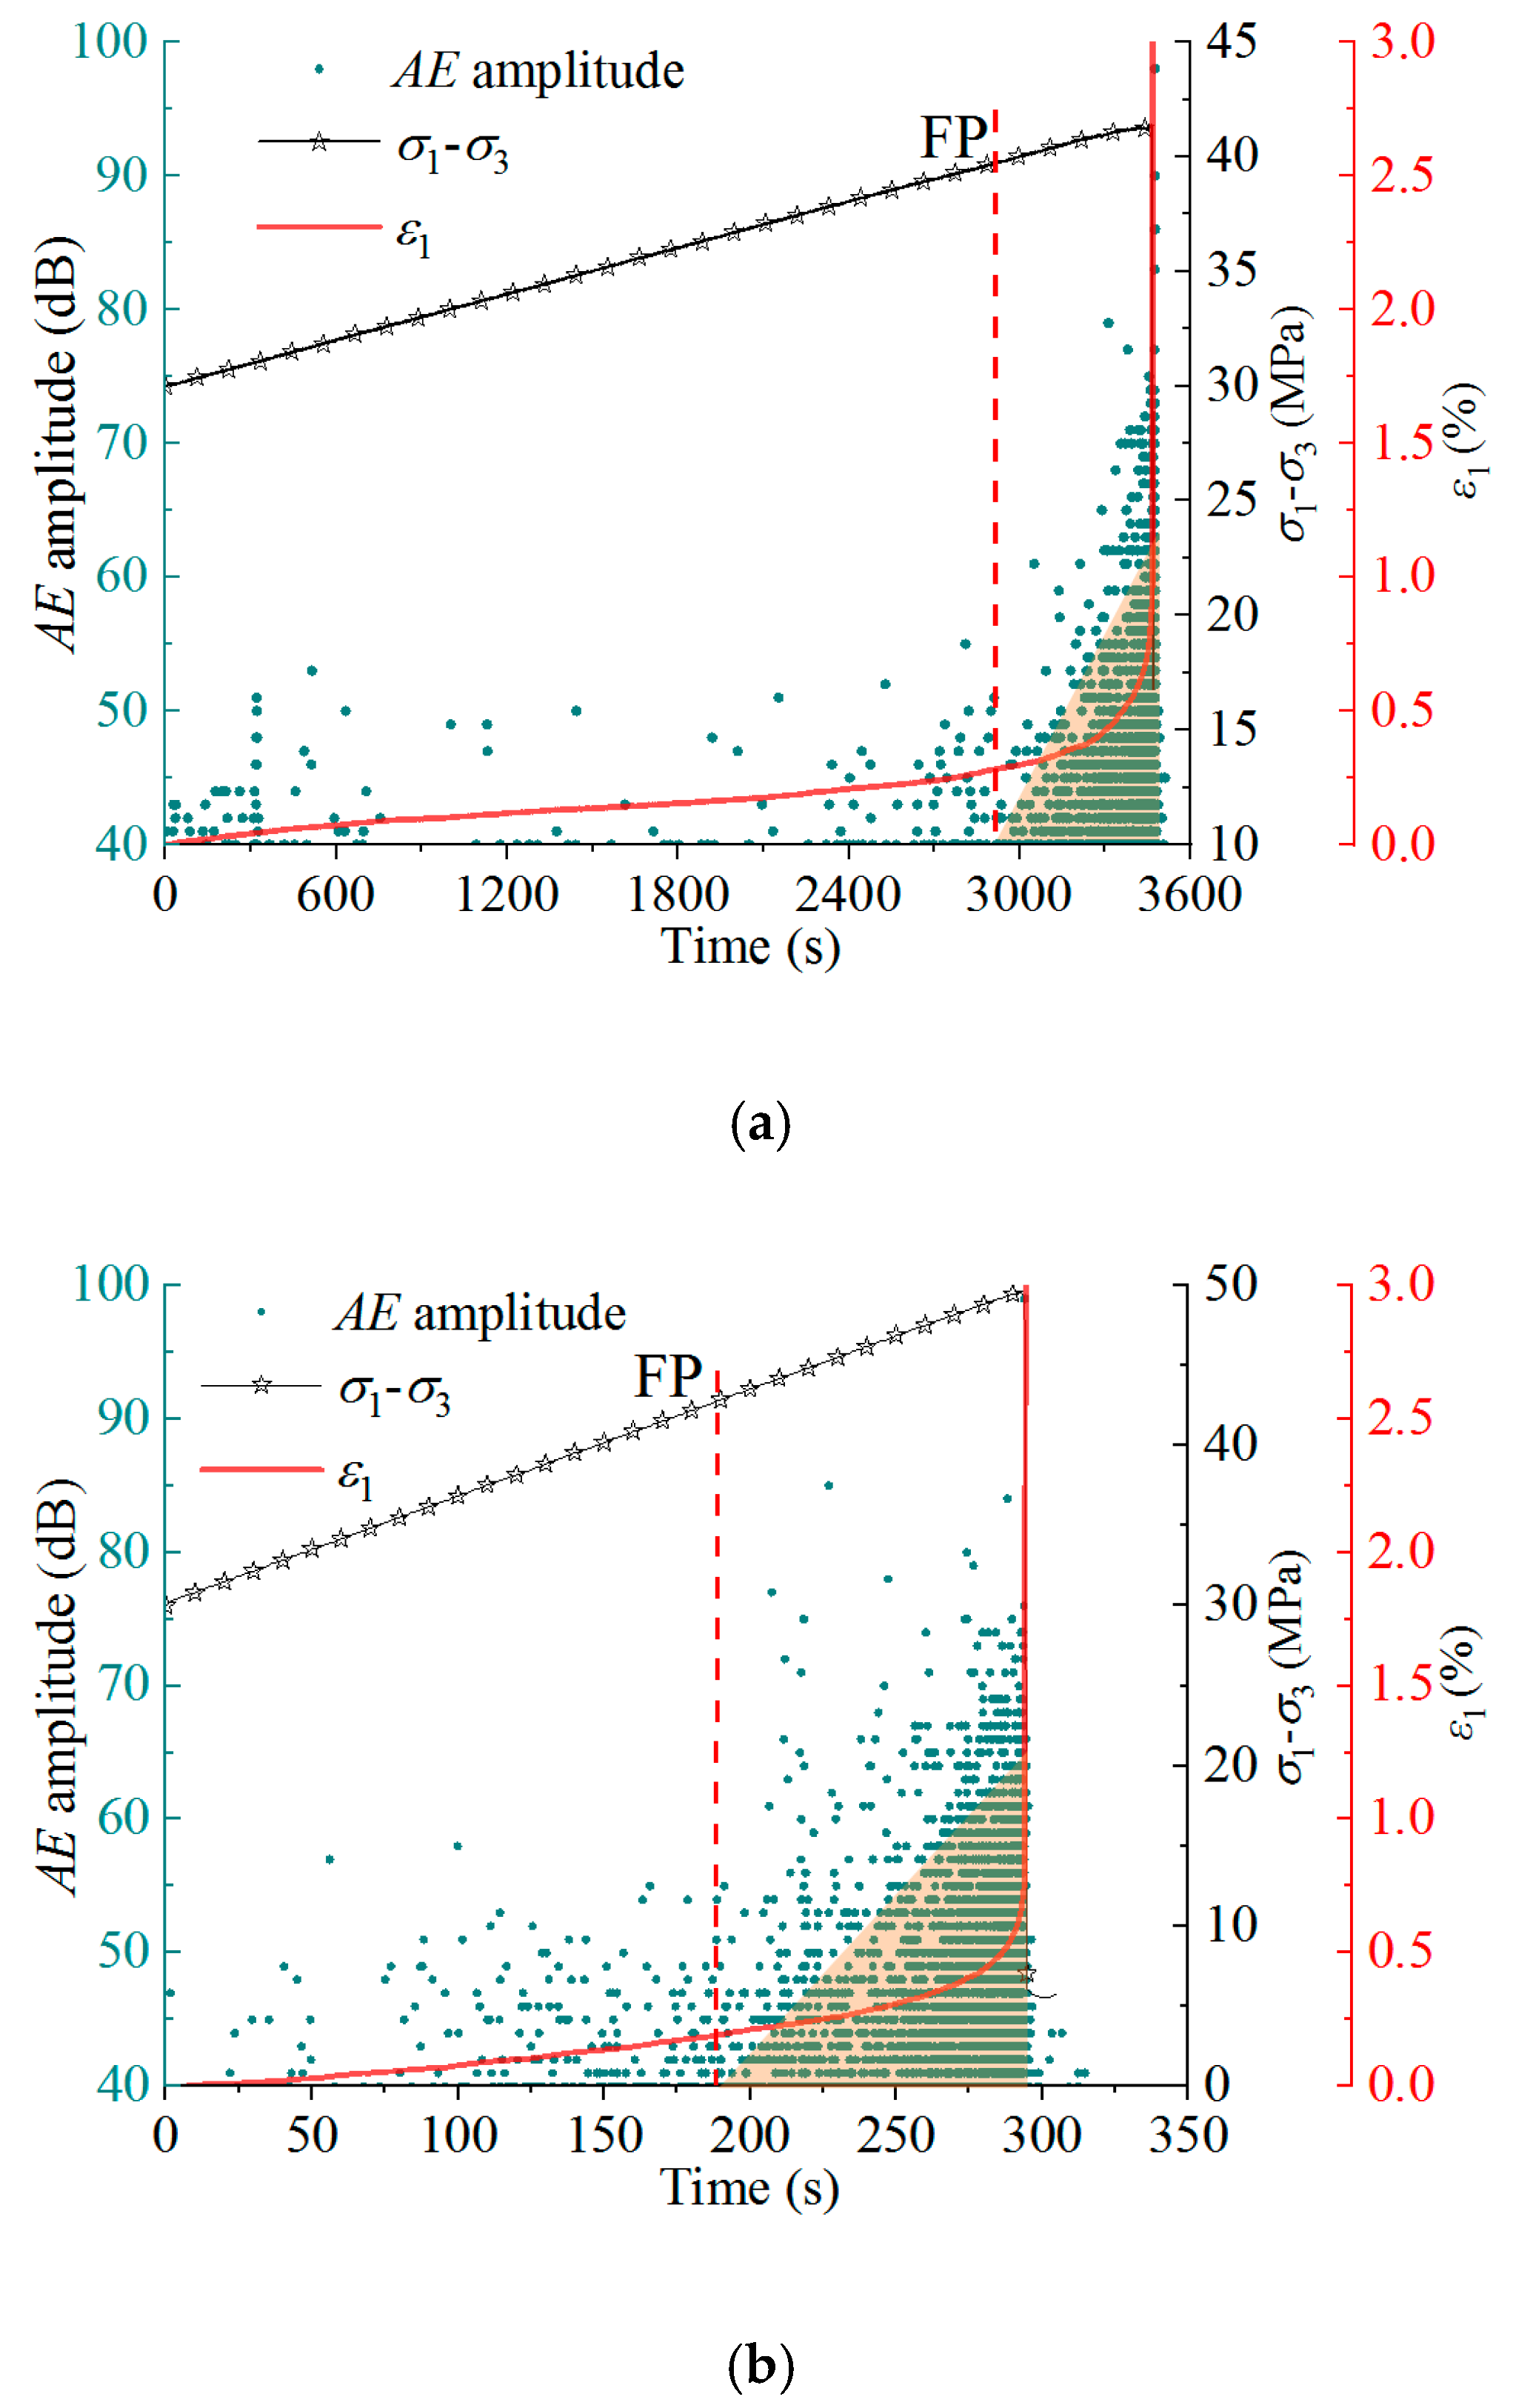
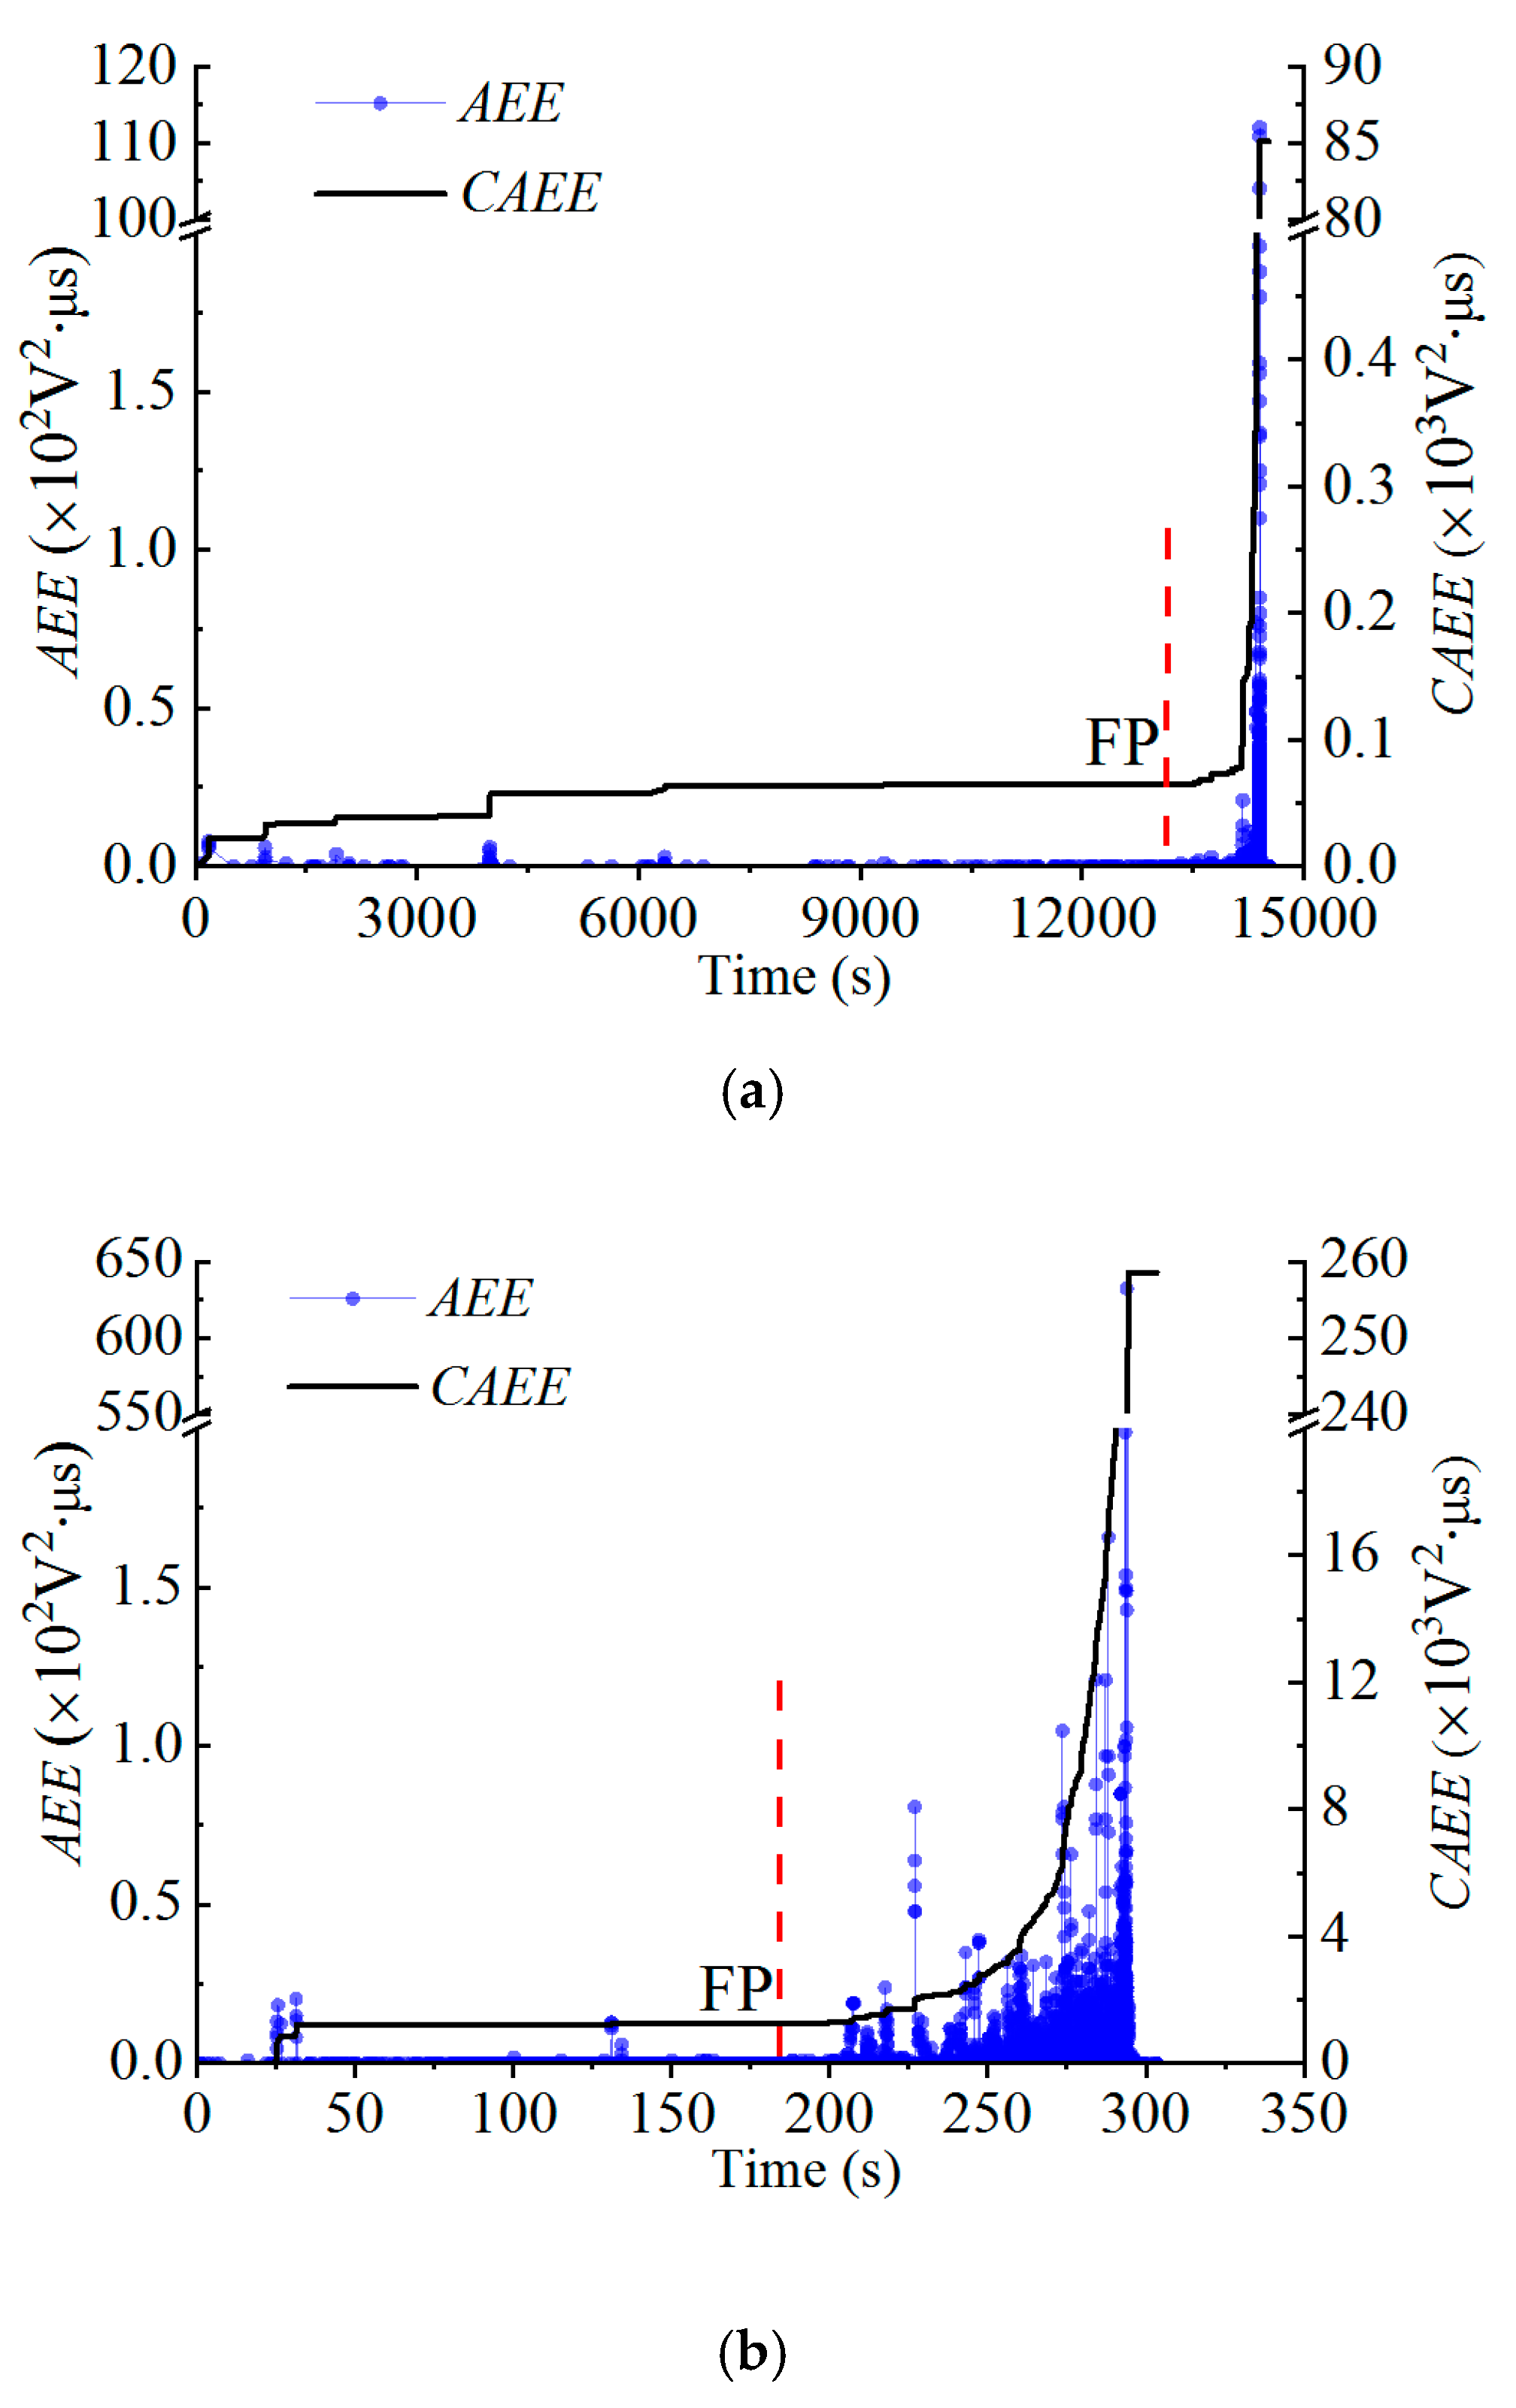
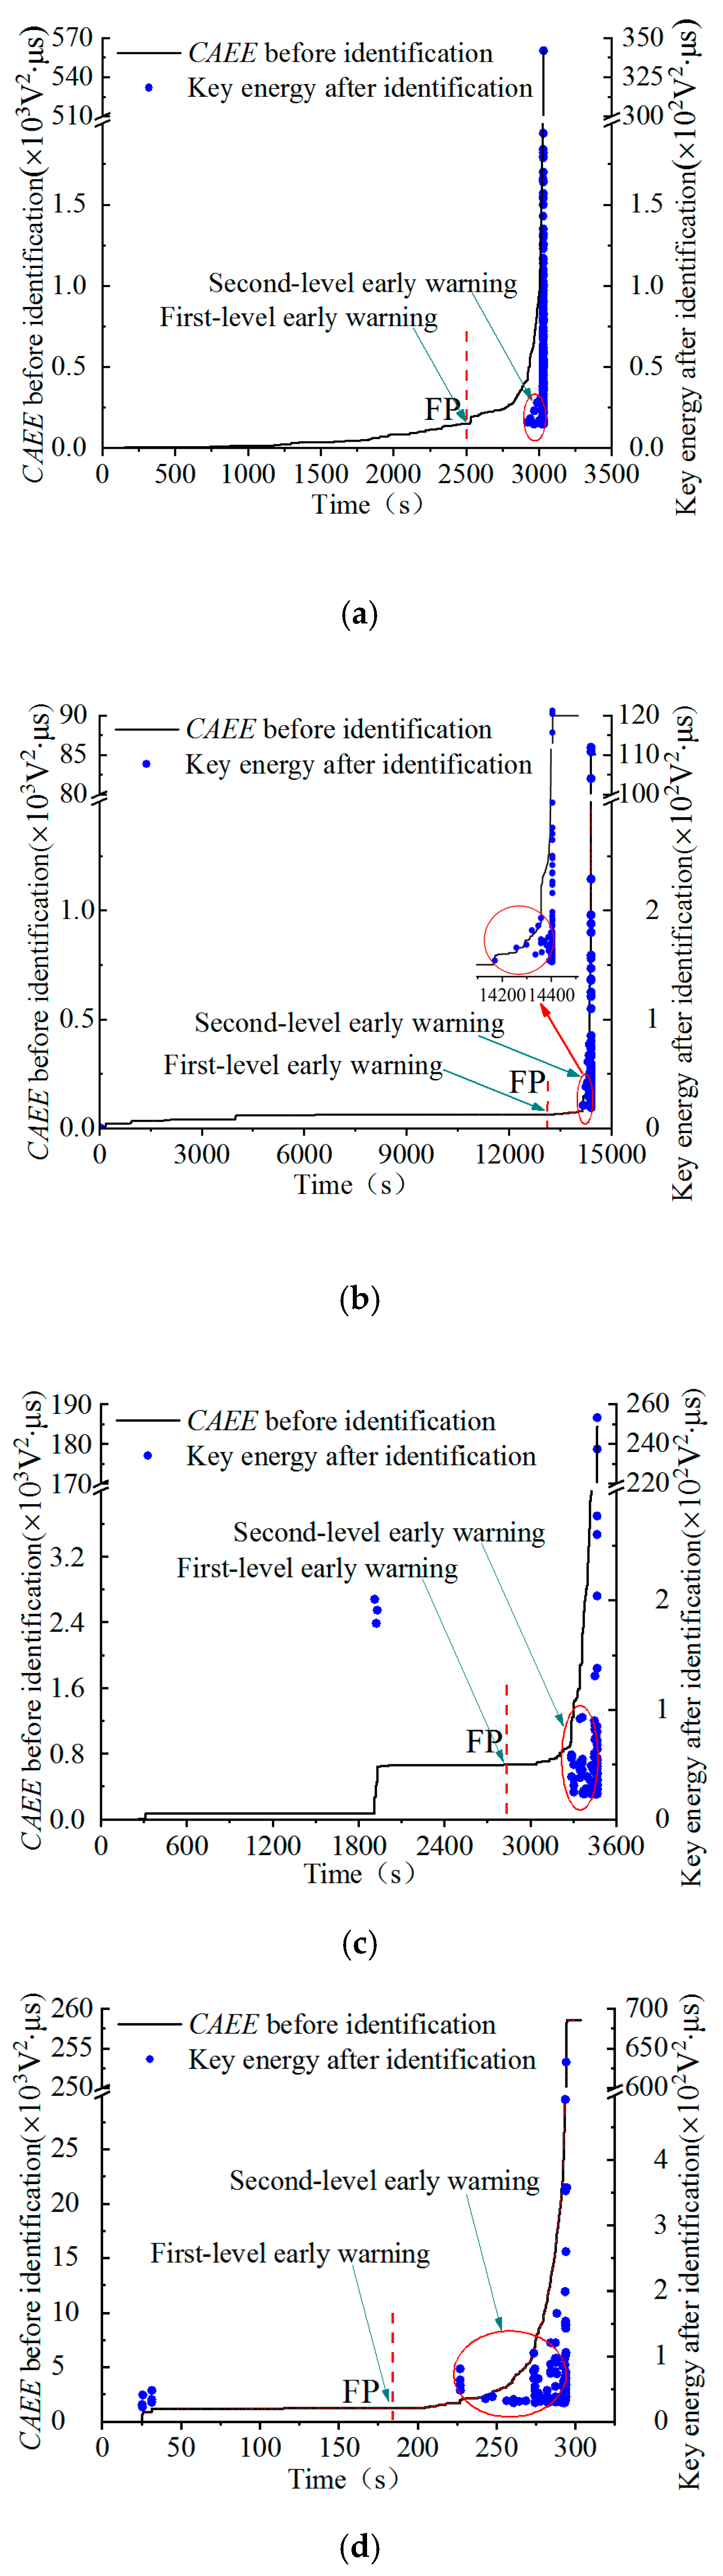
4.3. Early Warning Analysis of the AEE for Frozen Sandstone under Different Lateral Unloading Rates

The key energy of frozen sandstone at different lateral unloading rates is shown in Figure 11. The picked key energy corresponds to the position of the sudden increase in the CAEE before picking, indicating that this picking method is reliable and effective. According to the results in Section 3, point FP (the starting point of the triangular area of dense AE amplitude datapoints) is regarded as the first level of early warning, and the AEE cluster area is regarded as the second level of early warning for the lateral unloading failure of frozen sandstone. The key energy before point FP should not be mistaken for the energy cluster region. After picking, the AEE cluster area is more prominent, and the prediction is more accurate. During the actual excavation process, different methods of key reinforcement can be implemented according to the first and second levels of early warning.

5. Discussion

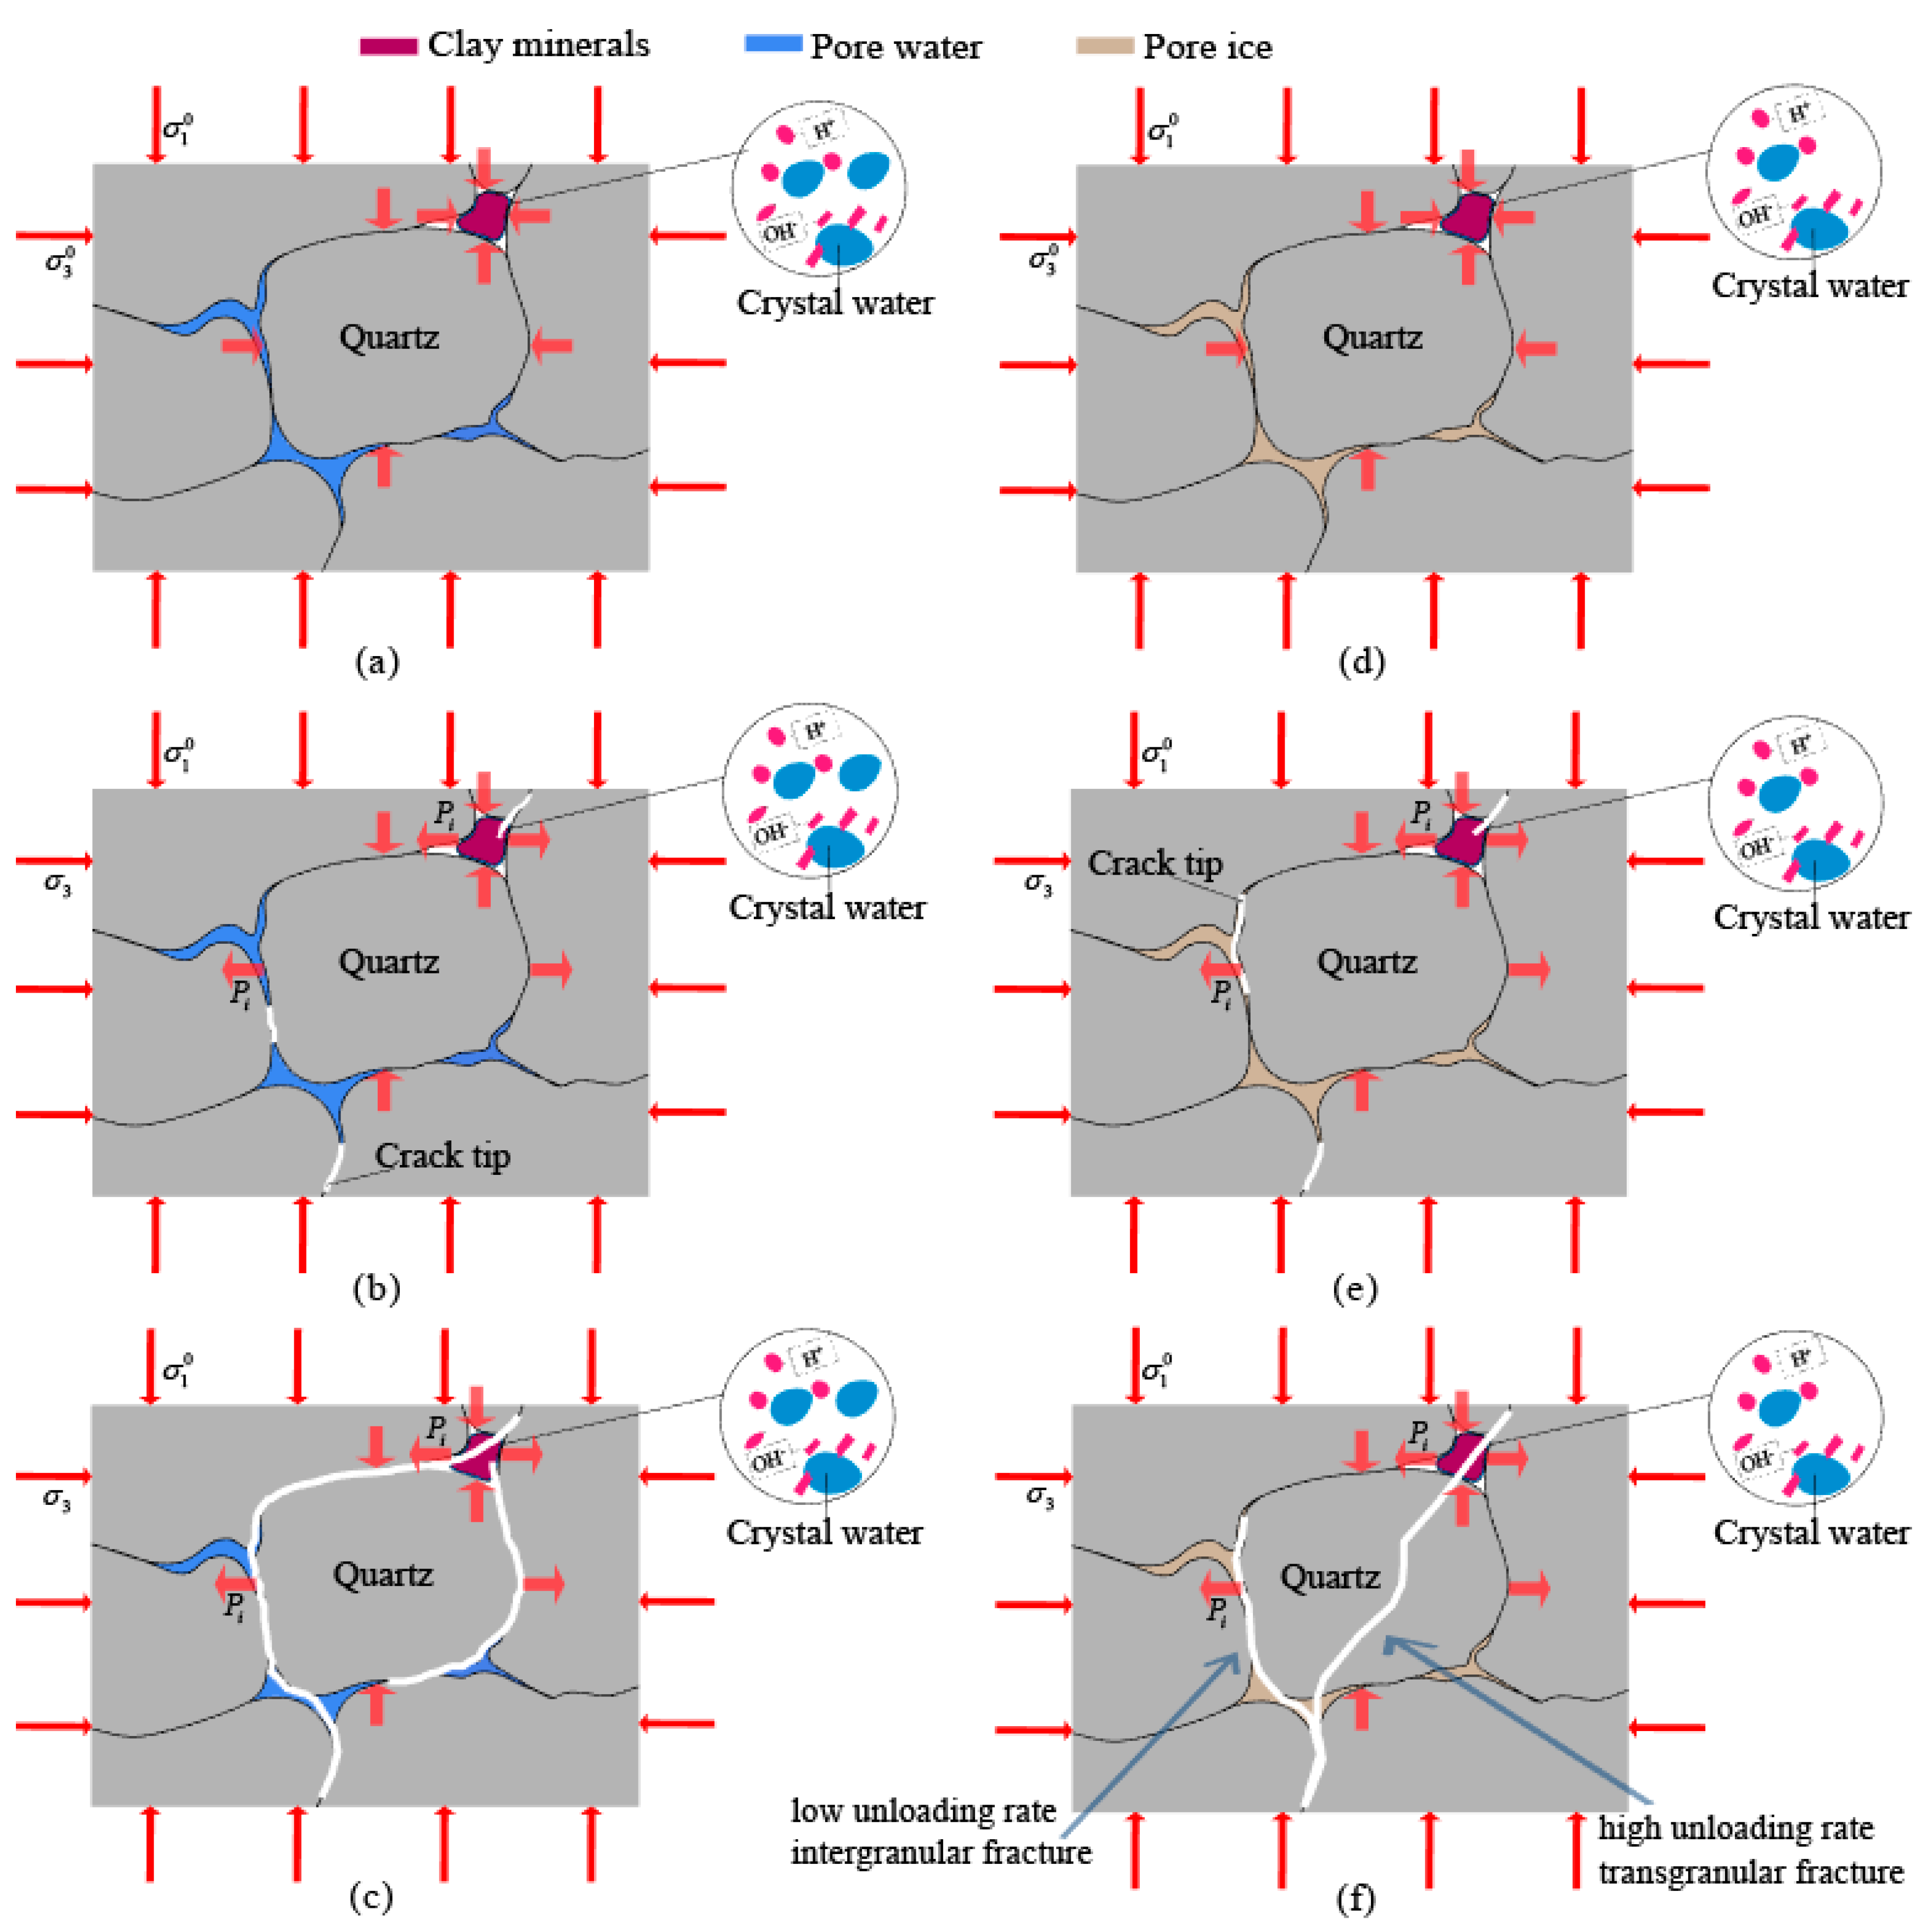
5.1. Effect of Freezing Action on Fracture Mechanism of Lateral Unloading Sandstone

Artificial freezing construction: refrigeration equipment is used to freeze water-rich rock strata and isolate groundwater, thus facilitating engineering construction in freezing circles. After freezing, sandstone pore water freezes and expands, resulting in extrusion damage to pores. The compressive damage of pore ice is relatively weak. The peak stress of the frozen sandstone under lateral unloading is approximately 2.5 times higher than that of sandstone at 20 °C. As the rock heats up, its strength decreases, but the lining structure has already been constructed. The conceptual diagram of sandstone failure is shown in Figure 12. Figure 12a shows the initial state of the sandstone at 20 °C before lateral unloading. The sandstone is in a compressed state, the initial stress is borne by the rock skeleton, and the quartz and clay minerals bear compressive stress in all directions [28,29,30]. At the beginning of lateral unloading, the compressive stress in the horizontal direction of the rock skeleton gradually decreases. Water has a softening effect on sandstone, and the liquid water film between solid particles reduces the friction between pore walls [31] and further decreases the AEE. After unloading to a certain extent, the rock skeleton is subject to tensile force ( P i ) in the horizontal direction, and crack tips appear on the particle cementation surface and clay minerals (see Figure 12b). At the FP, the clay minerals crack, and the quartz, with higher tensile strength, is not easy to crack, resulting in less AEE. As more confining pressure is unloaded, the tensile stress in the horizontal direction of the rock skeleton becomes larger. When it exceeds the tensile strength of the rock sample, the crack propagates, and failure occurs (see Figure 12c). However, the sample at 20 °C is severely damaged, and the CAEE after destruction is relatively large.
The freezing of pore water changes the rock structure [32]. The frozen sandstone is a composite medium, mainly composed of mineral particles, ice, and unfrozen water. Ice can resist tensile and compressive stresses and can increase rock cohesion by entering its pores [33]. Figure 12d shows the initial state of the frozen rock sample before lateral unloading. The initial stress is shared by the rock skeleton and pore ice [34,35]. The temperature of the samples drops from 20 °C to –5 °C, and the pore water and crystal water are reduced. Under the freezing action of saturated Cretaceous sandstones, the pore water becomes ice and fills the pores, increasing the effective bearing area and compressive strength [36,37]. At the beginning of lateral unloading, the horizontal compressive stress of the rock skeleton and pore ice gradually decreases. More unloaded confining pressure means greater horizontal tension of the rock skeleton and the ice, and the micro-cracks initiate and expand in the weak medium. At the FP, crack tips appear in the particle cement, pore ice and clay minerals (see Figure 12e). Quartz is stronger than ice, so less energy is released by icebreaking and debonding. The tensile stress generated by confining pressure unloading exceeds the tensile strength and cause the expansion of cracks in rock sample, thus leading to the quartz particles in rock pulls apart and releases great energy (see Figure 12f). During the unloading failure stage, the pore ice, quartz, clay minerals and “ice-containing rock skeleton” deform simultaneously, inducing the release of AEE. Abundant AEE can be released even after a small amount of quartz is pulled apart.

5.2. Effect of Unloading Rate on Fracture Mechanism of Frozen Sandstone

The failure processes of the frozen rock samples are longer at lower unloading rates. Ice crystals, solid sandstone particles and cement not only produce elastic deformation and plastic deformation but also undergo partial creep deformation. The longer the failure process of rock sample is, the more extensive the fracture development and the greater the fracture density. The slower the crack propagation in the rock, the lower the acoustic emission amplitude and energy generated by the crack. When the density of cracks in a rock sample is high, the propagation of part of the acoustic emission signal is hindered, and few AE amplitude points are collected. At low unloading rate, intergranular fracture occurs in frozen rock sample, while transgranular fracture occurs at high unloading rate (see Figure 12f).
At a high unloading rate, a frozen rock sample fails faster under an unloading confining pressure and the cracks at low density are not fully developed and axial deformation is minimal. Long and wide cracks are produced over a short time, and the amplitude and energy of acoustic emission generated by a crack are relatively high. A small crack density is conducive to the propagation of acoustic emission signals, so more AE amplitude datapoints are recorded, and the AEE is higher. After point FP, the deviator stress continues to increase, and the elastic deformation energy stored in the frozen rock sample increases. As the lateral unloading rate of frozen rock increases, the released rate of elastic deformation energy and the peak AEE increase.

6. Conclusions

In this paper, mechanical unloading tests and simultaneous acoustic emission tests involving water-rich frozen rock samples under different lateral unloading rates are carried out. According to the acoustic emission parameters used to reflect the deformation of frozen sandstone under lateral unloading, the conclusions are as follows:
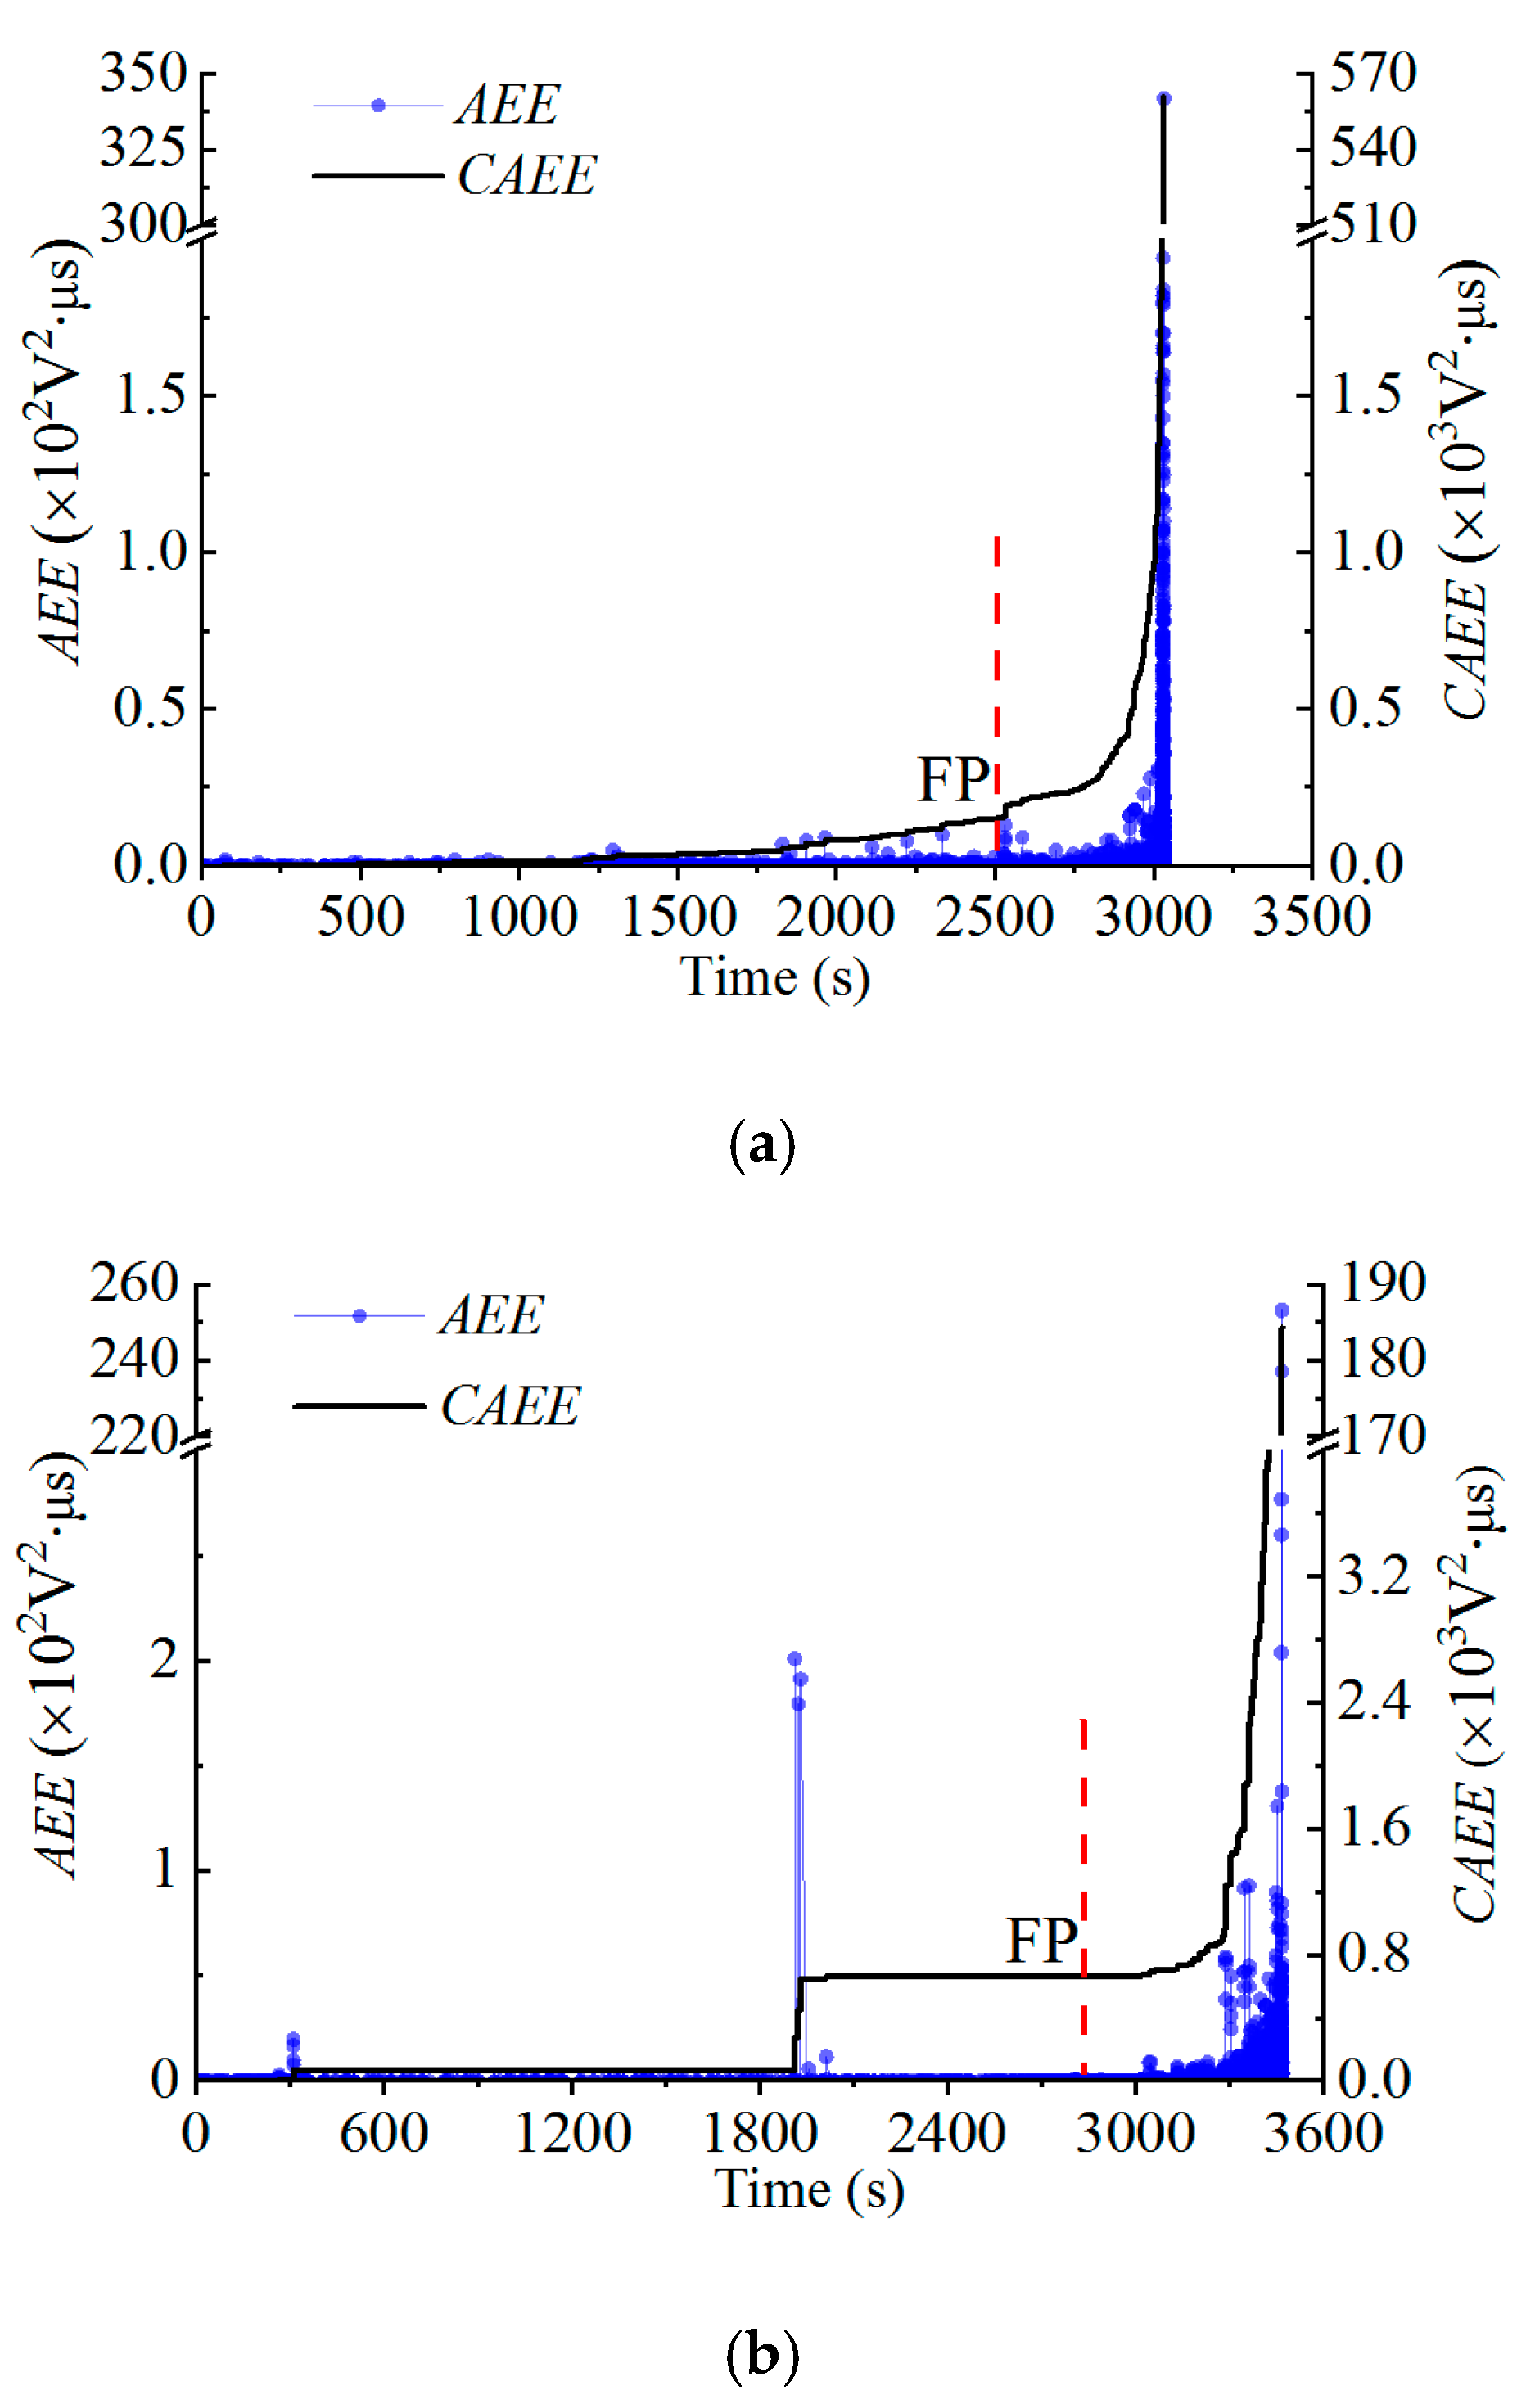
  • The peak lateral unloading stress of a frozen rock sample is approximately 2.5 times greater than that of a 20 °C rock sample under the same conditions. During the lateral unloading process of a rock sample, the AE amplitude data form a dense triangular area starting at point FP. Additionally, the CAEE of rock samples exhibit the same change trend over time: both increase slowly before point FP and increase exponentially after point FP. There is a cluster of AEE after point FP and before failure occurs. The triangular area and cluster area can be used as precursors signalling the lateral unloading failure of frozen sandstone.
  • As the lateral unloading rate of a frozen rock sample increases, the peak stress increases, the axial strain decreases, and the number of AE amplitude datapoints increases significantly. As the CAEE of the rock sample at point FP increases, the peak AEE increases, the CAEE at the time of failure increases, and the damage-related sound becomes louder, signifying a more dangerous safety hazard.
  • The lateral unloading failure pattern of frozen sandstone is consistent with the locations of the AE events recorded throughout the process. According to the AE event locations before point FP, the locations where the frozen surrounding rock needs support can be determined.
By picking the key AEE, the interference of low-energy signals is reduced. Based on the starting point of the dense triangular area of the AE amplitude data and the energy cluster area, a two-level early warning system is established. The development of protective measures that are triggered by different warning indicators can reduce the occurrence of disasters.

Author Contributions

Conceptualization, G.Y. and X.D.; formal analysis, H.L.; validation, Y.S.; Writing—original draft, S.L. All authors have read and agreed to the published version of the manuscript.

Funding

This research was supported by the National Natural Science Foundation of China (Grant Nos. 42177144, 51774231, and 42277172).

Data Availability Statement

All the data, models, or code that support the findings of this study are available from the corresponding author upon reasonable request.

Conflicts of Interest

The authors declare no conflict of interest.

References

  1. Maruvanchery, V.; Kim, E. Effects of water on rock fracture properties: Studies of mode I fracture toughness, crack propagation velocity, and consumed energy in calcite-cemented sandstone. Geomech. Eng. 2019, 17, 57–67. [Google Scholar] [CrossRef]
  2. Lin, G.; Li, M.; Chen, Y.L.; Zhang, J.Z.; Jiskani, I.M.; Doan, D.V.; Xu, L. Dynamic tensile mechanical properties and fracture characteristics of water-saturated sandstone under the freezing effect. Int. J. Geomech. 2021, 21, 04021044. [Google Scholar] [CrossRef]
  3. Li, Z.Y.; Yang, G.S. Constitutive model of frozen red sandstone based on ice-solid binary medium. Arab. J. Geosci. 2021, 14, 1616. [Google Scholar] [CrossRef]
  4. Cerfontaine, B.; Collin, F. Cyclic and fatigue behaviour of rock materials: Review, interpretation and research perspectives. Rock Mech. Rock Eng. 2018, 51, 391–414. [Google Scholar] [CrossRef]
  5. Rusin, Z.; Świercz, P. Frost resistance of rock materials. Constr. Build. Mater. 2017, 148, 704–714. [Google Scholar] [CrossRef]
  6. Zeng, Q. Discussion of freezing strain model for estimating the unfrozen water content of saturated rock under low temperature by Shibing Huang, Quansheng Liu, Yanzhang Liu, Zuyang Ye, and Aiping Cheng (Note). Int. J. Geomech. 2019, 19, 07019001. [Google Scholar] [CrossRef] [Green Version]
  7. Levin, L.Y.; Semin, M.A.; Parshakov, O.S. Mathematical Prediction of Frozen Wall Thickness in Shaft Sinking. J. Min. Sci. 2017, 53, 938–944. [Google Scholar] [CrossRef]
  8. Conver, J.L.; Yarwood, E.; Hetherington, L.D.; Swann, D.E. Nurse rock microclimates significantly buffer exposure to freezing temperature and moderate summer temperature. J. Arid Environ. 2020, 177, 104140. [Google Scholar] [CrossRef]
  9. Li, Z.Q.; Hu, F.; Qi, S.W.; Hu, R.L. Strain-softening failure mode after the post-peak as a unique mechanism of ruptures in a frozen soil-rock mixture. Eng. Geol. 2020, 274, 105725. [Google Scholar] [CrossRef]
  10. Zhang, D.M.; Yang, Y.S.; Chu, Y.P.; Zhang, X.; Xue, Y.G. Influence of loading and unloading velocity of confining pressure on strength and permeability characteristics of crystalline sandstone. Results Phys. 2018, 9, 1363–1370. [Google Scholar] [CrossRef]
  11. Xiao, T.L.; Huang, M.; Gao, M. Experimental study of the mechanical characteristics of a rock-like material containing a preexisting fissure under loading and unloading triaxial compression. Adv. Civ. Eng. 2020, 2020, 9078731. [Google Scholar] [CrossRef]
  12. Huang, X.; Liu, Q.S.; Liu, B.; Liu, X.W.; Pan, Y.C.; Liu, J.P. Experimental study on the dilatancy and fracturing behavior of soft rock under unloading conditions. Int. J. Civ. Eng. 2017, 15, 921–948. [Google Scholar] [CrossRef]
  13. Feng, F.; Chen, S.J.; Li, D.Y.; Huang, W.P.; Peng, K.; Zang, C.W. Excavation unloading-induced fracturing of hard rock containing different shapes of central holes affected by unloading rates and in situ stresses. Energy Sci. Eng. 2020, 8, 4–27. [Google Scholar] [CrossRef] [Green Version]
  14. Zhang, Y.; Zou, Y.; Zhang, Y.; Wang, L.; Liu, D.; Sun, J.; Ge, H.; Zhou, D. Experimental Study on Characteristics and Mechanisms of Matrix Pressure Transmission Near the Fracture Surface During Post-Fracturing Shut-In in Tight Oil Reservoirs. J. Pet. Sci. Eng. 2022, 219, 111133. [Google Scholar] [CrossRef]
  15. Meng, F.Z.; Louis, N.Y.W.; Zhou, H.; Wang, Z.Q.; Zhang, L.M. Asperity degradation characteristics of soft rock-like fractures under shearing based on acoustic emission monitoring. Eng. Geol. 2020, 266, 105392. [Google Scholar] [CrossRef]
  16. Luo, D.N.; Su, G.S.; Zhang, G.L. True-triaxial experimental study on mechanical behaviours and acoustic emission characteristics of dynamically induced rock failure. Rock Mech. Rock Eng. 2020, 53, 1205–1223. [Google Scholar] [CrossRef]
  17. Wei, J.; Zhu, W.C.; Guan, K.; Zhou, J.R.; Song, J.J. An acoustic emission data-driven model to simulate rock failure process. Rock Mech. Rock Eng. 2020, 53, 1605–1621. [Google Scholar] [CrossRef]
  18. Zha, E.S.; Zhang, R.; Ai, T.; Ren, L.; Zhang, Z.P.; Liu, Y.; Lou, C.D. Acoustic emission characteristics and damage evolution of rock under different loading modes. Energies 2020, 13, 3649. [Google Scholar] [CrossRef]
  19. Jing, H.W.; Yin, Q.; Yang, S.Q.; Chen, W.Q. Micro-mesoscopic creep damage evolution and failure mechanism of sandy mudstone. Int. J. Geomech. 2021, 21. [Google Scholar] [CrossRef]
  20. Kim, J.S.; Kim, G.Y.; Baik, M.H.; Finsterle, S.; Cho, G.C. A new approach for quantitative damage assessment of in-situ rock mass by acoustic emission. Geomech. Eng. 2019, 18, 11–20. [Google Scholar] [CrossRef]
  21. Li, S.C.; Li, D.Q.; Zhang, N. Multivariate prediction model of strength and acoustic emission energy considering parameter correlation of coal or rock. Adv. Mater. Sci. Eng. 2020, 2020, 8429652. [Google Scholar] [CrossRef]
  22. Yang, J.; Mu, Z.L.; Yang, S.Q. Experimental study of acoustic emission multi-parameter information characterizing rock crack development. Eng. Fract. Mech. 2020, 232, 107045. [Google Scholar] [CrossRef]
  23. Bost, M.; Pouya, A. Stress generated by the freeze–thaw process in open cracks of rock walls: Empirical model for tight limestone. Bull. Eng. Geol. Environ. 2017, 76, 1491–1505. [Google Scholar] [CrossRef] [Green Version]
  24. Lishman, B.; Marchenko, A.; Sammonds, P.; Murdza, A. Acoustic emissions from in situ compression and indentation experiments on sea ice. Cold Reg. Sci. Technol. 2020, 172, 102987. [Google Scholar] [CrossRef]
  25. Semin, M.A.; Levin, L.Y.; Zhelnin, M.S.; Plekhov, O.A. Natural Convection in Water-Saturated Rock Mass under Artificial Freezing. J. Min. Sci. 2020, 56, 297–308. [Google Scholar] [CrossRef]
  26. Shkuratnika, V.L.; Kravchenkoa, O.S.; Filimonovb, Y.L. Stresses and temperature affecting acoustic emission and rheological characteristics of rock salt. J. Min. Sci. 2019, 55, 531–537. [Google Scholar] [CrossRef]
  27. He, X.Q. Modern Statistical Analysis Methods and Applications; People’s University Publication House: Beijing, China, 2012. [Google Scholar]
  28. Ermolovich, E.A.; Ivannikov, A.L.; Khayrutdinov, M.M.; Kongar-Syuryun, C.B.; Tyulyaeva, Y.S. Creation of a Nanomodified Backfill Based on the Waste from Enrichment of Water-Soluble Ores. Materials 2022, 15, 3689. [Google Scholar] [CrossRef] [PubMed]
  29. Khayrutdinov, A.; Kongar-Syuryun, C.; Kowalik, T.; Faradzhov, V. Improvement of the backfilling characteristics by activation of halite enrichment waste for non-waste geotechnology. IOP Conf. Ser. Mater. Sci. Eng. 2020, 867, 012018. [Google Scholar] [CrossRef]
  30. Kongar-Syuryun, C.B.; Faradzhov, V.V.; Tyulyaeva, Y.S.; Khayrutdinov, A.M. Effect of activating treatment of halite flotation waste in backfill mixture preparation. Min. Inf. Anal. Bull. 2021, 2021, 43–57. [Google Scholar] [CrossRef]
  31. Jia, H.L.; Zi, F.; Yang, G.S.; Li, G.Y.; Shen, Y.J.; Sun, Q.; Yang, P.Y. Influence of pore water (ice) content on the strength and deformability of frozen argillaceous siltstone. Rock Mech. Rock Eng. 2020, 53, 967–974. [Google Scholar] [CrossRef]
  32. Jia, H.L.; Ding, S.; Wang, Y.; Zi, F.; Sun, Q.; Yang, G.S. An NMR-based investigation of pore water freezing process in sandstone. Cold Reg. Sci. Technol. 2019, 168, 102893. [Google Scholar] [CrossRef]
  33. Bai, Y.; Shan, R.L.; Ju, Y.; Wu, Y.X.; Sun, P.F.; Wang, Z.E. Study on the mechanical properties and damage constitutive model of frozen weakly cemented red sandstone. Cold Reg. Sci. Technol. 2020, 171, 102980. [Google Scholar] [CrossRef]
  34. Liu, S.; Yang, G.; Dong, X.; Shen, Y.; Liu, H. Mechanical characteristics of frozen sandstone under lateral unloading: An experimental study. Adv. Civ. Eng. 2021, 2021, 6653294. [Google Scholar] [CrossRef]
  35. Liu, S.; Yang, G.S.; Dong, X.H.; Shen, Y.J.; Liu, H. Energy characteristics and damage constitutive model of frozen sandstone under triaxial compression. J. Cold Reg. Eng. 2022, 36, 1–12. [Google Scholar] [CrossRef]
  36. Wang, C.; Zhang, K.; Zhao, Y.; Bi, J.; Ning, L.; Zhang, K. An adsorption model for cylindrical pore and its method to calculate pore size distribution of coal by combining NMR. Chem. Eng. J. 2022, 450, 138415. [Google Scholar] [CrossRef]
  37. Wang, C.; Zhao, Y.; Ning, L.; Bi, J. Permeability evolution of coal subjected to triaxial compression based on in-situ nuclear magnetic resonance. Int. J. Rock Mech. Min. 2022, 159, 105213. [Google Scholar] [CrossRef]
Figure 1. Sandstone sample.
Water 15 02297 g001
Figure 2. Servo-controlled low-temperature and high-pressure triaxial rock testing system.
Water 15 02297 g002
Figure 3. Stress path of the lateral unloading test.
Water 15 02297 g003
Figure 4. Curves of the AE amplitude, deviatoric stress and axial strain of the rock samples over time: (a) 20 °C, V u = 0.2 MPa/min; (b) −10 °C, V u = 0.2 MPa/min.
Water 15 02297 g004
Figure 5. Curves of the AEE and CAEE of the rock samples over time: (a) 20 °C, V u = 0.2 MPa/min; (b) −10 °C, V u = 0.2 MPa/min.
Water 15 02297 g005
Figure 6. Curves showing the changes in the parameters of the rock sample 5 s before and after the moment when the sample experiences lateral unloading failure: (a) 20 °C, V u = 0.2 MPa/min; (b) −10 °C, V u = 0.2 MPa/min.
Water 15 02297 g006
Figure 7. Curves of the AE amplitude, deviatoric stress and axial strain of the frozen rock samples with time: (a) V u = 0.04 MPa/min; (b) V u = 4 MPa/min.
Water 15 02297 g007
Figure 8. Curves of the AEE and CAEE of the frozen rock samples with time: (a) V u = 0.04 MPa/min; (b) V u = 4 MPa/min.
Water 15 02297 g008
Figure 9. Curves showing the changes in the parameters of the frozen rock samples 5 s before and after the moment of lateral unloading failure: (a) V u = 0.04 MPa/min; (b) V u = 4 MPa/min.
Water 15 02297 g009
Figure 10. Acoustic emission events location and failure modes of frozen sandstone samples under different lateral unloading rates.
Water 15 02297 g010
Figure 11. Key energy of frozen sandstone under different lateral unloading rates: (a) 20 °C, V u = 0.2 MPa/min; (b) −10 °C, V u = 0.04 MPa/min; (c) −10 °C, V u = 0.2 MPa/min; (d) −10 °C, V u = 4 MPa/min.
Water 15 02297 g011
Figure 12. The conceptual diagram of sandstone failure: (a) Initial State of the Rock Sample at 20 °C; (b) The State of the 20 °C Rock Sample at FP; (c) Destruction State of the 20 °C Rock Sample; (d) Initial State of the Frozen Rock Sample; (e) The State of Frozen Rock Sample at FP; (f) Destruction State of the Frozen Rock Sample.
Water 15 02297 g012
Table 1. Average physical parameters of the sandstone.
Dry Density
(g/cm3)
Saturation Density
(g/cm3)
Saturated Water Capacity
(%)
Porosity
(%)
Longitudinal-Wave Velocity
(m/s)
2.182.357.5816.562416
Table 2. Lateral unloading test plan.
Rock SampleTemperature T (°C)Initial Confining Pressure
σ 3 0   ( MPa )
Initial Axial Pressure
σ 1 0   ( MPa )
Unloading Rate
V u   ( MPa / min )
LUT-1-a
LUT-1-b
LUT-1-c
2020260.2
LUT-2-a
LUT-2-b
LUT-2-c
−1020500.04
LUT-3-a
LUT-3-b
LUT-3-c
500.2
LUT-4-a
LUT-4-b
LUT-4-c
504.0
Table 3. Coordinates of the four acoustic emission sensor positions (unit: mm).
NumberXYZ
1−25800
225800
3020−25
402025
Table 4. Characteristic values of the frozen sandstone under different lateral unloading rates.
V u  
(MPa/min)
σ p
(MPa)
Early Warning Point FPEmax
(V2·μs)
Moment of Failure
Time
(s)
σ 1 σ 3 ( MPa )
ε 1 ( % )
CAEE
(V2·μs)
Time
(s)
CAEE
(V2·μs)
0.0439.4213,12638.760.2686411,19914,52985,103
0.241.4283039.420.26666425,3223468184,250
449.2618442.430.18512,17163,255303258,593
Table 5. Results of picking the key AEE.
Temperature
T (°C)
Initial Confining Pressure
σ 3 0   ( MPa )
Unloading Rate
V u   ( MPa / min )
Picking Threshold
Q s   ( V 2 · μ s )
Energy before Picking
(Number)
Energy after Picking
(Number)
Percentage after Picking
(%)
20200.21418,3445172.81
−10200.041814,3162131.49
−10200.22217,2331280.74
−102042825,0561750.7
Disclaimer/Publisher’s Note: The statements, opinions and data contained in all publications are solely those of the individual author(s) and contributor(s) and not of MDPI and/or the editor(s). MDPI and/or the editor(s) disclaim responsibility for any injury to people or property resulting from any ideas, methods, instructions or products referred to in the content.

