
The Reduction of SARS-CoV-2 RNA Concentration in the Presence of Sewer Biofilms
by
 , , ,
, , ,
Shuxin Zhang
1,
Elipsha Sharma
1,
Ananda Tiwari
2 ,
,
Yan Chen
1,
Samendra P. Sherchan
3,4,
Shuhong Gao
5,
Xu Zhou
5,
Jiahua Shi
6 and
Guangming Jiang
1,6,* 1
School of Civil, Mining and Environmental Engineering, University of Wollongong, Wollongong 2520, Australia
2
Finnish Institute for Health and Welfare, 00271 Helsinki, Finland
3
Department of Environmental Health Sciences, Tulane University, New Orleans, LA 70118, USA
4
Bioenvironmental Science Program, Morgan State University, Baltimore, MD 21251, USA
5
State Key Laboratory of Urban Water Resource and Environment, School of Civil & Environmental Engineering, Harbin Institute of Technology, Shenzhen 518055, China
6
Illawarra Health and Medical Research Institute (IHMRI), University of Wollongong, Wollongong 2520, Australia
*
Author to whom correspondence should be addressed.
Water 2023, 15(11), 2132; https://doi.org/10.3390/w15112132
Submission received: 17 April 2023
/
Revised: 30 May 2023
/
Accepted: 1 June 2023
/
Published: 4 June 2023
(This article belongs to the Special Issue Pathogen Detection and Identification in Wastewater)
Abstract
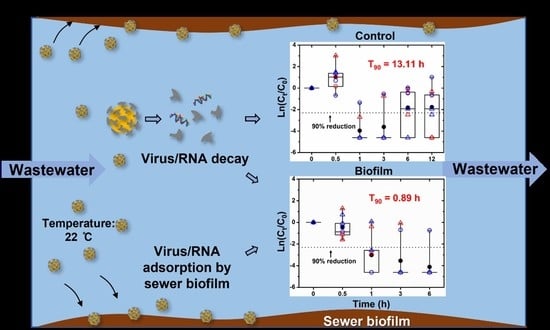
:Wastewater surveillance has been widely used to track the prevalence of SARS-CoV-2 in communities. Although some studies have investigated the decay of SARS-CoV-2 RNA in wastewater, understanding about its fate during wastewater transport in real sewers is still limited. This study aims to assess the impact of sewer biofilms on the dynamics of SARS-CoV-2 RNA concentration in naturally contaminated real wastewater (raw influent wastewater without extra SARS-CoV-2 virus/gene seeding) using a simulated laboratory-scale sewer system. The results indicated that, with the sewer biofilms, a 90% concentration reduction of the SARS-CoV-2 RNA was observed within 2 h both in wastewater of gravity (GS, gravity-driven sewers) and rising main (RM, pressurized sewers) sewer reactors. In contrast, the 90% reduction time was 8–26 h in control reactors without biofilms. The concentration reduction of SARS-CoV-2 RNA in wastewater was significantly more in the presence of sewer biofilms. In addition, an accumulation of c.a. 260 and 110 genome copies/cm2 of the SARS-CoV-2 E gene was observed in the sewer biofilm samples from RM and GS reactors within 12 h, respectively. These results confirmed that the in-sewer concentration reduction of SARS-CoV-2 RNA in wastewater was likely caused by the partition to sewer biofilms. The need to investigate the in-sewer dynamic of SARS-CoV-2 RNA, such as the variation of RNA concentration in influent wastewater caused by biofilm attachment and detachment, was highlighted by the significantly enhanced reduction rate of SARS-CoV-2 RNA in wastewater of sewer biofilm reactors and the accumulation of SARS-CoV-2 RNA in sewer biofilms. Further research should be conducted to investigate the in-sewer transportation of SARS-CoV-2 and their RNA and evaluate the role of sewer biofilms in leading to underestimates of COVID-19 prevalence in communities.
1. Introduction
Since the first COVID-19 outbreak in 2019, the RNA of severe acute respiratory syndrome coronavirus 2 (SARS-CoV-2) was detected in the wastewater of many countries. Wastewater-based epidemiology (WBE) for COVID-19 monitoring attracted unprecedented attention and has been employed worldwide [1,2,3,4]. Based on the SARS-CoV-2 wastewater surveillance data from around the world, several modelling and back-estimation studies were carried out to estimate COVID-19 case numbers in communities [5,6,7,8]. Data-driven black-box models were developed for COVID-19 prevalence calculation, due to unknowns like the transportation and decay of SARS-CoV-2 RNA in sewers [8,9,10,11,12].
The correction of SARS-CoV-2 RNA concentration in influent wastewater includes several aspects such as the evaluation of virus/RNA loss caused by the virus decay in wastewater and the potential virus attachment onto sewer biofilms during in-sewer transportation. Several previous studies reported that, at room temperature (20~25 °C), it takes above three days for one log decay of SARS-CoV-2 RNA concentration in untreated wastewater [13,14]. At 4 °C, the one log decay of SARS-CoV-2 RNA concentration is more than 27 days [13,15]. In comparison to the wastewater residence time (i.e., <10 h for 95% of wastewater treatment plants (WWTPs)) [16,17] and temperature (i.e., 75% of the world’s global wastewater were between 6.9–34.4 °C) [18] in sewers, the reported SARS-CoV-2 RNA persistence implies no need of significant correction for its decay in typical sewers for accurate WBE applications unless the sewer has long hydraulic retention time (HRT) or abnormal high temperature [19]. However, other factors that might induce RNA loss in the wastewater phase during the in-sewer transportation are unknown.
Based on the flow regimes, sewer systems could be divided into two main types, including the rising mains (RM) and the gravity (GS) sewers. Rising main pipes lift wastewater to higher elevations and run under anaerobic conditions because the pipes are full of wastewater. In contrast, gravity pipes transport wastewater to lower elevations by gravity and are partially filled with wastewater, thus containing both aerobic and anaerobic conditions [20]. Studies have confirmed that different sewer conditions affect the stability of various health and diet biomarkers, illicit drugs and pharmaceutical compounds [5,21,22,23,24,25]. Our recent study shows that the decay of infectivity of coronaviruses including feline infectious peritonitis virus (FIPV) and infectious human coronavirus 229E (HCoV-229E) was enhanced in sewer conditions as compared to wastewater [26]. In addition, another recent study reported that, during the 4-week study period of high COVID-19 prevalence in a community, an accumulation of ∼700 genome copies/cm2 was observed in simulated sewer biofilms [10]. Therefore, in comparison to the low decay rate of SARS-CoV-2 RNA in wastewater, the effect of sewer biofilms (and sediments when present in gravity sewers) might be a higher contributing factor for the reduction of SARS-CoV-2 RNA concentration in influent wastewater.
In this study, the in-sewer dynamics of SARS-CoV-2 RNA concentrations, including N and E genes, were investigated by evaluating the variation in both wastewater and biofilm samples in a laboratory-scale sewer reactor system comprising both rising main and gravity sewers. Intrinsically positive wastewater with SARS-CoV-2 RNA was used in batch tests. Sewer and control reactors, with and without biofilm, respectively, were employed to determine the role of partition of different sewer biofilms and the role of RNA decay itself in causing the reduction of RNA concentration during the in-sewer transportation. Concentrations of SARS-CoV-2 N and E genes were detected by the RT-qPCR method at different time points during a period of two pumping cycles (i.e., 12 h), which covers most in-sewer residence time of wastewater. Biofilm samples from the sewer reactors were also extracted to determine the attached SARS-CoV-2 during their normal operation. The results are expected to delineate the role of sewer biofilms in the reduction of SARS-CoV-2 RNA in wastewater.
2. Materials and Methods
2.1. SARS-CoV-2 RNA Positive Wastewater
Two influent wastewater samples from a local wastewater treatment plant (WWTP) in Wollongong, Australia, on 11 and 25 January 2022 were used in this study for batch tests. Both samples were confirmed as SARS-CoV-2 RNA positive by using China Center for Disease Control (CCDC) developed assay (CCDC-N RT-qPCR assay) and E-Sarbeco RT-qPCR assay (Table S1), as described previously [27]. These two untreated influent wastewater samples were used without SARS-CoV-2 RNA/virus seeding. The characteristics of the collected wastewater was provided in Table S2. The wastewater samples were stored at −80 °C (11 January 2022) or 4 °C (25 January 2022) until the experiments were conducted within a two-week period. According to other studies about the storage of SARS-CoV-2 RNA, the T90 of SARS-CoV-2 RNA decay in wastewater was around 28 to 52 days at 4 °C, and no decay was observed at −75 °C [15].
2.2. Laboratory-Scale Sewer System
A laboratory-scale sewer reactor system was adopted in this study (Figure 1) to simulate the real sewer system. This system was composed by connecting two types of reactors: two rising main (RM) reactors and two gravity sewer (GS) reactors, both having a diameter of 80 mm and a water height of 150 mm. All reactors were made of Perspex™ because of the good chemical stability to act as the substratum for biofilm development. These sewer reactors have been reported to represent typical sewer conditions by many previous studies [23,28,29]. The characteristics of the reactors were also described in our previous study [26]. The microbial community and abundance characterization were also reported in our previous publications [30].
Briefly, the sewer reactor system was fed with raw wastewater (collected from a local WWTP in Wollongong, Australia) for biofilm cultivation in 2020. 90 L of domestic wastewater was collected fortnightly and was stored at 4 °C. The wastewater was pumped by using a peristaltic pump (Masterflex L/S) every 6 h (a typical wastewater hydraulic retention time (HRT) and was pumped through heating coils in a water bath to warm the wastewater to room temperature (22 °C). Each feed pumping event lasted 2 min to provide one reactor working volume wastewater (0.75 L) into each reactor. The overall biofilm area of each reactor, including the carrier surface and reactor wall, is around 0.05 m2. Hence, the biofilm area to wastewater volume ratio (A/V) was around 70.9 m2/m3. A magnetic stirrer (MLS8, VELP Scientific, Italy) was used to continuously provide mixing (250 rpm) to generate a moderate shear force, calculated as 1.7 Pa, on the inner surface of the reactor wall and to avoid the settling of solids at the bottom. To confirm that the reactors reached their semi-steady states, batch tests were conducted to determine biofilm activity including the sulfate reduction rate and chemical oxygen demand (COD) reduction rate in the RM and GS reactors [5,26,29,31,32]. The characteristics were listed in Table S3. During the 6 h pumping circle, the pH of wastewater was stable in both RM and GS sewer reactors and was between 6.8–7.2. The sulfate concentration decreased from 27 mg/L to 14 mg/L within two hours in RM. While in the GS reactor, no obvious decrease was observed. The dissolved oxygen (DO) was around 0.65 mg/L in the GS reactor. The RM reactor was filled with wastewater, so the DO in the RM reactor should be zero. The soluble chemical oxygen demand (COD) of the RM reactor reduced from 116 to 84 mg/L and was varied between 60–110 mg/L in the GS reactor. These data are within the normal range test by our previous study [5].
2.3. Sewer Reactor Tests and Sampling Schemes
Four reactors, including the first RM and GS sewer reactors (RM-1st and GS-1st) in the lab-scale sewer system, and two control reactors (RMC and GSC), were used in the batch tests. The control reactors are plain reactors that have the same structure of each type of biofilm reactors. The control reactors were not fed with wastewater to grow biofilm before the batch tests. For each batch test, wastewater was pumped continuously into the sewer system for 5 min. At the same time, a volume of 0.75 L wastewater was added to the RMC and GSC control reactors for parallel blank tests. The temperature of the wastewater was adjusted to around 22 °C. The experimental schema was shown in Figure S1. Briefly, a volume of 50 mL wastewater was sampled from RM-1st, GS-1st, RMC and GSC reactors at time points of 0 h, 0.5 h, 1 h, 3 h and 6 h. After the 6 h sampling, the sewer reactors were fed for 2 min as per the normal operation. Then, a volume of 50 mL wastewater was collected from the RMC and GSC reactors at 12 h. In addition, sewer biofilms (one biocarrier at each time) were sampled from the first RM and GS sewer reactors (RM-1st and GS-1st) at 0 h and 12 h, and the second RM and GS sewer reactors (RM-2nd and GS-2nd) at 12 h. The total surface area of one biocarrier was around 3.17 cm2. One biocarrier with attached biofilms was extracted from the sewer reactors for analysis as described below. The above sewer reactor experiment was conducted in duplicate. Test 2 is a technical repeat of Test 1 and was started from the same timepoint (8:30 am) as Test 1 on the next day of Test 1 (Figure S1). All samples were immediately stored at −80 °C after sampling until further analysis.
2.4. Sample Processing and RNA Extraction
In previous studies, an adsorption-extraction method (no need for pH adjustment or addition of MgCl2) that utilized an electronegative membrane was found to be effective in recovering a human coronavirus surrogate, murine hepatitis virus (MHV), with a recovery rate of 60.5 ± 22.2% [33]. Therefore, this method was adopted in this study to recover SARS-CoV-2 RNA from both wastewater and bio-carrier samples [33]. A volume of 50 mL wastewater was filtered through electronegative membranes with a 0.45 μm pore size and 90 mm diameter (HAWP09000; Merck Millipore Ltd., Sydney, Australia). The filter paper was then folded and transferred to a 5 mL bead tube of the RNeasy PowerWater Kit (Qiagen, Hilden, Germany). For the biofilm samples (biocarriers), each of the plastic biocarrier was soaked and brushed in 50 mL of 4 °C phosphate-buffered saline (PBS, pH 7.4) and vortexed for 5 min to detach the biofilm. (Plastic biocarrier was used because of its high stability, and the mature biofilm on the surface of plastic material could be easily sampled.) The 50 mL wash solution was also filtered with electronegative membranes. The filter paper and the biocarrier were then transferred to a 5 mL bead tube together. All the following extraction procedure was carried out according to the instructions of the RNeasy PowerWater Kit. The final extracted RNA volume of the 50 mL wastewater or biofilm sample was 50 μL.
2.5. RT-qPCR Assay
The CCDC-N and E-Sarbeco primer-probe sets were adopted according to our previous comparative study on the analytical performance towards wastewater samples [27]. The information on primer-probe sets used in this study and the RT-qPCR conditions were listed in Table S1 in the supplementary material. RT-qPCR assay targeting the N gene was conducted by using a CCDC-N primer-probe set under the conditions [34]. The copy number of the N gene was calculated based on the spiked mocks calibration generated by using 10-fold serial dilutions of a known concentration of 2019-nCoV_N Positive Control (Catalogue No. 10006625) [27].
RT-qPCR assay targeting the E gene was conducted by using an E-Sarbeco primer-probe set under the conditions listed in Table S1 [35]. A standard curve of the E-Sarbeco assay was generated by using 10-fold serial dilutions of a known concentration of 2019-nCoV_E Positive Control (Catalogue No. 10006896). Characteristics of the standard curves including the efficiency, the linearity (coefficient of determination, R2), slope and Y-intercept were listed in Table 1.
All RT-qPCR reactions were conducted in duplicate. For each RT-qPCR run, a series of positive and no template controls were tested to eliminate the false positive and false negative results induced by potential contamination. The RT-qPCR assays were carried out by using the Bio-Rad CFX96 thermal cycler (Bio-Rad Laboratories). The thermocycler conditions were set as reverse transcription at 50 °C for 10 min and initial denaturation at 95 °C for 3 min, followed by 45 cycles of 15 s at 95 °C and 30 s at 58 °C. Data were collected only from the operation of the instrument when the positive control was positive, and the non-template control was negative.
2.6. Data Analysis
The experimental data of duplicate batch tests were integrated to generate a combined decay constant. The relationship between the SARS-CoV-2 RNA concentration in control or sewer reactors and time was, respectively, evaluated by adopting monophasic and biphasic first-order decay kinetics in this study due to its wide suitability for analyzing the viral RNA decay in wastewater [13,15,26]. Hence, the concentration variation of SARS-CoV-2 RNA was linearized by using the natural log (ln)-transformation of the calculated RNA concentration of each sampling time point as shown in Equation (1), where Ct and C0 are the concentrations (based on gene copies/50 mL) of SARS-CoV-2 N or E gene copies at time t and time 0, respectively. k is the reduction rate constant. The monophasic first-order decay rate constant with the associated 95% confident interval (CI) was estimated by using GraphPad Prism Version 9.0.0 (GraphPad Software, La Jolla, CA, USA). The fit was assessed by the coefficient of determination (R2) and root mean square error (RMSE). The time required to achieve 90% (T90) reduction of the viral RNA based on the monophasic first-order decay kinetics was further calculated using k values according to Equation (2).
3. Results
3.1. Reduction of SARS-CoV-2 RNA in Wastewater
The initial SARS-CoV-2 RNA concentration of the wastewater used in this study was between 104–105 gene copies/L (2.1 × 10⁴ and 4.2 × 10⁴ gene copies/L of the N gene; 3.6 × 10⁴ and 2.3 × 10⁵ gene copies/L of E gene, respectively), which was high enough for RNA decay/decrease batch test. In addition, the RNA extraction method adopted in this study was confirmed to have an RT-qPCR-based recovery of 60.5 ± 22.2% for murine hepatitis virus (MHV), a surrogate for SARS-CoV-2 [33]. The matrix spike recoveries of N (CCDC-N) and E (E-Sarbeco) genes were 3.63 ± 1.8% and 41.2 ± 18.7%, respectively, which might be due to the detection limit and efficiency of the different RT-qPCR assay [36]. The 50% detection of CCDC-N and E-Sarbeco assay against the wastewater sample is around 3 to 4 log/L [36]. It indicates that the negative samples tested during the reduction evaluation theoretically had up to about 2 log reduction/L. Thus, we regarded the value of all negative results as −4.61 (ln (0.01)) in all the following figures.
The variation of SARS-CoV-2 N and E gene concentrations (mean ± SD) in gravity (GS) and rising main (RM) control and sewer reactors (RM) was shown in Figure S2, respectively. Significant variations of the RNA concentrations were observed, although different reduction trends were generally observed between control and biofilm reactors. Considering the limited positive data obtained in each scenario (we used raw wastewater without spiking), data acquired for N and E genes in the RM and GS reactors were combined to compare the SARS-CoV-2 RNA concentration reduction in the presence and absence of biofilms. As shown in Figure 2A, 6/8 tests of both the 6 h and 12 h wastewater samples collected from the control reactors were positive, and 5/6 positive tests were above the 90% reduction line. This reveals limited decay of SARS-CoV-2 RNA in wastewater within 12 h. It is worth noticing that in the 1 h and 3 h samples of control reactors, only 2 out of the total 8 tests were positive which is abnormal compared to the high RNA concentration and high positive test numbers (6/8 positive) in the 6 h and 12 h samples. Although it seems that no differences between control and biofilm reactors appeared in the 3 h sample, the trend between 1 h to 6 h in control and biofilm reactors was the opposite. Thus, we infer these negative results might be induced by the low initial concentration and the varied RNA recovery of each extraction. Considering the high positive rates and concentrations of the 6 and 12 h samples, these negative results were thus excluded from further data analysis. In addition, there is an abnormal increase between the results of the 0 h and 0.5 h samples. Most of the increased concentrations were obtained by E gene assay (empty triangle). A similar increase was also observed by Hokajarvi et al. [15] for the persistence of the SARS-CoV-2 RNA in wastewater influent at different temperatures. This abnormal increase might be due to the larger variation of the E gene recovery caused by the low sensitivity of the E gene targeting RT-qPCR assay [36]. Meanwhile, a smaller abnormal increase of the N gene than the E gene was observed, which was consistent with the smaller recovery variation of the N gene (SD = 1.8%) than the E gene (SD = 18.7%) [36]. This behavior was also observed in biofilm reactors but was not as high as in control reactors. The RNA desorption from sewer biofilms occurred due to the disturbance of feeding wastewater to the sewer reactors. The biofilm sloughing, together with attached viral RNA on biofilms, might have reduced the initial variations.
In comparison to the low decay in wastewater in control reactors, a significant concentration reduction of SARS-CoV-2 RNA was observed in the wastewater phase of sewer reactors. There are only 4/8, 2/8 and 1/8 tests of the 1, 3 and 6 h samples, respectively, were positive (Figure 2B). In addition, in the sewer biofilm reactor, the decrease in RNA concentration in the wastewater phase was consistent with the decrease in the positive test numbers. The overall results, including the positive ratio and the reduction of concentrations, indicated that the concentration reduction of SARS-CoV-2 RNA in the wastewater phase was enhanced with the sewer biofilms.
3.2. In-Sewer Reduction Kinetics Analysis of SARS-CoV-2 RNA in the Wastewater Phase of Sewer Reactors
To further analyze the effect of sewer biofilm on the reduction of SARS-CoV-2 RNA concentration in wastewater, we combined the results of the N and E genes to compare the difference between the RM and GS reactors. We also combined the results of the RM and GS reactors to compare the difference between the SARS-CoV-2 N and E genes. Monophasic and biphasic first-order decay kinetics were adopted to generate the reduction rate k (h−1) and the T90 values (h) of SARS-CoV-2 RNA in different types of sewer reactors. The results of the kinetics analysis were provided in Table 2 and Figure S3.
All T90 values from the biofilm reactor were less than or equal to 2 h, while all T90 values from the control reactor were between 8 to 27 h. The total T90 was reduced from 13.11 h in the control reactor to 0.89 h in the biofilm reactor. T90 values of the RM and GS reactors were reduced from 10.07 h and 18.77 h in the control reactor to 0.84 h and 0.95 h in the biofilm reactor, respectively. T90 values of the SARS-CoV-2 N and E genes were reduced from 26.19 h and 8.74 h in the control reactor to 0.59 h and 2.0 h in the biofilm reactor, respectively. The k values of the control reactor were between 0.09 to 0.26 h−1 and the total k value was 0.18 h−1. For the biofilm reactor, the k1 values were between 1.15 to 3.93 h−1 and the total k1 value was 2.58 h−1, which was around 14.3 times that of the control reactor. The k2 values of the biofilm reactors were between 0.004 to 0.38 h−1 which were very similar to the k value range of the control reactors. In addition, all the valid transiting time point t1 values of the biofilm reactors were less than or equal to 1.5 h.
3.3. Accumulation of SARS-CoV-2 RNA in Sewer Biofilms
SARS-CoV-2 RNA concentration in sewer biofilms of the RM and GS reactors was evaluated by targeting both the N gene and E gene. The results of gene copies per cm2 of biofilm surface area were shown in Table 3. SARS-COV-2 N gene was detected in 5 out of 10 biofilm samples, and the average concentration of the positive RM and GS biofilm sample was 258.4 ± 72.7 GC/cm2 (4 positive samples, mean ± SD (standard deviation)) and 487 GC/cm2 (1 positive sample), respectively. SARS-COV-2 E gene was detected in 8 of 10 biofilm samples, and the average concentration of positive RM and GS biofilm was 704.7 ± 155.7 GC/cm2 (3 positive samples) and 1828.7 ± 1180.6 GC/cm2 (5 positive samples), respectively. In addition, during the 12 h of the second test, an accumulation of 260.9 GC/cm2 (from 654.5 GC/cm2 to 915.4 GC/cm2) and 113.7 GC/cm2 (from 935.9 GC/cm2 to 1049.6 GC/cm2) of the SARS-COV-2 E gene was observed in the RM-1st and GS-1st sewer biofilm reactor, respectively. For the N gene, an accumulation of 365.5 GC/cm2 was observed in the RM-1st sewer reactor. However, no N gene accumulation was observed in the GS-1st sewer reactor.
Assuming that the wastewater is in perfect plug flow in sewer reactors and since the duplicate tests were conducted on two consecutive days and started at the same time of the day, thus, the 0 h sample of the second test could be regarded as the 24 h sample of the first test, and the 12 h sample of the second test could be regarded as the 36 h sample of the first test. Based on this timeline, the variation of the E and N gene concentration in biofilm samples during 36 h was shown in Figure S4. The results indicated that, in biofilm samples, the concentration of the SARS-CoV-2 E gene was increasing in both the RM-1st (from ND to 654.5 GC/cm2 to 915.4 GC/cm2) and the GS-1st (from 686.1 GC/cm2 to 935.9 GC/cm2 to 1049.6 GC/cm2) sewer reactors during two batch tests. The concentration of the SARS-CoV-2 N gene was increasing in the biofilm of the RM-1st (from 196.1 GC/cm2 to ND to 365.5 GC/cm2) reactor. However, no SARS-COV-2 N gene was detected in the biofilm samples of the GS-1st reactor over 36 h. In addition, an increase in gene concentration was also observed in the biofilm of the RM-2nd (from ND to 544.1 GC/cm2) and the GS-2nd (from ND to 487 GC/cm2) reactors by targeting the E gene and N gene, respectively. However, in cases of results of the RM-2nd biofilm targeting the N gene and the GS-2nd biofilm targeting the E gene, a concentration decline was observed.
Collectively speaking, the SARS-CoV-2 RNA accumulation was observed in both the RM-1st and GS-1st sewer biofilm reactors during two consecutive days of sampling, suggesting that the concentration reduction of RNA in wastewater may be caused by not only the RNA decay in wastewater, but also more so by the RNA attachment on sewer biofilms.
4. Discussion
The above results support a higher reduction of SARS-CoV-2 RNA in sewer reactors, possibly due to biofilms, suggesting that the adsorption of viral particles in sewer pipes may be an important factor affecting the amount of virus in sewage influent. The possible biofilm formation in distribution pipes can enhance such virus adsorption and the age of networks can determine possible biofilm formation in sewage distribution networks. This study evaluated the fate or reduction of SARS-CoV-2 RNA in wastewater and the adsorption by sewer biofilms at the same time in a simulated sewer reactor system. A previous study reported an accumulation of ~700 genome copies/cm2 SARS-CoV-2 RNA on the sewer biofilm of a simulated annular biofilm reactor during a 4-week operation with high COVID-19 incidence in the community [10]. The biofilm was formed over the 4-week operation and, subsequently, sampled for viral RNA detection. However, sewer biofilm samples from a university campus were reported to be negative. In this study, we evaluated the SARS-CoV-2 RNA adsorption by mature sewer biofilms which were cultivated over two years in a simulated sewer reactor system. The accumulation of 260.9 GC/cm2 and 113.7 GC/cm2 of SARS-COV-2 E gene on the first RM and GS sewer biofilms in 12 h confirmed the RNA adsorption by biofilm and revealed the importance of sewer biofilms for reducing the concentration of SARS-CoV-2 RNA in influent wastewater. A few earlier studies compared the temperature effects on the decay of SARS-CoV-2 RNA in various types of water and wastewater. The information on the testing conditions, temperature (T), k value, R2 and T90 was listed and compared in Table 4.
Ahmed et al. investigated the decay of SARS-CoV-2 RNA and murine hepatitis virus (MHV) RNA in untreated wastewater at different temperatures [13]. This study determined T90 values at 4 °C, 15 °C, 25 °C and 37 °C as 27.8 ± 4.45, 20.4 ± 2.13, 12.6 ± 0.59 and 8.04 ± 0.23 days, respectively, by using a CCDC-N1 RT-qPCR assay. In cases of MHV, the T90 values at 4 °C, 15 °C, 25 °C and 37 °C as 56.6 ± 14.2, 28.5 ± 4.43, 17.3 ± 2.46 and 7.44 ± 0.61 days, respectively. The T90 value demonstrated a declining trend with the rise in experimental temperature. The less sensitivity to temperatures than murine hepatitis virus (MHV) RNA in untreated wastewater indicated that SARS-CoV-2 RNA is likely to persist long enough in untreated wastewater during in-sewer transportation. Hokajarvi’s study [15] also evaluated the stability of SARS-CoV-2 RNA in influent wastewater at 4 °C by targeting both the N and E genes. The T90 values of the two gene biomarkers were similar and were comparable to Ahmed’s study at 4 °C. However, the T90 value of Bivins’s study by targeting the SARS-CoV-2 E gene at 20 °C was 3.3 days and 26 days at high titer (105 TCID50 /mL) and low titer (103 TCID50 /mL), respectively [14]. These values were inconsistent with the T90 value (12.6 ± 0.59 days) in Ahmed’s study at 25 °C with an initial SARS-CoV-2 E gene concentration of 107.03 ± 0.19/mL. Caution should be exerted when comparing RNA decay rates, which may be largely affected by the initial concentration and type of SARS-CoV-2 RNA biomarkers at room temperature. In addition to the decay of the SARS-CoV-2 virus, many previous studies have investigated the persistence or decay of other enveloped viruses/bacteriophage. According to the results of Silverman and Boehm’s literature review based on 46 and 27 identified decay rate constants of animal coronaviruses and the enveloped bacteriophage Phi6, the average k value of these two types of surrogate was 1.78 ± 0.12 d−1 and 7.59 d−1 in raw wastewater at 22−25 °C, respectively [37]. These results are closer to the k values of the control reactor in our study (Table 4). They also found that the k values obtained in wastewater were substantially higher than those in freshwater but not statistically different from those observed in estuarine and marine natural waters, and the k value measured using molecular methods were less than those measured by culture methods which cannot directly indicate virus viability [38]. These findings highlighted the effect of the water matrix and the detection methods on the evaluation of enveloped virus decay. In conclusion, previous studies demonstrated that, at room temperature, 90% of the SARS-CoV-2 N gene decayed within 13 days in wastewater, and 90% of the SARS-CoV-2 E gene decayed within 3–26 days, majorly affected by sewage temperature and the targeted assay gene.

Table 4.
Comparison of SARS-CoV-2 RNA persistence in wastewater of different studies.
| RT-qPCR Assay | Initial Concentration | Virus Types | Testing Method | T (°C) | k (Mean ± SD) [95% CI] (d−1) | R2 | T90 (d) | Reference |
|---|---|---|---|---|---|---|---|---|
| CDC-N1 | 107.03 ± 0.19 GC/mL | Gamma-irradiated SARS-CoV-2 | 4.99 mL of wastewater and 5 mL of gamma-irradiated SARS-CoV-2 were mixed in 15 mL sterile conical tubes. 140 μL aliquot was sampled from each tube at each sampling time point for extraction and RT-qPCR analysis. | 4 | 0.084 ± 0.013 [0.103 to 0.064] | 0.79 | 27.8 ± 4.45 [22.4 to 50.1] | [13] |
| 15 | 0.114 ± 0.012 [0.144 to 0.083] | 0.71 | 20.4 ± 2.13 [16.0 to 27.7] | |||||
| 25 | 0.183 ± 0.008 [0.219 to 0.149] | 0.87 | 12.6 ± 0.59 [10.5 to 15.5] | |||||
| 37 | 0.286 ± 0.008 [0.370 to 0.202] | 0.74 | 8.04 ± 0.23 [6.22 to 11.4] | |||||
| E-Sarbeco | 105.4 GC/mL | 1:1000 dilution of SARS-CoV-2 inoculum | Spiked wastewater influent was packed separately into 57 microcentrifuge tubes in portions of 300 μL. Triplicate tubes were stored in the dark and extracted for RT-qPCR analysis. | 4 | 0.04 ± 0.2 | 0.59 | 52 | [15] |
| CDC-N2 | 106.1 GC/mL | 0.06 ± 0.0 | 0.99 | 36 | ||||
| E-Sarbeco | High titer (105 TCID50/mL) | SARS-CoV-2 nCoV WA1-2020 (MN985325.1), isolated from a clinical patient | SARS-CoV-2 nCoV-WA1-2020 (MN985325.1) was diluted 1:10 to wastewater. 1 mL aliquots were pipetted into 2 mL screw-top vials with 3 replicates for each time point. | 20 | 0.67 [0.54 to 0.86] | 0.27 | 3.3 [2.7 to 4.3] | |
| Low titer (103 TCID50/mL) | 0.09 [0.00 * to 0.23] | −0.01 | 26 [9.8 to ∞] | |||||
| CDC-N1/N2 | 135–953 GC/mL | SARS-CoV-2 RNA positive wastewater samples without seeding | 4 | 2.16 | - | - | [39] | |
| 10 | 0.96 | - | - | |||||
| 35 | 4.31 | - | - | |||||
| CDC-N | 20.9–41.8 GC/mL | SARS-CoV-2 RNA positive wastewater samples without seeding | 50 mL of wastewater was sampled from each reactor at each time point for RNA extraction and RT-qPCR analysis. | 22 | Control: 2.1 [0.49 to 3.73] | 0.81 | 1.1 [0.00 * to 4.73] | This study |
| Biofilm k1: 94.32 [66.72 to 132.96] Biofilm k2: 1.68 [0.00 * to 7.2] | 0.66 | 0.03 [0.02 to 0.04] | ||||||
| E-Sarbeco | 36.4–230 GC/mL | Control: 6.32 [0.00 * to 15.35] | 0.53 | 0.36 [0.18 to 0.69] | ||||
| Biofilm:27.6 [17.52 to 56.4] | 0.7 | 0.08 [0.06 to 0.25] |
Note(s): * 95% CI truncated at 0 in the case of negative values for k and T90.
In our study, the estimated T90 value was 1.1 day in the control reactor (wastewater only) by targeting the N gene, and was 0.36 day by targeting the E gene, which was shorter than most of the previous studies. However, previous studies usually use wastewater spiked with high SARS-CoV-2 concentration, and the total volume of testing systems was under 5 mL. In addition, the sampled wastewater at different time points was usually at microliter level. These are quite different from the initial RNA concentration and testing conditions used in our study, which may explain the difference between T90 values in our study and those in previous reports. In our study, intrinsic SARS-CoV-2 RNA positive wastewater without seeding any type of biomarkers was used, thus the initial concentration was around 1–5 log lower than in previous studies. Furthermore, the total wastewater volume in the lab-scale sewer reactors was 0.75 L, and 50 mL wastewater was sampled at each time point for filtration and RNA extraction. This workflow was consistent with the normal sampling and processing producers for detecting SARS-CoV-2 RNA in wastewater. Weidhaas et al. used a similar large volume of raw wastewater (without seeding) to conduct the decay test, the k value of N gene decay was 2.16 d−1, 0.96 d−1 and 4.31 d−1 at 4°C, 10°C and 35°C, respectively. These results were consistent with the k value of (2.1 d−1 at 22 °C) N gene decay in the control reactors acquired in our study [39].
Fu et al. [11] recently investigated the decay of avian infectious bronchitis virus (IBV) in sewage pipes. The D90 (distance required for one log reduction) value of this study was 12.51 km and 8.34 km at 12 °C for the non-biofilm and mature biofilm pipelines, and 8.32 km and 4.54 km at 28 °C, respectively, by assuming the flow rate of wastewater at 0.4 km/h. This study reported the enhanced reduction of viral RNA in wastewater in the presence of sewer biofilm which was cultured for 45 days. In our study, the biofilm of the simulated sewer system had been cultivated for more than two years. In addition, Ahmed et al. [40] reported that a sewer pipe length of over 400 m can produce a SARS-CoV-2 RNA decline in the sewer network. Through the quantification of SARS-CoV-2 RNA for wastewater influent and primary settled solids samples, Graham demonstrated that measuring SARS-CoV-2 RNA concentrations in settled solids is more sensitive than measuring SARS-CoV-2 in influent [41]. In another study about Campylobacter spp., the overall reduction followed a biphasic first-order decay model, and the faster reduction rate in the first phase was due to the adsorption of C. jejuni and C. coli onto biofilm [42]. The sensitivity analysis revealed that the reduction leads to significant differences in WBE back-estimation of Campylobacter spp. prevalence, especially for sewer catchments with long hydraulic retention times. All the above studies showed that the virus/RNA attachment on biofilms and solid fractions in wastewater warranted a correction for the WBE applications.
In this study, the 95% CI of reduction parameters is high, with low R2 and high RSME, which might be difficult to fully interpret the impact of biofilm on the reduction of SARS-CoV-2 in the reactors. However, the 95% CI of the estimated trend lines of the control and biofilm reactors do not overlap with each other in most scenarios (Figure S3). This reflects the different reduction trends of SARS-CoV-2 RNA due to the presence of biofilms. At the 6-h time point, all four samples from the control reactor tested positive for SARS-CoV-2 RNA (Figure 2). In contrast, in the biofilm reactor, only one sample from the GS reactor was detected as positive for the N gene. The results indicate that attachment to sewer biofilms facilitated the reduction of SARS-CoV-2 RNA concentration in the wastewater phase. This is further confirmed by the detection of SARS-CoV-2 RNA accumulation in sewer biofilms over 36 h. The increase of RNA concentration in biofilm samples, measured by the N or E genes, was consistent with the reduction of RNA concentration in wastewater samples in both the RM and GS sewer reactors. The detection of SARS-CoV-2 RNA in wastewater is challenging due to the complex matrix, which contains various components that can affect the performance of RT-qPCR methods differently. In this study, a higher concentration of the E gene was observed in both wastewater and biofilm samples. This result may be attributed to the higher recovery of the E gene compared to the N gene and the variable detection efficiency of RT-qPCR assays for wastewater samples [36]. Similar findings have been reported in previous studies that targeted the N and E genes for SARS-CoV-2 RNA detection [27,36,43,44]. Moreover, we demonstrated that, during in-sewer transportation, the attachment of SARS-CoV-2 virus/RNA on sewer biofilm (the reduction observed in wastewater of sewer biofilm reactors) might be more significant than the virus/RNA decay itself (the reduction observed in the control reactors). According to the results of this study towards the in-sewer decay of Campylobacter spp. [42], we supposed that the variation of SARS-CoV-2 RNA concentration of wastewater in sewer reactors was a result of the combined effects of RNA decay, biofilm adsorption, desorption and biofilm sloughing (especially at the beginning of the batch tests due to strong disturbances by feeding wastewater). In Table 2, all the valid T90 values (RM, GS and N gene) of the biofilm reactor were shorter than the t1 value (transiting time point t1). After t1, the k2 value of biofilm reactors were close to the k value of the control reactor. Based on the author’s suppose, this behavior revealed that after t1, there might be a balance between the RNA adsorption and desorption on sewer biofilm and biofilm sloughing. After achieving this balance, the reduction of RNA concentration in wastewater in the sewer reactor will mainly be due to RNA decay, just like that in the control reactor.
Overall, the results showed both RM and GS sewer biofilms can induce SARS-CoV-2 RNA attachment within typical wastewater residence time in sewers. Furthermore, considering the lower decay of SARS-CoV-2 RNA in wastewater, identified in this study, and reported by previous studies, the RNA loss caused by sewer biofilm attachment is more significant than RNA decay itself. However, several methodological limitations should be noticed. The sewer reactor used in this study has a limited total wastewater volume (0.75 L), which could not support multiple samples (50 mL each) at each time point. The biofilm samples were only collected at 0 h and 12 h, which were insufficient to detect the dynamic concentration changes in sewer biofilm.
The initial RNA concentration in non-spiked, intrinsic SARS-CoV-2 positive wastewater was low. This makes it difficult to obtain enough data points to support comprehensive kinetic analysis. In addition, although studies have confirmed that different sewer conditions could result in the different stability of various drugs and chemicals in wastewater, no significant difference in the SARS-CoV-2 RNA reduction was observed between the RM and GS sewer reactors in this study. This might be due to the low initial SARS-CoV-2 RNA concentration of the wastewater used in this study. Further studies should be conducted under various conditions, such as various initial SARS-CoV-2 RNA concentrations and temperatures. Moreover, the potential detachment of SARS-CoV-2 RNA from sewer biofilms should be studied to delineate the full picture of in-sewer dynamics. Other factors such as the higher concentration of RNase (ribonucleases) and other enzymes in wastewater and different biofilms and the different characteristics of biofilms with diverse characteristics of extracellular polymeric substance (EPS) and microbial community under different sewer conditions are worth investigating to analyze the partition of viral RNA into the sewer biofilms. Concentration variance caused by the SARS-CoV-2 mutants should also be considered in future in-sewer decay investigations.
5. Conclusions
This study investigated the impacts of different sewer biofilms on the reduction of SARS-CoV-2 RNA concentration in intrinsically positive wastewater in laboratory-scale sewer reactors. The SARS-CoV-2 RNA concentration in wastewater and biofilms was determined to delineate the fate of viral RNA during in-sewer transportation.
The concentration reduction of SARS-CoV-2 RNA in the wastewater phase was significantly higher in sewer biofilms and a 90% reduction of RNA concentration in wastewater was achieved within 2 h in both rising main and gravity sewer biofilm reactors. Therefore, biofilm grown in sewer networks can affect the fate of SARS-Co-2 during in-sewer transportation.
Accumulation of SARS-CoV-2 RNA in the biofilm of sewer reactors was observed for up to 36 h, which was consistent with the increased RNA reduction in wastewater. Therefore, the adsorption of virus RNA/particles in sewer biofilms is a non-negligible mechanism for the fate of SARS-Co-2 in sewer systems.
The concentration reduction of SARS-CoV-2 RNA in wastewater during in-sewer transportation may be more induced by the biofilm attachment rather than the RNA decay itself under the tested conditions.
Supplementary Materials
The following supporting information can be downloaded at: https://www.mdpi.com/article/10.3390/w15112132/s1, Figure S1: Experimental procedures of duplicate batch tests; Figure S2: Variation of SARS-CoV-2 E and N gene concentration (mean ± SD) in gravity (GS) and rising main (RM) control and sewer reactors, respectively; Figure S3: The in-sewer reduction kinetics of SARS-CoV-2 RNA (N and E gene) in different sewer reactors (RM and GS) with and without biofilms; Figure S4: Short-term SARS-CoV-2 RNA accumulation observed in biofilm reactors during duplicate sampling days. Table S1: RT-qPCR primer-probe sets used in this study [34,35]; Table S2: Characteristics of the influent wastewater used as the feed for the sewer reactors; Table S3: Characteristics of wastewater in sewer reactors over a cycle of 6 h.
Author Contributions
Conceptualization, S.Z. and G.J.; methodology, S.Z.; formal analysis, S.Z.; investigation, S.Z.; data curation, S.Z.; writing—original draft preparation, S.Z.; writing—review and editing, S.Z., E.S., A.T., Y.C., S.P.S., S.G., X.Z., J.S. and G.J.; visualization, S.Z.; supervision, G.J.; funding acquisition, G.J. All authors have read and agreed to the published version of the manuscript.
Funding
This research was supported by the ARC Discovery project (DP190100385). Shuxin Zhang and Elipsha Sharma received support from a University of Wollongong scholarship. NIH grant R21AI157434 to Samendra Sherchan.
Conflicts of Interest
The authors declare no conflict of interest.
References
- Peccia, J.; Zulli, A.; Brackney, D.E.; Grubaugh, N.D.; Kaplan, E.H.; Casanovas-Massana, A.; Ko, A.I.; Malik, A.A.; Wang, D.; Wang, M.; et al. Measurement of SARS-CoV-2 RNA in wastewater tracks community infection dynamics. Nat. Biotechnol. 2020, 38, 1164–1167. [Google Scholar] [CrossRef] [PubMed]
- Galani, A.; Aalizadeh, R.; Kostakis, M.; Markou, A.; Alygizakis, N.; Lytras, T.; Adamopoulos, P.G.; Peccia, J.; Thompson, D.C.; Kontou, A.; et al. SARS-CoV-2 wastewater surveillance data can predict hospitalizations and ICU admissions. Sci. Total Environ. 2022, 804, 150151. [Google Scholar] [CrossRef] [PubMed]
- Tiwari, A.; Lipponen, A.; Hokajärvi, A.-M.; Luomala, O.; Sarekoski, A.; Rytkönen, A.; Österlund, P.; Al-Hello, H.; Juutinen, A.; Miettinen, I.T.; et al. Detection and quantification of SARS-CoV-2 RNA in wastewater influent in relation to reported COVID-19 incidence in Finland. Water Res. 2022, 215, 118220. [Google Scholar] [CrossRef] [PubMed]
- Sherchan, S.P.; Shahin, S.; Ward, L.M.; Tandukar, S.; Aw, T.G.; Schmitz, B.; Ahmed, W.; Kitajima, M. First detection of SARS-CoV-2 RNA in wastewater in North America: A study in Louisiana, USA. Sci. Total Environ. 2020, 743, 140621. [Google Scholar] [CrossRef] [PubMed]
- Li, J.; Gao, J.; Zheng, Q.; Thai, P.K.; Duan, H.; Mueller, J.F.; Yuan, Z.; Jiang, G. Effects of pH, Temperature, Suspended Solids, and Biological Activity on Transformation of Illicit Drug and Pharmaceutical Biomarkers in Sewers. Environ. Sci. Technol. 2021, 55, 8771–8782. [Google Scholar] [CrossRef]
- Proverbio, D.; Kemp, F.; Magni, S.; Ogorzaly, L.; Cauchie, H.-M.; Gonçalves, J.; Skupin, A.; Aalto, A. Model-based assessment of COVID-19 epidemic dynamics by wastewater analysis. Sci. Total Environ. 2022, 827, 154235. [Google Scholar] [CrossRef]
- Vallejo, J.A.; Trigo-Tasende, N.; Rumbo-Feal, S.; Conde-Pérez, K.; López-Oriona, Á.; Barbeito, I.; Vaamonde, M.; Tarrío-Saavedra, J.; Reif, R.; Ladra, S.; et al. Modeling the number of people infected with SARS-COV-2 from wastewater viral load in Northwest Spain. Sci. Total Environ. 2022, 811, 152334. [Google Scholar] [CrossRef]
- Jiang, G.; Wu, J.; Weidhaas, J.; Li, X.; Chen, Y.; Mueller, J.; Li, J.; Kumar, M.; Zhou, X.; Arora, S.; et al. Artificial neural network-based estimation of COVID-19 case numbers and effective reproduction rate using wastewater-based epidemiology. Water Res. 2022, 218, 118451. [Google Scholar] [CrossRef]
- Li, X.; Zhang, S.; Shi, J.; Luby, S.P.; Jiang, G. Uncertainties in estimating SARS-CoV-2 prevalence by wastewater-based epidemiology. Chem. Eng. J. 2021, 415, 129039. [Google Scholar] [CrossRef]
- Morales Medina, W.R.; D’Elia, S.; Fahrenfeld, N.L. Accumulation of SARS-CoV-2 RNA in Sewer Biofilms. ACS EST Water 2022, 2, 1844–1851. [Google Scholar] [CrossRef]
- Fu, S.; Wang, Q.; He, F.; Zhou, C.; Zhang, J.; Xia, W. The decay of coronavirus in sewage pipes and the development of a predictive model for the estimation of SARS-CoV-2 infection cases based on wastewater surveillance. medRxiv 2022. [CrossRef]
- Bertels, X.; Demeyer, P.; Van den Bogaert, S.; Boogaerts, T.; van Nuijs, A.L.N.; Delputte, P.; Lahousse, L. Factors influencing SARS-CoV-2 RNA concentrations in wastewater up to the sampling stage: A systematic review. Sci. Total Environ. 2022, 820, 153290. [Google Scholar] [CrossRef] [PubMed]
- Ahmed, W.; Bertsch, P.M.; Bibby, K.; Haramoto, E.; Hewitt, J.; Huygens, F.; Gyawali, P.; Korajkic, A.; Riddell, S.; Sherchan, S.P.; et al. Decay of SARS-CoV-2 and surrogate murine hepatitis virus RNA in untreated wastewater to inform application in wastewater-based epidemiology. Environ. Res. 2020, 191, 110092. [Google Scholar] [CrossRef] [PubMed]
- Bivins, A.; Greaves, J.; Fischer, R.; Yinda, K.C.; Ahmed, W.; Kitajima, M.; Munster, V.J.; Bibby, K. Persistence of SARS-CoV-2 in Water and Wastewater. Environ. Sci. Technol. Lett. 2020, 7, 937–942. [Google Scholar] [CrossRef]
- Hokajarvi, A.M.; Rytkonen, A.; Tiwari, A.; Kauppinen, A.; Oikarinen, S.; Lehto, K.M.; Kankaanpaa, A.; Gunnar, T.; Al-Hello, H.; Blomqvist, S.; et al. The detection and stability of the SARS-CoV-2 RNA biomarkers in wastewater influent in Helsinki, Finland. Sci. Total Environ. 2021, 770, 145274. [Google Scholar] [CrossRef] [PubMed]
- O’Brien, J.W.; Banks, A.P.W.; Novic, A.J.; Mueller, J.F.; Jiang, G.; Ort, C.; Eaglesham, G.; Yuan, Z.; Thai, P.K. Impact of in-Sewer Degradation of Pharmaceutical and Personal Care Products (PPCPs) Population Markers on a Population Model. Environ. Sci. Technol. 2017, 51, 3816–3823. [Google Scholar] [CrossRef]
- Ort, C.; van Nuijs, A.L.N.; Berset, J.-D.; Bijlsma, L.; Castiglioni, S.; Covaci, A.; de Voogt, P.; Emke, E.; Fatta-Kassinos, D.; Griffiths, P.; et al. Spatial differences and temporal changes in illicit drug use in Europe quantified by wastewater analysis. Addiction 2014, 109, 1338–1352. [Google Scholar] [CrossRef] [Green Version]
- Hart, O.E.; Halden, R.U. Modeling wastewater temperature and attenuation of sewage-borne biomarkers globally. Water Res. 2020, 172, 115473. [Google Scholar] [CrossRef]
- McCall, C.; Fang, Z.N.; Li, D.; Czubai, A.J.; Juan, A.; LaTurner, Z.W.; Ensor, K.; Hopkins, L.; Bedient, P.B.; Stadler, L.B. Modeling SARS-CoV-2 RNA degradation in small and large sewersheds. Environ. Sci. Water Res. Technol. 2022, 8, 290–300. [Google Scholar] [CrossRef]
- Hvitved-Jacobsen, T.; Vollertsen, J.; Nielsen, A.H. Sewer Processes: Microbial and Chemical Process Engineering of Sewer Networks; CRC Press: Boca Raton, FL, USA, 2013. [Google Scholar]
- He, C.; Li, J.; Jiang, G.; Chen, S.; Niel, C.; Yuan, Z.; Mueller, J.F.; Thai, P. Transformation of phthalates and their metabolites in wastewater under different sewer conditions. Water Res. 2021, 190, 116754. [Google Scholar] [CrossRef]
- Li, J.; Gao, J.; Thai, P.K.; Mueller, J.F.; Yuan, Z.; Jiang, G. Transformation of Illicit Drugs and Pharmaceuticals in Sewer Sediments. Environ. Sci. Technol. 2020, 54, 13056–13065. [Google Scholar] [CrossRef] [PubMed]
- Thai, P.K.; O′Brien, J.; Jiang, G.; Gernjak, W.; Yuan, Z.; Eaglesham, G.; Mueller, J.F. Degradability of creatinine under sewer conditions affects its potential to be used as biomarker in sewage epidemiology. Water Res. 2014, 55, 272–279. [Google Scholar] [CrossRef] [PubMed]
- Choi, P.M.; O′Brien, J.W.; Li, J.; Jiang, G.; Thomas, K.V.; Mueller, J.F. Population histamine burden assessed using wastewater-based epidemiology: The association of 1,4-methylimidazole acetic acid and fexofenadine. Environ. Int. 2018, 120, 172–180. [Google Scholar] [CrossRef] [PubMed]
- O′Brien, J.W.; Choi, P.M.; Li, J.; Thai, P.K.; Jiang, G.; Tscharke, B.J.; Mueller, J.F.; Thomas, K.V. Evaluating the stability of three oxidative stress biomarkers under sewer conditions and potential impact for use in wastewater-based epidemiology. Water Res. 2019, 166, 115068. [Google Scholar] [CrossRef] [PubMed]
- Shi, J.; Li, X.; Zhang, S.; Sharma, E.; Sivakumar, M.; Sherchan, S.P.; Jiang, G. Enhanced decay of coronaviruses in sewers with domestic wastewater. Sci. Total Environ. 2022, 813, 151919. [Google Scholar] [CrossRef]
- Zhang, S.; Li, X.; Shi, J.; Sivakumar, M.; Luby, S.; O′Brien, J.; Jiang, G. Analytical performance comparison of four SARS-CoV-2 RT-qPCR primer-probe sets for wastewater samples. Sci. Total Environ. 2022, 806, 150572. [Google Scholar] [CrossRef]
- Choi, P.M.; Li, J.; Gao, J.; O′Brien, J.W.; Thomas, K.V.; Thai, P.K.; Jiang, G.; Mueller, J.F. Considerations for assessing stability of wastewater-based epidemiology biomarkers using biofilm-free and sewer reactor tests. Sci. Total Environ. 2020, 709, 136228. [Google Scholar] [CrossRef]
- Li, J.; Gao, J.; Thai, P.K.; Sun, X.; Mueller, J.F.; Yuan, Z.; Jiang, G. Stability of Illicit Drugs as Biomarkers in Sewers: From Lab to Reality. Environ. Sci. Technol. 2018, 52, 1561–1570. [Google Scholar] [CrossRef] [Green Version]
- Kulandaivelu, J.; Gao, J.; Song, Y.; Shrestha, S.; Li, X.; Li, J.; Doederer, K.; Keller, J.; Yuan, Z.; Mueller, J.F.; et al. Removal of Pharmaceuticals and Illicit Drugs from Wastewater Due to Ferric Dosing in Sewers. Environ. Sci. Technol. 2019, 53, 6245–6254. [Google Scholar] [CrossRef]
- Jiang, G.; Sharma, K.R.; Guisasola, A.; Keller, J.; Yuan, Z. Sulfur transformation in rising main sewers receiving nitrate dosage. Water Res. 2009, 43, 4430–4440. [Google Scholar] [CrossRef]
- Li, W.; Zheng, T.; Ma, Y.; Liu, J. Current status and future prospects of sewer biofilms: Their structure, influencing factors, and substance transformations. Sci. Total Environ. 2019, 695, 133815. [Google Scholar] [CrossRef] [PubMed]
- Ahmed, W.; Bertsch, P.M.; Bivins, A.; Bibby, K.; Farkas, K.; Gathercole, A.; Haramoto, E.; Gyawali, P.; Korajkic, A.; McMinn, B.R.; et al. Comparison of virus concentration methods for the RT-qPCR-based recovery of murine hepatitis virus, a surrogate for SARS-CoV-2 from untreated wastewater. Sci. Total Environ. 2020, 739, 139960. [Google Scholar] [CrossRef] [PubMed]
- Vogels, C.B.F.; Brito, A.F.; Wyllie, A.L.; Fauver, J.R.; Ott, I.M.; Kalinich, C.C.; Petrone, M.E.; Casanovas-Massana, A.; Catherine Muenker, M.; Moore, A.J.; et al. Analytical sensitivity and efficiency comparisons of SARS-CoV-2 RT-qPCR primer-probe sets. Nat. Microbiol. 2020, 5, 1299–1305. [Google Scholar] [CrossRef] [PubMed]
- Corman, V.M.; Landt, O.; Kaiser, M.; Molenkamp, R.; Meijer, A.; Chu, D.K.W.; Bleicker, T.; Brünink, S.; Schneider, J.; Schmidt, M.L. Detection of 2019 novel coronavirus (2019-nCoV) by real-time RT-PCR. Eurosurveillance 2020, 25, 2000045. [Google Scholar] [CrossRef] [PubMed] [Green Version]
- Ahmed, W.; Bivins, A.; Metcalfe, S.; Smith, W.J.M.; Verbyla, M.E.; Symonds, E.M.; Simpson, S.L. Evaluation of process limit of detection and quantification variation of SARS-CoV-2 RT-qPCR and RT-dPCR assays for wastewater surveillance. Water Res. 2022, 213, 118132. [Google Scholar] [CrossRef] [PubMed]
- Silverman, A.I.; Boehm, A.B. Systematic Review and Meta-Analysis of the Persistence and Disinfection of Human Coronaviruses and Their Viral Surrogates in Water and Wastewater. Environ. Sci. Technol. Lett. 2020, 7, 544–553. [Google Scholar] [CrossRef]
- Silverman, A.I.; Boehm, A.B. Systematic Review and Meta-Analysis of the Persistence of Enveloped Viruses in Environmental Waters and Wastewater in the Absence of Disinfectants. Environ. Sci. Technol. 2021, 55, 14480–14493. [Google Scholar] [CrossRef]
- Weidhaas, J.; Aanderud, Z.T.; Roper, D.K.; VanDerslice, J.; Gaddis, E.B.; Ostermiller, J.; Hoffman, K.; Jamal, R.; Heck, P.; Zhang, Y.; et al. Correlation of SARS-CoV-2 RNA in wastewater with COVID-19 disease burden in sewersheds. Sci. Total Environ. 2021, 775, 145790. [Google Scholar] [CrossRef]
- Ahmed, F.; Islam, M.A.; Kumar, M.; Hossain, M.; Bhattacharya, P.; Islam, M.T.; Hossen, F.; Hossain, M.S.; Islam, M.S.; Uddin, M.M.; et al. First detection of SARS-CoV-2 genetic material in the vicinity of COVID-19 isolation Centre in Bangladesh: Variation along the sewer network. Sci. Total Environ. 2021, 776, 145724. [Google Scholar] [CrossRef]
- Graham, K.E.; Loeb, S.K.; Wolfe, M.K.; Catoe, D.; Sinnott-Armstrong, N.; Kim, S.; Yamahara, K.M.; Sassoubre, L.M.; Mendoza Grijalva, L.M.; Roldan-Hernandez, L.; et al. SARS-CoV-2 RNA in Wastewater Settled Solids Is Associated with COVID-19 Cases in a Large Urban Sewershed. Environ. Sci. Technol. 2021, 55, 488–498. [Google Scholar] [CrossRef]
- Zhang, S.; Shi, J.; Sharma, E.; Li, X.; Gao, S.; Zhou, X.; O′Brien, J.; Coin, L.; Liu, Y.; Sivakumar, M.; et al. In-sewer decay and partitioning of Campylobacter jejuni and Campylobacter coli and implications for their wastewater surveillance. Water Res. 2023, 233, 119737. [Google Scholar] [CrossRef] [PubMed]
- Ahmed, W.; Bertsch, P.M.; Angel, N.; Bibby, K.; Bivins, A.; Dierens, L.; Edson, J.; Ehret, J.; Gyawali, P.; Hamilton, K.A.; et al. Detection of SARS-CoV-2 RNA in commercial passenger aircraft and cruise ship wastewater: A surveillance tool for assessing the presence of COVID-19 infected travellers. J. Travel Med. 2020, 27, taaa116. [Google Scholar] [CrossRef] [PubMed]
- Zheng, X.; Li, S.; Deng, Y.; Xu, X.; Ding, J.; Lau, F.T.K.; In Yau, C.; Poon, L.L.M.; Tun, H.M.; Zhang, T. Quantification of SARS-CoV-2 RNA in wastewater treatment plants mirrors the pandemic trend in Hong Kong. Sci. Total Environ. 2022, 844, 157121. [Google Scholar] [CrossRef] [PubMed]
Figure 1.
The laboratory-scale sewer system is composed of two rising main (RM) and two gravity sewer (GS) bioreactors.
Figure 1.
The laboratory-scale sewer system is composed of two rising main (RM) and two gravity sewer (GS) bioreactors.

Figure 2.
Concentration variation of SARS-CoV-2 RNA (E gene and N gene) in the wastewater phase of (A) control (RMC and GSC) and (B) biofilm reactors (RM−1st and GS−1st). The red symbols represent the results of the RM reactors. The blue symbols represent the results of the GS reactors. Empty circles represent the results of the N gene. Empty triangles represent the results of the E gene. Solid circles represent the average of the total eight tests. The middle solid lines inside the box represent medians. The top and bottom borders of the box represent the 75%ile and 25%ile, respectively. The top and bottom whiskers represent the 95%ile and 5%ile, respectively.

Table 1.
Characteristics of RT-qPCR calibrations for CCDC-N and E-Sarbeco assay.
| Primer-Probe Sets | Efficiency (%) | Linearity (R2) | Slope (Mean ± SD) | Y-Intercept (Mean ± SD) |
|---|---|---|---|---|
| CCDC-N | 108.2 | 0.999 | −3.139 ± 0.12 | 40.39 ± 0.18 |
| E-Sarbeco | 96.36 | 0.999 | −3.412 ± 0.09 | 41.87 ± 0.26 |
Table 2.
Reduction rate k/k1 (h−1) and k2 (h−1), transiting time point t1 (h) and T90 values (h) of SARS-CoV-2 RNA (N and E genes) in different types of sewer reactors (RM and GS) with and without biofilms based on the monophasic (Control) or biphasic (Biofilm) first-order decay models.
Table 2.
Reduction rate k/k1 (h−1) and k2 (h−1), transiting time point t1 (h) and T90 values (h) of SARS-CoV-2 RNA (N and E genes) in different types of sewer reactors (RM and GS) with and without biofilms based on the monophasic (Control) or biphasic (Biofilm) first-order decay models.
| Targets/Reactors | k/k1 (h−1) [95% CI] | k2 (h−1) [95% CI] | t1 (h) [95% CI] | T90 (h) [95% CI] | R2 | RMSE | |
|---|---|---|---|---|---|---|---|
| Control (Monophasic) | RM | 0.23 [0.02 to 0.44] | - | - | 10.07 [4.52 to 21.63] | 0.75 | 0.89 |
| GS | 0.12 [0 * to 0.31] | - | - | 18.77 [0 * to 227.8] | 0.48 | 0.79 | |
| N gene | 0.09 [0.02 to 0.16] | - | - | 26.19 [0 * to 113.5] | 0.81 | 0.28 | |
| E gene | 0.26 [0 * to 0.64] | - | - | 8.74 [4.35 to 16.49] | 0.53 | 1.59 | |
| Total | 0.18 [0 * to 0.37] | - | - | 13.11 [7.38 to 24.14] | 0.67 | 0.8 | |
| Biofilm (Biphasic) | RM | 2.74 [1.38 to 4.69] | 0.37 [0 * to 0.78] | 1 [0 * to 2.7] | 0.84 [0.56 to 3.41] | 0.63 | 1.36 |
| GS | 2.42 [1 to 4.41] | 0.004 [0 * to 0.66] | 1.5 [0.5 to NA] | 0.95 [0.59 to 3.79] | 0.52 | 1.53 | |
| N gene | 3.92 [2.78 to 5.44] | 0.07 [0 * to 0.3] | 1 [0.72 to 1.64] | 0.59 [0.45 to 0.86] | 0.66 | 1.25 | |
| E gene | 1.15 [0.73 to 2.35] | 0.38 [NA] | NA | 2.0 [1.45 to 6] | 0.7 | 1.24 | |
| Total | 2.58 [1.63 to 3.71] | 0.19 [0 * to 0.58] | 1.25 [0.69 to 2.33] | 0.89 [0.65 to 2.67] | 0.57 | 1.45 | |
Note(s): * 95% CI truncated at 0 in the case of negative values for k and T90. NA: Unreliable results.
Table 3.
Accumulation of SARS-CoV-2 RNA in rising main and gravity sewer biofilms.
| Type | Batch Test | N Gene (GC/cm2) | E Gene (GC/cm2) | ||||
|---|---|---|---|---|---|---|---|
| Reactor-1st | Reactor-2nd | Reactor-1st | Reactor-2nd | ||||
| 0 h | 12 h | 12 h | 0 h | 12 h | 12 h | ||
| RM | Test 1 | 196.1 * | - | 285.1 * | ND | - | ND |
| Test 2 | ND | 365.5 | 187.0 | 654.5 * | 915.4 | 544.1 | |
| GS | Test 1 | ND | - | ND | 686.1 * | - | 3622.4 |
| Test 2 | ND | ND | 487.0 * | 935.9 | 1049.6 * | 2849.4 * | |
Note(s): * Duplicate RT-qPCR tests only yielded one positive result. Sample was not acquired. ND: not detected.
Disclaimer/Publisher’s Note: The statements, opinions and data contained in all publications are solely those of the individual author(s) and contributor(s) and not of MDPI and/or the editor(s). MDPI and/or the editor(s) disclaim responsibility for any injury to people or property resulting from any ideas, methods, instructions or products referred to in the content. |
© 2023 by the authors. Licensee MDPI, Basel, Switzerland. This article is an open access article distributed under the terms and conditions of the Creative Commons Attribution (CC BY) license (https://creativecommons.org/licenses/by/4.0/).
Share and Cite
MDPI and ACS Style
Zhang, S.; Sharma, E.; Tiwari, A.; Chen, Y.; Sherchan, S.P.; Gao, S.; Zhou, X.; Shi, J.; Jiang, G. The Reduction of SARS-CoV-2 RNA Concentration in the Presence of Sewer Biofilms. Water 2023, 15, 2132. https://doi.org/10.3390/w15112132
AMA Style
Zhang S, Sharma E, Tiwari A, Chen Y, Sherchan SP, Gao S, Zhou X, Shi J, Jiang G. The Reduction of SARS-CoV-2 RNA Concentration in the Presence of Sewer Biofilms. Water. 2023; 15(11):2132. https://doi.org/10.3390/w15112132
Chicago/Turabian StyleZhang, Shuxin, Elipsha Sharma, Ananda Tiwari, Yan Chen, Samendra P. Sherchan, Shuhong Gao, Xu Zhou, Jiahua Shi, and Guangming Jiang. 2023. "The Reduction of SARS-CoV-2 RNA Concentration in the Presence of Sewer Biofilms" Water 15, no. 11: 2132. https://doi.org/10.3390/w15112132
Note that from the first issue of 2016, this journal uses article numbers instead of page numbers. See further details here.