Article

Predicting Potential Spawning Habitat by Ensemble Species Distribution Models: The Case Study of European Anchovy (Engraulis encrasicolus) in the Strait of Sicily

1
Institute of Anthropic Impacts and Sustainability in Marine Environment (IAS), National Research Council of Italy, 91021 Trapani, Italy
2
Institute for Studies on the MEDiterranean (ISMED), National Research Council of Italy, 90145 Palermo, Italy
3
Institute of Anthropic Impacts and Sustainability in Marine Environment (IAS), National Research Council of Italy, 90149 Palermo, Italy
*
Author to whom correspondence should be addressed.
Water 2022, 14(9), 1400; https://doi.org/10.3390/w14091400
Submission received: 30 March 2022 / Revised: 21 April 2022 / Accepted: 24 April 2022 / Published: 27 April 2022
(This article belongs to the Special Issue Marine Fisheries and Ecosystem Modeling)

Abstract

:
Species distribution models (SDMs) are important tools for exploring the complex association between species and habitats. Here, we applied six SDMs combining 1946 pieces of presence/absence data regarding European anchovy eggs with environmental parameters from surveys conducted in the Strait of Sicily from 1998 to 2016. We aimed to investigate the mechanisms influencing spawning habitat suitability for anchovy (Engraulis encrasicolus). The dataset was split into a training subset (75%) and a test subset (25%) for evaluating the predictive performance of the models. The results suggested the role of environmental parameters in explaining egg occurrence, model accuracy and spatial predictions. Bottom depth consistently had the highest importance, followed by absolute dynamic topography, which gives insights about local mesoscale oceanographic features. Each modelling method, except the linear model, produced successful performance for both the training and the test datasets. The spatial predictions were estimated as weighted averages of single-model predictions, with weights based on discriminatory power measured by the area under the receiver operating characteristic curve (AUC). This ensemble approach often provided more robust predictions than a single model. The coastal waters were identified as the most favorable for anchovy spawning, especially the south-central sector and the area around the southern-most tip of Sicily.

Graphical Abstract

1. Introduction

The growing need for quantitative information on species habitat during all life stages, for resource management and conservation planning, has caused a fast development in the Species Distribution Models (SDMs) in recent years [1,2,3,4]. Their wide use is due mainly to their flexibility and ability to quantify highly complex associations that characterize species and their habitat and to estimate spatially explicit predictions of environmental suitability [5,6].
Of particular interest in marine ecosystem-based management is the distribution of pelagic species, whose spawning strategy, offspring fate and standing stock biomass are highly affected by variability of environmental conditions, especially in the very oligotrophic Mediterranean Sea [7,8,9,10]. Specifically, the upwelling off the southern coast of Sicily [11] drives a highly productive assemblage of pelagic fish including the European anchovy (Engraulis encrasicolus, [12,13]). It is the target species for local fisheries and an intermediate link in the flow of energy from lower to higher trophic levels. Therefore, it substantially contributes to the diet of numerous predators and to the total catches from fisheries [14,15]. The short lifespan (2–3 years), reproductive strategy with large quantities of pelagic eggs and extended spawning season [16,17] make its biomass very susceptible to environmental variability. In the Strait of Sicily, the anchovy spawning period of this species occurs during the summer period, when the temperature increases and the water column is stratified [18], favoring the aggregation of prey in the surface layer, where most of the eggs and larvae are typically concentrated [19]. Therefore, habitat conditions have a high impact on survival in early life stages (eggs and larvae) and are considered more important than the effects of fishing effort in many Mediterranean regions [9,20,21,22].
Recently, the preferential spawning habitat of European anchovy in relation to environmental parameters has been examined for the Mediterranean Sea [23]. Its spawning distribution is mainly driven by depth gradient, which limits the potential spawning habitat to the continental shelf, within the 200 m isobaths [19,24,25,26,27,28]. Other important factors affecting anchovy spawning behavior are variations in primary production, temperature and stability of water column [18,29,30,31,32,33]. Several studies showed that the fate of recruitment is manly linked to local surface circulation during the spawning season [9,34,35,36,37]. In the Strait of Sicily, the surface circulation is dominated by the flow of the Modified Atlantic Waters (MAW; [38,39,40,41,42]), locally called Atlantic Ionian Stream (AIS). The AIS fuels high variability in both hydrological and physico-chemical conditions that may favor the local retention of eggs and larvae and the enrichment of primary production in the upper water layers, creating favorable feeding conditions for anchovy early life history stages [13,34,43,44].
However, most of the studies carried out until now have examined the relationship between the species distribution and a single environmental parameter. When a multivariate approach was applied, predictions of spawning habitat distribution were mainly based on a single statistical technique. Since the selection of the best a priori model is not straightforward [45], an approach based on the testing of multiple models can provide a more robust estimation of the occurrence of anchovy spawning [46,47,48]. In this paper, six different SDMs were applied combining a long presence/absence time series of European anchovy eggs in the Strait of Sicily and co-occurring environmental information. The approach included regression-based methods (Generalized Linear Model (GLM), Generalized Additive Model (GAM) and Multivariate Adaptive Regression Spline (MARS)) and machine-learning methods (Random Forest (RF), Boosted Regression Trees (BRT) and Support Vector Machines (SVM)).

2. Materials and Methods

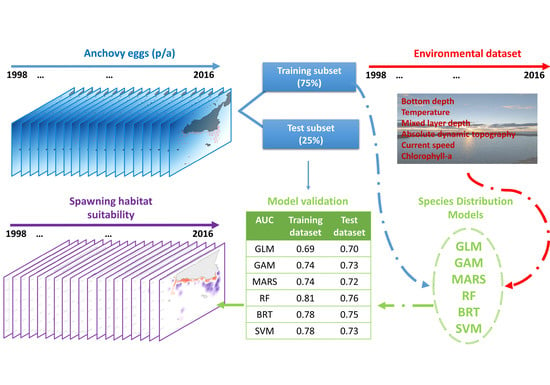
2.1. The Biological Dataset

Anchovy egg data used in this study are from nineteen summer oceanographic surveys carried out in the Strait of Sicily from 1998 to 2016 (Table 1), during the peak of anchovy spawning period in the study area [18]. Because spawning of the European anchovy occurs on the continental shelf [9], only stations with depths less than 200 m were included in the analysis, with a sampling grid of 6 × 6 nautical miles. Plankton samples were collected with a Bongo40 net towed obliquely from the surface to a 100 m depth, wherever possible. The Bongo40 net is composed of two coupled nets with a mouth diameter of 40 cm and mesh size of 200 µ. Samples were stored in 4% buffered formaldehyde (and/or 70% alcohol) sea-water solution for identification of anchovy eggs in the laboratory by stereomicroscopy. A presence/absence data matrix was finally obtained and used as response variable in use the SDMs.

2.2. The Environmental Dataset

A set of environmental parameters was selected based on available knowledge about their direct influence on the spawning behavior of the adult population and on the survival of anchovy offspring.
First, the bottom depth was included as an explanatory variable in estimated models, as this parameter represents a discriminant factor for all life stages of the European anchovy [31].
Continuous vertical profiles of temperature were acquired in all Bongo40 stations from the surface to the bottom by means of a SBE911 plus CTD probe (Sea-Bird Inc mod. 9/11 plus). The collected downcast data were quality-checked and processed in accordance with the instructions of the Mediterranean and Ocean Data Base [49], using the Seasoft-Win32 software (Washington, DC, USA). As anchovy eggs in the Mediterranean Sea are mainly found in the surface layer [50,51], the temperature data were averaged by station from surface to 10 m depth.
The mixed layer depth (MLD in m) was derived from each CTD profile using the algorithm described in [52], since it is an important driver for the definition of the potential spawning habitat [53].
The relevant impact of mesoscale oceanographic features such as upwelling, cold filaments and fronts on the spatial distribution of the planktonic early life stages of anchovy [9,54] was also taken into account. Oceanographic structures can influence the distribution of chemical and physical properties of the water column with a potential effect on anchovy egg survival and larval development [55]. Therefore, surface circulation features were evaluated by means of Absolute Dynamic Topography (ADT in cm) (daily data; spatial resolution: 0.125 × 0.125 degree) and the derived u and v components of geostrophic currents, produced by Copernicus Marine Environment Monitoring Service (CMEMS, http://marine.copernicus.eu/ (accessed on 15 July 2021)). ADT represents important oceanographic features such as mesoscale eddies and meanders [56], which affect primary production and can act as physical barriers for eggs or be responsible for their dispersal offshore. In addition, absolute speed (parameter speed.gos (cm s−1)) was derived from the zonal (u) and meridional (v) components of surface current and used as predictors in the modelling.
Finally, sea surface chlorophyll-a concentration (chl-a in mg m−3) was included in the modelling as an indicator of primary productivity [57] and a proxy for the presence of favorable feeding conditions for anchovy. Daily high resolution (1 × 1 km) satellite data from CMEMS were used for this purpose.
The satellite-based information was extracted for each planktonic station subject to the analysis, based on their spatial and temporal location.

2.3. Species Distribution Modelling

All SDMs were performed on the presence/absence of eggs and environmental parameters using the statistical software R 3.6.3 (Vienna, Austria) [58].
The available dataset was checked for the presence of any outliers, the collinearity among independent variables and the distribution of the input parameters. MLD and the concentration of chl-a were transformed via natural logarithm to achieve uniform distribution, useful for improving the model application.
The survey data were randomly split into two subsets, the first to train the models (training dataset: 75% of total number of stations) and the second one to validate the predictive performance of the estimated models (test dataset: 25% of available stations). All species distribution models were fitted using the “sdm” library [59] of the R environment [58]. For each model applied on the training set, the AUC-metric was used to select the most significant input variables useful for discrimination of stations with presence or absence of anchovy eggs. The AUC-metric calculates the improvement in model performance with the inclusion of each variable, compared to when the variable is excluded. Partial dependence plots for each significant predictor were used to describe the role of predictors in the explanation of the species distribution. The response curves were generated following the procedure proposed by [60].

2.3.1. Regression-Based Models

Three regression models were fitted to presence/absence data of anchovy eggs and environmental parameters: GLM, GAM and MARS. The assumption of binomial error distribution and logit link function were chosen for all modelling approaches.
GLM is a mathematical extensions of linear models that do not force data into non-linear scales, and thereby allow for non-linearity and non-constant variance structures in the data. Model is fit using maximum likelihood and by allowing the linear model to be related to the response variable via a link function and the magnitude of the variance of each measurement to be a function of its predicted value [61].
GAM is a semi-parametric extensions of GLM, where the only underlying assumption made is that the functions are additive and the linear predictor is the sum of smoothing functions. This makes GAM very flexible, and adaptable to very complex functions [62].
MARS is a non-parametric regression model used to estimate complex nonlinear relationships by a series of truncated spline functions of the predictors. It estimates a set of functions called “basic functions” (BF), which represent the information included in one or more independent variables. The BF are combined to obtain a sequence of candidate models with different BF numbers, from which MARS selects the optimal model [63].

2.3.2. Machine-Learning Models

Three machine-learning models were fitted: RF, BRT and SVM.
An RF is an ensemble classifier consisting of many decision trees, where the final predicted class is obtained by combining the predictions of all individual trees. A training set for each individual tree is constructed by randomly re-sampling data with replacement from available data in the original dataset. The number of trees was determine based on lowest error rate on validation data [64].
BRT combines the concept of regression trees with the concept of boosting. Boosting is an ensemble method that derives an answer from a large pool of models. In this case, this large pool of models is generated by creating trees that attempt to explain the variation in the data that is currently unexplained by existing trees [65]. The function assesses the optimal number of boosting trees using k-fold cross validation, described in [66].
SVM applies an algorithm with polynomial kernels able to estimate an optimal hyperplane with the maximal margin of separation between positive and negative stations. The Kernel parameter selection and Cost parameter were defined minimizing error rate on validation data [67].

2.3.3. Model Validation and Mapping

The output values from each species distribution model ranged from 0 to 1, representing the probability of the occurrence of anchovy eggs at a particular sampling station. For each SDM, an optimal threshold was estimated to transform the continuous output into a binary factor: positive stations (representing stations where the presence of anchovy eggs is expected to occur) with predicted values greater than the threshold and negative stations otherwise. Various measurements of accuracy were applied to each SDM for both the training and the independent test data to evaluate discriminating ability and reliability, including threshold-dependent statistics (Sensitivity and Specificity) and threshold-independent statistics (AUC) [68].
The ability of models to correctly predict species presence and absence was examined with sensitivity and specificity, respectively [69]. The maximum sum of sensitivity and specificity was used in SDM as criteria for optimizing the threshold.
In addition, a threshold-independent measure was estimated: the AUC [70]. A high AUC indicates that sites with high predicted suitability values tend to be areas of known presence and locations with lower model prediction values tend to be areas where the species presence is unknown. An AUC lower than 0.5 means that the model is not able to discriminate, 0.7 indicates satisfactory discrimination, 0.8 good discrimination, and 0.9 or higher very good discrimination [71].
Finally, we also estimated the probability of occurrence based on an ensemble of all models, because these predictions are often more robust than predictions derived from a single model [46,47,48]. Ensemble predictions were calculated as weighted averages of single-model predictions, with weights assigned to each modelling technique based on its discriminatory power as measured by the AUC. The Kriging-based spatial interpolation was used to map the results from ensemble approach within the study area.

3. Results

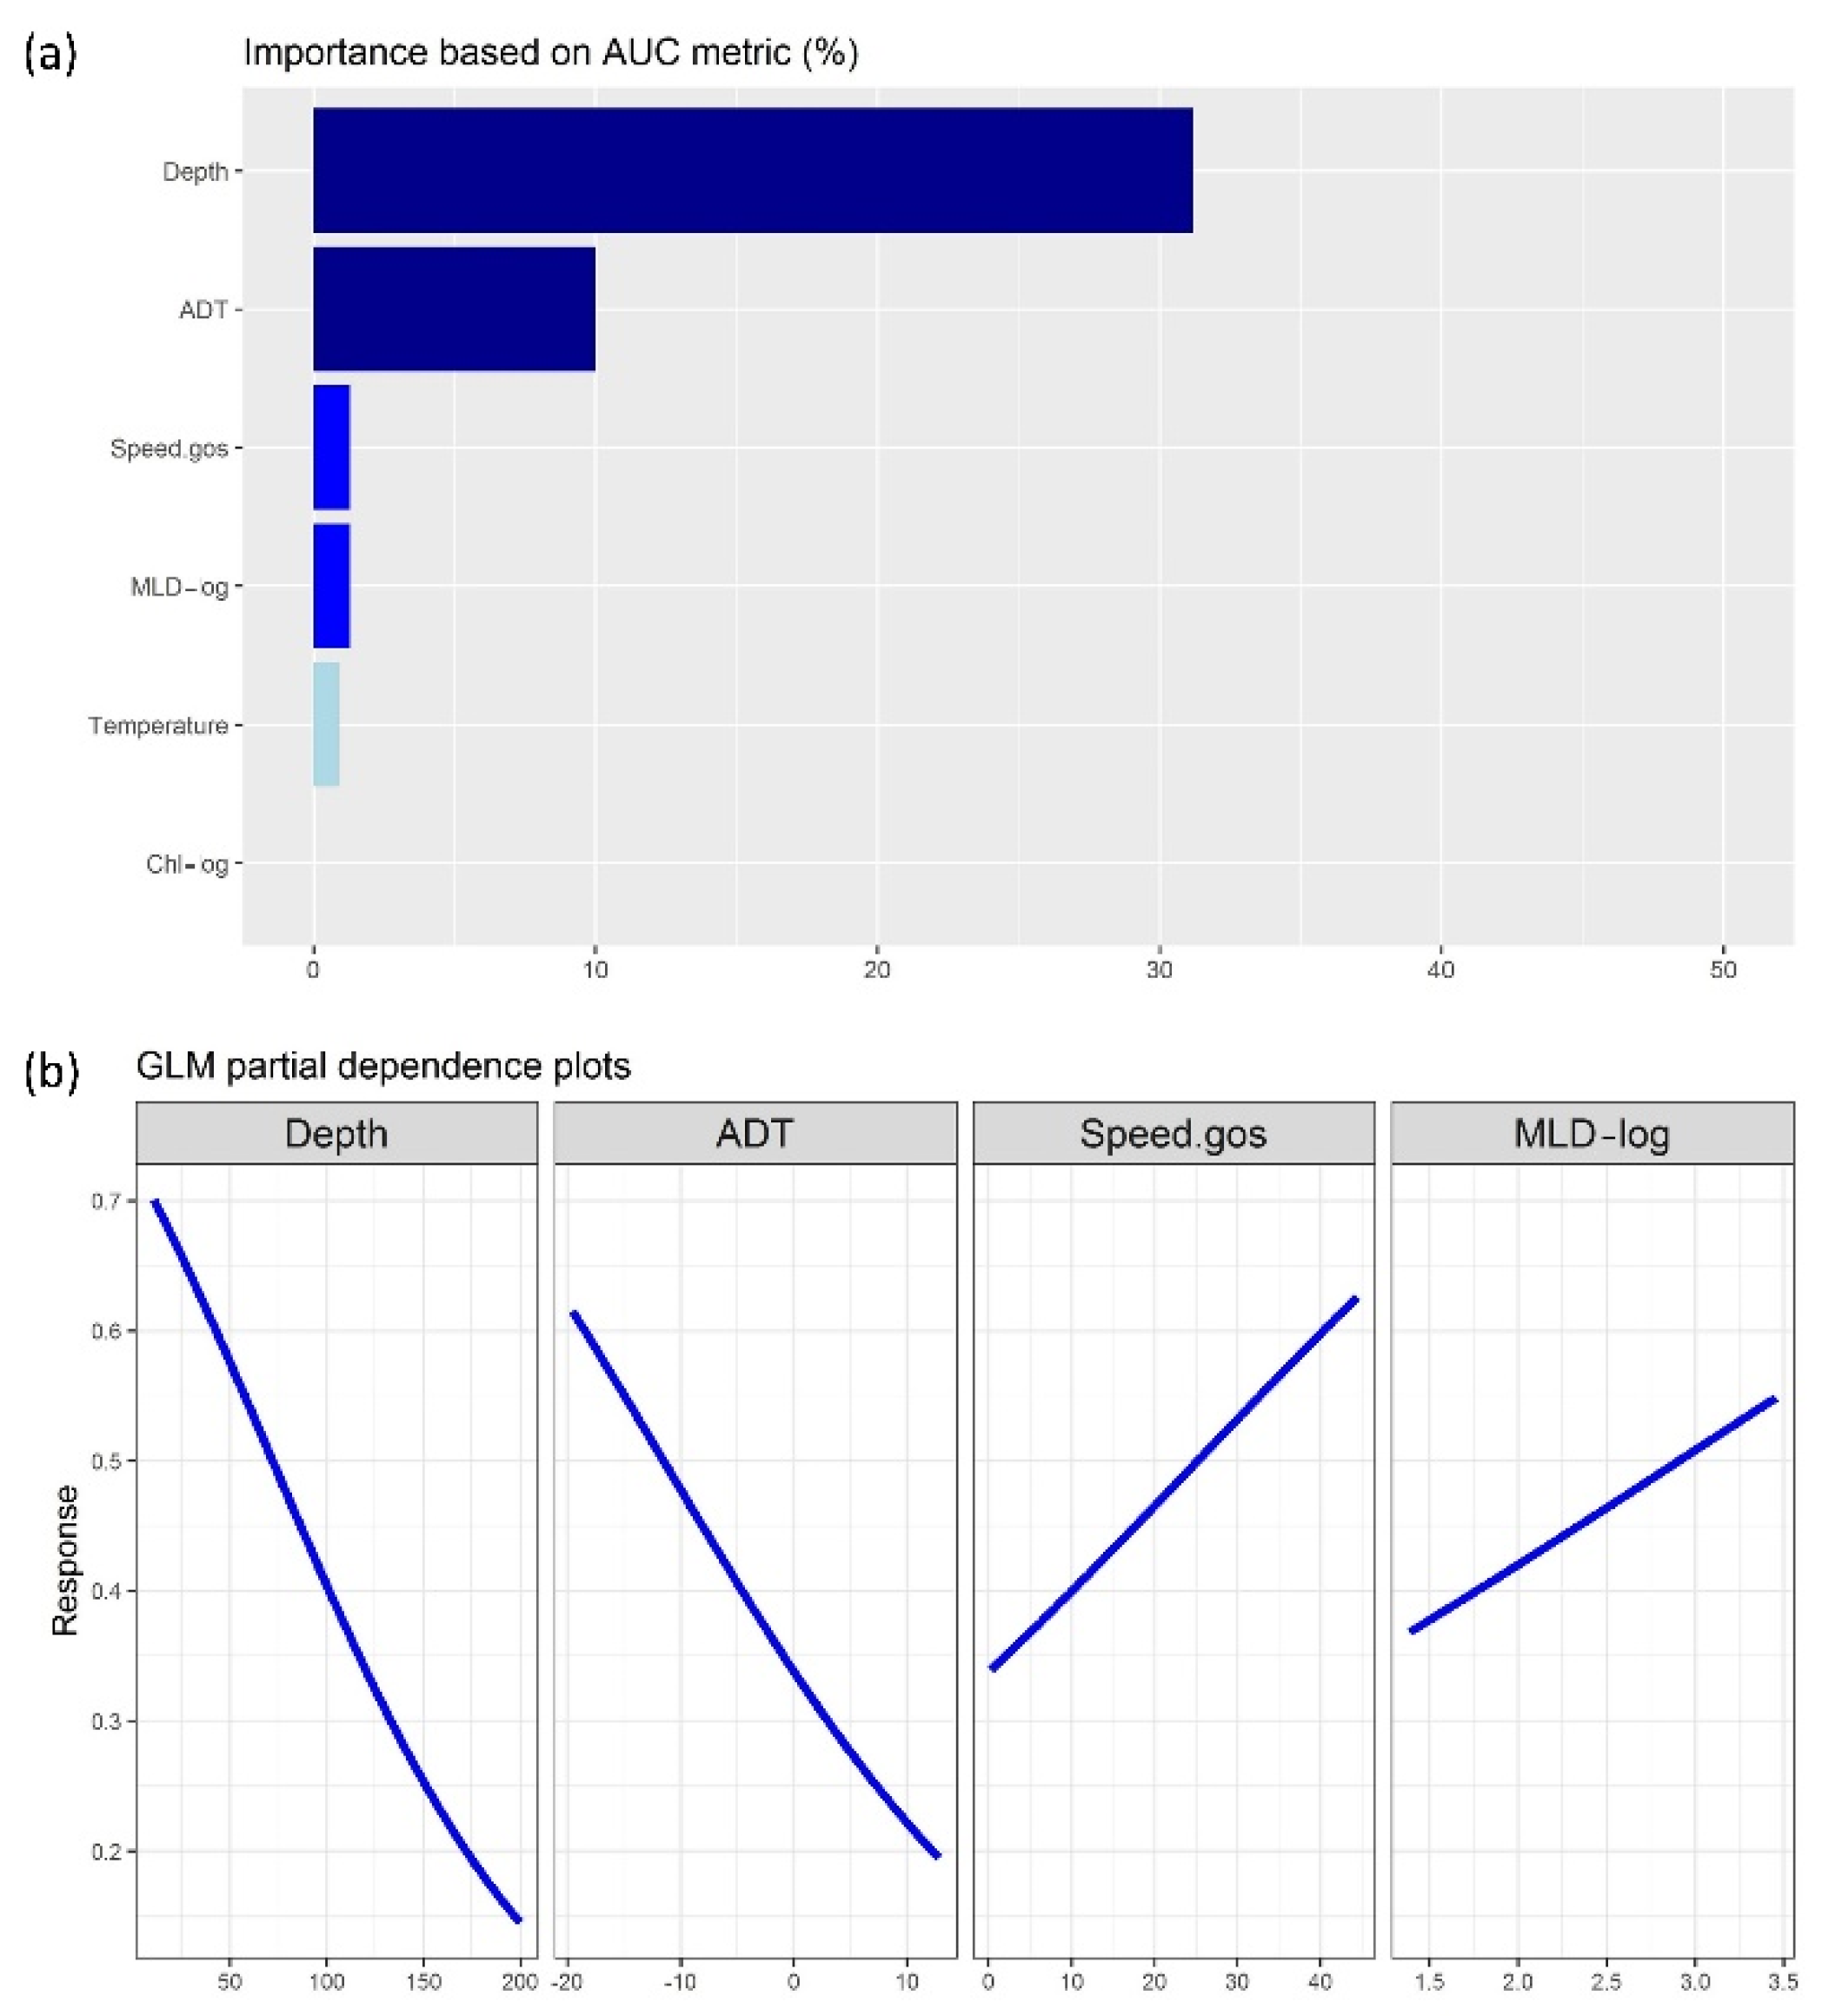
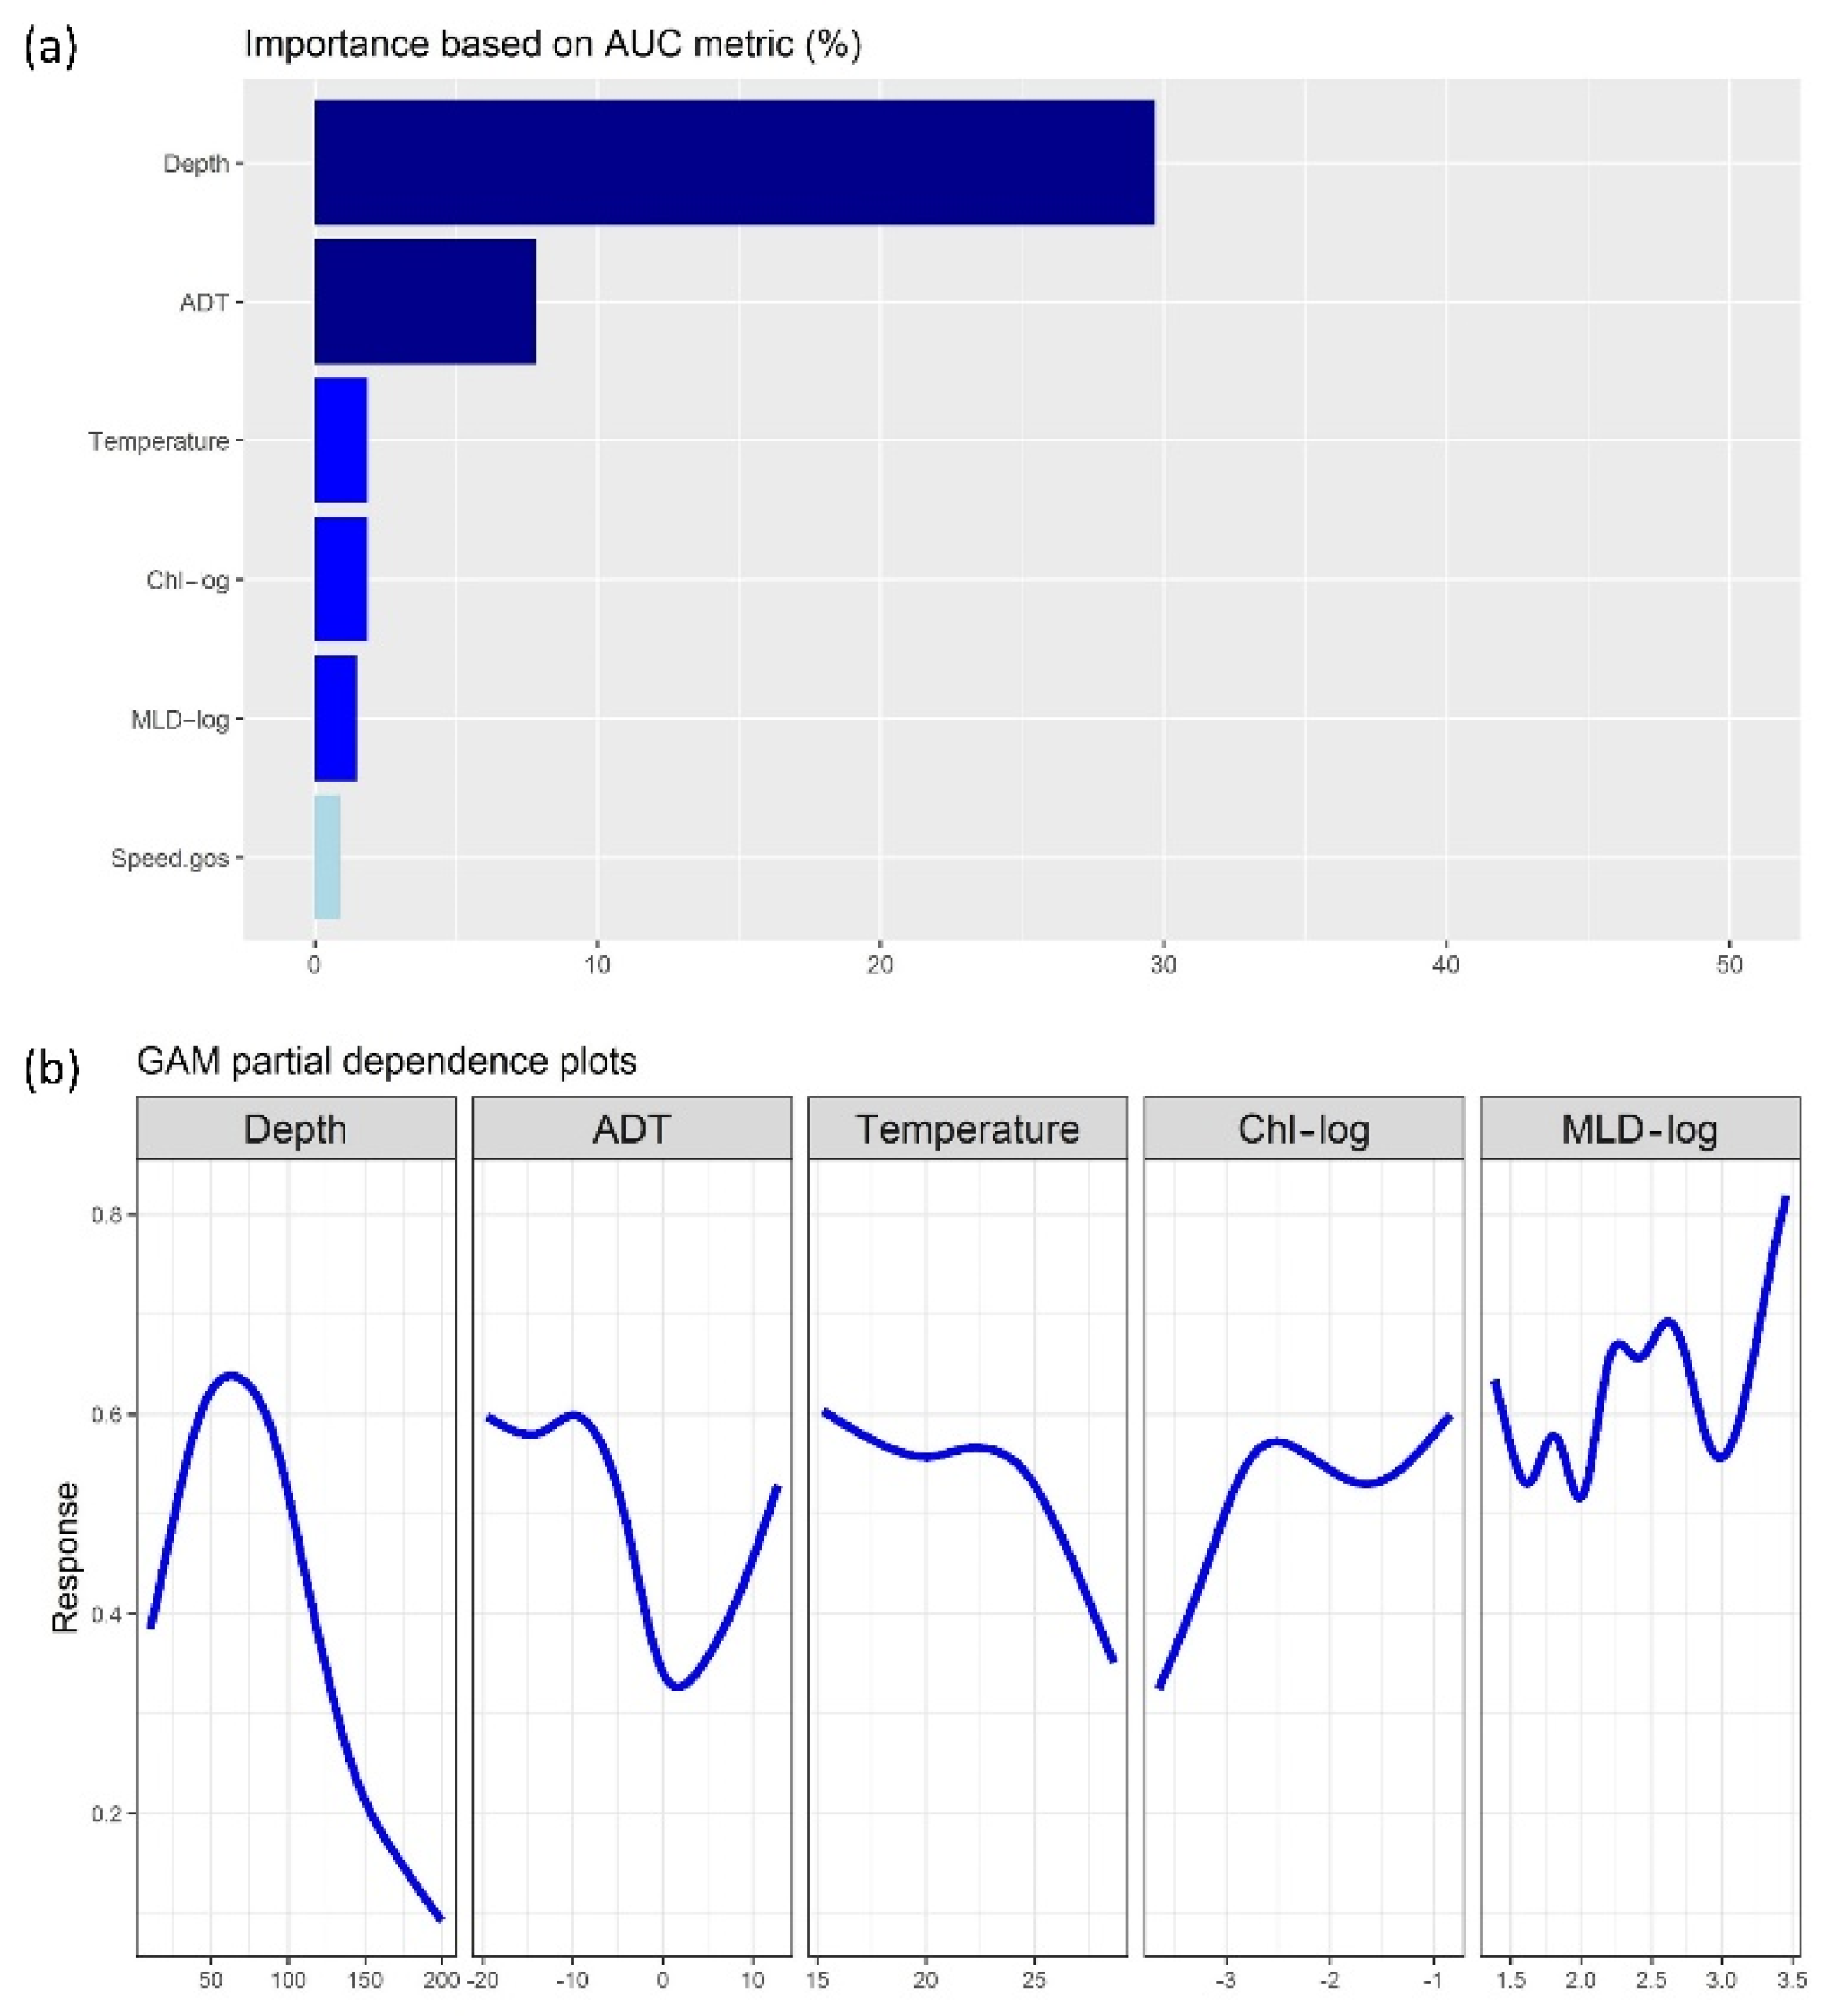
3.1. Regression-Based Outputs

The regression models included bottom depth as the primary effect on spawning, followed by ADT, speed.gos and MLD in all cases. GAM and MARS models also included chl-a and temperature (Figure 1a, Figure 2a and Figure 3a). In GLM, the linear relationship between egg occurrence and both bottom depth and ADT is negative, while speed.gos and MLD have a positive effect on egg presence (Figure 1b). A similar pattern of response was found in MARS and GAM results for all selected variables. The partial plot of bottom depth indicated an optimal range for the spawning grounds between 50 and 100 m. Some particular environmental conditions (ADT values > 10 cm in absolute value; speed.gos around 30 cm s−1; temperature < 25 °C; chl-a > 0.05 mg m−3 and 10 < MLD < 15 m) are linked to a higher probability of the presence of anchovy eggs (Figure 2 and Figure 3b).

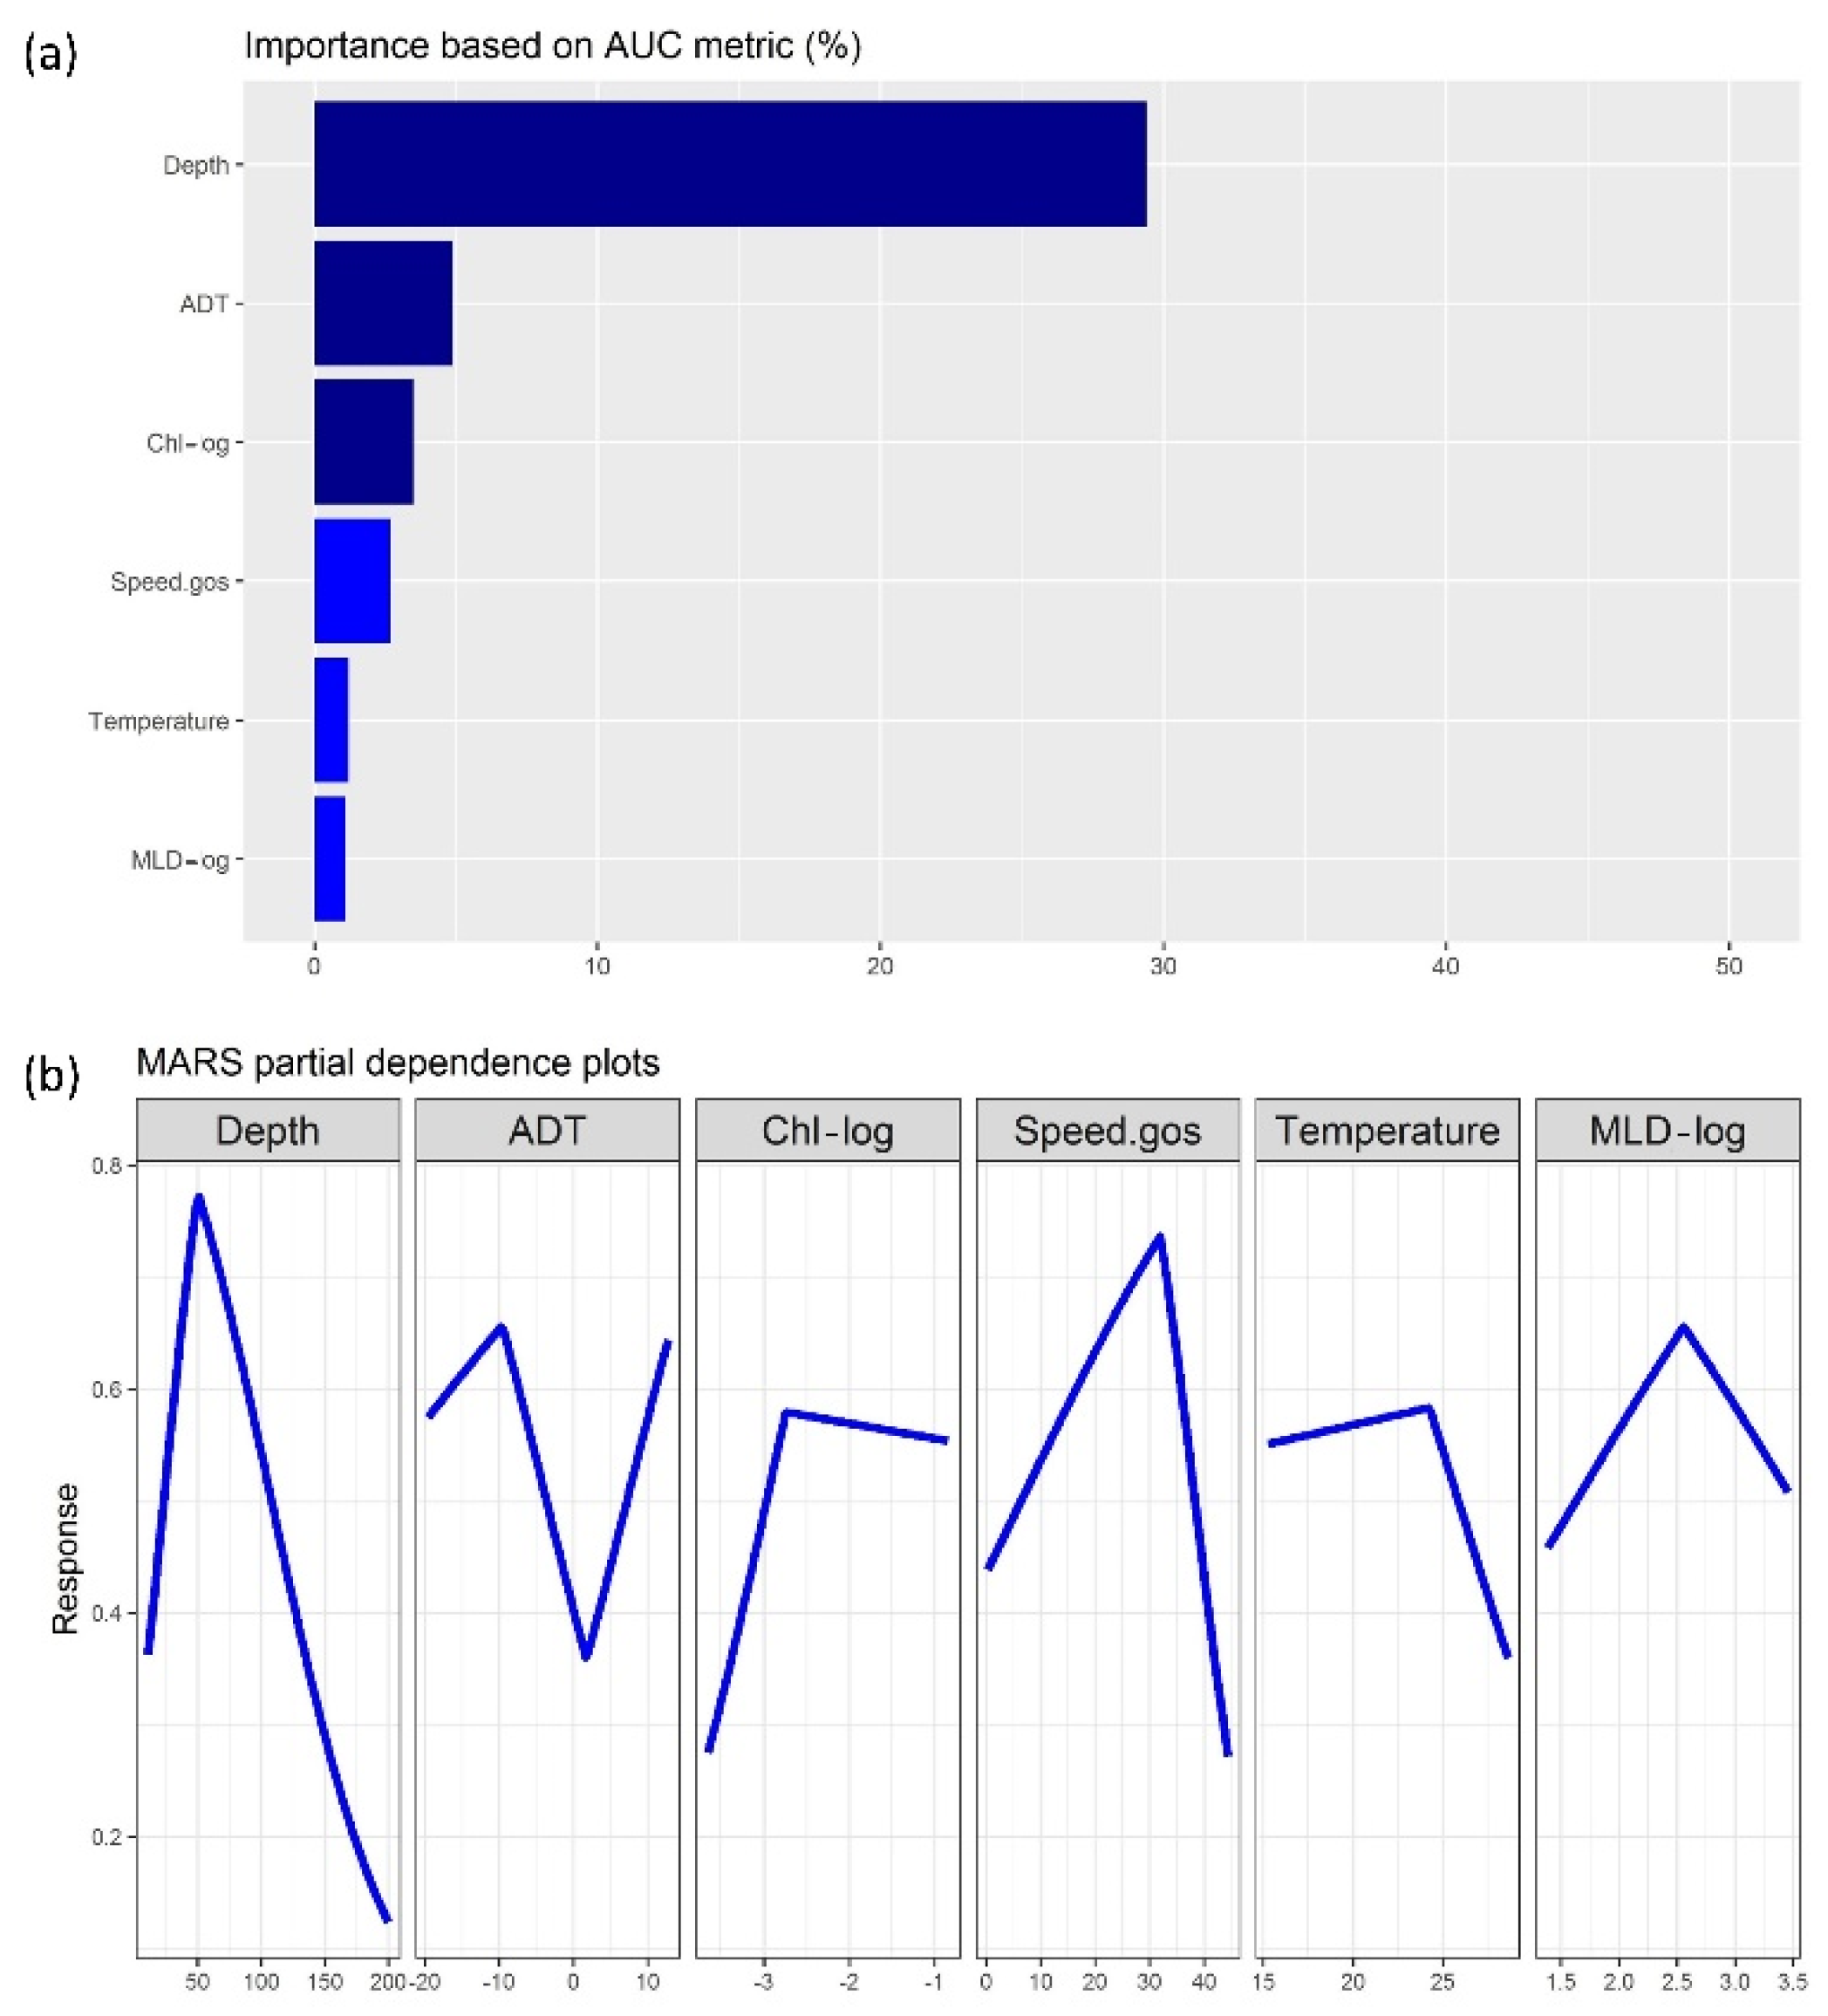
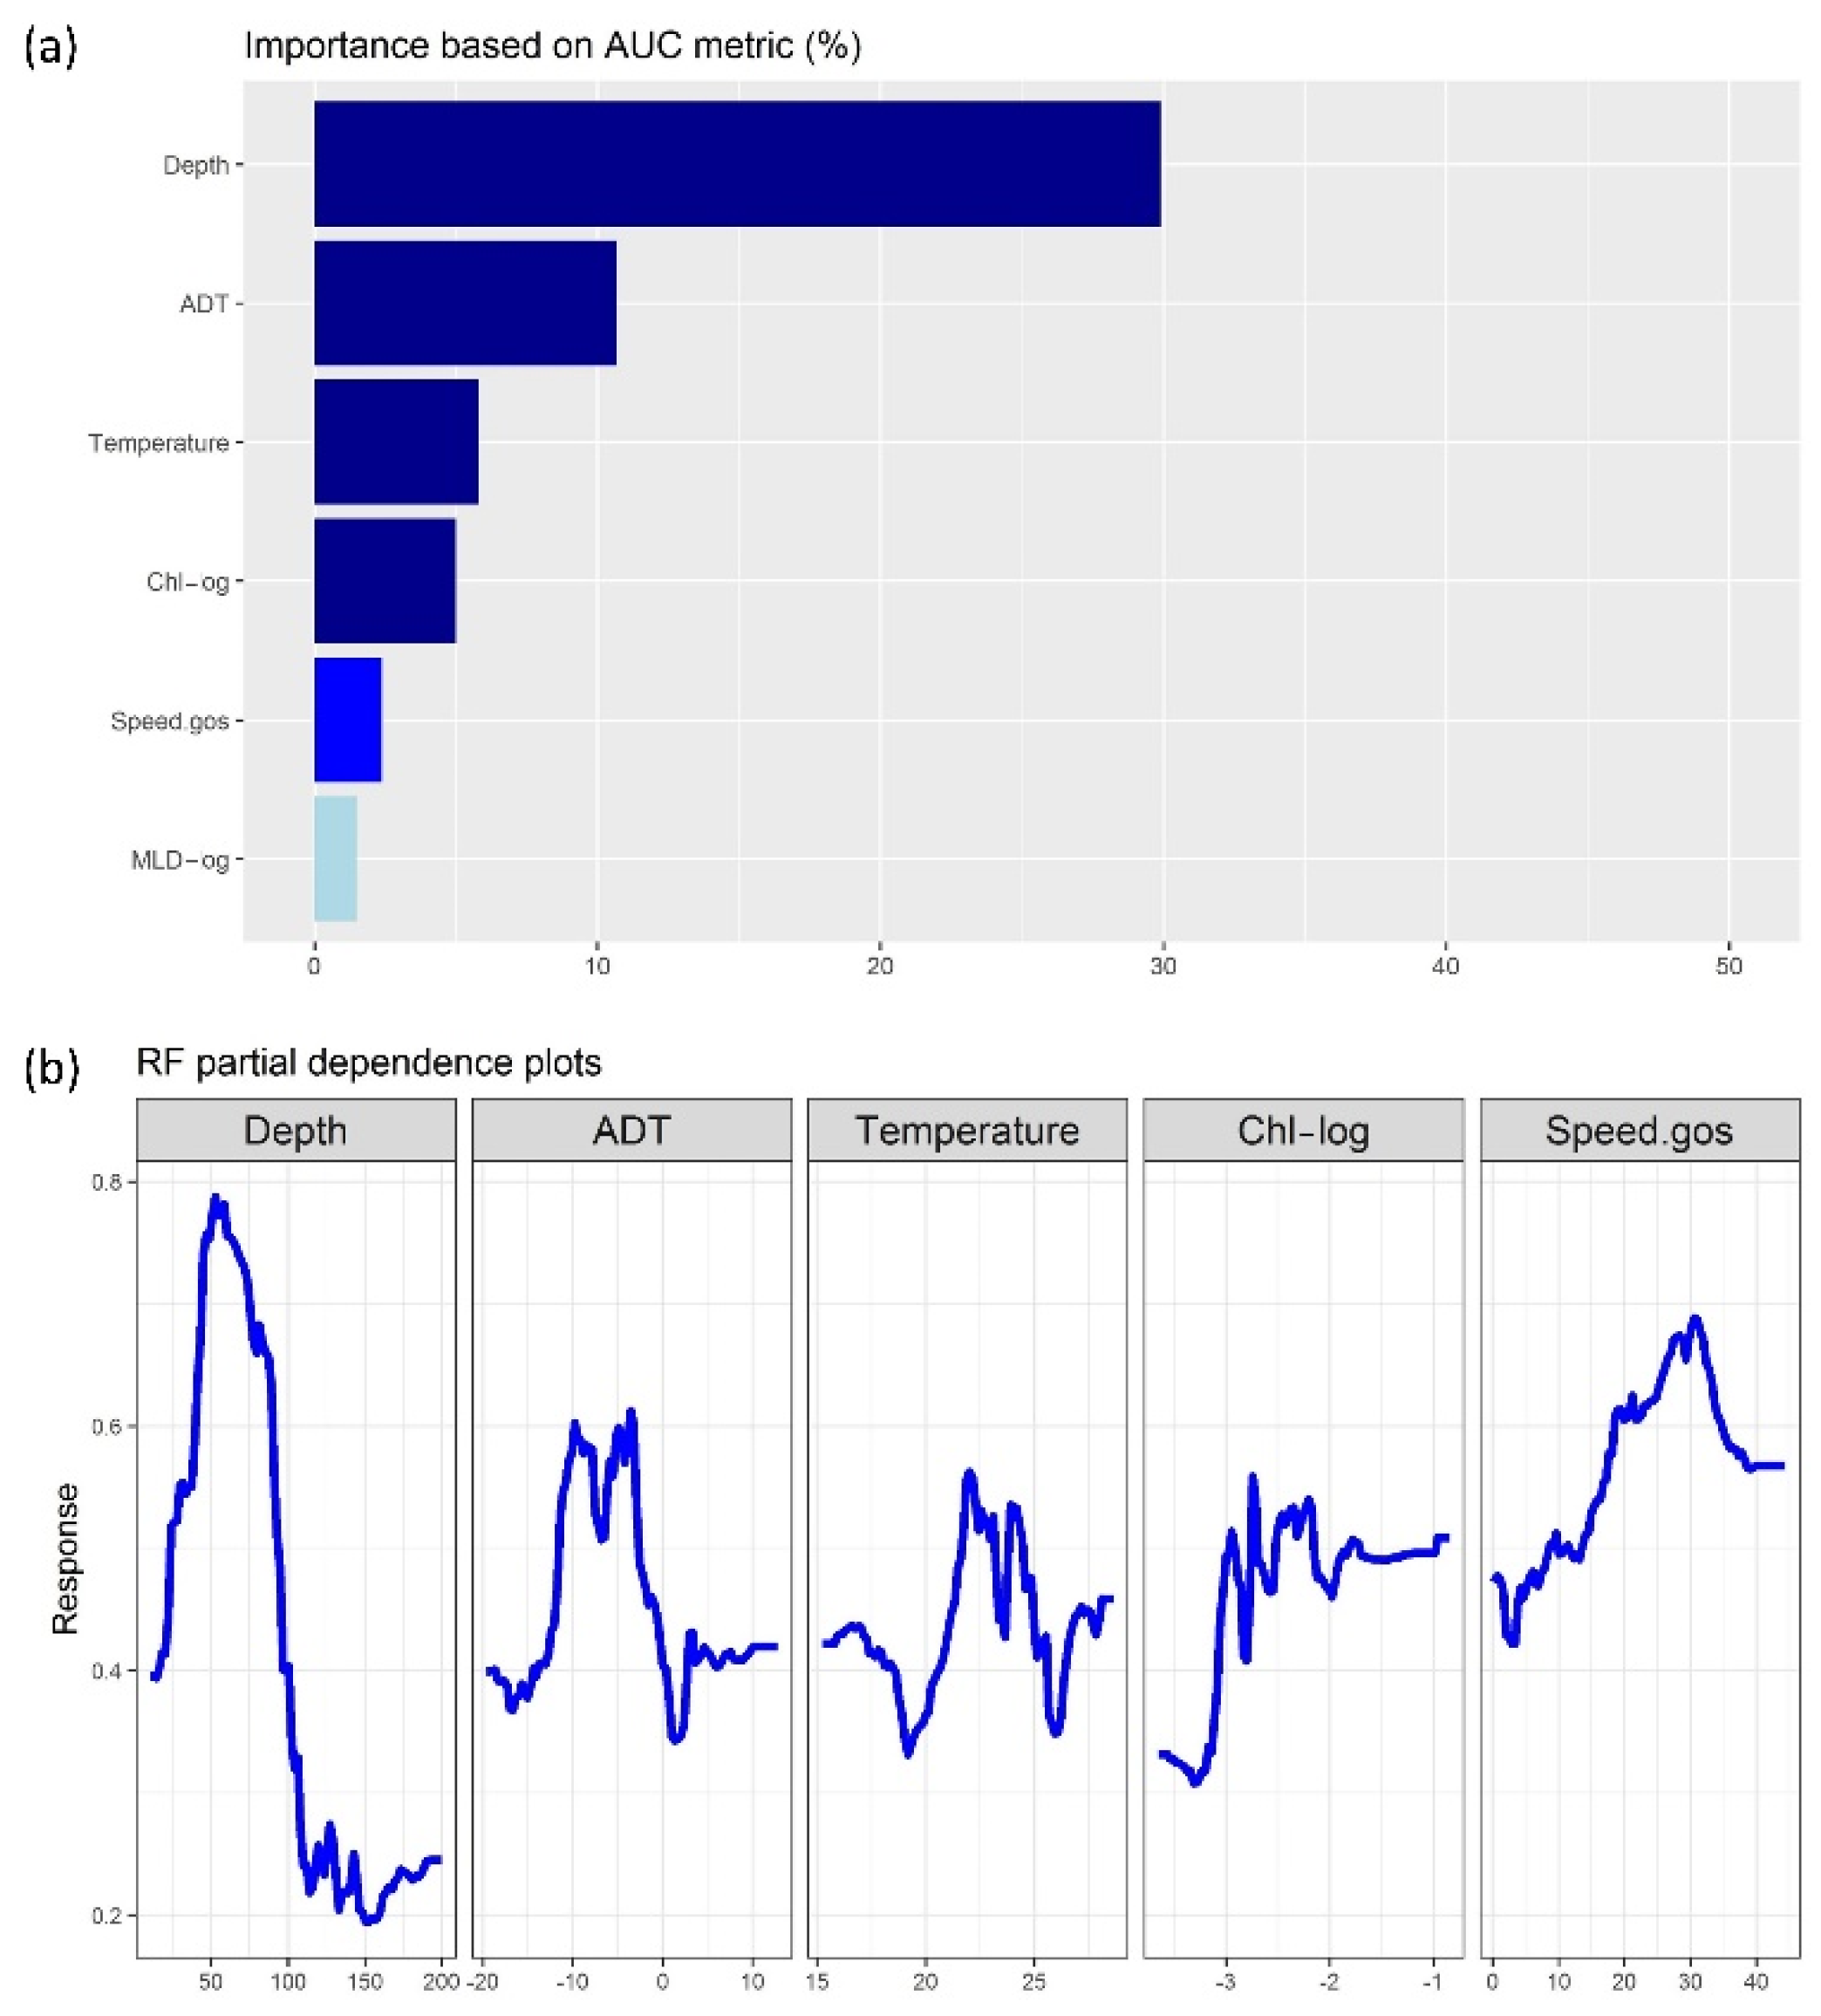
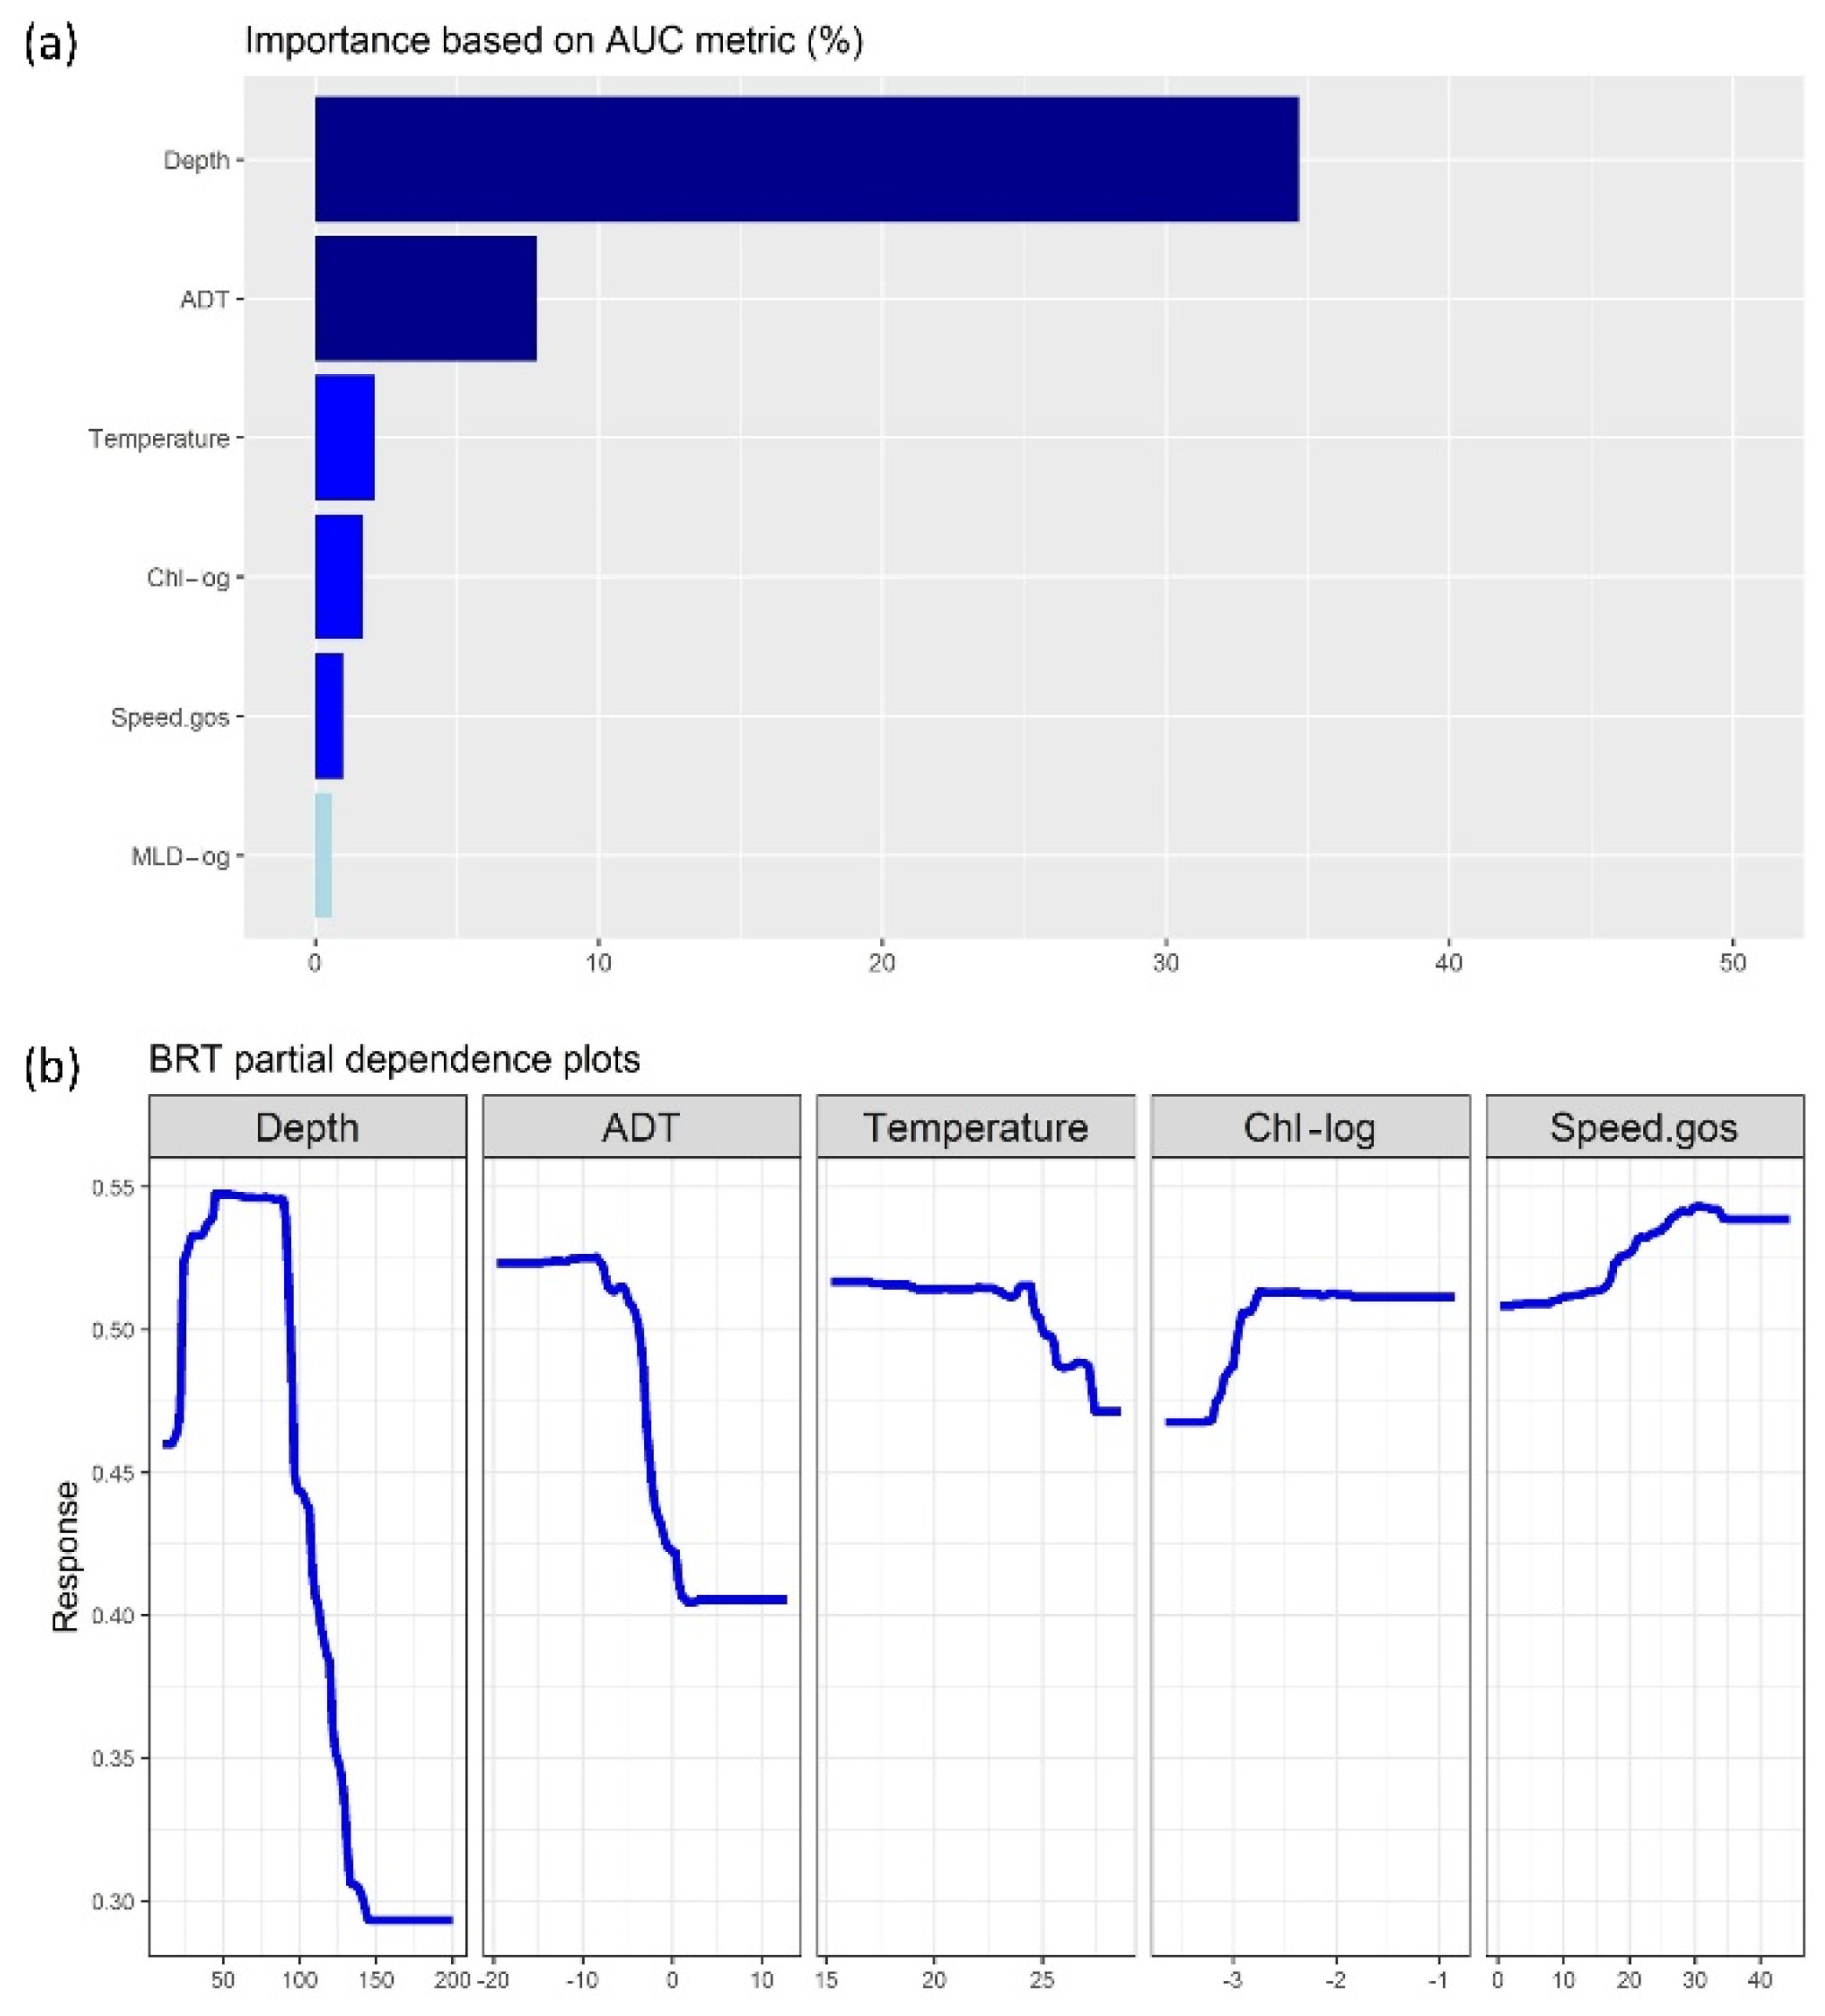
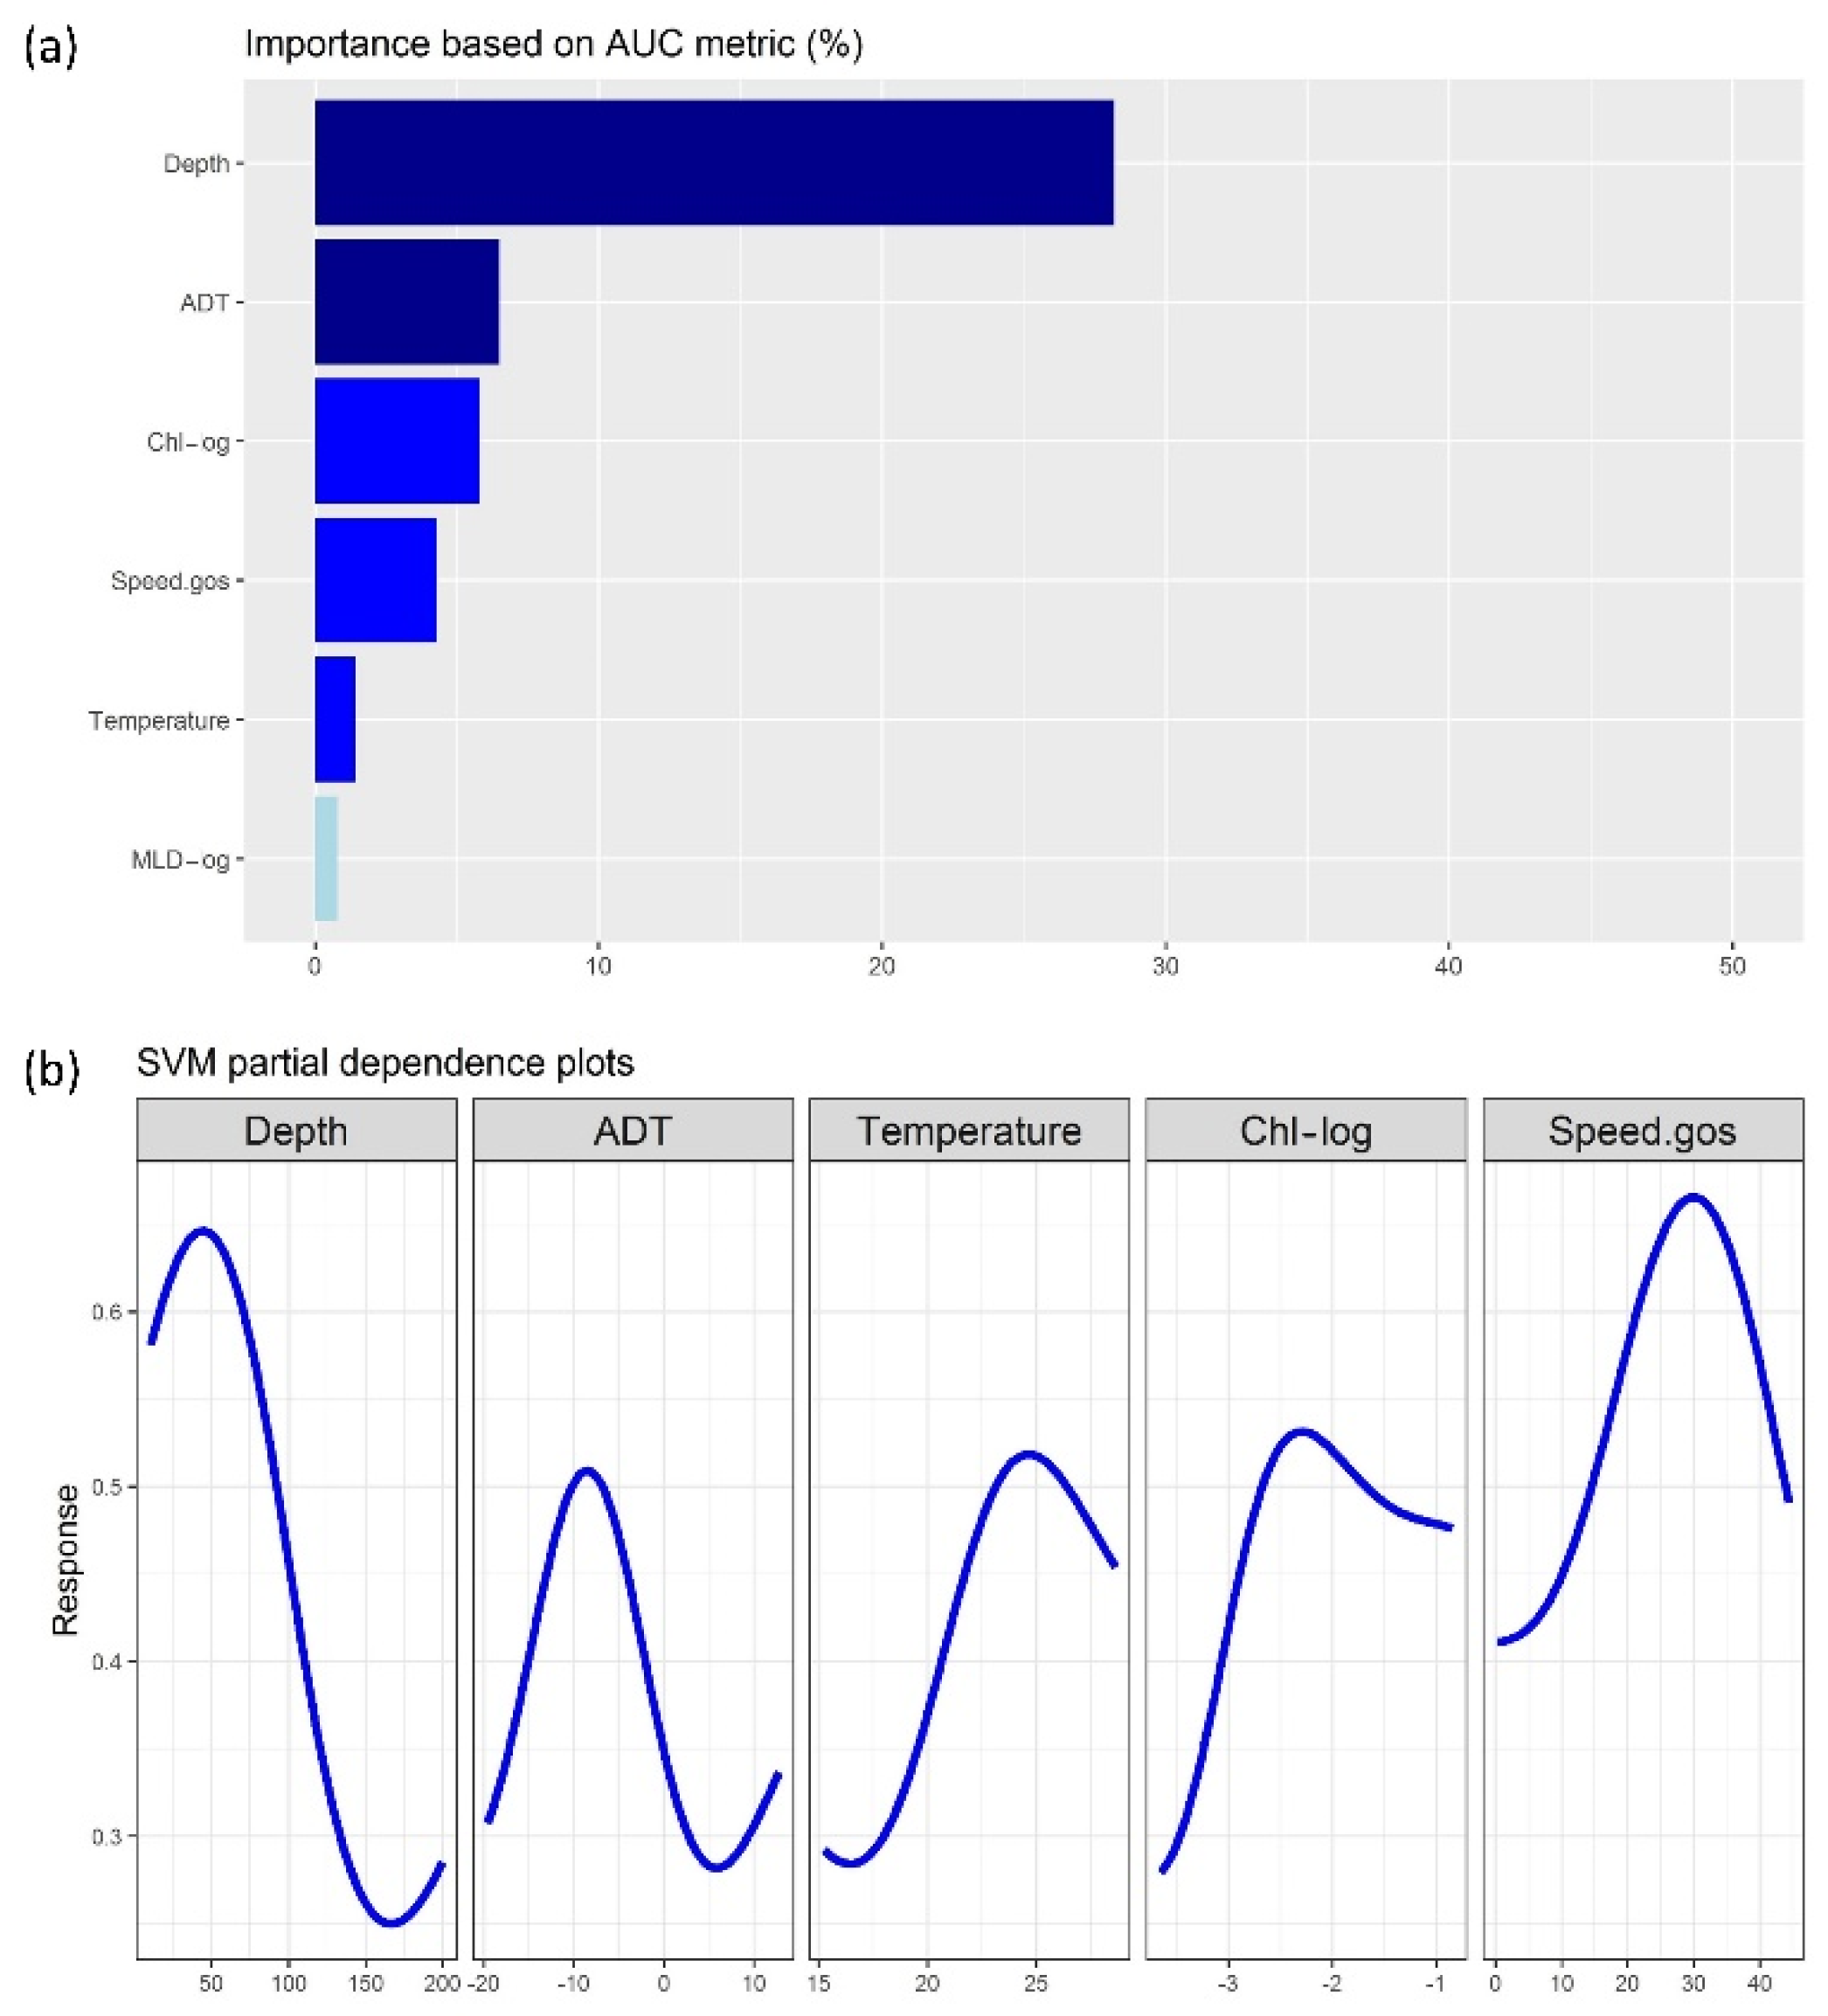
3.2. Machine-Learning Outputs

Five-hundred decision trees were used to select the best RF model and 450 boosting trees for the BRT model. A cost parameter equal to a one-and-a-third degree polynomial Kernel characterized the SVM model with the best performance.
As already observed for regression models, the machine-learning models also showed that anchovy egg distribution was principally driven by changes in bottom depth and ADT. Surface currents in terms of velocity, temperature and chl-a were moderately important for determining egg presence (Figure 4a, Figure 5a and Figure 6a).
The partial dependence plots (Figure 4b, Figure 5b and Figure 6b) show similar patterns to the regression plots. Specifically, the probability of egg occurrence increases in correspondence with an optimal range for bottom depth (between 50 and 100 m) and speed.gos (about 30 cm s−1). BRT model resulted in patterns similar to regression models for temperature and chl-a (temperature < 25 °C and chl-a > 0.05 mg m−3). Otherwise, for RF and SVM models, the higher probability of the presence of eggs is linked to temperature values between 20 and 25 °C, chl-a values between 0.05 and 0.1 mg m−3 and negative ADT values between −10 cm and 0.

3.3. Evaluation of Model Results

With the exception of the GLM, which showed a relatively weaker performance, the predictions obtained from the training data proved to be reliable for the modelling techniques. According to the classification by [72], the RF model had a good discrimination power (AUC = 0.81) and the other models assessed in this study, with AUC values ranging between 0.74 (GAM and MARS models) and 0.78 (BRT and SVM models), provided satisfactory discrimination (Table 2). The estimated threshold was about 0.40 for all models, with the exception of RF (0.52). These values, combined with sensitivity values higher than specificity, indicated that generally all models performed well in correctly identifying hauls with the presence of anchovy eggs. However, the machine-learning models outperformed regression predicting the reproductive habitat of anchovies (Table 2).
The modelling techniques also showed a satisfactory performance when applied to the test dataset. RF was the most accurate, with an AUC of 0.76. The estimated threshold was about 0.40 for all models, except for GAM (threshold = 0.51). All models (excluding GAM) performed best when they classified positive stations compared to negative (Table 3).

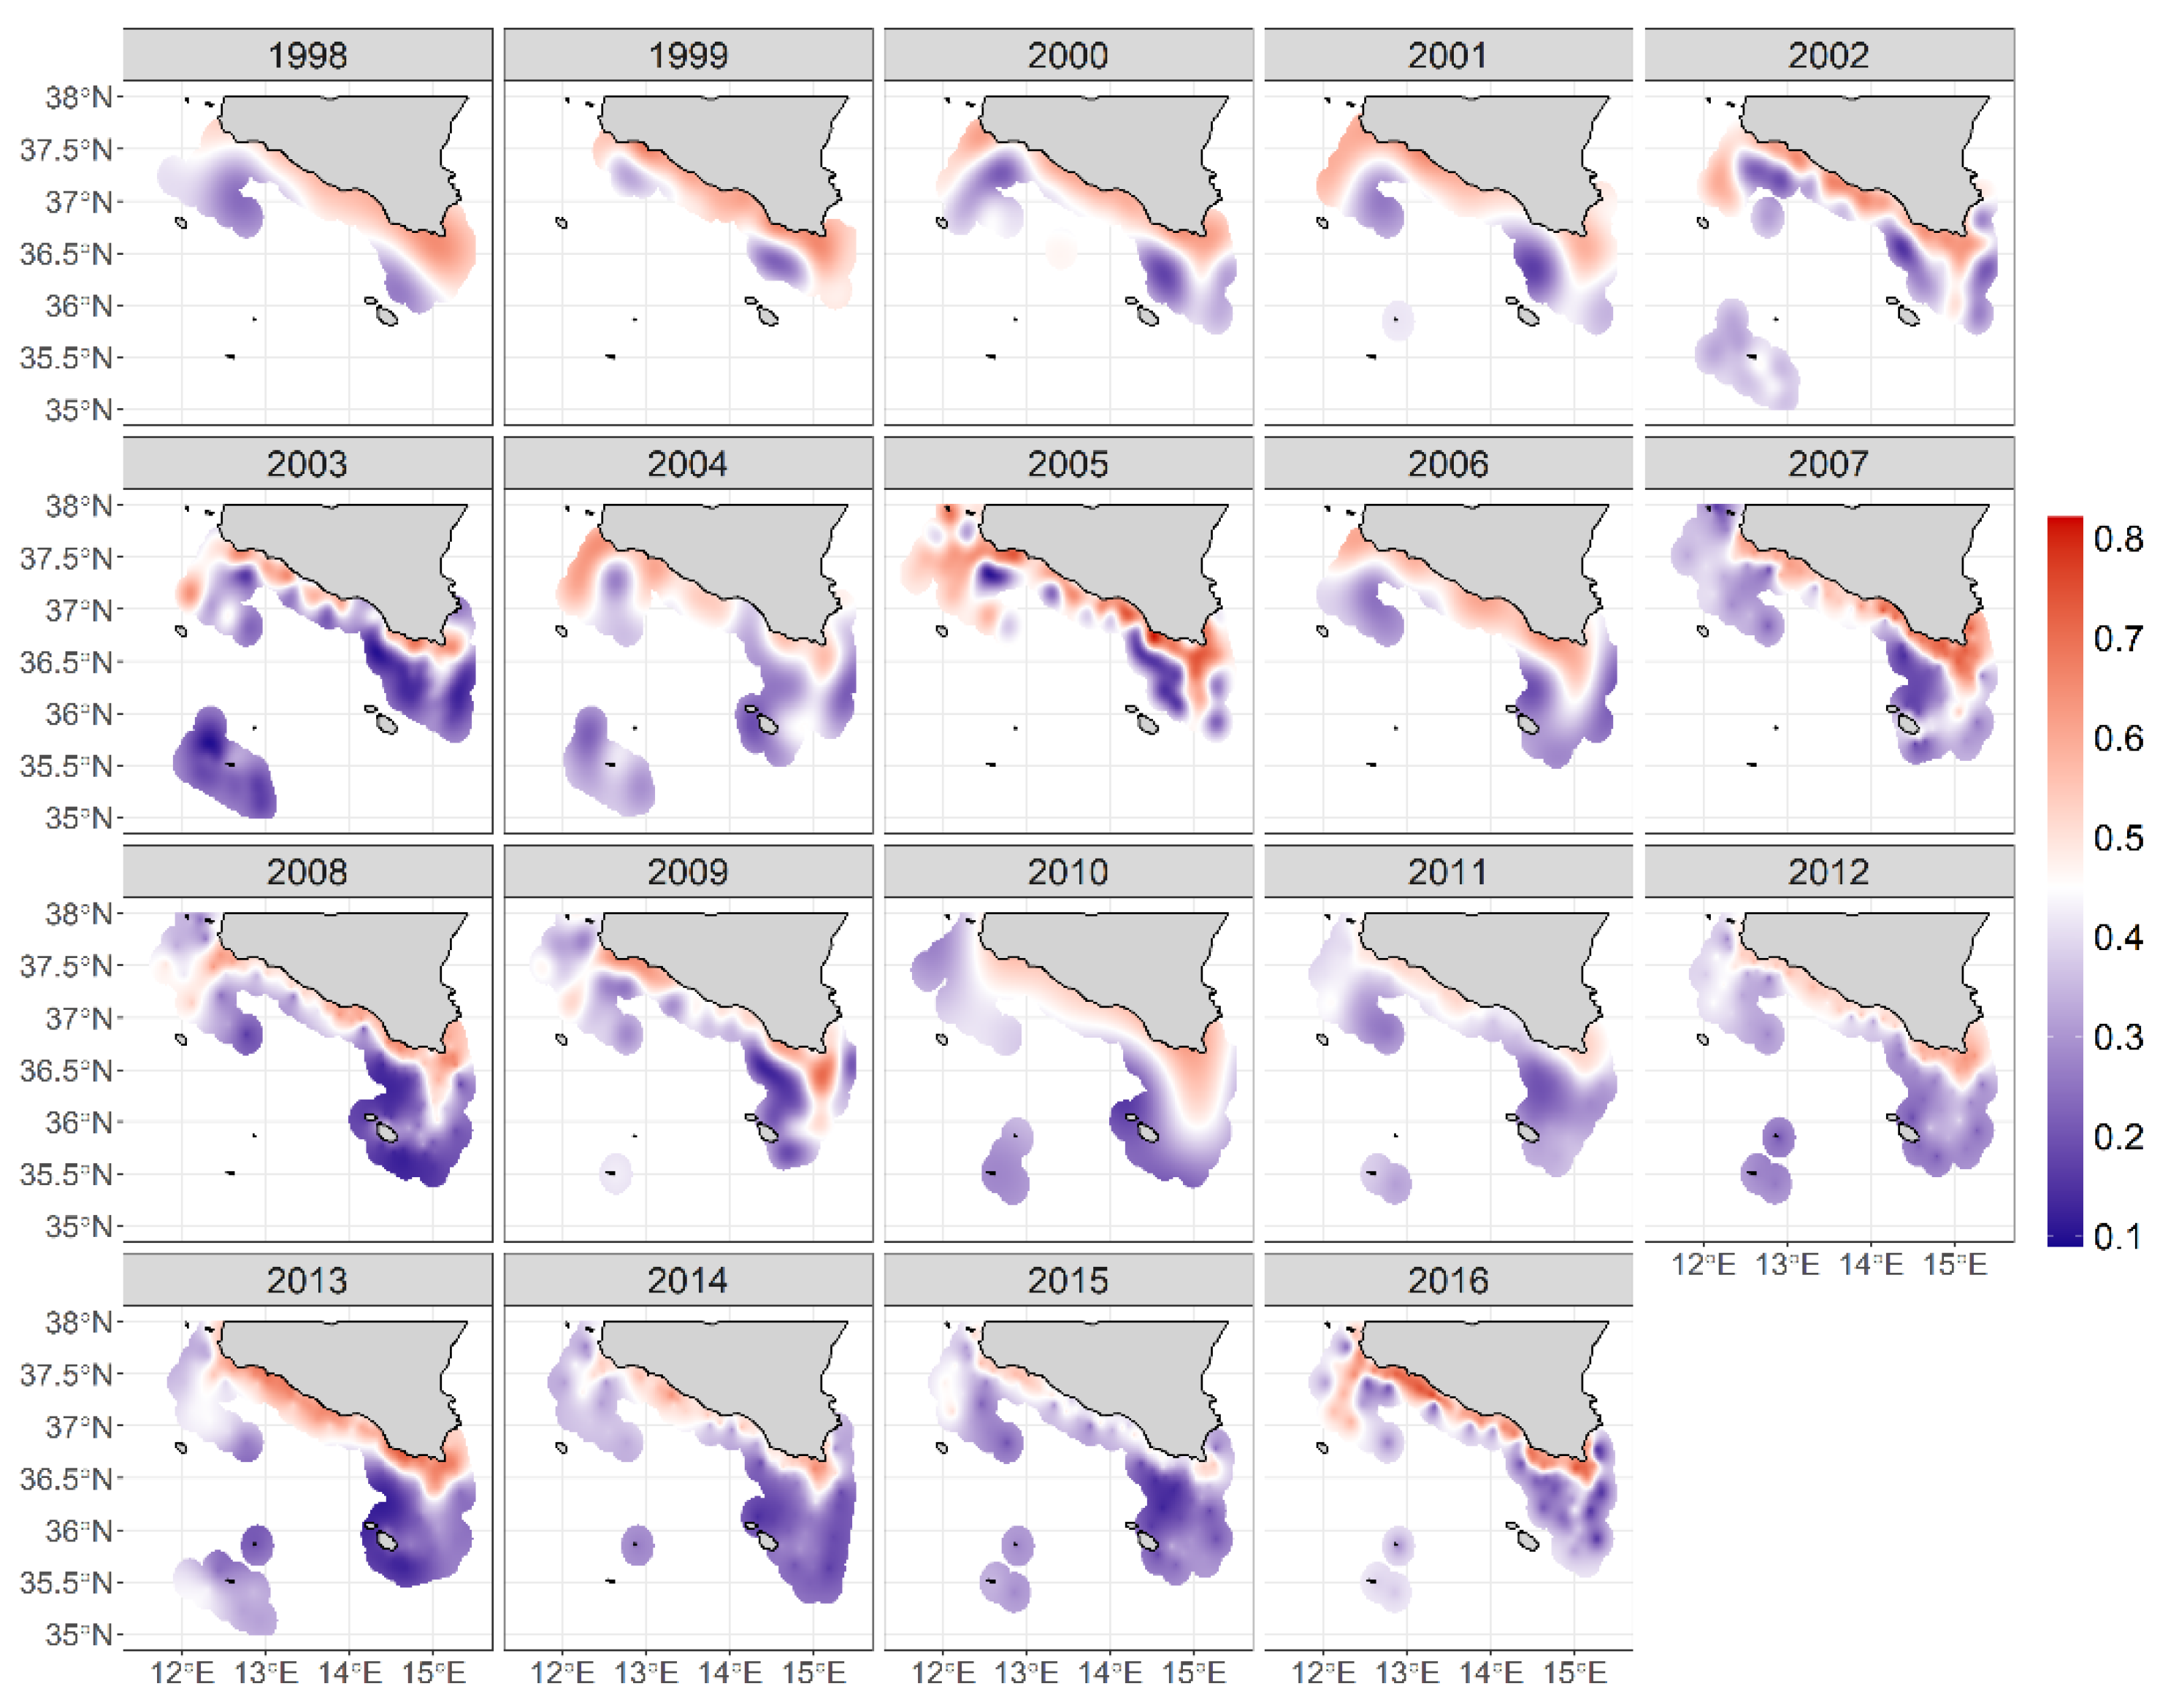
3.4. Displaying the Anchovy Spawning Habitat

The ensemble model identified the coastal waters as the most favorable for anchovy spawning, with the differences between years limited to areal extent. The areas associated with high probability of eggs (red areas in Figure 7) extended more offshore between 1998 and 2002 and between 2004 and 2006. In other years the preferential area was restricted to shallow waters near the coastline. This was observed in particular in 2011 and 2015, when only two restricted areas exhibited conditions favorable to spawning: a narrow band in the south-central sector of Sicilian coast and the area around the southern-most tip of Sicily (Cape Passero). In general, the unfavorable areas (blue areas in Figure 7) were associated with depths greater than 100 m.

4. Discussion

SDMs are a valuable statistical approach able to provide important information during the decision-making processes aimed at sustainable fishing and species conservation [5,6,72]. Methodological advances have enhanced SDM capabilities, allowing a better knowledge of species distributions and relationships with environmental conditions. However, these approaches could be affected by limitations due to the a priori choice of an optimal model [45]. An ensemble of SDMs provides a method for resolving differences between individual models and estimating more robustly the relationship between species and habitats [46,47].
The Strait of Sicily is a particularly interesting area because it is characterized by highly variable oceanographic conditions among years [73] that strongly affect the spawning and survival of first stages of fish with severe consequences on their stock biomasses. This is the case for the European anchovy, a short-lived species with a demographic structure locally dominated by age classes 1–2 years [74]. This paper represents the first attempt to evaluate the performance of different statistical modelling approaches applied to the investigation of anchovy spawning habitat in the Strait of Sicily, using the longest time series of egg presence/absence data available for the study area. Specifically, spawning habitat suitability was assessed by averaging predictions resulting from six different SDMs. The multiple approach included three regression models and three machine-learning models, based on data collected during 19 ichthyoplankton surveys (years 1998–2016) in the Strait of Sicily. The methodology offered a promising adaptive tool for selecting realistic conservation areas for this species as function of current environmental conditions. Validation of model outputs demonstrated the great efficacy and ecological relevance of the selected environmental parameters in predicting spawning habitat distribution, with the exception of GLM. In general, non-linear techniques, with complex ecological response, provided more realistic results compared with classical linear techniques. In addition, machine-learning models, particularly RF, performed better than regression models. The high performance of machine-learning algorithms is well-documented in SDM applications [47,75,76,77], consistently outperforming regression-based methods. This result could suggest a potential overfitting issue [66,78]. However, this was not the case for this study, because the models applied on the test dataset showed an equally good performance in the predictions. The higher performance of RF is attributed to its ability to combine the most popular class from several individual trees [64,79], which makes it a widely applied machine-learning algorithm for various field of studies [80,81].
Although the correct-classification rates were quite similar in all tested models, differences were found in the selection of significant variables and evaluation of their importance, as indicated also by [45,82]. However, despite the heterogeneity in the relative importance of the covariates among models, the interpretation of several SDM outcomes collectively helped to identify the optimal environmental windows for anchovy egg distribution in the study area. For instance, all approaches showed the major role played by bottom depth and ADT in affecting egg occurrence, with small differences among them. Specifically, egg occurrence was primarily related to bottom depth in the 50–100 m range, confirming a pattern of distribution linked to the coastal zone [9,29,44,83]. Moreover, egg distribution was influenced by spatial patterns of ADT, which depends mainly on the mesoscale oceanographic structure occurring in the surface layers. In the Strait of Sicily, the surface hydrodynamics is dominated by the AIS, which flows south-eastwards along a meandering path that varies over the years [73]. In terms of ADT, this current is characterized by values close to zero in its core, and its flow is characterized by negative values in the coastal (upwelling) area and positive values offshore. In this context, egg occurrence is mainly associated with the negative ADT values along the southern coast of Sicily, in relation to the AIS motion [32]. The significance of ADT reinforces the important role played by hydrography in affecting the anchovy spawning behavior in the Strait of Sicily, in agreement with other studies [9,54,84].
Conversely, the relative contribution of the remaining parameters, especially chlorophyll-a concentration, temperature and surface current, in predicting species occurrence was variable, suggesting a secondary but significant impact in affecting egg distribution during the peak of spawning. This study identified an optimal temperature window between 20 and 24 °C, not surprisingly higher than the range of 18–19 °C reported in [29], where temperature was depth averaged in the uppermost 40 m layer of the water column, and within the range observed for this species in the Mediterranean Sea [85]. The higher chlorophyll-a concentration associated with the egg occurrence confirms the findings of previous studies [29,84] and reinforces the hypothesis of a reproductive strategy aimed at maximizing the reproductive success of the species by assuring food availability during the larval development period [86,87]. The observed significant contribution of the current speed in explaining the egg spatial patterns in most models suggests the occurrence of advection from spawning areas to retention areas, as highlighted by other studies using Lagrangian dispersion models [9,54,88,89]. Conversely, the extent of mixed layer depth showed limited positive impact, highlighting an association between the presence of eggs and well-stratified waters typically characterizing the summer period (e.g., outputs of GLM and GAM models).
Despite some differences, it is also worth noting that most of the results of previous studies on the reproductive habitat of anchovies in the Strait of Sicily, even if obtained with different single modeling approaches and on shorter biological and environmental time series [9,29,30,31,32,33,34] are generally confirmed here. However, the added value of this study is its accurate comparisons of different modelling approaches, contributing to the development of more robust predictive models [46,47,90,91]. In addition, in this study, we took advantage of the extensive literature on the relationships between the environment and the reproductive biology of the European anchovy to validate the results of our methodological approach from an ecological point of view. In particular, the variability in the outcomes of the individual models and the consistency with previous studies underlined the need for a comprehensive use of an ensemble of SDMs to detect, and understand the complexity of relationships in the marine environment.
In this context, the understanding of the effects related to environmental fluctuations can create the basis for defining reliable future previsions about the state of the natural resource, significantly supporting sustainable fishery management actions concerning one of the most exploited natural resources in the Mediterranean Sea [92]. The definition of the spawning areas as well as the understanding of the environmental effect on recruitment represent fundamental knowledge for the management of the fishing effort aimed at guaranteeing the conservation of the resource in line with the priority objectives of current international strategies. This work proposes an analytical approach that can be exported to other contexts and sheds light on the main drivers that regulate the reproduction of the European anchovy in a crucial area for the fishing of small pelagics, highlighting the importance of monitoring programs for the conservation of the natural capital.

5. Conclusions

This study represents the first attempt to identify potential spawning habitat of the European anchovy in the Strait of Sicily with different modelling approaches applied on a long-term time series of environmental and biological information. The results have important implications for species management and conservation planning, as they provide an exhaustive characterization of the anchovy spawning habitat in the study area. Moreover, it also provides an innovative comprehensive modeling approach aimed at delivering a more effective predictive technique, first applied in the field of fisheries ecology.

Author Contributions

Conceptualization, E.M.Q.; methodology, E.M.Q. and M.T.; software, E.M.Q. and M.T.; validation, E.M.Q.; formal analysis, E.M.Q.; investigation, E.M.Q., M.T., A.C. and B.P.; resources, B.P.; data curation, M.T. and B.P.; writing—original draft preparation, E.M.Q., M.T. and B.P.; writing—review and editing, E.M.Q., M.T., A.C. and B.P.; supervision, E.M.Q. All authors have read and agreed to the published version of the manuscript.

Funding

This study was mainly supported by the Italian National Research Council (CNR) through USPO office, and by the FAO Regional Project “MedSudMed—Assessment and Monitoring of the Fishery Resources and the Ecosystems in the Straits of Sicily”, funded by the Italian Ministry MIPAAF and co-funded by the Directorate-General for Maritime Affairs and Fisheries of the European Commission (DG MARE). The study was also supported by several other research projects, including the EU projects “Distribution Biology and Biomass Estimates of the Sicilian Channel Anchovy (MED96-052)” and “The Sicilian Channel Anchovy Fishery and the underlying Oceanographic and Biological Processes conditioning their Interannual Fluctuations (MED98–070)”, the “Proreplus-Alif Project (lAboratori di testing per dispositivi eLettroacustici, sensorI oceanograFici e metodologie finalizzati al monitoraggio dello stato delle risorse biologiche del mare)”, funded by the Regione Siciliana Government (POR 2000–2006), and the “Flagship Project RITMARE-The Italian Research for the Sea”, coordinated by the Italian National Research Council and funded by the Italian Ministry of Education, University and Research within the National Research Program 2011–2013.

Data Availability Statement

The datasets used and analyzed during the current study are available from the corresponding author.

Acknowledgments

We thank the technicians of the laboratories of IAS-CNR U.O.S Capo Granitola for their help with ichthyoplanktonic sorting and the Captains and crew of the CNR R/V Urania for their collaboration and assistance during the oceanographic surveys. Finally, special thanks go to Salvatore Mazzola, whose scientific efforts allowed the start of the regular sampling surveys that are at the base of this study.

Conflicts of Interest

The authors declare no conflict of interest. In addition, the funders had no role in the design of the study; in the collection, analyses, or interpretation of data; in the writing of the manuscript, or in the decision to publish the results.

References

  1. Franklin:, J. Mapping Species Distributions: Spatial Inference and Prediction; Cambride University Press: Cambride, UK, 2010. [Google Scholar]
  2. Peterson, A.T.; Soberon, J.; Pearson, R.G.; Anderson, R.P.; Martinez-Meyer, E.; Nakamura, M.; Araujo, M.B. Ecological Niches and Geographic Distributions; Princeton University Press: Princeton, NJ, USA, 2011. [Google Scholar]
  3. Guisan, A.; Thuiller, W. Predicting Species Distribution: Offering more than simple habitat models. Ecol. Lett. 2005, 8, 993–1009. [Google Scholar] [CrossRef]
  4. Guisan, A.; Thuiller, W.; Zimmermann, N.E. Habitat Suitability and Distribution Models with Applications in R; Cambride University Press: Cambride, UK, 2017. [Google Scholar]
  5. Guisan, A.; Zimmermann, N.E. Predictive habitat distribution models in ecology. Ecol. Modell. 2000, 135, 147–186. [Google Scholar] [CrossRef]
  6. Elith, J.; Leathwick, J.R. Species Distribution Models: Ecological explanation and prediction across space and time. Annu. Rev. Ecol. Evolut. System. 2009, 40, 677–697. [Google Scholar] [CrossRef]
  7. Tzanatos, E.; Raitsos, D.E.; Triantafyllou, G.; Somarakis, S.; Tsonis, A.A. Indications of a climate effect on Mediterranean fisheries. Clim. Change 2014, 122, 41–54. [Google Scholar] [CrossRef]
  8. Corrales, X.; Coll, M.; Ofir, E.; Heymans, J.J.; Steenbeek, J.; Goren, M.; Edelist, D.; Gal, G. Future scenarios of marine resources and ecosystem conditions in the Eastern Mediterranean under the impacts of fishing, alien species and sea warming. Sci. Rep. 2018, 8, 14284. [Google Scholar] [CrossRef] [PubMed] [Green Version]
  9. Patti, B.; Torri, M.; Cuttitta, A. General surface circulation controls the interannual fluctuations of anchovy stock biomass in the Central Mediterranean Sea. Sci. Rep. 2020, 10, 1554. [Google Scholar] [CrossRef] [PubMed]
  10. Schickele, A.; Goberville, E.; Leroy, B.; Beaugrand, G.; Hattab, T.; Francour, P.; Raybaud, V. European small pelagic fish distribution under global change scenarios. Fish Fish. 2021, 22, 212–225. [Google Scholar] [CrossRef]
  11. Patti, B.; Guisande, C.; Bonanno, A.; Basilone, G.; Cuttitta, A.; Mazzola, S. Role of physical forcings and nutrient availability on the control of satellite-based chlorophyll-a concentration in the coastal upwelling area of the Sicilian Channel. Sci. Mar. 2010, 74, 577–588. [Google Scholar] [CrossRef] [Green Version]
  12. Linnæus, C. Systema naturæ per regna tria naturæ, secundum classes, ordines, genera, species, cum characteribus, differentiis, synonymis, locis. Tomus I. Editio Decima Reformata 1758, 1–4, 1–824. [Google Scholar]
  13. Cuttitta, A.; Quinci, E.M.; Patti, B.; Bonomo, S.; Bonanno, A.; Musco, M.; Torri, M.; Placenti, F.; Basilone, B.; Genovese, S.; et al. Different key roles of mesoscale oceanographic structures and ocean bathymetry in shaping larval fish distribution pattern: A case study in Sicilian waters in summer 2009. J. Sea Res. 2016, 115, 6–17. [Google Scholar] [CrossRef]
  14. Haii, S.J. The Effects of Fishing on Marine Ecosystems and Communities; Blackwell Sciences: Oxford, UK, 1999; 274p. [Google Scholar]
  15. Duarte, O. Trophic role of small pelagic fishes in a tropical upwelling ecosystem. Ecol. Modell. 2004, 172, 323–338. [Google Scholar] [CrossRef]
  16. Freon, P.; Cury, P.; Shannon, L.; Roy, C. Sustainable exploitation of small pelagic fish stocks challenged by environmental and ecosystem changes: A review. Bull. Mater. Sci. 2005, 76, 385–462. [Google Scholar]
  17. Alheit, J.; Roy, C.; Kifani, S. Decadal-scale variability in populations. In Climate Change and Small Pelagic Fish; Checkley, D., Alheit, J., Oozeki, Y., Roy, C., Eds.; Cambridge University Press: Cambridge, UK, 2009; pp. 67–87. [Google Scholar]
  18. Basilone, G.; Guisande, C.; Patti, B.; Mazzola, S.; Cuttitta, A.; Bonanno, A.; Vergara, A.R.; Maneiro, I. Effect of habitat conditions on reproduction of the European anchovy ((Engraulis encrasicolus) in the Strait of Sicily. Fish. Oceanogr. 2006, 15, 271–280. [Google Scholar] [CrossRef]
  19. Olivar, M.P.; Salat, J.; Palomera, I. A comparative study of spatial distribution patterns of the early stages of anchovy and pilchard in the NW Mediterranean Sea. Mar. Ecol. Prog. Ser. 2001, 217, 111–120. [Google Scholar] [CrossRef] [Green Version]
  20. Guraslan, C.; Fac, B.B.; Oguz, T. Modeling the impact of climate variability on Black Sea anchovy recruitment and production. Fish. Oceanog. 2014, 23, 436–457. [Google Scholar] [CrossRef]
  21. Ospina-Alvarez, A.; Catalan, I.A.; Bernal, M.; Roos, D.; Palomera, I. From egg production to recruits: Connectivity and inter-annual variability in the recruitment patterns of European anchovy in the northwestern Mediterranean. Prog. Oceanogr. 2015, 138, 431–447. [Google Scholar] [CrossRef] [Green Version]
  22. Politikos, D.; Somarakis, S.; Tsiaras, K.P.; Giannoulaki, M.; Petihakis, G.; Machias, A.; Triantafyllou, G. Simulating anchovy’s full life cycle in the northern Aegean Sea (eastern Mediterranean): A coupled hydro-biogeochemical-IBM model. Prog. Oceanogr. 2015, 138, 399–416. [Google Scholar] [CrossRef]
  23. Fernandez-Corredor, E.; Albo-Puigserver, M.; Pennino, M.G.; Bellido, J.M.; Coll, M. Influence of environmental factors on different life stages of European anchovy ((Engraulis encrasicolus) and European sardine (Sardina pilchardus) from the Mediterranean Sea: A literature review. Reg. Stud. Mar. Sci. 2021, 41, 101606. [Google Scholar] [CrossRef]
  24. Palomera, I.; Sabates, A. Co-occurrence of (Engraulis encrasicolus and Sardinella aurita eggs and larvae in the western Mediterranean. Sci. Mar. 1990, 54, 51–67. [Google Scholar]
  25. Palomera, I. Spawning of anchovy (Engraulis encrasicolus in the North Western Mediterranean relative to hydrographic features in the region. Mar. Ecol. Prog. Ser. 1992, 79, 215–223. [Google Scholar] [CrossRef]
  26. Palomera, I.; Olivar, M.P. Nearshore ichthyoplankton off the Costa Brava (Northwest Mediterranean). Bol. Inst. Esp. Oceanogr. 1996, 22, 71–76. [Google Scholar]
  27. Ibaibarriaga, L.; Irigoien, X.; Santos, M.; Motos, L.; Fives, J.M.; Franco, C.; Lago De Lanzos, A.; Acevedo, S.M.; Bernal, M.; Bez, N.; et al. Egg and larvae distribution of seven fish species in the northeast Atlantic waters. Fish. Oceanogr. 2007, 16, 284–293. [Google Scholar] [CrossRef]
  28. Somarakis, S.; Nikolioudakis, N. Oceanographic habitat, growth and mortality of larval anchovy ((Engraulis encrasicolus) in the northern Aegean Sea (eastern Mediterranean). Mar. Biol. 2007, 152, 1143–1158. [Google Scholar] [CrossRef]
  29. Basilone, G.; Bonanno, A.; Patti, B.; Mazzola, S.; Barra, M.; Cuttitta, A.; McBrige, R. Spawning site selection by European anchovy ((Engraulis encrasicolus) in relation to oceanographic conditions in the Strait of Sicily. Fish. Oceanogr. 2013, 22, 309–323. [Google Scholar] [CrossRef]
  30. Basilone, G.; Ferreri, R.; Barra, M.; Bonanno, A.; Pulizzi, M.; Gargano, A.; Fontana, I.; Giacalone, G.; Rumolo, P.; Mazzola, S.; et al. Spawning ecology of the European anchovy ((Engraulis encrasicolus) in the Strait of Sicily: Linking variations of zooplankton prey, fish density, growth, and reproduction in an upwelling system. Progr. Oceanogr. 2020, 184, 102330. [Google Scholar] [CrossRef]
  31. Giannoulaki, M.; Iglesias, M.; Tugores, M.P.; Bonanno, A.; Patti, B.; De Felice, A.; Leonori, I.; Bigot, L.; Ticina, V.; Pyrounaki, M.M.; et al. Characterizing the potential habitat of European anchovy (Engraulis encrasicolus in the Mediterranean Sea, at different life stages. Fish. Oceanogr. 2013, 22, 69–89. [Google Scholar] [CrossRef]
  32. Bonanno, A.; Giannoulaki, M.; Barra, M.; Basilone, G.; Machias, A.; Genovese, S.; Goncharov, S.; Popov, S.; Rumolo, P.; Bitetto, M.D.; et al. Habitat selection response of small pelagic fish in different environments. Two examples from the oligotrophic Mediterranean Sea. PLoS ONE 2014, 9, e101498. [Google Scholar] [CrossRef]
  33. Bonanno, A.; Barra, M.; Basilone, G.; Genovese, S.; Rumolo, P.; Goncharov, S.; Popov, S.; Buongiorno Nardelli, B.; Iudicone, D.; Procaccini, G.; et al. Environmental processes driving anchovy and sardine distribution in a highly variable environment: The role of the coastal structure and riverine input. Fish. Oceanogr. 2016, 25, 471–490. [Google Scholar] [CrossRef]
  34. García Lafuente, J.; García, A.; Mazzola, S.; Qyuintanilla, L.; Delgado, J.; Cuttitta, A.; Patti, B. Hydrographic phenomena influencing early life stages of the Sicilian Channel anchovy. Fish. Oceanogr. 2002, 11, 31–44. [Google Scholar] [CrossRef] [Green Version]
  35. Patti, B.; Bonanno, A.; Basilone, G.; Goncharov, S.; Mazzola, S.; Buscaino, G.; Cuttitta, A.; García Lafuente, J.; García, A.; Palumbo, V.; et al. Interannual fluctuations in acoustic biomass estimates and in landings of small pelagic fish populations in relation to hydrology in the strait of Sicily. Chem. Ecol. 2004, 20, 365–375. [Google Scholar] [CrossRef]
  36. Bonanno, A.; Zgosi, S.; Cuttitta, A.; El Turki, A.; Di Nieri, A.; Ghmati, H.; Basilone, G.; Aronica, S.; Hamza, M.; Barra, M.; et al. Influence of environmental variability on anchovy early life stages ((Engraulis encrasicolus) in two different areas of the Central Mediterranean Sea. Hydrobiologia 2013, 1, 273–287. [Google Scholar] [CrossRef]
  37. Falcini, F.; Palatella, L.; Cuttitta, A.; Buongiorno Nardelli, B.; Lacorata, G.; Lanotte, A.S.; Patti, B.; Santoleri, R. The role of hydrodynamic processes on anchovy eggs and larvae distribution in the Sicily channel (Mediterranean Sea): A case study for the 2004 data set. PLoS ONE 2015, 10, 0123213. [Google Scholar] [CrossRef] [PubMed]
  38. Lemursiaux, P.F.J. Estimation and study of mesoscale variability in the Strait of Sicily. Dynam. Atmos. Oceans 1999, 29, 255–303. [Google Scholar]
  39. Robinson, A.R.; Sellschopp, J.; Warn-Varnas, A.; Leslie, W.G.; Lozano, C.J.; Haley, P.J.; Anderson, L.A.; Lermusiaux, P.F.J. The Atlantic Ionian Stream. J. Mar. Syst. 1999, 20, 129–156. [Google Scholar] [CrossRef]
  40. Lemursiaux, P.F.J.; Robinson, A.R. Features of dominant mesoscale variability, circulation patterns and dynamics in the Strait of Sicily. Deep-Sea Res. I 2001, 48, 1953–1997. [Google Scholar]
  41. Béranger, K.; Mortier, L.; Gasparini, G.P.; Gervasio, L.; Astraldi, M.; Crepon, M. The dynamics of the Strait of Sicily: A comprehensive study from observations and models. Deep-Sea Res. 2004, 51, 411–440. [Google Scholar]
  42. Gasparini, G.P.; Smeed, D.A.; Alderson, S.; Sparnocchia, S.; Vetrano, A.; Mazzola, S. Tidal and subtidal currents in the Strait of Sicily. J. Geophys. Res. 2004, 109, C02011. [Google Scholar] [CrossRef]
  43. Cuttitta, A.; Arigò, A.; Basilone, G.; Bonanno, A.; Buscaino, G.; Rollandi, L.; Garcìa Lafuente, J.; Garcìa, A.; Mazzola, S.; Patti, B. Mesopelagic fish larvae species in the Strait of Sicily and their relationships to main oceanographic events. Hydrobiologia 2004, 527, 177–182. [Google Scholar] [CrossRef]
  44. Cuttitta, A.; Torri, M.; Zarrad, R.; Zgozi, S.; Jarboui, O.; Quinci, E.M.; Hamza, M.; Abdulfatah, E.; Haddoud, D.; El Turki, A.; et al. Linking surface hydrodynamics to planktonic ecosystem: The case study of the ichthyoplanktonic assemblages in the Central Mediterranean Sea. Hydrobiologia 2018, 821, 191–214. [Google Scholar] [CrossRef]
  45. Elith, J.; Graham, C.H. Do they? How do they? Why do they differ? On finding reasons for differing performances of species distribution models. Ecography 2009, 32, 66–77. [Google Scholar] [CrossRef]
  46. Araújo, M.B.; New, M. Ensemble forecasting of species distributions. Trends Ecol. Evolut. 2007, 22, 42–47. [Google Scholar] [CrossRef] [PubMed]
  47. Marmion, M.; Parviainen, M.; Luoto, M.; Heikkinen, R.K.; Thuiller, W. Evaluation of consensus methods in predictive species distribution modelling. Divers. Distrib. 2009, 15, 59–69. [Google Scholar] [CrossRef]
  48. Thuiller, W.; Lafourcade, B.; Engler, R.; Araújo, M.B. BIOMOD—A platform for ensemble forecasting of species distributions. Ecography 2009, 32, 369–373. [Google Scholar] [CrossRef]
  49. Brankart, J.M. Technical Report; University of Liège: Liège, Belgium, 1994; p. 5. [Google Scholar]
  50. Palomera, I. Vertical distribution of eggs and larvae of (Engraulis encrasicolus in stratified waters of the Western Mediterranean. Mar. Biol. 1991, 111, 37–44. [Google Scholar] [CrossRef]
  51. Mazzola, S.; Garcia, A.; Garcia-Lafuente, J. Distribution, Biology and Biomass Estimates of the Sicilian Channel Anchovy. 2000 Final Report, DG XIV, MED 96–052, 151p. Available online: https://www.researchgate.net/publication/259254780_Distribution_biology_and_biomass_estimates_of_the_Sicilian_Channel_anchovy_DGXIV_MED_96052_Final_Report (accessed on 29 March 2022).
  52. Kara, A.B.; Rochford, P.A.; Hurlburt, H.E. An optimal definition for ocean mixed layer depth. J. Geophys. Res. 2000, 105, 16803–16821. [Google Scholar] [CrossRef]
  53. Planque, B.; Bellier, E.; Lazure, P. Modelling potential spawning habitat of sardine (Sardina pilchardus) and anchovy ((Engraulis encrasicolus) in the Bay of Biscay. Fish. Oceanogr. 2007, 16, 16–30. [Google Scholar] [CrossRef]
  54. Torri, M.; Corrado, R.; Falcini, F.; Cuttitta, A.; Palatella, L.; Lacorata, G.; Patti, B.; Arculeo, M.; Mifsud, R.; Mazzola, S.; et al. Planktonic stages of small pelagic fishes (Sardinella aurita and (Engraulis encrasicolus) in the central Mediterranean Sea: The key role of physical forcings and implications for fisheries management. Prog. Oceanogr. 2018, 162, 25–39. [Google Scholar] [CrossRef]
  55. Cuttitta, A.; Patti, B.; Maggio, T.; Quinci, E.M.; Pappalardo, A.M.; Ferrito, V.; De Pinto, V.; Torri, M.; Falco, F.; Nicosia, A.; et al. Larval population structure of (Engraulis encrasicolus in the Strait of Sicily as revealed by morphometric and genetic analysis. Fish. Oceanogr. 2015, 24, 135–149. [Google Scholar] [CrossRef]
  56. Pujol, I.; Larnicol, G. Mediterranean sea eddy kinetic energy variability from 11 years of altimetric data. J. Marine Sys. 2005, 58, 121–142. [Google Scholar] [CrossRef]
  57. Joint, I.; Groom, S. Estimation of phytoplankton production from space: Current status and future potential of satellite remote sensing. J. Exp. Mar. Biol. Ecol. 2000, 250, 233–255. [Google Scholar] [CrossRef]
  58. R Core Team. R: A Language and Environment for Statistical Computing; R Foundation for Statistical Computing: Vienna, Austria, 2020; Available online: https://www.R-project.org/ (accessed on 30 September 2021).
  59. Naimi, B.; Araujo, M.B. sdm: A reproducible and extensible R platform for species distribution modelling. Ecography 2016, 39, 368–375. [Google Scholar] [CrossRef] [Green Version]
  60. Elith, J.; Ferrier, S.; Huettmann, F.; Leathwick, J.R. The evaluation strip: A new and robust method for plotting predicted responses from species distribution models. Ecol. Modell. 2005, 186, 280–289. [Google Scholar] [CrossRef]
  61. McCullagh, P.; Nelder, J.A. Generalized Linear Models; Chapman and Hall/CRC: London, UK, 1989; 532p. [Google Scholar]
  62. Hastie, T.; Tibshirani, R. Generalised Additive Models; Chapman and Hall/CRC: London, UK, 1990; 352p. [Google Scholar]
  63. Friedman, J.H. Multivariate adaptive regression splines. Ann. Stat. 1991, 19, 1–67. [Google Scholar] [CrossRef]
  64. Breiman, L. Random forests. Mach. Learn. 2001, 45, 5–32. [Google Scholar] [CrossRef] [Green Version]
  65. Friedman, J.H. Greedy function approximation: A gradient boosting machine. Ann. Stat. 2001, 29, 1189–1232. [Google Scholar] [CrossRef]
  66. Hastie, T.; Tibshirani, R.; Friedman, J.H. The Elements of Statistical Learning: Data Mining, Inference, and Prediction; Springer: New York, NY, USA, 2001. [Google Scholar]
  67. Vapnik, V. The Support Vector Method of Function Estimation. In Nonlinear Modeling; Suykens, J.A.K., Vandewalle, J., Eds.; Springer: Boston, MA, USA, 1998. [Google Scholar]
  68. Pearce, J.; Ferner, S. Evaluating the predictive performance of habitat models developed using logistic regression. Ecol. Model. 2000, 133, 225–245. [Google Scholar] [CrossRef] [Green Version]
  69. Fielding, A.H.; Bell, J.F. A review of methods for the measurement of prediction errors in conservation presence/absence models. Environ. Conserv. 1997, 24, 38–49. [Google Scholar] [CrossRef]
  70. Mason, S.J.; Graham, N.E. Areas beneath the relative operating characteristics (ROC) and relative operating levels (ROL) curves statistical significance and interpretation. Q. J. R. Meteorol. Soc. 2002, 128, 2145–2166. [Google Scholar] [CrossRef]
  71. Hosmer, D.W., Jr.; Lemeshow, S.; Sturdivant, R.X. Applied Logistic Regression, 3rd ed.; John Wiley & Sons: Hoboken, NJ, USA, 2013. [Google Scholar]
  72. Rodríguez, J.P.; Brotons, L.; Bustamante, J.; Seoane, J. The application of predictive modelling of species distribution to biodiversity conservation. Divers. Distrib. 2007, 13, 243–251. [Google Scholar] [CrossRef]
  73. Bonanno, A.; Placenti, F.; Basilone, G.; Mifsud, R.; Genovese, S.; Patti, B.; Di Bitetto, M.; Aronica, S.; Barra, M.; Giacalone, G.; et al. Variability of water mass properties in the Strait of Sicily in summer period of 1998–2013. Ocean Sci. 2014, 10, 759–770. [Google Scholar] [CrossRef] [Green Version]
  74. Basilone, G.; Guisande, C.; Patti, B.; Mazzola, S.; Cuttitta, A.; Bonanno, A.; Kallianiotis, A. Linking habitat conditions and growth in the European anchovy ((Engraulis encrasicolus). Fish. Res. 2004, 68, 9–19. [Google Scholar] [CrossRef]
  75. Bucklin, D.B.; Basille, M.; Benscoter, A.M.; Brandt, L.A.; Mazzotti, F.J.; Romanach, S.S.; Speroterra, C.; Watling, J.I. Comparing species distribution models constructed with different subsets of environmental predictors. Divers. Distrib. 2015, 21, 23–35. [Google Scholar] [CrossRef]
  76. Janowski, L.; Wroblewski, R.; Dworniczak, J.; Kolakowski, M.; Rogowska, K.; Wojcik, M.; Gajewski, J. Offshore benthic habitat mapping based on object-based image analysis and geomorphometric approach. A case study from the Slupsk Bank, Southern Baltic Sea. Sci Total Environ. 2021, 801, 149712. [Google Scholar] [CrossRef] [PubMed]
  77. Vezza, P.; Muñoz-Mas, R.; Martinez-Capel, F.; Mouton, A. Random forests to evaluate biotic interactions in fish distribution models. Environ. Model. Softw. 2015, 67, 173–183. [Google Scholar] [CrossRef]
  78. Dormann, C.F.; Purschke, O.; Marquez, J.R.G.; Lautenbach, S.; Schröder, B. Components of uncertainty in species distribution analysis: A case study of the Great Grey Shrike. Ecology 2008, 89, 3371–3386. [Google Scholar] [CrossRef]
  79. Cutler, D.R.; Edwards, T.C., Jr.; Beard, K.H.; Cutler, A.; Hess, K.T.; Gibson, J.; Lawler, J.J. Random forests for classification in ecology. Ecology 2007, 88, 2783–2792. [Google Scholar] [CrossRef]
  80. Ahmed, N.; Atzberger, C.; Zewdie, W. Species Distribution Modelling performance and its implication for Sentinel-2-based prediction of invasive Prosopis juliflora in lower Awash River basin, Ethiopia. Ecol. Proces. 2021, 10, 18. [Google Scholar] [CrossRef]
  81. Janowski, L.; Wroblewski, R.; Rucinska, M.; Kubowicz-Grajewska, A.; Tysiac, P. Automatic classification and mapping of the seabed using airborne LiDAR bathymetry. Eng. Geol. 2022, 301, 106615. [Google Scholar] [CrossRef]
  82. Ready, J.; Kaschner, K.; South, A.; Eastwood, P.D.; Rees, T.; Rius, J.; Agbayani, E.; Kullander, S.; Froese, R. Predicting the distributions of marine organisms at the global scale. Ecolog. Model. 2010, 221, 467–478. [Google Scholar] [CrossRef]
  83. Cuttitta, A.; Bonomo, S.; Zgozi, S.; Bonanno, A.; Patti, B.; Quinci, E.M.; Torri, M.; Hamza, M.; Fatah, A.; Haddoud, D.; et al. The influence of physical and biological processes on the ichthyoplankton communities in the Gulf of Sirte (Southern Mediterranean Sea). Mar. Ecol. 2016, 37, 831–844. [Google Scholar] [CrossRef]
  84. Agostini, V.; Bakun, A. ‘Ocean triads’ in the Mediterranean Sea: Physical mechanisms potentially structuring reproductive habitat suitability (with example application to European anchovy, (Engraulis encrasicolus). Fish. Oceanog. 2002, 11, 129–142. [Google Scholar] [CrossRef]
  85. Palomera, I.; Olivar, M.P.; Salat, J.; Sabatés, A.; Coll, M.; García, A.; Morales-Nin, B. Small pelagic fish in the NW Mediterranean Sea: An ecological review. Progr. Oceanogr. 2007, 74, 377–396. [Google Scholar] [CrossRef]
  86. Tudela, S.; Palomera, I.; Quílez, G. Feeding of anchovy (Engraulis encrasicolus larvae in the north-west Mediterranean. J. Mar. Biol. Assoc. United Kingd. 2002, 82, 349–350. [Google Scholar] [CrossRef]
  87. Morote, E.; Olivar, M.P.; Villate, F.; Uriarte, I. Diet of round sardinella, Sardinella aurita, larvae in relation to plankton availability in the NW Mediterranean. J. Plankt. Res. 2008, 30, 807–816. [Google Scholar] [CrossRef]
  88. Patti, B.; Zarrad, R.; Jarboui, O.; Cuttitta, A.; Basilone, G.; Aronica, S.; Placenti, F.; Tranchida, G.; Armeri, G.M.; Buffa, G.; et al. Anchovy ((Engraulis encrasicolus) early life stages in the Central Mediterranean Sea: Connectivity issues emerging among adjacent sub-areas across the Strait of Sicily. Hydrobiologia 2018, 821, 25–40. [Google Scholar] [CrossRef]
  89. Falcini, F.; Corrado, R.; Torri, M.; Mangano, M.C.; Zarrad, R.; Di Cintio, A.; Palatella, L.; Jarboui, O.; Missaoui, H.; Cuttitta, A.; et al. Seascape connectivity of European anchovy in the Central Mediterranean Sea revealed by weighted Lagrangian backtracking and bio-energetic modelling. Sci. Rep. 2020, 10, 18630. [Google Scholar] [CrossRef]
  90. Coetzee, B.W.T.; Robertson, M.P.; Erasmus, B.F.N.; van Rensburg, B.J.; Thuiller, W. Ensemble models predict Important Bird Areas in southern Africa will become less effective for conserving endemic birds under climate change. Glob. Ecol. Biogeogr. 2009, 18, 701–710. [Google Scholar] [CrossRef]
  91. Jones-Farrand, D.T.; Fearer, T.M.; Thogmartin, W.E.; Iii, F.R.T.; Nelson, M.D.; Tirpak, J.M. Comparison of statistical and theoretical habitat models for conservation planning: The benefit of ensemble prediction. Ecolog. Applic. 2011, 21, 2269–2282. [Google Scholar] [CrossRef] [Green Version]
  92. FAO 2022. GFCM (Mediterranean and Black Sea) Capture Production. Fisheries and Aquaculture Division [Online]. Rome. Available online: https://www.fao.org/fishery/statistics-query/en/gfcm_capture (accessed on 29 March 2022).
Figure 1. GLM results: (a), barplots of variable importance scores based on AUC-metric. The dark blue, blue and light blue colored bars indicate variables with high significance (p-value < 0.01), moderate significance (0.01 ≤ p-value < 0.05) and no significance (p-value ≥ 0.05), respectively. (b), partial plots of significant (p < 0.05) parameters are shown.
Water 14 01400 g001
Figure 2. GAM results: (a), barplots of variable importance scores based on AUC-metric. The dark blue, blue and light blue colored bars indicate variables with high significance (p-value < 0.01), moderate significance (0.01 ≤ p-value < 0.05) and no significance (p-value ≥ 0.05), respectively. (b), partial plots of significant (p < 0.05) parameters are shown.
Water 14 01400 g002
Figure 3. MARS results: (a), barplots of variable importance scores based on AUC-metric. The dark blue, blue and light blue colored bars indicate variables with high significance (p-value < 0.01), moderate significance (0.01 ≤ p-value < 0.05) and no significance (p-value ≥ 0.05), respectively. (b), partial plots of significant (p < 0.05) parameters are shown.
Water 14 01400 g003
Figure 4. RF results: (a), barplots of variable importance scores based on AUC-metric. The dark blue, blue and light blue colored bars indicate variables with high significance (p-value < 0.01), moderate significance (0.01 ≤ p-value < 0.05) and no significance (p-value ≥ 0.05), respectively. (b), partial plots of significant (p < 0.05) parameters are shown.
Water 14 01400 g004
Figure 5. BRT results: (a), barplots of variable importance scores based on AUC-metric. The dark blue, blue and light blue colored bars indicate variables with high significance (p-value < 0.01), moderate significance (0.01 ≤ p-value < 0.05) and no significance (p-value ≥ 0.05), respectively. (b), partial plots of significant (p < 0.05) parameters are shown.
Water 14 01400 g005
Figure 6. SVM results: (a), barplots of variable importance scores based on AUC-metric. The dark blue, blue and light blue colored bars indicate variables with high significance (p-value < 0.01), moderate significance (0.01 ≤ p-value < 0.05) and no significance (p-value ≥ 0.05), respectively. (b), partial plots of significant (p < 0.05) parameters are shown.
Water 14 01400 g006
Figure 7. Prediction map of probability of occurrence of anchovy eggs in the Strait of Sicily, based on the ensemble SDMs.
Water 14 01400 g007
Table 1. List of ichthyoplankton summer surveys in the study area during 1998–2016 with number of stations on the continental shelf (depths < 200 m).
YearSurveyPeriodNumber of Stations
1998BANSIC9825 June–11 July 199873
1999BANSIC99B19 June–25 June 199953
2000BANSIC200024 June–8 July 200074
2001ANSIC20017 July–25 July 200177
2002ANSIC200211 July–31 July 2002181
2003ANSIC200311 July–2 August 2003129
2004ANSIC200418 June–7 July 2004131
2005BANSIC20057 July–24 July 200597
2006BANSIC200630 July–10 August 200674
2007BANSIC200728 June–17 July 2007106
2008BANSIC200825 June–14 July 2008119
2009BANSIC20093 July–22 July 200996
2010BANSIC201025 June–14 July 2010118
2011BANSIC20118 July–26 July 201177
2012BANSIC20124 July–23 July 201286
2013BANSIC201326 June–16 July 2013134
2014BANSIC201422 July–9 August 2014103
2015BANSIC201516 July–3 August 2015103
2016BANSIC201630 June–14 July 2016115
Table 2. Model evaluation of six modelling techniques predicting the distribution of anchovy eggs in the training dataset.
Training DatasetGLMGAMMARSRFBRTSVM
Threshold-dependent measures
Threshold0.420.420.400.520.420.41
Sensitivity0.690.760.760.820.790.77
Specificity0.630.630.640.760.640.66
Threshold-independent measures
AUC0.690.740.740.810.780.78
Table 3. Model evaluation of six modelling techniques predicting the distribution of anchovy eggs in the test dataset.
Test DatasetGLMGAMMARSRFBRTSVM
Threshold-dependent measures
Threshold0.410.510.450.400.430.42
Sensitivity0.770.660.680.790.760.71
Specificity0.590.720.660.600.640.66
Threshold-independent measures
AUC0.700.730.720.760.750.73
Publisher’s Note: MDPI stays neutral with regard to jurisdictional claims in published maps and institutional affiliations.

